Article

Experimental Transmission of Digital Data Coded on Electrical Carriers at 2.1 GHz and 4.2 GHz by Using a Microwave Photonic Filter

by
Ana Gabriela Correa-Mena
1,2,
Alicia Vera-Marquina
3,
Alejandro García-Juárez
3,
Jorge Rodríguez-Asomoza
4 and
Ignacio Enrique Zaldívar-Huerta
1,*
1
Departamento de Electrónica, Instituto Nacional de Astrofísica, Óptica y Electrónica, Calle Luis Enrique Erro No.1, Tonantzintla, Puebla 72840, Mexico
2
Departamento de Ciencias de la Computación y Electrónica, Universidad Técnica Particular de Loja, San Cayetano Alto, Loja 1101608, Ecuador
3
Departamento de Investigación en Física, Universidad de Sonora, Blvd. Luis Encinas y Rosales S/N, Hermosillo, Sonora 83000, Mexico
4
Departamento de Computación, Electrónica y Mecatrónica, Universidad de las Américas, Ex-hacienda Sta. Catarina Mártir, Cholula, Puebla 72820, Mexico
*
Author to whom correspondence should be addressed.
Electronics 2020, 9(5), 833; https://doi.org/10.3390/electronics9050833
Submission received: 13 March 2020 / Revised: 2 April 2020 / Accepted: 2 April 2020 / Published: 18 May 2020
(This article belongs to the Section Microwave and Wireless Communications)

Abstract

:
This paper proposes and demonstrates the use of filtered microwave band-pass windows situated at 2.1 GHz and 4.2 GHz as electrical carriers to transmit digital signals. The use of an appropriate microwave photonic filter (MPF) allows for the generation of the microwave band-pass windows. The key parameters of the filtering effect are the intermodal separation of a multimode laser diode (MLD), the chromatic dispersion parameter of the optical link, and its own length. Experimentally, it is demonstrated that the filtered band-pass windows can be used as electrical carriers to transmit digital signals at frequencies of 50 MHz, 100 MHz, and 150 MHz over 25.31 km of single-mode-standard-fiber (SM-SF). The quality Q-factor, jitter, and bit-error-rate are the parameters that allow for the evaluation of the quality of the digital signal transmission. The obtained results allow for the proposition of this photonic architecture in a passive optical network (PON) to distribute services like Internet Protocol (IP) telephony, internet, streaming video, and high definition television.

1. Introduction

Currently, we are witnessing the growth of personal communication demand and the popularity of the broadband services of terminal users, such as the wireless telephony, online gaming, high-quality internet, and digital-TV. All these services are generated in the electrical domain, and their distribution can be accomplished by copper cables, antennas, or optical fibers. It is well-known that optical fibers have outstanding features like a wider bandwidth, a greater information capacity, immunity to crosstalk, immunity to static interference, environmental immunity, lower transmission loss, security, durability, and reliability [1]. Additionally, optical communications systems allow the transport of large quantities of information (expressed in terms of bits per second), with fewer errors, reaching high transmission rates, allowing the encryption of voice, video, and data. [2]. In a parallel way, the implementation of microwave photonic filters (MPFs) in the optical domain has received great attention in recent years by taking advantage of the low-losses, a wide bandwidth, a fast tuning ability, and an immunity to electromagnetic interference offered by modern photonics [3]. All these characteristics have made it such that optical systems are rapidly moving towards the end-users in access networks as fiber-to-the-home (FTTH), fiber-to-the-building (FTTB), radio-over-fiber (RoF), etc. [4]. Nevertheless, the phenomena that limit high speed over a single mode-standard fiber (SM-SF) at 1550 nm are linear chromatic dispersion (CD) and nonlinear-optical-effects (NOE) such as self-phase modulation (SPM), four-wave mixing (FWM), and cross-phase modulation (XPM) [5]. To maximize the system capacity and to minimize degradation due to impairments of transmission, it is necessary to select an appropriate format to modulate the light-wave carrier. The dominant modulation format in intensity-modulated-direct-detection (IM-DD) fiber optic communications systems is non-return-to-zero (NRZ). NRZ exhibits good tolerance to CD due to its narrow optical spectrum. The NRZ format is not sensitive to laser phase noise as it is to phase key shift (PSK) modulation. Additionally, NRZ requires a relatively lower electrical bandwidth for transmitters and receivers than the RZ format, and its configuration is the simplest. However, this modulation format is not suitable for a high bit rate and long distances [6]. The digital signal performance in optical communication systems is affected by some factors such as power levels, modulation format, data rate, optical fiber length, and the number of channels, which are considered for all fiber access network technologies. For instance, in [7], an analysis of a gigabit passive optical network (GPON) was performed with keeping the data rate of 2.5 Gb/s and the link length of 20 km constant by using return-to-zero (RZ), non-return-to-zero (NRZ), differential-phase-shift-keying (DPSK), and differential-quadrature-phase shift-keying (DQPSK) modulation formats. In [8], the performance of the RZ and NR optical modulation formats in terms of the Q-factor, jitter, and bit-error-rate (BER) at a different distance (5 km, 15 km, 25 km, 40 km, 70 km, and 100 km) for wavelength-division-multiplexed (WDM) systems operating at a data rate of 10 Gb/s was analyzed. In [9], the NRZ, NRZ-DPSK, RZ-DPSK, carrier-suppressed-return-to-zero (CSRZ), CSRZ-DPSK modulation formats for a 64 channel 40 Gb/s WDM-PON with dispersion compensation using dispersion-compensation-fiber (DCF) over a 40 km fiber span were evaluated. In contrast to above-mentioned references, where all digital transmission scenarios were realized through simulations, the purpose of this work was to emulate an experimental scenario where the performance of digital signals transmitted over 25.31 km of SM-SF at different data rates (50 MHz, 100 MHz, and 150 MHz) was evaluated. In particular, digital signals were coded on filtered microwave band-pass windows located at 2.1 GHz and 4.2 GHz using a microwave photonic filter (MPF). The novelty of this work resides in the advantageous use of the chromatic dispersion parameter exhibited by the SM-SF on the filtered microwave signals, as well as in its proposition of the reconfigurability of these microwave signals as a function of the length of the SM-SF. The rest of this paper is as follows. Section 2 introduces a brief description of the basic principle of operation of the MPF used, as well as an explanation of the experimental setup and the results acquired from the eye diagrams such as the Q-factor, jitter, and BER. Finally, the conclusions are summarized in Section 3.

2. Basic Principle, Experimental Setup and Results

This section consists of two subsections. First, a brief explanation of the principle of operation of the MPF used in this experiment is given. Next, the experimental description of the transmission of the digital signals using the filtered microwave band pass windows at 2.1 GHz and 4.2 GHz as electrical carriers is presented.

2.1. The MPF Principle of Operation

Figure 1 depicts the basic configuration of the MPF. It is a point-to-point electro-optical communication system at external modulation that includes a multimode laser diode (MLD) as the optical source, an electro-optic Mach–Zehnder-intensity modulator (MZ-IM) an optical link of the SM-SF, and a photo-detector (PD). In [10], it was demonstrated that the frequency response of the system is proportional to the Fourier transform of the MLD spectrum. The interested reader can be addressed to reference [10] for detailed information about the transfer function of the MPF. Additionally, the frequency response is composed of a series of filtered signals or microwave band-pass windows that are generated by considering the intermodal separation (δλ) of the MLD, the length (L) of the optical fiber, and its associated chromatic dispersion parameter (D).
The corresponding value to the central frequency of the nth filtered microwave band-pass windows is computed as [10]:
f n = n D L δ λ
where n is an integer.
Moreover, the associated bandwidth at −3 dB of the nth band-pass window is determined by [10]:
Δ f b p = 4 l n 2 π D L Δ λ
where Δλ is the full width at half maximum (FWHM).

2.2. Experimental Description

2.2.1. Experimental MPF Frequency Response

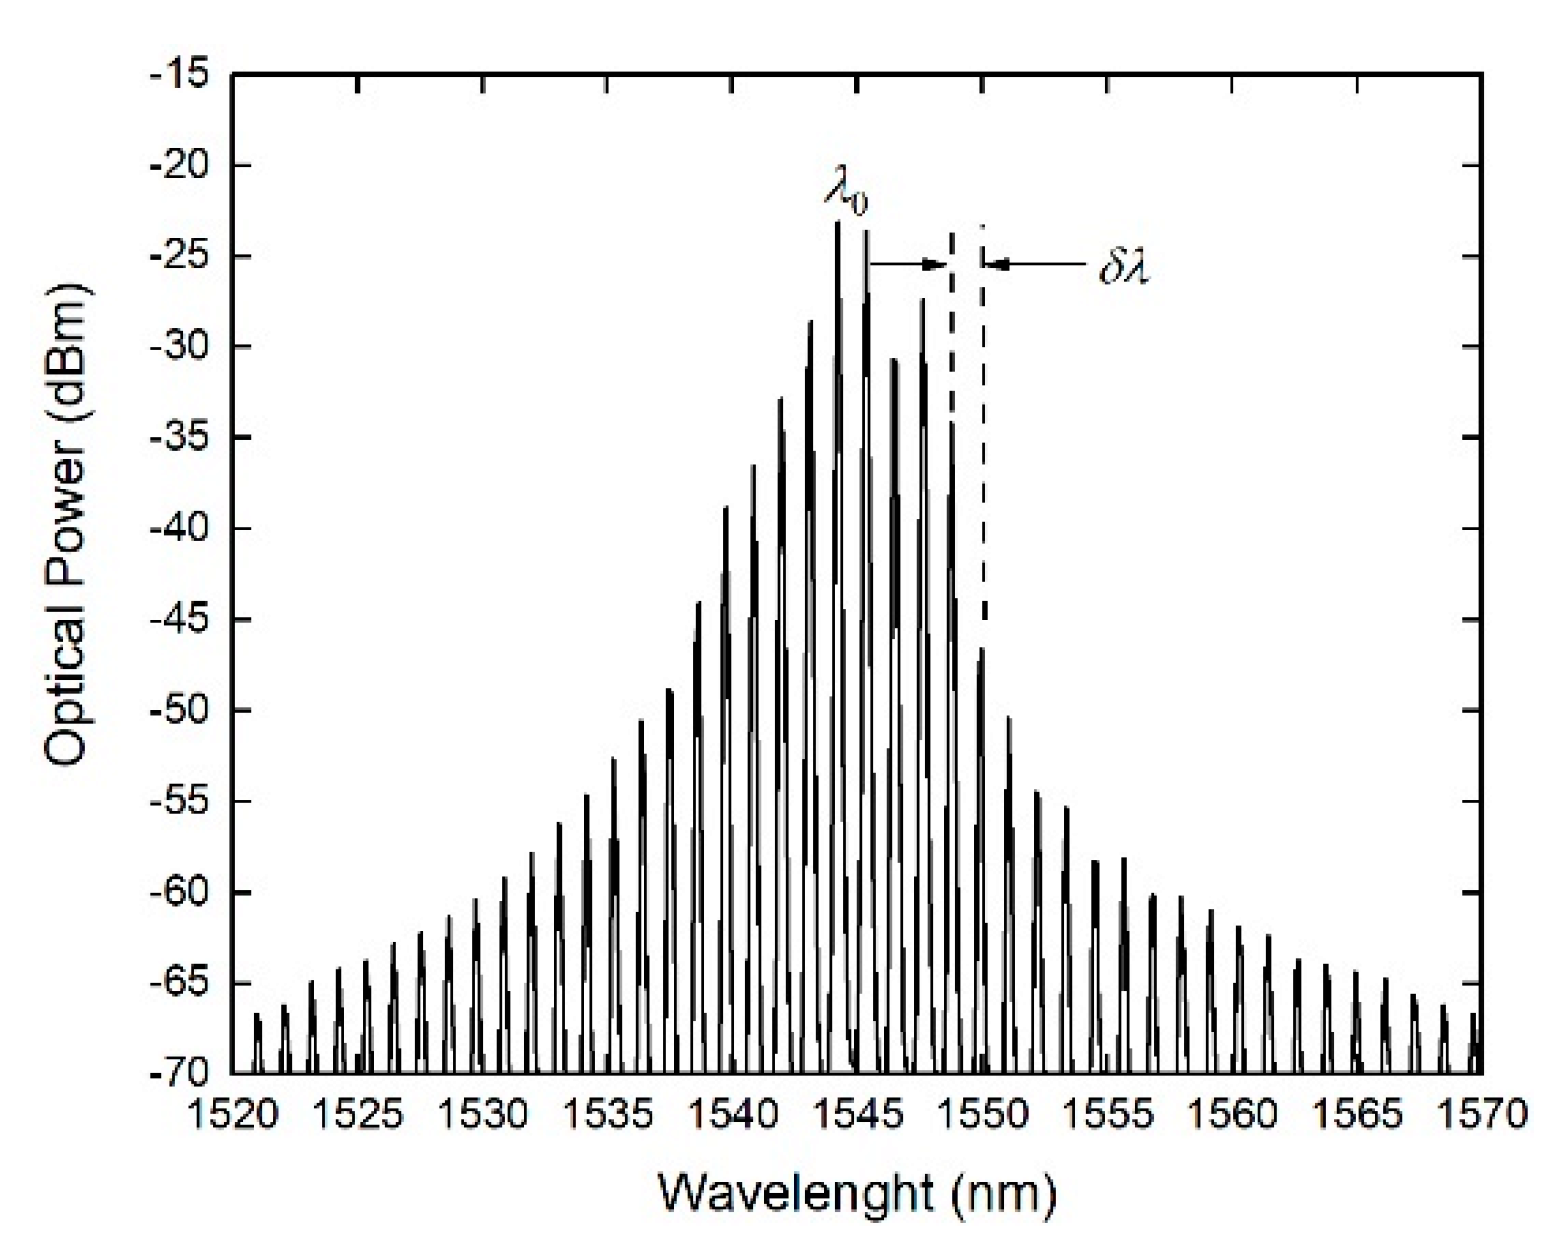
Initially, the optical spectrum of the MLD used in this experiment was measured at a well-stabilized injection current of 20 mA and driven at 25 °C by a temperature-controller to ensure stability to thermic fluctuations. Figure 2 shows the spectrum registered by an optical spectrum analyzer (OSA), obtaining center wavelength λ0 = 1544 nm, δλ = 1.1 nm, and Δλ = 6.62 nm.
Subsequently, a continuous Radio Frequency RF sweep (0.01–10 GHz at 10 dBm) was applied to the electric RF port of the MZ-IM to modulate the light wave of the MLD. The modulated signal passed through a link of the SM-SF of L = 25.31 km, and, according to the fiber datasheet, the main parameters were α = 0.2 dB/km, and D = 15.81 ps/nm⋅km at 1550 nm. Lastly, the PD (Miteq, electrical bandwidth (BW)-13 GHz, Responsivity ℜ = 0.9 A/W) converted the optical signal to an electric signal that corresponded to the frequency response of the system. Figure 3 shows the measured frequency response registered by using an electrical spectrum analyzer (ESA). The parameters of center frequency (fn), BW, and signal-to-noise-ratio (SNR) for each band-pass window were measured. It was noticeable that four well-formed band-pass windows were centered at f1 = 2.1 GHz (BW = 0.425 GHz, SNR = 7.45 dB), f2 = 4.2 GHz (BW = 0.453 GHz, SNR = 7.02 dB), f3 = 6.3 GHz (BW = 0.482 GHz, SNR = 8.20 dB), and f4 = 8.4 GHz (BW = 0.566 GHz, SNR = 8.94 dB).
In the past, we have successfully demonstrated the robustness of this MPF scheme using the filtered band-pass windows as electrical carriers to transmit analog TV-signals [11,12]. Now, the objective of this work, as was initially established, was to use the band-pass windows centered at f1 = 2.1 GHz and f2 = 4.2 GHz as electric carriers to code digital signals. The election of these two filtered band-pass windows obeyed the availability of electric devices (power dividers and mixers) in our laboratory. However, the other band-pass windows (6.3 GHz and 8.4 GHz) can potentially be used as electrical carriers. Knowing that, in digital communications, the maximum data rate that supports a communication system is evaluated by Shannon’s theorem, which states that given a channel with BW and SNR, the maximum channel capacity (C) is estimated as [1]:
C = ( 3.32 ) × ( B W ) × l o g 10 ( 1 + S N R )
Equation (3) allows us to establish the maximum data rate for our proposed experiment. The filtered band-pass windows exhibited, on average, an electrical BW of 481 MHz and an SNR of 7.90 dB, so the theoretical maximum data rate that was possible to transmit was 1.51 Gbps. The handling of Equations (1) and (2) allowed us to compute the theoretical filtered band-pass windows and their corresponding bandwidths, respectively. All these results and the corresponding experimental values, including the SNR, are shown in Table 1.

2.2.2. Experimental Digital Signals Transmission

First, it is important to remark the performance of the pulse pattern generator (PPG) used in this experiment (Agilent 8111OA-165 MHz). The PPG generated pseudo-random binary sequence (PRBS) data with a word length of 214 − 1 at frequencies of 50 MHz, 100 MHz, and 150 MHz with different formats. Knowing that the NRZ modulation format is the optimal choice for access network technologies (<100 km) [2], this format was chosen to code digital data onto the optical carriers. Figure 4 shows the digital signals delivered by the PPG and measured by an oscilloscope (Keysight, DSAV084A, BW of 8 GHz max sample rate of 80 GSa/s), whereas in Table 2, the main features of the digital signals to be transmitted are summarized.
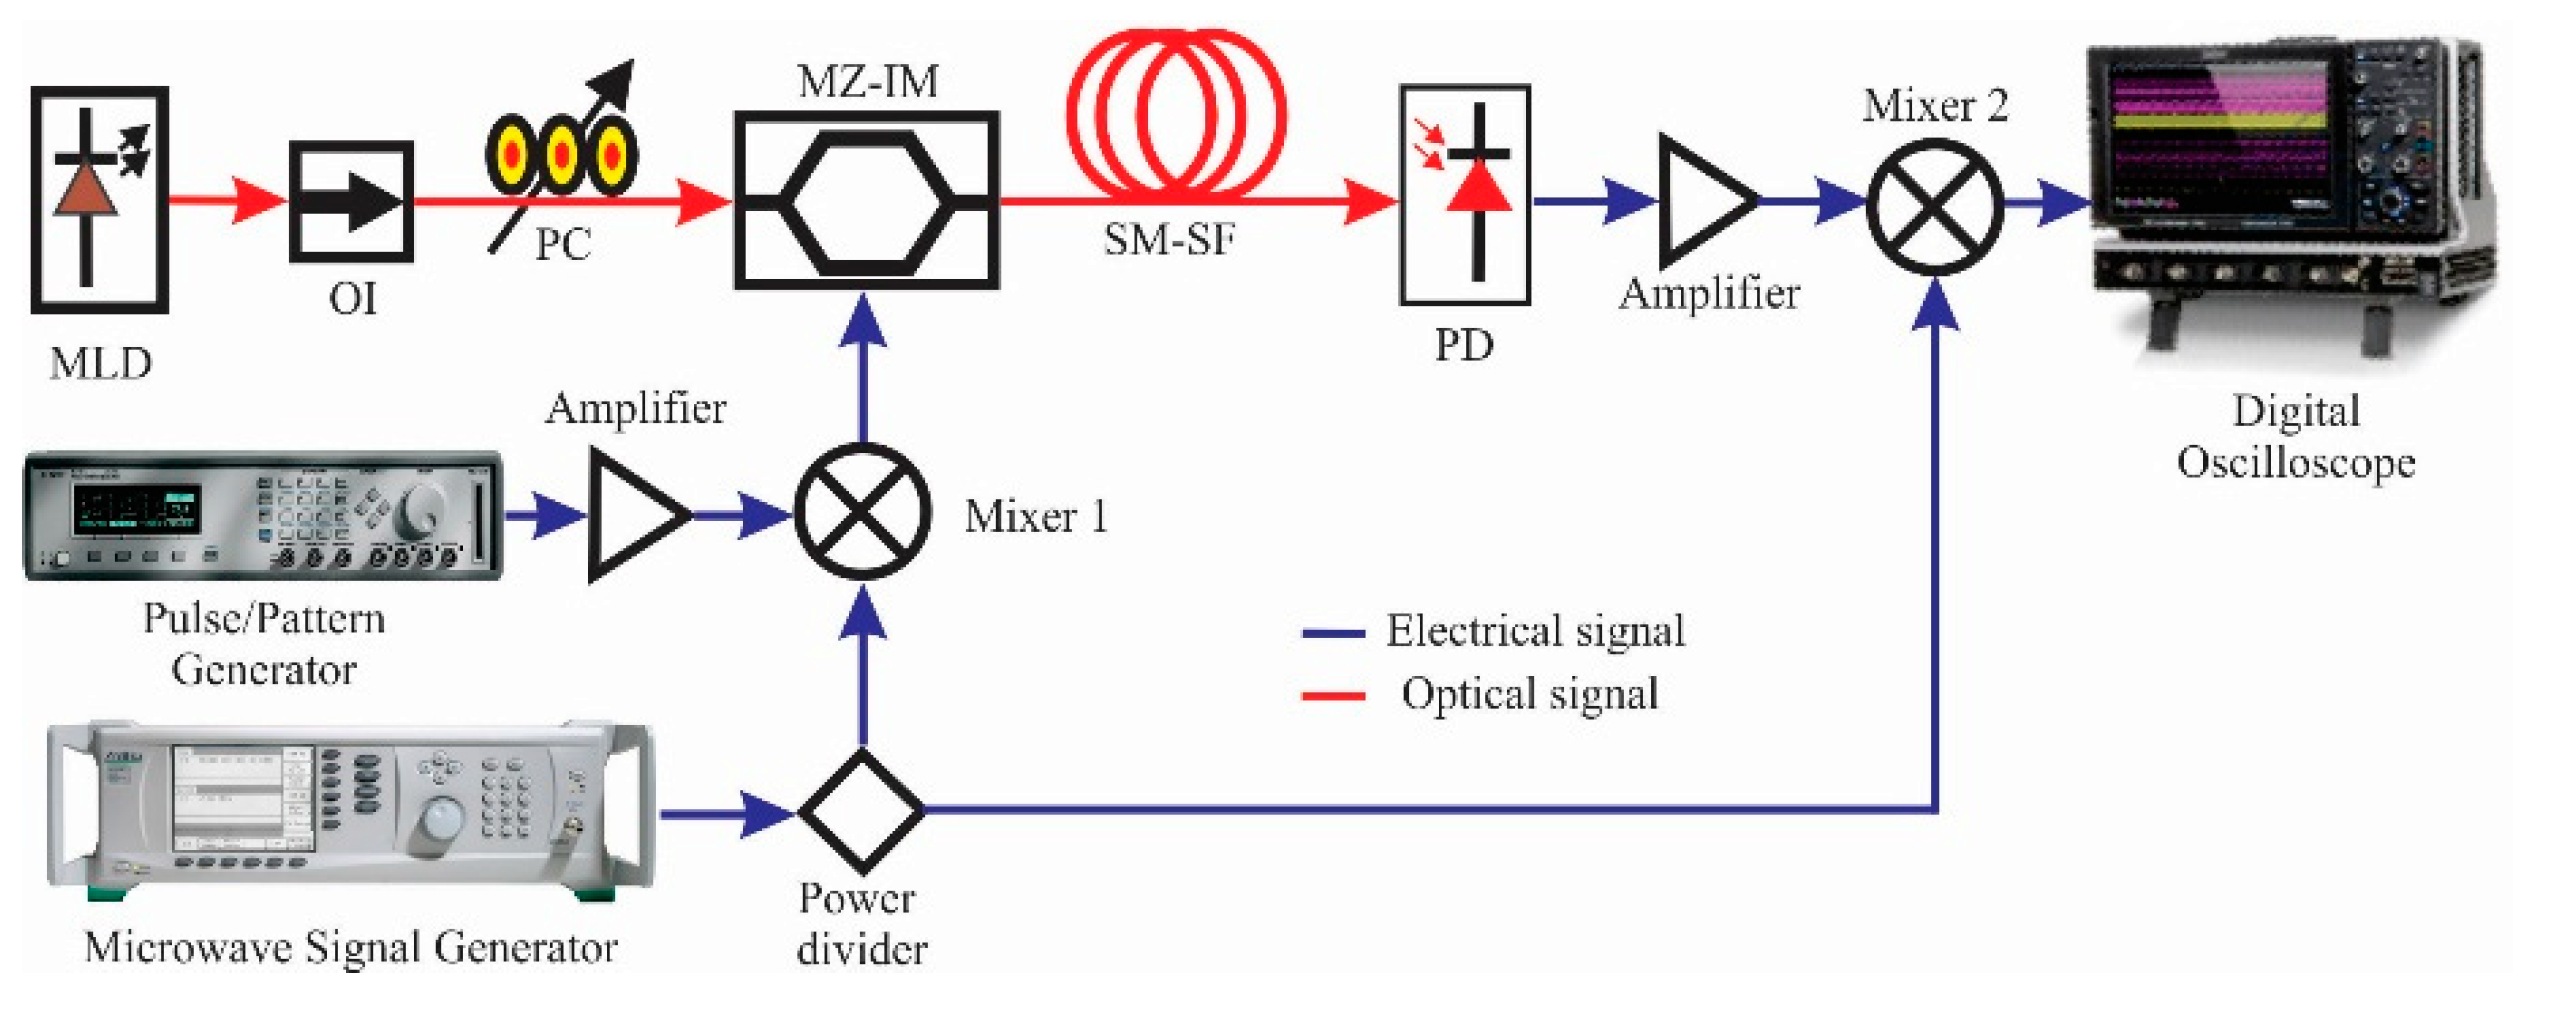
Figure 5 shows the experimental setup used for digital signal transmission. In the following, the utilization of the band-pass window situated at 2.1 GHz (Case A) is described, with the understanding that for 4.2 GHz (Case B), the procedure was similar.
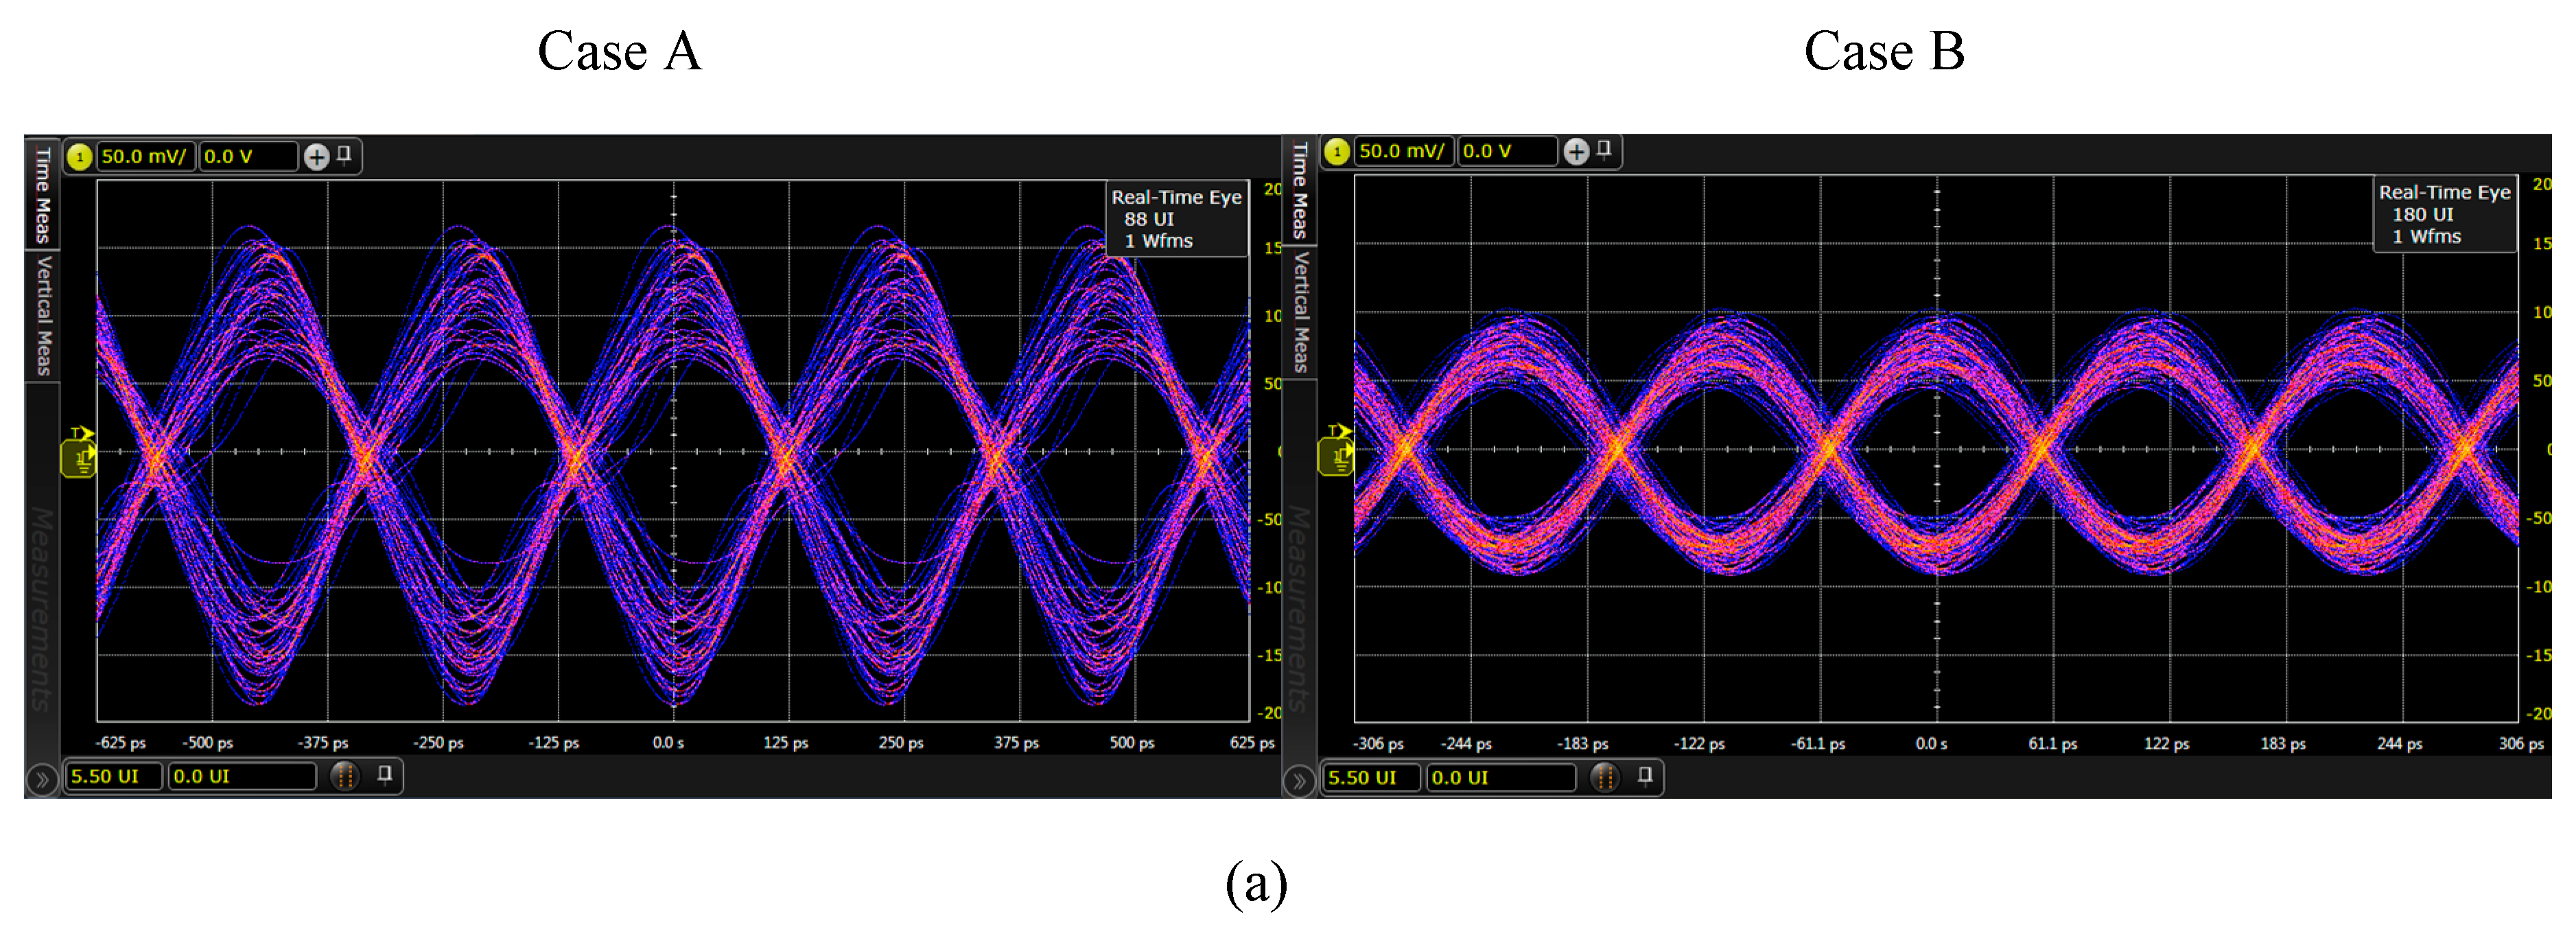
The light issued of the MLD passed across the optical isolator (OI) to avoid reflections; it was sent to a polarization controller (PC) and subsequently to the MZ-IM (MXAN-LN-20, insertion loss of 2.7 dB, Vπ = 2.5 V, operating wavelength of 1530–1580 nm) in order to be modulated. The Microwave Signal Generator MSG_1 (Anritsu, MG3692, 0.1 Hz–20 GHz) supplied an electrical signal of frequency 2.1 GHz at 10 dBm, whereas the PPG provided the digital signal to be transmitted. Both signals were combined (Mixer 1), and the resulting signal was applied to the RF port of the MZ-IM to modulate the light wave. At the output of the MZ-IM, the modulated signal was injected into a coil of 25.31 km of SM-SF. At the end of the optical link, the signal was detected and converted to an electric signal by the PD. This signal was amplified and mixed (Mixer 2) with the microwave signal delivered by the MSG_2 (Rohde and Schwarz, MSB100A, 9 kHz–6 GHz), which was tuned at the same frequency of MSG_1 to decode the transmitted signal. Finally, the electrical signal was plugged to the oscilloscope to measure the digital signal quality through the shape of the eye diagram. Figure 6 shows the eye diagram pattern of the digital signals (50 MHz, 100 MHz, and 150 MHz), which were coded on the microwave band-pass windows situated at 2.1 GHz (Case A) and 4.2 GHz (Case B).
From Figure 6, it can be been that it is remarkable that the eye patterns for Case B achieved better Q-factor, less jitter, and less signal distortion values than Case A. Table 3 recapitulates the quality for the digital signal transmission. It can be observed that the filtered microwave band-pass window centered at 4.2 GHz was the best electric carrier for digital signal transmission. The bit-error-rate (BER) was numerically evaluated by the relationship of the Q-factor to the BER, defined as [13]:
B E R = 1 2 π e Q 2 2 Q
For most practical optical networks, the BER is 10−10, which is convenient to sustain a robust communication system. Thus, from Table 3, it can be noticed that the BER for the filtered microwave band-pass windows centered at 4.2 GHz was less than the threshold established by ITU (International Telecommunications Union) [14].

3. Conclusions

A microwave photonic filter architecture used to transmit digital signals coded in filtered microwave signals or band-pass windows located at 2.1 GHz and 4.2 GHz was presented. The choice of these band-pass windows was made due to the availability of electric devices as power dividers and mixers at our laboratory. However, other band-pass windows at 6.3 and 8.4 GHz can potentially be used as electric carries. The significance of this approach is that the use of an MLD as an optical source allows for the generation of perfectly spaced band-pass windows in a “natural” way. The efficiency of the proposed scheme was evaluated with the transmission of digital signals at frequencies of 50 MHz, 100 MHz, and 150 MHz using the NRZ modulation format. These frequencies obeyed the PPG limitation, the maximum of which was 165 MHz. The NRZ modulation format allowed for the improvement of the dispersion tolerance due to its reduced spectrum width. Due to self-phase modulation (SPM), the effect strongly depends on the optical power of the source [15,16]; we considered the results reported in [17] to determine the minimal optical power needed when the NRZ modulation format was used. The proposed system was free of FWM and XPM inter-channel effects given it was used a single channel transmission. According to the results displayed in Table 3, it is evident that the eye-opening was better for the 2.1 GHz case than for the 4.2 GHz case; however, the Q value was better for the latter case. The experimental results indicated that despite the considerable value of chromatic dispersion parameter exhibited by the optical fiber, acceptable values of the Q-factor, jitter, and bit-error-rate were obtained. On the other hand, note that the use of Equation (1) allowed for the reconfigurability of the filtered microwave band-pass windows in the function of the length of the optical link. For instance, considering D = 15.81 ps/nm⋅km, δλ = 1.1 nm, and L = 12 km, the use of Equation (1) gave f1 = 4.7 GHz, f2 = 9.5 GHz, f3 = 14.3 GHz, and f4 = 19.13 GHz. If L = 50 km, then f1 = 1.1 GHz, f2 = 2.3 GHz, f3 = 3.4 GHz, and f4 = 4.6 GHz. Therefore, a particular microwave band-pass window could be assigned to final users in the function of this distance. This reconfigurability is important because in a PON scheme, the optical link does not necessarily have to have the same length or distance. Finally, although that the data rates used in this experiment were modest, they were enough to deliver services like IP telephony, internet, streaming video, and high definition television (HDTV); therefore, the obtained results allow for the proposition of the use of this MPF architecture as a potential candidate for a PON scheme to distribute these services. In summary, our experiments demonstrated that the proposed system can be adapted to transmit analog or digital data.

Author Contributions

Conceptualization, methodology, preparation and writing the draft, A.G.C.-M., A.G.-J., and I.E.Z.-H.; resources, writing—review and editing, A.V.-M., and J.R.-A.; supervision, I.E.Z.-H. All authors have read and agreed to the published version of the manuscript.

Funding

This research received no external funding.

Acknowledgments

One of the authors, A. G. Correa-Mena would like to thank the CONACyT for the student scholarship number 335148.

Conflicts of Interest

The authors declare no conflict of interest.

References

  1. Tomasi, W. Advanced Electronic Communications Systems, 6th ed.; Pearson: London, UK, 2014. [Google Scholar]
  2. Winzer, P.; Essiambre, R. Optical Fiber Telecommunications V B, 5th ed.; Academic Press: Holmdel, NJ, USA, 2008. [Google Scholar] [CrossRef]
  3. Li, L.; Yi, X.; Song, S.; Chew, S.X.; Minasian, R.; Nguyen, L. Microwave Photonic Signal Processing and Sensing Based on Optical Filtering. Appl. Sci. 2019, 9, 163–165. [Google Scholar] [CrossRef] [Green Version]
  4. Alobaidan, H. Current and Future FTTH Technologies. J. Wirel. Netw. Commun. 2017, 7, 35–40. [Google Scholar] [CrossRef]
  5. Ali, R.; Ali, M.; Mir, T.; Shabir, B.; Lilla, U. Analytical Review of Advance Optical Modulation Formats. ELELIJ 2015, 4, 35. [Google Scholar] [CrossRef]
  6. García-Pérez, A.; Andrade-Lucio, J.; Ibarra-Manzano, O.; Alvarado-Méndez, E.; Trejo-Duran, M.; Gutiérrez-Martín, H. Efficient modulation formats for high bit-rate fiber transmission. Acta Univ. 2006, 16, 17–26. [Google Scholar]
  7. Irfan, M.; Qureshi, M.; Zafar, S. Evaluation of advanced modulation formats using triple-play services in GPON based FTTH. In Proceedings of the International Conference on in Cloud Computing, Riyadh, Saudi Arabia, 26–29 April 2015; pp. 1–6. [Google Scholar] [CrossRef]
  8. Phogat, A.; Gulati, T.; Malik, D. Q-factor and Jitter performance in WDM systems using RZ, NRZ, and Duobinary modulation formats at different distances. Int. J. Latest Trends Eng. Technol. 2013, 2, 30–34. [Google Scholar]
  9. Kurbatska, I.; Alsevska, A.; Gegere, L.; Bobrovs, V. Comparison of modulation formats for use in the next generation passive optical networks. In Proceedings of the Progress in Electromagnetic Research Symposium, Shanghai, China, 8–11 August 2016; pp. 3783–3787. [Google Scholar] [CrossRef]
  10. González-Mondragón, L.A.; Quintero-Rodríguez, L.J.; García-Juárez, A.; Vera-Marquina, A.; Zaldívar-Huerta, I.E. Multiple passband microwave photonic filter with adjustable bandwidth. Opt. Laser Technol. 2020, 126, 106133. [Google Scholar] [CrossRef]
  11. Zaldívar-Huerta, I.E.; Peréz-Montaña, D.; Hernández-Nava, P.; García-Juárez, A.; Rodríguez-Asomoza, J.; Leal-Cruz, A. Transmission system for distribution of video over long-haul optical point-to-point links using a microwave photonic filter in the frequency range of 0.01–10 GHz. Opt. Fiber Technol. 2013, 19, 665–670. [Google Scholar] [CrossRef]
  12. Correa-Mena, A.; Zaldívar-Huerta, I.E.; Abril-García, J.; García-Juárez, A.; Vera-Marquina, A. Practical application of a bidirectional microwave photonic filter: Simultaneous transmission of analog TV signals. Opt. Eng. 2016, 55, 106125. [Google Scholar] [CrossRef] [Green Version]
  13. Freude, W.; Schmogrow, R.; Nebendahl, B.; Winter, M.; Josten, A.; Hillerkuss, D.; Koenig, S.; Meyer, J.; Dreschmann, M.; Huebner, M.; et al. Quality metrics for optical signals: Eye diagram, Q-factor, OSNR, EVM and BER. In Proceedings of the 2012 14th International Conference on Transparent Optical Networks (ICTON), Coventry, UK, 2–5 July 2012. [Google Scholar] [CrossRef]
  14. G.983.1 Broadband Optical Access Systems Based on Passive Optical Networks (PON) ITU-T. Available online: https://www.itu.int/rec/T-REC-G.983.1/en (accessed on 2 April 2020).
  15. Sharan, L.; Chaubey, V. Design and simulation of CSRZ modulated 40 Gbps DWDM system in presence of Kerr Non linearity. In Proceedings of the Ninth International Conference on Wireless and Optical Communications Networks, Indore, India, 20–22 September 2012; pp. 1–5. [Google Scholar] [CrossRef]
  16. Park, S.; Gnauck, A.; Wiesenfeld, J.; Garrett, L. 40-Gb/s transmission over multiple 120-km spans of conventional single-mode fiber using highly dispersed pulses. IEEE Photonics Technol. Lett. 2000, 12, 1085–1087. [Google Scholar] [CrossRef]
  17. Inna, K.; Sandis, S.; Girts, I.; Njaceslavs, B. Investigation on optimal transmission parameters for different modulation formats in 10 Gbit/s WDM-PON systems. In Proceedings of the International Workshop on Fiber Optics in Access Network, Lisbon, Portugal, 18–19 October 2016. [Google Scholar] [CrossRef]
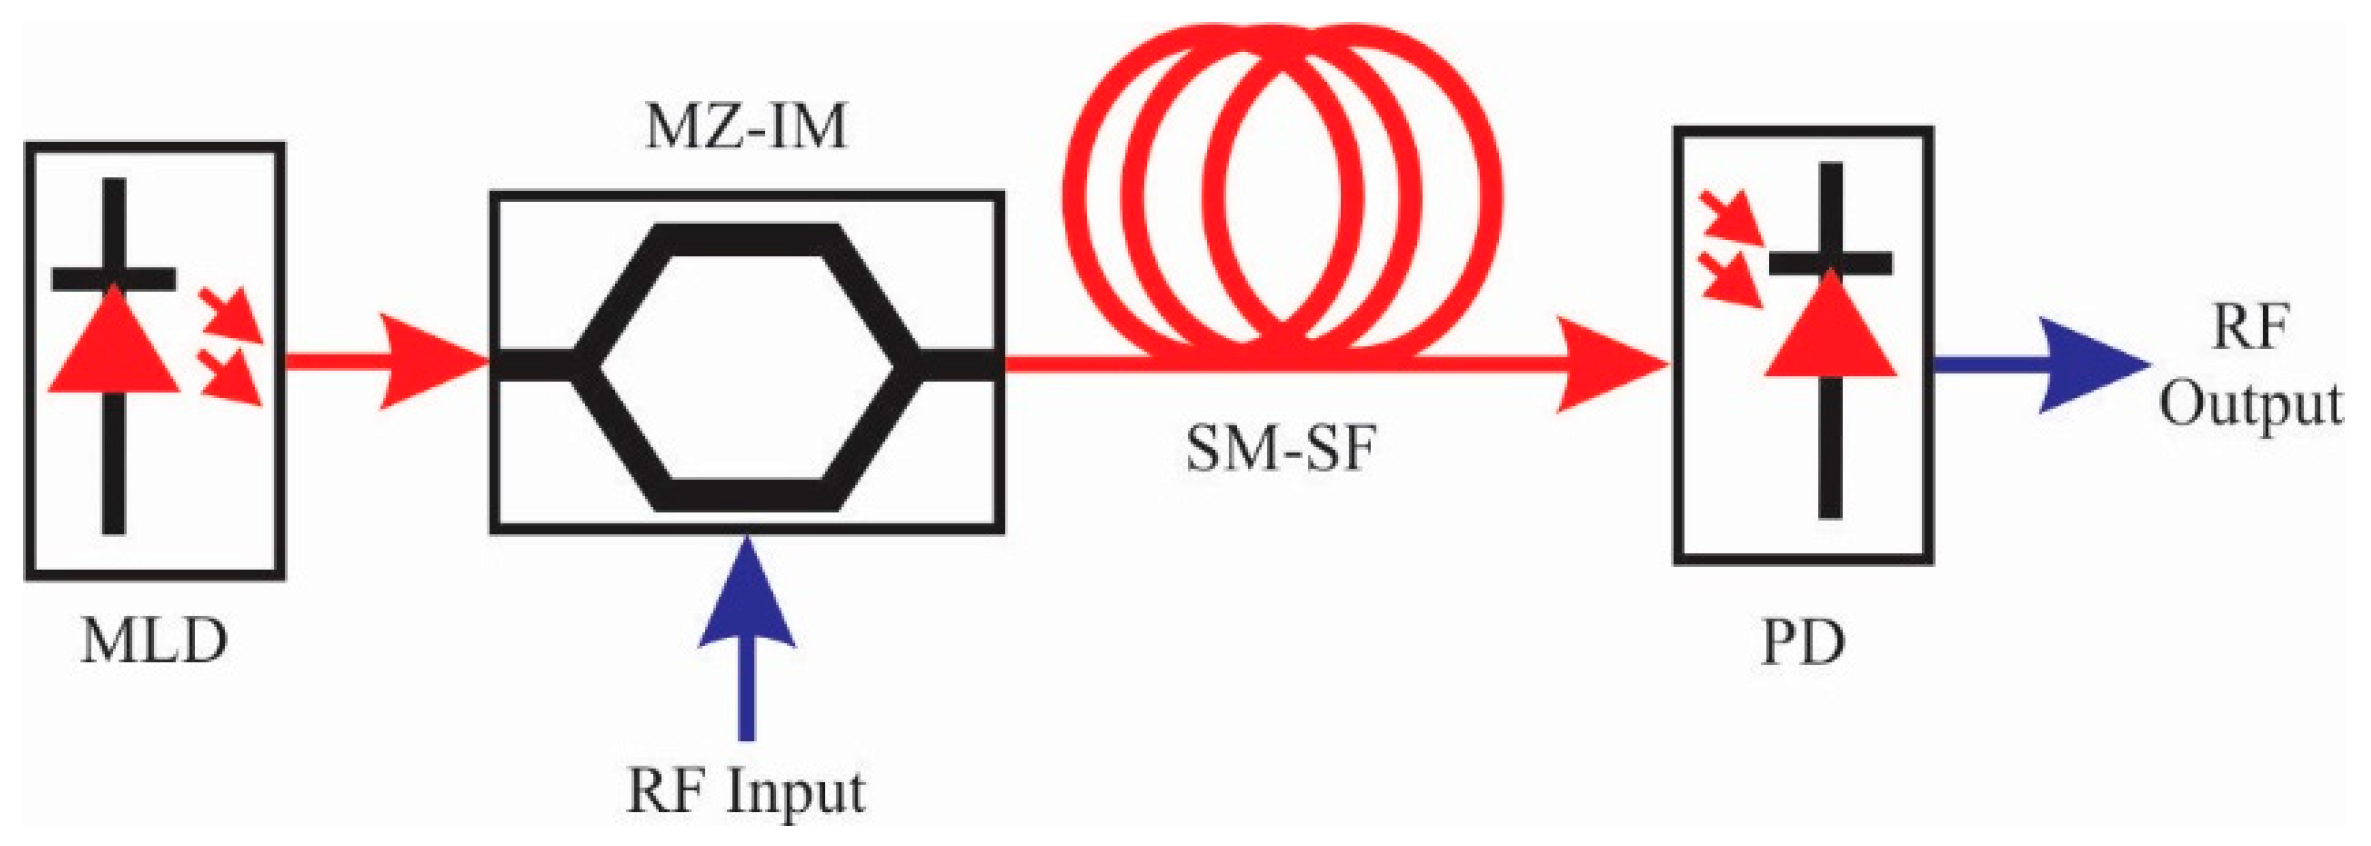
Figure 1. Basic configuration of the proposed microwave photonic filter (MPF) [10].
Electronics 09 00833 g001
Figure 2. Optical spectrum of the multimode laser diode (MLD) (ML925B45F).
Electronics 09 00833 g002
Figure 3. Experimental frequency response.
Electronics 09 00833 g003
Figure 4. Eye diagrams of the transmitted digital signals at (a) 50 MHz, (b) 100 MHz, and (c) 155 MHz.
Electronics 09 00833 g004
Figure 5. Proposed experimental setup to carry out the digital signals transmission.
Electronics 09 00833 g005
Figure 6. Eye diagram of the digital signal at (a) 50 MHz; (b) 100 MHz; and (c) 150 MHz.
Electronics 09 00833 g006aElectronics 09 00833 g006b
Table 1. Electrical parameters of the filtered band-pass windows. fn: center frequency; BW: electrical bandwidth; SNR: signal-to-noise ratio; and C: maximum channel capacity.
FrequencyTheoretical
fn (GHz) by Using Equation (1)
Experimental
fn (GHz)
Theoretical
Δfbp (MHz) by Using Equation (2)
Experimental
BW (MHz)
Experimental
SNR (dB)
Theoretical C (Gbps) by Using Equation (3)
f12.272.14014257.451.30
f24.544.24537.021.35
f36.816.34828.201.54
f49.088.45668.941.87
Table 2. Features of the digital signals to be transmitted.
Frequency (MHz)50100155
Q-factor44.4845.8742.76
Eye Height (mV)871875881
Eye Width (ns)19.369.816.49
Eye Jitter RMS (ps)113.1342.7640.46
Table 3. Performance measurement of the digital signals transmission.
Frequency PPG (Pulse Pattern Generator) (MHz)50100150
Electrical Frequency (GHz)2.14.22.14.22.14.2
Q-factor4.76.165.126.545.26.58
Eye Height (mV)100.083.2118.884.0116.878.1
Eye Width (ps)165.9881.16184.5385.96168.9483.55
Eye Jitter RMS (ps)10.515.419.375.2310.204.90
BER1.35 × 10−63.72 × 10−101.58 × 10−73.14 × 10−111.03 × 10−72.40 × 10−11