Article

Automated Spatiotemporal Classification Based on Smartphone App Logs

1
School of Games, Hongik University, Seoul 30016, Korea
2
Graduate School of Advanced Imaging Science, Multimedia & Film, Chung-Ang University, Seoul 06973, Korea
3
Department of Computer Engineering, Jeju National University, Jeju 63241, Korea
*
Author to whom correspondence should be addressed.
Electronics 2020, 9(5), 755; https://doi.org/10.3390/electronics9050755
Submission received: 6 April 2020 / Revised: 27 April 2020 / Accepted: 30 April 2020 / Published: 4 May 2020
(This article belongs to the Special Issue Virtual Reality and Scientific Visualization)

Abstract

:
In this paper, a framework for user app behavior analysis using an automated supervised learning method in smartphone environments is proposed. This framework exploits the collective location data of users and their smartphone app logs. Based on these two datasets, the framework determines the apps with a high probability of usage in a geographic area. The framework extracts the app-usage behavior data of a mobile user from an Android phone and transmits them to a server. The server learns the representative trajectory patterns of the user by combining the collected app usage patterns and trajectory data. The proposed method performs supervised learning with automated labeled trajectory data using the user app data. Furthermore, it uses the behavioral characteristics data of users linked to the app usage data by area without a labeling cost.

1. Introduction

Due to the widespread use of smartphones, the number of mobile users has increased significantly in the past few years, together with a rise in the number of apps used by these users. Following an increase in paid/free app registrations in Google Play, the total number of apps used has rapidly increased, from 2300 in 2009 to 3.5 million in 2018 [1]. Furthermore, using a variety of app data mining techniques, new systems are being continuously proposed to recommend user-preferred apps [2,3]. As smartphones enable an easy usage of networks, the usage volume is high, and, hence, meaningful data can easily be obtained and transmitted to a server. It is possible to provide useful information to smartphone users and app developers, if data from smartphones are sent to a server and analyzed collectively. However, it is difficult to predict and infer high-dimensional representative behaviors of users in real-space based solely on the app usage details from their smartphones. In this paper, an algorithm is proposed that determines the probability of apps being used in defined geographic areas, using a running app and the location data of a smartphone. The algorithm is based on the observation that group-based trajectory patterns of users differ depending on the representative behavior patterns of a corresponding area. This study shows that user behaviors in respective geographical regions can be predicted via machine learning using characteristic group-based trajectory patterns and app usage details. We demonstrate that the app usage pattern of users can be predicted from trajectory data by area. The framework extracts the app usage and location data of the smartphone and transmits it to an analysis server. The server accumulates the trajectory and app usage data collected from a large number of users and learns the representative patterns by area. Most trajectory analysis methods previously proposed in [4,5,6,7,8,9] analyze the characteristics of trajectories of real-world data from image data and a trajectory model. This study is the first to attempt to increase the accuracy of trajectory analysis using data from a virtual space for trajectory analysis. The main aspects of our study are as follows.
  • Group trajectory-based behavior prediction system: App usage pattern of real-world users is predicted based on location data from mobile data.
  • Auto supervision method for trajectory analysis: App usage details and trajectory data are automatically paired and used as auto supervised learning data.
The rest of the paper consists of five sections. In Section 2, app data mining studies and trajectory analysis techniques in mobile environments are introduced. In Section 3, the representative trajectory characteristics by area based on app usage logs are described. In Section 4, the proposed system is described. In Section 5, the validity of the proposed method is examined by analyzing the experimental results. Finally, in Section 6, the main findings of the study are summarized and future studies are considered.

2. Previous Works

In our study, app data mining and trajectory analysis were combined. A summary of previous studies in these two fields is presented in the following section.

2.1. App Datamining

Several data mining methods have been used to analyze user behavior in mobile environments from literature. Prior to the vitalization of mobile ecosystems, neither network use nor data extraction was easy in mobile environments. Therefore, data were collected and analyzed based on surveys by dividing mobile users into different populations [10]. However, with mobile device SDK support, it is now easy to store and extract data from mobile devices. More precisely, mobile behavioral data can be saved in a log format in local storage for subsequent extraction and analysis [11]. Saving data in a log format has the drawback of the possibility of directly extracting data from the corresponding mobile devices. To address this, several studies have proposed group-based network traffic analysis. In this method, packet data that pass through the gateway of a network are acquired and analyzed [12,13]. Moreover, acquiring data through an IP-based gateway has limitations, such as difficulties in data extraction and analysis, and presentation of statistical data. Following advancements in apps in mobile environments, behavioral data can be extracted and analyzed using apps [3,14]. Hanuu [3] collected mobile contextual data automatically by installing MobiTrack on mobile devices and proposed a method of sending the data periodically to a server to perform synchronization. The contextual data extracted using MobiTrack contain categories that show the characteristics of apps, such as communication usage, multimedia consumption, and device features. The categories are not subdivided. Recently, mainstream attempts have been made to perform integrated analysis of user behaviors using varieties of multi-modal data together with app data. Various miniaturized sensors can be easily mounted on a mobile device, and, thus, widespread collection and analysis of multi-modal data is feasible [10,12,13,15,16,17,18]. Furthermore, in some studies, various data were collected and analyzed in mobile environments. Particularly, GPS, calls, SMS, picture views, pictures, weather, mp3, battery, and other types of data were collected and the user’s status was estimated by applying statistical analysis and impact [19]. Furthermore, voice calls, data communication, and battery usage data were collected and analyzed. Using this information, a network business operator can optimize the construction of an infrastructure and the creation of new services [20]. The authors of [21] collected and analyzed mobile sensor and network data for mobile user convenience. In [22], the session usage of mobile users and their inherent mobile usage rate were investigated. There is an approach that uses numerical data provided on an app platform, which is an alternative to obtaining data from each device in a mobile environment. App stores provides a variety of app information for customers, businesses, and technology-centric attributes. The information can be accessed via an SDK provided by the app platform, and thus, research data can easily be acquired. Harman et al. [23] extracted function-related information of an app using the app store’s mining and analysis data and combined the information with more easily usable data to analyze the technology, customer, and business aspects of the app. Based on this approach, potential factors for software repository mining studies were identified.

2.2. Trajectory Analysis

Generally, the trajectory analysis field emphasizes research on object trajectory tracking. This involves the prediction of the location of an object based on a previous trajectory by a dynamic model. This is a fundamental technique in traffic analysis and predictions in the field of traffic engineering. Recently, object tracking has advanced considerably, relative to technology. Current systems have high precision and are capable of automatically processing challenging sequences. Lerner [24] proposed a crowd simulation technique. The approach was a data-based method that ran simulated agents using a trajectory extracted from a video of a real crowd. Consequently, various types of crowds could be simulated. Pellegrini [25] proposed Linear Trajectory Avoidance (LTA), which is a dynamic model that can track multiple individuals in complex scenarios. In the LTA model, all interactions between simple image information related to a destination or a desired direction and a different target object are considered. Angular pedestrian grid (APG) was introduced as a new dynamic object processing method that encrypts the information of a nearby pedestrian. Recently, vehicle-crowd interaction scenarios have attracted significant interest. Several models [5,6,7,8] have been designed to explain the movement of crowds under specific conditions, with interpersonal relationships and vehicle–pedestrian interactions being considered separately. Yang [9] built a new pedestrian trajectory dataset that included both, interpersonal relationships and vehicle-crowd interactions. In particular, a proposal was advanced to determine the interaction between individual persons and vehicle-crowd interactions, by predicting the group movements of a pedestrian group (crowd), which is an essential technology for the development of autonomous vehicles. Recently, long-short term memory (LSTM) [26] and gated recurrent units (GRU) [27] were successfully applied to sequence prediction tasks, such as voice [28] and handwriting recognition [29] in artificial intelligence. These techniques have been applied to moving line fields. Alahi [30] proposed a social LSTM model based on a LSTM model that is able to jointly make inferences for many individual persons in order to predict human trajectory. It has the characteristic that one LSTM is used for each trajectory and information is shared between LSTMs via the adoption of a new social pooling layer. Pfeiffer [4] proposed a method of modeling pedestrian dynamics and interactions between them based on LSTM. The LSTM neural network facilitated simultaneous predictions of pedestrian–pedestrian interactions and the avoidance of static obstacles. In addition, Lu et al. [31] proposed an LSTM neural network based on multi-regime modeling and ensemble learning to accurately capture the different patterns of traffic flow dynamics. Recently, a convolution neural network (CNN) [32] was used for traffic flow forecasting. The CNN algorithm performance in image recognition classification has been demonstrated in previous studies, and it is primarily characterized by its capability to detect topological features. Relevant CNN-based models were fitted for forecasting traffic flows from traffic condition information of adjacent roads [33,34,35,36,37,38,39].
This study aimed to predict the probability of app usage based on real-world trajectory data by integrating a conventional app-data mining technique and a CNN-based classification method. Although the conventional trajectory analysis technique attempts to predict the movement of an object based on collected trajectory data, in our study, the usage of an app is predicted with CNN.

3. Proposed Spatiotemporal Analysis

3.1. Spatial Design and Analysis

In the process of spatial designing, such as in architecture and urban planning, there may be spatial intentions for allowing pedestrians moving in a given location to experience their surrounding area in specific ways. In a theme park scenario, designers position restaurants in specific areas, so that visitors have access to food and can rest, when required. Additionally, for effective traffic control, appropriate signs are positioned along specific streets. Although the space is designed with these intentions in mind, visitors may exhibit behaviors different from these expectations. These deviations from the original spatial intentions may not be evident for some individuals. The behavior of visitors in a space can be accurately analyzed only if group-based multi-modal data are collected from many individuals. Generally, spatial use analysis is performed through video image analysis and statistical analysis on the corresponding space and is associated with a large computational burden. In this study, a system was built that automatically labels the representative trajectory data of each area using app usage details. We define the representative app usage patterns in the respective areas by tracking the app usage data of users. Using the defined patterns, all trajectory patterns generated by the users in a corresponding area are learned by an artificial neural network. A classifier trained in this manner automatically checks the behaviors performed by the users in a corresponding area based on the trajectory data patterns produced. Our methodology can be used as follows. First, by performing spatial analysis, the preference information of users in a corresponding area can be estimated based on the app usage details. If a certain user opens a navigation or map searching app at a certain position, this indicates that navigation information is needed in the corresponding area. Thus, a spatial designer can consider the installation of road signs that can provide local information for the corresponding area. Second, from the spatial analysis, if time series trajectory information is examined together with app usage details, the corresponding area associated with the information of interest and real behavior information can be investigated spatiotemporally. This information facilitates various time series analysis approaches and consequently, the temporal behavior changes of visitors can be determined intuitively for a certain space. Third, app usage details and trajectory information are paired so that they can be cross-referenced. Thus, if they are applied to the automated supervised learning method used in machine learning, mutual prediction between app usage details and trajectory is feasible. If only the app usage details are examined, the next trajectory location of the user at the corresponding position can be estimated. Moreover, current app usage can be estimated based on the trajectory location. We designed the framework to facilitate such usability.

3.2. App Categories

For these tasks, representative app categories are summarized. By 2019, the app categories in the Google Play Store consisted of 32 sub-categories, and the game category consisted of 17 genres. We defined the nine most representative patterns (Information, Finance, Entertainment, Education, News, Communication, Shopping, Photography, and Navigation) among them and integrated the app category with these representative patterns. The entire game category was classified separately from the app category and was integrated with the entertainment category. In Table 1, the association relationships between the app categories as they were defined by Google Play and the authors are shown. These representative patterns can be viewed as expressions of behavioral desires demanded by users in a corresponding area, and these patterns can be useful reference information if performing spatial analysis. Several studies predict the representative behavior patterns of users in a corresponding area by only using the trajectory patterns. In contrast, we improve the accuracy of the trajectory analysis by performing learning using the app-usage details, in addition to the trajectory data.

4. System

The details of the proposed spatiotemporal analysis process are shown in Figure 1. An app that can collect a user’s app-usage details and location information and distribute it to the test participants was developed. It collects and processes the user data in real-time and transmits the resulting information to a server. The server collects the data received from numerous users and refers to the representative label of the app by communicating with the Google app server. Then, the app uses the classification information obtained in this manner and the current local area information as an input into an artificial neural network. Learning is performed by unit area. The trained artificial neural network identifies the features of a group-based trajectory in a designated area and predicts an app category that is highly likely to be used by users in corresponding areas.
The system consists mainly of one client and three servers. The mobile client is a background app client that extracts app execution behavior data from smartphones and sends them to a server. The extracted smartphone behaviors were limited to certain time points. The data accumulated between screen-on and screen-off time of the smartphone was regarded as the database transaction data of user behavior for the subsequent analysis. This data included the parameters required for the analysis of the transaction data.
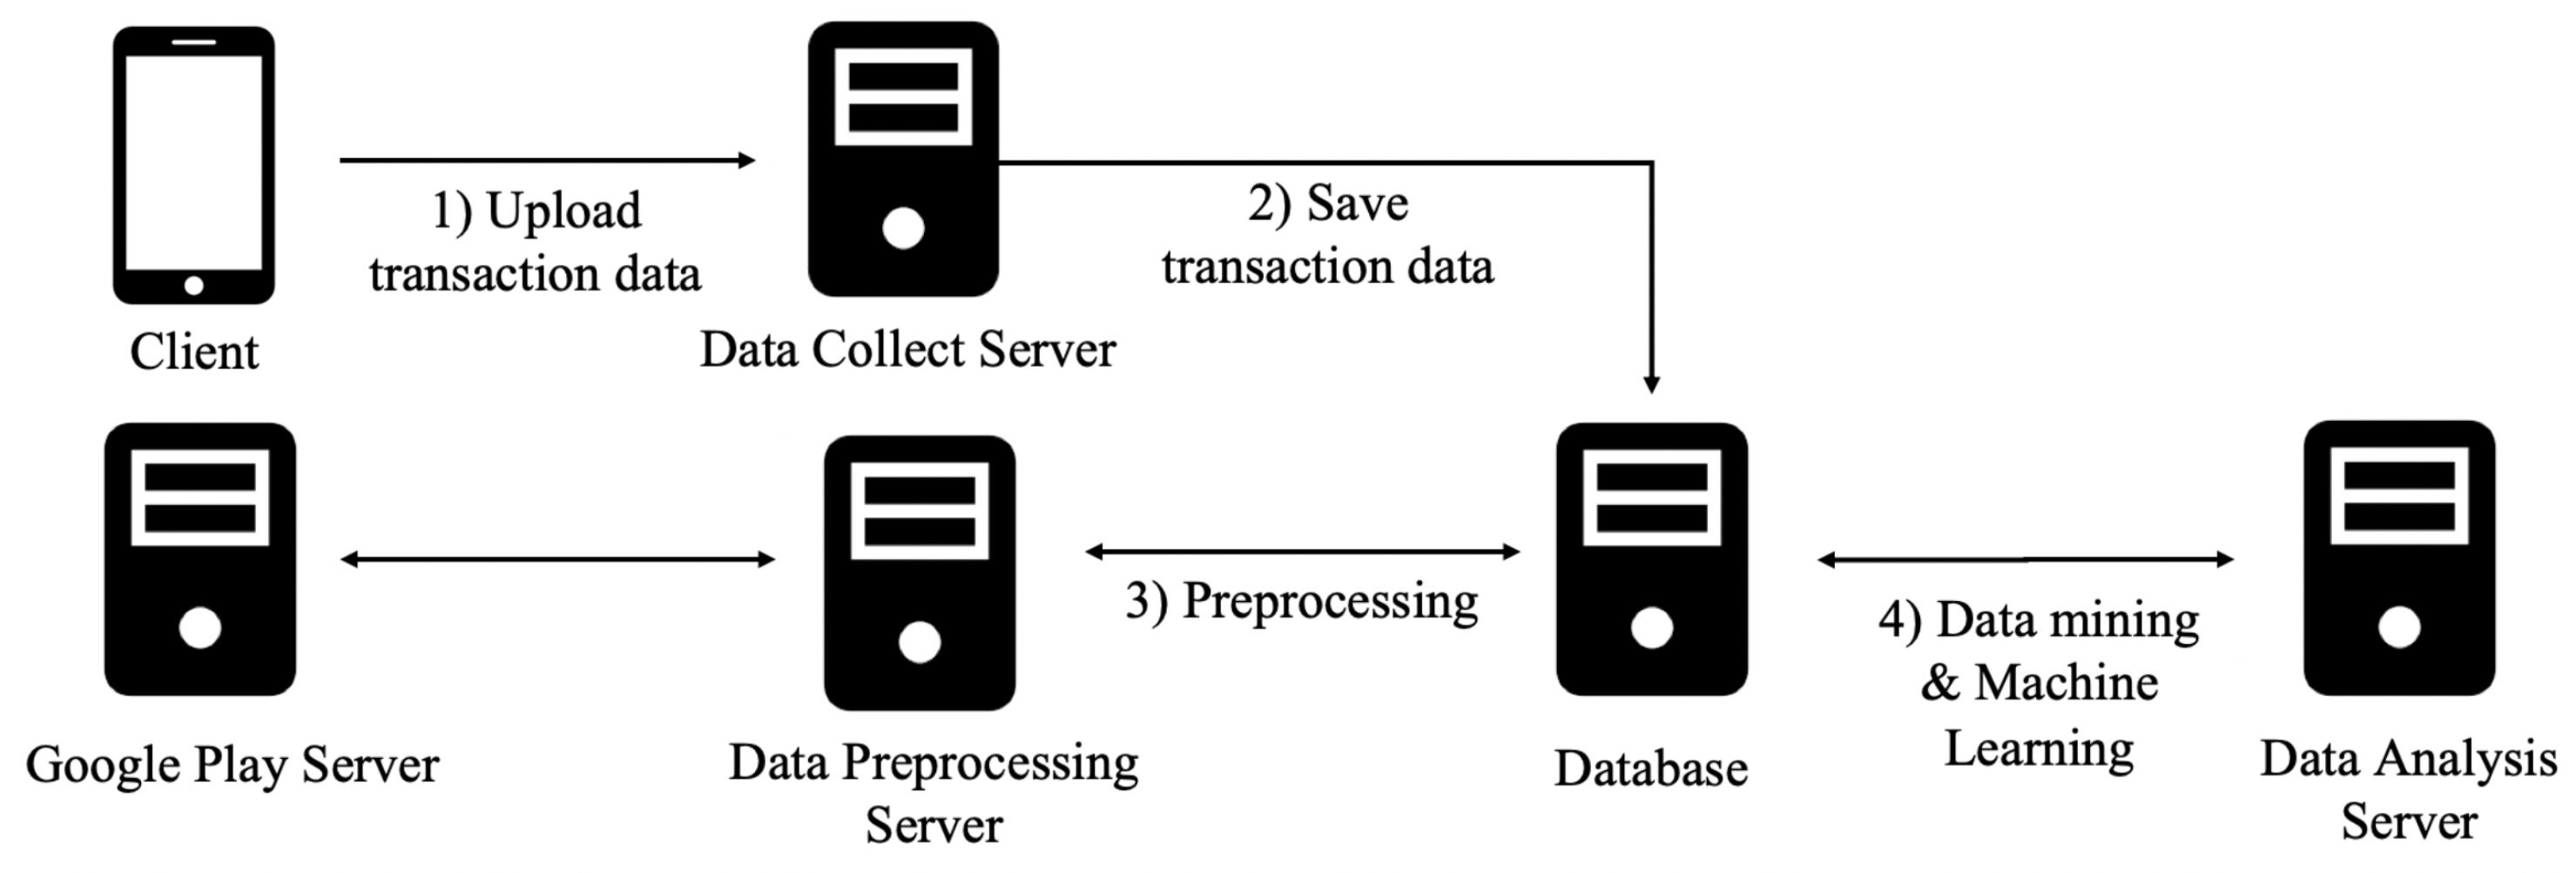
The framework proposed in this study is an extension of the system constructed in [40]. The overall system diagram is shown in Figure 2. The data analysis stages consist of: (1) the smartphone’s data extraction and transmission stage; (2) the data preprocessing and correction task stage; and (3) the data analysis stage. The data collect server receives data from the clients and saves them in storage. The data processing server performs preprocessing tasks before analyzing the data. The preprocessing tasks used are as follows: (1) a cleansing task that deletes unnecessary data from the received data; (2) a maintenance task that reorganizes unsuitable data; and (3) a changing task that converts the collected data into machine learning data. The data analysis server analyzes the preprocessed data. To analyze the data in the framework, a daily smartphone usage volume was determined by analyzing the numerical values of the transactions transmitted by each client. The labeling values of the category values extracted with the app for all transactions were determined.

4.1. Smartphone’s Data Extraction and Transmission Stage

During the data extraction and transmission stage, the information of an app executed by the user on the smartphone is collected and transmitted to the server. The developed client app operates as a background service of the smartphone and extracts the behavior of the smartphone user by transaction. Data needed for app usage analysis in a unit behavior transaction are included. The smartphone screen has two states. Screen-on is the state when the screen display is turned on, while screen-off is the state when the screen display is turned off. A transaction is defined as the usage behavior between screen-on and screen-off. The four types of data included in the behavior transactions are:
  • IMEI (International Mobile Equipment Identity): It refers to an international unique identification number of a device provided by the manufacturer upon the device leaving the factory. The corresponding information is encrypted and modified to protect the privacy of the users.
  • Recent Tasks: It indicates the apps being executed on the device.
  • Current Date: It indicates the system time at the termination time point of a transaction.
  • Position: It indicates the device location value at the transaction time point.
Data extracted at the termination time point of a transaction are saved in the file system of the smartphone. The saved files are sequentially transmitted to the server through the HTTP protocol. Successfully transmitted data undergo deletion in the file system, and, when failure occurs, the data remain in the file system and retransmission is attempted at the next transmission time. Given that a retransmission mechanism is included, loss of data can be prevented even when it is temporarily impossible to use the network.

4.2. Data Preprocessing Stage

In the data preprocessing stage, a data warehouse is created in the server by testing the validity of the received data, deleting unnecessary data, and correcting additionally required data. The validity test checks whether the data are in the defined json format. If failure occurs in the validity test, the process does not proceed to the next stage. In the task of deleting unnecessary data, data that are not required for the transaction analysis are deleted (e.g., Android launcher setting values, setting values in Android, user contact information, etc.). For the task of correcting additionally required data, the category data are added to the package name of an app executed with the received data. The corresponding task uses the Google Play site’s HTTP GET METHOD API. After completion of the correction task, the final data are recorded in the file system. The respective behavior transaction data are saved by date after a root directory is formed based on the IMEI value.

4.3. Data Analysis Stage

In the data analysis stage, the data saved in the server are analyzed and the results are extracted. Based on the collected data, we performed the following three types of data analysis.

4.3.1. Basic Statistical Value Analysis

We extracted basic statistical values using the collected data. First, daily transaction values for an area/individual were extracted, and the statistics of smartphone usage were checked according to the user, area, and date. Each region was divided into 20 m × 20 m grid units and assigned a unit area. Furthermore, the most frequently used apps in the corresponding area by unit area and by date were sorted based on the relative proportions.

4.3.2. Time Series Repetitive App Patterns

The app usage details in a usage area may differ depending on the collection time. In particular, a separate time series analysis should be performed to investigate the patterns of app usage according to changes in time. We investigated the usage patterns of apps that are most frequently used with a time series analysis. To accomplish this, we used the Apriori algorithm to detect the most representative repetitive pattern [41,42,43]. This is an algorithm for frequent-item set mining and association rule learning over transactional databases. It identifies frequent individual items in a database and extends this to increasingly larger sets of items if the sets appear frequently in the database. The frequent-item sets determined by Apriori are used to identify the association rules that highlight general trends in the data. A time series analysis was performed for the representative app and identified for each time slot, and, for each area, to identify the sequential order of representative apps that are used most frequently in the corresponding area.

4.3.3. Trajectory Pattern Analysis

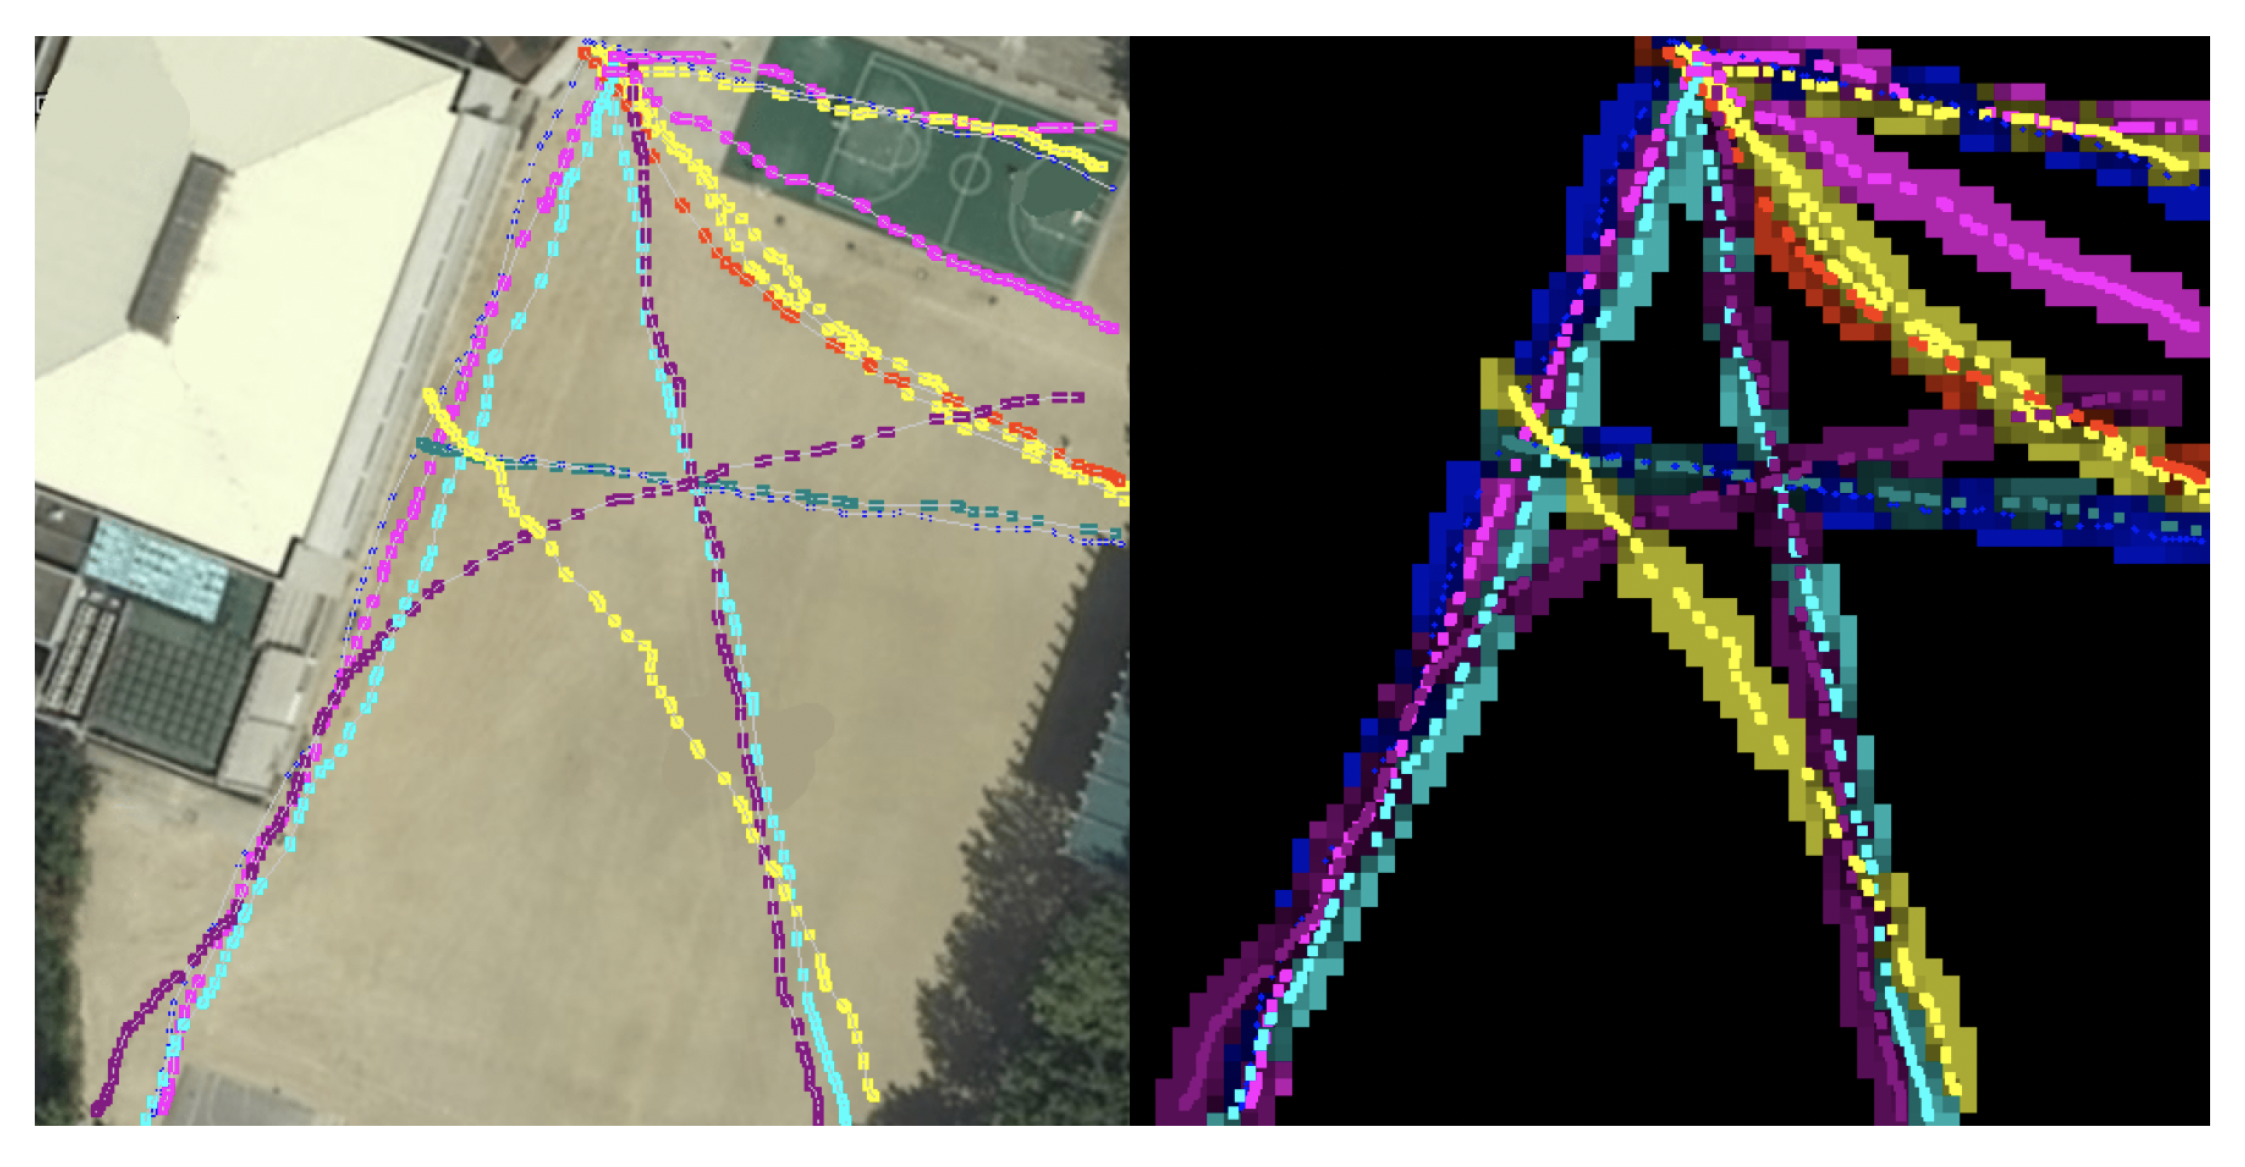
In the present framework, the trajectory network was trained using the information collected. The network was used to predict an app that is highly likely to be used based on a trajectory of the current state. For the trajectory analysis, we collected the app usage details and the cumulative moving trajectories of visitors by unit area. They were saved as images by visualization from the top-view viewpoint. Furthermore, a convolutional neural network (CNN) [32] was used for analyzing the trajectory data, which were automatically labeled using the proposed system, and supervised learning was performed using the usage pattern values of representative apps used in the corresponding area. CNN is effective in the identification of the adjacent information features of space using an image-based deep-learning algorithm. The trajectory was generated by connecting the sampled position values with straight lines. When extracting trajectory data, it is sampled by overlapping position values in a dense space that can exist. When visualizing trajectory with these attributes, it is difficult to identify the characteristic trajectory patterns in the area owing to the overlapping sampling points. The use of CNN is advantageous for identifying patterns in surrounding information in an image. However, it is difficult to make learning accurate with the overlapping trajectory data. To address this, we adopted an influence map (IM) [44] from the navigation and agent path-finding domain. IMs rely on the concept that objects in the virtual world influence the relationships between the objects and consequently spread from their current position outwards throughout the map. IMs show the scalar value of an object’s influence in the space after abstraction of the virtual world (for example, graph or grid). In one space unit, only the scalar value of the object with the greatest influence in the area is displayed. If an object is placed in a virtual world, its influence is propagated sequentially to adjacent space units. For propagation, we used Flood-fill algorithm [45]. The generated IM example from the real-world trajectory is shown in Figure 3. IM displays the app used in the location data as one grid. If the same app is used in the same location, a grid of the corresponding color is propagated to neighboring areas. Through this process, the usage history of the app in a specific area is displayed in the area of the grid. In our system, IM can be seen as the IM between the trajectory, and as the starting point is the trajectory, the direction and main axis of the trajectory are reflected in the image data. We used a 224 × 224 color IM image as input data for the network. Among various CNNs, the VGG-16 [46] network was chosen for multi-label classifiers. The VGG-16 network is a model that demonstrates moderate classification accuracy in the image classification field. VGG-16 consists of 16 layers. A rectified linear unit is used for the hidden layer activation function, and softmax is used as the output layer activation function. The output values of VGG-16 are the app usage details of each app category described in Table 1. Given that the present network is a classification model, the network result values are the probability distributions of the likelihood of using each app category when a trajectory image is inputted. In our method, the usage details are learned on a certain map. Therefore, it is assumed that our trajectory analysis network is trained by area, using an automatic learning method without separate learning in advance. In addition, it is assumed that there is no difference between users in terms of movement in each area. The VGG-16 appropriately identifies the spatial information in the image data, but we use additional information for learning to increase the accuracy. We used the seven parameters shown in Table 2 in the fully connected layer at the end of VGG-16. These parameters refer to information that is difficult to identify using only the image information for the machine learning network and can be used to increase the learning accuracy. The VGG-16 model network proposed in this study is shown in Figure 4.

5. Experiments

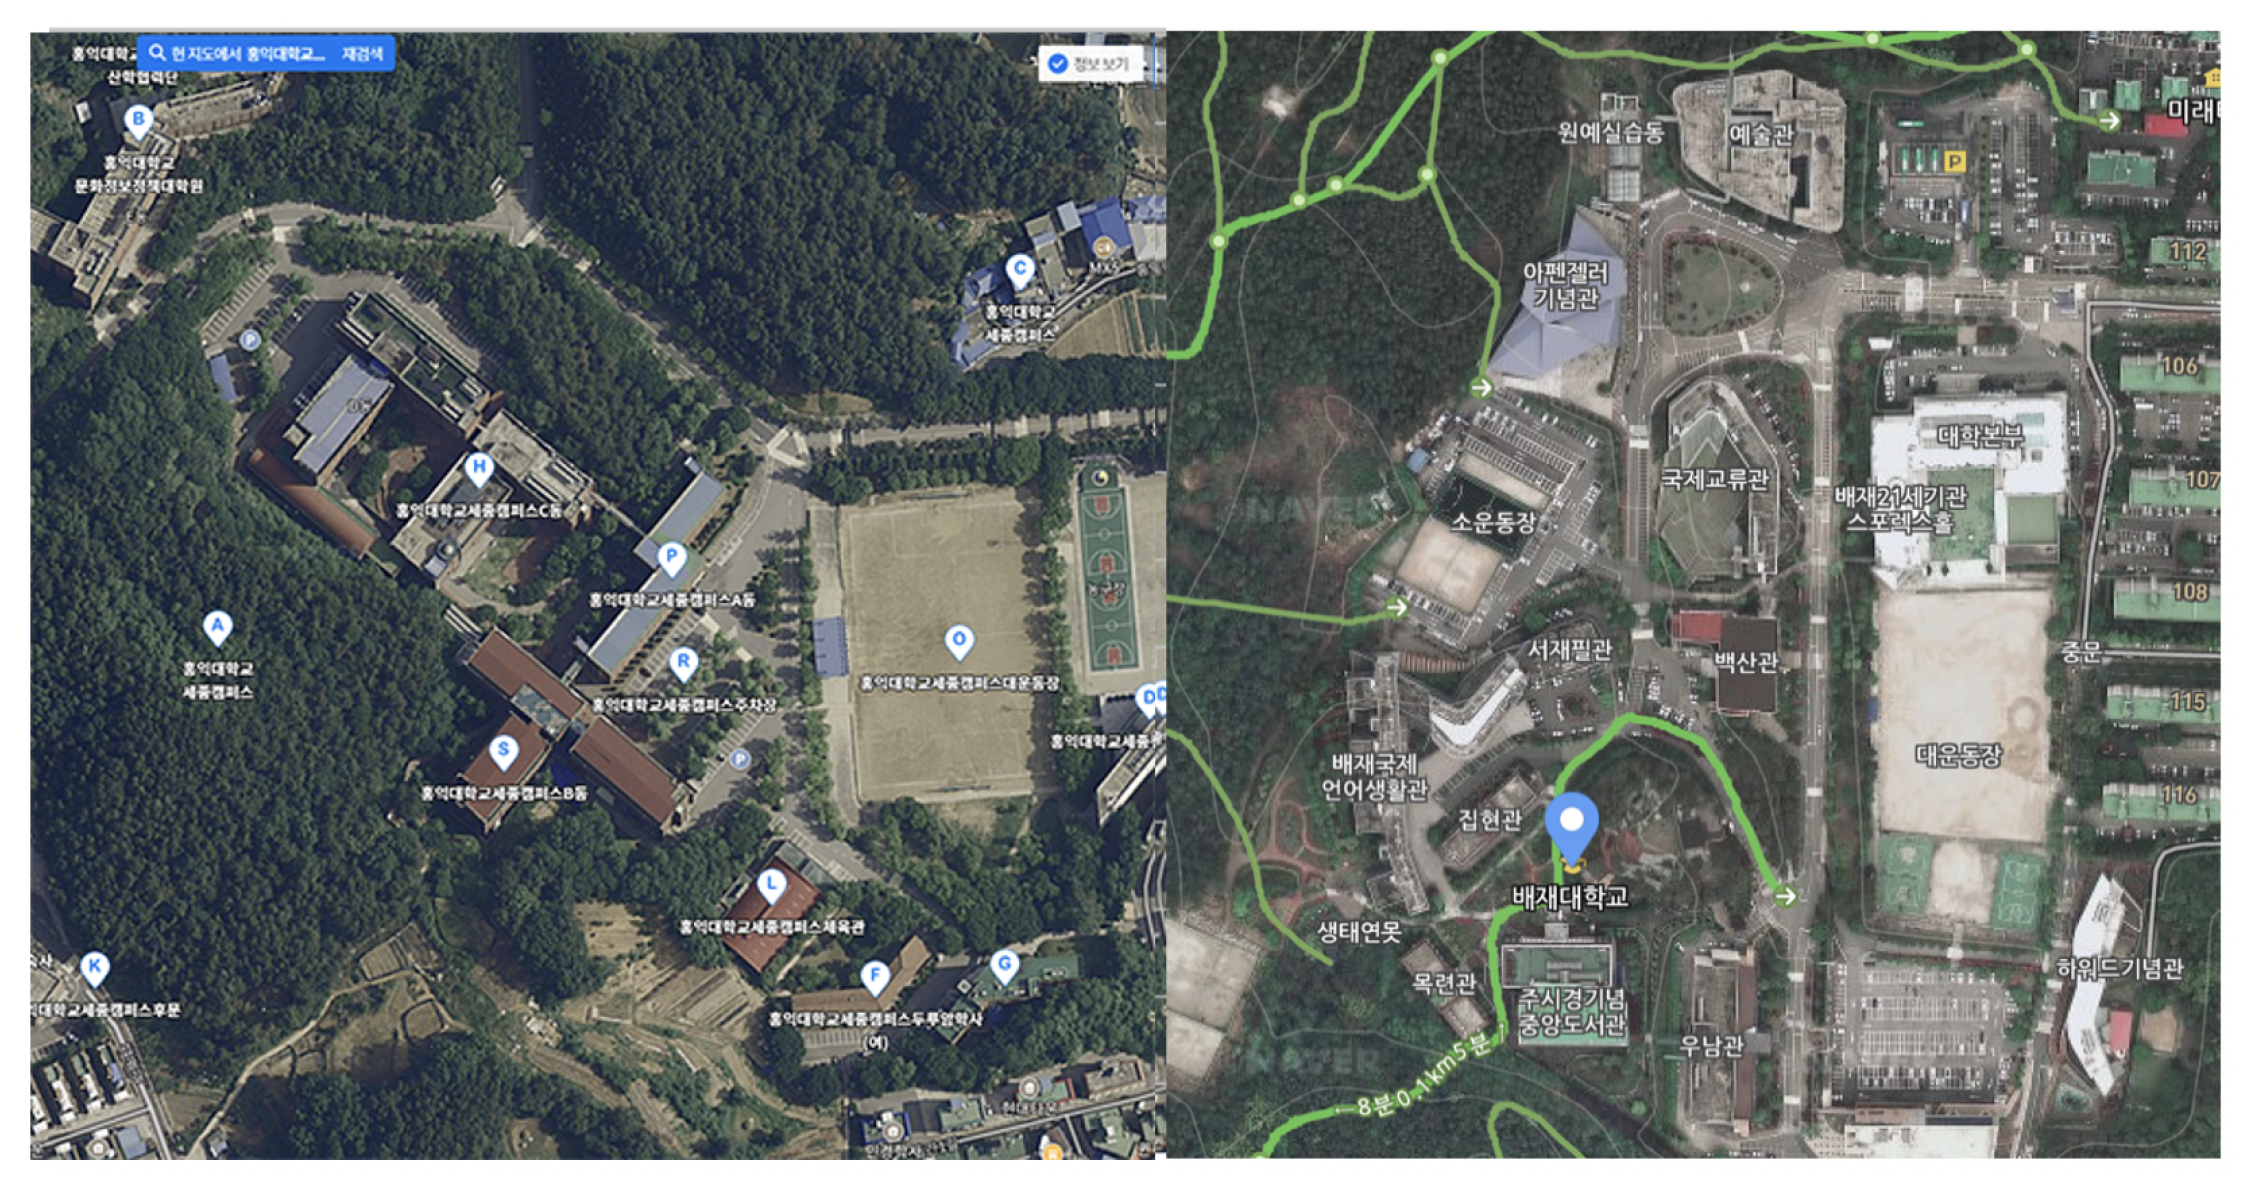
We recruited 40 test participants for the investigation of the operation results of the proposed system. The developed monitoring app was installed and allowed to run on the selected Android smartphones for four months. We only considered situations in which the apps analyzed in this study were installed for the participants, who were paid to be monitored by marketing companies or data mining research labs. The experiments were conducted on the Sejong Campus of the Hongik University and Paichai University in Korea. Transactions took place every 30 s and were collected only when the subject was on campus. The data collection/preprocessing/analysis servers were installed in the Hongik University and the tasks of collecting and analyzing the data were performed there as well. The servers and clients were implemented with Java and Java Script. Our servers were minimally configured to allow only the small number of simultaneous connections needed for the experiment. In Figure 5, a satellite map of the experiment space is shown. For these experiments, in total, 86,400 transactions were sent to the server. The statistics showed that users use the phone app very often in real life, but only for a short time. This indicates that, with the assumption that users spend 9 h sleeping every day, the smartphone was used once every 6 min on average in this area.
The total number of basic grid units used in this experiment is 338 for each university (169 × 2). With a total of 338 learning data points, there is a possibility of overfitting in machine learning training. Therefore, we increased the amount of data by applying a data augmentation technique that takes one image and produces several similar images. The trajectory image of a grid was enlarged to be a little larger than the original image and was cut into a 224 × 224 size trajectory images for training. Four turns were subsequently added. This deformation further generated a total of 20 deformation data points per grid unit (5 additional trajectory data generations × 4 direction flips). Additional data over time were generated. Automated labeling data were generated by moving the time axis per grid unit. This work allowed us to extract data for each time zone, so that we could apply the characteristics of the trajectory by time zone to the classifier. This has the effect of increasing the accuracy of the classifier and increasing the amount of learning data by adding a time attribute to the classifier. The representative movements were recalculated in the area every 30 min producing about 12 additional supervised data points per unit. Through this process, we used a total of 81,120 supervised data points (338 Unit × 20) × (Cropping × Flipping) × 12 (Time Sliding)) for machine learning. This data augmentation process is necessary for the small-scale experiments used in this study, but it does not need to be applied if it is possible to obtain large-scale experimental data. We used a GTX-1080ti graphics processing unit (GPU) to train the models. We used the Pytorch library for network implementation. We used the Adam optimizer [47] for optimization and Cross-Entropy loss as a loss function. The learning rate was set to 0.001. We set the epoch to 1000 times and the batch number to 64. The training took about 12 h to complete. Figure 6 shows the confusion matrix of the training result.
In Table 3, the category, the classification ratio and the accuracy of the classification (10-fold cross-validation results for each category) are shown. It can be observed that the smartphones were used with a focus on information and communication rather than on any other categories within the campus environment. The patterns of these two categories are among the frequently appearing patterns and are illustrated in Table 4. Information and communication appear many times in the relevant patterns. Therefore, users collect information or communicate in human networks using smartphones, which is a basic behavior pattern, but also use other functions. The incidence of continuous behavior patterns shown in Table 4 is less than 7% in total sequences. Most continuous actions occurred at the 2-gram level. The number of 2-gram consecutive app launches was less than expected because apps run only for a short time in mobile environments.
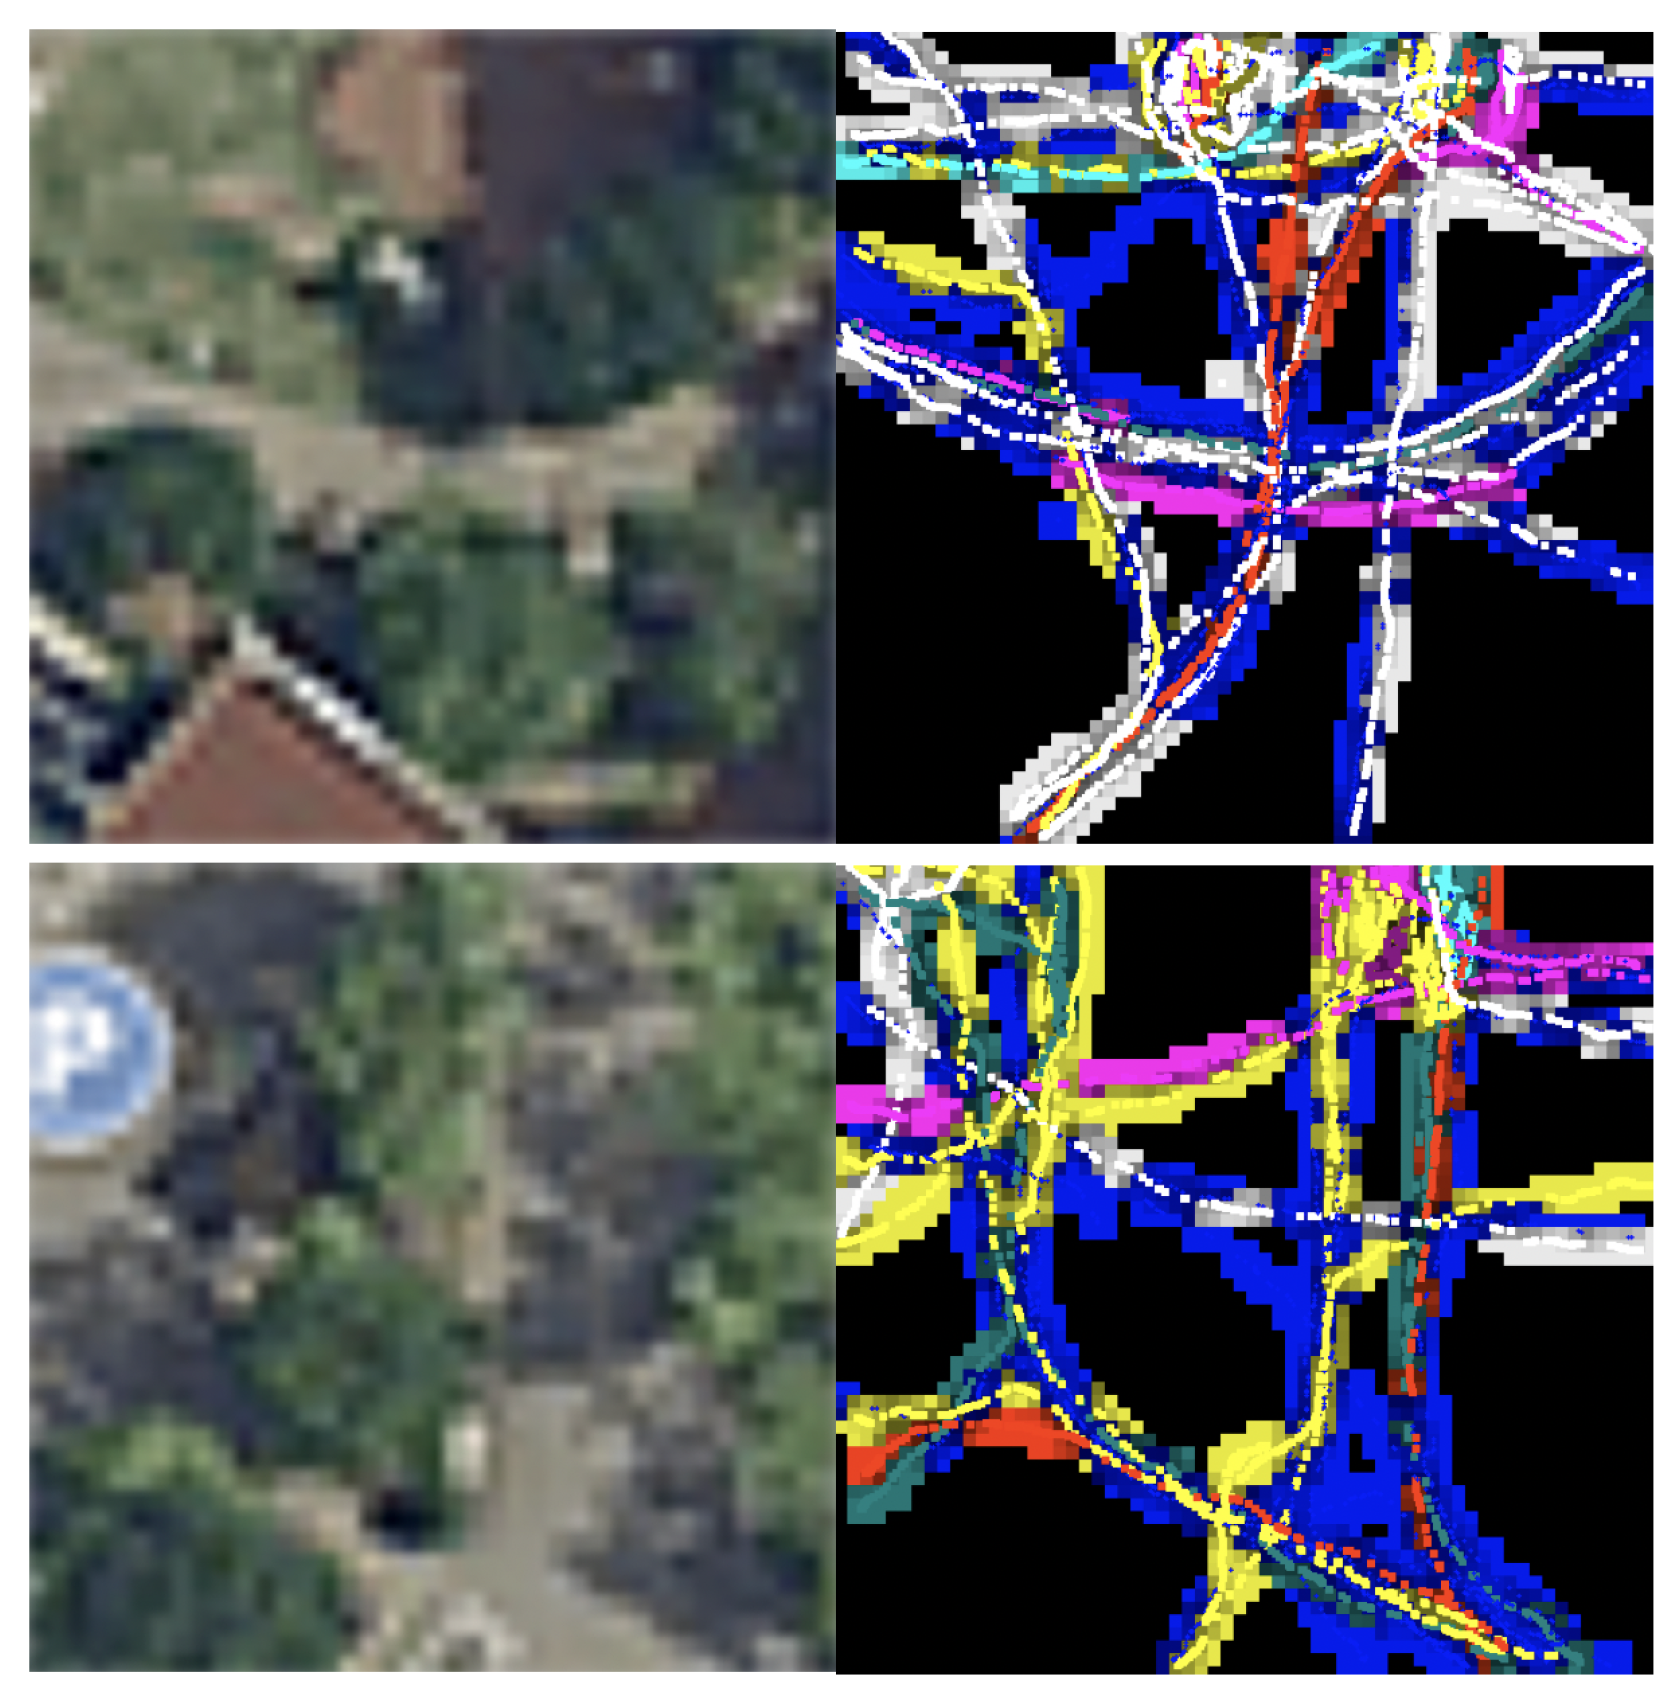
The trajectory patterns showed a large classification difference between inside and outside buildings. In buildings, the classifications of information and education were high. Most of the other behaviors stopped during class hours and the utilization of apps in the information and education categories increased significantly. Most trajectories did not occur, however, after classes; bidirectional trajectories mainly occurred as people moved through major hallways. The classification results of information and education learned for those times are shown in Figure 7. As many people move in a confined space, blue lines (trajectories without app usage) appear on the IM. Moreover, at a certain point, there is a pattern of using information or education apps for a certain time. In this pattern, app usage patterns appear in the form of isolated points within overlapping moving lines. Both education and information are represented in the form of dots within buildings, resulting in a high classification accuracy.
The trajectories that occurred outside of buildings were mainly moving paths centered on major roads. If moving, unidirectional, bidirectional, and tri-directional representative patterns occurred, they were very similar to the road shapes. In Figure 8, examples of trajectories learned for those times are shown. The most frequently occurring areas were branching areas in the campus, such as three- and four-way intersections. Outside buildings, communication and entertainment apps were mainly active. They were mainly represented in a flow form along the trajectories. This pattern of behavior occurs intensively during breaks between college classes. News apps are used frequently both inside and outside buildings. The difference is that they occur while moving along with the moving line outside the building. However, the news trajectories are stationary inside the building. Because of these contradictory attributes, the classification accuracy of news is low. However, because entertainment is limited to outside the building and within a certain point, its classification accuracy is relatively high.
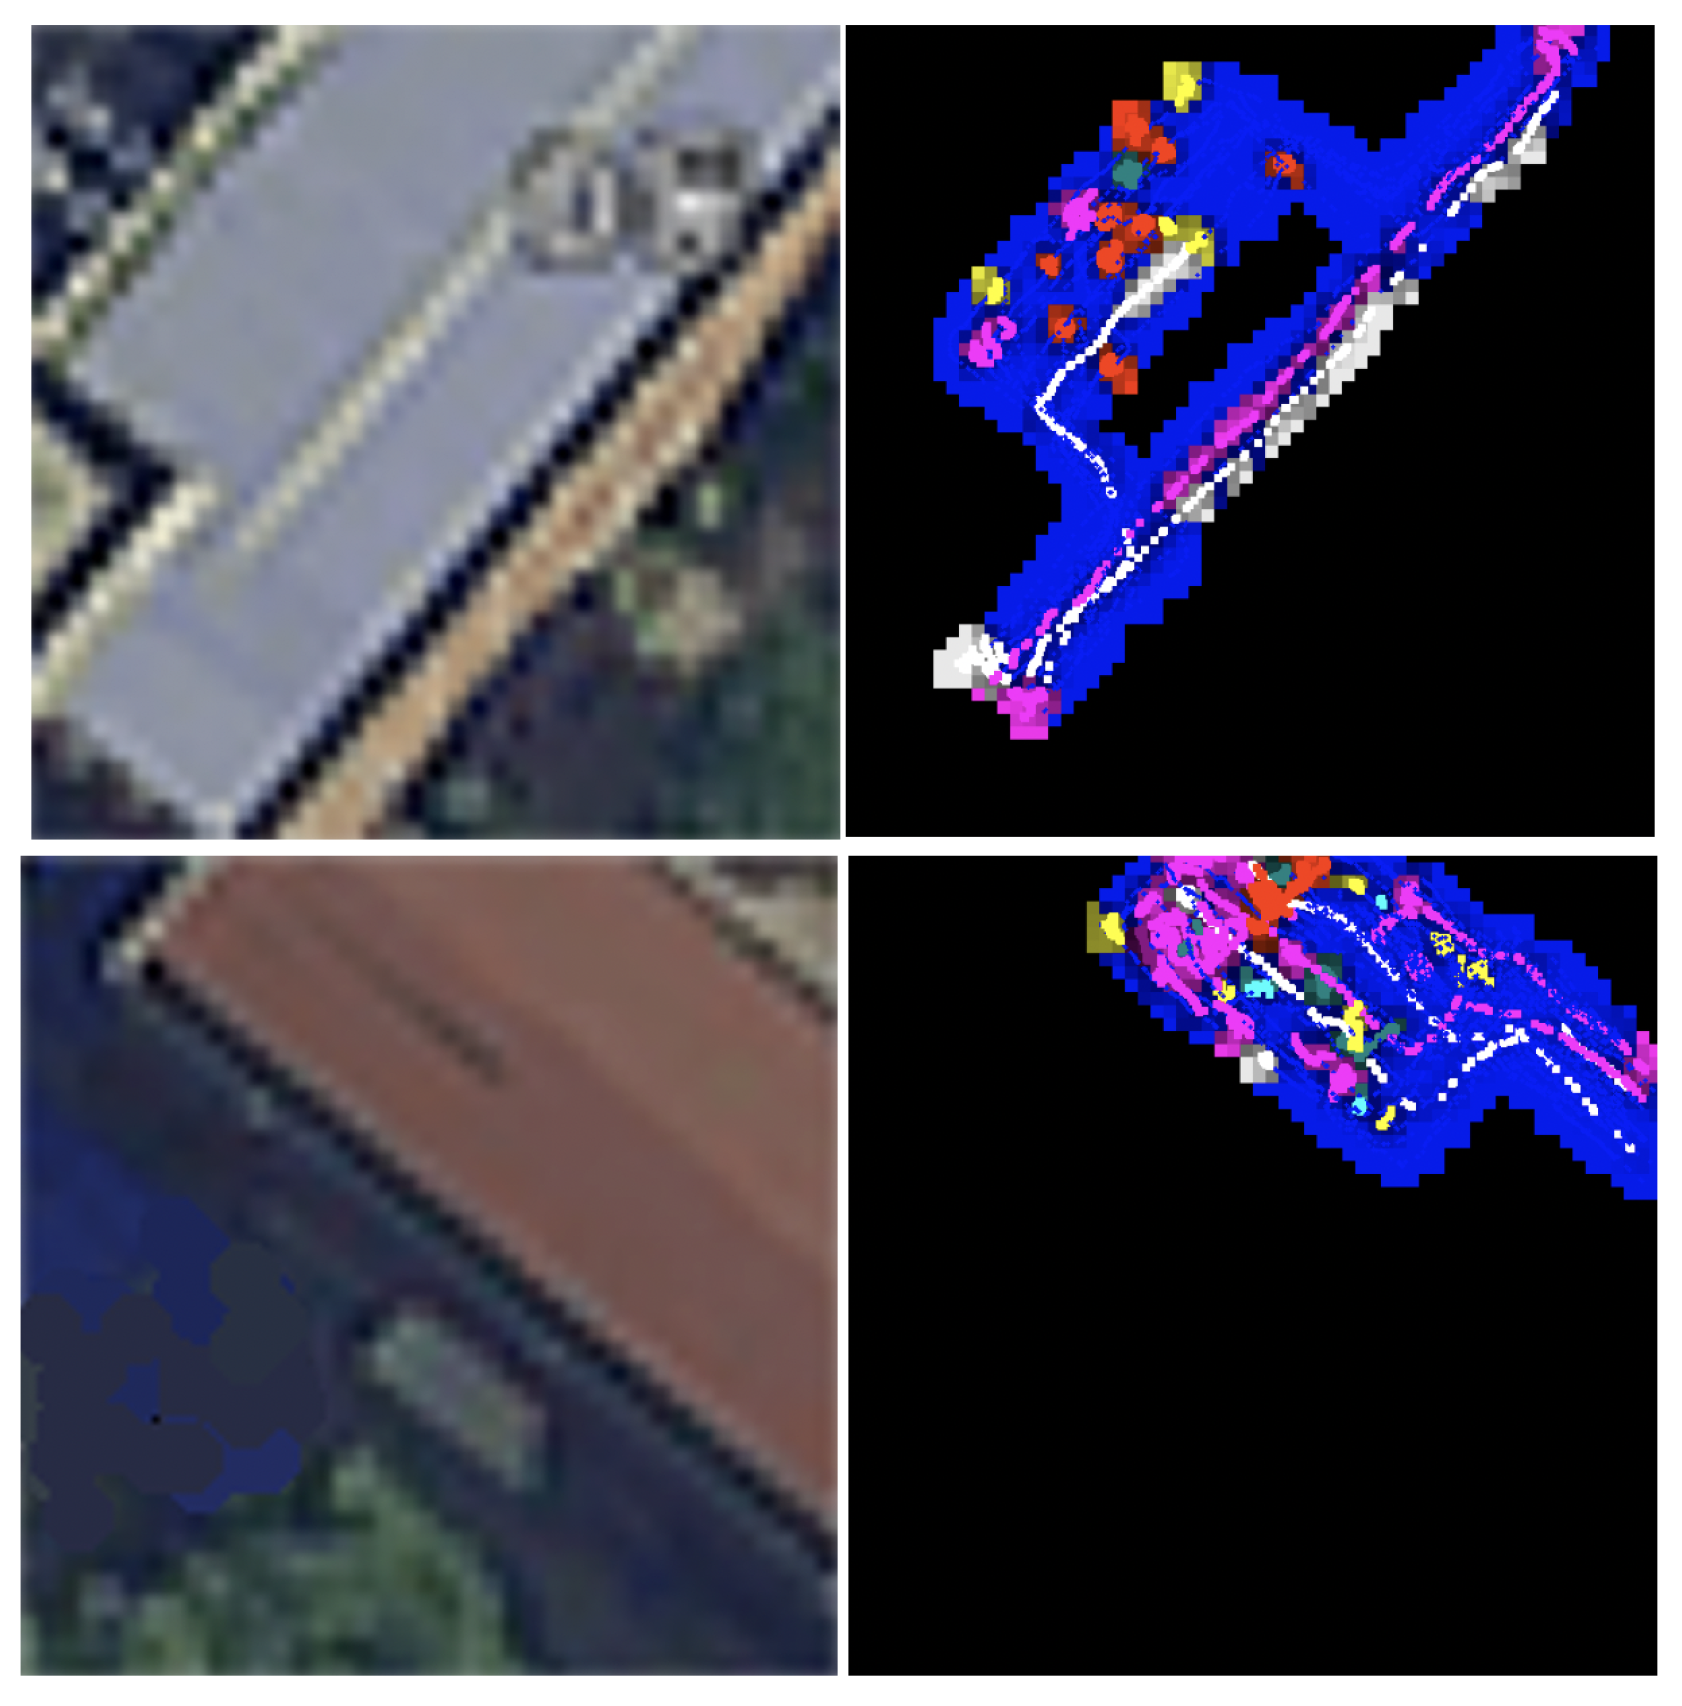
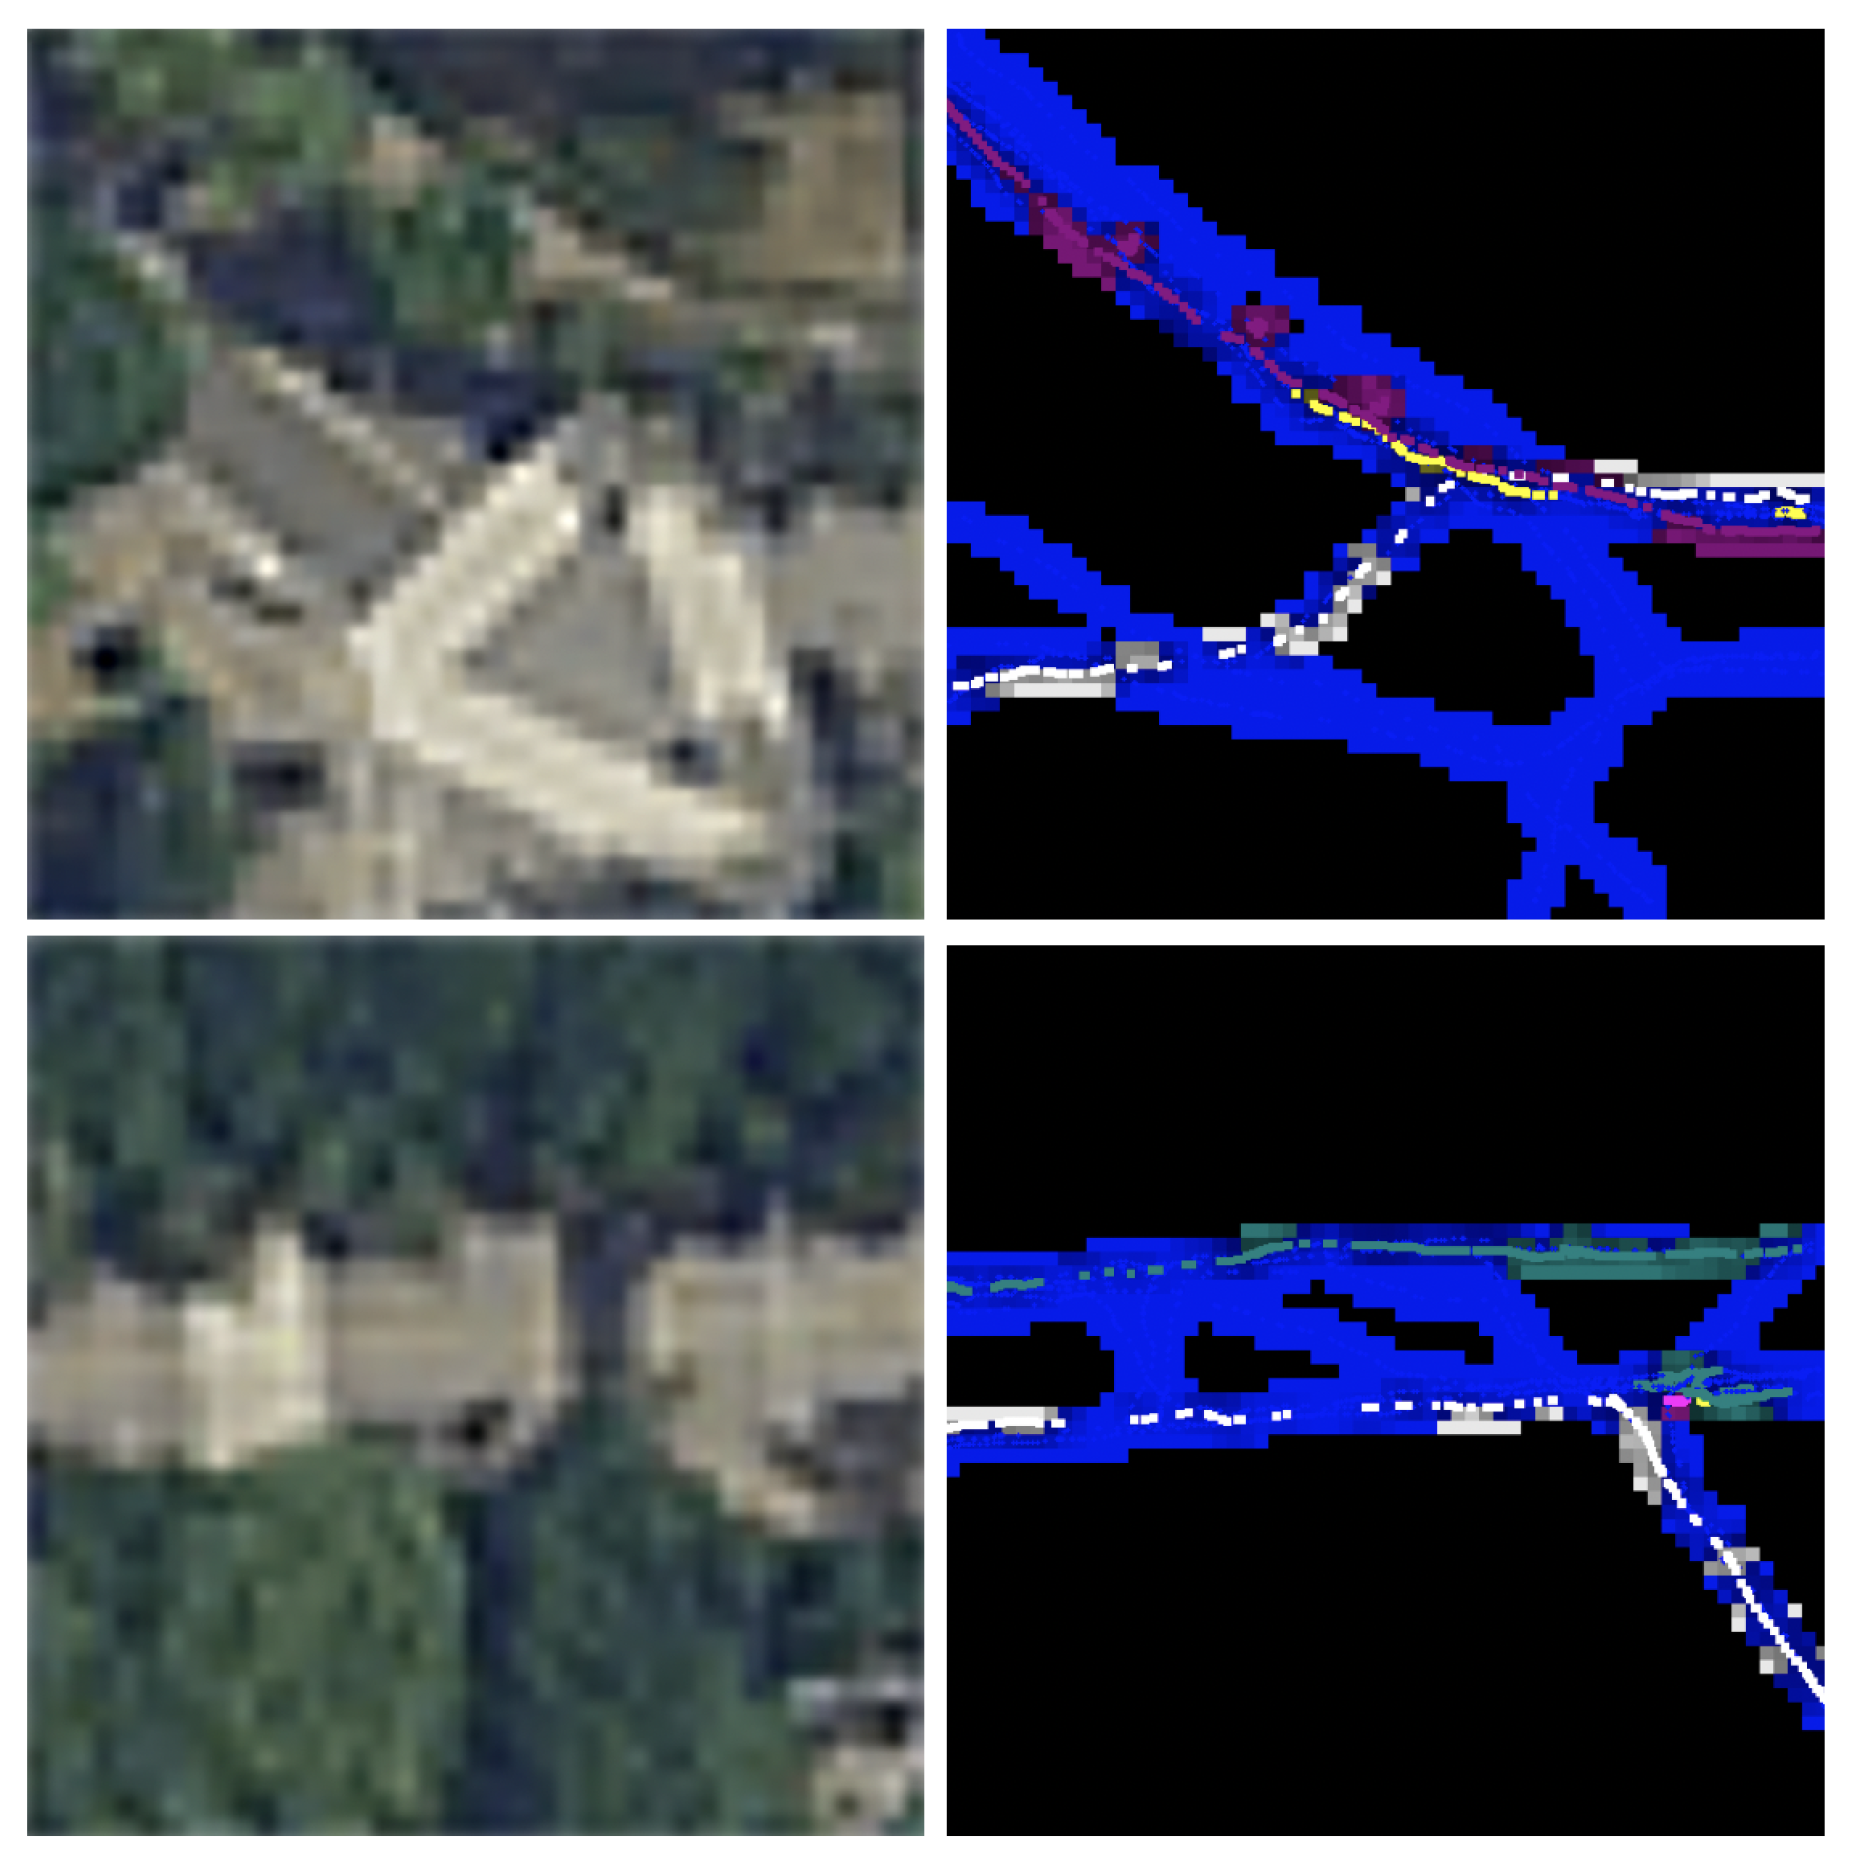
In the experiments, some exact classifications were not determined following overfitting in areas where the amount of training data was inadequate. In Figure 9, an example of this case is shown. The top pattern in Figure 9 is where photography takes place, e.g., where there is a work of art in a rare place. The bottom pattern shows when a navigation app is activated to find travel information around the bus stop. If special purpose apps, such as photography, finance, and navigation apps, were used in uncommon areas, overfitting occurs in these areas. As a result, the classification accuracy is low if many apps have a similar number in a situation where most moving lines and the number of app occurrences are insufficient.
Therefore, apps in information, entertainment, and communication categories showed the largest number of detections. However, because news apps were used in most areas, its classification accuracy is relatively low. Inside buildings, results labeled as information and education were high. This occurred in places where people stayed for long periods. In the case of communications and entertainment, moving trajectory patterns were observed. The network recognizes this difference. The areas where app usage classified as finance, navigation, shopping, and photography occurred were relatively low. The positions discovered were mostly in specific areas (for example, bus stops or banks). The numbers were inadequate for training. Figure 10 shows results of areas of our system that were difficult to classify. The classification accuracy is low if many apps have a similar number in a situation where most moving lines and number of app occurrences are insufficient.
Table 5 shows the differences in learning accuracy according to the training data. Compared with the raw trajectory image dataset, the IM dataset showed a very high accuracy improvement. The classification accuracy dropped significantly, if the trajectory without apps (blue) was excluded from the learning stage. The VGG-based classifier proposed in this system utilizes relative position information between trajectories with app and trajectories without app and uses the app as a feature parameter of the classification. The seven additional features provide information that cannot be identified by image proximity. This feature information appears to contribute to the distinction between trajectories inside and outside the building.

6. Discussion

In existing real-world trajectory research, there was no way to accurately estimate a user’s intentional behavior using only trajectory data. Therefore, it was not possible to confirm which user was showing which movement for what purpose. To estimate a user’s intention, it is necessary to acquire additional information (e.g., card usage history). However, it is generally expensive to obtain this additional information. In our study, we attempted to analyze high-dimensional behavior by combining user app usage histories and trajectory data, which can be obtained relatively easily. We conducted similar trajectory analysis studies in a virtual world [48] and were able to accurately predict them. In this study, we extended our previous work. Compared to the virtual world, there is a lot of effort in the real world to acquire data that can be used for machine learning. For this reason, our system has a complex distributed processing system structure.
In general, even if a machine learning network can access all data in a user’s mobile phone, effective network learning is difficult due to the excessive number of parameters. Therefore, a sorting of the selected parameters has to be performed. In addition, it is necessary to design a network that can optimally utilize the selected parameters. For this reason, research in behavior prediction cannot be easily improved upon. This paper is meaningful in that an appropriate VGG-16 network is proposed and that the training parameters and datasets can be effectively learned.

7. Conclusions

In this paper, we introduce a method of using app data and trajectory data to analyze the behaviors of smartphone users. A background service client was installed on mobile devices to extract app usage data and trajectories and transmit them to servers. Using the acquired data, the secondary parameters needed for machine learning were induced, and a time-series data analysis was performed. Moreover, using the App Platform Data API, the classification of apps used and the corresponding trajectory data were paired, and auto-supervised learning was performed using the VGG-16 network. A network trained in this manner received the trajectory input patterns of users and was able to predict their app usage behavior. Our research is useful in two ways. First, in the field of spatial data mining, spatial analysis has been attempted using various types of information. At this time, some of the information (GPS, image from drone, remote sensor, 3D scan geometry data, etc.) used is accurate, but requires expensive equipment for collection. However, in our opinion, the location information and usage of apps in mobile phones that most people carry are data that can be measured at a low cost, if the user’s consent can be obtained. The advantage of our research is that this low-cost data can be used for spatial analysis of spaces less than 20 m × 20 m. The second advantage of our research is the automated labeling system for machine learning. One of the common trends in machine learning has been an emphasis on the use of unlabeled data. In machine learning studies, there is usually a lot of data that can be collected, but it is often impossible to utilize it because there is no labeled data. Our research uses low-cost trajectory data, so it is less accurate than data using expensive equipment. To improve this accuracy, we suggested an automated labeling technology from an automatic training data labeling domain [49]. This is a combination of state-of-the art deep learning technology trends in spatial analysis research field. In addition, it has the advantage of increasing the accuracy of low-cost data-based spatial analysis technologies. This could be applied in the fields of spatial analysis and mobile phone app development for marketing. In further work, we aim to conduct a study to apply various vision-based trajectory analysis methods to facilitate the easier collection of data required for machine learning, while reducing the cost of trajectory analysis.

Author Contributions

Methodology, S.K. (Shinjin Kang); software, Y.K.; writing–original draft preparation, S.K. (Shinjin Kang); writing–review and editing, S.K. (Sookyun Kim); visualization, S.K. (Sookyun Kim); project administration, S.K. (Shinjin Kang); funding acquisition, S.K. (Shinjin Kang). All authors have read and agreed to the published version of the manuscript.

Funding

This work was supported by the National Research Foundation of Korea (NRF) grant funded by the Korean government (MSIT) (No. NRF-2019R1A2C1002525).

Conflicts of Interest

The authors declare no conflict of interest.

References

  1. Google Play. Available online: http://play.google.com/ (accessed on 10 March 2019).
  2. Wikipedia: Google Play. Available online: http://en.wikipedia.org/wiki/Google_Play (accessed on 10 March 2019).
  3. Hannu, T.V. Analysis of Smartphone User Behavior. In Proceedings of the IEEE International Conference on Mobile Business and 2010 Ninth Global Mobility Roundtable, Athens, Greece, 13–15 June 2010. [Google Scholar]
  4. Pfeiffer, M.; Paolo, G.; Sommer, H.; Nieto, J.; Siegwart, R.; Cadena, C. A Data-driven Model for Interaction-aware Pedestrian Motion Prediction in Object Cluttered Environments. In Proceedings of the IEEE International Conference on Robotics and Automation (ICRA) 2018, Brisbane, QLD, Australia, 21–25 May 2018. [Google Scholar]
  5. Zeng, W.; Chen, P.; Yu, G.; Wang, Y. Specification and calibration of a microscopic model for pedestrian dynamic simulation at signalized intersections: A hybrid approach. Transp. Res. Part Emerg. Technol. 2017, 80, 37–70. [Google Scholar] [CrossRef]
  6. Anvari, B.; Bell, M.G.H.; Sivakumar, A.; Ochieng, W.Y. Modelling shared space users via rule-based social force model. Transp. Res. Part Emerg. Technol. 2015, 51, 83–103. [Google Scholar] [CrossRef] [Green Version]
  7. Yang, D.; Kurt, A.; Redmill, K.; Ozgüner, U. Agent-based microscopic pedestrian interaction with intelligent vehicles in shared space. In Proceedings of the SCOPE ’17: 2nd International Workshop on Science of Smart City Operations and Platforms Engineering, Pittsburgh, PA, USA, 21 April 2017; pp. 69–74. [Google Scholar]
  8. Cheng, H.; Sester, M. Agent-based microscopic pedestrian interaction with intelligent vehicles in shared space. In Proceedings of the Annual International Conference on Geographic Information Science, Lund, Sweden, 12–15 June 2018; pp. 309–325. [Google Scholar]
  9. Yang, D.; Li, L.; Redmill, K.; Ozgüner, U. Top-view Trajectories: A Pedestrian Dataset of Vehicle-Crowd Interaction from Controlled Experiments and Crowded Campus. In Proceedings of the 2019 IEEE Intelligent Vehicles Symposium (IV), Paris, France, 9–12 June 2019. [Google Scholar]
  10. KISDI IT FOCUS. Korea Information Society Development Institute. 2001. Available online: http://m.kisdi.re.kr/mobile/repo/ (accessed on 10 January 2001).
  11. Park, B.S.; Cho, I.H.; Cheon, Y.B.; Lee, W.Y.; Lee, J.S. A Log Analysis of Smartphone Application Usage Focusing on Domestic iPhone Users. In Proceedings of the Korean HCI, Kangwon, Korea, 27 January 2011; pp. 1051–1055. [Google Scholar]
  12. Traffic Analysis and Modeling of IP Core Networks. Helsinki University Of Technology. 2004. Available online: http://citeseerx.ist.psu.edu/viewdoc/download (accessed on 3 December 2004).
  13. Moghaddam, S.; Helmy, A. Internet usage modeling of large wireless networks using self-organizing maps. In Proceedings of the 7th IEEE International Conference on Mobile Ad-hoc and Sensor Systems (IEEE MASS 2010), San Francisco, CA, USA, 8–12 November 2010. [Google Scholar]
  14. Hannu, T.V. Contextual Usage-Level Analysis of Mobile Services. In Proceedings of the IEEE International Conference on Mobile and Ubiquitous Systems: Networking & Service, Philadelphia, PA, USA, 6–10 August 2007. [Google Scholar]
  15. Lee, Y.-S.; Jung, M.-C.; Cho, S.-B. Collection and Construction of User’s Context in Smart Phone. In Proceedings of the Korean Information Science Society Conference, Seoul, Korea, 1 June 2006; pp. 115–117. [Google Scholar]
  16. Verkasalo, H.T. Empirical Insights on the Evolution of the Finnish Mobile Market. In Proceedings of the 2007 6th Conference on Telecommunication Techno-Economics, Helsinki, Finland, 14–15 June 2007. [Google Scholar]
  17. Kelly, D.; Smyth, B.; Caulfield, B. Uncovering Measurements of Social and Demographic Behavior From Smartphone Location Data. IEEE Trans. Hum. Mach. Syst. 2013, 43, 188–198. [Google Scholar] [CrossRef]
  18. Nam, J.S.; Zhang, B.-T. A Method to Discover Mobile Phone User’s Daily Pattern Using Probabilistic Topic Models. In Proceedings of the KIISE Korea Computer Congress 2010, Jeju, Korea, 30 June 2010; pp. 313–316. [Google Scholar]
  19. Kang, J.-M.; Seo, S.-S.; Hong, J.W.-K. Usage Pattern Analysis of Smartphones. In Proceedings of the 13th Asia-Pacific Network Operations and Management Symposium, Taipei, Taiwan, 21–23 September 2011. [Google Scholar]
  20. Kang, J.-M.; Seo, S.-S.; Hong, J.W.-K. Collect and analyze smart phone usage patterns for mobile network management. In Proceedings of the 13th Asia-Pacific Network Operations and Management Symposium, Taipei, Taiwan, 21–23 September 2011. [Google Scholar]
  21. Bell Telephone Laboratories Technical Staff. Transmission Systems for Communications, 3rd ed.; Western Electric Co.: Winston-Salem, NC, USA, 1985; pp. 44–60. [Google Scholar]
  22. Tapio, S.; Karikoski, J.; Hammainen, H. Diversity and End user context in smartphone Usage Sessions. In Proceedings of the IEEE International Conference on Next Generation Mobile Applications, Services and Technologies, Cardiff, UK, 14–16 September 2011. [Google Scholar]
  23. Harman, M.; Yue, J.; Yuanyuan, Z. App store mining and analysis: MSR for app stores. In Proceedings of the 2012 9th IEEE Working Conference on Mining Software Repositories (MSR), Zurich, Switzerland, 2–3 June 2012. [Google Scholar]
  24. Lerner, A.; Chrysanthou, Y.; Lischinski, D. Crowds by Example. Comput. Graph. Forum 2007, 26, 655–664. [Google Scholar] [CrossRef]
  25. Pellegrini, S.; Ess, A.; Schindler, K.; van Gool, L. You’ll never walk alone: Modeling social behavior for multi-target tracking. In Proceedings of the 2009 IEEE 12th International Conference on Computer Vision, Kyoto, Japan, 27 September–4 October 2009; pp. 261–268. [Google Scholar]
  26. Hochreiter, S.; Schmidhuber, J. Long short-term memory. Neural Comput. 1997, 9, 1735–1780. [Google Scholar] [CrossRef] [PubMed]
  27. Chung, J.; Gulcehre, C.; Cho, K.H.; Bengio, Y. Empirical evaluation of gated recurrent neural networks on sequence modeling. In Proceedings of the NIPS 2014 Deep Learning and Representation Learning Workshop, Montreal, QC, Canada, 12 December 2014. [Google Scholar]
  28. Huang, C.; Wu, B.; Nevatia, R. Robust object tracking by hierarchical association of detection responses. In Proceedings of the European Conference on Computer Vision, Marseille, France, 12–18 October 2008. [Google Scholar]
  29. Huang, D.-A.; Kitani, K.M. Action-Reaction: Forecasting the Dynamics of Human Interaction. In Proceedings of the European Conference on Computer Vision, Zurich, Switzerland, 6–12 September 2014. [Google Scholar]
  30. Alahi, A.; Goel, K.; Ramanathan, V.; Robicquet, A.; Fei-Fei, L.; Savarese, S. Social LSTM: Human Trajectory Prediction in Crowded Spaces. In Proceedings of the 2016 IEEE Conference on Computer Vision and Pattern Recognition (CVPR), Las Vegas, NV, USA, 27–30 June 2016. [Google Scholar]
  31. Lu, Z.; Xia, J.; Wang, M.; Nie, Q.; Ou, J. Short-term traffic flow forecasting via multi-regime modeling and ensemble learning. Appl. Sci. 2020, 10, 356. [Google Scholar] [CrossRef] [Green Version]
  32. Graham, W. Convolutional Learning of Spatio-temporal Features. In Proceedings of the European Conference on Computer Vision, Heraklion, Crete, Greece, 5–11 September 2010. [Google Scholar]
  33. Zhao, W.; Gao, Y.; Ji, T.; Wan, X.; Ye, F.; Bai, G. Deep temporal convolutional networks for short-term traffic flow forecasting. IEEE Access 2019, 7, 114496–114507. [Google Scholar] [CrossRef]
  34. Zhang, W.; Yu, Y.; Qi, Y.; Shu, F.; Wang, Y. Short-term traffic flow prediction based on spatio-temporal analysis and cnn deep learning. Transp. Transp. Sci. 2019, 15, 1688–1711. [Google Scholar] [CrossRef]
  35. Yang, D.; Li, S.; Peng, Z.; Wang, P.; Wang, J.; Yang, H. Mf-cnn: Traffic flow prediction using convolutional neural network and multi-features fusion. IEICE Trans. Inf. Syst. 2019, 102, 1526–1536. [Google Scholar] [CrossRef] [Green Version]
  36. Liao, S.; Chen, J.; Hou, J.; Xiong, Q.; Wen, J. Deep convolutional neural networks with random subspace learning for short-term traffic flow prediction with incomplete data. In Proceedings of the 2018 International Joint Conference on Neural Networks (IJCNN), Rio de Janeiro, Brazil, 8–13 July 2018; pp. 1–6. [Google Scholar]
  37. Kan, G.; Hu, Y.; Qian, Z.; Liu, H.; Zhang, K.; Sun, Y.; Gao, J.; Yin, B. Optimized graph convolution recurrent neural network for traffic prediction. IEEE Trans. Intell. Transp. Syst. 2020, in press. [Google Scholar]
  38. Du, S.; Li, T.; Gong, X.; Horng, S.-J. A Hybrid Method for Traffic Flow Forecasting Using Multimodal Deep Learning. arXiv 2018, arXiv:1803.02099. [Google Scholar] [CrossRef] [Green Version]
  39. Tampubolon, H.; Yang, C.-L.; Chan, A.S.; Sutrisno, H.; Hua, K.-L. Optimized capsnet for traffic jam speed prediction using mobile sensor data under urban swarming transportation. Sensors 2019, 19, 5277. [Google Scholar] [CrossRef] [PubMed] [Green Version]
  40. Kang, D.-J.; Cho, S.-H.; Kang, S.-J. A Framework for Usage Pattern Analysis of Smartphone Applications. KIISE Trans. Comput. Pract. 2013, 19, 502–508. [Google Scholar]
  41. Agrawal, R.; Srikant, R. Fast Algorithms for Mining Association Rules in Large Databases. In Proceedings of the 20th International Conference on Very Large Data Bases, San Francisco, CA, USA, 12–15 September 1994. [Google Scholar]
  42. Agrawal, R.; Srikant, R. Mining Sequential Patterns. In Proceedings of the Eleventh International Conference on Data Engineering, Taipei, Taiwan, 6–10 March 1995. [Google Scholar]
  43. Ye, Y.; Chiang, C. A Parallel Apriori Algorithm for Frequent Itemsets Mining. In Proceedings of the Fourth International Conference on Software Engineering Research, Management and Applications (SERA’06), Seattle, WA, USA, 9–11 August 2006. [Google Scholar]
  44. Jang, S.; Cho, S. Evolving neural NPCs with layered influence map in the real-time simulation game ‘Conqueror’. In Proceedings of the 2008 IEEE Symposium On Computational Intelligence and Games, Perth, Australia, 15–18 December 2008. [Google Scholar]
  45. Wikipedia: Flood-Fill Algorithm. Available online: https://en.wikipedia.org/wiki/Flood_fill (accessed on 2 May 2020).
  46. Karen, S.; Zisserman, A. Very Deep Convolutional Networks for Large-Scale Image Recognition. In Proceedings of the International Conference on Learning Representations, San Diego, CA, USA, 7–9 May 2015. [Google Scholar]
  47. Kingma, D.P.; Ba, J.L. Adam: A method for stochastic optimization. arXiv 2014, arXiv:1412.6980. [Google Scholar]
  48. Kang, S.-J.; Kim, Y.-B.; Park, T.; Kim, C.-H. Automatic player behavior analysis system using trajectory data in a massive multiplayer online game. Multimed. Tools Appl. 2013, 66, 383–404. [Google Scholar] [CrossRef]
  49. Dube, P.; Bhattacharjee, B.; Huo, S.; Waston, P.; Kender, J.; Belgodere, B. Automatic Labeling of Data for Transfer Learning. Nature 2019, 241, 192255. [Google Scholar]
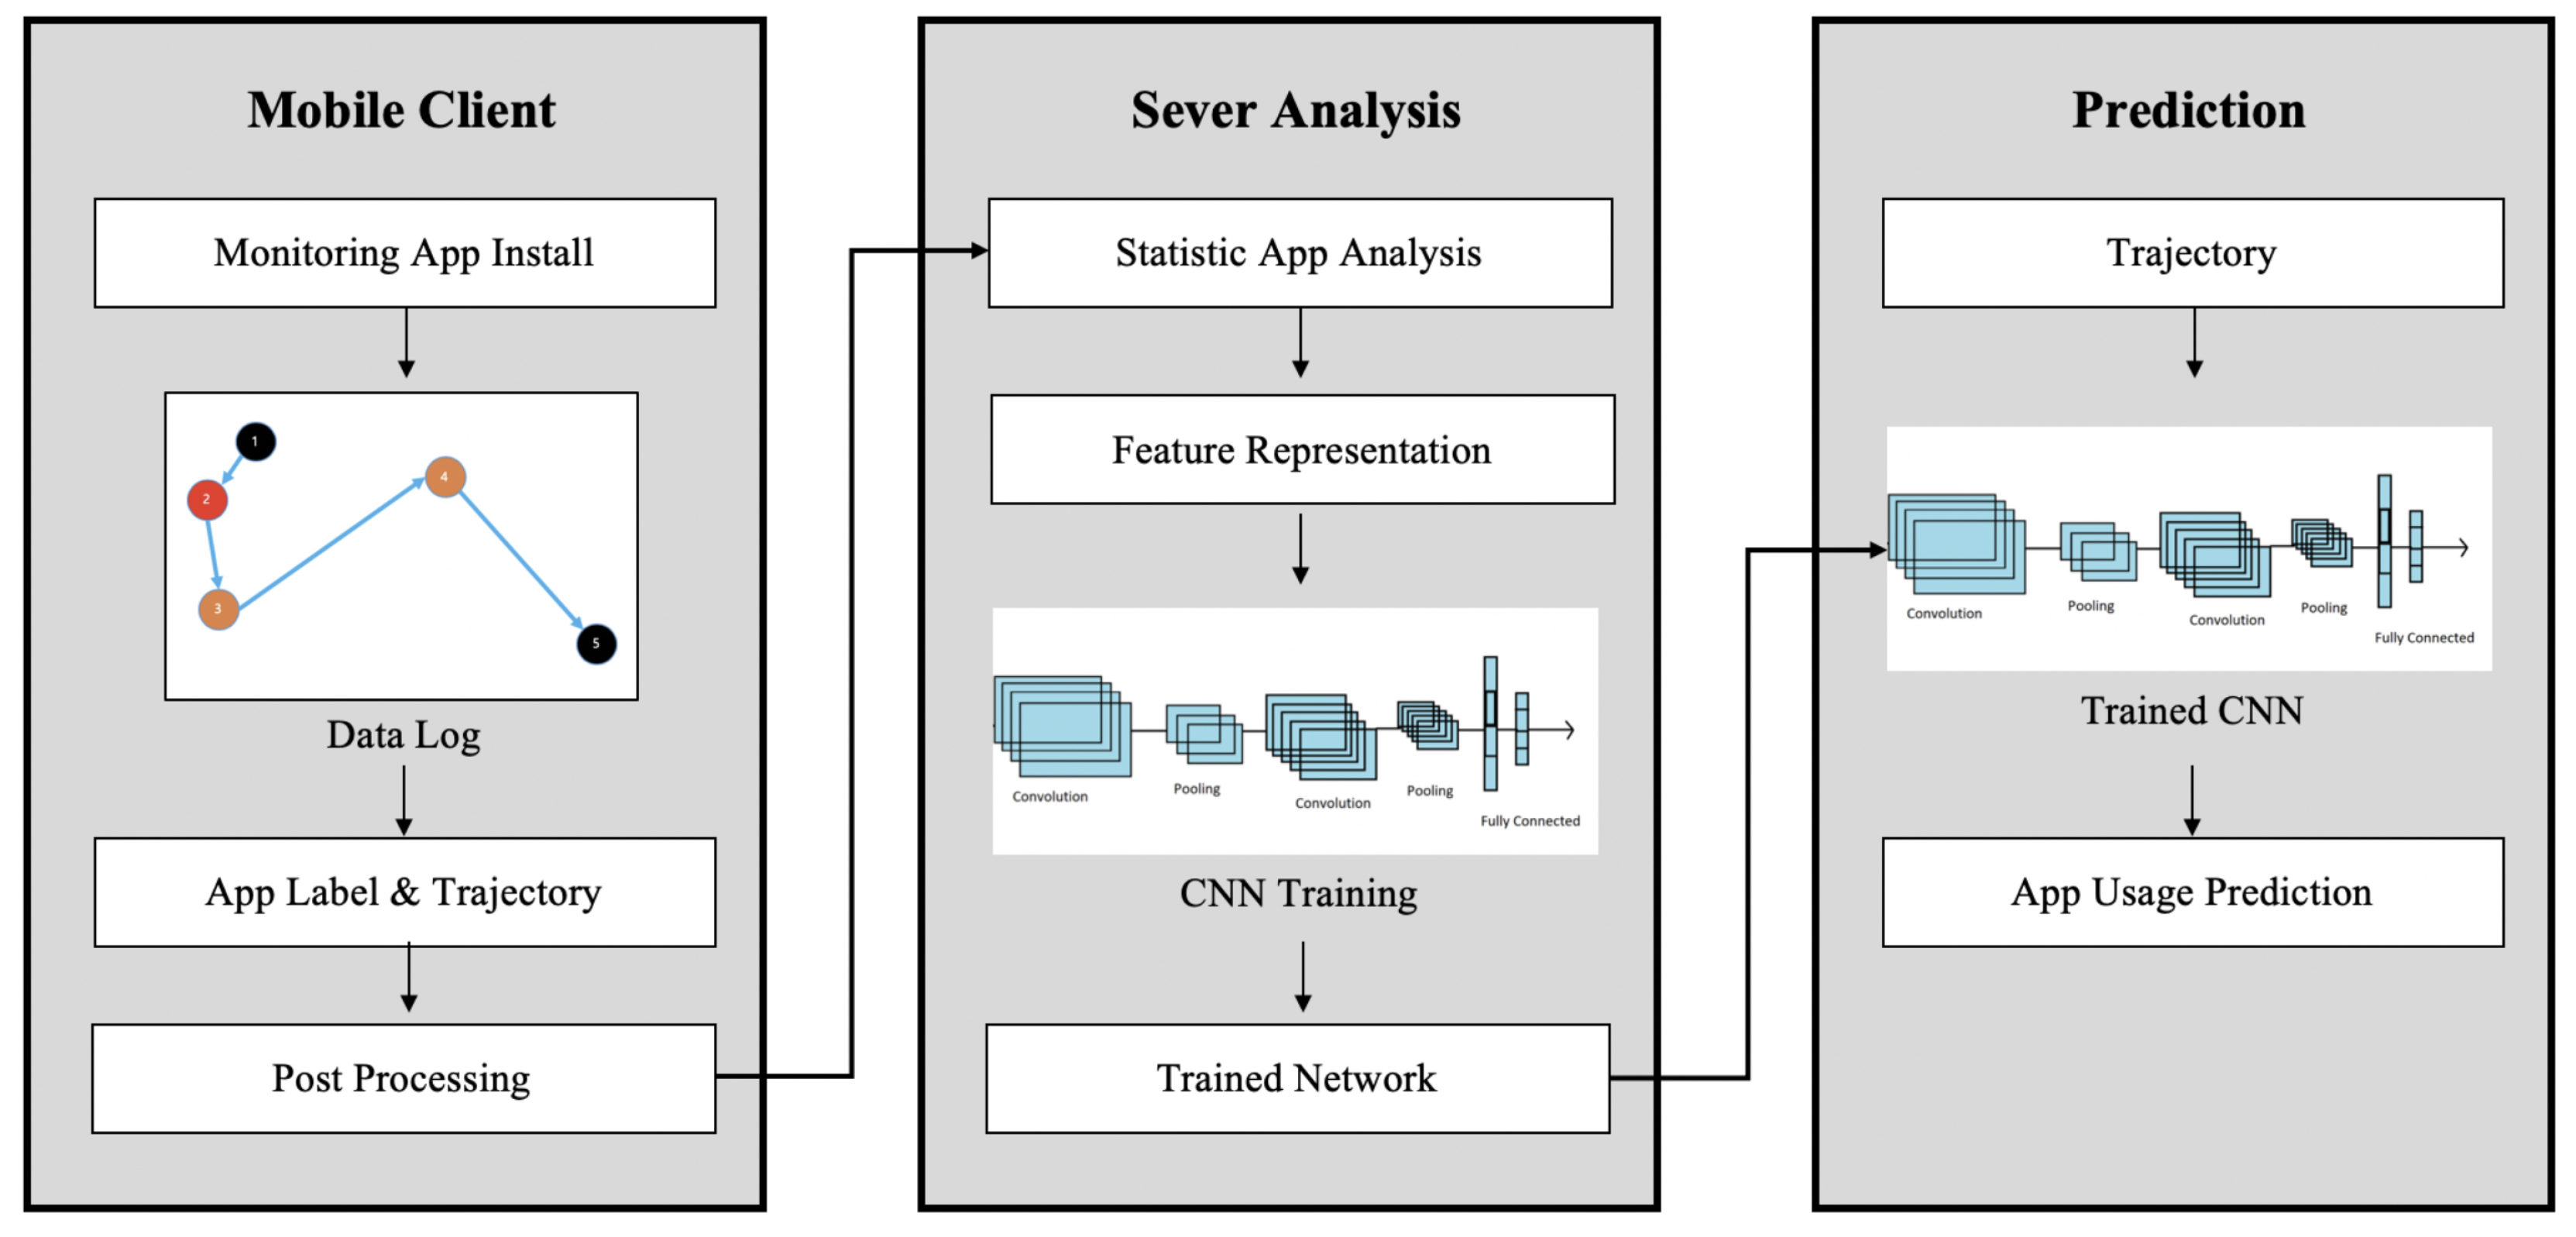
Figure 1. Schematic diagram of the proposed overall process.
Electronics 09 00755 g001
Figure 2. Proposed server framework.
Electronics 09 00755 g002
Figure 3. Influence map (IM) from the trajectory data.
Electronics 09 00755 g003
Figure 4. Proposed VGG-16 Network for classification.
Electronics 09 00755 g004
Figure 5. Satellite map of the experimental space.
Electronics 09 00755 g005
Figure 6. Confusion matrix results.
Electronics 09 00755 g006
Figure 7. Classification results inside buildings (Education, pink; Information, red; Trajectory without APP, Blue).
Electronics 09 00755 g007
Figure 8. Classification results inside buildings (Communication, white; Entertainment, yellow).
Electronics 09 00755 g008
Figure 9. Classification Examples of maps and IMs for Photography (purple) and Navigation (green).
Electronics 09 00755 g009
Figure 10. Wrong classification results.
Electronics 09 00755 g010
Table 1. Google Play’s app categories and the proposed app categories.
Proposed CategoryGoogle Category
InformationArt and Design, Auto and Vehicle, Beauty, Book and Reference, Tools, Travel and Local, Tools, Video Players and Editors, Weather, Food and Drink, Health and Fitness, House and Home, Libraries and Demo, Lifestyle, Medical, Penalization, Events, Productivity
NavigationMap and Navigation
NewsNews and Magazines
CommunicationCommunication and Social
EducationEducation
EntertainmentDating, Entertainment, Sports, Game, Music and Audio, Comics
FinanceFinance and Business
PhotographyPhotography
ShoppingShopping
Table 2. Additional parameters for machine learning (non-spatial data).
CategoryParameters
DensityPosition density in grid: The number of position sample points in a unit grid.
TimeStalling time with App: Stalling time while user uses app.
Stalling time without App: Stalling time while user does not use the app.
DirectionPrinciple Axis Direction: Representative axis in unit grid (Direction of main road or main building).
Avg. Trajectory Direction: Average direction vector of trajectory in unit grid.
Directional Homogeneity: Difference of every trajectory direction with Avg. trajectory direction.
Variance of Trajectory Direction: Standard deviation of trajectory direction in unit grid.
Table 3. Top app types by use frequency.
CategoryClassification RatioClassification Accuracy
Information29%90%
Communication22%87%
Entertainment15%92%
News14%53%
Education7%76%
Shopping4%76%
Finance4%73%
Photography2%50%
Navigation2%81%
Table 4. Shortest frequent time-series pattern.
Frequent PatternsRatio
Communications > Information36%
Information > Communications18%
Communications > News15%
Communications > Entertainment10%
Information > Finance9%
Communications > Finance8%
Communications > Navigation4%
Table 5. Accuracy Comparison Result.
Training DataClassification Accuracy
Raw Trajectory Image Data24.1%
IM Data (excluding trajectory without app)45.2%
IM Data (including trajectory without app)65.6%
IM Data (including trajectory without app with additional seven features)75.3%