Article

Photovoltaic Degradation Rate Affected by Different Weather Conditions: A Case Study Based on PV Systems in the UK and Australia

by
Mahmoud Dhimish
* and
Abdullah Alrashidi
Department of Computing and Engineering, University of Huddersfield, Huddersfield HD1 3DH, UK
*
Author to whom correspondence should be addressed.
Electronics 2020, 9(4), 650; https://doi.org/10.3390/electronics9040650
Submission received: 22 March 2020 / Revised: 10 April 2020 / Accepted: 13 April 2020 / Published: 16 April 2020
(This article belongs to the Special Issue Reliability Analysis for Photovoltaic Systems)

Abstract

:
This article presents the analysis of degradation rate over 10 years (2008 to 2017) for six different photovoltaic (PV) sites located in the United Kingdom (mainly affected by cold weather conditions) and Australia (PV affected by hot weather conditions). The analysis of the degradation rate was carried out using the year-on-year (YOY) degradation technique. It was found that the degradation rate in the UK systems varies from −1.05% and −1.16%/year. Whereas a higher degradation ranging from −1.35% to −1.46%/year is observed for the PV systems installed in Australia. Additionally, it was found that in the Australian PV systems multiple faulty PV bypass diodes are present due to the rapid change in the ambient temperature and uneven solar irradiance levels influencing the PV modules. However, in cold weather conditions (such as in the Northern UK) none of the bypass diodes were damaged over the considered PV exposure period. Furthermore, the number of PV hot spots have also been observed, where it was found that in the UK-based PV systems the number of hot spotted PV modules are less than those found in the Australian systems. Finally, the analysis of the monthly performance ratio (PR) was calculated. It was found that the mean monthly PR is equal to 88.81% and 86.35% for PV systems installed in the UK and Australia, respectively.

1. Introduction

The ability to precisely predict the output power delivery over the course of time is of vital importance to the growth of the photovoltaic (PV) industry. Two key cost drivers are the efficiency with which sunlight is converted into actual energy and how this relationship fluctuations over time. An accurate quantification of power decay over time, also known as degradation rate [1], is critical to all stakeholders/utility companies, investors, integrators, and researchers alike.
Economically, PV modules degradation rates are equally important, because a higher degradation rate interprets directly into less output power produced by the system, thus reducing future cash flows [2]. Inaccuracies in determined degradation rates lead to amplified financial risks in the PV sector. Technically, degradation mechanisms are important to understand because they could lead to PV system failures [3]. Typically, a 10% decline is considered a failure, but there is no compromise on the definition of failure [4], because a high-efficiency module degraded by 50% may still have a higher efficiency than a non-degraded module from a less efficient technology.
The documentation of the degradation mechanisms through modeling and experiments in principle directly leads to lifetime improvements of PV modules as suggested by S. Kawai et al. [5]. Outdoor field testing has played a significant role in measuring long-term lifetime and behavior for at least two reasons: it is the typical functioning environment for PV installations, and it is the only way to correlate indoor testing apparatuses to outdoor results to forecast field performance.
There are various references in the literature that include the degradation rate of PV systems worldwide. However, there are a lack of references found in the literature describing the behavior and degradation analysis of existing PV systems in the United Kingdom and Australia. Therefore, in this article, the degradation rate of six PV sites installed in three different locations in the UK and Australia are examined over a period of ten years (2008 to 2017). Before moving to the methodology, it is indeed important to have an overview of the degradation rate across multiple regions in the world, which will be summarized as follows:
  • United States of America (USA): The USA is placed on the top five countries leading the PV technology worldwide [6]. In 1977, the Department of Energy established the Solar Energy Research Institute in Golden, Colorado. In 1991, it was renamed as the NREL. Outdoor testing of modules and sub-modules started at the Solar Energy Research Institute in 1982. When amorphous silicon (a-Si) modules first became commercially available, NREL began to report degradation rate that were considerably higher than −1.0%/year [7]. In [8] and [9], similar results of the PV degradation were found in small (<10 kWp) size PV installations, followed by a yearly degradation rate of approximate −0.8% to −1.25%/year.
  • Europe: The terrestrial focus of PV industry in Europe can be traced to the oil crisis of the 1970s. The development and institution of PV sites can be divided into publicly and privately funded projects. The publicly funded portion in Europe can be additionally divided into the umbrella organization of the Commission of the European Communities and individual national programs. Never the less, various references indicate that the annual degradation rate in Spain and Italy is between −0.8% to −1.1%/year [10,11,12], in Germany between −0.5% to −0.7%/year [13,14], in Cyprus between −0.8% to −1.1%/year [15], in Greece between −0.9% to −1.13%/year [16], and finally in Poland is always greater than −0.9%/year [17].
  • Asia: Chandel et al. [18] studied the degradation rate in India based on 28 year filed exposes mono crystalline PV modules, with the degradation rate found to be −1.4%/year. Similar results were found by Thotakura et al. [19]. In this study, the degradation rate in southern India is observed at −1.3%/year. Furthermore, in Thailand, the degradation rate was widely different, ranging between −0.5% to −4.9%/year [20]. However, C. Dechthummarong et al. [21] found that the degradation rate based on 15 years of PV exposure in northern Thailand is equal to −1.5%/year. The degradation rate of PV modules in many other countries such as Japan, Singapore, and Republic of Korea are reported in [22,23,24], the PV degradation rate is equal to −1.15%/year in Japan [22], −2.0%/year in Singapore [23], and −1.3%/year in Republic of Korea [24].
It is worth noting that degradation rates in PV modules may differ too between lower and higher irradiance levels dependent on cause, for example:
  • Encapsulate browning—may be similar at low and high irradiance levels
  • Series resistance increase—will be worse at high irradiance conditions
  • Shunt resistance decrease—will be worse at low irradiance conditions
  • Random failures such as faulty bypass diodes—will give an even higher variability between PV installations
Worldwide, the PV degradation rate varies between −0.4% to −2.0%/year. However, there is not enough evidence based on the annual degradation rate across the UK and Australia, and therefore, this article tries to fill-in this gap of knowledge by evaluating three different PV sites located in various locations in the United Kingdom (specifically in Scotland) and Australia. It was found that the average annual degradation rate of the PV installations varies between −1.05% to −1.16%/year in the UK, whereas the degradation rate in the PV systems installed in Australia ranges from −1.35% to −1.46%/year.
This paper is organized as follows: Section 2 presents the methodology including the description of the examined PV systems and the degradation rate analysis technique. In Section 3, the results of the degradation rate for all examined PV systems are described. Section 4 and Section 5 present the overall discussion and conclusions of the article, respectively.

2. Methodology

2.1. Description of the Examined PV Systems

In this work, six different PV installations have been examined. The geographical distribution of the PV sites is shown in Figure 1a,b, and summarized as follows: Group 1—United Kingdom: PV site A located in Glasgow; PV site B located in Edinburgh, and PV site C located in Aberdeen. Group 2—Australia: PV site D located in Albury; PV site E located in Sydney and PV site F located in Newcastle.
The PV sites have been categorized in two groups: the first group contains PV sites A, B and C (located in the UK), whereas the second group consist of PV sites D, E and F (located in Australia). The solar irradiance (G) and ambient temperature (T) play major role on the performance and annual energy production for the PV panels. Since the examined PV sites are located in different locations, it is worthy to address the locations weather and ambient temperature data.
The average values of the solar irradiance in all studied locations between the years 1981–2010 is taken from [25] and reported in Figure 1a,b. As can be noticed, the irradiance in the UK and the Australian sites are relatively equal to 850 kWh/m2 and 2300 kWh/m2, respectively.
Additionally, the weighted temperature for all PV sites in the UK is equal to 11.2 °C, while it is equal to 21.4 °C for the Australian PV sites. The weighted temperature is calculated using Equation (1) [26]:
T weighted = T PV × G G
where Tweighted is the weighted temperature of the PV site, TPV is the actual temperature measured in the PV system in °C, and G is the solar irradiance affecting the PV system in W/m2.
Figure 1c presents a real picture of the examined PV system located at Glasgow (PV site A). All examined PV systems are residential rooftop systems and have an identical configuration, which is demonstrated in Figure 1d, as well as identical azimuth (−3° due to South) and tilt angle of (39°). The PV installations are comprised of crystalline silicon PV modules with a peak power of 220 W, they are configured in 2 PV strings connected in parallel, each comprised of 9 PV modules connected in series. All have the same PV capacity of 3960 W. The electrical characteristics at standard test conditions (STC) including the peak power, voltage, and current at maximum-power point for the examined PV modules are shown in Table 1.
Furthermore, all observed PV systems are fitted with an ICONICA maximum power point tracking (MPPT) unit. This device has the capability of enhancing the output power during partial shading conditions, with the MPPT efficiency ranging from 97.5% to 99.2%. The MPPT unit is connected to a hybrid pure sine wave inverter linked to the grid, with the inverter efficiency ranging from 90% to 94%.
All examined PV sites have a weather station manufactured by the Davis Company. The weather station measures the ambient temperature, wind speed, humidity, and solar irradiation. Onsite measurements of DC voltage and current are recorded at the inverter input with a sampling rate of 5 min, thus the number of samples collected in each year was equal to 52,560 sample. The PV modules are fitted in 2008, or at the end of 2007, therefore the comparison between degradation rates of the PV sites will be studied starting from 2008 to 2017; 10 years of exposure.

2.2. Year-On-Year (YOY) Degradation Analysis Technique

In this article, we have used a new model called year-on-year (YOY) developed by the national renewable energy laboratory (NREL). The open access software (RdTools) allows us to analyze the degradation rate for PV installations [2]. The degradation calculations consist of several steps discussed in the following processes:
  • Import data and preliminary calculations: at this step, the time series of the energy yield, PV temperature, and solar irradiance will be processed.
  • Normalization: since PV data is randomly distributed, normalization process is required in order to transform the data into a normal distribution mode. This step calculated a unitless performance ratio (PR) metric with less variability than raw power production data. The PR is typically based on the rated power of the PV system, measured PV power, and site irradiance (measured by weather station). The normalization is done using the following Equation [27]:
    P R = P P STC , rated × G poa G ref × ( 1 + γ   ( T PV T ref )
    where P is the measured dc or ac power of the PV systems in watts, PSTC,rated is the rated dc or ac power of the PV system in watts, Gpoa is the plane-of-array irradiance, Gref is the reference irradiance 1000 W/m2, γ is the maximum power temperature coefficient in relative %/°C, TPV is the PV system temperature in °C, and Tref is the PV system reference temperature 25 °C.
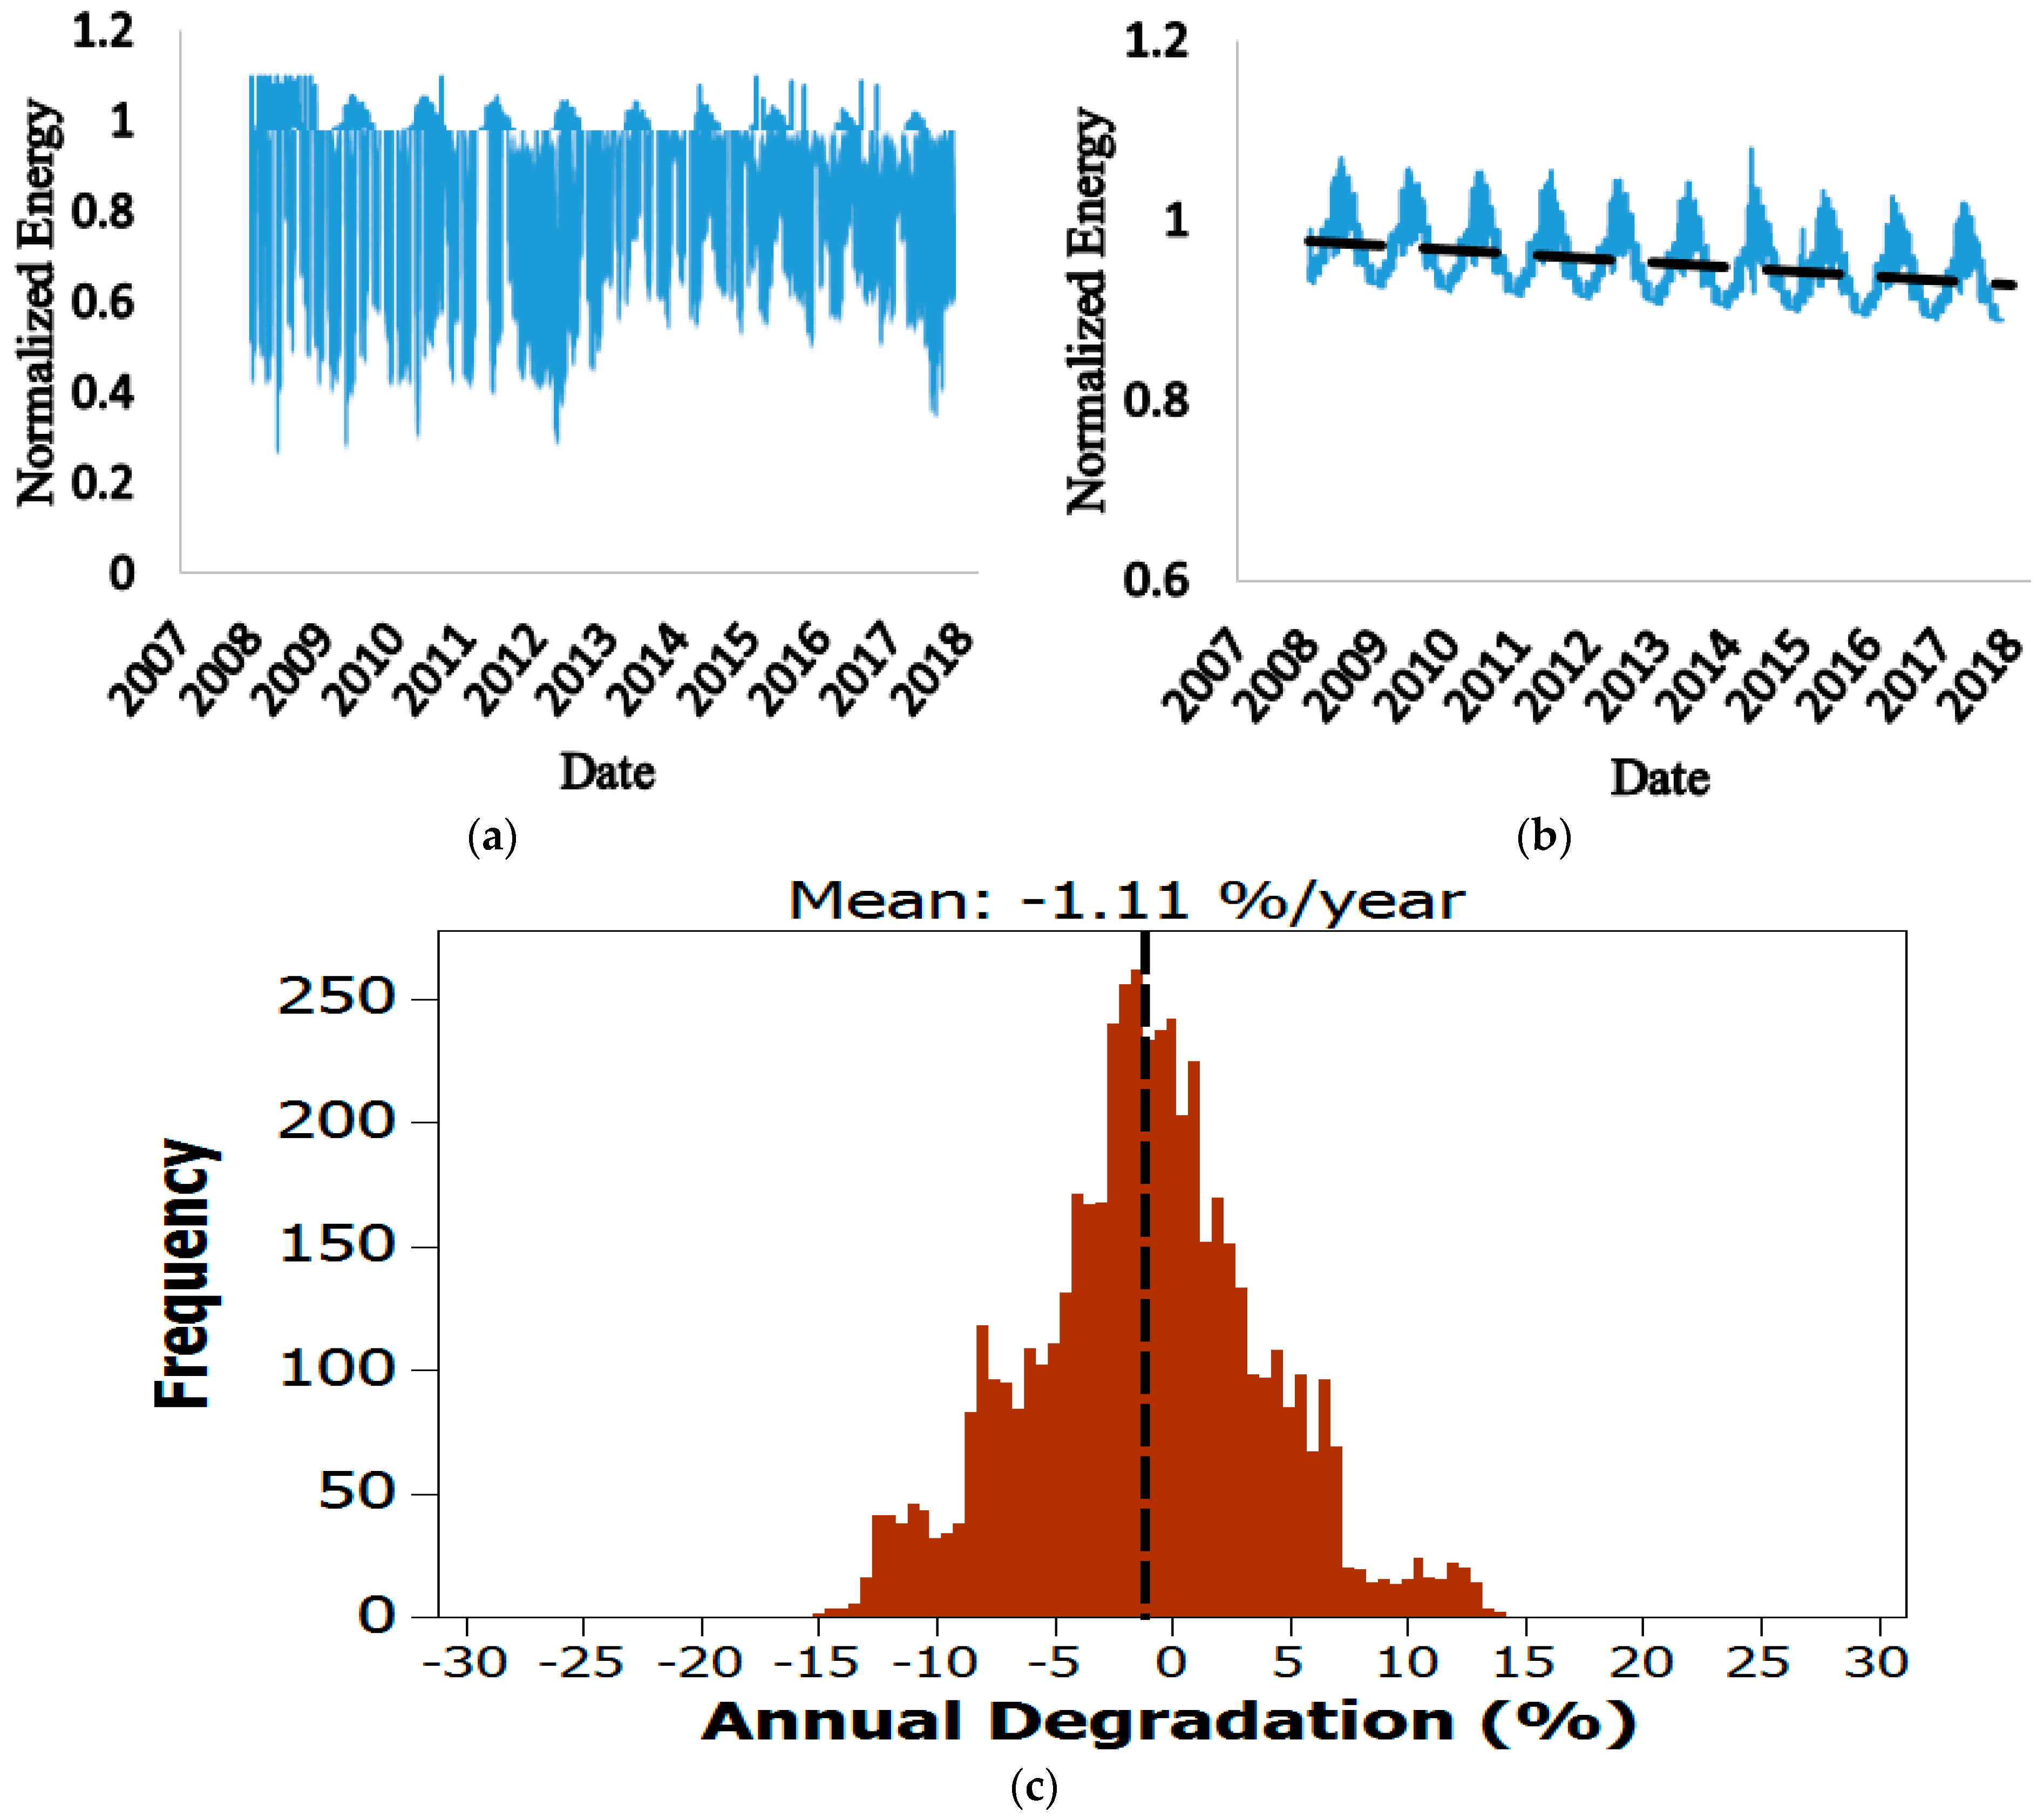
  • Data Filtering: PV data filtering is used to exclude data points that represents invalid data, create bias in the analysis, or introduce significant noise. Often, low irradiance conditions are associated with night-time data or with errors due to PV components startup such as the MPPT unit. An example of the data filtering output is shown in Figure 2a.
  • Aggregation: PV data is aggregated with an irradiance and temperature weighted average. This step reduces the impact of high-error data points in the morning and evening time. The aggregation time-period was selected at one day period. Therefore, the final yield data has a resolution of 1 day. An example of output aggregation is shown in Figure 2b.
  • Degradation analysis: the degradation analysis step processes the remaining data to compute a degradation rate based on year-on-year method. The rate of change is calculated between two points at the same time in subsequence years. Calculating such a rate of change for all data points and all years, results in a histogram (as shown in Figure 2c) of rates of change, the central tendency of which representing the overall system performance.

3. Results

3.1. Degradation Rates in the UK PV Installations (A, B and C)

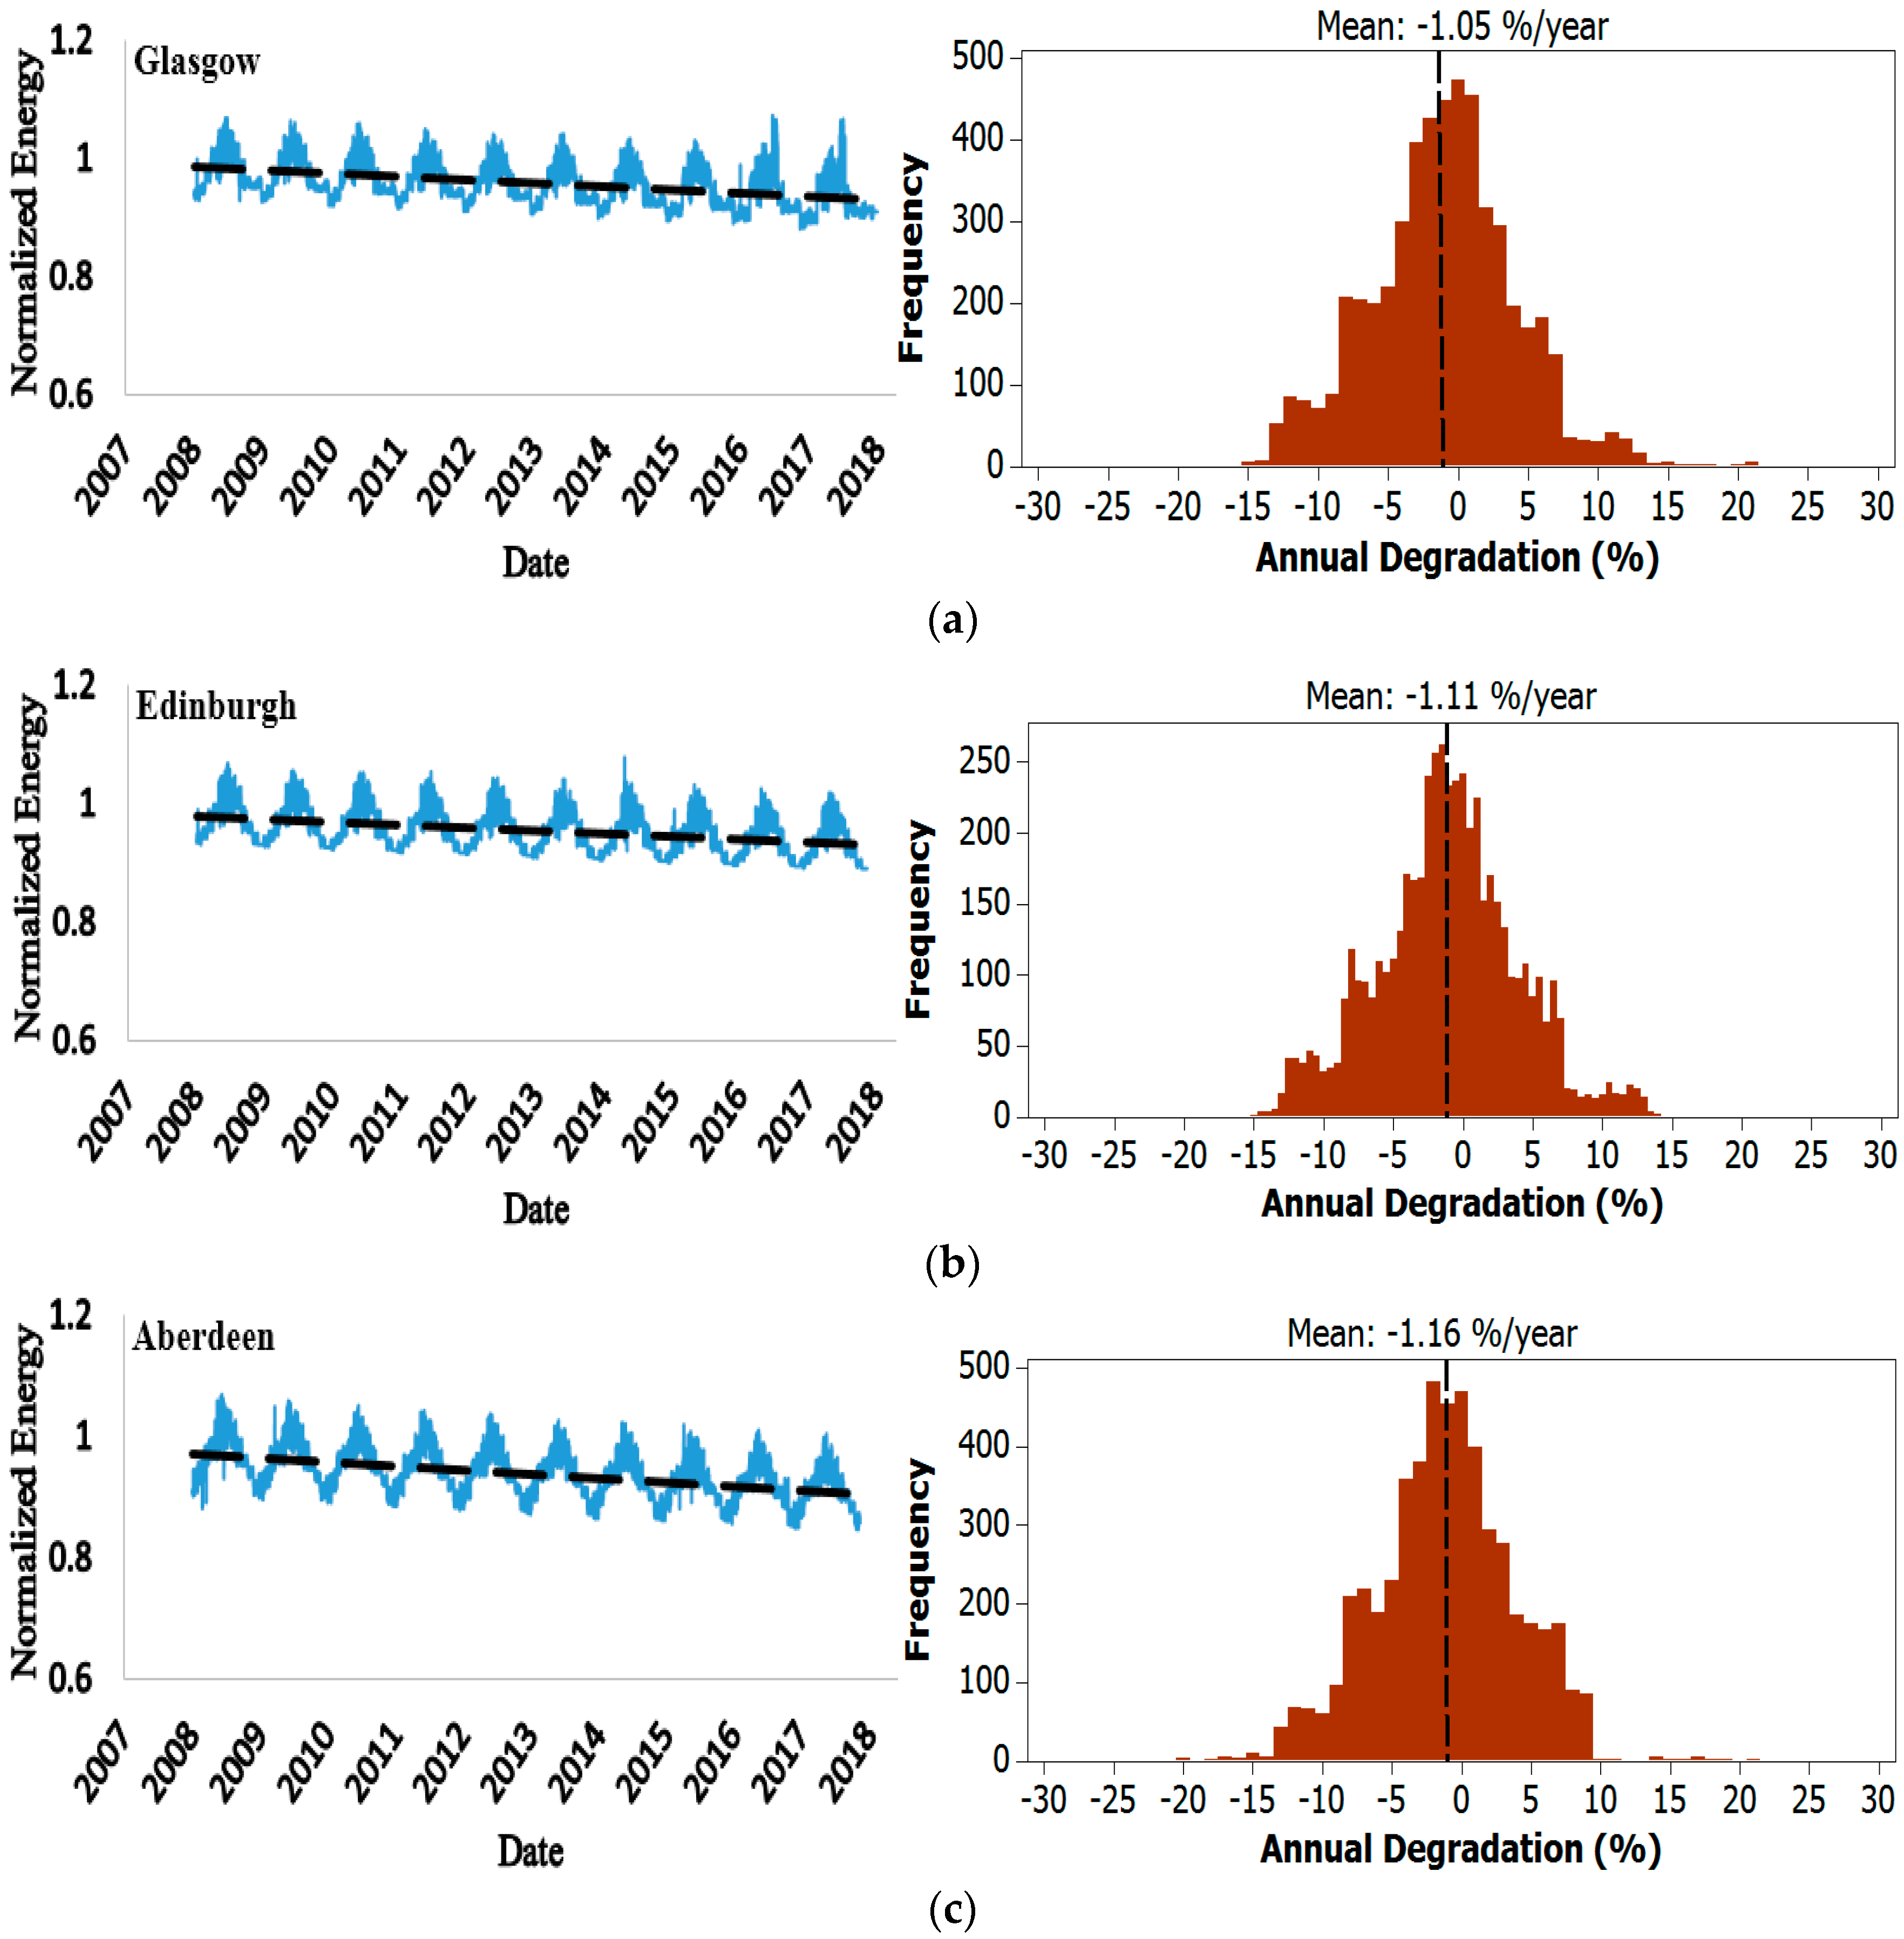
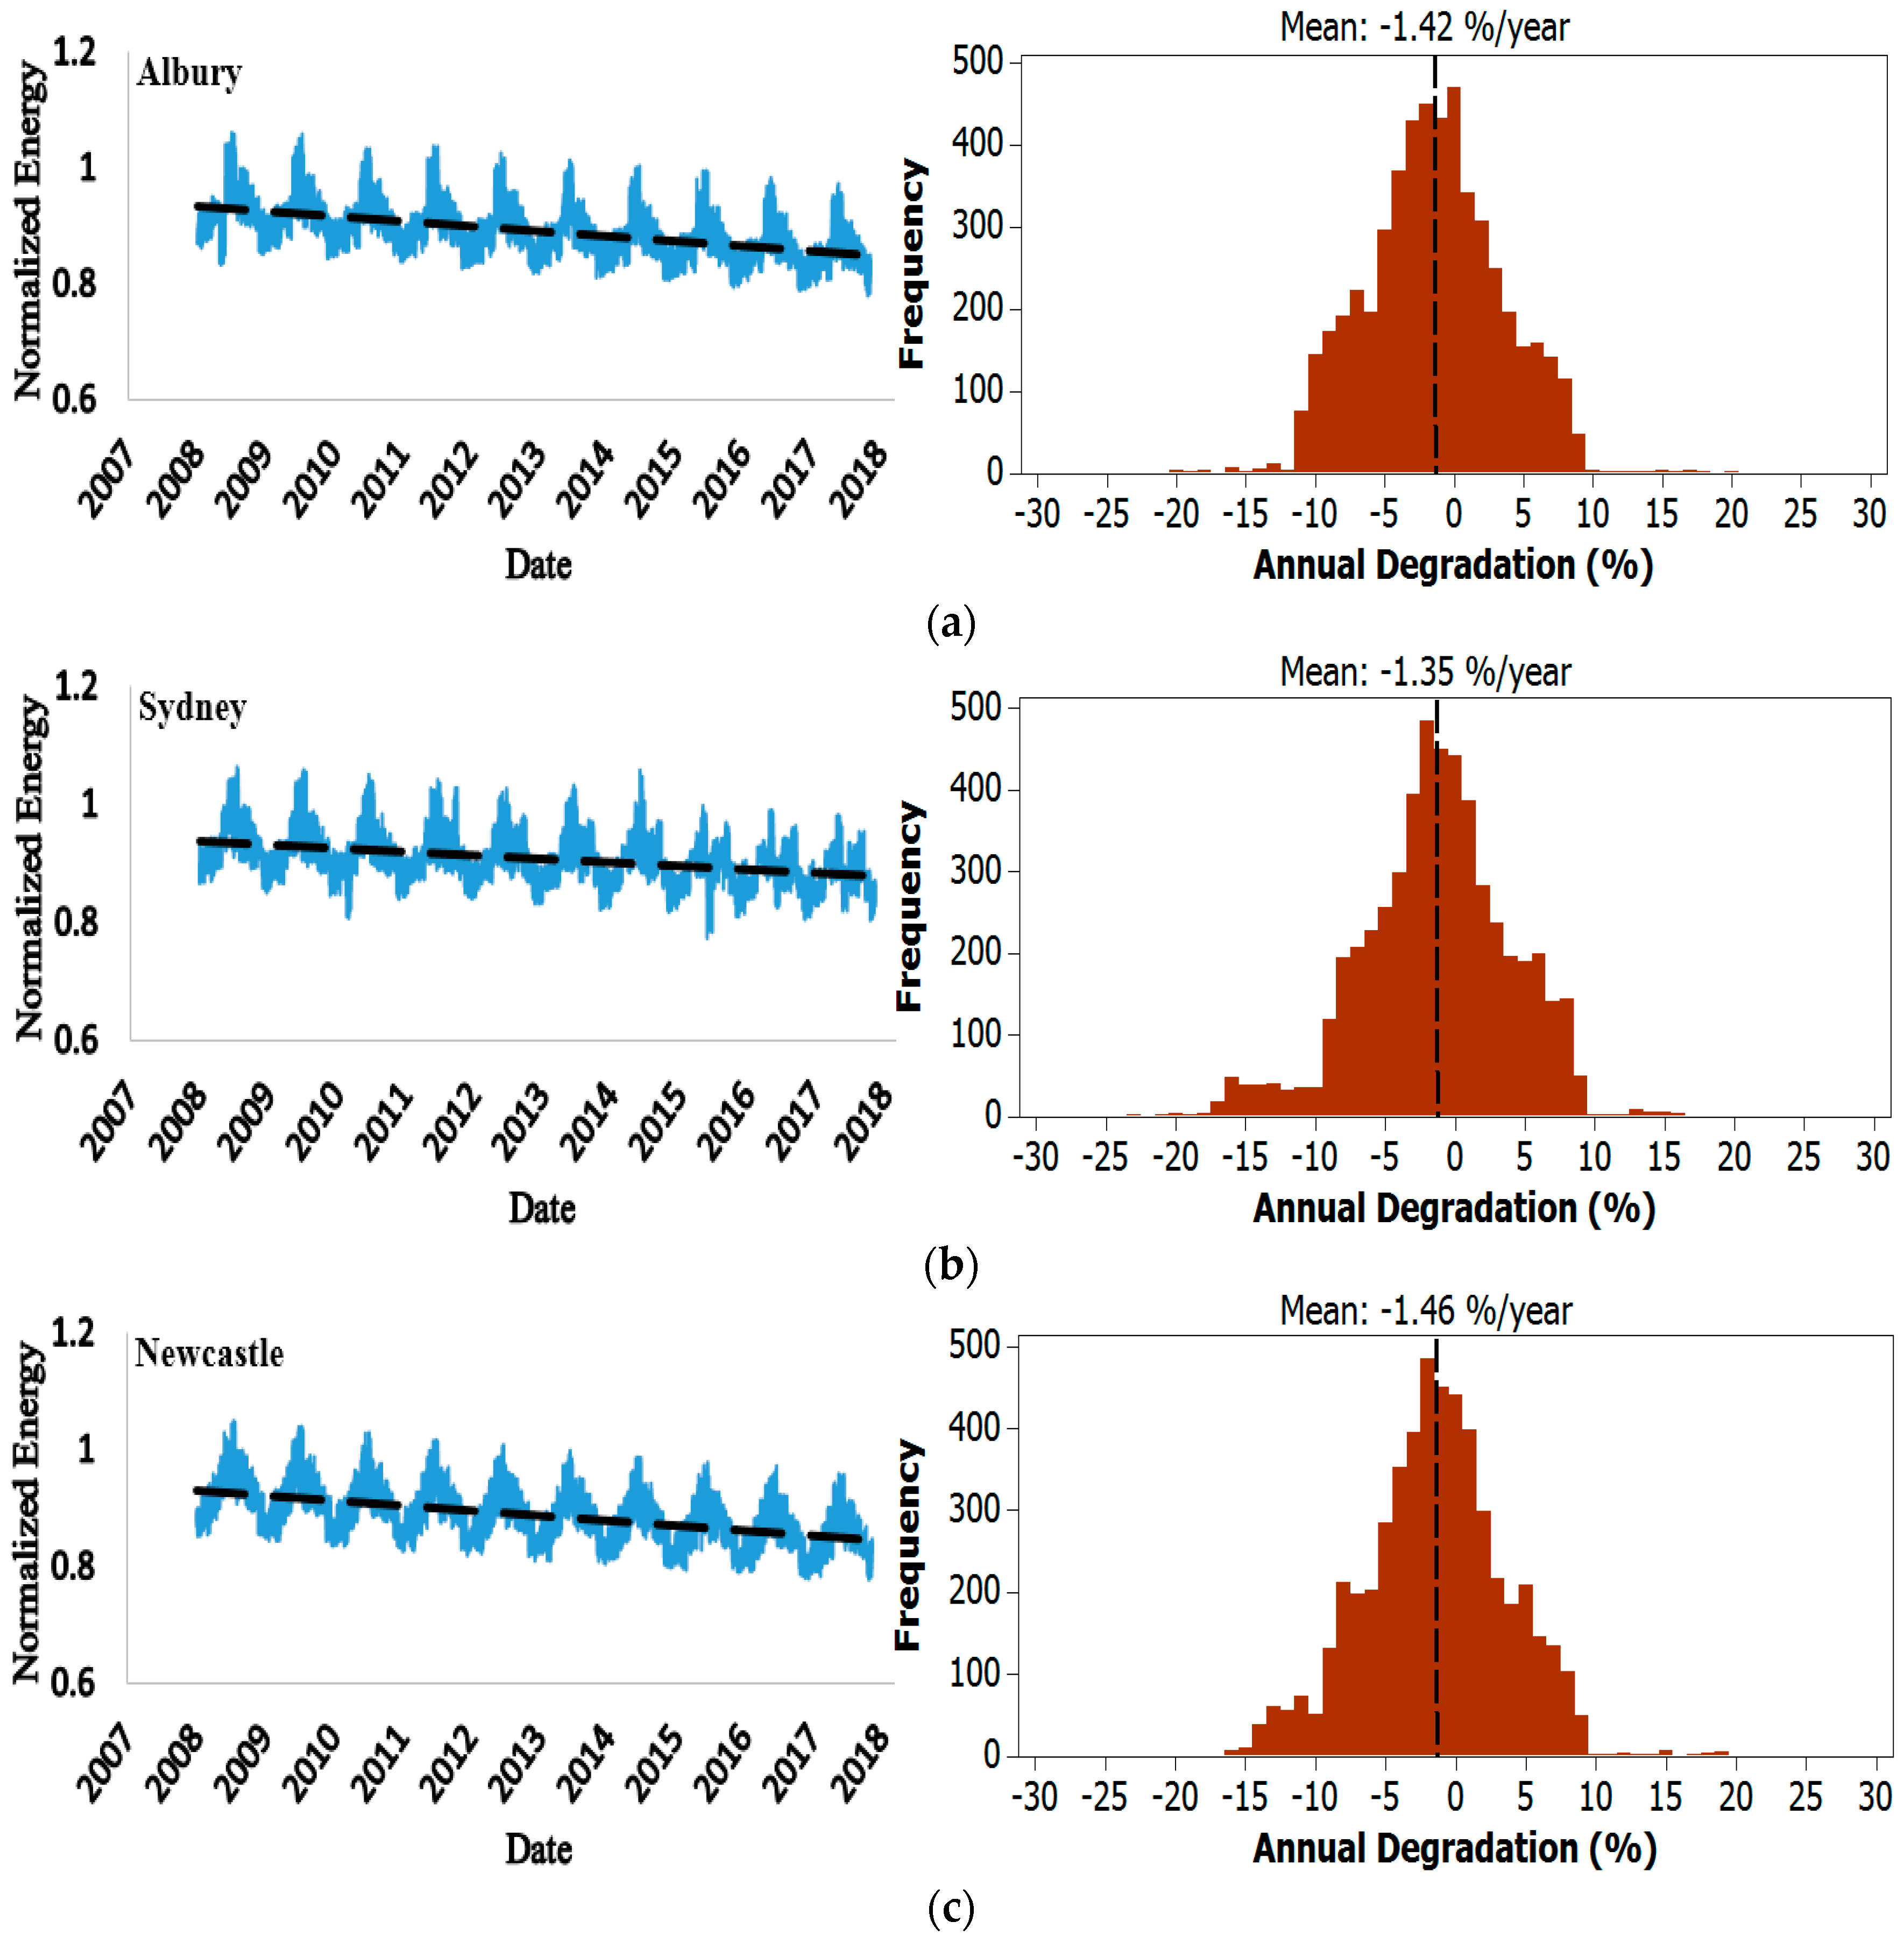
The YOY degradation analysis technique was applied to calculate the degradation rate of the examined PV systems based on their output dc power. Figure 3a–c shows the normalized output energy and the histogram of the degradation rate analysis in sites A, B, and C. Accordingly, in the Glasgow PV site, the mean degradation rate over the last 10 year is −1.05%/year. Grater degradation mean of −1.11%/year is observed for PV system installed in Edinburgh. Furthermore, the highest mean degradation rate is found in Aberdeen at −1.16%/year. Remarkably, this large degradation rate in the PV systems is related to the fact that the PV sites (A, B, and C) are in cold areas. The heavy snow, rain, and high wind speed impact the surface of the PV modules, thus there is a higher risk for PV hot spots, micro cracks, and damage in the surface of the PV modules due to hoarfrost, which subsequently will increase the degradation rate of the PV modules.
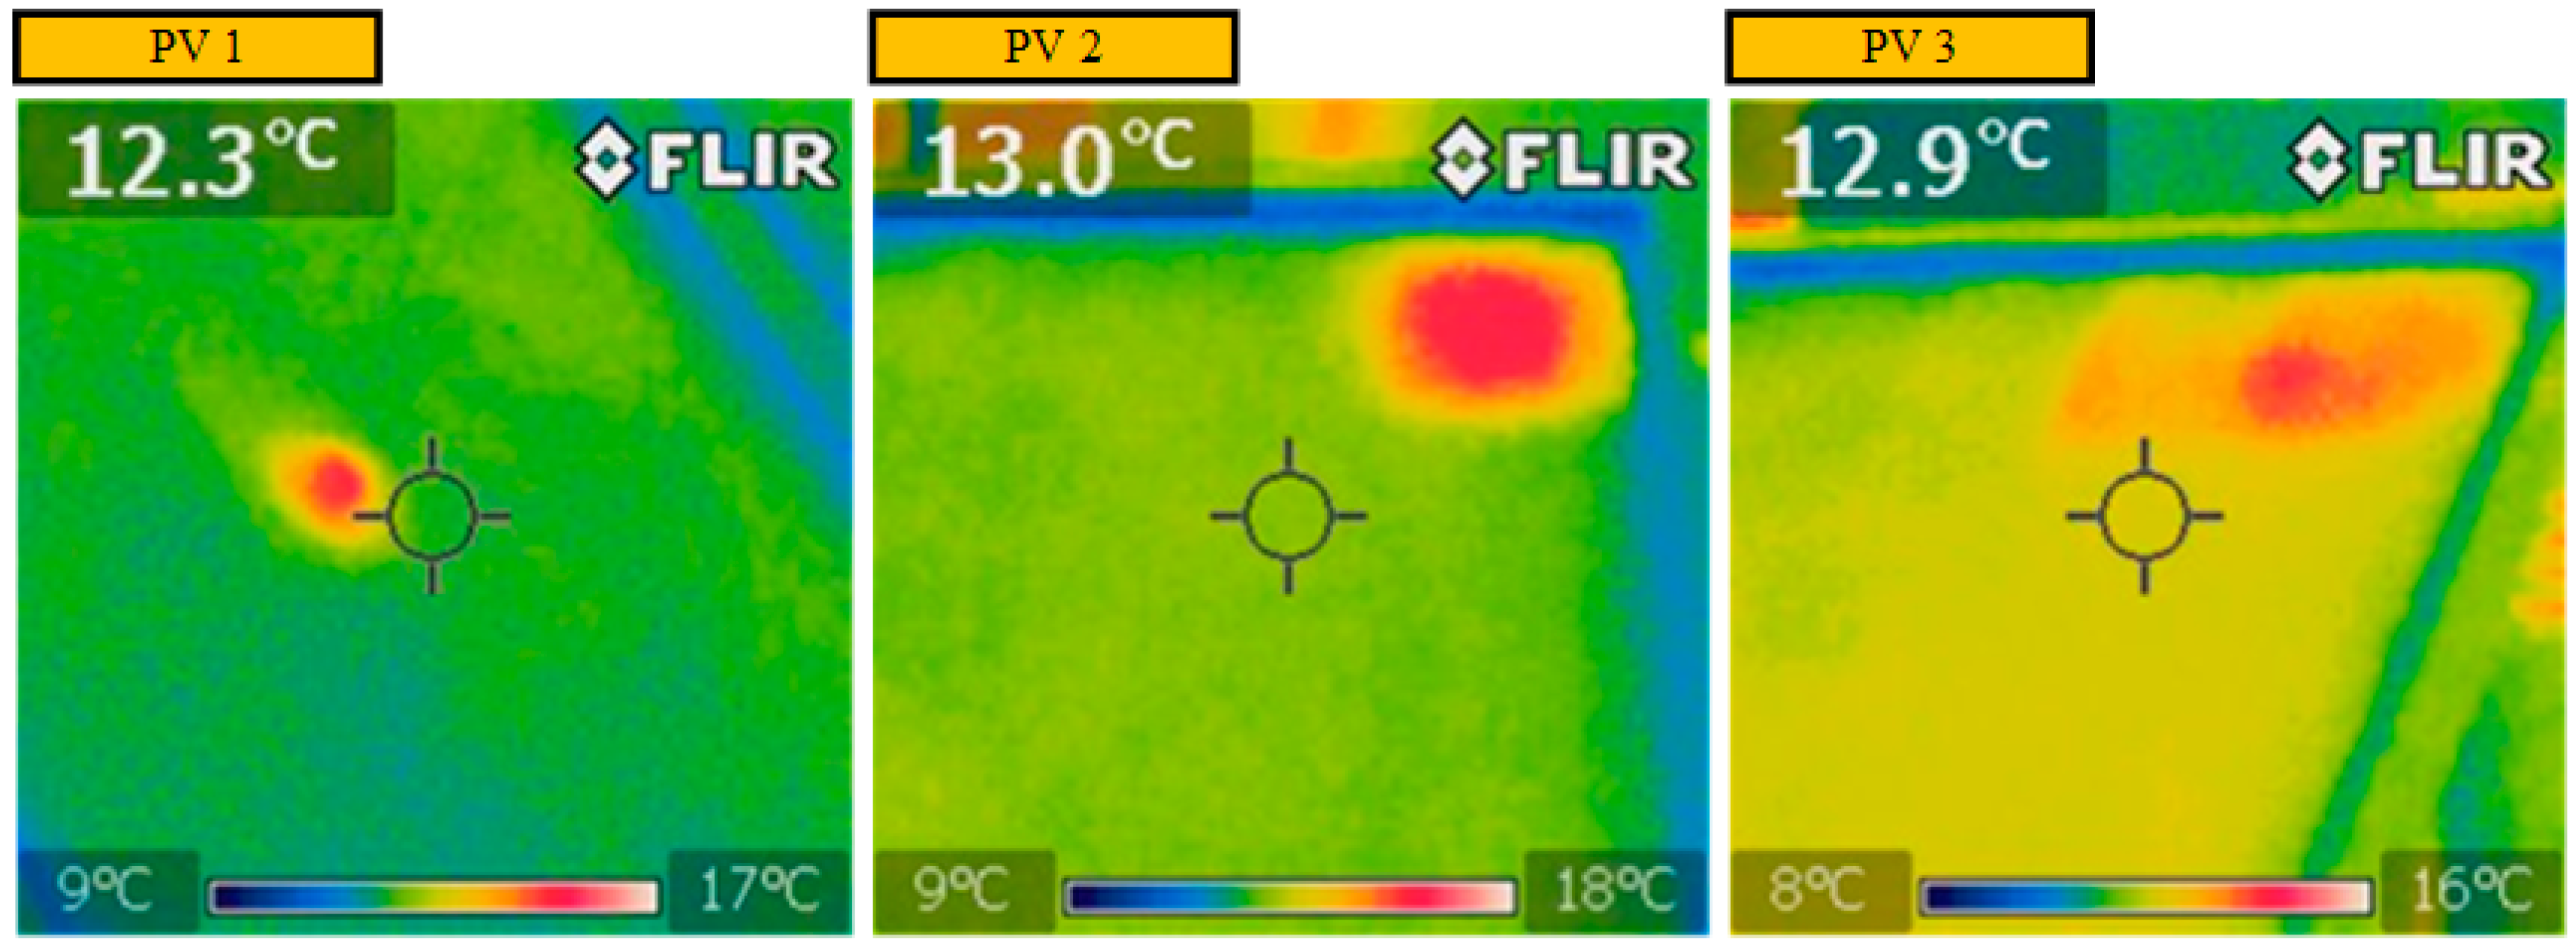
Since the PV site C has the highest degradation rate (−1.16%/year) compared to PV site A and B, this site has been inspected. Interestingly, a broken glass due to a hoarfrost was found in one of the PV modules. In addition, three adjacent PV modules affected by hot spots were identified. Figure 4 shows the thermography image for the hot-spotted PV modules captured using FLIR E4 thermal imaging camera. Fundamentally, hot spots reduce the output power production of the PV modules. Thus, it will increase the degradation rate of this PV site.
In order to analyze the impact of these hot-spots affecting the PV system performance, we have divided the dataset used for the degradation rate analysis into two main parts:
  • First PV array: the PV array consists of 9 healthy PV modules; connected in series; all PV modules are not affected by hot-spots, or any other types of faults.
  • Second PV array: the PV array consists of 9 PV modules connected in series, of which three are affected by hot-spots.
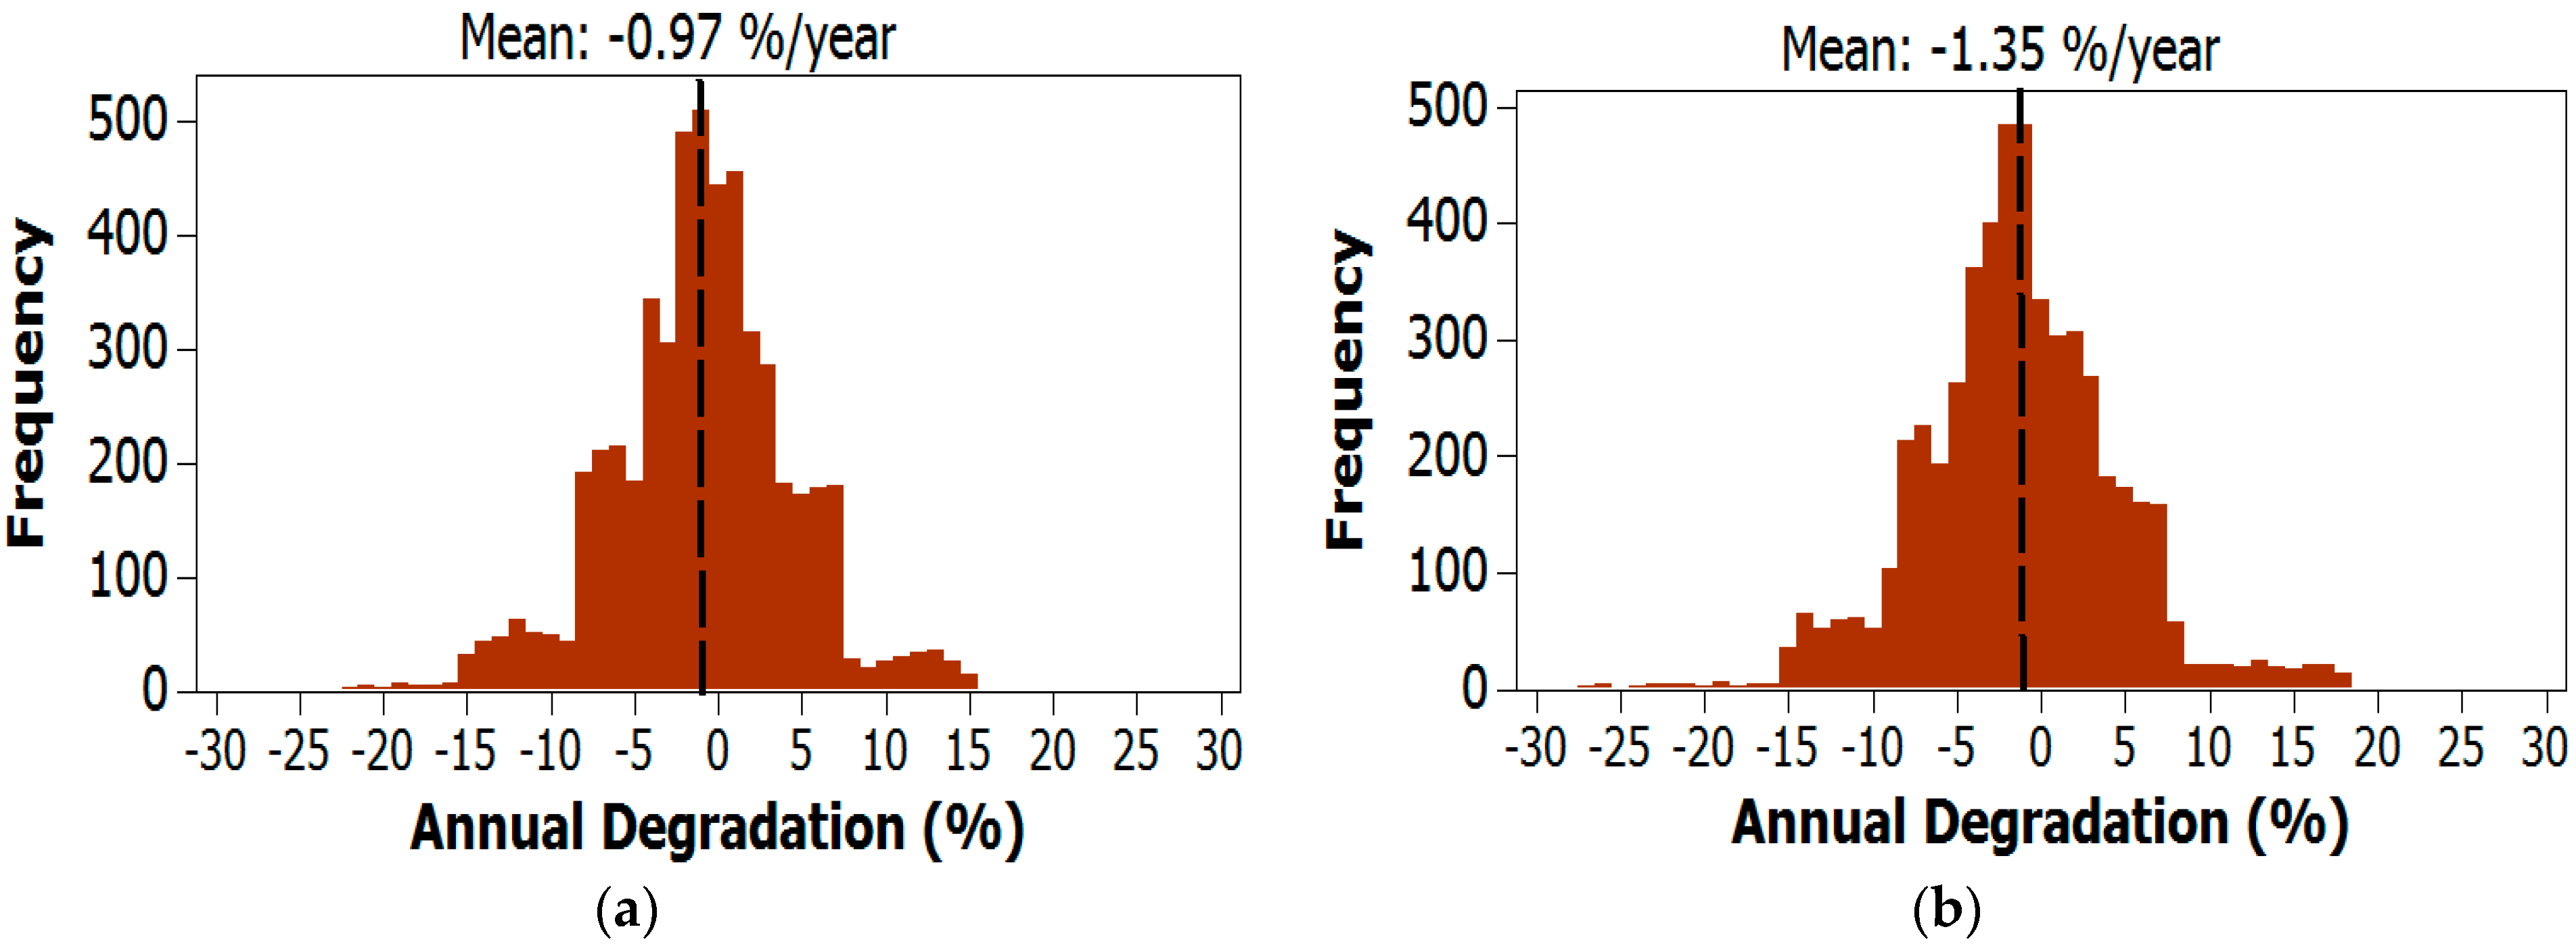
According to results shown in Figure 5a, the first PV array has an annual degradation rate of −0.97%/year. Whereas, in Figure 5b, the PV second PV array affected by three hot-spotted PV modules has an annual degradation rate of −1.35%/year. This result proves that Aberdeen site had the lowest degradation rate compared to both Glasgow and Edinburg, due to the impact of the hot-spots found in several PV modules.

3.2. Degradation Rates in the Australian PV Installations (D, E and F)

Similar to the previous section, the analysis of the degradation rate for the Australian sites has been conducted with the YOF degradation analysis technique. Figure 6a–c shows the normalized output energy and the histogram of the degradation rate analysis in sites D, E, and F. Consequently, in Albury PV site, the mean degradation rate over the last 10 year is −1.42%/year. A lesser degradation mean of −1.35%/year is observed for the PV system installed in Sydney. Furthermore, the highest mean degradation rate is found in Newcastle at −1.46%/year.
Compared to the PV degradation rates obtained in the UK sites, which are ranging from −1.05 to −1.16%/year, the degradation in the Australian sites are always higher. This is due to various reasons including (i) high levels of the ambient temperature affecting the PV modules, and (ii) the solar irradiation affecting the PV modules is much higher than the UK-based PV systems. Interestingly, this increase in the ambient and irradiance levels influence the PV modules by the following:
  • PV modules bypass diodes failure: from the examined PV sites in Australia, it was found that several PV modules had a faulty bypass diode. Two examples are shown in Figure 7a,b. A faulty bypass diode is found in a PV string, resulting an increase in the PV string temperature. In Figure 7a, the PV string has 7.9 °C increase in the temperature, whereas the PV string in Figure 7b has 9.1 °C increase in the PV string temperature due to the bypass diodes failure.
  • Hot spots: as similar to the hot spots found in the PV site C (Aberdeen, UK) shown previously in Figure 4b, after inspecting the PV site F (Newcastle, Australia) it was found that six PV modules were affected by hot spots. Figure 7c,d shows two different PV modules affected by hot spots.
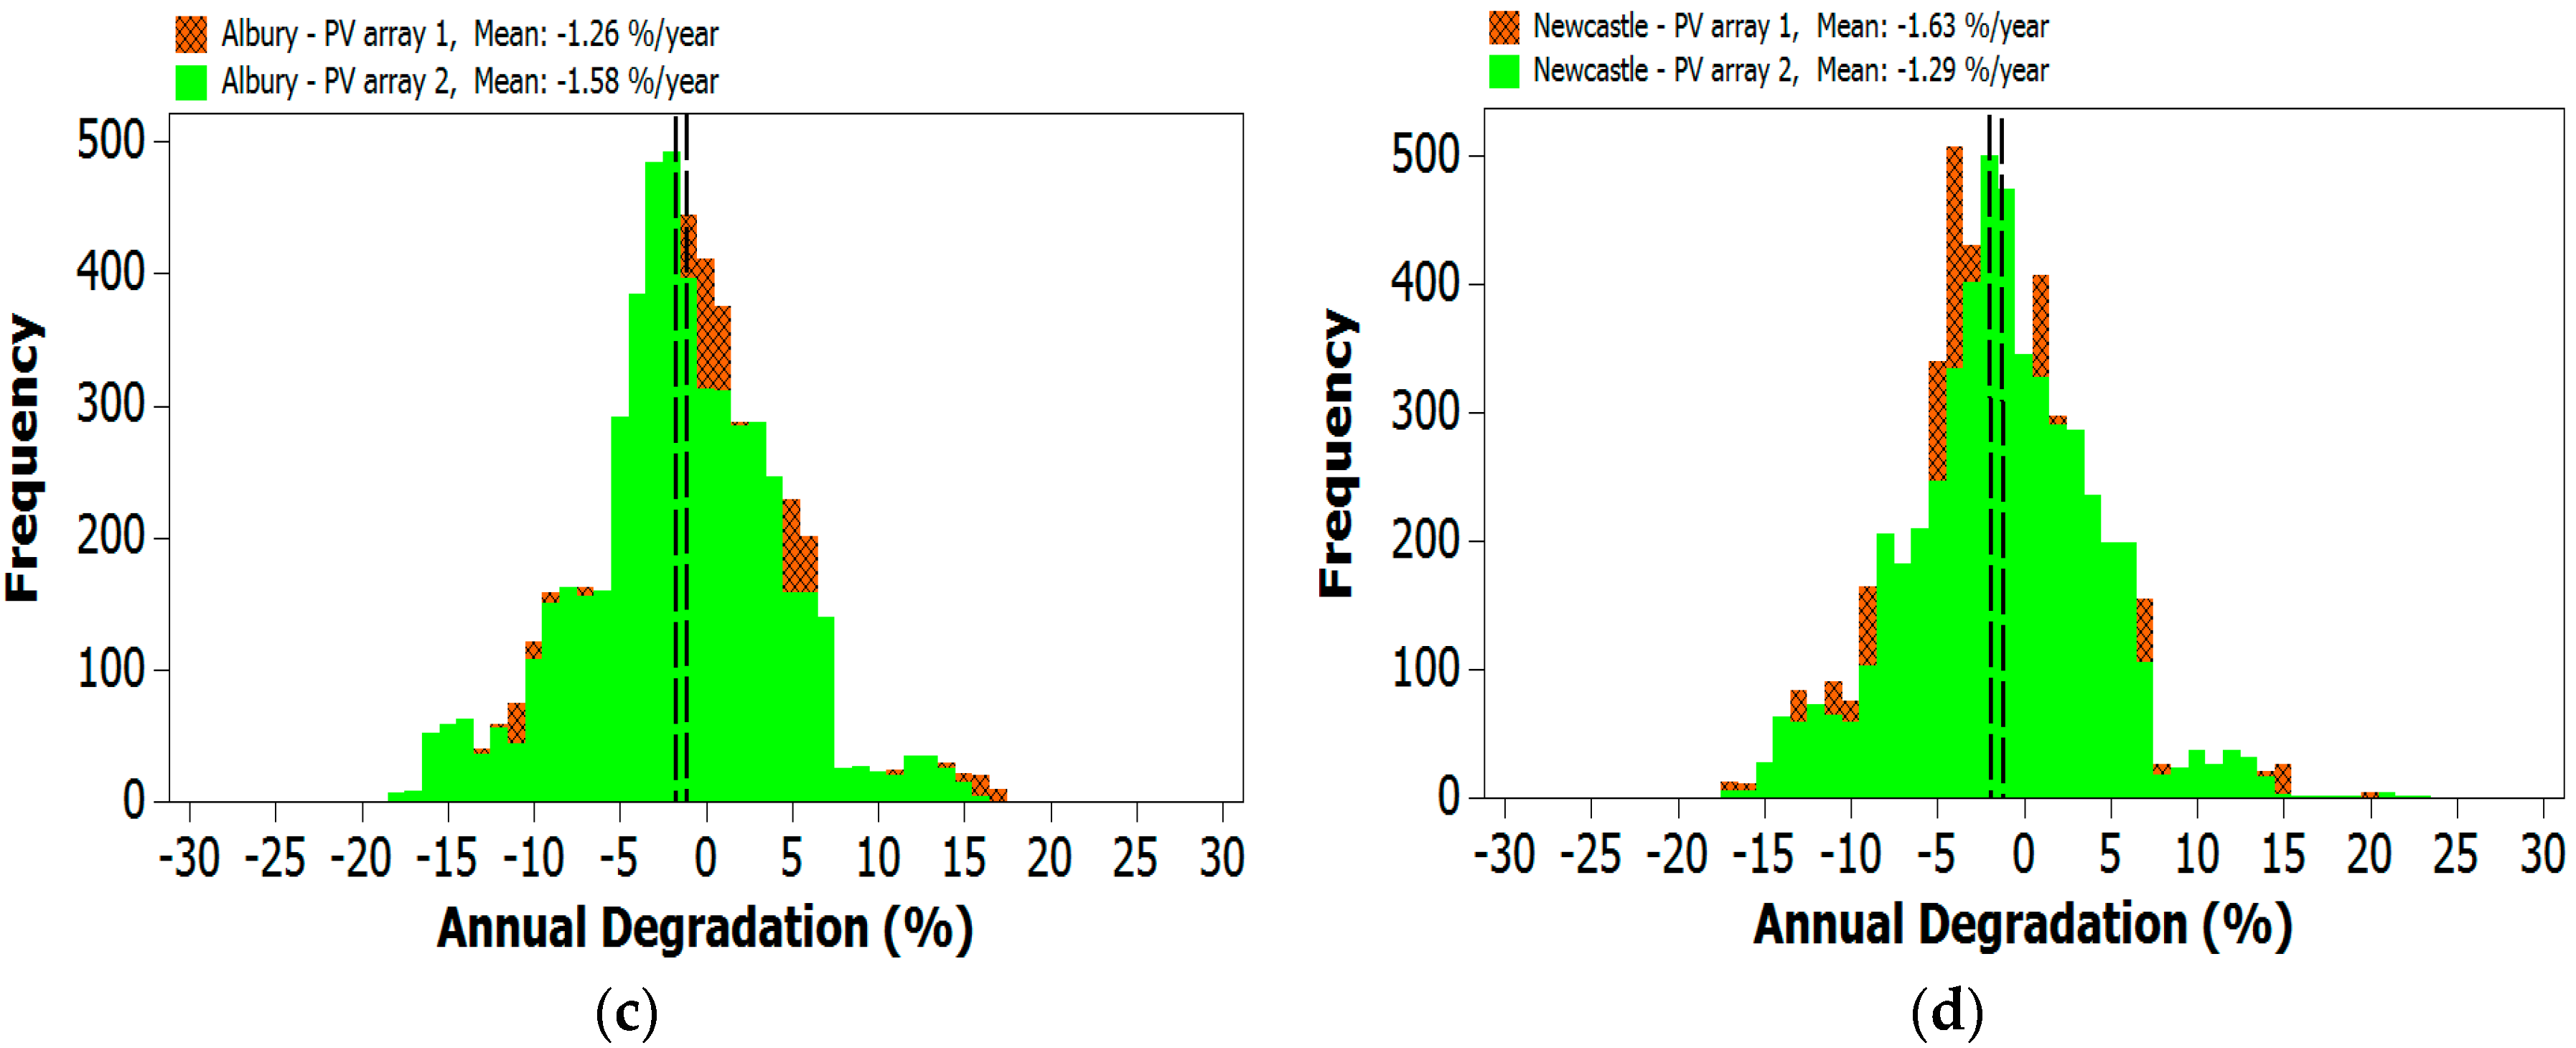
In order to visualize the impact of the failure in the bypass diodes, as well as the hot-spots in the Australian PV sites, we have carried out the analysis of the sub-array of the affected PV installations. Figure 8a shows the sub-array of the PV installation located in Albury, where two PV modules affected by faulty bypass diodes is observed in the PV array 2. According to Figure 8b, the Newcastle PV system has five hot-spotted PV modules in the first PV array, while the second PV array is only affected by one hot-spotted PV module.
Results shown in Figure 8c,d present the annual degradation rate for the sub-array in both Albury and Newcastle PV systems. According to Figure 8c, Albury PV site, the first PV array has an annual degradation rate of −1.26%/year. Whereas, the PV second PV array affected by faulty bypass diodes in two different PV modules has an annual degradation rate of −1.58%/year, resulting in a higher annual degradation due to the existence of the faulty bypass diodes. Similarly, Figure 8d shows the annual degradation rate in PV array 1 and 2 for PV systems located in Newcastle, Australia. The First PV array has high annual degradation of −1.63%/year because there are five PV modules are affected by various hot-spots. However, less annual degradation is obtained for the second PV array of −1.29%/year, while this PV array is only affected by one hot-spotted PV module.

4. Discussion

In this article, the degradation rate for two different PV sites were investigated. The first PV sites are in the UK (affected by cold weather conditions), whereas the second PV sites are in Australia (affected by hot weather conditions). From the findings discussed in above sections, this article claims the following:
  • In cold weather conditions the PV degradation rate is less than the degradation rate of PV modules affected by hot weather conditions. Based on the analysis of three different PV sites, it was found that PV degradation rate in the UK is between −1.05% to −1.16%/year, whereas the PV degradation rate in Australia ranging from −1.35% to −1.46%/year.
  • In cold weather conditions, there is high risk for glass broke due to hoarfrost, in addition, heavy snow is expected to impact the PV modules by various hot spots, which will reduce the output power generation of the PV modules.
  • In hot weather conditions, it was found that faulty PV bypass diodes are expected to occur due to the high range of ambient temperature and uneven temperature and irradiance profiles affecting the PV modules. However, in cold weather conditions, none of the bypass diodes were damaged over the considered period; 10 years of operation.
  • The number of PV hot spots found in UK PV sites are less than the number of hot spots found in the Australasian PV sites.
  • The observed failure of the bypass diodes in the Australian PV systems are a result of the sudden drop in the output power of one of the three PV modules cell strings, this will activate the bypass diode in the shaded PV string, while other bypass diodes in the un-shaded strings remains switched-off. The repeated alternation in the switching (off/on) for the bypass diodes resulting in a possible failure. This is also the case in many investigated studies such as [28,29,30].
The analysis of the monthly performance ratio for all examined PV sites in the UK and Australia have been compared. A total number of 120 samples/site; resulting a total of 360 for all examined PV sites in the UK as well as in Australia.
The performance ratio (PR) is a widely used metric for comparing relative performance of PV installations whose design, technology, capacity, and location differ [31] and [32]. The PR is calculated using Equation (3):
P R = Y f Y r = E P V   \   P S T C   G T I     \   G S T C
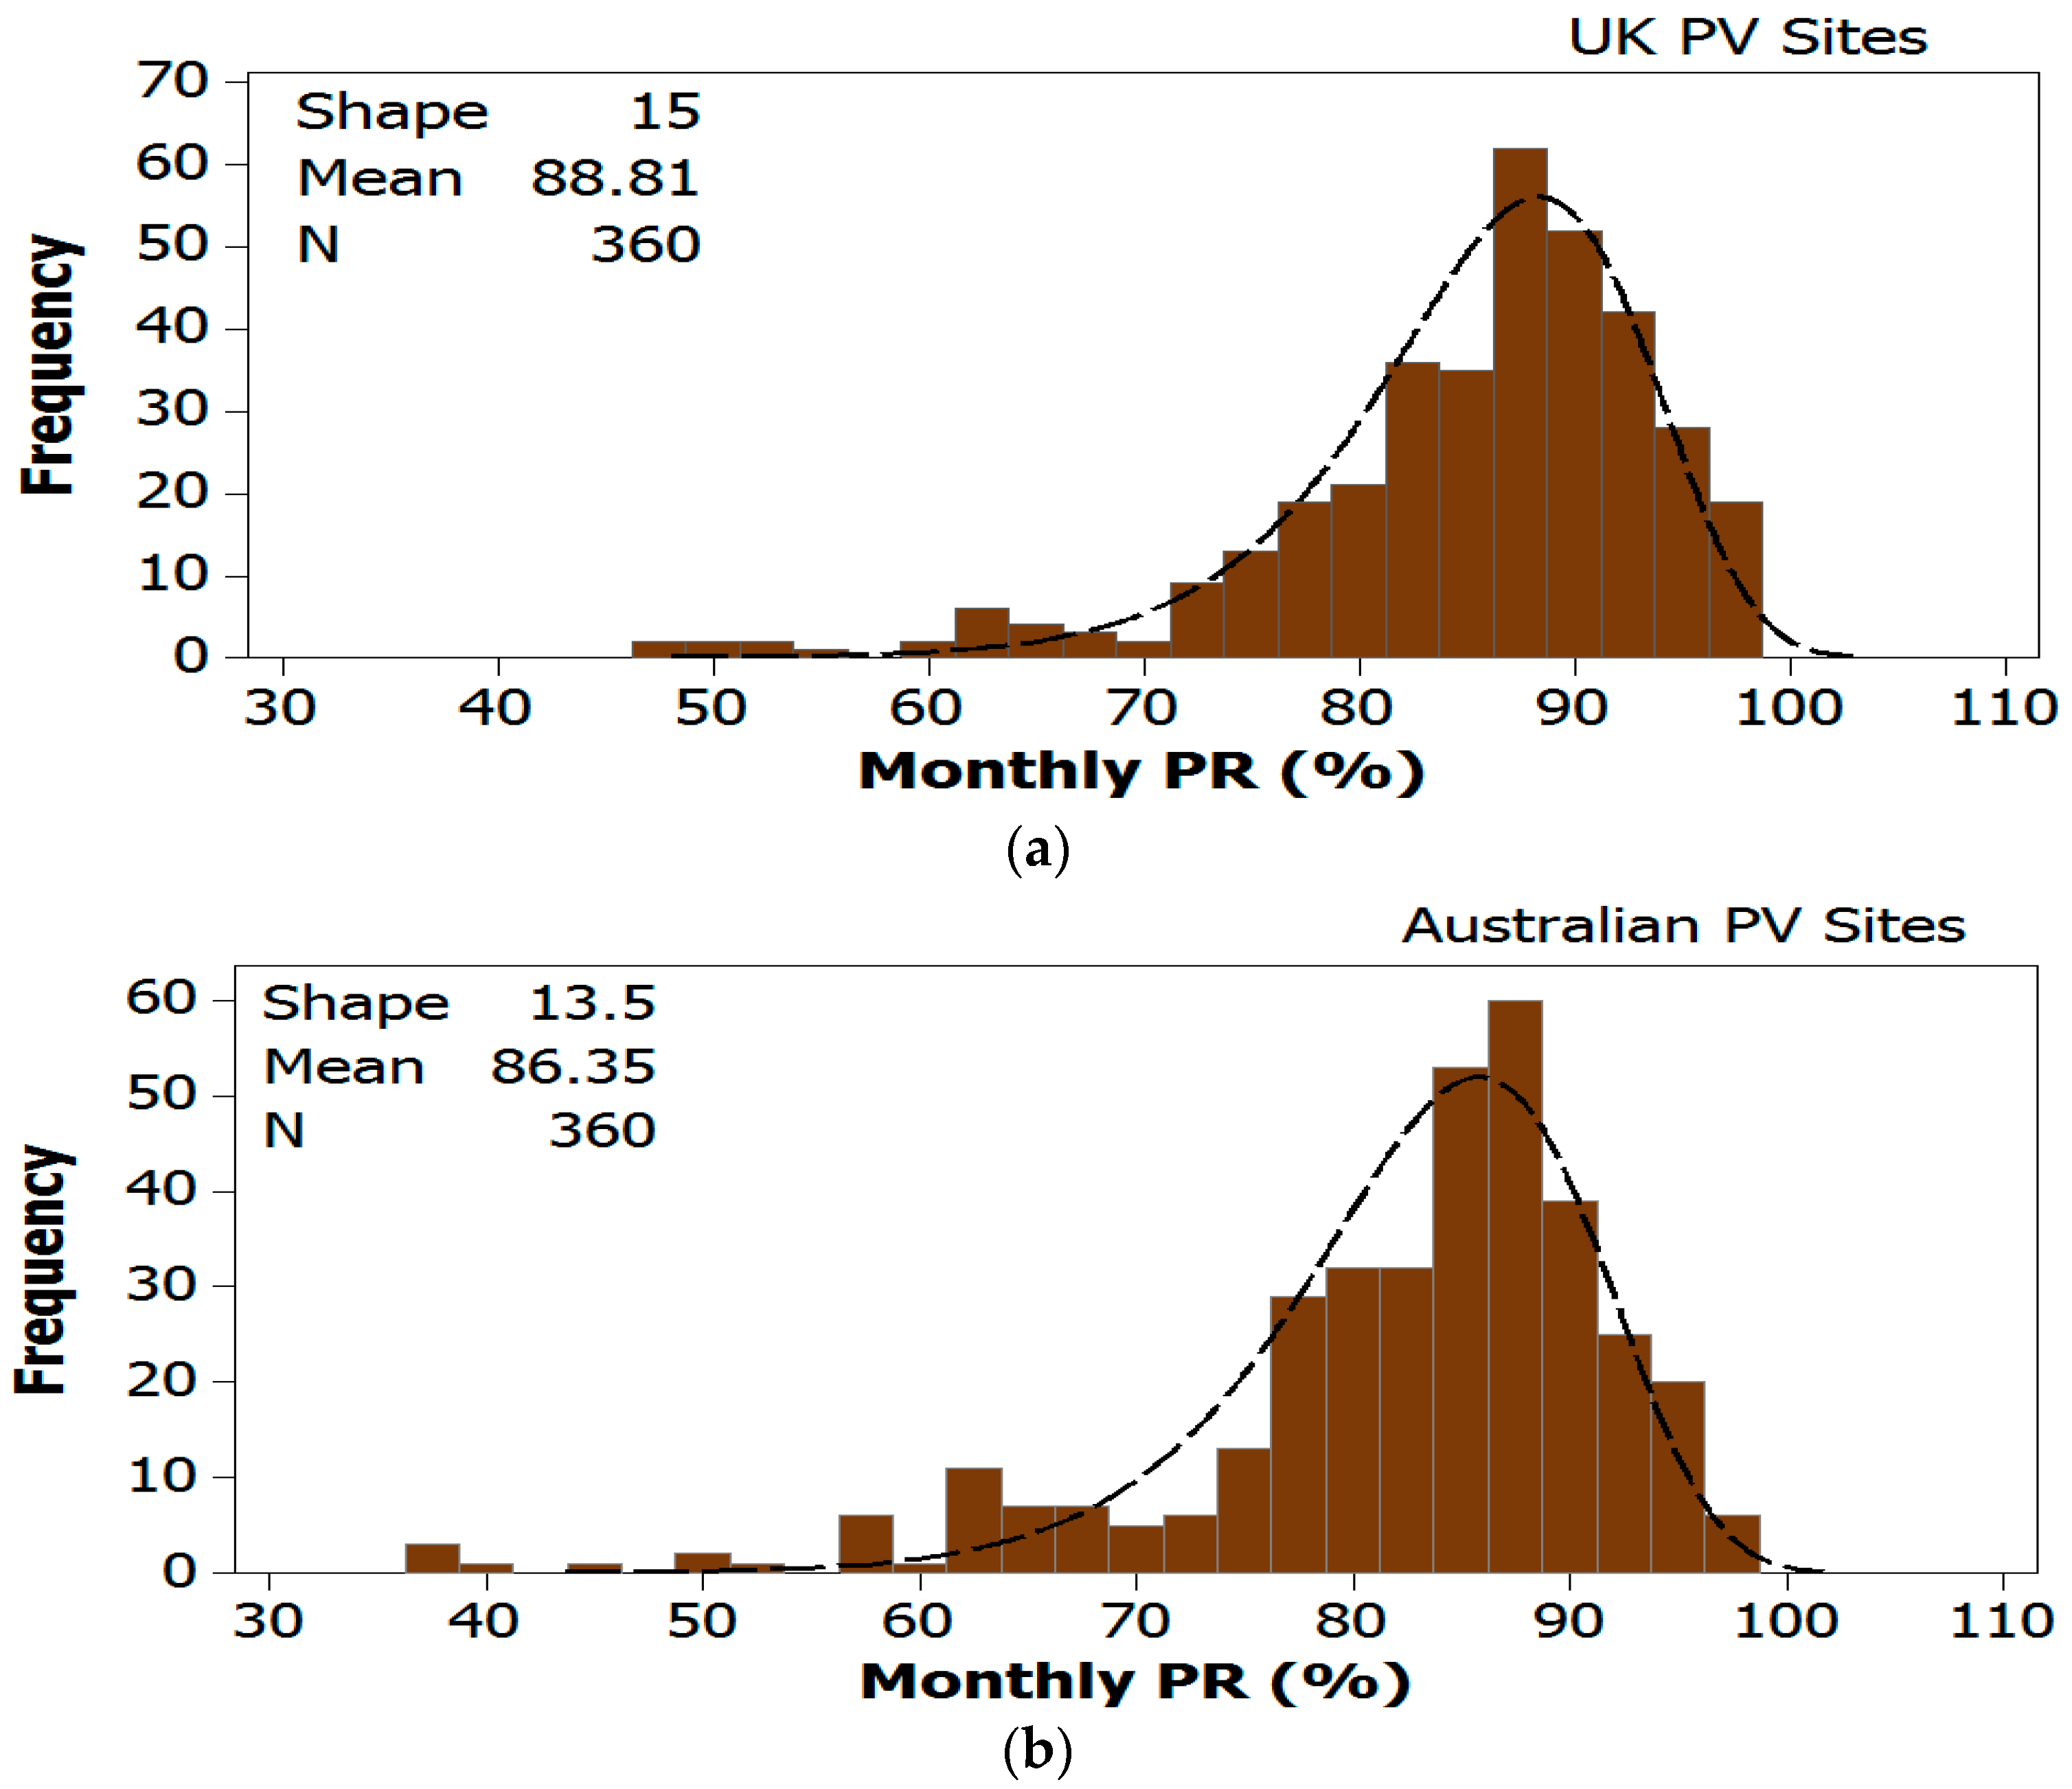
where Y f is the final yield energy of the PV systems, while Y r is the reference yield energy. E P V is the total energy produced by the PV system during a given period of time, P S T C is the rated power of the PV system under STCs, G T I is the global solar irradiance received by the PV system, and G S T C is the global solar irradiance under STC of 1000 W/m2. We have analyzed the monthly PR for all systems over a period of 10 years. The monthly integrated PR obtained for the PV sites in the UK and Australia is shown in Figure 9.
The distribution does not follow a normal (or Gaussian) distribution, because an important fraction of the PV systems shows an overall performance lower than average, and others are clearly subject to faults, which skews the distributions towards the low PR values. The distribution is better explained with a Weibull distribution [33], which often arises when the range of variation of a population is physically limited at one extremity, but not at the other.
According to Figure 9a,b, the obtained mean monthly PR is equal to 88.81% and 86.35% for PV systems installed in the UK and Australia, respectively. Therefore, PV systems in the UK have an increase in the monthly PR of 2.46% compared to those installed in Australia. Interestingly, this result verifies that the PV annual degradation rate in the UK is lower than Australia, which was found in the previous section.

5. Conclusions

This article presents the analysis of degradation rate over 10 years (2008 to 2017) for six different PV sites located in the UK (mainly affected by cold weather conditions) and Australia (PV affected by hot weather conditions). The analysis of the degradation rate was carried out using the year-on-year (YOY) degradation technique. It was found that the degradation rate in the UK sites varies from −1.05% and −1.16%/year. Whereas a higher degradation ranging from −1.35% to −1.46%/year is observed for the PV sites installed in Australia.
Additionally, it was found that in the Australian PV installations, multiple faulty PV bypass diodes are present due to the rapid change in the ambient temperature and uneven solar irradiance levels influencing the PV modules. However, in cold weather conditions (such as northern UK), none of the bypass diodes were damaged over the considered PV exposure period. Furthermore, the number of PV hot spots have been also observed. It was found that in the UK-based PV sites the number of hot spotted PV modules are less than those found in the Australian PV systems.
On the other hand, the analysis of the monthly performance ratio was calculated in both observed counties. Remarkably, it was found that the mean monthly PR is equal to 88.81% and 86.35% for PV systems installed in the UK and Australia, respectively. This result verifies that the PV annual degradation rate in the UK is lower than Australia.

Author Contributions

Conceptualization M.D. and A.A.; methodology M.D. and A.A; software A.A.; validation M.D. and A.A; formal analysis A.A.; resources M.D.; data curation M.D.; writing-original draft preparation M.D.; writing-review and editing A.A.; supervision M.D. All authors have read and agreed to the published version of the manuscript.

Funding

This research received no external funding.

Conflicts of Interest

The authors declare no conflict of interest.

References

  1. Javed, K.; Ashfaq, H.; Singh, R.; Hussain, S.M.S.; Ustun, T.S. Design and Performance Analysis of a Stand-alone PV System with Hybrid Energy Storage for Rural India. Electronics 2019, 8, 952. [Google Scholar] [CrossRef] [Green Version]
  2. Liu, M.; Lu, W.; Xin, Y.; Wang, X.; Li, X.; Yao, S.; Guo, Q. Mechanism of Degradation Rate on the Irradiated Double-Polysilicon Self-Aligned Bipolar Transistor. Electronics 2019, 8, 657. [Google Scholar] [CrossRef] [Green Version]
  3. Dhimish, M.; Holmes, V.; Mehrdadi, B.; Dales, M.; Mather, P. Output-Power Enhancement for Hot Spotted Polycrystalline Photovoltaic Solar Cells. IEEE Trans. Device Mater. Reliab. 2017, 18, 37–45. [Google Scholar] [CrossRef]
  4. Kyprianou, A.; Phinikarides, A.; Makrides, G.; Georghiou, G.E. Definition and Computation of the Degradation Rates of Photovoltaic Systems of Different Technologies with Robust Principal Component Analysis. IEEE J. Photovolt. 2015, 5, 1698–1705. [Google Scholar] [CrossRef]
  5. Kawai, S.; Tanahashi, T.; Fukumoto, Y.; Tamai, F.; Masuda, A.; Kondo, M. Causes of Degradation Identified by the Extended Thermal Cycling Test on Commercially Available Crystalline Silicon Photovoltaic Modules. IEEE J. Photovolt. 2017, 7, 1–8. [Google Scholar] [CrossRef]
  6. Chen, W.; Yang, M.; Zhang, S.; Andrews-Speed, P.; Li, W. What accounts for the China-US difference in solar PV electricity output? An LMDI analysis. J. Clean. Prod. 2019, 231, 161–170. [Google Scholar] [CrossRef]
  7. Jordan, D.; Kurtz, S.R.; VanSant, K.; Newmiller, J. Compendium of photovoltaic degradation rates. Prog. Photovolt. Res. Appl. 2016, 24, 978–989. [Google Scholar] [CrossRef]
  8. Bouaichi, A.; Merrouni, A.A.; Hajjaj, C.; Zitouni, H.; Ghennioui, A.; El Amrani, A.; Messaoudi, C. In-situ inspection and measurement of degradation mechanisms for crystalline and thin film PV systems under harsh climatic conditions. Energy Procedia 2019, 157, 1210–1219. [Google Scholar] [CrossRef]
  9. Ascencio-Vásquez, J.; Kaaya, I.; Brecl, K.; Weiss, K.-A.; Topič, M. Global Climate Data Processing and Mapping of Degradation Mechanisms and Degradation Rates of PV Modules. Energies 2019, 12, 4749. [Google Scholar] [CrossRef] [Green Version]
  10. Martínez, S.M.; Carretón, M.C.; Honrubia-Escribano, A.; Gómez-Lázaro, E. Performance evaluation of large solar photovoltaic power plants in Spain. Energy Convers. Manag. 2019, 183, 515–528. [Google Scholar] [CrossRef]
  11. Lovati, M.; Salvalai, G.; Fratus, G.; Maturi, L.; Albatici, R.; Moser, D. New method for the early design of BIPV with electric storage: A case study in northern Italy. Sustain. Cities Soc. 2019, 48, 101400. [Google Scholar] [CrossRef] [Green Version]
  12. Muttillo, M.; Nardi, I.; Stornelli, V.; De Rubeis, T.; Pasqualoni, G.; Ambrosini, D. On Field Infrared Thermography Sensing for PV System Efficiency Assessment: Results and Comparison with Electrical Models. Sensors 2020, 20, 1055. [Google Scholar] [CrossRef] [PubMed] [Green Version]
  13. Weu, A.; Kumar, R.; Butscher, J.F.; Lami, V.; Paulus, F.; Bakulin, A.A.; Vaynzof, Y. Energy Transfer to a Stable Donor Suppresses Degradation in Organic Solar Cells. Adv. Funct. Mater. 2019, 30, 1907432. [Google Scholar] [CrossRef] [Green Version]
  14. Seel, J.; Barbose, G.L.; Wiser, R.H. An analysis of residential PV system price differences between the United States and Germany. Energy Policy 2014, 69, 216–226. [Google Scholar] [CrossRef] [Green Version]
  15. Singh, R.; Sharma, M.; Rawat, R.; Banerjee, C. Field Analysis of three different silicon-based Technologies in Composite Climate Condition—Part II—Seasonal assessment and performance degradation rates using statistical tools. Renew. Energy 2020, 147, 2102–2117. [Google Scholar] [CrossRef]
  16. Gaglia, A.G.; Lykoudis, S.; Argiriou, A.; Balaras, C.; Dialynas, E. Energy efficiency of PV panels under real outdoor conditions–An experimental assessment in Athens, Greece. Renew. Energy 2017, 101, 236–243. [Google Scholar] [CrossRef]
  17. Jurasz, J.; Dąbek, P.B.; Campana, P.E. Can a city reach energy self-sufficiency by means of rooftop photovoltaics? Case study from Poland. J. Clean. Prod. 2020, 245, 118813. [Google Scholar] [CrossRef]
  18. Chandel, S.; Naik, M.N.; Sharma, V.; Chandel, R. Degradation analysis of 28 year field exposed mono-c-Si photovoltaic modules of a direct coupled solar water pumping system in western Himalayan region of India. Renew. Energy 2015, 78, 193–202. [Google Scholar] [CrossRef]
  19. Thotakura, S.; Kondamudi, S.C.; Xavier, J.F.; Quanjin, M.; Reddy, G.R.; Gangwar, P.; Davuluri, S.L. Operational performance of megawatt-scale grid integrated rooftop solar PV system in tropical wet and dry climates of India. Case Stud. Therm. Eng. 2020, 18, 100602. [Google Scholar] [CrossRef]
  20. Tongsopit, S.; Junlakarn, S.; Wibulpolprasert, W.; Chaianong, A.; Kokchang, P.; Hoang, N.V.; Julakarn, S.; Wibulpholprasert, W. The economics of solar PV self-consumption in Thailand. Renew. Energy 2019, 138, 395–408. [Google Scholar] [CrossRef]
  21. Dechthummarong, C.; Wiengmoon, B.; Chenvidhya, D.; Jivacate, C.; Kirtikara, K. Physical deterioration of encapsulation and electrical insulation properties of PV modules after long-term operation in Thailand. Sol. Energy Mater. Sol. Cells 2010, 94, 1437–1440. [Google Scholar] [CrossRef]
  22. Park, J.H.; Lee, H.D.; Tae, D.H.; Ferreira, M.; Rho, D.S. A Study on Disposal Diagnosis Algorithm of PV Modules Considering Performance Degradation Rate. J. Korea Acad. Ind. Coop. Soc. 2019, 20, 493–502. [Google Scholar]
  23. Teah, H.S.; Yang, Q.; Onuki, M. Incorporating External Effects into Project Sustainability Assessments: The Case of a Green Campus Initiative Based on a Solar PV System. Sustainability 2019, 11, 5786. [Google Scholar] [CrossRef] [Green Version]
  24. Jordan, D.C.; Deline, C.; Deceglie, M.; Silverman, T.J.; Luo, W. PV Degradation—Mounting & Temperature. In Proceedings of the 2019 IEEE 46th Photovoltaic Specialists Conference (PVSC), Chicago, IL, USA, 16–21 June 2019; pp. 0673–0679. [Google Scholar]
  25. Dhimish, M.; Mather, P. Exploratory evaluation of solar radiation and ambient temperature in twenty locations distributed in United Kingdom. Urban Clim. 2019, 27, 179–192. [Google Scholar] [CrossRef]
  26. Taylor, J.; Leloux, J.; Hall, L.M.; Everard, A.M.; Briggs, J.; Buckley, A. Performance of distributed PV in the UK: A statistical analysis of over 7000 systems. In Proceedings of the 31st European Photovoltaic Solar Energy Conference and Exhibition, Hamburg, Germany, 14–18 September 2015. [Google Scholar]
  27. Jordan, D.; Kurtz, S.R. Photovoltaic Degradation Rates-an Analytical Review. Prog. Photovolt. Res. Appl. 2011, 21, 12–29. [Google Scholar] [CrossRef] [Green Version]
  28. Dhimish, M.; Chen, Z. Novel Open-Circuit Photovoltaic Bypass Diode Fault Detection Algorithm. IEEE J. Photovolt. 2019, 9, 1819–1827. [Google Scholar] [CrossRef] [Green Version]
  29. Shin, W.; Ko, S.; Song, H.-J.; Ju, Y.; Hwang, H.; Kang, G.-H. Origin of Bypass Diode Fault in c-Si Photovoltaic Modules: Leakage Current under High Surrounding Temperature. Energies 2018, 11, 2416. [Google Scholar] [CrossRef] [Green Version]
  30. Alqaisi, Z.; Mahmoud, Y. Comprehensive Study of Partially Shaded PV Modules with Overlapping Diodes. IEEE Access 2019, 7, 172665–172675. [Google Scholar] [CrossRef]
  31. Jiménez-Castillo, G.; Muñoz-Rodriguez, F.; Martinez-Calahorro, A.J.; Tina, G.M.; Rus-Casas, C. Impacts of Array Orientation and Tilt Angles for Photovoltaic Self-Sufficiency and Self-Consumption Indices in Olive Mills in Spain. Electronics 2020, 9, 348. [Google Scholar] [CrossRef] [Green Version]
  32. Dhimish, M.; Mather, P.; Holmes, V. Evaluating Power Loss and Performance Ratio of Hot-Spotted Photovoltaic Modules. IEEE Trans. Electron Devices 2018, 65, 5419–5427. [Google Scholar] [CrossRef] [Green Version]
  33. Shao, J.; Zhang, H.; Chen, B. Experimental Study on the Reliability of PBGA Electronic Packaging under Shock Loading. Electronics 2019, 8, 279. [Google Scholar] [CrossRef] [Green Version]
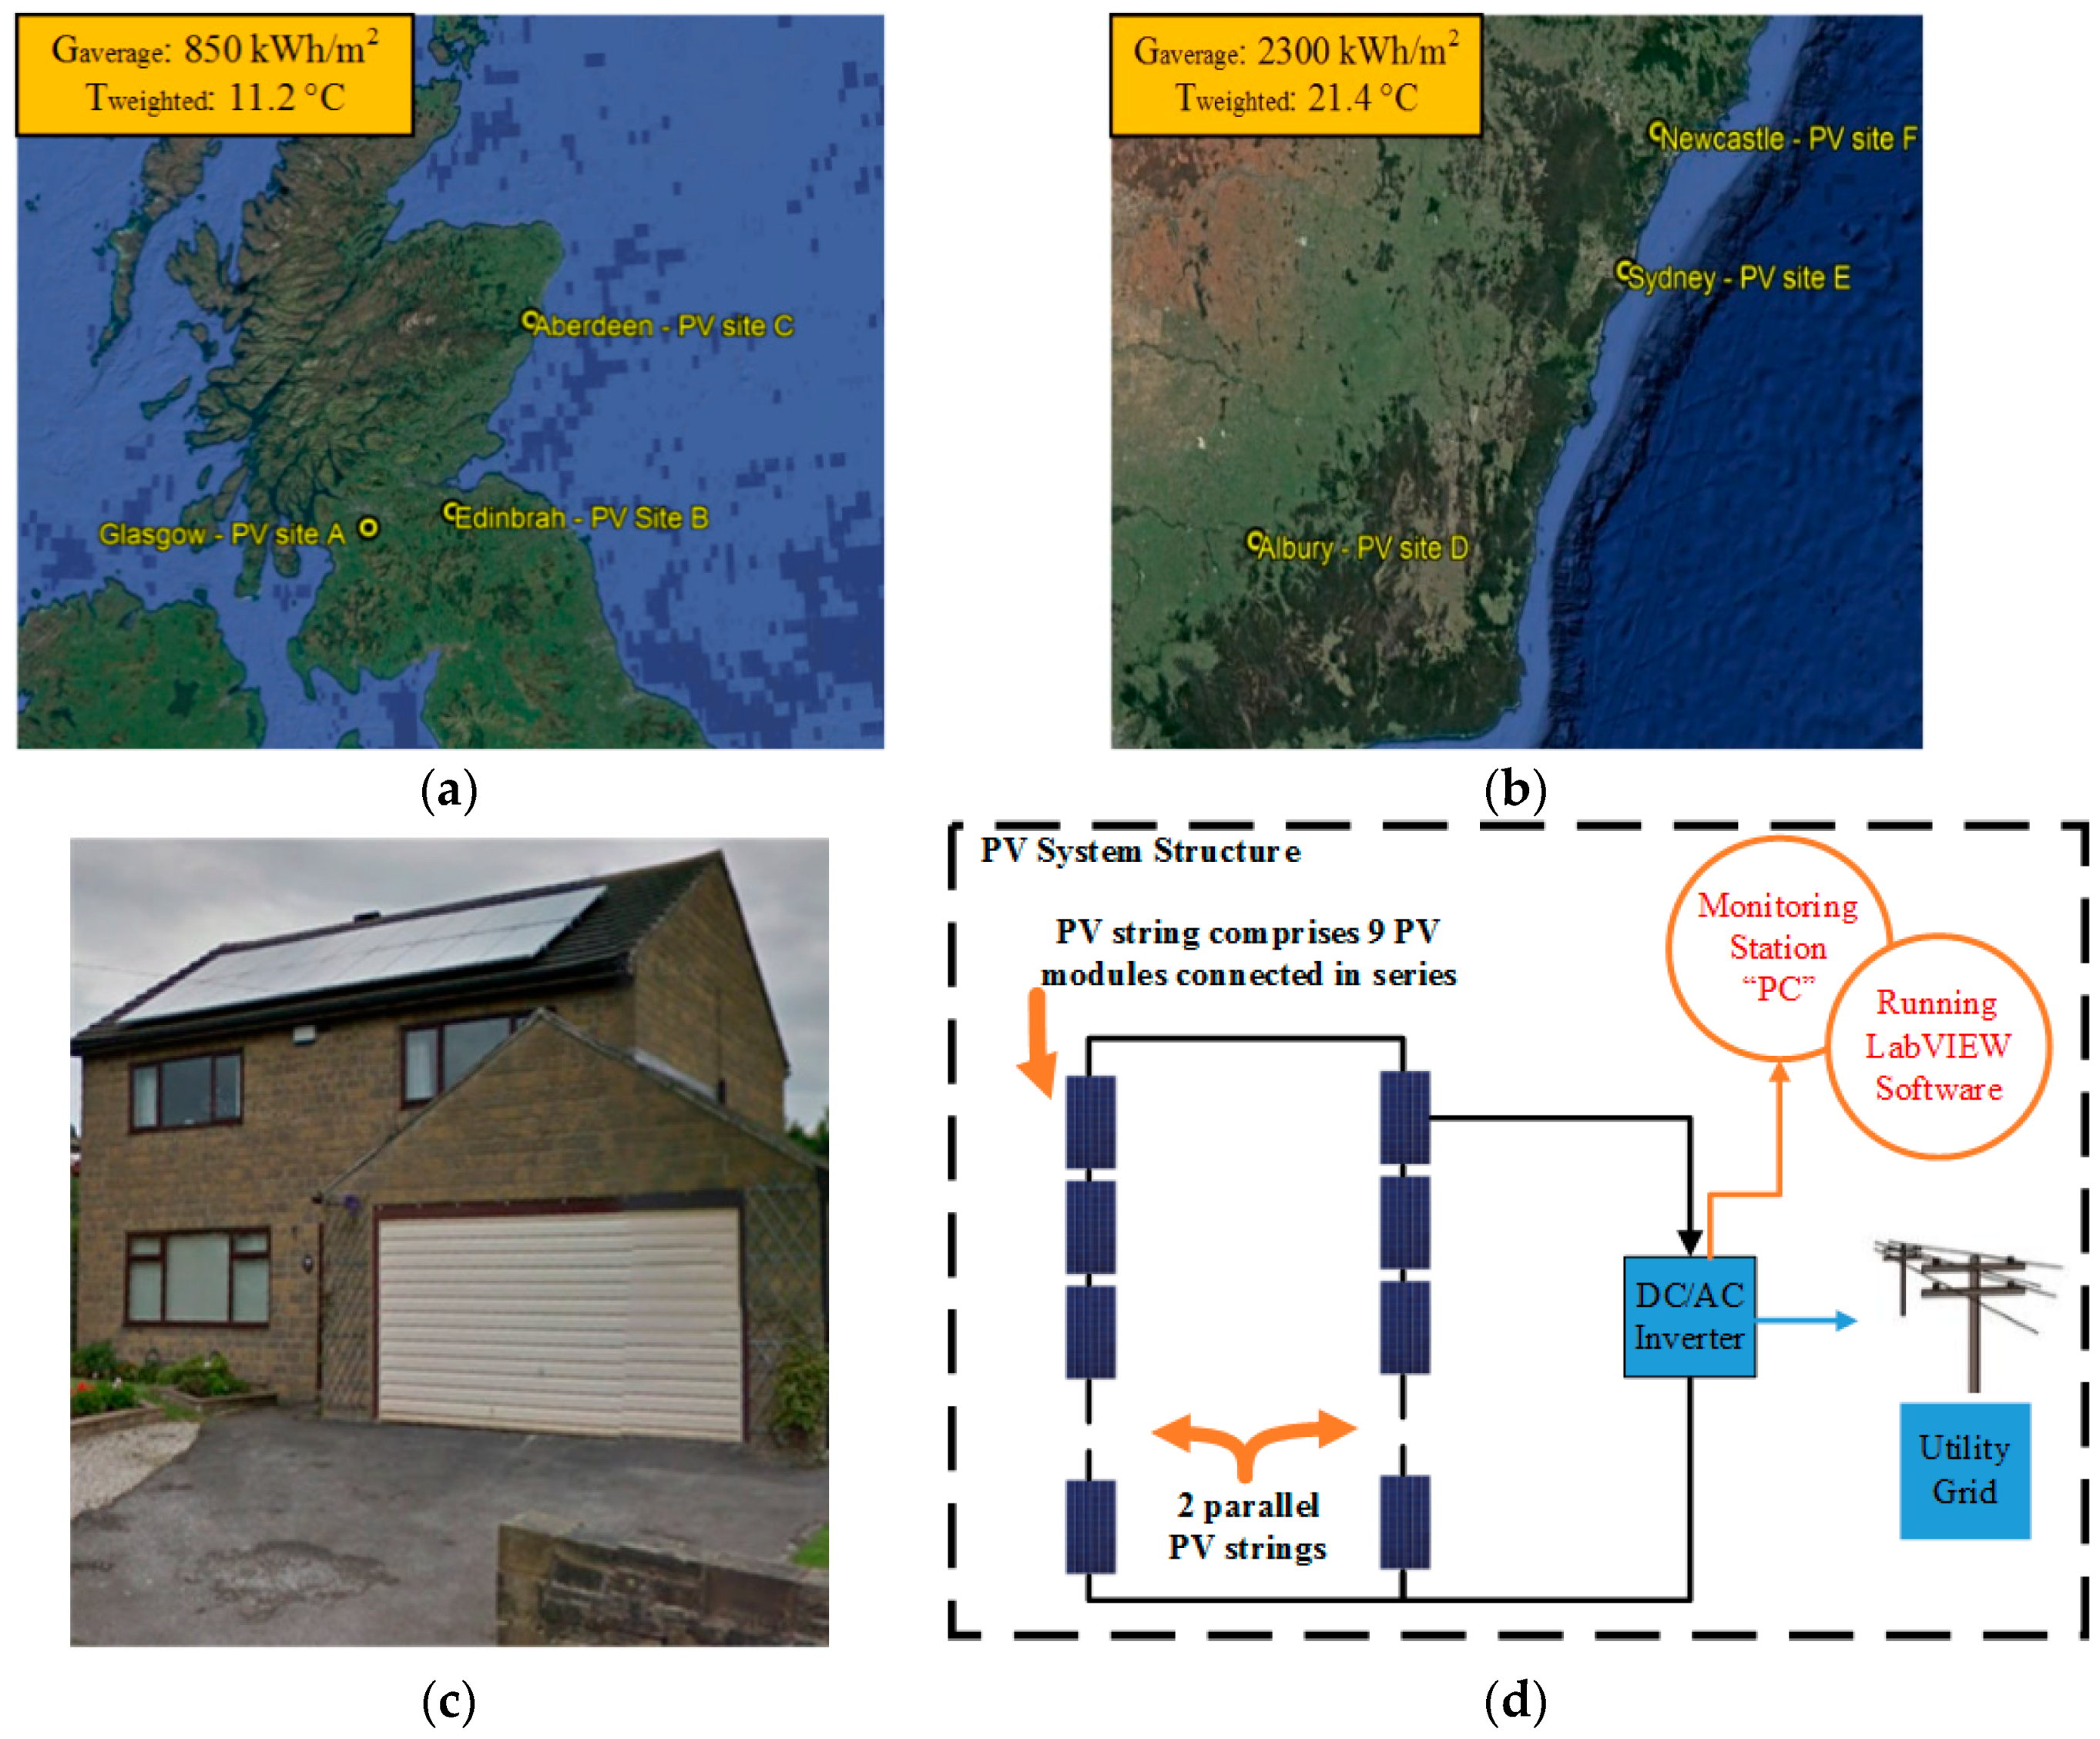
Figure 1. Examined photovoltaic (PV) systems: (a) geographical distribution of the examined PV systems located in the United Kingdom including the average irradiance and weighted temperature over the last 30 years; (b) geographical distribution of the examined PV systems located in the Australia including the average irradiance and weighted temperature over the last 30 years; (c) real picture of the examined PV system installed in Glasgow site—PV site A; (d) PV sites configurations, comprising two parallel PV strings, each consisting of nine series connected PV modules.
Electronics 09 00650 g001
Figure 2. Example of the year-on-year (YOY) degradation process: (a) data filtration; (b) daily aggregation procedure; (c) the result of the degradation rate.
Electronics 09 00650 g002
Figure 3. Normalized energy and annual degradation of the examined PV systems in the UK: (a) PV site A—Glasgow; (b) PV site B—Edinburgh; (c) PV site C—Aberdeen.
Electronics 09 00650 g003
Figure 4. Hot spots captured in three different PV modules in the PV site C (Aberdeen PV site).
Electronics 09 00650 g004
Figure 5. Degradation rate analysis per PV array for PV systems installed in Aberdeen: (a) first PV array annual degradation rate −0.97%/year; (b) second PV array “affected by three hot-spotted PV modules” annual degradation rate of −1.35%/year.
Electronics 09 00650 g005
Figure 6. Normalized energy and annual degradation of the examined PV systems in Australia: (a) PV site D—Albury; (b) PV site E—Sydney; (c) PV site F—Newcastle.
Electronics 09 00650 g006
Figure 7. Impact of high ambient temperature and solar radiation on the examined PV sites in Australia, images were taken using FLIR E4 thermal imaging camera: (a) faulty bypass diode in a PV string increasing the temperature of the PV string by 7.9 °C; (b) faulty bypass diode in a PV string increasing the temperature of the PV string by 9.1 °C; (c) PV hot spots found in a PV module in site F (Newcastle, Australia); (d) more PV hot spots found in a different PV module in PV site F.
Electronics 09 00650 g007
Figure 8. Analysis of the hot-spots and annual degradation rate in the Australian PV installations: (a) two PV modules affected by faulty bypass diodes in the second PV array—found in Albury PV system; (b) PV array 1 is affected by five hot-spotted PV modules, while PV array 2 is affected by one hot-spotted PV module—found in Newcastle PV system; (c) Albury PV site annual degradation rate; (d) Newcastle PV site annual degradation rate.
Electronics 09 00650 g008aElectronics 09 00650 g008b
Figure 9. Monthly performance ratio analysis for all examined PV systems for a period of 10 years: (a) UK PV sites; (b) Australian PV sites.
Electronics 09 00650 g009
Table 1. PV modules electrical parameters.
PV Module ParameterValue
PV peak power220 W
One PV cell peak power3.6 W
Voltage at maximum power point (Vmpp)28.7 V
Current at maximum power point (Impp)7.67 A
Open Circuit Voltage (Voc)36.74 V
Short Circuit Current (Isc)8.24 A