Pattern Recognition Techniques for the Identification of Activities of Daily Living Using a Mobile Device Accelerometer

 , ,
, ,  ,
, 

 ,
,  and
and
Abstract
1. Introduction
2. Related Work
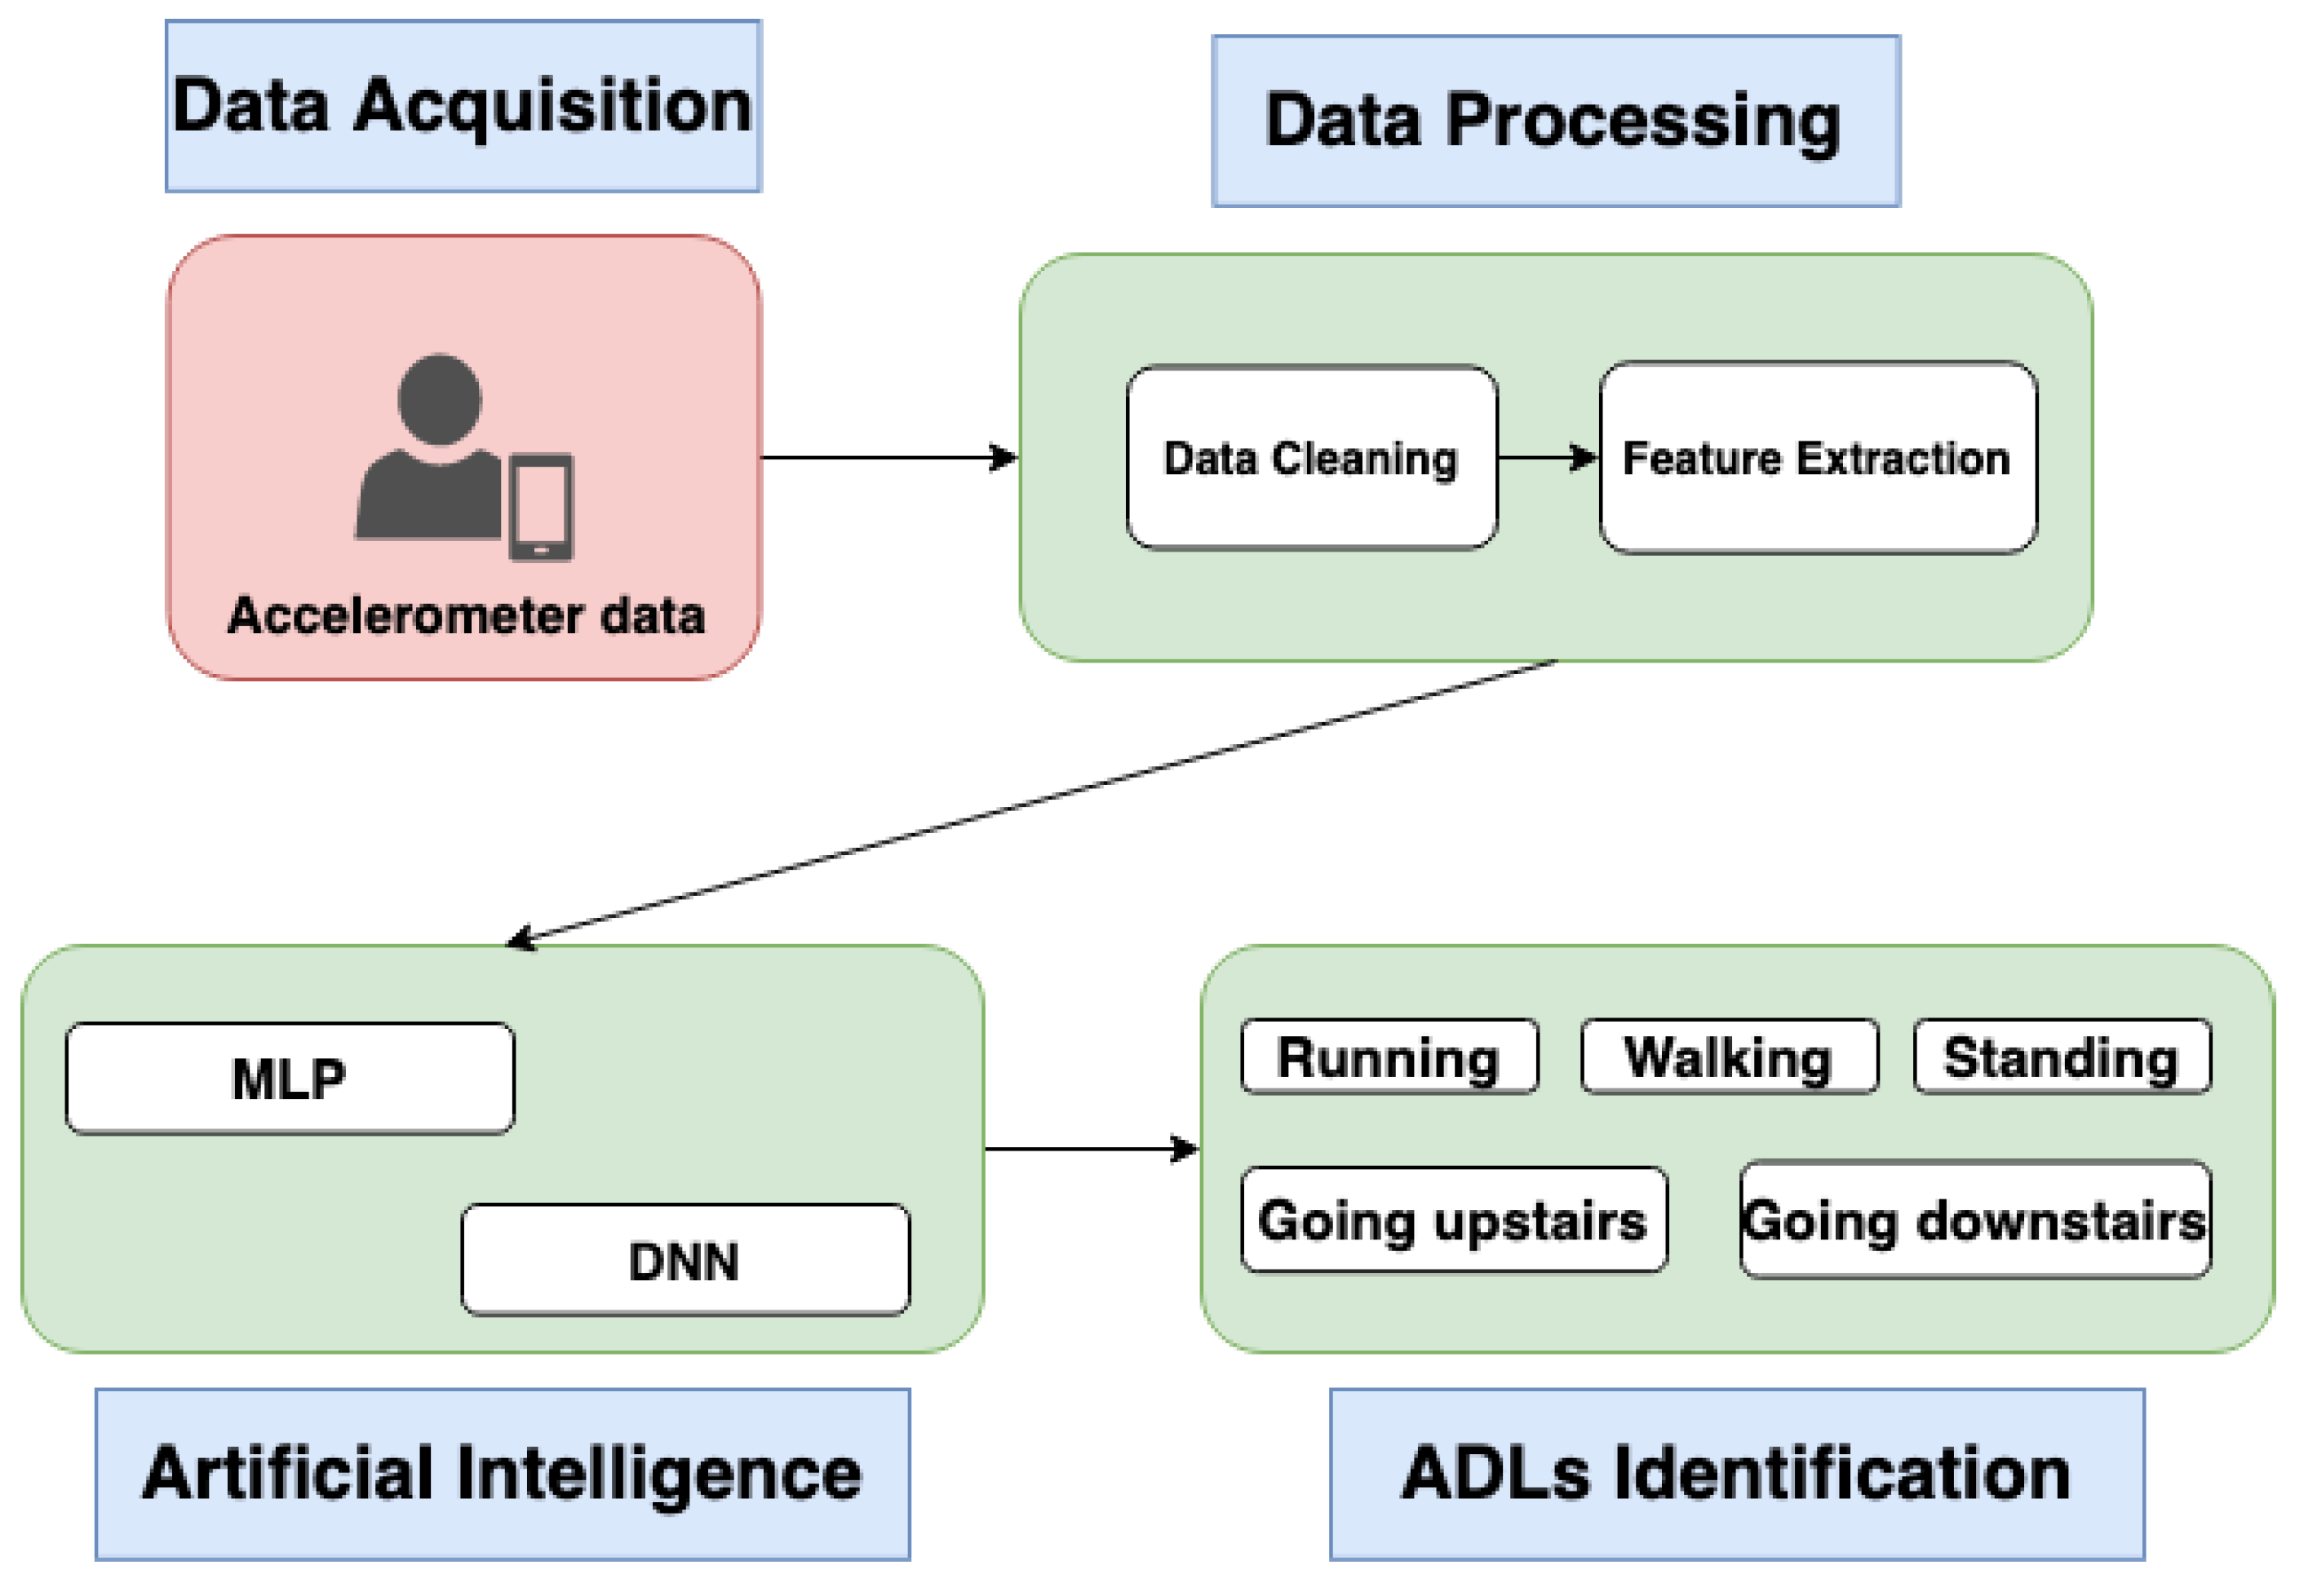
3. Methods
3.1. Data Acquisition
3.2. Data Processing
3.3. Data Classification
4. Results and Discussion
5. Conclusions
Author Contributions
Funding
Acknowledgments
Conflicts of Interest
References
- Salazar, L.H.A.; Lacerda, T.; Nunes, J.V.; von Wangenheim, C.G. A systematic literature review on usability heuristics for mobile phones. Int. J. Mob. Hum. Comput. Interact. (IJMHCI) 2013, 5, 50–61. [Google Scholar] [CrossRef]
- Marques, G. Ambient Assisted Living and Internet of Things. In Harnessing the Internet of Everything (IoE) for Accelerated Innovation Opportunities; IGI Global: Hershey, PA, USA, 2019; p. 100. [Google Scholar] [CrossRef]
- Pedretti, L.W.; Early, M.B. Occupational Therapy: Practice Skills for Physical Dysfunction; Mosby: St. Louis, MO, USA, 2001. [Google Scholar]
- Garcia, N.M. A roadmap to the design of a personal digital life coach. In International Conference on ICT Innovations; Springer: Berlin, Germany, 2015; pp. 21–27. [Google Scholar]
- Pires, I.M.; Garcia, N.M.; Pombo, N.; Flórez-Revuelta, F. From Data Acquisition to Data Fusion: A Comprehensive Review and a Roadmap for the Identification of Activities of Daily Living Using Mobile Devices. Sensors 2016, 16, 184. [Google Scholar] [CrossRef] [PubMed]
- Pires, I.M.; Garcia, N.M.; Flórez-Revuelta, F. Multi-sensor data fusion techniques for the identification of activities of daily living using mobile devices. In Proc European Conf. on Machine Learning and Principles and Practice of Knowledge Discovery in Databases - ECML/PKDD; CEUR: Porto, Portugal, 2015. [Google Scholar]
- Pires, I.M.; Garcia, N.M.; Pombo, N.; Flórez-Revuelta, F. Identification of Activities of Daily Living Using Sensors Available in off-the-shelf Mobile Devices: Research and Hypothesis. In Ambient Intelligence—Software and Applications—7th International Symposium on Ambient Intelligence (ISAmI 2016); Lindgren, H., De Paz, J.F., Novais, P., Fernández-Caballero, A., Yoe, H., Jiménez Ramírez, A., Villarrubia, G., Eds.; Springer International Publishing: Cham, Switzerland, 2016; pp. 121–130. [Google Scholar]
- Marques, G.; Pitarma, R.; Garcia, N.M.; Pombo, N. Internet of Things Architectures, Technologies, Applications, Challenges, and Future Directions for Enhanced Living Environments and Healthcare Systems: A Review. Electronics 2019, 8, 81. [Google Scholar] [CrossRef]
- Akhoundi, M.A.A.; Valavi, E. Multi-sensor fuzzy data fusion using sensors with different characteristics. arXiv 2010, arXiv:1010.6096. [Google Scholar]
- Banos, O.; Damas, M.; Pomares, H.; Rojas, I. On the Use of Sensor Fusion to Reduce the Impact of Rotational and Additive Noise in Human Activity Recognition. Sensors 2012, 12, 8039–8054. [Google Scholar] [CrossRef] [PubMed]
- Dernbach, S.; Das, B.; Krishnan, N.C.; Thomas, B.L.; Cook, D.J. Simple and Complex Activity Recognition through Smart Phones. In Proceedings of the 2012 Eighth International Conference on Intelligent Environments, Guanajuato, Mexico, 26–29 June 2012; pp. 214–221. [Google Scholar] [CrossRef]
- Hsu, Y.; Chen, K.; Yang, J.; Jaw, F. Smartphone-based fall detection algorithm using feature extraction. In Proceedings of the 2016 9th International Congress on Image and Signal Processing, BioMedical Engineering and Informatics (CISP-BMEI), Datong, China, 15–17 October 2016; pp. 1535–1540. [Google Scholar] [CrossRef]
- Paul, P.; George, T. An effective approach for human activity recognition on smartphone. In Proceedings of the 2015 IEEE International Conference on Engineering and Technology (ICETECH), Coimbatore, India, 20 March 2015; pp. 1–3. [Google Scholar] [CrossRef]
- Shen, C.; Chen, Y.; Yang, G. On motion-sensor behavior analysis for human-activity recognition via smartphones. In Proceedings of the 2016 IEEE International Conference on Identity, Security and Behavior Analysis (ISBA), Sendai, Japan, 29 February–2 March 2016; pp. 1–6. [Google Scholar] [CrossRef]
- Doya, K.; Wang, D. Exciting Time for Neural Networks. Neural Netw. 2015, 61, xv–xvi. [Google Scholar] [CrossRef]
- Wang, D. Pattern recognition: Neural networks in perspective. IEEE Expert 1993, 8, 52–60. [Google Scholar] [CrossRef]
- Neuroph. 2019. Available online: http://neuroph.sourceforge.net/ (accessed on 20 March 2019).
- Encog. 2017. Available online: http://www.heatonresearch.com/encog/ (accessed on 20 March 2019).
- Deeplearning4j. 2019. Available online: https://deeplearning4j.org/ (accessed on 20 March 2019).
- Pires, I.M.; Garcia, N.M.; Pombo, N.; Flórez-Revuelta, F.; Spinsante, S.; Teixeira, M.C. Identification of activities of daily living through data fusion on motion and magnetic sensors embedded on mobile devices. Pervasive Mob. Comput. 2018, 47, 78–93. [Google Scholar] [CrossRef]
- Zdravevski, E.; Lameski, P.; Trajkovik, V.; Kulakov, A.; Chorbev, I.; Goleva, R.; Pombo, N.; Garcia, N. Improving Activity Recognition Accuracy in Ambient-Assisted Living Systems by Automated Feature Engineering. IEEE Access 2017, 5, 5262–5280. [Google Scholar] [CrossRef]
- Gadebe, M.L.; Kogeda, O.P.; Ojo, S.O. Personalized Real Time Human Activity Recognition. In Proceedings of the 2018 5th International Conference on Soft Computing Machine Intelligence (ISCMI), Nairobi, Kenya, 21–22 November 2018; pp. 147–154. [Google Scholar] [CrossRef]
- Naved, M.M.A.; Uddin, M.Y.S. Adaptive Notifications Generation for Smartphone Users Based on their Physical Activities. In Proceedings of the 2018 5th International Conference on Networking, Systems and Security (NSysS), Dhaka, Bangladesh, 18–20 December 2018; pp. 1–9. [Google Scholar] [CrossRef]
- RoyChowdhury, I.; Saha, J.; Chowdhury, C. Detailed Activity Recognition with Smartphones. In Proceedings of the 2018 Fifth International Conference on Emerging Applications of Information Technology (EAIT), Kolkata, India, 12–13 January 2018; pp. 1–4. [Google Scholar] [CrossRef]
- Sukor, A.S.A.; Zakaria, A.; Rahim, N.A. Activity recognition using accelerometer sensor and machine learning classifiers. In Proceedings of the 2018 IEEE 14th International Colloquium on Signal Processing Its Applications (CSPA), Batu Feringghi, Malaysia, 9–10 March 2018; pp. 233–238. [Google Scholar] [CrossRef]
- Yan, N.; Chen, J.; Yu, T. A Feature Set for the Similar Activity Recognition Using Smartphone. In Proceedings of the 2018 10th International Conference on Wireless Communications and Signal Processing (WCSP), Hangzhou, China, 18–20 October 2018; pp. 1–6. [Google Scholar] [CrossRef]
- Lavanya, B.; Gayathri, G.S. Exploration and Deduction of Sensor-Based Human Activity Recognition System of Smart-Phone Data. In Proceedings of the 2017 IEEE International Conference on Computational Intelligence and Computing Research (ICCIC), Coimbatore, India, 14–16 December 2017; pp. 1–5. [Google Scholar] [CrossRef]
- Li, G.; Huang, L.; Xu, H. iWalk: Let Your Smartphone Remember You. In Proceedings of the 2017 4th International Conference on Information Science and Control Engineering (ICISCE), Changsha, China, 21–23 July 2017; pp. 414–418. [Google Scholar] [CrossRef]
- Tsinganos, P.; Skodras, A. A smartphone-based fall detection system for the elderly. In Proceedings of the 10th International Symposium on Image and Signal Processing and Analysis, Ljubljana, Slovenia, 18–20 September 2017; pp. 53–58. [Google Scholar] [CrossRef]
- Wannenburg, J.; Malekian, R. Physical Activity Recognition From Smartphone Accelerometer Data for User Context Awareness Sensing. IEEE Trans. Syst. Man, Cybern. Syst. 2017, 47, 3142–3149. [Google Scholar] [CrossRef]
- Cardoso, N.; Madureira, J.; Pereira, N. Smartphone-based transport mode detection for elderly care. In Proceedings of the 2016 IEEE 18th International Conference on e-Health Networking, Applications and Services (Healthcom), Munich, Germany, 14–17 September 2016; pp. 1–6. [Google Scholar] [CrossRef]
- Dangu Elu Beily, M.; Badjowawo, M.D.; Bekak, D.O.; Dana, S. A sensor based on recognition activities using smartphone. In Proceedings of the 2016 International Seminar on Intelligent Technology and Its Applications (ISITIA), Lombok, Indonesia, 28–30 June 2016; pp. 393–398. [Google Scholar] [CrossRef]
- Sen, S.; Rachuri, K.K.; Mukherji, A.; Misra, A. Did you take a break today? Detecting playing foosball using your smartwatch. In Proceedings of the 2016 IEEE International Conference on Pervasive Computing and Communication Workshops (PerCom Workshops), Sydney, Australia, 14–18 March 2016; pp. 1–6. [Google Scholar] [CrossRef]
- Weiss, G.M.; Lockhart, J.W.; Pulickal, T.T.; McHugh, P.T.; Ronan, I.H.; Timko, J.L. Actitracker: A Smartphone-Based Activity Recognition System for Improving Health and Well-Being. In Proceedings of the 2016 IEEE International Conference on Data Science and Advanced Analytics (DSAA), Montreal, QC, Canada, 17–19 October 2016; pp. 682–688. [Google Scholar] [CrossRef]
- Wang, C.; Xu, Y.; Zhang, J.; Yu, W. SW-HMM: A Method for Evaluating Confidence of Smartphone-Based Activity Recognition. In Proceedings of the 2016 IEEE Trustcom/BigDataSE/ISPA, Tianjin, China, 23–26 August 2016; pp. 2086–2091. [Google Scholar] [CrossRef]
- Guo, H.; Chen, L.; Chen, G.; Lv, M. An Interpretable Orientation and Placement Invariant Approach for Smartphone Based Activity Recognition. In Proceedings of the 2015 IEEE 12th Intl Conf on Ubiquitous Intelligence and Computing and 2015 IEEE 12th Intl Conf on Autonomic and Trusted Computing and 2015 IEEE 15th Intl Conf on Scalable Computing and Communications and Its Associated Workshops (UIC-ATC-ScalCom), Beijing, China, 10–14 August 2015; pp. 143–150. [Google Scholar] [CrossRef]
- Kim, Y.; Kang, B.; Kim, D. Hidden Markov Model Ensemble for Activity Recognition Using Tri-Axis Accelerometer. In Proceedings of the 2015 IEEE International Conference on Systems, Man, and Cybernetics, Hong Kong, China, 9–12 October 2015; pp. 3036–3041. [Google Scholar] [CrossRef]
- Kwon, Y.; Kang, K.; Bae, C. Analysis and evaluation of smartphone-based human activity recognition using a neural network approach. In Proceedings of the 2015 International Joint Conference on Neural Networks (IJCNN), Killarney, Ireland, 12–16 July 2015; pp. 1–5. [Google Scholar] [CrossRef]
- Ling, Y.; Wang, H. Unsupervised Human Activity Segmentation Applying Smartphone Sensor for Healthcare. In Proceedings of the 2015 IEEE 12th Intl Conf on Ubiquitous Intelligence and Computing and 2015 IEEE 12th Intl Conf on Autonomic and Trusted Computing and 2015 IEEE 15th Intl Conf on Scalable Computing and Communications and Its Associated Workshops (UIC-ATC-ScalCom), Beijing, China, 10–14 August 2015; pp. 1730–1734. [Google Scholar] [CrossRef]
- Torres-Huitzil, C.; Nuno-Maganda, M. Robust smartphone-based human activity recognition using a tri-axial accelerometer. In Proceedings of the 2015 IEEE 6th Latin American Symposium on Circuits Systems (LASCAS), Montevideo, Uruguay, 24–27 February 2015; pp. 1–4. [Google Scholar] [CrossRef]
- Wang, C.; Zhang, W. Activity Recognition Based on Smartphone and Dual-Tree Complex Wavelet Transform. In Proceedings of the 2015 8th International Symposium on Computational Intelligence and Design (ISCID), Hangzhou, China, 12–13 December 2015; Volume 2, pp. 267–270. [Google Scholar] [CrossRef]
- Zainudin, M.N.S.; Sulaiman, M.N.; Mustapha, N.; Perumal, T. Activity recognition based on accelerometer sensor using combinational classifiers. In Proceedings of the 2015 IEEE Conference on Open Systems (ICOS), Bandar Melaka, Malaysia, 24–26 August 2015; pp. 68–73. [Google Scholar] [CrossRef]
- Zhang, L.; Wu, X.; Luo, D. Real-Time Activity Recognition on Smartphones Using Deep Neural Networks. In Proceedings of the 2015 IEEE 12th Intl Conf on Ubiquitous Intelligence and Computing and 2015 IEEE 12th Intl Conf on Autonomic and Trusted Computing and 2015 IEEE 15th Intl Conf on Scalable Computing and Communications and Its Associated Workshops (UIC-ATC-ScalCom), Beijing, China, 10–14 August 2015; pp. 1236–1242. [Google Scholar] [CrossRef]
- Aguiar, B.; Silva, J.; Rocha, T.; Carneiro, S.; Sousa, I. Monitoring physical activity and energy expenditure with smartphones. In Proceedings of the IEEE-EMBS International Conference on Biomedical and Health Informatics (BHI), Hong Kong, China, 5–7 January 2014; pp. 664–667. [Google Scholar] [CrossRef]
- Fahim, M.; Lee, S.; Yoon, Y. SUPAR: Smartphone as a ubiquitous physical activity recognizer for u-healthcare services. In Proceedings of the 2014 36th Annual International Conference of the IEEE Engineering in Medicine and Biology Society, Chicago, IL, USA, 26–30 August 2014; pp. 3666–3669. [Google Scholar] [CrossRef]
- Khalifa, S.; Hassan, M.; Seneviratne, A. Feature selection for floor-changing activity recognition in multi-floor pedestrian navigation. In Proceedings of the 2014 Seventh International Conference on Mobile Computing and Ubiquitous Networking (ICMU), Singapore, 6–8 January 2014; pp. 1–6. [Google Scholar] [CrossRef]
- Duarte, F.; Lourenço, A.; Abrantes, A. Activity classification using a smartphone. In Proceedings of the 2013 IEEE 15th International Conference on e-Health Networking, Applications and Services (Healthcom 2013), Lisbon, Portugal, 9–12 October 2013; pp. 549–553. [Google Scholar] [CrossRef]
- Fan, L.; Wang, Z.; Wang, H. Human Activity Recognition Model Based on Decision Tree. In Proceedings of the 2013 International Conference on Advanced Cloud and Big Data, Nanjing, China, 13–15 December 2013; pp. 64–68. [Google Scholar] [CrossRef]
- Lau, S.L. Comparison of orientation-independent-based-independent-based movement recognition system using classification algorithms. In Proceedings of the 2013 IEEE Symposium on Wireless Technology Applications (ISWTA), Kuching, Malaysia, 22–25 September 2013; pp. 322–326. [Google Scholar] [CrossRef]
- Mitchell, E.; Monaghan, D.; O’Connor, N.E. Classification of Sporting Activities Using Smartphone Accelerometers. Sensors 2013, 13, 5317–5337. [Google Scholar] [CrossRef] [PubMed]
- Oshin, T.O.; Poslad, S. ERSP: An Energy-Efficient Real-Time Smartphone Pedometer. In Proceedings of the 2013 IEEE International Conference on Systems, Man, and Cybernetics, Manchester, UK, 13–16 October 2013; pp. 2067–2072. [Google Scholar] [CrossRef]
- Bujari, A.; Licar, B.; Palazzi, C.E. Movement pattern recognition through smartphone’s accelerometer. In Proceedings of the 2012 IEEE Consumer Communications and Networking Conference (CCNC), Las Vegas, NV, USA, 14–17 January 2012; pp. 502–506. [Google Scholar] [CrossRef]
- Kwapisz, J.R.; Weiss, G.M.; Moore, S.A. Activity Recognition Using Cell Phone Accelerometers. SIGKDD Explor. Newsl. 2011, 12, 74–82. [Google Scholar] [CrossRef]
- Lau, S.L.; David, K. Movement recognition using the accelerometer in smartphones. In Proceedings of the 2010 Future Network Mobile Summit, Florence, Italy, 16–18 June 2010; pp. 1–9. [Google Scholar]
- Lau, S.L.; König, I.; David, K.; Parandian, B.; Carius-Düssel, C.; Schultz, M. Supporting patient monitoring using activity recognition with a smartphone. In Proceedings of the 2010 7th International Symposium on Wireless Communication Systems, York, UK, 19–22 September 2010; pp. 810–814. [Google Scholar] [CrossRef]
- Stenneth, L.; Wolfson, O.; Yu, P.S.; Xu, B. Transportation mode detection using mobile phones and GIS information. In Proceedings of the 19th ACM SIGSPATIAL international conference on advances in geographic information systems, Chicago, IL, USA, 1–4 November 2011; pp. 54–63. [Google Scholar]
- Borazio, M.; Van Laerhoven, K. Using time use with mobile sensor data: A road to practical mobile activity recognition? In Proceedings of the 12th International Conference on Mobile and Ubiquitous Multimedia, Lulea, Sweden, 2–5 December 2013; pp. 1–10. [Google Scholar]
- Hong, J.H.; Ramos, J.; Shin, C.; Dey, A.K. An activity recognition system for ambient assisted living environments. In International Competition on Evaluating AAL Systems Through Competitive Benchmarking; Springer: Berlin, Germany, 2012; pp. 148–158. [Google Scholar]
- Ignatov, A.D.; Strijov, V.V. Human activity recognition using quasiperiodic time series collected from a single tri-axial accelerometer. Multimed. Tools Appl. 2016, 75, 7257–7270. [Google Scholar] [CrossRef]
- Khan, A.M.; Siddiqi, M.H.; Lee, S.W. Exploratory data analysis of acceleration signals to select light-weight and accurate features for real-time activity recognition on smartphones. Sensors 2013, 13, 13099–13122. [Google Scholar] [CrossRef] [PubMed]
- Pereira, J.D.; da Silva e Silva, F.J.; Coutinho, L.R.; de Tácio Pereira Gomes, B.; Endler, M. A movement activity recognition pervasive system for patient monitoring in ambient assisted living. In Proceedings of the 31st Annual ACM Symposium on Applied Computing, Pisa, Italy, 4–8 April 2016; pp. 155–161. [Google Scholar]
- Torres-Huitzil, C.; Alvarez-Landero, A. Accelerometer-based human activity recognition in smartphones for healthcare services. In Mobile Health; Springer: Berlin, Germany, 2015; pp. 147–169. [Google Scholar]
- Tao, D.; Wen, Y.; Hong, R. Multicolumn bidirectional long short-term memory for mobile devices-based human activity recognition. IEEE Internet Things J. 2016, 3, 1124–1134. [Google Scholar] [CrossRef]
- Zdravevski, E.; Risteska Stojkoska, B.; Standl, M.; Schulz, H. Automatic machine-learning based identification of jogging periods from accelerometer measurements of adolescents under field conditions. PLoS ONE 2017, 12, e0184216. [Google Scholar] [CrossRef] [PubMed]
- Github. Impires/August_2017-_Multi-Sensor_Data_Fusion_in_Mobile_Devices_for_the_Identification_of_Activities_of_Dail. 2018. Available online: https://github.com/impires/August_2017-_Multi-sensor_data_fusion_in_mobile_devices_for_the_identification_of_activities_of_dail (accessed on 20 March 2019).
- BQ. Smartphones BQ Aquaris | BQ Portugal. 2019. Available online: https://www.bq.com/pt/smartphones (accessed on 20 March 2019).
- Graizer, V. Effect of low-pass filtering and re-sampling on spectral and peak ground acceleration in strong-motion records. In Proceedings of the 15th World Conference of Earthquake Engineering, Lisbon, Portugal, 24–28 September 2012; pp. 24–28. [Google Scholar]
- Lameski, P.; Zdravevski, E.; Koceski, S.; Kulakov, A.; Trajkovik, V. Suppression of Intensive Care Unit False Alarms Based on the Arterial Blood Pressure Signal. IEEE Access 2017, 5, 5829–5836. [Google Scholar] [CrossRef]
- Hajela, P.; Berke, L. Neural networks in structural analysis and design: An overview. Comput. Syst. Eng. 1992, 3, 525–538. [Google Scholar] [CrossRef]
- prateekvjoshi. Understanding Xavier Initialization in Deep Neural Networks. 2016. Available online: https://prateekvjoshi.com/2016/03/29/understanding-xavier-initialization-in-deep-neural-networks/ (accessed on 20 March 2019).
- Ng, A.Y. Feature Selection, L1 vs. L2 Regularization, and Rotational Invariance. In ICML ’04, Proceedings of the Twenty-first International Conference on Machine Learning, Banff, AB, Canada, 4–8 July 2004; ACM: New York, NY, USA, 2004; p. 78. [Google Scholar] [CrossRef]
- Pires, I.M.; Garcia, N.M.; Pombo, N.; Flórez-Revuelta, F. Limitations of the Use of Mobile Devices and Smart Environments for the Monitoring of Ageing People. In Proceedings of the 4th International Conference on Information and Communication Technologies for Ageing Well and e-Health-Volume 1: HSP; Science and Technology Publications: Setúbal, Portugal, 2018; pp. 269–275, ISBN 978-989-758-299-8. [Google Scholar] [CrossRef]


| Study | Number of ADLs | ADLs Recognized | Features | Proposed Methods and Accuracy | Device Location |
|---|---|---|---|---|---|
| [22] | 8 | Standing; Sitting; Laying; Walking; Walking upstairs; Walking downstairs; Running; Nordic walking | Standard deviation; mean; maximum; minimum | 73% (Majority Vote Naïve Bayes Nearest Neighbor algorithm (MVNBNN)) | Smartphone located in trouser front pocket |
| [23] | 3 | Walking; running; walking upstairs | Mean; standard deviation; euclidean norm of mean; euclidean norm of the standard deviation; correlation values; 25th and 75th percentile values; frequency; amplitude; peak frequency; number of peak values | 95% (KNN); 89% (Random Forest); 99% (SVM) | Smartphone in a pouch and located around waist |
| [24] | 3 | Slow walk; brisk walk; sitting | Mean; standard deviation; variance | 90.9% (SVM) | Smartphone located in trouser front pocket |
| [25] | 6 | Standing; Sitting; Lying; Walking Upstairs; Walking Downstairs; Walking | Minimum; Maximum; Mean; Standard Deviation; SMA; Signal Vector Magnitude; Tilt Angle; Power Spectral Density (PSD); Signal Entropy; Spectral Energy | 93.52% (Decision Tree); 69.72% (SVM); 87.2% (MLP) | Smartphone located in trouser pocket freely chosen by the user |
| [26] | 4 | walking downstairs; walking upstairs; walking; jogging | Mean; Variance; Standard Deviation; Maximum; Minimum; Correlation Coefficient; Mean Crossing Value; Peak; Spectral Energy; Power Spectral Density; Interquartile Range; DT-CWT | 68.56% (SVM); 90.35% (Random Forest); 94.65% (MLP); 85.99% (J48 Decision Tree); 93.44% (KNN); 80.32% (Naive Bayes) | Smartphone located into the right jeans pocket |
| [27] | 6 | Sitting; standing; laying; walking; walking upstairs; walking downstairs | Mean; Standard deviation; Median absolute deviation; Maximum; Minimum; Signal magnitude area; Sum of the squares separated by the quantity of values; Interquartile range; Entropy; Autoregression coefficients; correlation coefficient; index of the frequency segment with biggest magnitude; Weighted average of the frequency segments to acquire a mean recurrence; skewness; kurtosis; Energy of a recurrence interval inside the 64 containers of the FFT of every window; Angle between two vectors | 97.77% (Decision Tree); 89.99% (KNN); 95.55% (Naive Bayes); 100% (Random Forest); 95.55% (SVM) | Smartphone located on the waist |
| [28] | 1 | Walking | Maximum; Minimum; Mean; Range; RMS; Standard Deviation; Zero Crossing Rate; Kurtosis; Spectral Slope | 97.80% (SVM); 97.64% (Random Forest); 97.64% (Logistic); 98.11% (MLP) | Smartphones located into users’ pocket freely chosen by them |
| [29] | 1 | falling | average absolute acceleration variation; impact duration; maximum; peak duration; activity level of a window that contains the impact; average acceleration of free-fall stage; number of steps; skewness; kurtosis; interquartile range; power of the impact; standard variation of the impact; square of the highest coefficient; number of peaks | 97.53% (KNN) | Not available |
| [30] | 5 | jogging; walking; sitting; laying down; standing | Mean; maximum; minimum; median; SMA; Median deviation; PCA; interquartile range | 94.32% (SVM); 98.74% (MLP); 91.10% (Naive Bayes); 99% (KNN); 98.80% (Decision Tree); 99.01% (kStar) | Smartphones located into users’ pocket freely chosen by them |
| [31] | 6 | walking; standing; travel by car; travel by bus; travel by train; travel by metro | Mean; Median; Maximum; Minimum; RMS; standard deviation; interquartile range; minimum average; maximum average; maximum peak height; average peak height; entropy; FFT spectral energy; Skewness; kurtosis | 95.6% (J48 Decision Tree); 92.4% (SMO); 61.9% (Naïve Bayes) | Smartphone in the pocket (not specified) |
| [32] | 1 | playing tennis | Mean; Variance; correlation | 98.12% (Naïve Bayes); 99.61% (MLP); 99.91% (J48 Decision Tree); 100% (SVM) | Smartphone located on forearm and in the subject front pocket |
| [33] | 1 | playing fosball | Mean; Variance; Covariance; Energy; entropy | 95% (MLP) | Smartphone located on pocket and smartwatch located on wrist |
| [34] | 7 | walking; jogging; walking upstairs; walking downstairs; standing; sitting; lying down | mean and standard deviation for each axis; bin distribution; heuristic measure of wave periodicity | 90% (Random Forest) | Smartphone located in front pants pocket |
| [35] | 5 | walking; standing; running; walking upstairs; walking downstairs | Mean; Variance; quartiles | 80% (Sliding-Window-based Hidden Markov Model (SW-HMM)) | Smartphones located on belt, right jeans pocket, right arm, and right wrist |
| [36] | 5 | running; walking; sitting; walking upstairs; walking downstairs | Mean; Variance; standard deviation; median; maximum; minimum; RMS; zero crossing rate; skewness; kurtosis; spectral entropy | 80% (SVM) | 4 smartphones located in the left upper arm, the shirt-pocket, the jeans front pocket, and the behind jeans pocket |
| [37] | 6 | walking; walking upstairs; walking downstairs; sitting; standing; laying | Mean; standard deviation | 83.55% (Hidden Markov Model Ensemble (HMME)) | Smartphone located on the waist |
| [38] | 4 | walking; running; standing; sitting | Mean; Maximum; Minimum; Median; standard deviation | 99% (MLP) | Smartphone located in the user’s pants pocket |
| [13] | 4 | walking; running; standing; sitting | Mean; Minimum; Maximum; standard deviation | 92% (Clustered KNN) | Smartphone located in the user’s jeans pocket |
| [39] | 4 | walking; running; sitting; standing | Mean; Variance; bin distribution in time and frequency domain; FFT spectral energy; correlation of the magnitude | 98.69% (Decision Tree) | Smartphone located in the user’s trousers pocket |
| [40] | 5 | standing; walking; walking upstairs; walking downstairs; running | Mean; standard deviation; percentiles | 92% (MLP) | Smartphone located at four locations: two front trousers pockets and two back trousers pockets |
| [41] | 6 | standing; sitting; walking upstairs; walking downstairs; walking; jogging | Dual-tree complex wavelet transform (DT-CWT) statistical information and orientation | 76% (Random Forest); 73.8% (Instance-based learning (IBk)); 67.4% (J48 Decision Tree); 67.4% (J-Rip) | Smartphone located in the user’s trousers pocket |
| [42] | 6 | walking downstairs; jogging; sitting; standing; walking upstairs; walking | Minimum; Maximum; Mean; standard deviation; zero crossing rate for each axis; correlation between axis | 92.4% (J48 Decision Tree); 91.7% (MLP); 84.3% (Likelihood Ratio (LR)) | Smartphone located in their front trousers leg pocket |
| [43] | 7 | walking; running; standing; sitting; lying; walking upstairs; walking downstairs | Mean; Minimum; Maximum; standard deviation | 77% (DNN) | Smarphone located in the right pant pocket |
| [44] | 5 | running; walking; standing; sitting; laying | Mean; Median; Maximum; Minimum; Root Mean Square (RMS); standard deviation; interquartile range; energy; entropy; skewness; kurtosis | 99.5% (Decision Tree) | Smartphone located in the belt or in the trousers front pocket |
| [45] | 4 | walking; running; cycling; hopping | RMS; Variance; Correlation; energy | 97.69% (SVM) | Smartphone located in the pants front pocket |
| [46] | 3 | walking upstairs; walking up on an escalator; walking on a ramp | mean, standard deviation, skewness, kurtosis, average absolute deviation, and pairwise correlation of the tree axis of accelerometer; mean of the resultant acceleration | 80.59% (Decision Tables); 82.97% (J48 Decision Tree); 87.49% (Naïve Bayes); 89.20% (KNN); 87.86% (MLP) | Smartphone located in the right or left palms in front of the body |
| [47] | 4 | walking; cycling; running; standing | Mean; standard deviation; correlation; power spectral density | 98% (Naïve Bayes); 83% (KNN); 95% (Decision Tree); 96% (SVM) | Smartphone located along the waist in the front pocket |
| [48] | 5 | standing; walking; running; walking upstairs; walking downstairs | Mean; Median; Variance; standard deviation; maximum; minimum; range; RMS; FFT coefficients; FFT spectral energy | 88.32% (Decision Tree) | Smartphone located in different positions such as in the bag, trouser pocket and hands. |
| [49] | 5 | walking; sitting; standing; walking upstairs; walking downstairs | Mean; standard deviation; variance | 92.44% (KNN); 90.77% (Decision Tree); 90.4% (rule-based learner (JRip)); 92.91% (MLP) | Smartphone located in the user’s trouser pocket |
| [50] | 6 | walking; jogging; walking upstairs; walking downstairs; sitting; standing | energy and variances of the coefficients of discrete wavelet transform (DWT) | 79.9% (Naïve Bayes); 82.3% (MLP) | Smartphone located on the upper crevice of a user’s back |
| [51] | 3 | walking; jogging; running | number of peaks; number of troughs; difference between the maximum peak and the minimum trough; sum of all peaks and troughs | 93.4% (J48 Decision Tree + Decision Table + Naïve Bayes) | Smartphone positioned on the palm, front trouser pocket, backpack, and top jacket pocket |
| [52] | 1 | walking | Mean; standard deviation | 98% (MLP) | Smarphone located in the user’s pocket |
| [53] | 6 | walking; jogging; walking upstairs; walking downstairs; sitting; standing | Mean; standard deviation; average absolute difference; average resultant acceleration; time between peaks; binned distribution | 85.1% (J48 Decision Tree); 78.1% (logistic regression); 91.7% (MLP); 37.2% (Straw Man) | Smartphone located in the user’s front pants leg pocket |
| [54] | 5 | walking; standing; sitting; walking upstairs; walking downstairs | mean, standard deviation and correlation of the raw data; energy of FFT; mean and standard deviation of the FFT components in the frequency domain | 95.62% (Bayesian Network); 97.81% (Naïve Bayes); 99.27% (KNN); 93.53% (JRip) | Smartphone located in the user’s right trouser pocket |
| [55] | 5 | walking; sitting; standing; walking upstairs; walking downstairs | Mean; standard deviation; variance; FFT energy; FFT information entropy | 91.37% (Decision Tree); 94.29% (KNN); 84.42% (SMO) | Smartphone located in the user’s trouser pocket |
| [56] | 6 | travel by car; travel by bus; travel by train; walking; travel by bike; standing | average speed; average acceleration; average bus closeness; average rail closeness; average candidate bus closeness | 91.6% (Naïve Bayes); 92.5% (Bayesian Network); 92.2% (Decision Trees); 93.7% (Random Forest); 83.3% (MLP) | Smartphone located in the user’s waist, arm, pocket, or bag |
| [57] | 11 | sleeping; eating; personal care; working; studying; household work; socializing; sports; hobbies; mass media; travel by car | average of acceleration; Mean Absolute Difference (MAD) of the acceleration | 20.76% (SVM) | Smartphone located in the user’s arm |
| [58] | 11 | walking; reading; lying down; standing; rearranging books; picking up golf or tennis balls; cycling; falling down; eating; washing hands | minimum; maximum; average; median; standard deviation; toughs and peaks of acceleration | 72% (Hybrid model) | Smartphone located in the user’s arm |
| [59] | 5 | walking; jogging; walking upstairs; walking downstairs; standing | mean value; mean absolute value; difference between maximum and minimum value; total value of absolute differences | 96% (k-NN) | Smartphone located in the user’s waist |
| [60] | 6 | standing; walking; walking upstairs; walking downstairs; running; hopping | FFT; 42-dimensional time domain features | 72.62% (Autoregressive (AR) Model) | Smartphone located in different locations: Pants’ front pocket (left), Pants’ front pocket (right), Pants’ back pocket (left), Pants’ back pocket (right) and Jacket’s inner pocket |
| [61] | 7 | running; walking upstairs, walking downstairs; walking; standing; lying down | average; median; Standard deviation | 90.2% (IBk); 88.2% (Random Florest); 85.5% (Random Tree); 88.1% (J48); 80.3% (JRip); 85.8% (RepTree); 82.9% (MLP) | Smartphone located the user’s leg and waist and wearable sensor located in the chest |
| [62] | 6 | running; walking; standing; walking upstairs; walking downstairs | standard deviation; mean; percentiles | 90.85% (Naïve Bayes); 87.35% (K-NN); 81.16% (SVM) | Smartphone is located in the front-right and the back-left pockets |
| [63] | 5 | jumping; running; walking; walking downstairs; walking upstairs | average acceleration; peaks | 83.8% (SVM); 83.4% (Empirical risk minimization (ERM)); 79.4% (K-NN); 86.8% (Bidirectional Long Short-Term Memory (BLSTM)); 89.4% (Multi-column Bidirectional Long Short-Term Memory (MBLSTM)) | Not available |
| Type of ANN | Framework | Dataset | Best Accuracy Achieved (%) | |
|---|---|---|---|---|
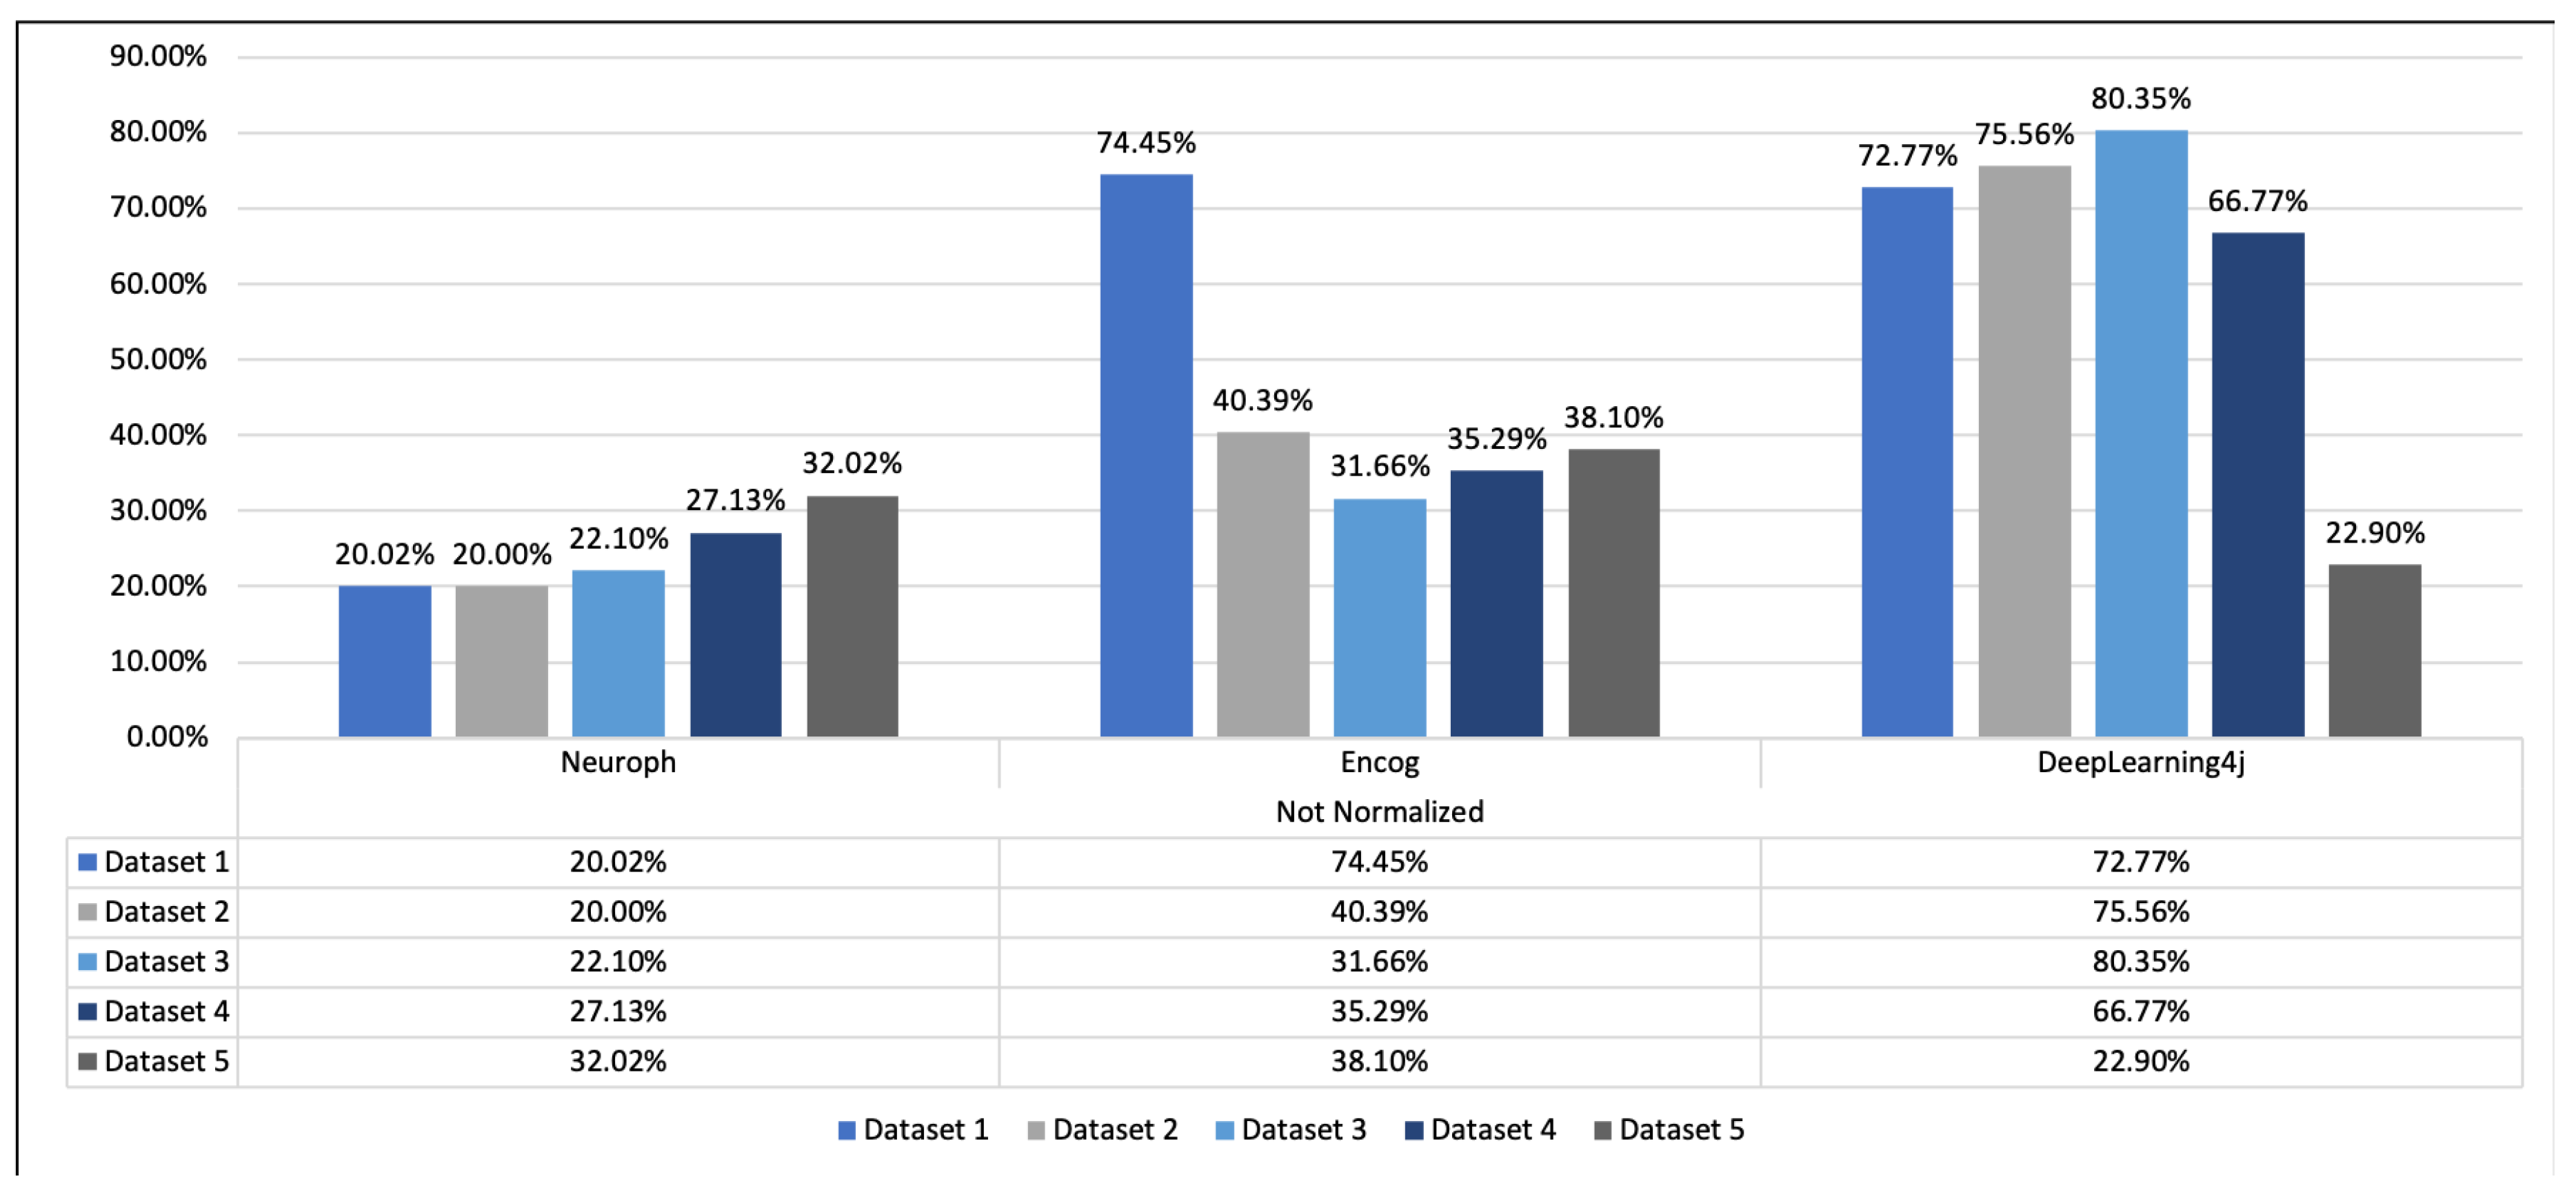
| Non-normalised data | MLP | Neuroph | 5 | 32.02 |
| Encog | 1 | 74.45 | ||
| DNN | DeepLearning4j | 5 | 80.35 | |
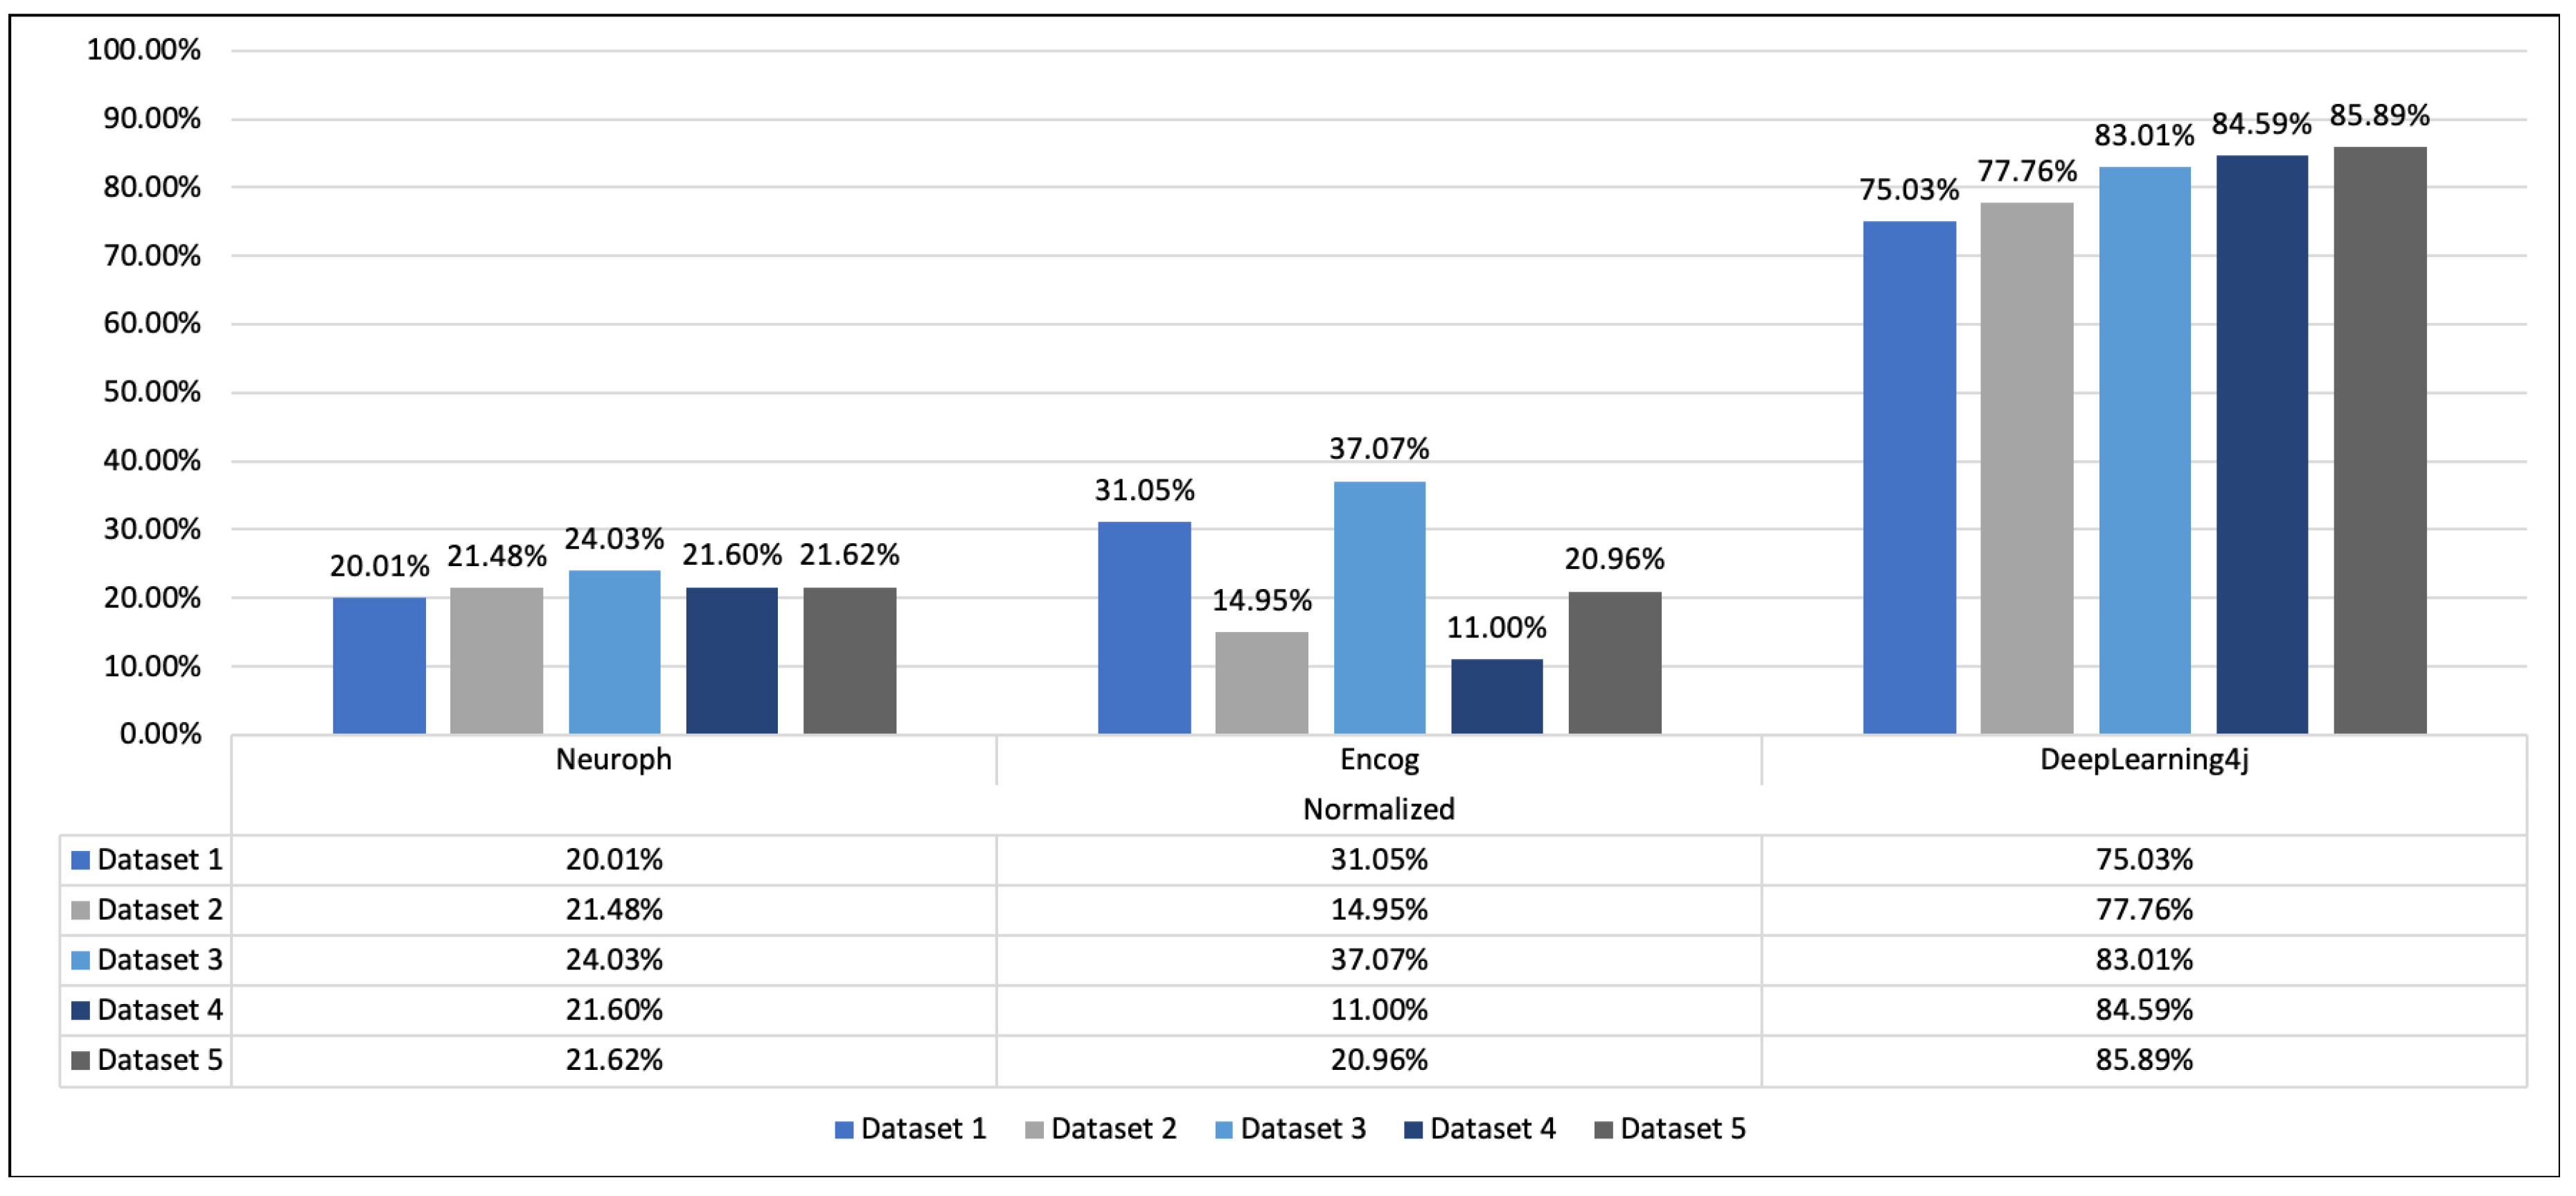
| Normalised data | MLP | Neuroph | 3 | 24.03 |
| Encog | 2 | 37.07 | ||
| DNN | DeepLearning4j | 5 | 85.89 |
| Walking Downstairs | Walking Upstairs | Running | Standing | Walking | |
|---|---|---|---|---|---|
| True Positive | 2 | 3 | 1471 | 0 | 2000 |
| True Negative | 3474 | 3473 | 2005 | 3476 | 1476 |
| False Positive | 1998 | 1997 | 529 | 2000 | 0 |
| False Negative | 4526 | 4527 | 5995 | 4524 | 6524 |
| Walking Downstairs | Walking Upstairs | Running | Standing | Walking | |
|---|---|---|---|---|---|
| True Positive | 0 | 0 | 162 | 0 | 200 |
| True Negative | 2162 | 2162 | 2000 | 2162 | 162 |
| False Positive | 2000 | 2000 | 1838 | 2000 | 0 |
| False Negative | 5838 | 5838 | 6000 | 5838 | 7838 |
| Walking Downstairs | Walking Upstairs | Running | Standing | Walking | |
|---|---|---|---|---|---|
| True Positive | 0 | 0 | 1001 | 0 | 0 |
| True Negative | 1001 | 1001 | 0 | 1001 | 1001 |
| False Positive | 2000 | 2000 | 999 | 2000 | 2000 |
| False Negative | 6999 | 6999 | 8000 | 6999 | 6999 |
| Walking Downstairs | Walking Upstairs | Running | Standing | Walking | |
|---|---|---|---|---|---|
| True Positive | 1 | 0 | 0 | 0 | 2000 |
| True Negative | 2000 | 2001 | 2001 | 2001 | 1 |
| False Positive | 1999 | 2000 | 2000 | 2000 | 0 |
| False Negative | 6000 | 5999 | 5999 | 5999 | 7999 |
| Walking Downstairs | Walking Upstairs | Running | Standing | Walking | |
|---|---|---|---|---|---|
| True Positive | 290 | 0 | 0 | 2000 | 0 |
| True Negative | 7786 | 7999 | 8000 | 506 | 7999 |
| False Positive | 214 | 1 | 0 | 7494 | 1 |
| False Negative | 1710 | 2000 | 2000 | 0 | 2000 |
| Walking Downstairs | Walking Upstairs | Running | Standing | Walking | |
|---|---|---|---|---|---|
| True Positive | 1334 | 1639 | 1909 | 1985 | 1722 |
| True Negative | 7641 | 7317 | 7978 | 7941 | 7712 |
| False Positive | 359 | 683 | 22 | 59 | 288 |
| False Negative | 666 | 361 | 91 | 15 | 278 |
© 2020 by the authors. Licensee MDPI, Basel, Switzerland. This article is an open access article distributed under the terms and conditions of the Creative Commons Attribution (CC BY) license (http://creativecommons.org/licenses/by/4.0/).
Share and Cite
Pires, I.M.; Marques, G.; Garcia, N.M.; Flórez-Revuelta, F.; Canavarro Teixeira, M.; Zdravevski, E.; Spinsante, S.; Coimbra, M. Pattern Recognition Techniques for the Identification of Activities of Daily Living Using a Mobile Device Accelerometer. Electronics 2020, 9, 509. https://doi.org/10.3390/electronics9030509
Pires IM, Marques G, Garcia NM, Flórez-Revuelta F, Canavarro Teixeira M, Zdravevski E, Spinsante S, Coimbra M. Pattern Recognition Techniques for the Identification of Activities of Daily Living Using a Mobile Device Accelerometer. Electronics. 2020; 9(3):509. https://doi.org/10.3390/electronics9030509
Chicago/Turabian StylePires, Ivan Miguel, Gonçalo Marques, Nuno M. Garcia, Francisco Flórez-Revuelta, Maria Canavarro Teixeira, Eftim Zdravevski, Susanna Spinsante, and Miguel Coimbra. 2020. "Pattern Recognition Techniques for the Identification of Activities of Daily Living Using a Mobile Device Accelerometer" Electronics 9, no. 3: 509. https://doi.org/10.3390/electronics9030509
APA StylePires, I. M., Marques, G., Garcia, N. M., Flórez-Revuelta, F., Canavarro Teixeira, M., Zdravevski, E., Spinsante, S., & Coimbra, M. (2020). Pattern Recognition Techniques for the Identification of Activities of Daily Living Using a Mobile Device Accelerometer. Electronics, 9(3), 509. https://doi.org/10.3390/electronics9030509