Article

Assessment of QoE for Video and Audio in WebRTC Applications Using Full-Reference Models

1
Department of Telematic Engineering, Universidad Carlos III de Madrid, Avenida de la Universidad 30, 28911 Leganés, Spain
2
Department of Computer Science, Computer Architecture, Computer Languages & Information Systems, Statistics & Operational Research, Universidad Rey Juan Carlos, Calle Tulipán S/N, 28933 Móstoles, Spain
3
School of Computer Science, University College Dublin, Dublin 4, Ireland
*
Author to whom correspondence should be addressed.
Electronics 2020, 9(3), 462; https://doi.org/10.3390/electronics9030462
Submission received: 11 February 2020 / Revised: 3 March 2020 / Accepted: 6 March 2020 / Published: 10 March 2020
(This article belongs to the Section Computer Science & Engineering)

Abstract

:
WebRTC is a set of standard technologies that allows exchanging video and audio in real time on the Web. As with other media-related applications, the user-perceived audiovisual quality can be estimated using Quality of Experience (QoE) measurements. This paper analyses the behavior of different objective Full-Reference (FR) models for video and audio in WebRTC applications. FR models calculate the video and audio quality by comparing some original media reference with the degraded signal. To compute these models, we have created an open-source benchmark in which different types of reference media inputs are sent browser to browser while simulating different kinds of network conditions in terms of packet loss and jitter. Our benchmark provides recording capabilities of the impairment WebRTC streams. Then, we use different existing FR metrics for video (VMAF, VIFp, SSIM, MS-SSIM, PSNR, PSNR-HVS, and PSNR-HVS-M) and audio (PESQ, ViSQOL, and POLQA) recordings together with their references. Moreover, we use the same recordings to carry out a subjective analysis in which real users rate the video and audio quality using a Mean Opinion Score (MOS). Finally, we calculate the correlations between the objective and subjective results to find the objective models that better correspond with the subjective outcome, which is considered the ground truth QoE. We find that some of the studied objective models, such as VMAF, VIFp, and POLQA, show a strong correlation with the subjective results in packet loss scenarios.

1. Introduction

Web Real-Time Communications (WebRTC) is a technology that allows sharing media between web browsers in a standard fashion. The purest form of a WebRTC application follows a peer-to-peer (P2P) architecture, in which a web browser accesses the camera and microphone of a host to send its media (video and audio) in real time to a remote browser.
Practitioners use standard WebRTC Application Programming Interfaces (APIs) in JavaScript to implement this kind of web application, in which HTML5 video tags play WebRTC streams. In addition to P2P decentralized real-time media applications, WebRTC has a significant impact on the development of other kinds of web applications, such as conferencing or broadcasting systems. In conferencing systems, several browsers share their media using the concept of room (i.e., an N to N communication). In broadcasting systems, a browser shares its media to several receivers (i.e., a 1 to N communication). These applications typically require some kind of server-side infrastructure.
Quality of Experience (QoE) is a measurement of the level of satisfaction of the users of an application or system. The amendment 5 of the ITU-T Recommendation P.10/G.100 defines QoE as “the degree of delight or annoyance of the user of an application or service.” Therefore, QoE is a user-centric concern, and so, it is not trivial to measure or estimate. This paper analyses the behavior of different objective Full-Reference (FR) QoE models for video and audio in WebRTC applications. To carry out this work, we have created and released as open-source a benchmark in which we assess a WebRTC application in an automated fashion. This benchmark allows recording the received WebRTC streams, which act as impairment signals for the FR models. Then, using the same recordings, we carry out a subjective analysis with real users to try to find correlations between the objective and subjective outcomes.
This piece of research is part of ElasTest (https://elastest.io/), an H2020 European Union project aimed at creating a comprehensive solution to ease the process of development, operation, and maintenance of end-to-end tests for different kind of applications, including web and mobile [1].

1.1. Background

This section provides a summary of the technologies supporting this work, i.e., WebRTC and QoE. Moreover, this section also provides a summary of the latest related works available in the literature.

1.1.1. WebRTC

WebRTC is a Voice over Internet Protocol (VoIP) technology that expands on and integrates existing real-time communications technologies, such as Session Initiation Protocol (SIP)-based architectures [2]. WebRTC allows the development of high-quality applications with media capabilities in web browsers by leveraging three types of JavaScript APIs: (i) MediaStream, to acquire audio and video streams; (ii) RTCPeerConnection, to communicate audio and video in real time; and (iii) RTCDataChannel, to communicate arbitrary application data in real time.
The WebRTC stack takes care of the media plane, providing different capabilities for encoding, decoding, or NAT (Network Address Translation) traversal.However, WebRTC is signaling agnostic, and therefore, there are no standard ways to set up or terminate WebRTC calls, which must be implemented by developers using custom mechanisms. Figure 1 shows the WebRTC protocol stack in the media plane, both for the RTCPeerConnection and RTCDataChannel APIs [3]. As depicted in this figure, browsers send their user media using the RTCPeerConnection API through SRTP (Secure Real-Time Transport Protocol) and custom data using the RTCDataChannel API through SCTP (Stream Control Transport Protocol). Then, the next protocol layer is DTLS (Datagram Transport Layer Security), which allows securing data exchange between WebRTC peers using encryption techniques.
Regarding connectivity, WebRTC peers are usually connected to the Internet behind firewalls and NAT (Network Address Translators) devices. The WebRTC stack relies on the protocol ICE (Interactive Connectivity Establishment) to achieve connectivity between peers. ICE collects all available candidates to the connection. Depending on the nature of the NAT devices, STUN (Session Traversal Utilities for NAT) or TURN (Traversal Using Relay around NAT) servers might be required [4].
In WebRTC, low latency and timeliness are more important than reliability. For this reason, UDP (User Datagram Protocol) is the transport protocol of the whole stack. UDP offers no reliability or order of the data and delivers each packet to the upper layers at the moment it is available. All in all, different aspects may affect the quality of WebRTC communications: packet loss (due to using best-effort protocols at transport and network level) and jitter (due to the variation in the latency on a packet flow between peers) [5].
Another relevant mechanism implemented in WebRTC which may affect the perceived quality is the bandwidth estimation (BWE). Modern BWE algorithms implemented in browsers predict congestion by analyzing the delay between packets. These algorithms progressively increase the bitrate used to encode the media according to the estimated bandwidth. When a receiver detects congestion, it sends REMB (Receiver Estimated Max Bitrate) messages to the sender, which adapts the transmission bitrate accordingly [6].

1.1.2. QoE

The term QoE and its underlying concepts were discussed in the context of the European Network on Quality of Experience in Multimedia Systems and Services (Qualinet) starting in 2003. As a result, Le Callet et al., created the Qualinet White Paper on definitions about QoE [7]. This report defines Influence Factors (IF) as the characteristic which may have an influence on the QoE for the final user and established three categories for IFs:
  • Human IFs: the properties related to the user as a human being, such as demographic and socioeconomic background or emotional state.
  • System IFs: technical properties that determine the quality of an application or service, such as media capture, encoding, transmission, or rendering.
  • Context IFs: factors of the user’s environment in terms of physical (e.g., location, space, and movement), temporal (e.g., time of day, duration, and frequency of use), or economic characteristics (e.g., costs, subscription type, or brand of the service).
QoE assessment is not trivial because user satisfaction is challenging to quantify. Typically, we classify the QoE assessment methods into two categories. First, subjective QoE models quantify the quality perceived by the final users by soliciting their evaluation scores. This score typically follows a Mean Opinion Score (MOS) rate, for instance, from 1 (bad quality) to 5 (excellent quality). On the one hand, subjective methods are costly and time-consuming, but on the other hand, these methods are considered the most accurate way to measure QoE since the actual users are involved in getting the metric.
Second, objective QoE models compute a metric as a function of QoS parameters and external factors. These methods were developed to avoid involving the users in the assessment process. Objective models are supposed to correlate with subjective values, which are considered the ground truth of QoE. A relevant type of objective assessment metric is known as media-layer. In these types, media signals are used as input to calculate the QoE. There are three different categories of media-layer models:
  • Full-Reference (FR): these models use some reference for audio or video together with the distorted signal (impairment) to compute the value of QoE.
  • Reduced-Reference (RR): these methods have access to partial information regarding the original reference (typically statistical) together with the impairment signal.
  • No-Reference (NR): these methods estimate the value of QoE without any knowledge of the original reference.
Due to its importance in this paper, we analyze some of the most relevant FR models available in the literature. Table 1 shows a comprehensive summary of these models for video and audio:

1.1.3. Related Work

Reference [21] present a comprehensive review of the QoE assessment for WebRTC applications in [21]. This paper first provides an analysis of how WebRTC topologies affect QoE. Second, it proposes a group of Key Performance Indicators (KPIs) to estimate the QoE in WebRTC applications. Finally, this paper presents a Systematic Literature Review (SLR) on the QoE assessment in the WebRTC arena carried out in 2017. Table 2 contains a summary of this review, presenting the aspects of Quality of Service (QoS) and QoE covered in each paper.
We find new works in the field of QoE in WebRTC after SLR. For example, Dunja and Skorin-Kapov investigate how different video encoding parameters (e.g., bit rate, resolution, or frame rate) influence QoE in Reference [22]. This paper presents a subjective evaluation of WebRTC calls carried out with mobile devices. Participant reported ratings of different test scenarios of video encoding parameters. At the same time, the authors collected WebRTC statistics using the Google Chrome WebRTC-internals tool. They concluded that old smartphones should use a maximum resolution of 640 × 480 px. Besides, when bandwidth is limited, both resolution and video bitrate should also be reduced. The same authors extended their work investigating how the Google Congestion Control (GCC) algorithm impacts QoE if different scenarios of packet loss and video codec configuration are applied [23].
Reference [24] analyses the effect on the QoE of Multi-View Video and Audio (MVV-A) contents (e.g., the Olympics Games) transmitted over WebRTC. To do that, the authors carried out a subjective experiment of the perceived QoE of these contents with various network conditions. This work concludes that a high number of viewpoints tend to provide better QoE, while the content which requires frequent viewpoint changes degrades the QoE. The same authors extended their work in Reference [25], comparing the QoE in MVV-A contents with transmission methods using video and audio streaming MPEG-DASH (Moving Picture Experts Group Dynamic Adaptive Streaming over HTTP).
Husić et al. investigate how different context IFs influence the QoE in WebRTC video calls [26]. Using subjective experimentation and statistical analysis, the authors conclude that the task complexity and the duration of WebRTC calls influence the QoE.

1.2. Motivation

The real-time nature of WebRTC imposes specific characteristics that might affect the perceived quality for end-users. For the different WebRTC application types (1 to 1, 1 to N, or N to N), we can find a common factor. There is always at least one browser that sends its media (we refer it as the presenter) and at least one browser which is receiving that media (we refer it as the viewer). For this reason, this paper focuses on media-layer FR metrics for calculating the QoE of WebRTC applications, both for video and audio. We aim to evaluate the QoE of video and audio by comparing the media in the viewer (impairment signal) with the media in the presenter (original reference).
Reference [21] introduced in the Related Work section concludes that an open challenge in the domain of QoE is to identify a group of optimal models to assess the audio and video quality in WebRTC applications. This paper contributes to this vision, providing a continuation of our previous work [42], which presented the preliminary results about the evaluation of several video quality models for WebRTC applications. The first aspect in which the current paper improves our previous work is the evaluation of audio and video instead of video-only evaluation. Some of the participants of the subjective analysis in our previous paper pointed out that the assessment of video sequences without audio was nonnatural. Therefore, it is a possible source of bias when evaluating video quality subjectively. Moreover, in Reference [42], we used a single video in which was a close-up of a woman being interviewed, simulating a regular WebRTC call. This video had a size of 640 × 480 px, which is a typical resolution for WebRTC streams. To improve and confirm our previous results, in this paper, we use the same video sequence but, this time, also with audio. Besides, we use an other video sequence, much more complicated in terms of video content. It is a clip about the famous online game “Fortnite” of 1280 × 720 px, i.e., High-Definition (HD). Thanks to the use of this reference, we have detected a problem in our previous approach related to video assessment. We realized the alignment of video frames of the impairment concerning the reference is not perfect after sending the video with WebRTC. This fact introduces an error factor in the video quality calculation using FR methods. To solve this problem, we have designed and implemented an alignment method for the impairment signal based on overlaying the frame number in the video of the presenter side. Then, we use an Optical Character Recognition (OCR) mechanism to adjust the video properly in the receiver side before computing the FR video scores. Last but not least, we have changed the System Under Test (SUT) in this paper. In our previous work, we use a WebRTC application built with the OpenVidu framework, which is a Selective Forwarding Units (SFU) videoconferencing system based on Kurento Media Server [43]. The motivation to use this SUT was simplicity since OpenVidu allows accessing the RTCPeerConnection JavaScript objects from the global scope of the browser. This feature was required to record the WebRTC stream. As explained later, we have enhanced this process by using the so-called Monkey Patching technique. All in all, we use a simple P2P WebRTC application instead of an SFU-based. This change reduces the complexity of the SUT, allowing to analyze the raw capabilities of WebRTC in terms of QoE.

1.3. Contributions

The first contribution of this paper is the implementation of an experimental benchmark aimed to calculate different objective FR metrics for audio and video in WebRTC applications. The methodology which follows our benchmark has three stages. First, we generate a proper media input (reference) with video and audio for the QoE evaluation of a WebRTC application. Second, we carry out a WebRTC call between two browsers, using the reference stream previously generated in one browser while recording the received media in the other browser (impairment) under different network conditions in terms of packet loss and jitter. We also considered simulating delay in the network. Delay has a direct influence on the end-to-end latency, which in turn has a significant impact on the conversational QoE. Nevertheless, this parameter does not affect the media quality calculated with a FR model, since this kind of models uses one direction of the communication (reference signal in the presenter and impairment in the viewer) to calculate the video quality. Nevertheless, we did not carry experimentation based on delay because this parameter affects the end-to-end latency but not the media quality computed with FR algorithms. Third and last, using the reference and impairment streams, we use existing FR models to calculate the QoE both for video and audio. We enable other practitioners to follow the proposed methodology by releasing the benchmark as an open-source GitHub repository.
The second contribution of this paper is a subjective evaluation, carried out with real users. We reuse the impairment sequences obtained previously with the benchmark during the objective analysis. Subjective assessment is considered the actual value of QoE [44]. For this reason, we want to find out the perceived video and audio quality of the obtained impairment sequences subjectively. Then, we analyze the data gathered in this subjective survey to find correlations between the objective results obtained in the experimental benchmark. As a result, we determine which one of the selected FR models provides better estimations of video and audio quality in WebRTC applications for different types of input sequences and network conditions.

2. Material and Methods

2.1. Benchmark for Objective Evaluation

As introduced before, objective media-layer FR metrics calculate the QoE by comparing an original signal with its degraded version. The first contribution of this paper is the design and implementation of a benchmark to obtain these signals (reference and impairment) for WebRTC applications.
As explained next, we have created this benchmark on the top of well-known testing frameworks and tools. Besides, we released the resulting artifacts within an open-source repository (Apache 2 license) available on GitHub (https://github.com/elastest/elastest-webrtc-qoe-meter). The workflow implemented in this repository has three stages: (i) input generation, (ii) SUT evaluation, and (iii) QoE calculation. Figure 2 illustrates this process. The next sections provide fine-grained details of each step.

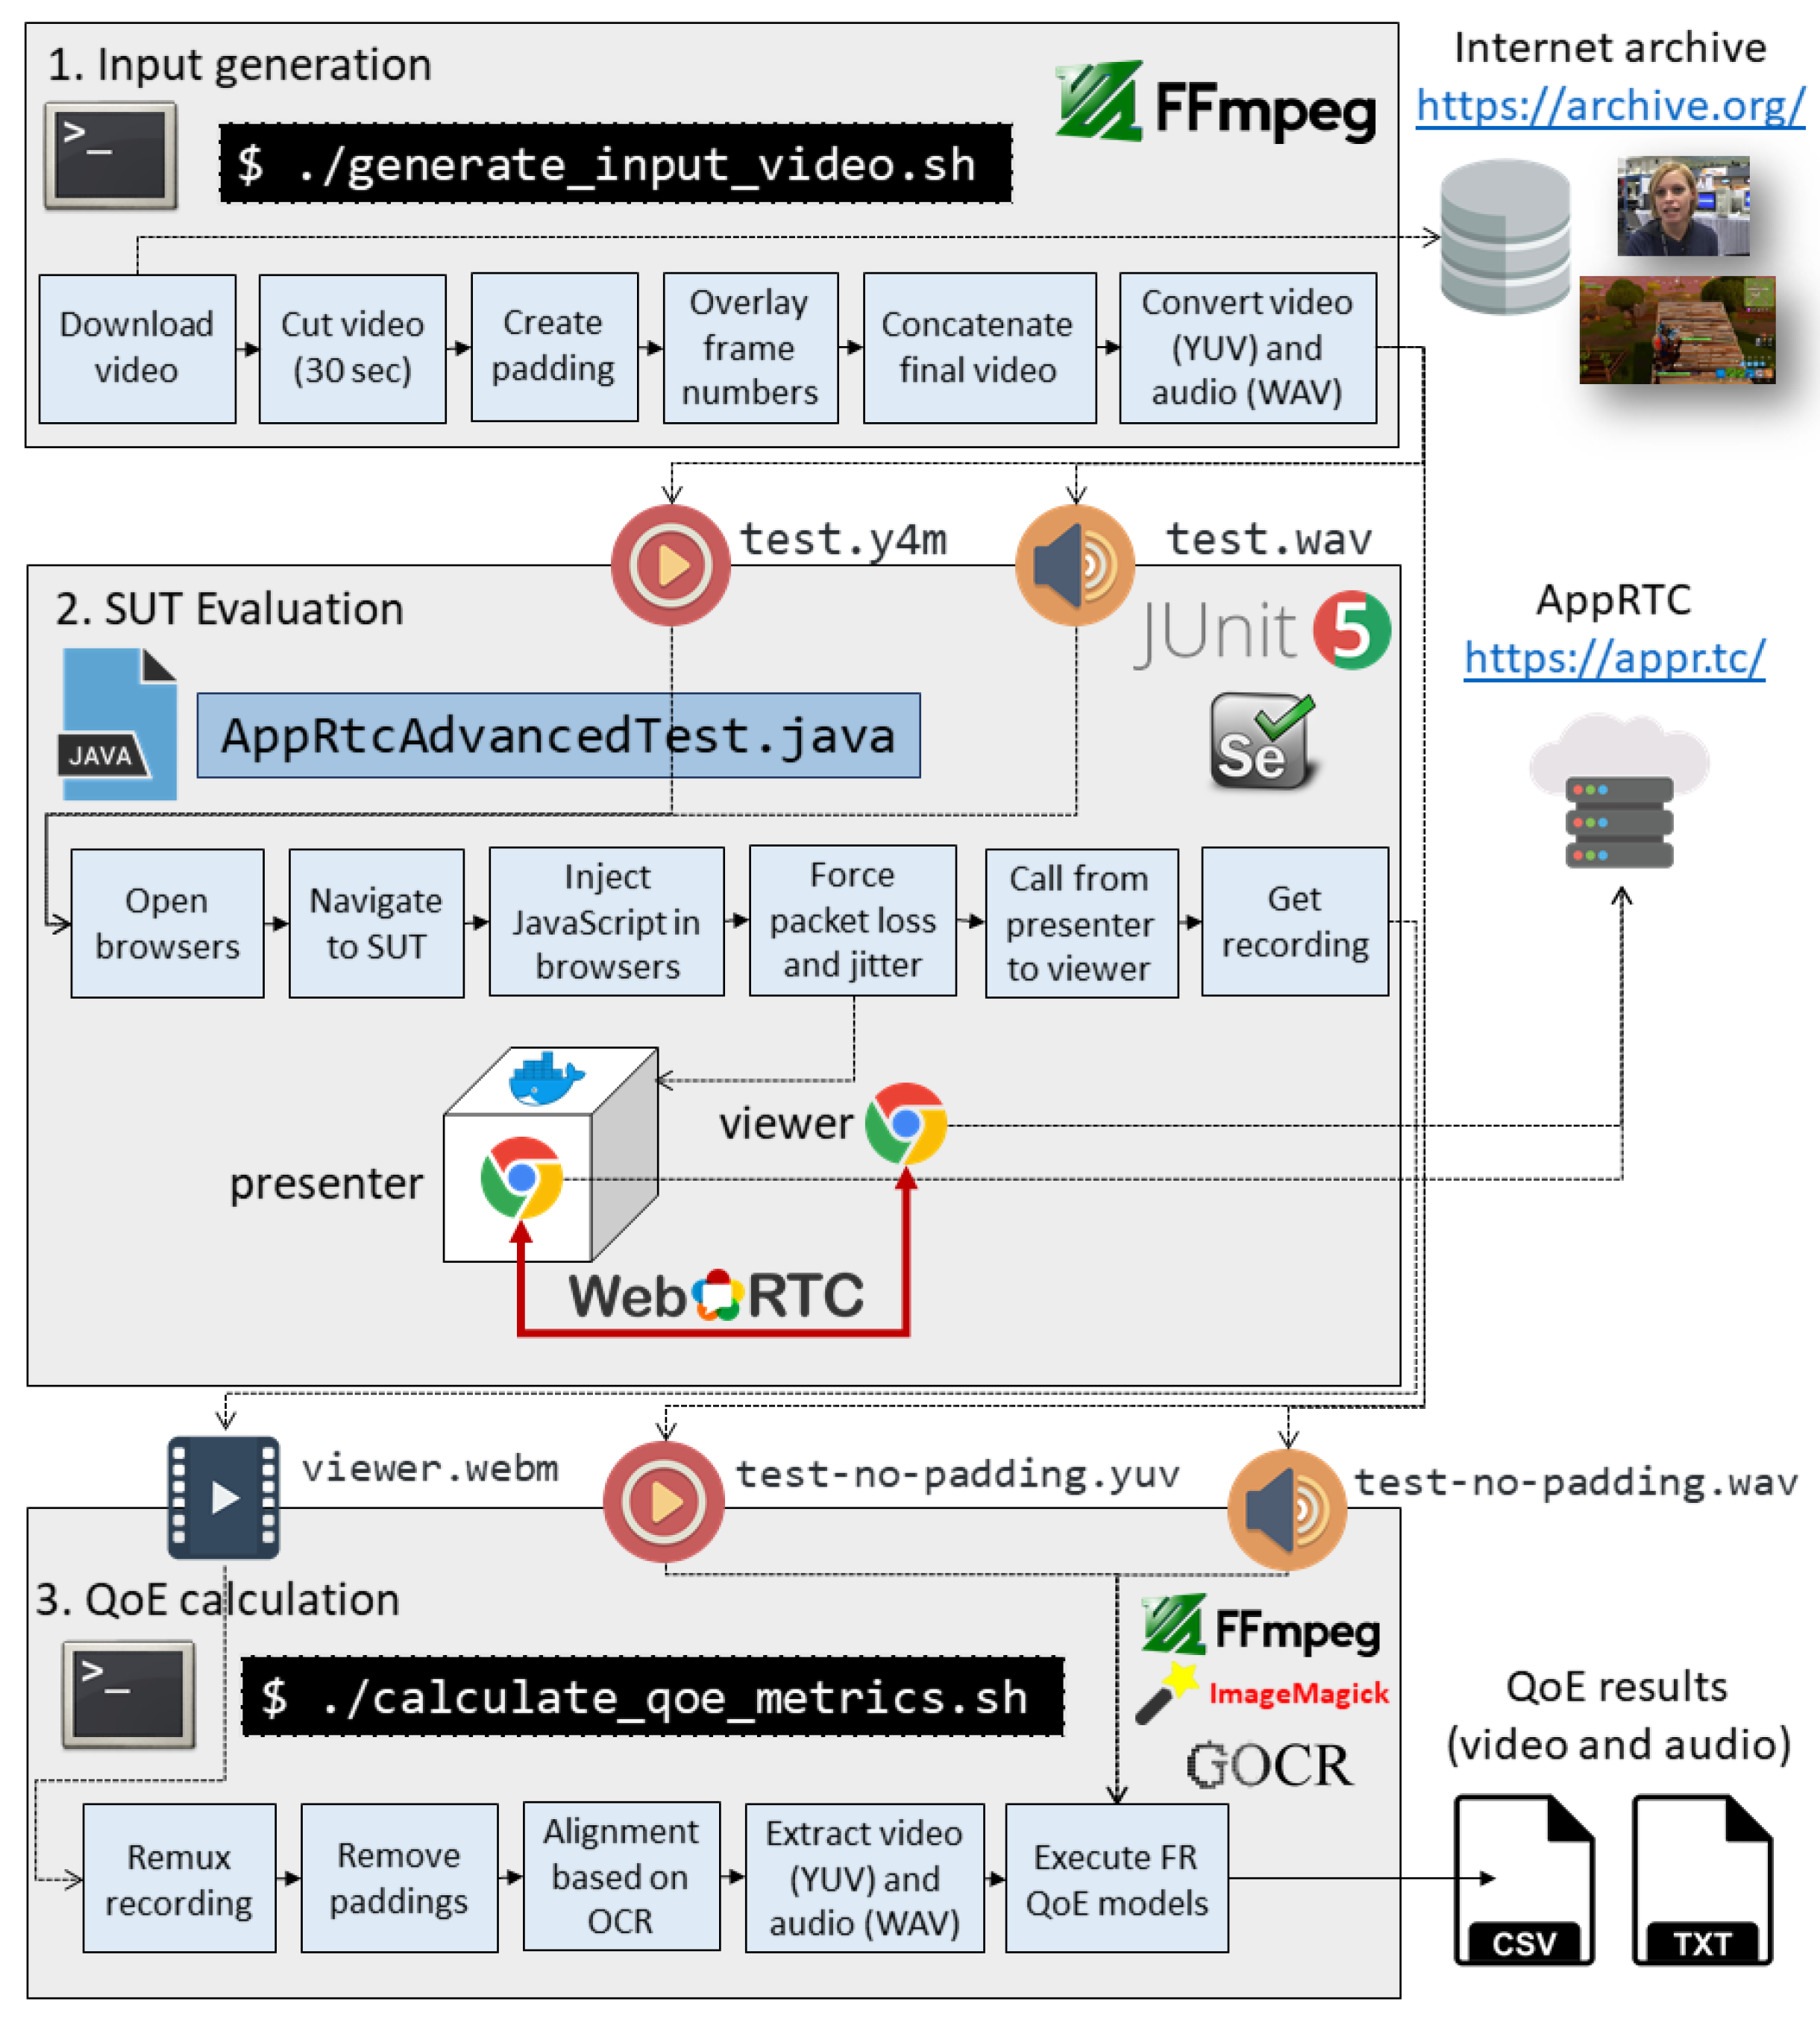
2.1.1. Input Generation

In the first place, we need a proper reference media sequence (video and audio) to carry out a WebRTC call. This input is used in the second stage to feed the WebRTC stream of a browser. In theory, we could use any modern browser implementing the WebRTC stack, but in practice, Chrome is the browser that provides a wider variety of capabilities to assess WebRTC applications automatically. Specifically, we use the following configuration options to feed custom video and audio for WebRTC:
  • –use-file-for-fake-video-capture=/path/to/test.y4m: This flag allows feeding a custom video file (instead of using the actual media from the camera) for WebRTC communications. Chrome requires the format of this file follows a YUV color encoding system (raw format).
  • –use-file-for-fake-audio-capture=/path/to/test.wav: This flag allows to feed a custom audio file (instead of using the actual audio from the microphone) for WebRTC communications. Chrome requires a WAV file format for this (raw format).
A relevant aspect we need to take care of is the synchronization of the reference and impairment signals. As explained before, to calculate the objective FR metrics for video and audio, the original and impairment sequences need to be perfectly aligned. To achieve this, we generate the reference signal with the following constraints:
  • We place the media source in between two padding signals, discarded in the third stage (QoE calculation).
  • We encode the reference video in YUV and the audio in WAV, which are the formats supported by Chrome.
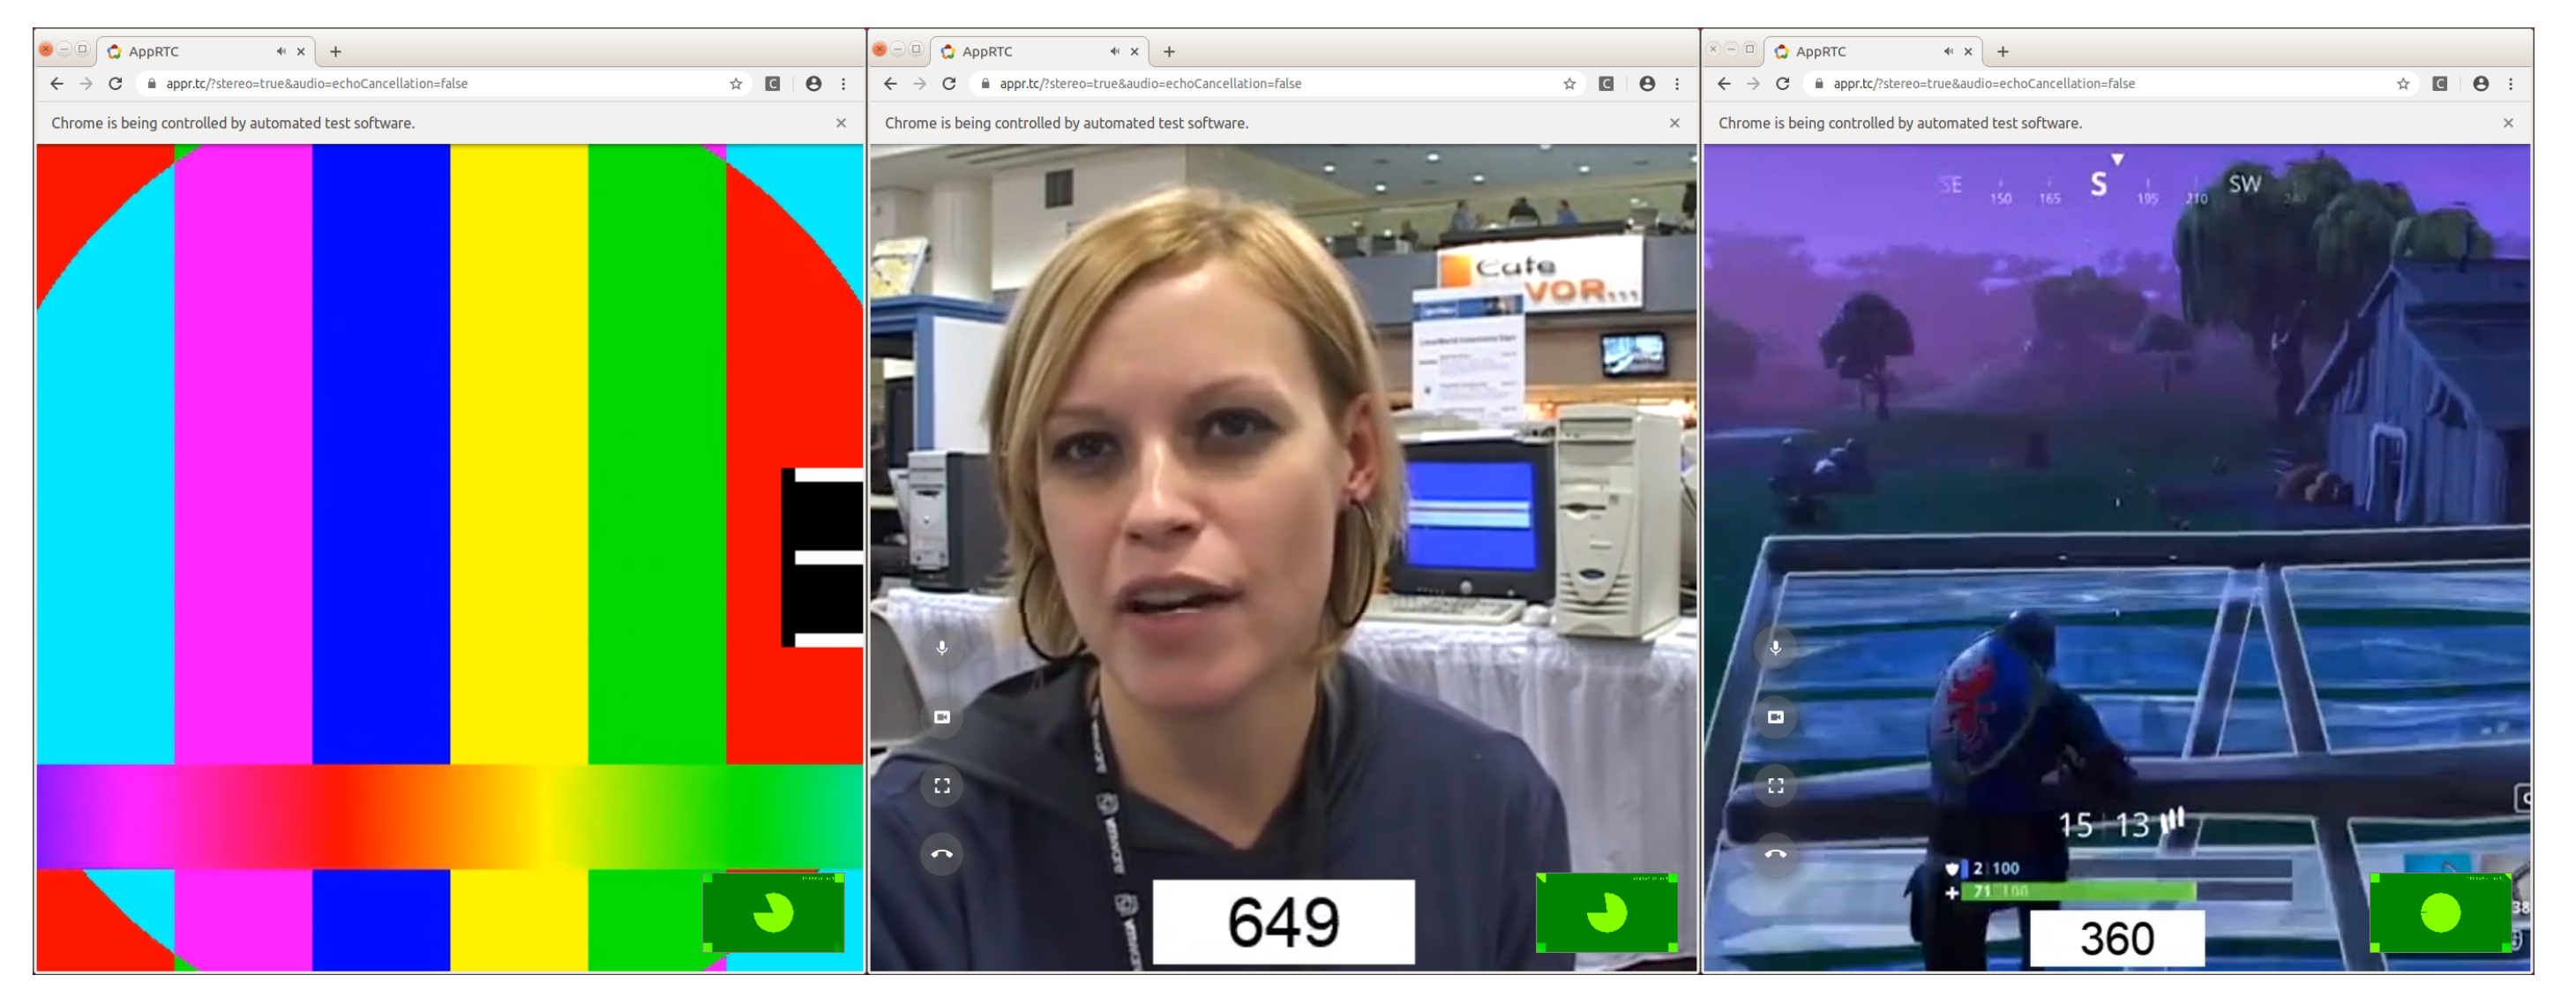
  • We use a fixed value of the video frame rate (24 fps). Then, we overlay the frame number within the media to ensure perfect alignment in the third stage (see more details on Section 2.1.3).
We have selected a couple of open video sources available in the Internet Archive (https://archive.org/) released with Creative Commons license (https://creativecommons.org/licenses/by-sa/3.0/). First, a conversational-type video has been used (https://archive.org/details/e-dv548_lwe08_christa_casebeer_003.ogg). In the video, we can see the first plane of a woman answering the questions of a man behind the camera. This video has a resolution of 640 × 480 px, which is very usual in laptops and mobile devices. Then, we use a more complicated video in terms of encoding. It is a fragment of the famous online game “Fortnite” explained by a male narrator (https://archive.org/details/ForniteBattle8/fornite+battle+2.mp4). This video has a resolution of 1280 × 720 px.
We have created a shell script to carry out this first stage automatically. The name of the script is generate_input_video.sh. To implement this script, we use FFmpeg (https://www.ffmpeg.org/). FFmpeg is a powerful open-source toolbox for handling multimedia streams. The steps followed in this script are as follows:
  • Download the video sample from the Internet Archive (using the command-line tool wget).
  • Cut the original video. As explained later, we use the impairment sequences also for subjective analysis. To avoid a very long experiment time, we limit the duration of the reference sequences to 30 s.
  • Overlay each frame number in the video content. As explained later, each frame number is recognized directly from the video content using an OCR tool. For this reason, first, we need to attach each frame number in the video at this point.
  • Create padding video based on a test pattern. This padding video sequence is a test source pattern composed of different colored bars (see Figure 3a).
  • Concatenate the final video, attaching the padding at the beginning and the end of the sequence, and the actual content (interview or game) in the middle.
  • Convert the final video to Y4M and the final audio to WAV, as required by Google Chrome.

2.1.2. SUT Evaluation

The next stage consists of carrying out a WebRTC call between a couple of browsers (presenter and viewer). There are several important decisions to be taken in this step. First of all, we need to select the SUT. As introduced before, this paper improves our previous work [42] by employing simple P2P WebRTC calls instead of media-server based conferences. The objective is to evaluate the behavior of the WebRTC stack without any intermediate element, which could affect the final QoE.
To select a proper SUT, we have analyzed the official collection of samples provided by the WebRTC team, the so-called “WebRTC Samples” (https://webrtc.github.io/samples/). Among other test applications, this collection contains a full-featured WebRTC video chat called AppRTC. This application is well-known in the WebRTC community since Maire Reavy (Firefox Media Product Lead) and Serge Lachapelle (Chrome Product Manager) used its early version to carry out the first call between Chrome and Firefox in 2013 [45]. AppRTC follows a P2P architecture, in which the media flows from browser to browser, which is perfect for our needs. This application uses Collider (a WebSocket-based signaling server implemented in Go language) to establish and release the WebRTC call between browsers. All in all, we use the online version of AppRTC (https://appr.tc/) as our SUT.
The next relevant choice is the type of browser to be used. As introduced before, any modern WebRTC-compliant browser, such as Chrome, Firefox, or Edge, could be selected. Nevertheless, in practice, the browser providing a more comprehensive toolbox of capabilities for automated testing WebRTC is Google Chrome. In particular, we use the Chrome options to feed custom video and audio (reference sequence previously generated) as WebRTC input. This media is encoded in the browser and sent by WebRTC to an other browser.
For repeatability, we need to exercise the SUT using the browsers in an automated fashion, and therefore, we need a way to drive Chrome automatically. Selenium WebDriver is a testing framework that allows creating end-to-end tests for assessing the client-side of web applications. It allows driving automatically real browsers (such as Chrome or Firefox) from a language binding (such as Java, JavaScript, or Python) [46]. Selenium WebDriver is the de-facto standard to interact automatically with a web application using its Graphical User Interface (GUI). Besides, it allows executing custom JavaScript code in the browsers.
We use JavaScript to record the WebRTC stream in the viewer browser. Using Selenium WebDriver, at the beginning of the test, we inject the RecordRTC library (https://github.com/muaz-khan/RecordRTC) in the SUT. RecordRTC is an open-source JavaScript library that acts as a wrapper of the MediaStream Recording API (https://www.w3.org/TR/mediastream-recording/), allowing to record WebRTC streams using JavaScript in a friendly manner. In the WebRTC JavaScript API, RTCPeerConnection objects provide access to MediaStream objects. The Selenium WebDriver executes JavaScript from the global scope of the browser. As a result, we need to access the RTCPeerConnection objects in order to record the WebRTC stream with the MediaStream Recording API. To achieve this, we use the so-called Monkey Patching technique, which allows modifying the default behavior of a given piece of code at runtime without changing its source code. In particular, we override the original RTCPeerConnection constructor to collect any RTCPeerConnection in a global array. This array is later accessed with Selenium WebDriver to start, stop, and get the WebRTC streams. We have implemented this technique using the JavaScript snippet below. This snippet forms part of a custom JavaScript library called elastest-remote-control.js. We inject this library in the SUT using Selenium WebDriver before starting the WebRTC call.
Thanks to the use of this technique, practitioners can reuse our benchmark to assess any kind of WebRTC application following the proposed methodology. To illustrate this, the open-source repository implementing our methodology also provides test examples using different SUTs, for example, based on the Janus WebRTC server (https://janus.conf.meetecho.com/), OpenVidu SFU (https://openvidu.io/), and several WebRTC samples.
Electronics 09 00462 i001
Listing 1: Monkey Patching for RTCPeerConnection objects (JavaScriptWebRTC API).
We use JUnit version 5 to implement an automated test that exercises the SUT through Selenium WebDriver. JUnit version 5 is the latest version of the popular general-use testing framework for Java. It provides a brand-new architecture and a programming and extension model called Jupiter [21].
Another relevant technology to support our benchmark is Docker. Docker allows us to deploy and run any application as a lightweight and portable container on the top of a Linux kernel [47]. We use Docker as it allows applications and their dependencies to be shipped as isolated containers. As introduced before, we use Google Chrome as the preferred browser. In particular, we use instances of Chrome executed in Docker containers. This fact allows manipulating the network of the browser without affecting the rest of the elements in the local host. This way, we can execute NetEm (Network Emulator) commands in the browser container in a straightforward manner. NetEm is a Linux package that allows customizing several network parameters to simulate different network conditions, such as delay, jitter, or packet loss [48].
To simplify the use of browsers in Docker container through Selenium and JUnit 5, we have created and released as open-source the tool Selenium-Jupiter (https://bonigarcia.github.io/selenium-jupiter/). Selenium-Jupiter is an extension for Selenium in JUnit 5, which provides seamless integration with Docker. Figure 3 shows different screenshots of the SUT being controlled automatically by Selenium WebDriver (note the text below the address bar stating that the browser is being controlled by automated test software).
All in all, we have implemented a JUnit test case (called AppRtcAdvancedTest.java) that uses Selenium to assess AppRTC automatically. This test accepts different parameters that allow us to configure the packet loss and jitter in the network of the Docker container of the presenter browser. We repeat the experiment 7 times:
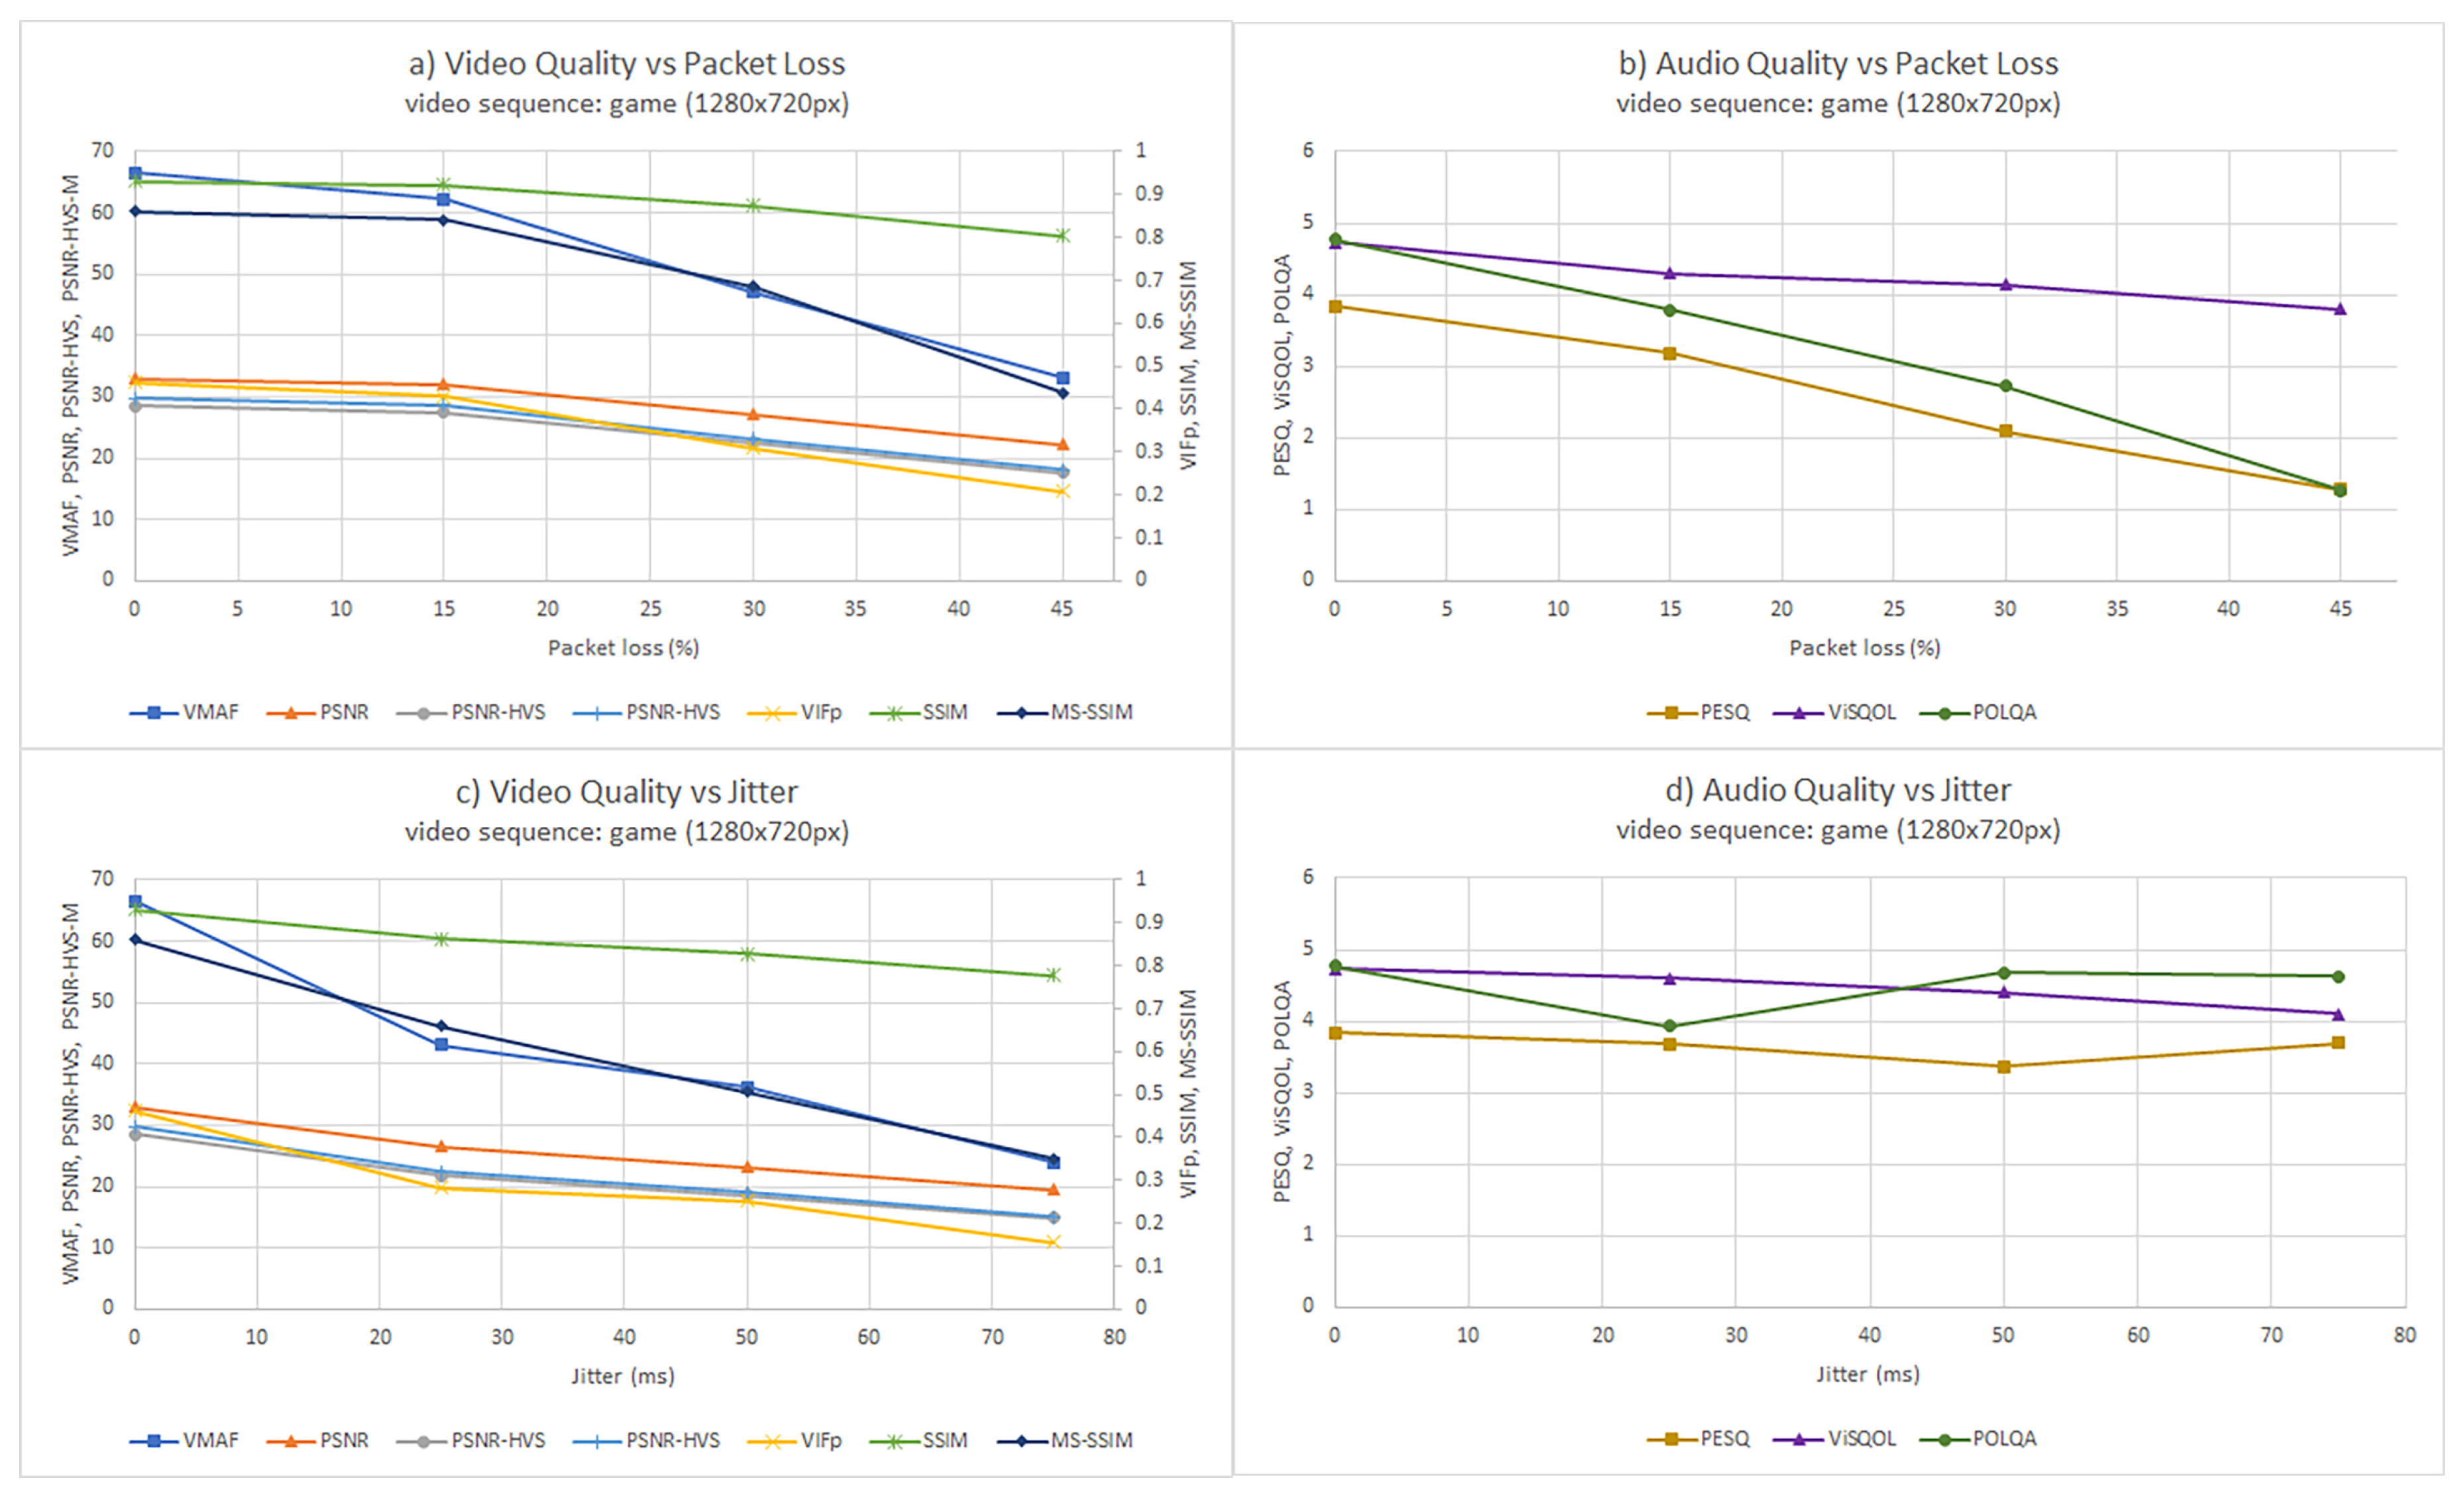
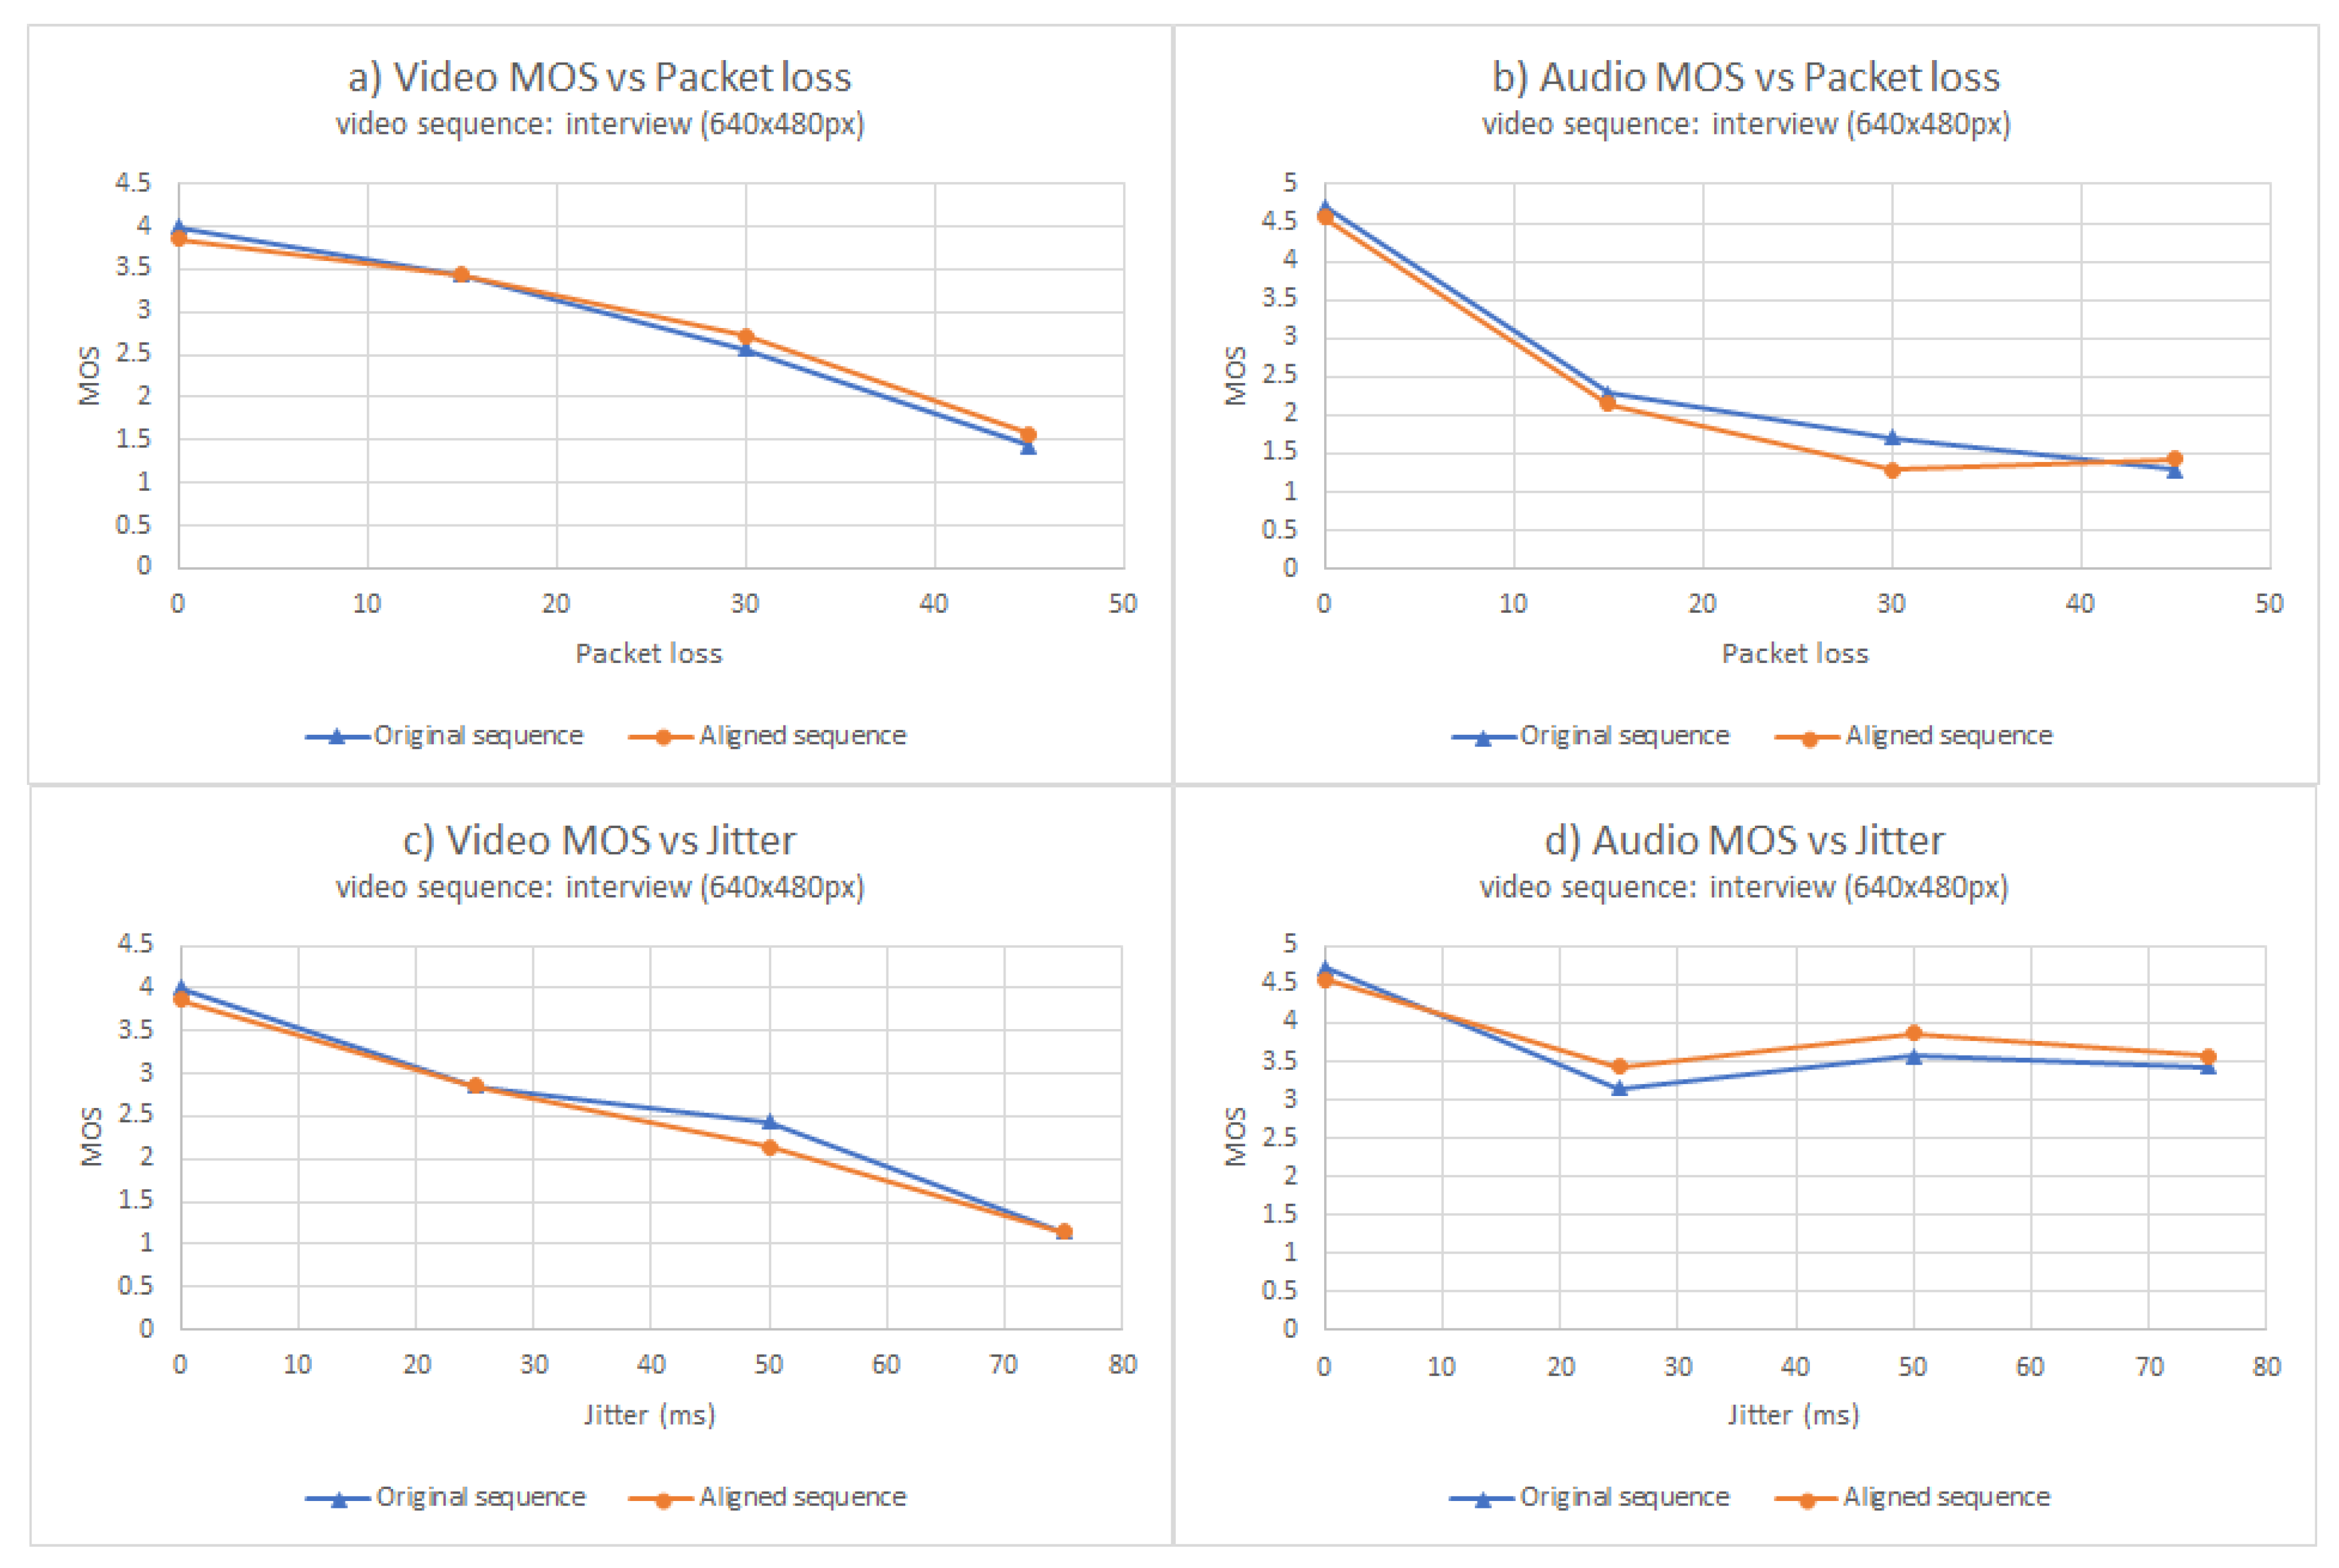
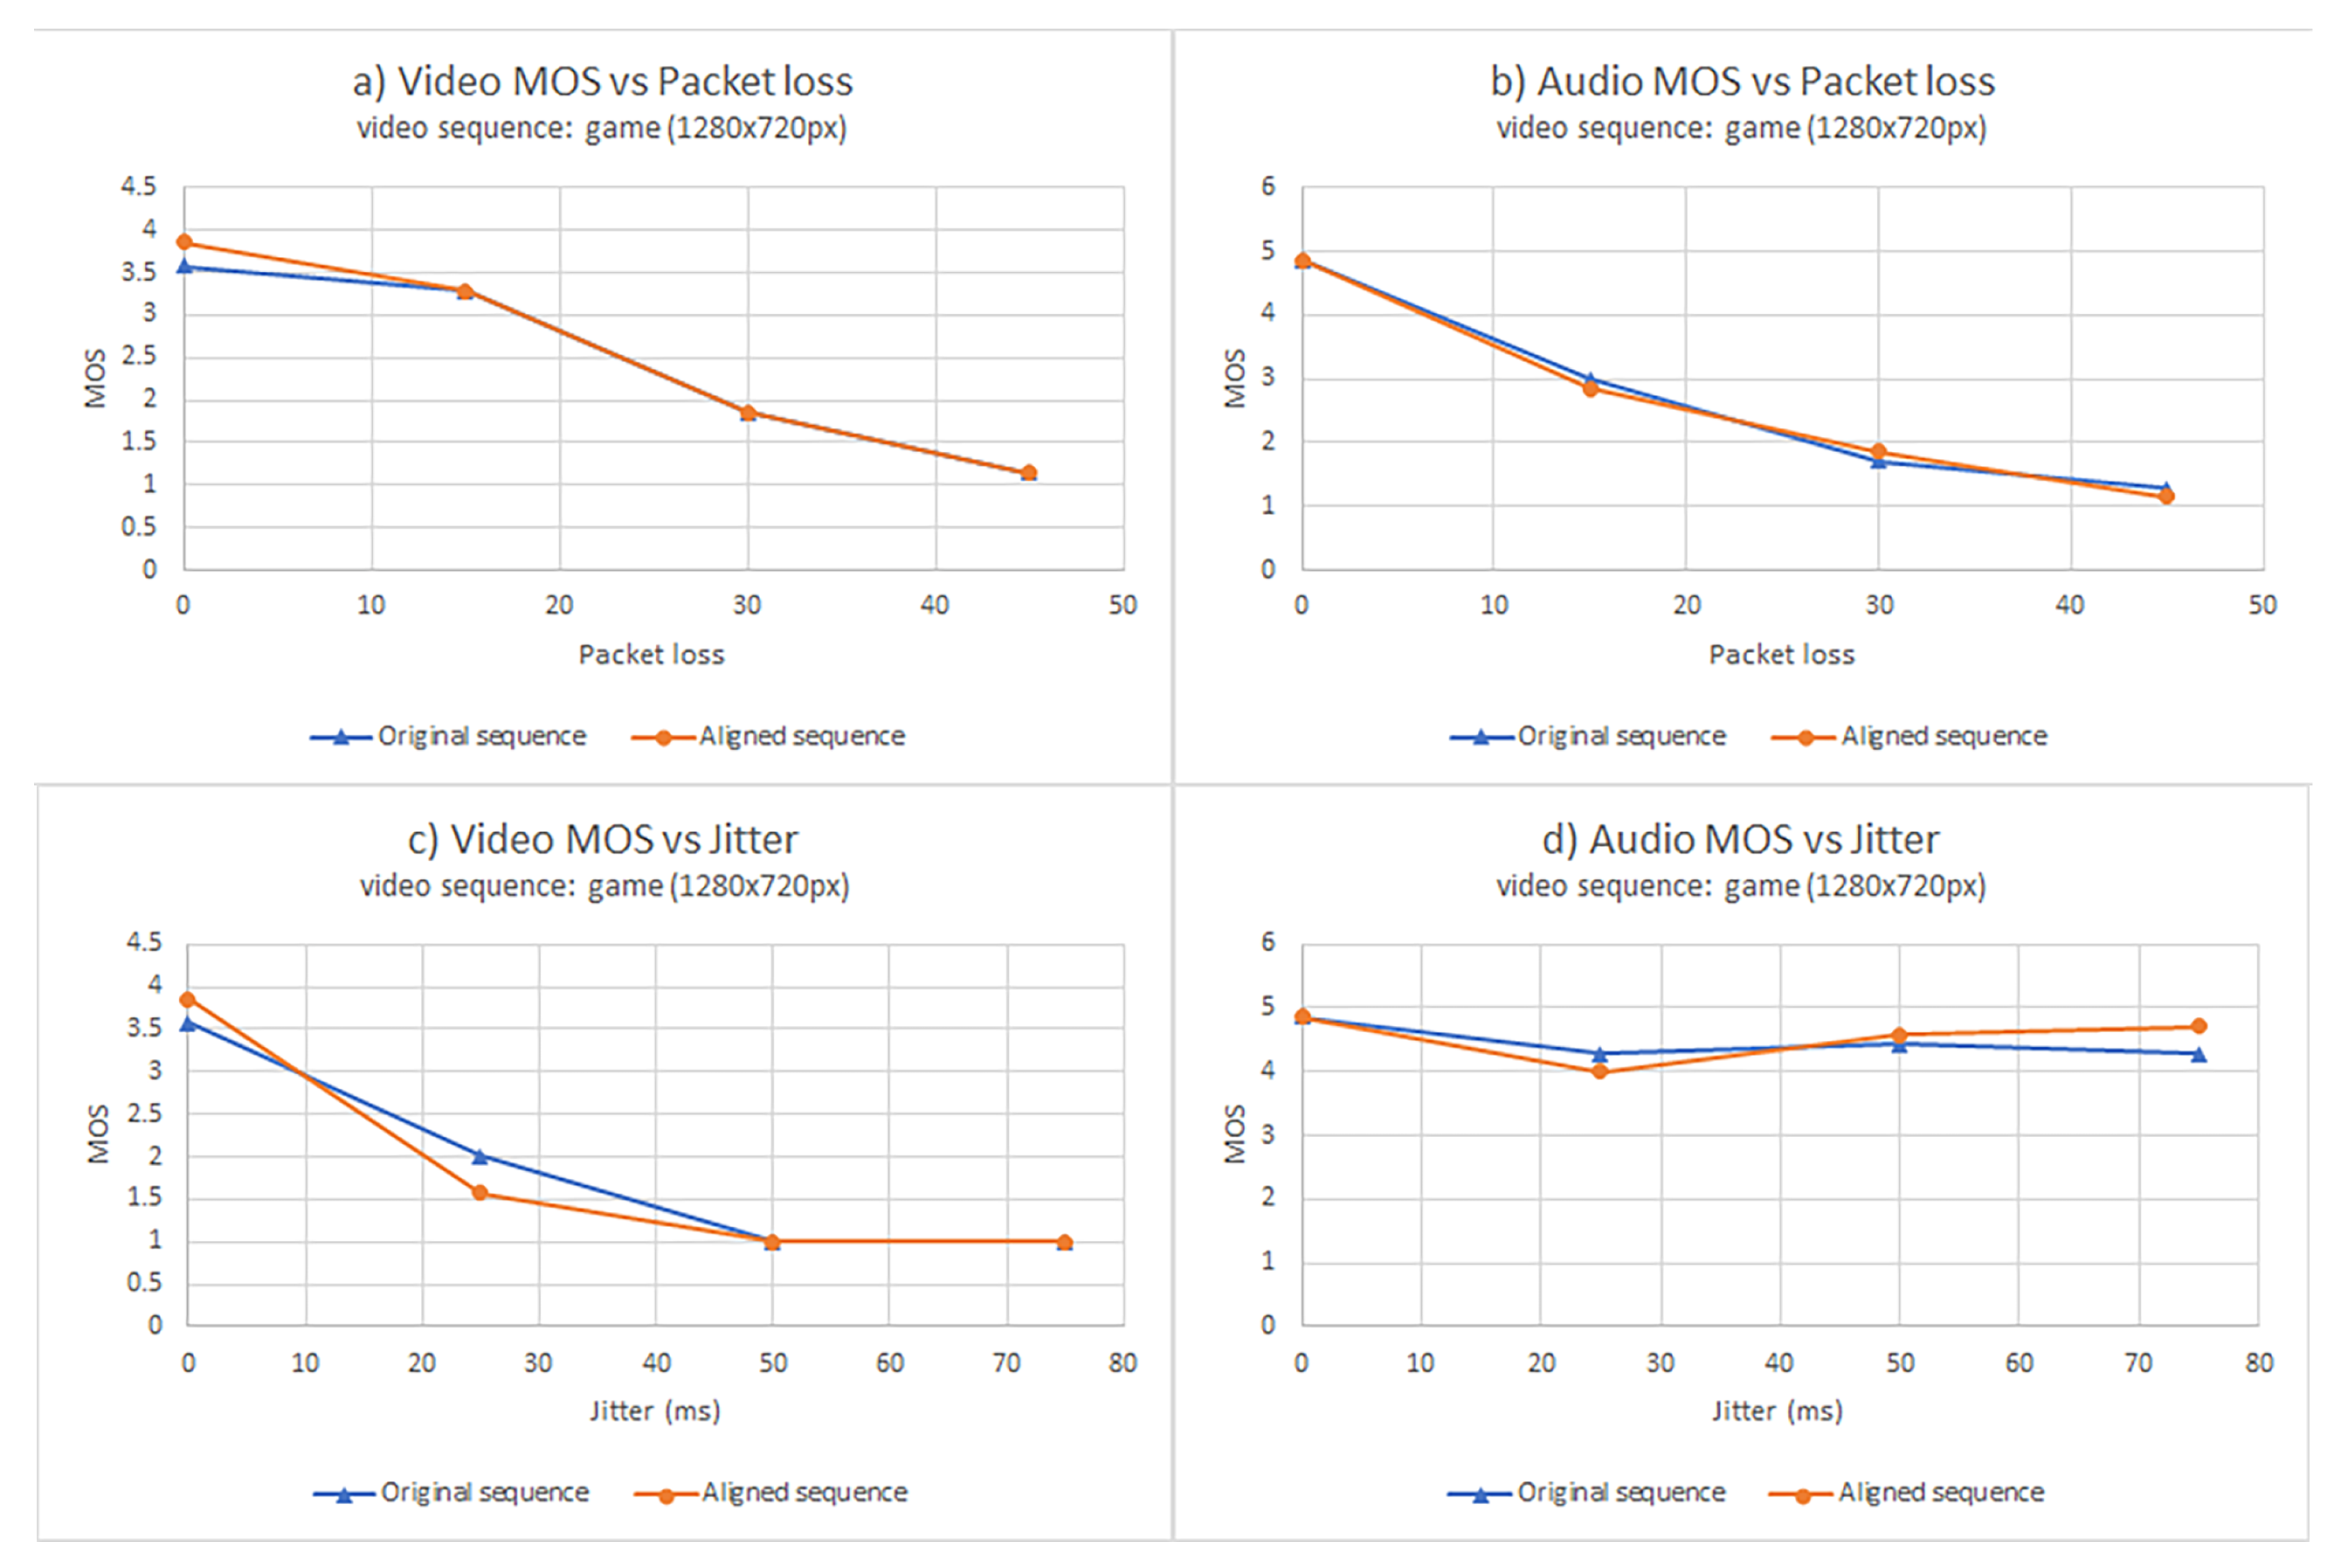
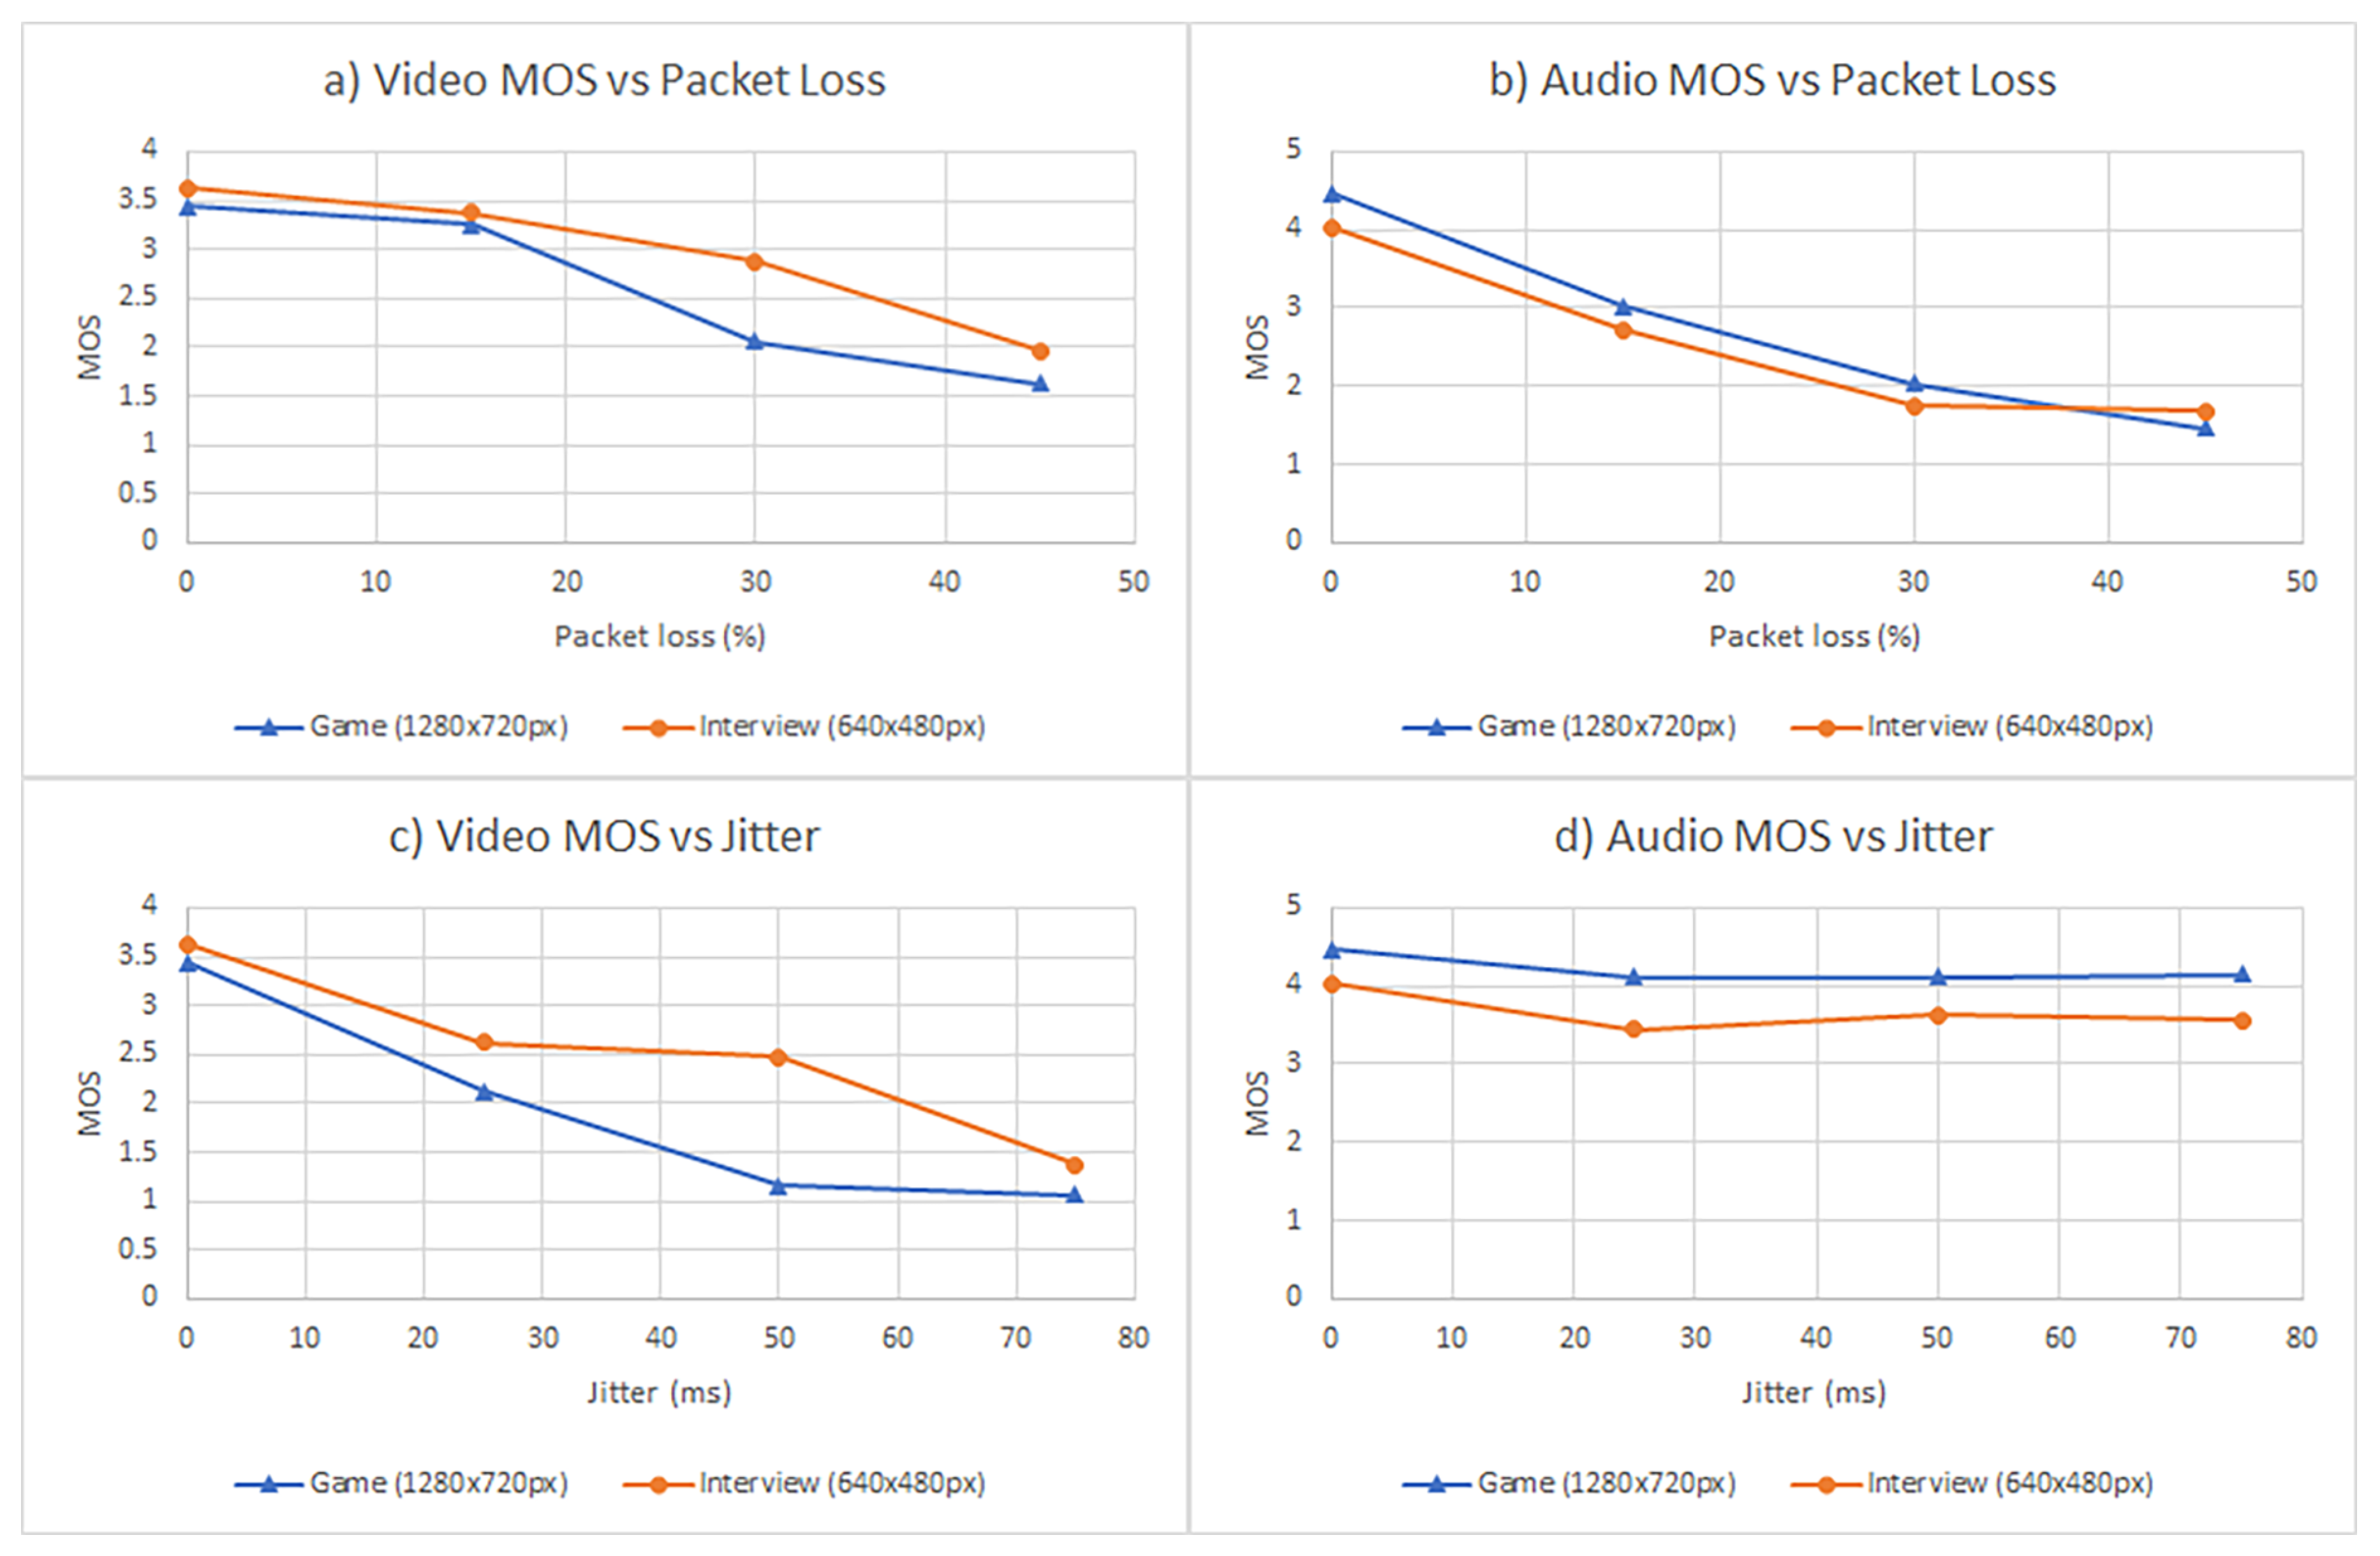
  • 1 for the ideal scenario, in which no packet loss nor jitter happens.
  • 3 for scenarios with packet loss: 15%, 30%, and 45%, respectively).
  • 3 for scenarios with jitter: 25 ms, 50 ms, and 75 ms, respectively (75 ms is the maximum recommended value to avoid jitter distortions [49]).

2.1.3. QoE Calculation

After executing the first stage of our methodology (input generation), we have different resulting media files: (i) input video file in YUV and (ii) input audio file in WAV. Then, after executing the second stage (SUT evaluation), we obtain the recording of the WebRTC stream in the viewer browser (video and audio together in WEBM format). Finally, we calculate different QoE metrics for video and audio using the previously generated files (the reference for video and audio together with the impairment from the viewer browser) in the third stage. We have created a shell script (called calculate_qoe_metrics.sh) to automate this stage.
This script implements different steps to calculate the video and audio metrics. First, we need to carry out some remuxing process in the impairment media. The original video file (created in the first stage) has a fixed resolution (1280 × 720 px or 640 × 480 px) and a fixed frame rate (24 fps). Nevertheless, after sending this stream with WebRTC, these features changed. Due to the BWE algorithm for WebRTC previously introduced, browsers change the bitrate to encode media according to the estimated bandwidth. As a result, the video received in the viewer browser has a variable frame rate and the resolution is variable. For example, for the game input sequence (1280 × 720 px), the received video first has 640 × 480 px, then 960 × 540 px, and finally reaches the original 1280 × 720 px. All in all, to compare the impairment video with the source, we need to carry out a remuxing process to change the resolution and frame rate to the original fixed values. We use FFmpeg to carry out this process.
Then, we need to remove the paddings from the impairment. As explained before, we attached a padding sequence at the beginning and end of the media sent by the presenter. To compare the reference with the impairment, we first need to remove these paddings. We use ImageMagick (https://imagemagick.org/) to carry out this task. ImageMagick is a free software suite for image manipulation. In particular, we use the command convert contained in this toolbox to detect the RGB color of given coordinates in each video frame. Since the padding video is composed of different colored bars, it is easy to determine whether a frame matches with the color sequence of the test source pattern. All in all, we use FFmpeg to convert each frame to a JPG picture, and the convert command finds out the exact pictures (first and last) where the actual media starts. We use FFmpeg again to cut the video using these numbers, discarding the initial and final padding content.
As explained before, browsers can change the encoding bitrate according to the estimated bandwidth. We have detected that a variable number of frames are not encoded and, therefore, not received in the viewer browser. The naked eye does not perceive this process, but since FR models for video compare the reference and the impairment frame to frame, it affects the estimated quality obtained with these models.
To solve this problem, we have designed an alignment process based on the recognition of each frame number using an OCR tool. Algorithm 1 shows the pseudocode of the algorithm used to implement this alignment process. Using the cropped impairment sequence (without padding) as input, first, we extract each frame as a single picture from the impairment video. The result picture set is iterated in reverse order, i.e., from the last file name value (for example, 720.jpg) to the first one (for example, 1.jpg). For each picture, we use an OCR tool to recognize the frame number. In particular, we use GOCR (http://jocr.sourceforge.net/), an open-source OCR implementation, in our shell script. Next, we use a counter variable to iterate the frame number. We initialize this variable with the latest frame number value, calculated knowing the video length in seconds and the frame rate (for example, 30 × 24 = 720). Then, we copy each image, starting from the value of frame number recognized by the OCR until the value of the frame counter. This process allows duplicating frames in the case of missing frames. It also allows avoiding duplicated frames out of order. The resulting set images is later used to feed FFmpeg to generate a new video file, using the original impairment audio.
Algorithm 1: Alignment process algorithm
Electronics 09 00462 i002
The final step carried in this stage is the calculation of FR models for video and audio. For the shake of completeness, we use different implementations available in the literature, namely VMAF (Video Multi-Method Assessment Fusion), VIFp (Visual Information Fidelity in the pixel domain), SSIM (Structural Similarity), MS-SSIM (Multi-Scale SSIM), PSNR (Peak Signal-to-Noise Ratio), PSNR-HVS (Human Visual System), and PSNR-HVS-M (improvement of PSNR-HVS using visual masking) for video and PESQ (Perceptual Evaluation of Speech Quality), ViSQOL (Virtual Speech Quality Objective Listener), and POLQA (Perceptual Objective Listening Quality Analysis) for audio. Regarding video, we use the official implementation of VMAF (https://github.com/Netflix/vmaf). Moreover, we use the open-source suite VQMT (Video Quality Measurement Tool) to calculate the video quality metrics VIFp, SSIM, MS-SSIM, PSNR, PSNR-HVS, and PSNR-HVS-M (https://github.com/Rolinh/VQMT). Regarding audio, we use the official implementations for PESQ (https://www.itu.int/rec/T-REC-P.862) and ViSQOL (https://github.com/google/visqol), together with the SwissQual’s SQuadAnalyzer in super-wideband mode version of POLQA (http://www.polqa.info/). Both the video and audio implementations require the input media files in raw format. Thus, we convert the resulting media file after the alignment process to raw format, concretely video to YUV and audio to WAV. As a result of executing this stage, the script generates a set of 7 Comma Separated Values (CSV) files, containing the QoE results for video (VMAF, VIFp, SSIM, MS-SSIM, PSNR, PSNR-HVS, and PSNR-HVS-M) per frame and set of 2 text files containing the average result for audio (PESQ, and ViSQOL). Due to licensing issues, we calculate POLQA separately.

2.2. Survey for Subjective Evaluation

After the objective experimentation, we carried out a subjective evaluation. We reuse the impairment sequences previously obtained as input in the subjective evaluation. The objective is two-folded. On the one hand, we want to find correlations between the quality perceived (in video and audio) by real users and the objective results previously obtained. On the other hand, we want to find out if the alignment process implemented does not affect the perceived video quality in the eyes of real users.
We have designed this subjective study following the general perceived performance estimation process defined in ITU-T Recommendation G.1030 [50] and BT.500-11 [51]. Thus, we ask a group of users to watch the audiovisual impairment sequences and to rate these sequences using a five-point MOS scale as follows: 1 = bad, 2 = poor, 3 = fair, 4 = good, and 5 = excellent. To try to balance out the bias produced for some expectations regarding the expected quality (for example, from excellent to poor quality), sequences are presented in a random order in the survey.
Before releasing the actual survey, we carried out a pilot survey using a smaller group of users. This pilot allows us to check the correctness of the survey. Besides, we use the pilot to evaluate how the alignment process is perceived by this group of users. Thus, we present the aligned sequence in addition to its equivalent after the alignment process. We assume that, if the alignment process is correct, the perceived video quality on both sequences should be the same. We select a small group of participants for the pilot, made up of expert engineers in the research group of Universidad Rey Juan Carlos (URJC).
After the pilot, in the general availability survey, we use only the impairment sequences. This survey contains a total of 16 video sequences of 30 s each: 2 video references (game and interview) and 7 impairments: ideal network conditions, packet loss (15%, 30%, and 45%), and jitter (25 ms, 50 ms, and 75 ms) per video type (game and interview). We ask each participant to rate the 14 impairment sequences, estimating a time to complete the survey of 10 minutes. To try to get a heterogeneous user group to limit the bias per human or context IF [7], we have asked for participation in the survey using different channels: the public forum about WebRTC discuss-webrtc (https://groups.google.com/forum/#!forum/discuss-webrtc), the Reddit channel about WebRTC (https://www.reddit.com/r/WebRTC/), and our Twitter accounts.

3. Results

This section provides a comprehensive summary of the experimentation results, both for the objective and the subjective analysis. The raw data for this analysis is public in the GitHub repository (https://github.com/elastest/elastest-webrtc-qoe-meter), with the rest of the artifacts of the benchmark.

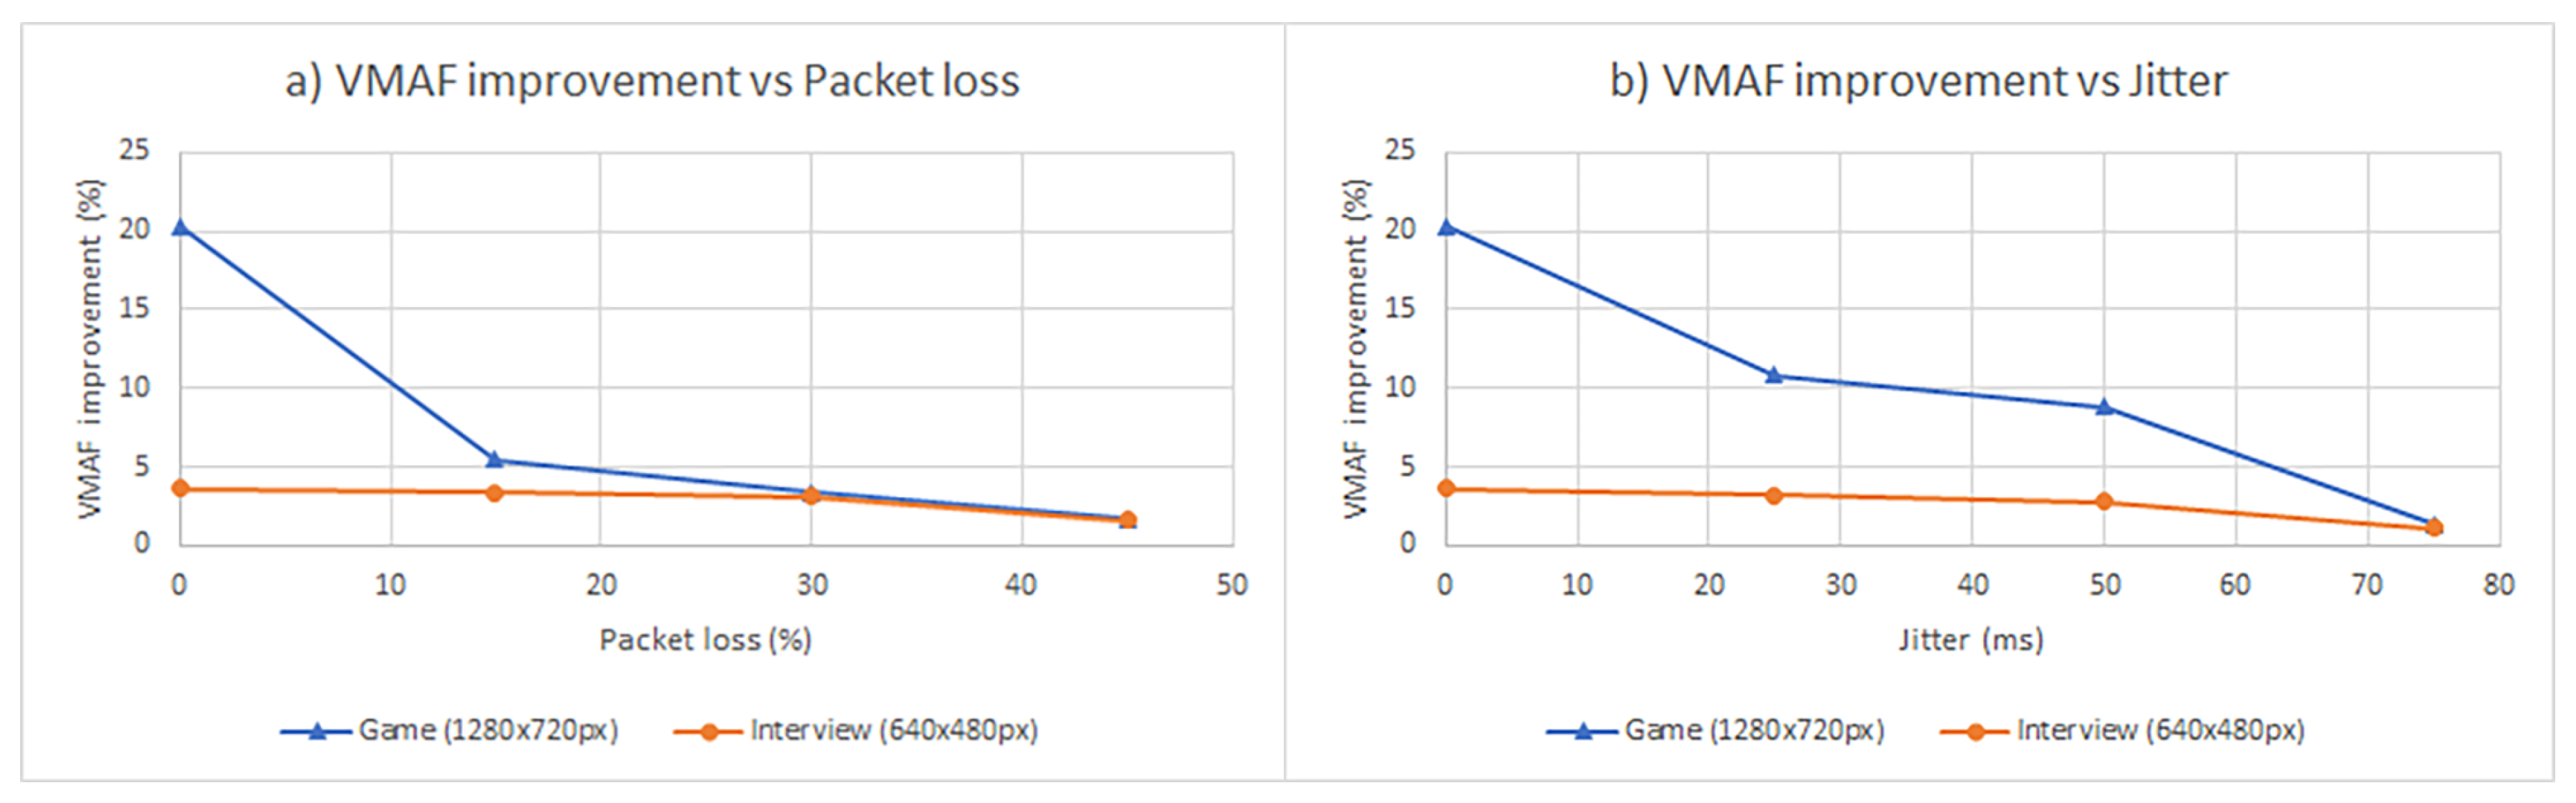
3.1. Objective Analysis

Regarding objective assessment, we have compiled different data for video (VMAF, VIFp, SSIM, MS-SSIM, PSNR, PSNR-HVS, and PSNR-HVS-M) and audio (PESQ, ViSQOL, and POLQA) for two different video sequences with different contents (interview and game). To be able to interpret the results correctly, it is essential to be aware of the value ranges for each objective model: VMAF score ranges from 0 (lowest quality) to 100 (distorted and reference video is equal) [52]. VIFp score ranges from 0 (lowest quality) and 1 (the distorted and the reference video are the same) [10]. SSIM and MS-SSIM index ranges from 0 (no structural similarity) and 1 (two identical sets of data) [11]. PSNR, PSNR-HVS, and PSNR-HVS-M range between 20 dB (lower quality) and 60 dB (good quality) [53]. PESQ, ViSQOL, and POLQA are perceptual models for audio quality in which their scores range from 1 (bad) to 5 (excellent) [18,20,54].
Figure 4 shows the average of objective outcomes for the interview sequence. The first chart (labeled as a) shows the evolution of the video quality for different packet loss scenarios (0%, 15%, 30%, and 45%). On the one hand, we display the results for VMAF, PSNR, PSNR-HVS, and PSNR-HVS-M using the primary y-axis of the chart, since these values range from 0 to 99. On the other hand, we display VIFp, SSIM, and MS-SSIM using the secondary y-axis, since the values range from 0 to 1. As expected, the video quality measured with these objective models decreases when the packet loss ratio is higher. We observe an equivalent behavior in Figure 4c, in which we calculate the video quality of the interview sequence in different scenarios of jitter (0 ms, 25 ms, 50 ms, and 75 ms). Figure 4b shows the evolution of the audio quality for the interview sequence using the same packet loss scenarios. Again, the obtained results are as expected because the audio quality decreases as long as the packet loss increases. Figure 4d shows the evolution of the audio quality for the same sequence but, this time, in the different jitter scenarios. It is relevant to observe that, this time, the three objective models under study provide from fair to good results of audio quality: PESQ average 3.72, standard deviation of 0.27; ViSQOL 4.28, standard deviation of 0.06, and POLQA 4.46, standard deviation of 0.33. According to these results, we can see that jitter does not impact much the quality estimated by the objective FR models for audio under study. It is also remarkable to observe that the audio quality can increase as long as the jitter rises (this is happening in the case of POLQA in Figure 4d). As discussed in Reference [54], this effect might occur on ViSQOL and POLQA due to the alignment and warping within their algorithms to deal with the perceptual impact of playout adjustments caused by jitter buffers.
Figure 5 shows the average of objective results for the second audiovisual input under study, i.e., the game sequence (1280 × 720 px). The results are coherent with the behavior observed in the interview sequence. Quality for video and audio are monotonically decreasing functions when using different packet loss scenarios (Figure 5a,b). The same happens with the video quality in different jitter scenarios, but again, the audio quality remains almost constant when calculated with different values of jitter: PESQ average 3.65, standard deviation of 0.2; ViSQOL average 4.46, standard deviation of 0.27; and POLQA average 4.5, standard deviation of 0.38. In light of the results, we can confirm that the packet loss rate is a relevant parameter for the objective QoE in WebRTC. When this rate is higher, the computed objective video and audio quality is lower. This behavior is coherent from the two sequences under study. On the other side, we checked that the jitter scenarios (0 ms, 25 ms, 50 ms, and 75 ms) affect the objective video quality. However, it does not affect in the same way the audio quality computed with PESQ, ViSQOL, and POLQA.
Even though the shapes of the resulting charts are similar in the two sequences under study (interview and game), a relevant difference between them is the absolute values of video quality. For example, the average of the VMAF score of the interview sequence is 76.18, with a standard deviation of 10.45 in the case of packet loss scenarios, and the average is 69.3, with a standard deviation of 15.5 when jitter happens. The VMAF average for these scenarios (packet loss and jitter) for the game sequence is 52.23 (standard deviation of 15.25) and 42.43 (standard deviation of 17.9). This result is an other relevant finding since it confirms that WebRTC calls are suitable for conversational video calls; however, the QoE is impacted when delivering complex videos.
As a final remark in the objective experimentation, we have compared the results of video quality using the video impairment sequence before and after the alignment process. The objective of this part is to quantify the level of improvement obtained thanks to the alignment process. To simplify this part, we focused on a single objective model for video: VMAF. As explained next, this model shows from notable to strong correlation with the subjective results. Focusing on the game sequence in ideal network conditions (i.e., without packet loss and jitter), we check that the VMAF obtained using the sequence before the alignment process as input is 46.17, while the VMAF obtained using the sequence but after the alignment process is 66.52. This fact supposes the alignment process improves the objective result obtained with VMAF in 20.35%. As shown in Figure 6a, this level of improvement is lower as long as the packet loss rate is higher (5.43% for 15% of packet loss, 3.33% for 30% of packet loss, and 1.67% for 45% of packet loss). We observe the same behavior in the case of jitter when assessing the game sequence (Figure 6b). Nevertheless, the results are very different when using the interview sequence. Focusing again on the ideal scenario (no packet loss nor jitter), the VMAF obtained before the alignment process is 84.83. At the same time, the result after the alignment process is 88.47 (i.e., an improvement of only 3.64%). We find equivalent outcomes in the rest of packet loss and also in the jitter scenarios (Figure 6b).
To understand the motivation of these figures, we need to think about the content of the video under test. On the one hand, the interview sequence, which always shows the first plane of a woman, does not change significantly from frame to frame. For this reason, if a frame is skipped or duplicated, the resulting VMAF does not suffer from significant biases. On the other side, the rapid movement of the game sequences causes relevant changes in the VMAF score when frames are not appropriately compared with the reference. All in all, we can conclude that the alignment process is especially relevant to assess the QoE using FR objective models when using non-conversational sequences, such as online games or sports, to name a few.

3.2. Subjective Analysis

As explained before, we use the media recordings obtained in the objective experimentation to carry out also a subjective analysis. This first part of the subjective analysis is a pilot, executed using a group of 7 experts. The objective of this pilot is two-folded. First, we want to detect potential issues in the instrument before releasing it to the community. Second, we want to evaluate the accuracy of the alignment process. To that aim, we ask the participants to evaluate the video and audio quality for the recorded test sequences after and before the alignment process. The hypothesis is that, if the alignment process is correct, the scores for both sequences should be equivalent.
Figure 7 and Figure 8 show the evolution of the video and audio quality scored in the pilot for the interview and game sequences, respectively. We can see at first glance that the shape of the functions is quite similar in all cases. The average of the difference between both results (original and alignment sequences) is 0.27 with a standard deviation of 0.46 in the case of video quality in the interview sequence and also 0.27 on average (standard deviation of 0.49) for audio. The average difference in video quality is 0.19 (standard deviation of 0.29) and 0.25 (standard deviation of 0.44) for audio in the game sequence.
In light of this result, we concluded that our alignment process does not affect the perceived quality in video and audio because expert users do not observe relevant differences between the video and audio quality in both sequences. All in all, in the next part of the subjective survey, we only use the aligned sequences. This way, we ask for participation in a survey to rate the WebRTC impairment sequences for the ideal scenario and also in the case of network problems (packet loss and jitter), giving a total of 14 videos. We obtained a total of 32 valid answers (12.5% women, 87.5% men) from 11 different countries (Colombia, Germany, India, Ireland, Mexico, Pakistan, Russia, Spain, Turkey, the United Kingdom, and the United States). The age of the participants ranges from 24 to 51 years (average 32.53 years, standard deviation of 8.26 years). Figure 9 illustrates the results. These charts show the evolution of the average MOS for video and audio for both sequences (interview and game) in the different network scenarios.
Inspecting these charts, we can observe the video/audio scores in packet loss scenarios and video in jitter scenarios result in monotonically decreasing functions. In contrast, the scores in audio quality in jitter scenarios remain almost constant. In other words, we check that the shape of the functions is equivalent to the results obtained in the objective part (Figure 4 and Figure 5).
To check the extent to which the subjective outcomes change together compared to the objective results, we calculate the correlation coefficient between the MOS results for video and audio with the data obtained in the objective experimentation. To that aim, we use the Pearson correlation, which evaluates the strength and direction of the linear relationship between pairs of continuous variables [55]. A coefficient of Pearson correlation (r) varies from 0 (no correlation) to ±1 (perfect correlation). A positive correlation indicates there is a direct relationship between the variables (i.e., change together), while a negative correlation implies an inverse relationship (i.e., change opposite).
We use the IBM SPSS (Statistical Package for the Social Sciences) Statistics toolbox to calculate the Pearson correlation between the MOS scores obtained in the subjective survey and the data from the objective experiment. This tool also provides the statistical significance (p) of the correlation. We use the value of p to reject a null hypothesis when p is lower than a given threshold. In our case, the null hypothesis ( H 0 ) is that subjective and objective outcomes are not correlated. Typically, researchers claim statistical significance when p ≤ 0.05. Nevertheless, to avoid controversy [56], we use a more stringent threshold in our research, i.e., p ≤ 0.01 [57].
Table 3 shows a summary of the Pearson correlation (r) and the statistical significance (p) of our dataset. Each column in this table corresponds to experiment network scenarios (packet loss and jitter) for each test sequence (interview and game). Each cell contains the value of r and p of the objective models (VMAF, VIFp, SSIM, MS-SSIM, PSNR, PSNR-HVS, PSNR-HVS-M, PESQ, ViSQOL, and POLQA) crossed with the MOS score from the subjective survey.
A relevant conclusion of this analysis is that none of the objective models for video and audio correlates strongly in all the studied scenarios. Regarding video, we only find a strong correlation between VMAF (r = 0.991, p = 0.009) and VIFp (r = 0.992, p = 0.010) with the MOS score in the case of the interview sequence in different scenarios of packet loss. This fact is coherent with our previous research [42]. Regarding audio, we only find a strong correlation in the same situation (interview with packet loss) between the POLQA and MOS (r = 0.993, p = 0.007).
Another significant finding is the difference between the correlation results for audio with jitter. We find reliable results in the rest of the scenarios (video/audio with packet loss and video with jitter). Nevertheless, the statistical correlation depicted in Table 3 reflects poor correlation in the audio with jitter for both sequences (interview and game). For example, the results of PESQ in the interview sequence are r = 0.445, p = 0.555, while POLQA for the same sequence is r = −0.160, p = 0.840. The motivation of this heterogeneous correlation seems to be related to the perception of the users. From an objective point of view, in light of the results presented in Section 3.1, the audio quality in jitter scenarios remains tightly clustered. Nevertheless, the video quality gets worse as long as the jitter increases. This fact seems to affect the score rated to the audio quality by the participants, and as a result, the resulting correlation in audio does not show any linear relationship.

3.3. Limitations

We have detected several limitations in the presented approach. First, the proposed alignment process for the impairment sequences is based on the OCR recognition of the frame number labeled within the video track. This process might solve some problems for detecting skipped frames. Nevertheless, the audio remains the same before and after the alignment process. This fact might cause slight differences in the duration of the video and audio tracks of the resulting aligned media.
Second, the method for participants recruitment (i.e., asking for participation using the WebRTC discuss forum, Twitter, and Reddit) is not ideal because, in practice, the range of demographics is not as heterogeneous as we would like to avoid biases. Different participant recruitment models could be considered in the future to achieve a more widespread sample.
Lastly, the chosen parameters for the jitter tests (0–70ms) have significantly less of an impact on the subjective MOS scores for audio than for video. This fact is likely as a result of the WebRTC jitter buffer using playout adjustments to deal with jitter of this magnitude so that the jitter is largely imperceptible [58]. As a result, the ability to evaluate the audio quality under jitter conditions is limited. A more comprehensive study of jitter in the future could be conducted on whether the range of jitter tested yielded a more comprehensive range of quality ratings.

4. Discussion

This paper presents a research effort in the field of QoE assessment of WebRTC applications using FR models for video (VMAF, VIFp, SSIM, MS-SSIM, PSNR, PSNR-HVS, and PSNR-HVS-M) and audio (PESQ, ViSQOL, and POLQA). We created and released as open-source a benchmark aimed to evaluate this model. Practitioners can reuse this benchmark to assess any WebRTC application, following a three-tier methodology: (i) input generation; (ii) SUT evaluation; and (iii) QoE calculation.
We have used the AppRTC video chat as SUT. Nevertheless, our benchmark is prepared to evaluate any other WebRTC application in an automated fashion. Thanks to the Monkey Patching technique, we can collect the RTCPeerConnection objects created with the JavaScript WebRTC API and, then, record the media streams using the MediaStream Recording API. All in all, we can record any WebRTC stream using this capability. Then, we use these recordings together with the reference as input of different FR models to calculate video and audio QoE. In addition to AppRTC, our GitHub repository contains test examples using other SUTs, such as Janus, OpenVidu, or WebRTC samples.
Browsers can change the bitrate to encode the media according to the estimated bandwidth in WebRTC. As a result, received WebRTC streams can be different in terms of the number of frames of the original reference. For this reason, we have designed an alignment process to compare the impairment accurately with the reference. In light of the results, we have checked that this alignment process is required when the nature of the media sent by WebRTC is not-conversational, for example, in online games or sports, to name a few.
Finally, we have carried out a subjective analysis reusing the impairment recordings obtained in the objective assessment. We aim to determine the existing correlations between the MOS scores obtained in the subjective survey with the objective results. We find that none of the FR models studied show strong correlations with the MOS outcomes for all the network scenarios (packet loss and jitter) and the different types of media sequences (conversational and online game). We believe this fact is an opportunity for future research since there is a lack of specific FR models for video and audio for real-time communications, such as WebRTC.

Author Contributions

Conceptualization, B.G.; methodology, B.G. and M.G.; software, B.G.; validation, B.G. and F.G.; investigation, B.G.; resources, F.G. and M.G.; data curation, B.G. and A.H.; writing—original draft preparation, B.G.; writing—review and editing, B.G., F.G. and A.H; visualization, B.G. and F.G.; supervision, F.G. and M.G.; project administration, F.G. and M.G.; funding acquisition, F.G. and M.G. All authors have read and agreed to the published version of the manuscript.

Funding

This work has been supported by the European Commission under project ElasTest (H2020-ICT-10-2016, GA-731535); by the Regional Government of Madrid (CM) under project EDGEDATA-CM (P2018/TCS-4499) cofunded by FSE and FEDER; by the Spanish Government under projects LERNIM (RTC-2016-4674-7) and BugBirth (RTI2018-101963-B-I00) cofunded by the Ministry of Economy and Competitiveness, FEDER, and AEI; and by Science Foundation Ireland (SFI) cofunded under the European Regional Development Fund under grant number 12/RC/2289_P2 and grant number SFI/12/RC/2077.

Conflicts of Interest

The authors declare no conflict of interest.

References

  1. García, B.; Gallego, M.; Gortazar, F.; López, L. ElasTest, an Open-source Platform to Ease End-to-End Testing; Challenges and Opportunities in ICT Research Projects—Volume 1; INSTICC: Setubal, Portugal; SciTePress: Setubal, Portugal, 2017; pp. 3–21. [Google Scholar] [CrossRef]
  2. Amirante, A.; Castaldi, T.; Miniero, L.; Romano, S.P. On the seamless interaction between WebRTC browsers and SIP-based conferencing systems. IEEE Commun. Mag. 2013, 51, 42–47. [Google Scholar] [CrossRef]
  3. Grigorik, I. High Performance Browser Networking: What Every Web Developer Should Know about Networking and Web Performance; O’Reilly Media, Inc.: Newton, MA, USA, 2013. [Google Scholar]
  4. García, B.; Gallego, M.; Gortázar, F.; Bertolino, A. Understanding and estimating quality of experience in WebRTC applications. Computing 2018, 101, 1–23. [Google Scholar] [CrossRef] [Green Version]
  5. Johnston, A.B.; Burnett, D.C. WebRTC: APIs and RTCWEB Protocols of the HTML5 Real-Time Web; Digital Codex LLC: Lilburn, GA, USA, 2012. [Google Scholar]
  6. Carlucci, G.; De Cicco, L.; Holmer, S.; Mascolo, S. Analysis and design of the google congestion control for web real-time communication (WebRTC). In Proceedings of the 7th International Conference on Multimedia Systems, Klagenfurt, Austria, 10–13 May 2016; pp. 1–12. [Google Scholar]
  7. Brunnström, K.; Beker, S.A.; De Moor, K.; Dooms, A.; Egger, S.; Garcia, M.N.; Hossfeld, T.; Jumisko-Pyykkö, S.; Keimel, C.; Larabi, M.C.; et al. Qualinet White Paper on definitions of Quality of Experience. In Proceedings of the Output from the Fifth Qualinet Meeting, Novi Sad, Serbia, 12 March 2013. [Google Scholar]
  8. Liu, T.J.; Lin, Y.C.; Lin, W.; Kuo, C.C.J. Visual quality assessment: Recent developments, coding applications and future trends. APSIPA Trans. Signal Inf. Process. 2013, 2. [Google Scholar] [CrossRef] [Green Version]
  9. Sheikh, H.R.; Bovik, A.C. Image information and visual quality. In Proceedings of the IEEE International Conference on Acoustics, Speech, and Signal Processing, Montreal, QC, Canada, 17–21 May 2004; Volume 3. [Google Scholar]
  10. Thakur, N.; Devi, S. A new method for color image quality assessment. Int. J. Comput. Appl. 2011, 15, 10–17. [Google Scholar] [CrossRef]
  11. Wang, Z.; Bovik, A.C.; Sheikh, H.R.; Simoncelli, E.P. Image quality assessment: From error visibility to structural similarity. IEEE Trans. Image Process. 2004, 13, 600–612. [Google Scholar] [CrossRef] [Green Version]
  12. Wang, Z.; Simoncelli, E.P.; Bovik, A.C. Multiscale structural similarity for image quality assessment. In Proceedings of the IEEE Thrity-Seventh Asilomar Conference on Signals, Systems & Computers, Pacific Grove, CA, USA, 9–12 November 2003; Volume 2, pp. 1398–1402. [Google Scholar]
  13. Karim, S.; He, H.; Junejo, A.; Sattar, M. Measurement of Objective Video Quality in Social Cloud Based on Reference Metric. Wirel. Commun. Mob. Comput. 2020, 2020. [Google Scholar] [CrossRef]
  14. Huynh-Thu, Q.; Ghanbari, M. Scope of validity of PSNR in image/video quality assessment. Electron. Lett. 2008, 44, 800–801. [Google Scholar] [CrossRef]
  15. Egiazarian, K.; Astola, J.; Ponomarenko, N.; Lukin, V.; Battisti, F.; Carli, M. New full-reference quality metrics based on HVS. In Proceedings of the Second International Workshop on Video Processing and Quality Metrics, Scottsdale, AZ, USA, 22–24 January 2006; Volume 4. [Google Scholar]
  16. Ponomarenko, N.; Silvestri, F.; Egiazarian, K.; Carli, M.; Astola, J.; Lukin, V. On between-coefficient contrast masking of DCT basis functions. In Proceedings of the Third International Workshop on Video Processing and Quality Metrics, Scottsdale, AZ, USA, 1–13 January 2007; Volume 4. [Google Scholar]
  17. Pinson, M.H.; Wolf, S. A new standardized method for objectively measuring video quality. IEEE Trans. Broadcast. 2004, 50, 312–322. [Google Scholar] [CrossRef]
  18. Rix, A.W.; Hollier, M.P.; Hekstra, A.P.; Beerends, J.G. Perceptual Evaluation of Speech Quality (PESQ) the New ITU Standard for End-to-End Speech Quality Assessment Part I–Time-Delay Compensation. J. Audio Eng. Soc. 2002, 50, 755–764. [Google Scholar]
  19. Sloan, C.; Harte, N.; Kelly, D.; Kokaram, A.C.; Hines, A. Objective assessment of perceptual audio quality using ViSQOLAudio. IEEE Trans. Broadcas. 2017, 63, 693–705. [Google Scholar] [CrossRef] [Green Version]
  20. Beerends, J.G.; Schmidmer, C.; Berger, J.; Obermann, M.; Ullmann, R.; Pomy, J.; Keyhl, M. Perceptual objective listening quality assessment (POLQA), the third generation ITU-T standard for end-to-end speech quality measurement part I—Temporal alignment. J. Audio Eng. Soc. 2013, 61, 366–384. [Google Scholar]
  21. García, B. Mastering Software Testing with JUnit 5: Comprehensive Guide to Develop High Quality Java Applications; Packt Publishing Ltd.: Birmingham, UK, 2017. [Google Scholar]
  22. Vucic, D.; Skorin-Kapov, L. QoE evaluation of WebRTC-based Mobile Multiparty Video Calls in Light of Different Video Codec Settings. In Proceedings of the IEEE 15th International Conference on Telecommunications (ConTEL), Graz, Austria, 3–5 July 2019; pp. 1–8. [Google Scholar]
  23. Vucic, D.; Skorin-Kapov, L. The Impact of Packet Loss and Google Congestion Control on QoE for WebRTC-Based Mobile Multiparty Audiovisual Telemeetings. In Proceedings of the International Conference on Multimedia Modeling, Thessaloniki, Greece, 8–11 January 2019; Springer: Berlin, Germany, 2019; pp. 459–470. [Google Scholar]
  24. Nunome, T.; Miyazaki, R. The Effect of Contents and Available Viewpoints on QoE of Multi-view Video and Audio over WebRTC. In Proceedings of the IEEE International Conference on Computational Science and Engineering (CSE) and IEEE International Conference on Embedded and Ubiquitous Computing (EUC), New York, NY, USA, 1–3 August 2019; pp. 80–85. [Google Scholar]
  25. Maehara, Y.; Nunome, T. WebRTC-based multi-view video and audio transmission and its QoE. In Proceedings of the IEEE International Conference on Information Networking (ICOIN), Kuala Lumpur, Malaysia, 9–11 January 2019; pp. 181–186. [Google Scholar]
  26. Husić, J.B.; Alagić, E.; Baraković, S.; Mrkaja, M. The Influence of Task Complexity and Duration when Testing QoE in WebRTC. In Proceedings of the IEEE 18th International Symposium INFOTEH-JAHORINA (INFOTEH), Jahorina, Bosnia and Herzegovina, 20–22 March 2019; pp. 1–6. [Google Scholar]
  27. Kilinc, C.; Andersson, K. A congestion avoidance mechanism for WebRTC interactive video sessions in LTE networks. Wirel. Pers. Commun. 2014, 77, 2417–2443. [Google Scholar] [CrossRef] [Green Version]
  28. Muñoz-Gea, J.P.; Aparicio-Pardo, R.; Wehbe, H.; Simon, G.; Nuaymi, L. Optimization framework for uplink video transmission in HetNets. In Proceedings of the Workshop on Mobile Video Delivery, Singapore, 19–21 March 2014; ACM: New York, NY, USA, 2014; p. 6. [Google Scholar]
  29. Tsiaras, C.; Rösch, M.; Stiller, B. VoIP-based Calibration of the DQX Model. In Proceedings of the IEEE IFIP Networking Conference (IFIP Networking), Toulouse, France, 20–22 May 2015; pp. 1–9. [Google Scholar]
  30. Vucic, D.; Skorin-Kapov, L. The impact of mobile device factors on QoE for multi-party video conferencing via WebRTC. In Proceedings of the IEEE 13th International Conference on Telecommunications (ConTEL), Graz, Austria, 13–15 July 2015; pp. 1–8. [Google Scholar]
  31. Boubendir, A.; Bertin, E.; Simoni, N. On-demand, dynamic and at-the-edge VNF deployment model application to Web Real-Time Communications. In Proceedings of the IEEE 12th International Conference on Network and Service Management (CNSM), Las Vegas, NV, USA, 22–26 October 2016; pp. 318–323. [Google Scholar]
  32. Komperda, O.; Melvin, H.; Počta, P. A black box analysis of WebRTC mouth-to-ear delays. Commun. Sci. Lett. 2016, 18, 3–10. [Google Scholar] [CrossRef]
  33. Carullo, G.; Tambasco, M.; Di Mauro, M.; Longo, M. A performance evaluation of WebRTC over LTE. In Proceedings of the IEEE 12th Annual Conference on Wireless On-demand Network Systems and Services (WONS), Cortina d’Ampezzo, Italy, 20–22 January 2016; pp. 1–6. [Google Scholar]
  34. Ammar, D.; De Moor, K.; Xie, M.; Fiedler, M.; Heegaard, P. Video QoE killer and performance statistics in WebRTC-based video communication. In Proceedings of the IEEE Sixth International Conference on Communications and Electronics (ICCE), Antalya, Turkey, 17–20 November 2016; pp. 429–436. [Google Scholar]
  35. Santos-González, I.; Rivero-García, A.; Molina-Gil, J.; Caballero-Gil, P. Implementation and Analysis of Real-Time Streaming Protocols. Sensors 2017, 17, 846. [Google Scholar] [CrossRef] [Green Version]
  36. Herrero, R. Integrating HEC with circuit breakers and multipath RTP to improve RTC media quality. Telecommun. Syst. 2017, 64, 211–221. [Google Scholar] [CrossRef]
  37. Chodorek, R.R.; Chodorek, A.; Rzym, G.; Wajda, K. A comparison of QoS parameters of WebRTC videoconference with conference bridge placed in private and public cloud. In Proceedings of the IEEE 26th International Conference on Enabling Technologies: Infrastructure for Collaborative Enterprises (WETICE), Poznan, Poland, 21–23 June 2017; pp. 86–91. [Google Scholar]
  38. Zhang, L.; Amin, S.O.; Westphal, C. VR video conferencing over named data networks. In Proceedings of the Workshop on Virtual Reality and Augmented Reality Network; ACM: New York, NY, USA, 2017; pp. 7–12. [Google Scholar]
  39. García, B.; Gortázar, F.; López-Fernández, L.; Gallego, M. WebRTC testing: Challenges and practical solutions. IEEE Commun. Stand. Mag. 2017, 1, 36–42. [Google Scholar] [CrossRef]
  40. Edan, N.M.; Al-Sherbaz, A.; Turner, S. WebNSM: A novel scalable WebRTC signalling mechanism for many-to-many video conferencing. In Proceedings of the IEEE 3rd International Conference on Collaboration and Internet Computing (CIC), San Jose, CA, USA, 15–17 October 2017; pp. 27–33. [Google Scholar]
  41. Bandung, Y.; Subekti, L.B.; Tanjung, D.; Chrysostomou, C. QoS analysis for WebRTC videoconference on bandwidth-limited network. In Proceedings of the 20th International Symposium on Wireless Personal Multimedia Communications (WPMC), Bali, Indonesia, 17–20 December 2017; pp. 547–553. [Google Scholar]
  42. García, B.; López-Fernández, L.; Gortázar, F.; Gallego, M. Practical Evaluation of VMAF Perceptual Video Quality for WebRTC Applications. Electronics 2019, 8, 854. [Google Scholar] [CrossRef] [Green Version]
  43. Garcia, B.; Lopez-Fernandez, L.; Gallego, M.; Gortazar, F. Kurento: The Swiss army knife of WebRTC media servers. IEEE Commun. Stand. Mag. 2017, 1, 44–51. [Google Scholar] [CrossRef]
  44. Chen, Y.; Wu, K.; Zhang, Q. From QoS to QoE: A tutorial on video quality assessment. IEEE Commun. Surv. Tutor. 2014, 17, 1126–1165. [Google Scholar] [CrossRef]
  45. Gouaillard, A.; Roux, L. Real-time communication testing evolution with WebRTC 1.0. Proceedeings of the IEEE Principles, Systems and Applications of IP Telecommunications (IPTComm), Chicago, IL, USA, 25–28 September 2017; pp. 1–8. [Google Scholar]
  46. Collin, M. Mastering Selenium WebDriver 3.0: Boost the Performance and Reliability of Your Automated Checks by Mastering Selenium WebDriver; Packt Publishing Ltd.: Birmingham, UK, 2018. [Google Scholar]
  47. Merkel, D. Docker: Lightweight Linux containers for consistent development and deployment. Linux J. 2014, 2014, 2. [Google Scholar]
  48. Hemminger, S. Network emulation with NetEm. In Proceedings of the Linux Conference, Canberra, Australia, 18–23 April 2005; pp. 18–23. [Google Scholar]
  49. Chong, H.M.; Matthews, H.S. Comparative analysis of traditional telephone and voice-over-Internet protocol (VoIP) systems. In Proceedings of the IEEE International Symposium on Electronics and the Environment, 2004. Conference Record, Scottsdale, AZ, USA, 10–13 May 2004; pp. 106–111. [Google Scholar]
  50. International Telecommunication Union. Recommendation G. 1030. Estimating End-to-End Performance in IP Networks for Data Applications; International Telecommunication Union: Geneva, Switzerland, 2005; Volume 42. [Google Scholar]
  51. International Telecommunication Union. Recommendation BT.500-11. Methodology for the Subjective Assessment of the Quality of Television Pictures; International Telecommunication Union: Geneva, Switzerland, 2002. [Google Scholar]
  52. Li, Z.; Aaron, A.; Katsavounidis, I.; Moorthy, A.; Manohara, M. Toward a practical perceptual video quality metric. The Netflix Tech Blog, 6 June 2016. [Google Scholar]
  53. Alvarez, A.; Cabrero, S.; Pañeda, X.G.; Garcia, R.; Melendi, D.; Orea, R. A flexible QoE framework for video streaming services. In Proceedings of the IEEE GLOBECOM Workshops (GC Wkshps), Houston, TX, USA, 5–9 December 2011; pp. 1226–1230. [Google Scholar]
  54. Hines, A.; Skoglund, J.; Kokaram, A.C.; Harte, N. ViSQOL: An objective speech quality model. EURASIP J. Audio Speech Music Process. 2015, 2015, 1–18. [Google Scholar] [CrossRef] [Green Version]
  55. Benesty, J.; Chen, J.; Huang, Y.; Cohen, I. Pearson correlation coefficient. In Noise Reduction in Speech Processing; Springer: Berlin, Germany, 2009; pp. 1–4. [Google Scholar]
  56. Amrhein, V.; Greenland, S.; McShane, B. Scientists rise up against statistical significance. Nature 2019. [Google Scholar] [CrossRef] [Green Version]
  57. Wasserstein, R.L.; Schirm, A.L.; Lazar, N.A. Moving to a world beyond “p < 0.05”. Am. Stat. 2019. [Google Scholar] [CrossRef] [Green Version]
  58. Počta, P.; Melvin, H.; Hines, A. An analysis of the impact of playout delay adjustments introduced by voip jitter buffers on listening speech quality. Acta Acust. United Acust. 2015, 101, 616–631. [Google Scholar] [CrossRef]
Figure 1. Web Real-Time Communications (WebRTC) protocol stack.
Electronics 09 00462 g001
Figure 2. Objective assessment methodology.
Electronics 09 00462 g002
Figure 3. Screenshots of AppRTC during the test execution while playing padding sequence, conversational-type reference, and game reference, respectively.
Electronics 09 00462 g003
Figure 4. Objective results for the interview sequence: (a) Video quality results using different scenarios of packet loss. (b) Audio quality results using different scenarios of packet loss. (c) Video quality results using different scenarios of jitter. (d) Audio quality results using different scenarios of jitter.
Electronics 09 00462 g004
Figure 5. Objective results for the game sequence. (a) Video quality results using different scenarios of packet loss. (b) Audio quality results using different scenarios of packet loss. (c) Video quality results using different scenarios of jitter. (d) Audio quality results using different scenarios of jitter.
Electronics 09 00462 g005
Figure 6. Level of improvement in VMAF (in percentage) comparing the impairment sequences (game and interview) before and after the alignment process. (a) VMAF improvement using different scenarios of packet loss. (b) VMAF improvement using different scenarios of jitter.
Electronics 09 00462 g006
Figure 7. Comparison of the subjective results in the pilot for the interview sequence. (a) Video quality using different scenarios of packet loss. (b) Audio quality using different scenarios of packet loss. (c) Video quality using different scenarios of jitter. (d) Audio quality using different scenarios of jitter.
Electronics 09 00462 g007
Figure 8. Comparison of the subjective results in the pilot for the game sequence. (a) Video quality using different scenarios of packet loss. (b) Audio quality using different scenarios of packet loss. (c) Video quality using different scenarios of jitter. (d) Audio quality using different scenarios of jitter.
Electronics 09 00462 g008
Figure 9. Subjective results in the general availability survey for both sequences (interview and game). (a) Video quality results using different scenarios of packet loss. (b) Audio quality results using different scenarios of packet loss. (c) Video quality results using different scenarios of jitter. (d) Audio quality results using different scenarios of jitter.
Electronics 09 00462 g009
Table 1. Summary of Full-Reference (FR) models for audio and video.
TypeFR ModelDescription
VideoVMAF (Video Multi-Method Assessment Fusion)Perceptual video quality assessment algorithm developed by Netflix, combining human vision modeling with machine learning [8]
VIF (Visual Information Fidelity)Image assessment method based on the characteristics of the Human Visual System (HVS) [9]. There are some variants, such VIFp (VIF in the pixel domain) [10].
SSIM (Structural Similarity)It measures the difference of structure between some original and impairment image in terms of luminance, contrast, and structure [11]. There are several models derived from SSIM, for example, MS-SSIM (Multi-Scale SSIM), conducted over multiples scales of subsampling [12].
MSE (Mean Squared Error)It is a straightforward metric to compute differences between two video signals [13].
PSNR (Peak Signal-to-Noise Ratio)It is the proportion between the maximum signal and the impairment noise [14]. PSNR has several variants, such as PSNR-HVS (extension of PSNR using properties of the HVS) [15] or PSNR-HVS-M (improvement of PSNR-HVS using visual masking) [16].
Video Quality Metric (VQM)Linear combination of several impairment parameters [17]
AudioPESQ (Perceptual Evaluation of Speech Quality)It is an audio quality assessment model standardized as the ITU-T recommendation P.862 [18]
ViSQOL (Virtual Speech Quality Objective Listener)FR model for audio quality assessment modeling the human speech quality perception using a spectro-temporal measure of similarity [19]
POLQA (Perceptual Objective Listening Quality Analysis)The successor of PESQ, standardized as the ITU-T recommendation P.863 [20]
Table 2. Selected papers about WebRTC and Quality of Experience (QoE) between 2014 and 2017 [21].
Ref.TitleAssessment Type
[27]A congestion avoidance mechanism for WebRTC interactive video sessions in LTE networksQoS: Packet delay, end-to-end delay, bandwidth, throughput, packet loss, jitter, bitrate
[28]Optimization framework for uplink video transmission in HetNetsObjective QoE (VQM)
[29]VoIP-based calibration of the DQX modelQoS: Jitter, latency, packet loss, bandwidth. Subjective QoE (MOS)
[30]The impact of mobile device factors on QoE for multi-party video conferencing via WebRTCSubjective QoE (MOS)
[31]On-demand, dynamic, and at-the-edge VNF deployment model application to web real-time communicationsQoS: Call setup time, end-to-end delay, jitter
[32]A black box analysis of WebRTC mouth-to-ear delaysQoS: End-to-end delay, bitrate, jitter
[33]A performance evaluation of WebRTC over LTEQoS: Throughput, jitter, packet loss
[34]Video QoE killer and performance statistics in WebRTC-based video communicationQoS: Throughput, bandwidth, packet loss, bitrate, picture loss indication, bucket delay. Subjective QoE
[35]Implementation and analysis of real-time streaming protocolsQoS: Call setup time, end-to-end delay
[36]Integrating HEC with circuit breakers and multipath RTP to improve RTC media qualityObjective QoE (PESQ and PEVQ)
[37]A comparison of QoS parameters of WebRTC video conference with conference bridge placed in private and public cloudQoS: Throughput, end-to-end delay, error rate
[38]VR video conferencing over named data networksQoS: End-to-end delay
[39]WebRTC testing: Challenges and practical solutionsQoS: End-to-end delay. Objective QoE (PESQ, SSIM, and PSNR)
[40]WebNSM: A novel scalable WebRTC signalling mechanism for many-to-many video conferencingQoS: Bandwidth. Subjective QoE
[41]QoS analysis for WebRTC video conference on bandwidth-limited networkQoS: Bandwidth, jitter, bitrate, frame rate, packet rate, packet loss, latency, packet delay
Table 3. Pearson correlation (r) and statistical significance (p) of the subjective (MOS) for video and audio compared to the objective results (VMAF, VIFp, SSIM, MS-SSIM, PSNR, PSNR-HVS, and PSNR-HVS-M; PESQ, ViSQOL, and POLQA) for the two types of sequences (interview and game) in the different network scenarios (packet loss and jitter).
MOS
Interview with Packet LossInterview with JitterGame with Packet LossGame with Jitter
VMAFr = 0.991r = 0.938r = 0.983r = 0.966
p = 0.009p = 0.062p = 0.017p = 0.034
VIFpr = 0.992r = 0.954r = 0.987r = 0.953
p = 0.010p = 0.046p = 0.013p = 0.047
SSIMr = 0.981r = 0.952r = 0.951r = 0.957
p = 0.007p = 0.048p = 0.049p = 0.043
MS-SSIMr = 0.998r = 0.925r = 0.943r = 0.962
p = 0.006p = 0.075p = 0.057p = 0.038
PSNRr = 0.988r = 0.946r = 0.977r = 0.974
p = 0.012p = 0.054p = 0.023p = 0.026
PSNR-HVSr = 0.987r = 0.951r = 0.979r = 0.975
p = 0.013p = 0.049p = 0.021p = 0.025
PSNR-HVS-Mr = 0.987r = 0.953r = 0.980r = 0.976
p = 0.013p = 0.047p = 0.020p = 0.024
PESQr = 0.989r = 0.445r = 0.970r = 0.671
p = 0.006p = 0.555p = 0.030p = 0.329
ViSQOLr = 0.973r = −0.160r = 0.981r = 0.602
p = 0.027p = 0.840p = 0.019p = 0.398
POLQAr = 0.993r = 0.227r = 0.959r = 0.500
p = 0.007p = 0.773p = 0.041p = 0.500

