Article

Optimizing Energy Consumption in the Home Energy Management System via a Bio-Inspired Dragonfly Algorithm and the Genetic Algorithm

1
Faculty of Electrical & Computer Engineering, University of Engineering and Technology, Peshawar 25000, Pakistan
2
Endicott College of International Studies, Woosong University, Daejeon 300-718, Korea
3
Department of Electronics Engineering, Hankuk University of Foreign Studies, Yongin 17035, Korea
*
Authors to whom correspondence should be addressed.
Electronics 2020, 9(3), 406; https://doi.org/10.3390/electronics9030406
Submission received: 13 January 2020 / Revised: 5 February 2020 / Accepted: 15 February 2020 / Published: 28 February 2020
(This article belongs to the Special Issue Transforming Future Cities: Smart City)

Abstract

:
Due to the exponential increase in the human population of this bio-sphere, energy resources are becoming scarce. Because of the traditional methods, most of the generated energy is wasted every year in the distribution network and demand side. Therefore, researchers all over the world have taken a keen interest in this issue and finally introduced the concept of the smart grid. Smart grid is an ultimate solution to all of the energy related problems of today’s modern world. In this paper, we have proposed a meta-heuristic optimization technique called the dragonfly algorithm (DA). The proposed algorithm is to a real-world problem of single and multiple smart homes. In our system model, two classes of appliances are considered; Shiftable appliances and Non-shiftable appliances. Shiftable appliances play a significant role in demand side load management because they can be scheduled according to real time pricing (RTP) signal from utility, while non-shiftable appliances are not much important in load management, as these appliances are fixed and cannot be scheduled according to RTP. On behalf of our simulation results, it can be concluded that our proposed algorithm DA has achieved minimum electricity cost with a tolerable waiting time. There is a trade-off between electricity cost and waiting time because, with a decrease in electricity cost, waiting time increases and vice versa. This trade-off is also obtained by our proposed algorithm DA. The stability of the grid is also maintained by our proposed algorithm DA because stability of the grid depends on peak-to-average ratio (PAR), while PAR is reduced by DA in comparison with an unscheduled case.

1. Introduction

In today’s developing era, everything is changing very quickly. In all aspects of life, things are changing and improving to provide maximum comfort to the end users. Every researcher is exploring the unseen world to use it for benefits of human beings. In those research fields, one major research area is energy optimization. Electrical energy is used for so many purposes such as in our homes, offices, industries, commercial buildings, educational institutes, research labs, vehicles, hospitals, and even in transportation nowadays. It is quite noticeable that the electricity usage is increasing day by day. Every day brings more buildings, such as power consumption centers, and the amount of available energy is constant because a power station produces only a specified amount of energy for a specified period of time and the amount of generating energy can only be increased if the structure of the entire generating station is changed, which is impossible. The whole structure can not be changed due to intensification in energy demand. To overcome this problem, different techniques have been used until now. These techniques or algorithms are of a different nature; some of them are based on mathematical models, some are nature inspired algorithms, and some of them are bio-inspired algorithms. Researchers model their problem according to these algorithms and try to find ideal or near ideal solutions to their problems.
As mentioned earlier, a limited quantity of energy is usually available for most of the users. That is why we need to utilize the energy intelligently and efficiently. As a result, the idea of Smart Grid (SG) was presented. SG is not much more than a Traditional Grid (TG), but, before interpreting an TG as an SG, certain additional technologies must be integrated into TG like Smart/Intelligent Control Systems, Information Technology, and Cyber security, which, in turn, make a Cyber-Physical System as exploited by a Smart Grid Network [1], which is mandatory for the reliable operation of a SG. That’s why the term ‘smart’ is used for it. SG is actually a complicated structure composed of many sections. A service is offered by SG called Demand Side Management (DSM) where the appliances operate according to the RTP signal. DSM is the modification of consumer’s demand for energy consumption. DSM provides two services ‘Energy Management’ and ‘Demand Response’ (DR). DR is a financial strategy used by electric utility companies to compel their users to reduce or shift energy consumption from high cost hours to low cost hours of the day. DSM and DR focus on the intelligent utilization of energy resources. DR provides different benefits to the end electricity users [2]. It can be achieved through two techniques: Incentive-based and Price-based [3]. In an incentive-based technique, the user’s appliance is switched to an ON/OFF state by sending a short message to the smart home (SH); when a high peak is detected, the appliance is switched to off state and vice versa. Thus, in this way, the PAR is decreased by the company, which is the main objective in an optimization problem. In the price-based program, the user is motivated to use their appliances during low price hours or off-peak hours. If the user schedules his appliances in low cost hours; as a result, he will be charged less for one unit of electricity which will bring the effective decrease in his electricity bill. Actually, a trade-off among cost and user waiting time exists, so scheduling can disturb the user’s comfortability if the scheduling is not intelligent. Thus, a user can decrease his energy consumption and PAR via cooperative relationship between the SM and the electric company [4]. According to [5], electricity consumption can be decreased 10–30% by scheduling of appliances intelligently. It shows that scheduling can perform well in the objectives of an optimization problem. SG also integrates renewable energy resources (RES) and sensors to make the procedures more user friendly and transparent [6]. RES are used in emergencies and in situations whenever catastrophes occur.
Researchers try to capture the natural phenomenon in their algorithms, by capturing several nature-inspired, natural phenomena, bio-inspired and meta heuristic inspired algorithms were developed. They have also explored and analyzed some other algorithms for problems related to energy optimization like: Bio-inspired Genetic Algorithms (GAs) and Cuckoo Search Algorithm (CSAs) [7]. Therefore, a new meta-heuristic optimization algorithm is proposed in this research paper, named DA [8], for minimization of consumed energy cost, PAR, and user waiting time. The simulation results are compared with a well-known optimization algorithm, GA.

2. Literature Review

In the past few decades, particularly in the last two decades, a lot of work has been carried out in the research domain of energy optimization. Different algorithms have been proposed and implemented successfully in the field of energy optimization. In [9], the authors have proposed an hour-ahead DR algorithm for EMSs in a home. In this work, the authors have presented a steady price prediction model, whose working principle is based on ANN, that is used for dealing with the uncertainty in pricing signals from utility in the future. The home load is categorized as shiftable, non-shiftable, and controllable appliances. They have reduced the user electricity bill and discomfort due to the scheduling of appliances. However, PAR is not taken into consideration. In [10], the authors have used TLBO, EDE, and their hybrid version EDTLA for an efficient EMS to deal with energy cost and minimize user discomfort in terms of waiting time. In [11], an HEMS is proposed using EDE, HSA and their hybrid v for a version named harmony EDE (HEDE) for optimal use of the existing resources of energy to reduce cost and PAR. However, they did not include the RES to save energy. Wu et al. [12] have proposed a stochastic dynamic programming framework for efficient HEMS with PEV energy storage. They have reduced electricity cost. However, PAR is not taken into consideration. Similarly, in [13], the authors have used GA, MFO, and hybridization of these two, named TG-MFO for efficient EMS in homes. In [14], the authors combined wind, PV, and fuel cells to make a hybrid energy system, by using PSO. The main theme of this work was to achieve maximum energy using a controlling strategy. In [15], the authors have used WDO, HSA, GA, and hybridization of GA and HSA, named GHSA for efficient HEMS to reduce the electricity bill and PAR. In [16], the authors have proposed a hybrid version of GA and TLBO, named TLGO, to achieve minimum energy cost and PAR. In [17], the authors have used GOA and CSA for efficient EMS in industries to reduce cost and PAR.
In [18], the authors have categorized the home appliances as power flexible and time flexible in order to achieve maximum reduction in the electricity cost and reduce the waiting time. In [19], the authors have proposed a hybrid optimization algorithm, named bird-mating optimization, for achieving voltage balancing and mitigation of the deviation, so that power could be supplied efficiently. In [20], the authors have proposed a hybrid version of CSA and EWA. They have applied the concept of re-scheduling the appliances, if they are interrupted after scheduling, due to which the authors have claimed 50.6% reduction in the cost, using RTP signaling. In [21], the authors have depicted a review of the research articles using heuristic techniques for energy optimization in smart homes. In [22], the authors have proposed GOA and BFA for EMS in an office, for reduction of electricity bill and PAR. The authors have claimed 34.69% reduction in electricity bill using GOA and 37.47% reduction in electricity bill using BFA. Similarly, in [23], the authors have proposed GA with RTP and IBR price signaling for reduction of electricity costs and PAR. Furthermore, solar energy as RES is also added for further reduction of electricity cost. In [24], the authors have analyzed and compared GA and CSA for total cost, PAR reduction, and waiting time, where he simulated the results through MATLAB and presented that the cost is reduced by 22.84% using GA and 21.47% reduction is achieved using CSA, while PAR is reduced to 3.63 for GA (18.24% reduction) and 3.7198 for CSA (19.00% reduction). From these results, it is clear that GA is better for costs while CSA is better for reduction of PAR. In all of this research, the algorithms carry out scheduling of appliances in accordance with the electricity price signal provided by the electric utility company. Every electricity price signal comprises high and low peak hours designed by the utility. The electricity price signal may be of different time slots; in some works, the authors considered electricity price signals of 48 time slots and some authors considered the electricity price signal of 24 time slots. The electric utility companies encourage the costumers to operate their appliances in low peak hours instead of random operation or operating in high peak hours. In this way, the end users or customers are charged less as compared to un-scheduled load cost. Therefore, all algorithms try to shift the appliances to off-peak hours from high peak hours of the day. In [25], the authors have proposed CP DR energy optimization in a smart home for energy cost reduction. They have transformed MIP to CP for efficient optimization of household appliances. In [26], the authors have proposed an optimal scheduling for micro-grid DG units, using MVPA to reduce operational cost. In [27], the authors have proposed a modified version of CSA, i.e., a self-adaptive step-size version for solving ED issues, particularly, for large-scale systems. In [28], the authors have proposed a GWO algorithm for efficient energy optimization, and claim 33.185% reduction in the operational cost. In [29], the authors have proposed a microgrid connected with main grid for reducing energy cost and PAR using GWO, BPSO, GA, and WDO optimization techniques. They have also made hybrid versions of different algorithms for getting more good results. In [30], the authors have proposed a DC micro-grid, which consists of PV, fuel cells, and batteries for smart homes EMS to reduce the generation cost. They have used ABC for this purpose. In [31], the authors have used GA and BPSO for efficient HEMS. The authors have proposed a hybrid version named GAPSO to improve their results. This literature review gives an idea behind the use of different optimization algorithms for energy cost and PAR reduction intelligently and efficiently. However, there is always a trade-off between cost reduction and consumer discomfort in terms of waiting time, when appliances are scheduled from on peak hours to off peak hours.

3. Proposed System Model

Efficient utilization of energy in SG is authorized by DSM. DR and DS Control activities are the key factors of DSM for customers. In this research, a system model is proposed for a single utility and number of users. For computing hourly power consumption of every end user, SMs are installed in every SH. The purpose of the smart meter is to communicate the power consumed by the user to the utility, communicate the pricing signal to the EMC, and also to communicate the feedback of each appliances to the utility for the billing purpose and other benefits of the consumer and utility. The power utility is connected to the EMC. In EMC, there is bidirectional communication flow and unidirectional power flow in real time. We have considered a set of 12 appliances A A p p = A A p p 1 , A A p p 2 , A A p p 3 , , A A p p n , in our proposed system model. It is assumed that every appliance of our system model is capable of communicating with EMC using GSM technology. The purpose of EMC is to schedule all the appliances according to the pricing signal provided by the utility. The complete details of the system model are shown in Figure 1.
For the goal of optimization to be achieved, each appliance should complete its operation in the scheduled time slot. Here, in this work, we considered 24 time slots per day, one time slot is equal to 1 h, and the unit price of each hour is varied according to the RTP signal. Furthermore, we have classified our appliances to two classes, which is explained in the next section.

3.1. Classification of Load

For evaluation of the objective function of our suggested scheme, we assumed two real-world scenarios in our research; first, we check the performance of our suggested scheme for single and multiple smart homes. In each smart home, we assumed a set of appliances; for simplicity, we have classified our appliances into two classes (Class A and Class B). In Class A, we have placed shiftable appliances while, in Class B, we have placed non-shiftable appliances. For every smart home, let A n = a s + a n s strates two classes of appliances, where a s represents shiftable appliances, and a n s represents non-shiftable appliances, respectively. The time horizon of one day is explained below:
t ϵ T , , T = t 1 , t 2 , t 3 , t 4 , , t 24 .
Normally, in every home, people use different appliances according to their daily needs. In every home, the living style and habits of people vary according to their routine, which is why the energy usage and length of operational time (LOT) of their appliances must be different from one another. In this research work, we assumed 12 different appliances in every smart home. The power rating, starting time, finishing time, and LOT of each appliance are depicted in Table 1.

3.1.1. Shiftable Appliances

Shiftable appliances is a class of those appliances, that can be shifted to any time slot in 24 h. In addition, it is also possible to interrupt the operation of these appliances. We placed the coffee maker, printer, microwave oven, laptop, desktop, vacuum cleaner, electric car, iron, washing machine, and the hair dryer in this group. Let a s be the combination of shiftable appliances and A s ϵ a s demonstrates all the appliances in this class as shiftable appliances. Here, λ s is the power consumption of each appliances in this class ρ ( t ) , presents the unit price, ϵ s , which represents a time horizon of one day, and α a ( t ) shows the Active/Inactive status of the appliances. The total energy consumption and its respective cost for one day for a single home, and thirty homes is shown in the following mathematical relations:
Total energy consumption:
E s = α s ϵ A n ( t = 1 24 λ s × × α s ( t ) )
Total cost of consumed energy for shiftable appliances in a single home:
σ α T o t a l s = α s ϵ A n ( t = 1 24 λ s × ρ ( t ) × α s ( t ) )
Total cost of consumed energy for shiftable appliances in thirty homes:
φ α T o t a l s = H o m e = 1 30 ( α s ϵ A n ( t = 1 24 λ s × ρ ( t ) × α s ( t ) ) )
where α ( t ) represents the ON/OFF state of the appliance and ρ ( t ) represents the unit price.

3.1.2. Non-Shiftable Appliances

This class of appliances are also called fixed load appliances. It means that, shifting from one time slot to other time slot or interrupting during operation time is not possible in such type of appliances. Non-shiftable appliances need a fixed time for the finishing of their operational time slot. Refrigerator and interior lightening are placed in this class. Let α n s show each of the nonshiftable appliances in A n s set of non-shiftable appliances. Here, λ n s represents the power consumption of each non-shiftable appliance, ρ ( t ) represents the unit price, ϵ n s presents a time horizon of one day, and α n s ( t ) represents the Active/Inactive status of appliances in this class. Total energy consumption of one day is shown in the following mathematical relation:
Total Energy Consumption:
ϵ n s = α n s ϵ A n s ( t = 1 24 λ n s × α n s ( t ) )
An end user executes these appliances in an un-scheduled manner, due to the non-shiftable nature of appliances in this class, the customers pay a high amount because the demanded time slot is high pricing time. A high price is paid because of high PAR value. To retain the equilibrium between energy generation and consumption, the utility charges high prices for consumption of electricity in demanded hours. For non-shiftable appliances, the cost consumption for one day of single and multiples homes is shown in the following mathematical relations:
Cost Consumption of single home:
σ α T o t a l n s = α n s ϵ A n ( t = 1 24 λ n s × ρ ( t ) × α n s ( t ) )
Cost Consumption of thirty homes:
φ α T o t a l n s = H o m e = 1 30 ( α n s ϵ A n ( t = 1 24 λ n s × α n s ( t ) ) )
φ α T o t a l = φ α T o t a l s + φ α T o t a l n s

4. Pricing Signal

Many international energy system operators issue hourly Real Time Pricing (RTP) signals every day to the consumers. The RTP signal is a key feature of a smart meter which benefits the end user as well as the utility. The RTP signal is provided to the users via smart energy meters, the users modify their daily needs according to the RTP signal, and the EMC scheduled the smart appliances according to the proposed algorithm. The day-ahead energy price signal of the New York Independent System Operator (NYISO), shown in Figure 2, accessed on 27th December 2019, is reproduced and used for cost calculation [32].

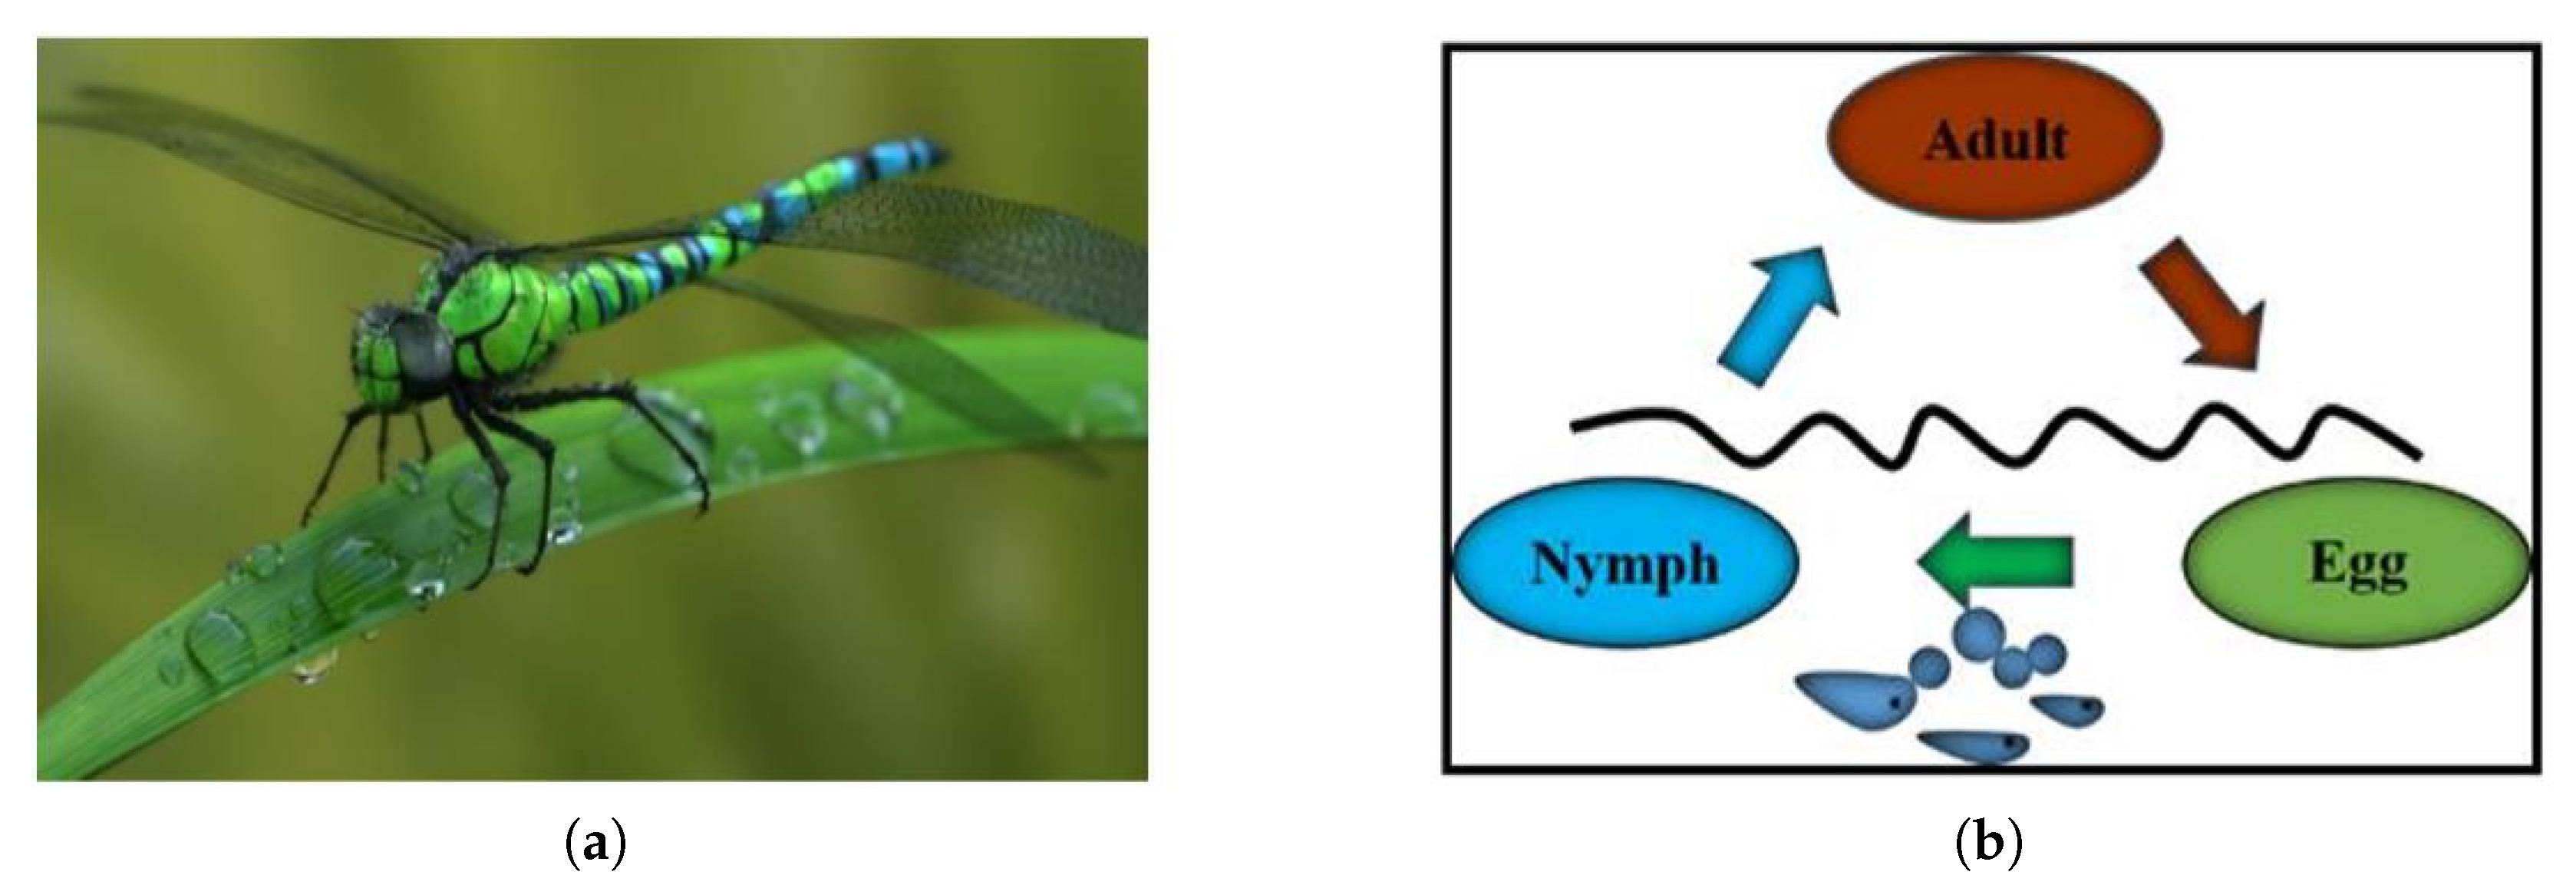
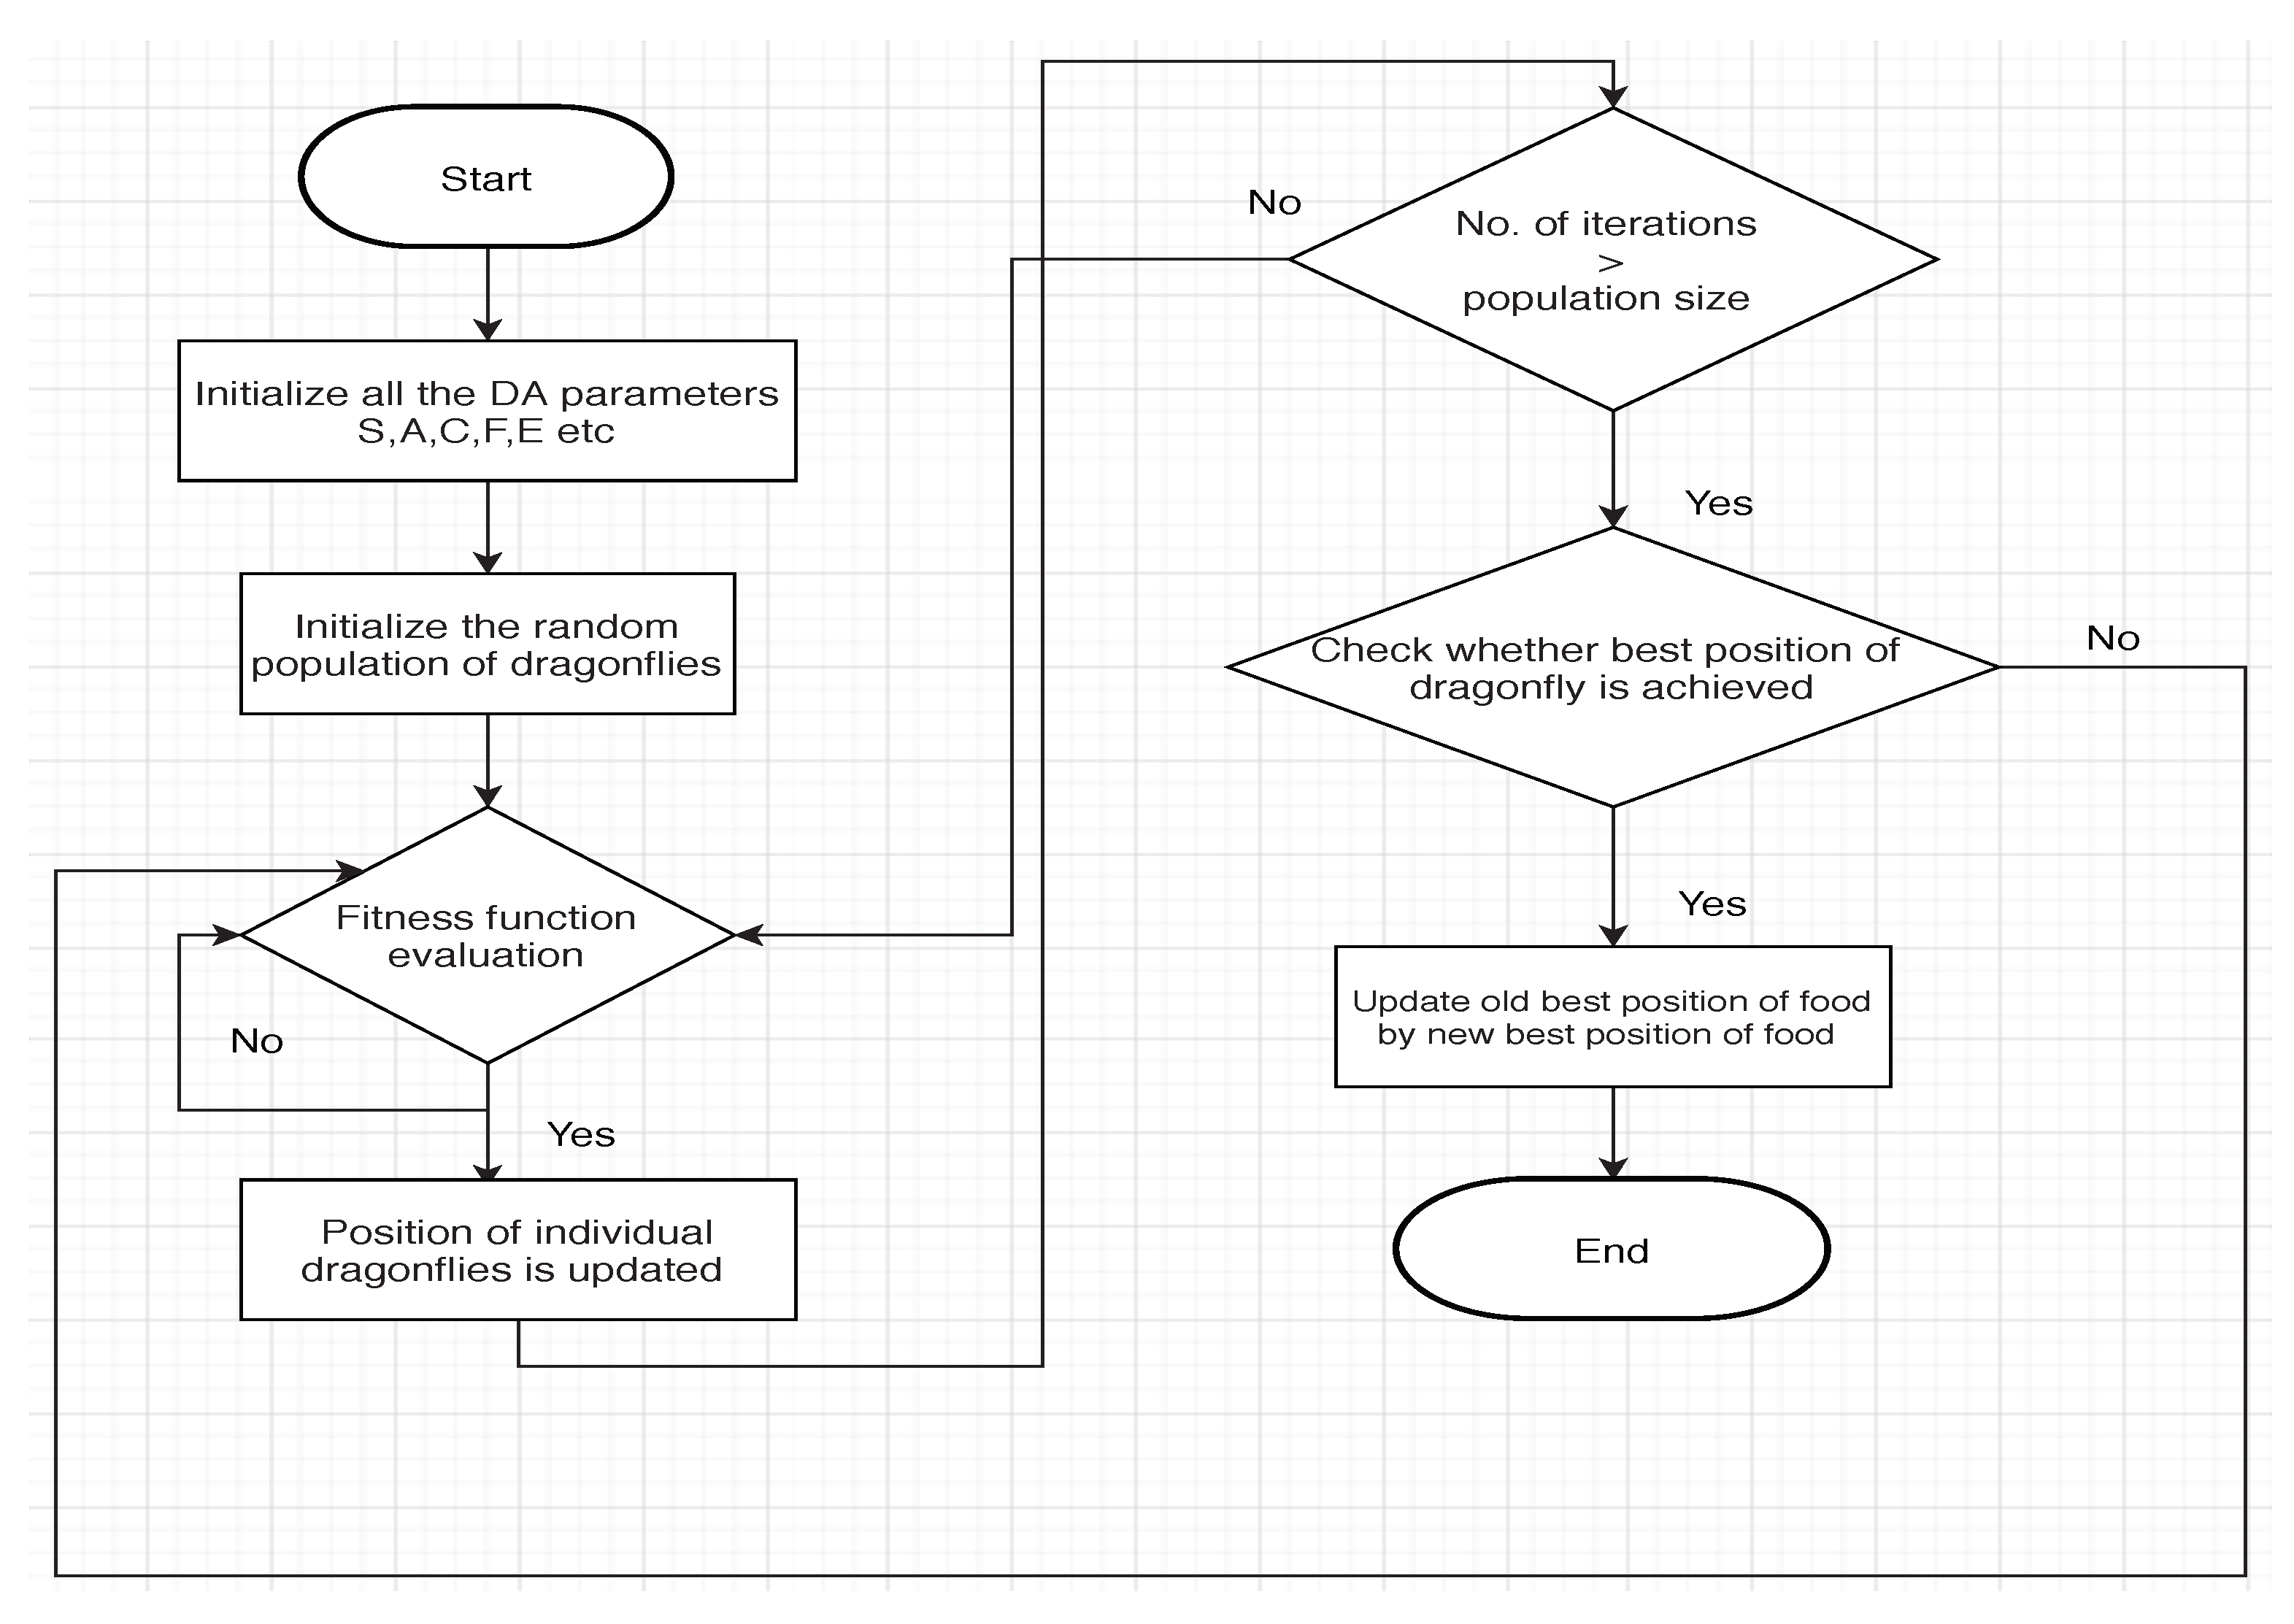
5. Proposed Dragonfly Algorithm

To achieve low cost, low PAR, and minimum waiting time, we have proposed DA, brief details of which are given below:
A dragonfly is a decorative insect, its scientific name is Anisoptera and belongs to kingdom Animalia, and it is classified to phylum Arthropoda. The average life span of a dragonfly is six months. The dragonfly insect is found in 3000 different species around the world [33]. There are two main phases in the life-cycle of a dragonfly, which includes: nymph and adult. The dragonfly spends most of his lifespan as a nymph and then become an adult after passing the metamorphism stage as shown in Figure 3.
Dragonflies are placed in the class of small predators; they rely on other small insects for their survival. They also prey aquatic flies and even small fishes. The swarming nature is an interesting fact of dragonflies. The purpose behind the swarming of dragonflies is: hunting and migration. Hunting is static (stationary) swarm and migration is dynamic (traveling) swarm.
In the static behavior of swarm dragonflies in small groups over a specific area to make prey of all other flying insects such as butterflies, mosquitoes, and many other small insects [34]. On other hand, in a dynamic swarm, a large number of dragonflies migrate from one place to another place over a long distance for finding a best habitat for their living [35].
The mentioned two swarming behaviors are similar to the main phases of optimization using meta-heuristics: exploration and exploitation. The static swarm is the main goal of exploration, while a dynamic swarm is favorable in the exploitation phase. The two swarming styles are briefly explained and mathematically represented in the next section.
  • Separation represents the static collision prevention of dragonflies in the swarm from other dragonflies of the nearby vicinity.
  • The alignment shows the velocity matching of one dragonfly in the swarm to the other individual dragonfly in the same swarm of dragonflies.
  • Cohesion represents the struggle of dragonflies toward the center of the mass of the nearby individual dragonflies.
All of the individual dragonflies should attract themselves towards the food sources and prevent their selves from the enemies to survive, which is the main goal of the swarming nature of dragonflies. In consideration of these two behaviors, five main position updating factors are shown in the equation below:
Separation can calculated by the following equation:
S i = k = 1 N Z Z k
where Z represents the position of the current dragonfly, while Z k represents the position of a k-th nearby dragonfly, and N is the number of all other nearby individual dragonflies.
Alignment can calculated by the following equation:
A i = N k = 1 V k N
where V k is the velocity of a k-th dragonfly nearby.
Cohesion can calculated by the following equation:
C i = N k = 1 X k N Z
where Z shows the position of the current dragonfly, while Z k represents the position of the k-th nearby dragonfly and N is the number of all other nearby individual dragonflies.
Attraction toward the food can be calculated by the following equation:
F i = Z + Z
where Z shows the position of the current dragonfly, and Z + represents the position of the target food.
Distraction from the enemy can be calculated by the following equation:
E i = Z + Z
where Z shows the position of current dragonfly and Z represents the position of the enemy.
Two vectors are used for updating the position of dragonflies and simulations of their movement, in which two vectors are: step ( Δ Z ) and position (Z). Δ Z represents the direction of the motion of dragonfly and the step vector is represented mathematically by the following equation:
Δ Z t + 1 = ( s S e p i + a A l i g i + c C o h i + f F o o d i + e E n e m y i ) + w Δ Z t
where ( s , a , c , f , e , w ) are the swarm factors during an optimization process.
The step vector is represented mathematically by the following equation:
Z t + 1 = Z t + δ Z t + 1
In the two equations above, t shows the present iteration.
For the arbitrariness, stochastic nature and exploration of dragonflies, the flying over the search area is necessary, using an arbitrary walk (levy flight) in case there is no nearby solution for finding the position of individual in the swarm; for solving this issue, the position of an individual can be calculated by the following equation:
Z t + 1 = Z t + L e v y ( d ) × Z t
In the above equation, t shows the present iteration, and d is the dimension of the position vector. The levy flight can be found by the following equation:
L e v y ( Z ) = 0.01 × c 1 | c 2 | β × 1 σ
where c 1 and c 2 are two randomly selected constants between 0 and 1; β is also a constant number that is selected according to the situation of the problem. The step by step process of the proposed DA is depicted in Algorithm 1 i.e., Pseudocode and Figure 4 i.e., flow-chart:
Algorithm 1: Pseudocode of the proposed Dragonfly Algorithm
Electronics 09 00406 i001

6. Results and Discussion

Simulations are conducted for achieving our objectives to check the effectiveness, productiveness, and validity of our proposed algorithm. The central aim of our simulations is to show the optimal scheduling for both possible scenarios, i.e., single smart home for single and thirty days and, secondly, for thirty smart homes for single and thirty days. Due to the random nature of the heuristic techniques, we have considered the results after average of 50 runs. In each home, we considered 12 smart appliances with different lifestyles. They may have different LOTs and different appliances’ power ratings. All appliances of our assumed cases are tabulated and briefly explained in Table 1 along with their parametric values and types. For example, appliances may be of shiftable or non-shiftable class. Only shiftable appliances are taking part in the scheduling process, while non-shiftable appliances do not take part in scheduling process, as they must complete their operational time according to their fixed allotted time slots. The operational time for refrigerator is from 8:00 a.m. to 7:59 a.m. on the next day and that of interior lightening is 6:00 p.m. to 12:00 a.m. These two appliances must complete their operational time in these hours without interruption and shifting. The simulation results consist of daily basis hourly load, hourly cost, total cost, waiting time, and PAR for single and thirty homes, respectively.

6.1. Daily Basis Hourly Load

Figure 5 depicts the daily basis hourly load curve for a randomly selected single home and thirty homes for 24 h. According to the utility provided DAP signal, shown in Figure 2, peak hours range from 4:00 p.m. to 8:00 p.m., during which the energy prices are high. It is therefore clear from Figure 5a,b that both algorithms, i.e., GA and DA, have shifted the load from high price hrs to low price hrs. This shifting has drastically reduced the consumed energy cost. In comparison to GA, DA shows a bit of a uniform response.

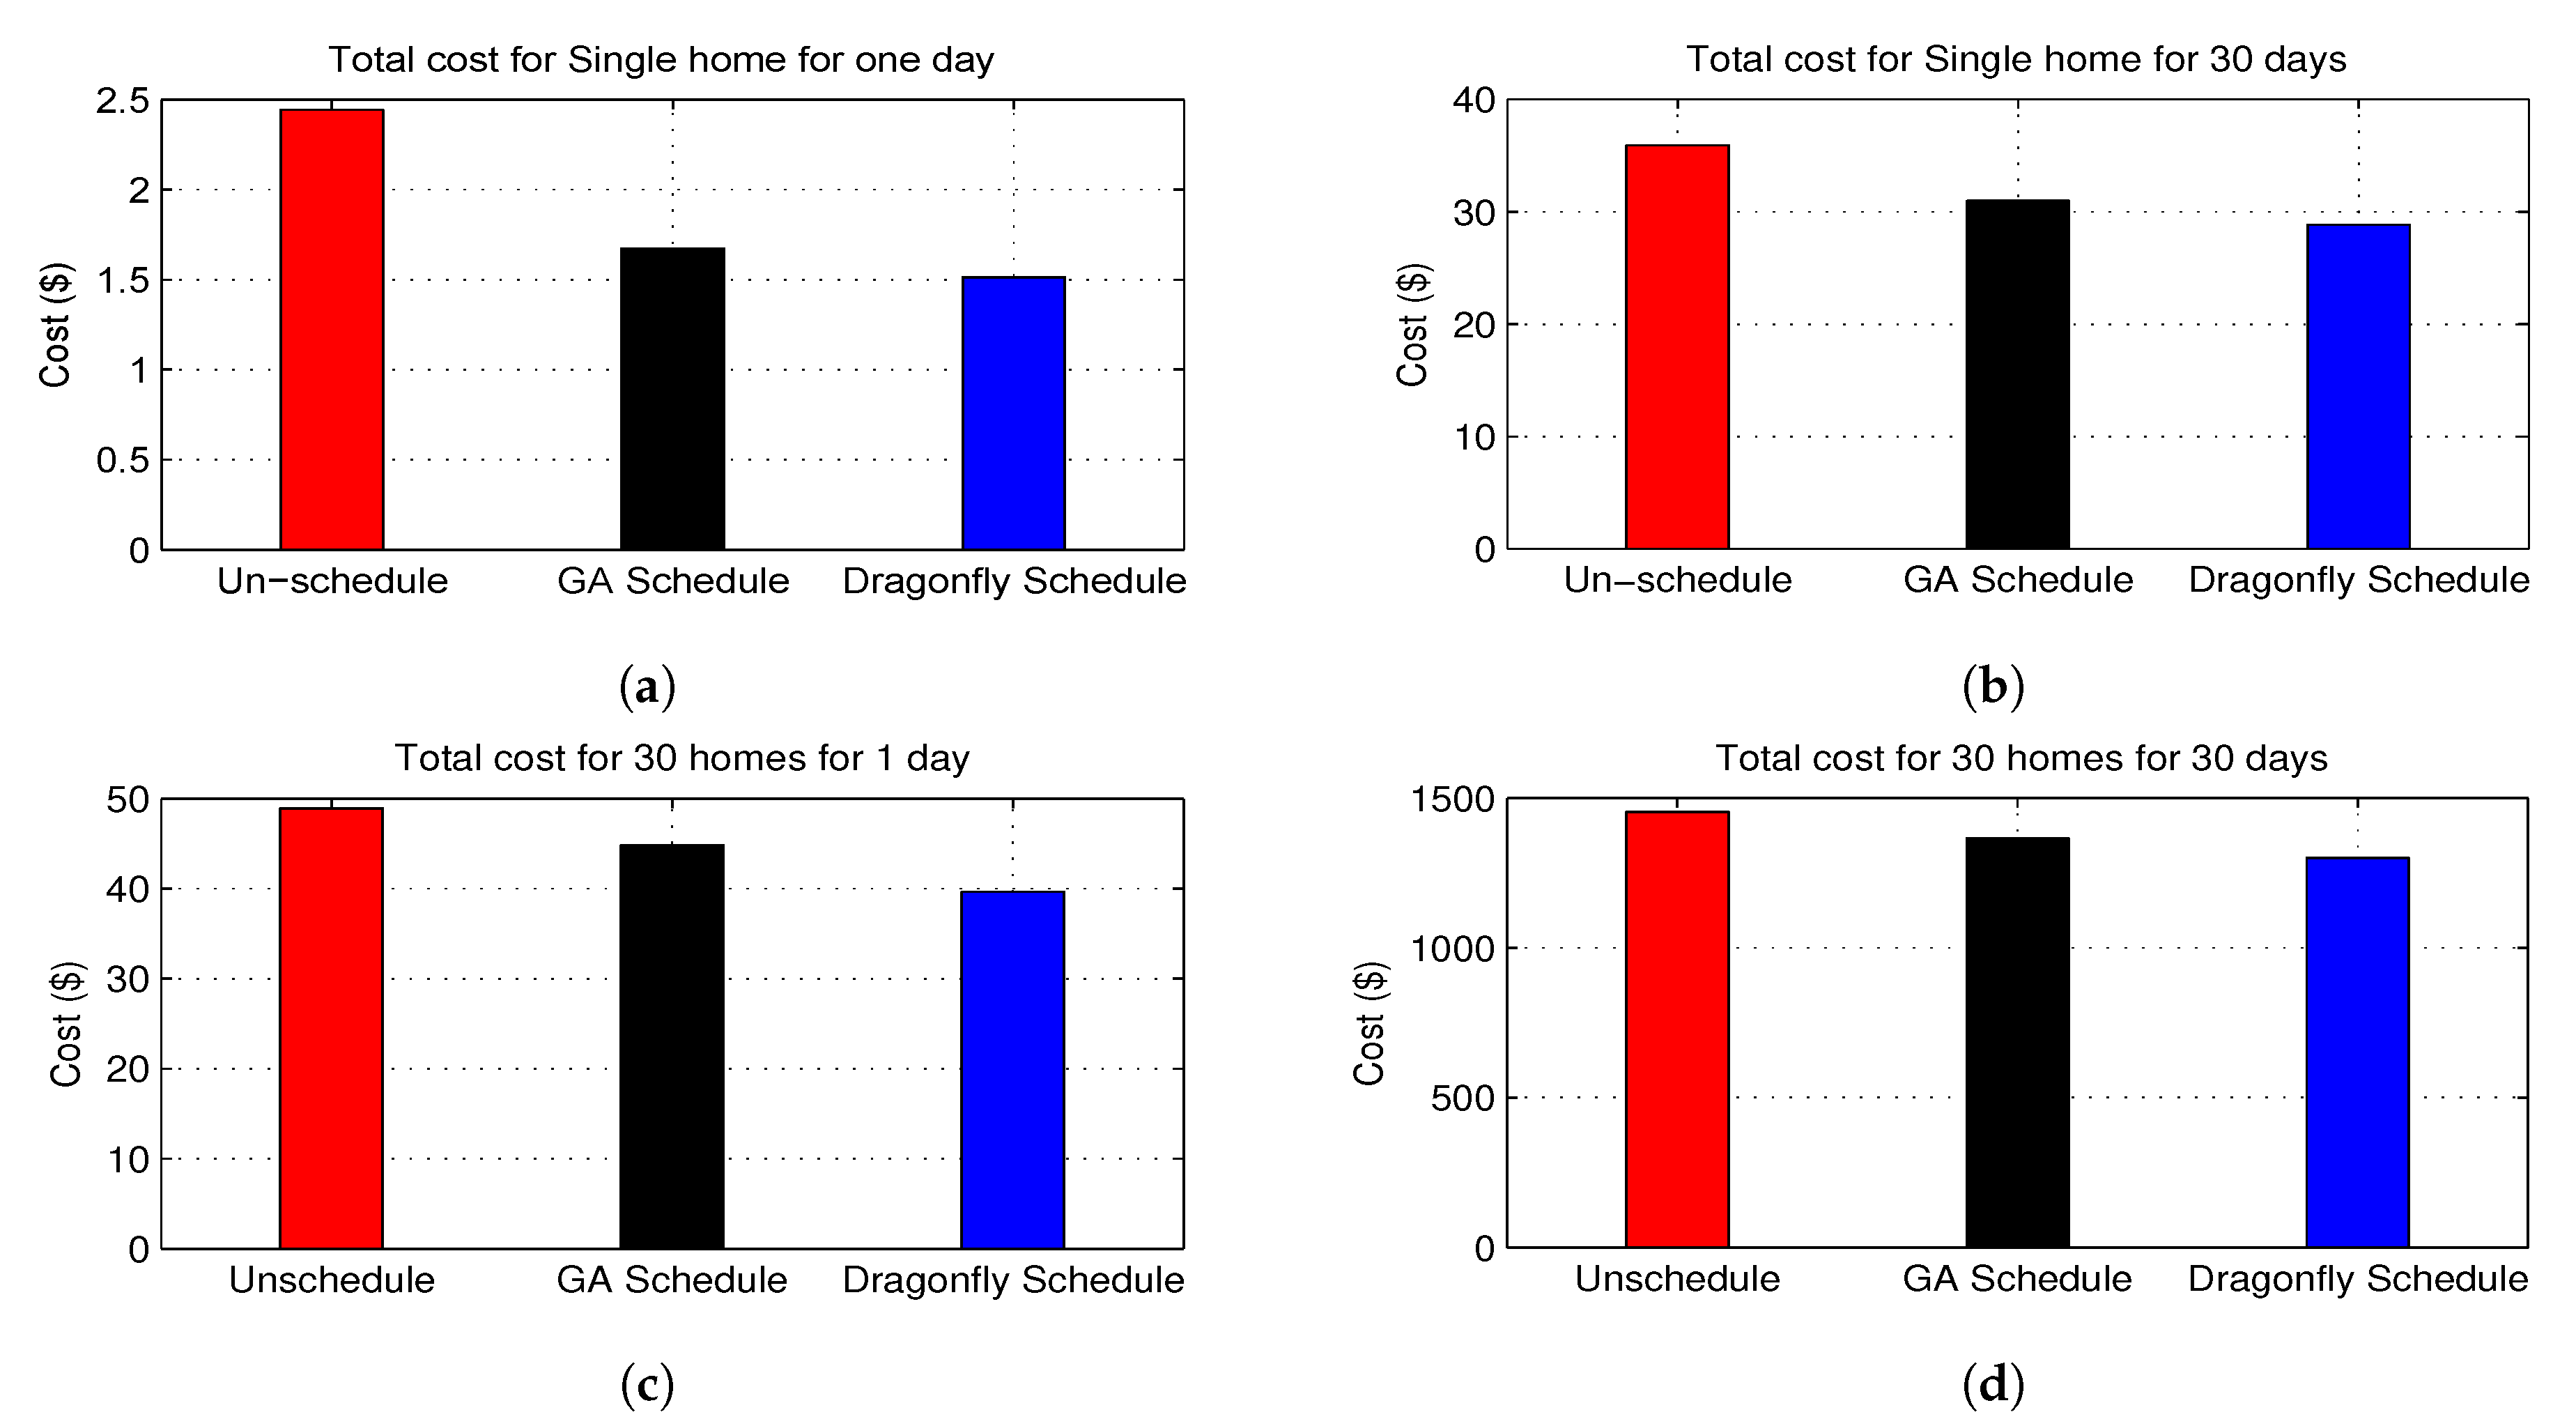
6.2. Daily Basis Hourly Cost

Figure 6 shows the hourly cost for a randomly selected single home and thirty homes for one day. It is clear from both Figure 6a,b that, in the un-scheduled case, prices are high. However, due to the shifting of the load from ON-peak hours to OFF-peak hrs, both GA and DA have reduced the cost for single as well as thirty homes.

6.3. Total Average Cost

Figure 7 shows the total average cost for a randomly selected single home for one day, single home for thirty days, thirty homes for single day and thirty homes for thirty days. Due to the shifting of load from ON-peak hours to OFF-peak hours, it is clear from Figure 7a that GA has 30.54%, while DA has reduced the cost for a single home 35.57% for a one-day scenario. Similarly, in the case of a single home for thirty days, Figure 7b GA and DA reduced the cost at 11.61% and 22.32%, respectively. Figure 7c shows the case for thirty homes for a single day, while Figure 7d gives the results of thirty homes for thirty days. Their respective values are given in Table 2.

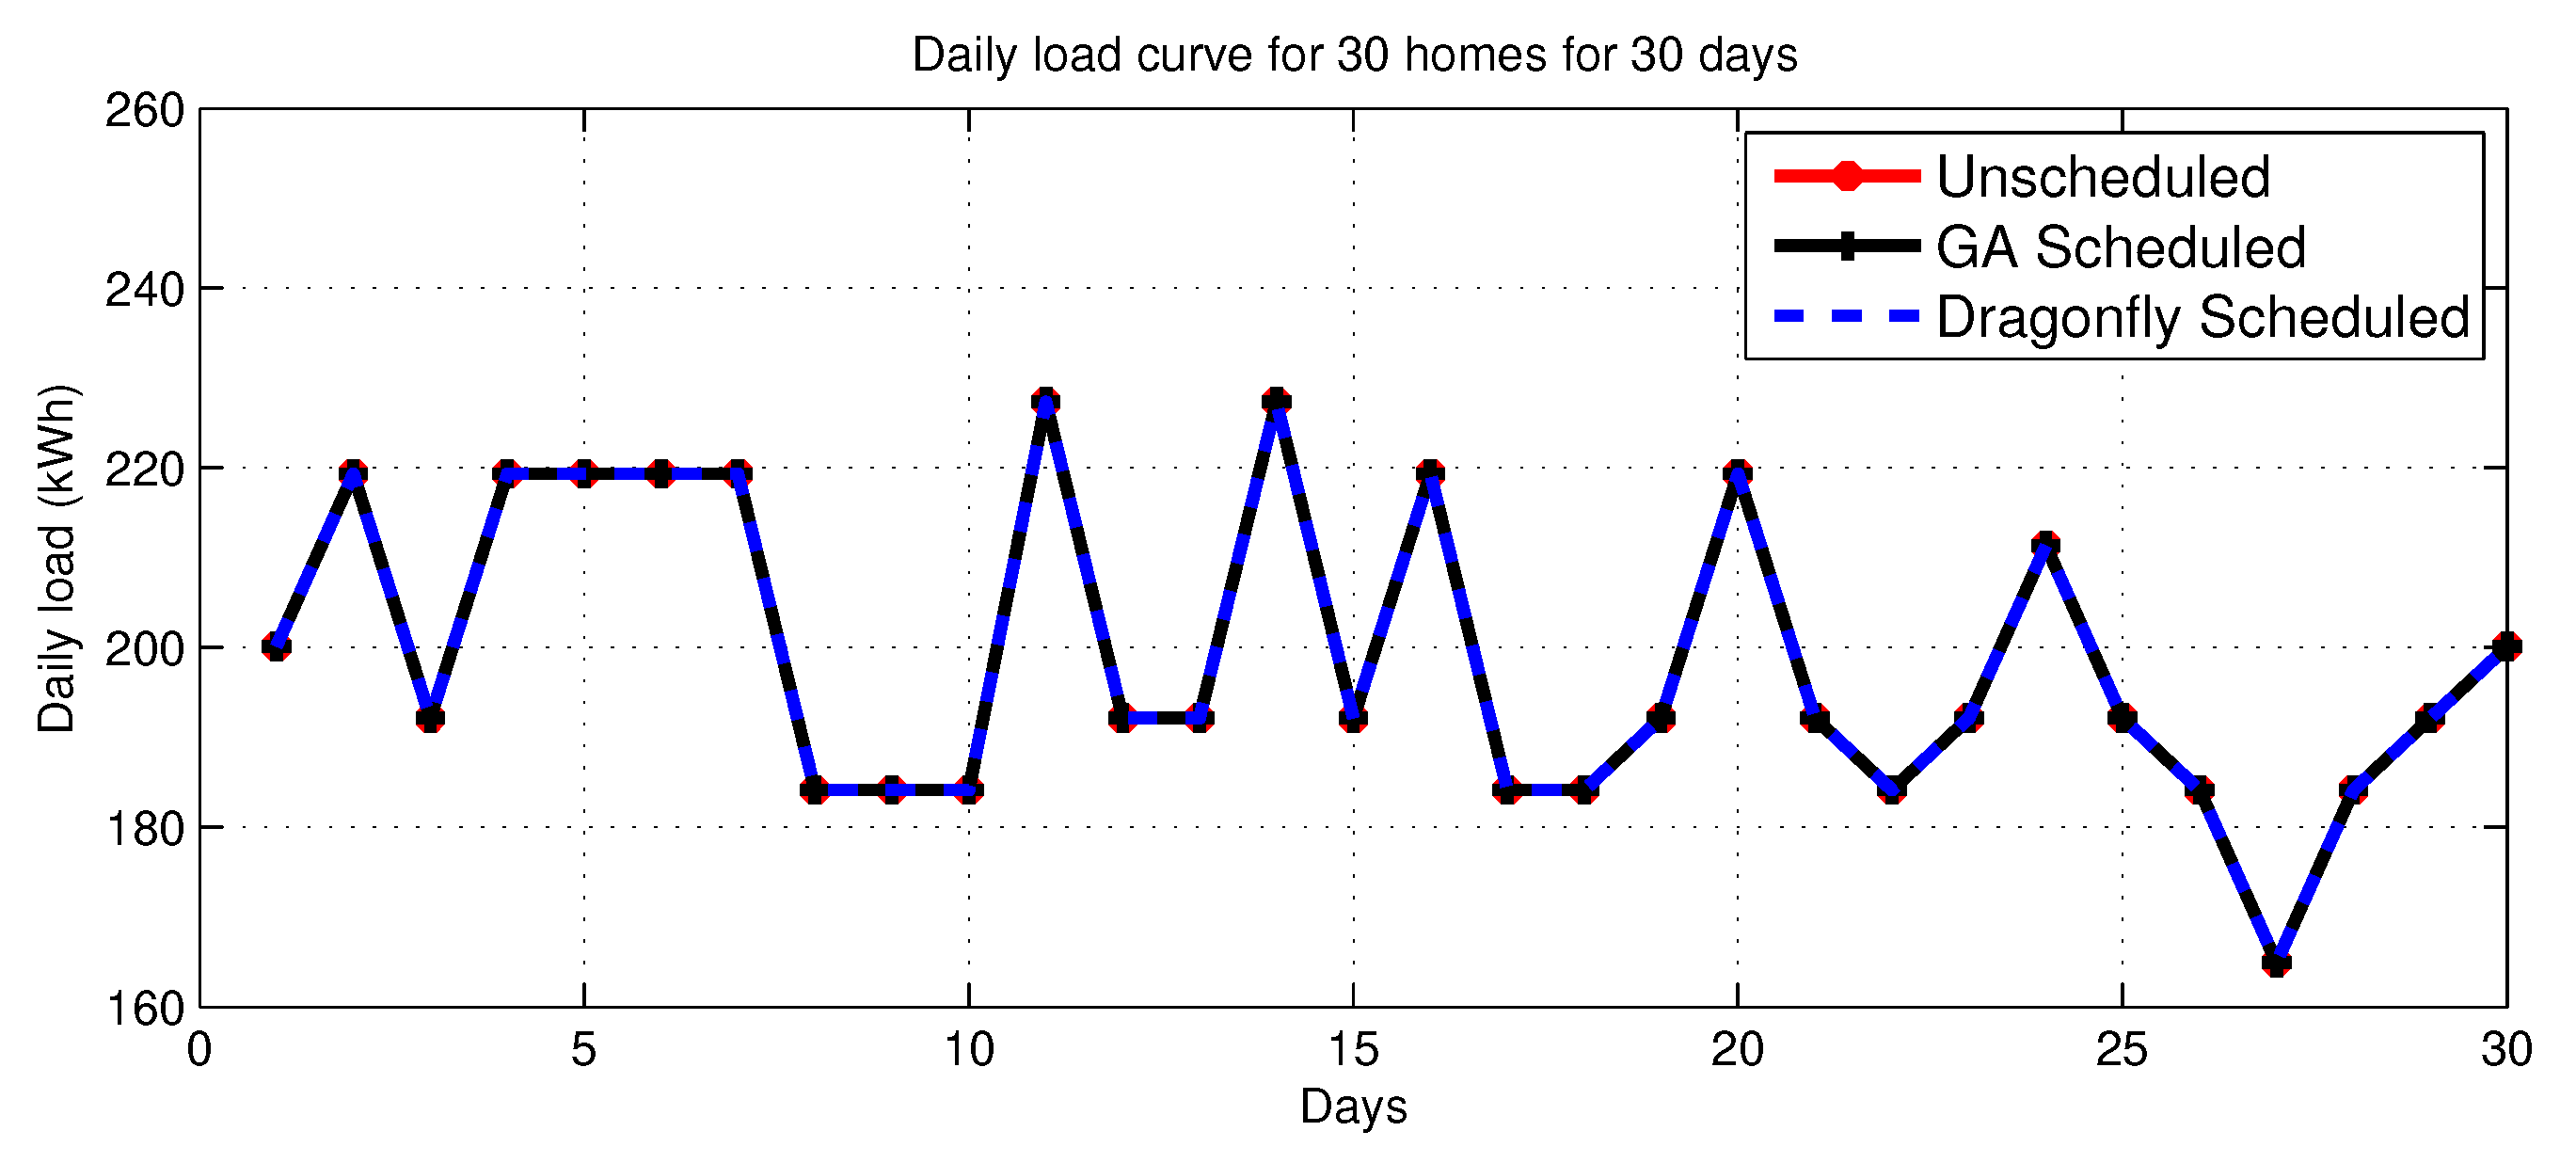
6.4. Daily-Basis 30 Days Load Pattern

Figure 8 depicts the daily-basis 30 days load response. It is clear from the figure that, in all three cases (i.e., un-schedule, GA and DA scheduled cases), the total daily load remains same. It means that, due to scheduling mechanisms, load does not reduce; it only shifts to OFF-peak hrs for reduction of cost.

6.5. PAR

Figure 9 depicts the PAR of single home and 30 homes. It is clear from Figure 9a that GA has reduced PAR to 22.94% for single homes and 03.30% for thirty homes, while DA has reduced it to 18.61% and 26.07% for single and thirty homes, respectively, as shown in Figure 9b. Thus, GA performance in terms of PAR reduction is better than DA; therefore, on the basis of simulation results, it is clear that, in a single home scenario, GA will be preferred, while DA will be preferred for multiple homes scenario.

6.6. Average Waiting Time

Figure 10 depicts the average waiting time of single and thirty homes. Figure 10a shows that, in terms of waiting time, DA gives better results for single home cases, while Figure 10b depicts that, for the thirty homes scenario, GA has less waiting time. It concludes that DA reduces cost but at the cost of consumer discomfort. Thus, those consumers who prefer to reduce their electricity bill instead of taking into consideration more waiting time may use DA and vice versa.

7. Comparison and Limitations

7.1. Comparison

Table 2 depicts the comparison of proposed algorithm DA with GA and un-scheduled load for single and thirty homes. Three objectives—cost, PAR, and waiting time—are tried to minimize with both algorithms. In terms of cost reduction, DA outperformed GA, while, for waiting time, GA is good. However, in terms of PAR, GA is superior for single homes, but DA is more efficient for multiple homes.

7.2. Limitations

Obviously, no such ideal algorithm is available with no limitations. The main limitation of our proposed algorithm is minimization of an electricity bill at the cost of user discomfort. Secondly, this algorithm is not performing well in all scenarios of single homes and multiple homes. Simulation results show that the meta-heuristic optimization technique DA reduces the cost by 35.57% and 17.22%, while GA reduces the electricity cost by 30.54% and 06.56% in single and multiple home scenarios, respectively. Thus, DA is better than GA for cost reduction. However, simulation results of PAR show that GA reduces PAR by 22.94% and DA reduces it by 18.61% for single homes, while, for multiple homes scenario, GA reduces PAR by 03.30% while DA reduces it by 26.07%. Thus, in terms of PAR, for single home scenarios of the smart grid, GA is more efficient than DA, while, for multiple homes scenario, DA is more efficient than GA.

8. Conclusions

In this paper, a novel meta-heuristic optimization appliances scheduling technique in a single home and multiple (thirty in our case) homes is proposed and analyzed. We proposed a new nature-inspired optimization algorithm, DA for achieving two main objectives; reduction of consumer electricity bill and PAR, keeping in view a specified waiting time threshold because of appliances scheduling process. DAP is used for cost calculation. We considered two classes of appliances, shiftable and non-shiftable. In shiftable appliances, we assumed only ten appliances for applying our proposed algorithms to check their performance, while, in a non-shiftable class, we only took two appliances. We compared our results with GA, a well known optimization algorithm in this field to check three fitness functions mentioned, i.e., minimization of the energy cost, PAR, and waiting time. Perhaps, a lot of countries in this bio-sphere can fulfill their energy demand. However, using such optimization algorithms, the existing grid system can be improved and their journey towards smart grids, to further facilitate their customers, by integrating renewable energy sources can be achieved. In addition, increasing energy generation is not only practicable, but pollution is also increasing with increased emission of carbon, while using different fuels for energy generation. Therefore, the benefits of such optimization algorithms are not only to reduce energy cost, but also to minimize pollution. The simulation results depict that our proposed technique performed well in the case of PAR and cost reduction. However, the limitation of such algorithms is that it reduces the electricity bill at the cost of user discomfort in the shape of increased waiting time. In the future, multi-objective algorithms will be proposed to reduce the electricity bill and PAR, while maintaining a high level of user comfort. In addition, the proposed multi-objective algorithms will be tested on all three sectors of residential, commercial, and industrial areas, to achieve more benefits for both the utility and consumers. Therefore, newly proposed nature-inspired algorithms will be applied for this purpose.

Author Contributions

M.U., I.U., and I.H. did the written work for the whole manuscript. I.U. and I.H. proposed the system model and did the revision. A.B. and M.N. did editing and developed methodology, while M.S. and D.S. technically supervised the whole work and refined it. All of the authors equally contributed, edited, revised, and approved the manuscript. All authors have read and agreed to the published version of the manuscript.

Funding

This work was supported by Hankuk University of Foreign Studies, Yongin, Korea and Endicott College of International Studies, Woosong University, Daejeon, South Korean research fund.

Acknowledgments

The authors are extremely thankful to Hankuk University of Foreign Studies, Yongin, Korea and Endicott College of International Studies, Woosong University, Daejeon, South Korea for supporting this work.

Conflicts of Interest

The authors declare no conflict of interest.

Abbreviations

The following abbreviations are used in this manuscript:
ABCArtificial bee colony
ANNArtificial neural network
BFABacterial foraging algorithm
BPSOBinary particle swarm optimization
CSACuckoo search algorithm
DADragonfly algorithm
DGDistributed generation
DRDemand response
DSMDemand side management
EDEEnhanced differential evolution
EDEconomic dispatch
EDTLAEnhanced differential teaching learning algorithm
EWAEarthworm algorithm
EMCEnergy management controller
GAGenetic algorithm
GWOGrey wolf optimization
HSAHarmony search algorithm
LOTLength of operational time
MIPMixed integer programming
MVPAMost valuable player algorithm
OTIOperational time interval
PARPeak-to-average power ratio
PEVPlug-in electric vehicle
PSOParticle swarm optimization
PVPhoto-voltaic
RESRenewable energy sources
RTPReal-time pricing
SGSmart grid
SHSmart home
SMSmart meter
TGTraditional grid
TLGOTeacher learning genetic optimization
WDOWind-driven optimization
TLBOTeaching learning-based optimization

References

  1. Hussain, I.; Aamir; Ullah, I.; Khan, N.; Riaz, M. Reliable and Secure Advanced Metering Infrastructure for Smart Grid Network. In Proceedings of the 2018 International Conference on Computing, Electronic and Electrical Engineering (ICE Cube), Quetta, Pakistan, 12–13 November 2018; pp. 1–6. [Google Scholar] [CrossRef]
  2. Strbac, G. Demand side management: Benefits and challenges. Energy Policy 2008, 36, 4419–4426. [Google Scholar] [CrossRef]
  3. Yang, J.; Zhang, G.; Ma, K. Matching supply with demand: A power control and real time pricing approach. Int. J. Electr. Power Energy Syst. 2014, 61, 111–117. [Google Scholar] [CrossRef]
  4. Hu, W.; Chen, Z.; Bak-Jensen, B. Optimal operation strategy of battery energy storage system to real-time electricity price in Denmark. In Proceedings of the IEEE PES General Meeting, Providence, RI, USA, 25–29 July 2010; pp. 1–7. [Google Scholar]
  5. Tascikaraoglu, A.; Boynuegri, A.R.; Uzunoglu, M. A demand side management strategy based on forecasting of residential renewable sources: A smart home system in Turkey. Energy Build. 2014, 80, 309–320. [Google Scholar] [CrossRef]
  6. Logenthiran, T.; Srinivasan, D.; Shun, T.Z. Demand side management in smart grid using heuristic optimization. IEEE Trans. Smart Grid 2012, 3, 1244–1252. [Google Scholar] [CrossRef]
  7. Khan, I.; Singh, D. Energy-balance node-selection algorithm for heterogeneous wireless sensor networks. ETRI J. 2018, 40, 604–612. [Google Scholar] [CrossRef]
  8. Mirjalili, S. Dragonfly algorithm: A new meta-heuristic optimization technique for solving single-objective, discrete, and multi-objective problems. Neural Comput. Appl. 2016, 27, 1053–1073. [Google Scholar] [CrossRef]
  9. Lu, R.; Hong, S.H.; Yu, M. Demand Response for Home Energy Management Using Reinforcement Learning and Artificial Neural Network. IEEE Trans. Smart Grid 2019, 10, 6629–6639. [Google Scholar] [CrossRef]
  10. Javaid, N.; Hussain, S.M.; Ullah, I.; Noor, M.A.; Abdul, W.; Almogren, A.; Alamri, A. Demand Side Management in Nearly Zero Energy Buildings Using Heuristic Optimizations. Energies 2017, 10, 1131. [Google Scholar] [CrossRef] [Green Version]
  11. Khan, Z.A.; Zafar, A.; Javaid, S. Hybrid meta-heuristic optimization based home energy management system in smart grid. J. Ambient. Intell. Hum. Comput. 2019, 10, 4837–4853. [Google Scholar] [CrossRef]
  12. Wu, X.; Hu, X.; Yin, X.; Moura, S.J. Stochastic Optimal Energy Management of Smart Home With PEV Energy Storage. IEEE Trans. Smart Grid 2018, 9, 2065–2075. [Google Scholar] [CrossRef]
  13. Ullah, I.; Hussain, S. Time-Constrained Nature-Inspired Optimization Algorithms for an Efficient Energy Management System in Smart Homes and Buildings. Appl. Sci. 2019, 9, 792. [Google Scholar] [CrossRef] [Green Version]
  14. Ou, T.; Hong, C. Dynamic operation and control of microgrid hybrid power systems. Energy 2014, 66, 314–323. [Google Scholar] [CrossRef]
  15. Hussain, H.M.; Javaid, N.; Iqbal, S.; Hasan, Q.U.; Aurangzeb, K.; Alhussein, M. An Efficient Demand Side Management System with a New Optimized Home Energy Management Controller in Smart Grid. Energies 2018, 11, 190. [Google Scholar] [CrossRef] [Green Version]
  16. Manzoor, A.; Javaid, N.; Ullah, I.; Abdul, W.; Almogren, A.; Alamri, A. An Intelligent Hybrid Heuristic Scheme for Smart Metering based Demand Side Management in Smart Homes. Energies 2017, 10, 1258. [Google Scholar] [CrossRef] [Green Version]
  17. Ullah, I.; Hussain, I.; Singh, M. Exploiting Grasshopper and Cuckoo Search Bio-Inspired Optimization Algorithms for Industrial Energy Management System: Smart Industries. Electronics 2020, 9, 105. [Google Scholar] [CrossRef] [Green Version]
  18. Singh, D. Mobility and Energy Efficient Mechanism for Low power devices to Support Global Healthcare System. J. Theor. Appl. Inf. Technol. 2014, 66, 315–329. [Google Scholar]
  19. Ou, T.-C.; Su, W.-F.; Liu, X.-Z.; Huang, S.-J.; Tai, T.-Y. A Modified Bird-Mating Optimization with Hill-Climbing for Connection Decisions of Transformers. Energies 2016, 9, 671. [Google Scholar] [CrossRef]
  20. Jamil, A.; Alghamdi, T.A.; Khan, Z.A.; Javaid, S.; Haseeb, A.; Wadud, Z.; Javaid, N. An Innovative Home Energy Management Model with Coordination among Appliances using Game Theory. Sustainability 2019, 11, 6287. [Google Scholar] [CrossRef]
  21. Singh, D.; Lee, H.J.; Chung, W.Y. An energy consumption technique for global healthcare monitoring applications. In Proceedings of the 2nd International Conference on Interaction Sciences: Information Technology, Culture and Human, Seoul, Korea, 24–26 November 2009; pp. 539–542. [Google Scholar]
  22. Ullah, I.; Khitab, Z.; Khan, M.N.; Hussain, S. An Efficient Energy Management in Office Using Bio-Inspired Energy Optimization Algorithms. Processes 2019, 7, 142. [Google Scholar] [CrossRef] [Green Version]
  23. Asgher, U.; Babar Rasheed, M.; Al-Sumaiti, A.S.; Ur-Rahman, A.; Ali, I.; Alzaidi, A.; Alamri, A. Smart Energy Optimization Using Heuristic Algorithm in Smart Grid with Integration of Solar Energy Sources. Energies 2018, 11, 3494. [Google Scholar] [CrossRef] [Green Version]
  24. Aslam, S.; Bukhsh, R.; Khalid, A.; Javaid, N.; Ullah, I.; Fatima, I.; Hasan, Q.U. An efficient home energy management scheme using cuckoo search. In Proceedings of the International Conference on P2P, Parallel, Grid, Cloud and Internet Computing, Barcelona, Spain, 8–10 November 2017; pp. 167–178. [Google Scholar]
  25. Tsui, K.M.; Chan, S. Demand response optimization for smart home scheduling under real-time pricing. IEEE Trans. Smart Grid 2012, 3, 1812–1821. [Google Scholar] [CrossRef]
  26. Ramli, M.A.; Bouchekara, H.; Alghamdi, A.S. Efficient Energy Management in a Microgrid with Intermittent Renewable Energy and Storage Sources. Sustainability 2019, 11, 3839. [Google Scholar] [CrossRef] [Green Version]
  27. Zhao, J.; Liu, S.; Zhou, M.; Guo, X.; Qi, L. Modified cuckoo search algorithm to solve economic power dispatch optimization problems. IEEE/CAA J. Autom. Sin. 2018, 5, 794–806. [Google Scholar] [CrossRef]
  28. Nimma, K.S.; Al-Falahi, M.D.A.; Nguyen, H.D.; Jayasinghe, S.D.G.; Mahmoud, T.S.; Negnevitsky, M. Grey Wolf Optimization-Based Optimum Energy-Management and Battery-Sizing Method for Grid-Connected Microgrids. Energies 2018, 11, 847. [Google Scholar] [CrossRef] [Green Version]
  29. Iqbal, Z.; Javaid, N.; Iqbal, S.; Aslam, S.; Khan, Z.A.; Abdul, W.; Almogren, A.; Alamri, A. A Domestic Microgrid with Optimized Home Energy Management System. Energies 2018, 11, 1002. [Google Scholar] [CrossRef] [Green Version]
  30. Al-Sakkaf, S.; Kassas, M.; Khalid, M.; Abido, M.A. An Energy Management System for Residential Autonomous DC Microgrid Using Optimized Fuzzy Logic Controller Considering Economic Dispatch. Energies 2019, 12, 1457. [Google Scholar] [CrossRef] [Green Version]
  31. Javaid, N.; Ahmed, F.; Ullah, I.; Abid, S.; Abdul, W.; Alamri, A.; Almogren, A.S. Towards Cost and Comfort Based Hybrid Optimization for Residential Load Scheduling in a Smart Grid. Energies 2017, 10, 1546. [Google Scholar] [CrossRef] [Green Version]
  32. Available online: http://www.energyonline.com/Data/GenericData.aspx?DataId=2&${ISO-NE}_{---}{Day-Ahead}_{-}{Energy}_{-}Price$ (accessed on 27 December 2019).
  33. Beaudrot, L.; Ahumada, J.A.; O’Brien, T.; Alvarez-Loayza, P.; Boekee, K.; Campos-Arceiz, A.; Eichberg, D. Standardized assessment of biodiversity trends in tropical forest protected areas: The end is not in sight. PLoS Biol. 2016, 14, e1002357. [Google Scholar] [CrossRef]
  34. Wikelski, M.; Moskowitz, D.; Adelman, J.S.; Cochran, J.; Wilcove, D.S.; May, M.L. Simple rules guide dragonfly migration. Biol. Lett. 2006, 2, 325–329. [Google Scholar] [CrossRef]
  35. Russell, R.W.; May, M.L.; Soltesz, K.L.; Fitzpatrick, J.W. Massive swarm migrations of dragonflies (Odonata) in eastern North America. Am. Midl. Nat. 1998, 140, 325–343. [Google Scholar] [CrossRef]
Figure 1. Proposed system model.
Electronics 09 00406 g001
Figure 2. Day-ahead pricing (DAP) reproduced signal [32].
Electronics 09 00406 g002
Figure 3. (a) Real dragonfly, (b) Life-cycle of dragonfly [8].
Electronics 09 00406 g003
Figure 4. The Flowchart of Step by step process of the DA.
Electronics 09 00406 g004
Figure 5. Daily basis hourly load for un-scheduled and GA and DA scheduled (a) single home; (b) 30 homes.
Electronics 09 00406 g005
Figure 6. Hourly cost for un-scheduled and GA and DA scheduled (a) single home; (b) 30 homes.
Electronics 09 00406 g006
Figure 7. Total cost for un-scheduled, GA and DA scheduled load (a) total cost for a single home for one day; (b) total cost for a single home for 30 days; (c) total cost for 30 homes for one day; (d) total cost for 30 homes for 30 days.
Electronics 09 00406 g007
Figure 8. Daily load curve for un-scheduled and GA and DA scheduled load for 30 days.
Electronics 09 00406 g008
Figure 9. PAR for un-scheduled and GA and DA scheduled load (a) single home; (b) 30 homes.
Electronics 09 00406 g009
Figure 10. Average daily waiting time for un-scheduled and GA and DA scheduled load (a) single home; (b) 30 homes.
Electronics 09 00406 g010
Table 1. Appliances categorization, names, power rating, starting time, finishing time, and Length of operational time (LOT).
Appliances
Class
Appliance NamePower Rating
(kW)
Starting Time
(h)
Finishing
Time (h)
LOT (h)
Coffee maker1.008101
Printer0.518201
Microwave oven1.708101
Laptop0.118242
ShiftableDesktop0.318243
AppliancesVacuum Cleaner1.209171
Electric Car3.518083
Iron0.809172
Washing Machine1.509122
Hair Dryer1.513181
Non-ShiftableInterior Lightening0.8418246
AppliancesRefrigerator0.38824
Table 2. Results summary of Un-Scheduled, Genetic algorithm (GA), and Dragonfly algorithm (DA) based scheduled load.
TechniquesNo. of HomesNo. of DaysCost ($)% Cost ReductionWaiting Time (h)PAR% PAR Reduction
112.4234.62
Un-13036.017
Schedule30148.1423.03
30301432.735
111.68330.54%3.033.5622.94%
GA13031.83211.61%
Scheduled30144.98206.56%1.822.9303.30%
30301357.72205.23%
111.56135.57%2.893.7618.61%
DA13027.97722.32%
Scheduled30139.85117.22%2.292.2426.07%
30301267.42611.54%

