1. Introduction
According to the US Environmental Protection Agency, industries are responsible for about 27% of total consumed energy [
1]. Meanwhile, there has been an exponential rise in energy demand worldwide due to rapid population expansion. On the other hand, the generation of electric power contributes to nearly 25% of green-house gases (GHGs) to the environment. The inadequacy of energy is a major issue in many countries of the world, directly affecting the economy, development, and environment. Therefore, the main focus is to preserve energy resources [
2]. In such circumstances, the electricity requirement of different users cannot be fulfilled by traditional electric power grids. For this purpose, the concept of smart grid (SG) arises, which efficiently overcomes energy generation and use problems by using renewable energy sources (RES) and a distribution generation (DG) system. An efficient and effective energy management system (EMS) is now needed to not only integrate these RESs and DG systems into the existing network, but also optimally use the existing energy resources to reduce consumed electricity cost.
We are proposing two bio-inspired optimization algorithms for an optimal use of the existing resources. For this purpose, our proposed system model will consist of many smart agents in the premises of the industry like smart machines, smart meters (SMs), and energy management controllers (EMC) etc. SM is a communication agent between utility and consumers. Because it shares of the consumer load information, the energy supplier capacity is enhanced and it becomes able to solve energy problems. Demand-side management (DSM) is used for this purpose, to shift consumer load from high-demand hours to low-demand hours. In this paper we have considered DSM, which helps in load balancing between users and utility [
3]. In DSM strategies, demand response (DR) is the mechanism in which utility tries to manage consumer demand with a condition, such that users must reduce their consumption at critical times [
4]. Utilities give different incentives, in the form of reduced electricity pricing, to the user due to this load reduction at peak hours. Out of different pricing schemes, day-ahead pricing (DAP), critical peak pricing (CPP), time of use (TOU), and real-time pricing (RTP) schemes are used in DR [
5].
In load management, the main objective is to use energy efficiently in order to reduce blackouts. For this purpose, a technique is used known as load leveling. The following strategies are used in load management [
6]:
Peak Clipping: In peak clipping, high load peaks are clipped, and peak loads are reduced. This process helps in peak load reduction.
Valley Filling: In valley filling, high load valleys fill off-peak load intervals. In order to achieve this type of load management, we must use thermal energy storage.
Load Shifting: In load shifting strategy, the load of consumers is moved from peak load demand timings to low load demand timings (i.e., hours) [
7].
In SG, different mathematical models such as linear programming (LP), integer-linear programming (ILP), and mixed-integer-linear programming (MILP) are used to resolve the issue of energy optimization. However, when appliances or machines are increased in number, these models are not much applicable, as these are mathematical models, and for large numbers of appliances (or machines in our case), the exact solution given by these models becomes impossible. Therefore, the researchers moved towards meta-heuristic algorithms. In this paper, we are focusing on the industrial sector, which comprises different automatic operated machines (AOMs). The objectives of this work are three-fold: reduction of electricity cost, peak-to-average power ratio (PAR) and user waiting time due to scheduling of the machines. We have proposed two optimization techniques—grasshopper optimization algorithm (GOA) and cuckoo search algorithm (CSA)—to achieve our objectives.
2. Problem Statement
Researchers all over the world have proposed numerous algorithms for optimal scheduling of the load in industrial, commercial, and residential sectors [
8,
9,
10,
11,
12,
13,
14,
15,
16,
17,
18,
19,
20,
21,
22,
23,
24,
25,
26,
27,
28,
29]. Most of these research works aim to reduce electricity bills and PAR. However, very few have considered end-user frustration due to scheduling of appliances. Because more than 90% of energy blackouts and disturbances occur in the power distribution networks, the world has moved towards the smart grid concept to reduce these outages and disturbances [
30]. The rapid increase in fuel cost, connected with the failure of utility to increase its generation in parallel with rising electricity demand, has speeded up the need to improve the distribution system by evolving new energy optimization techniques in DSM. Initially, automated meter-reading (AMR) technology was introduced in SG; however, it was not successful due to its one-way communication towards utility. After the limitation in AMR, the utility companies moved towards advanced metering infrastructure (AMI) technology, which enables the system to communicate bilaterally. This bilateral communication in the AMI not only enables the supplier/utility providers to get instantaneous information about the consumer load demand, but also imposes its small cap on load consumption, in order to get low electricity cost.
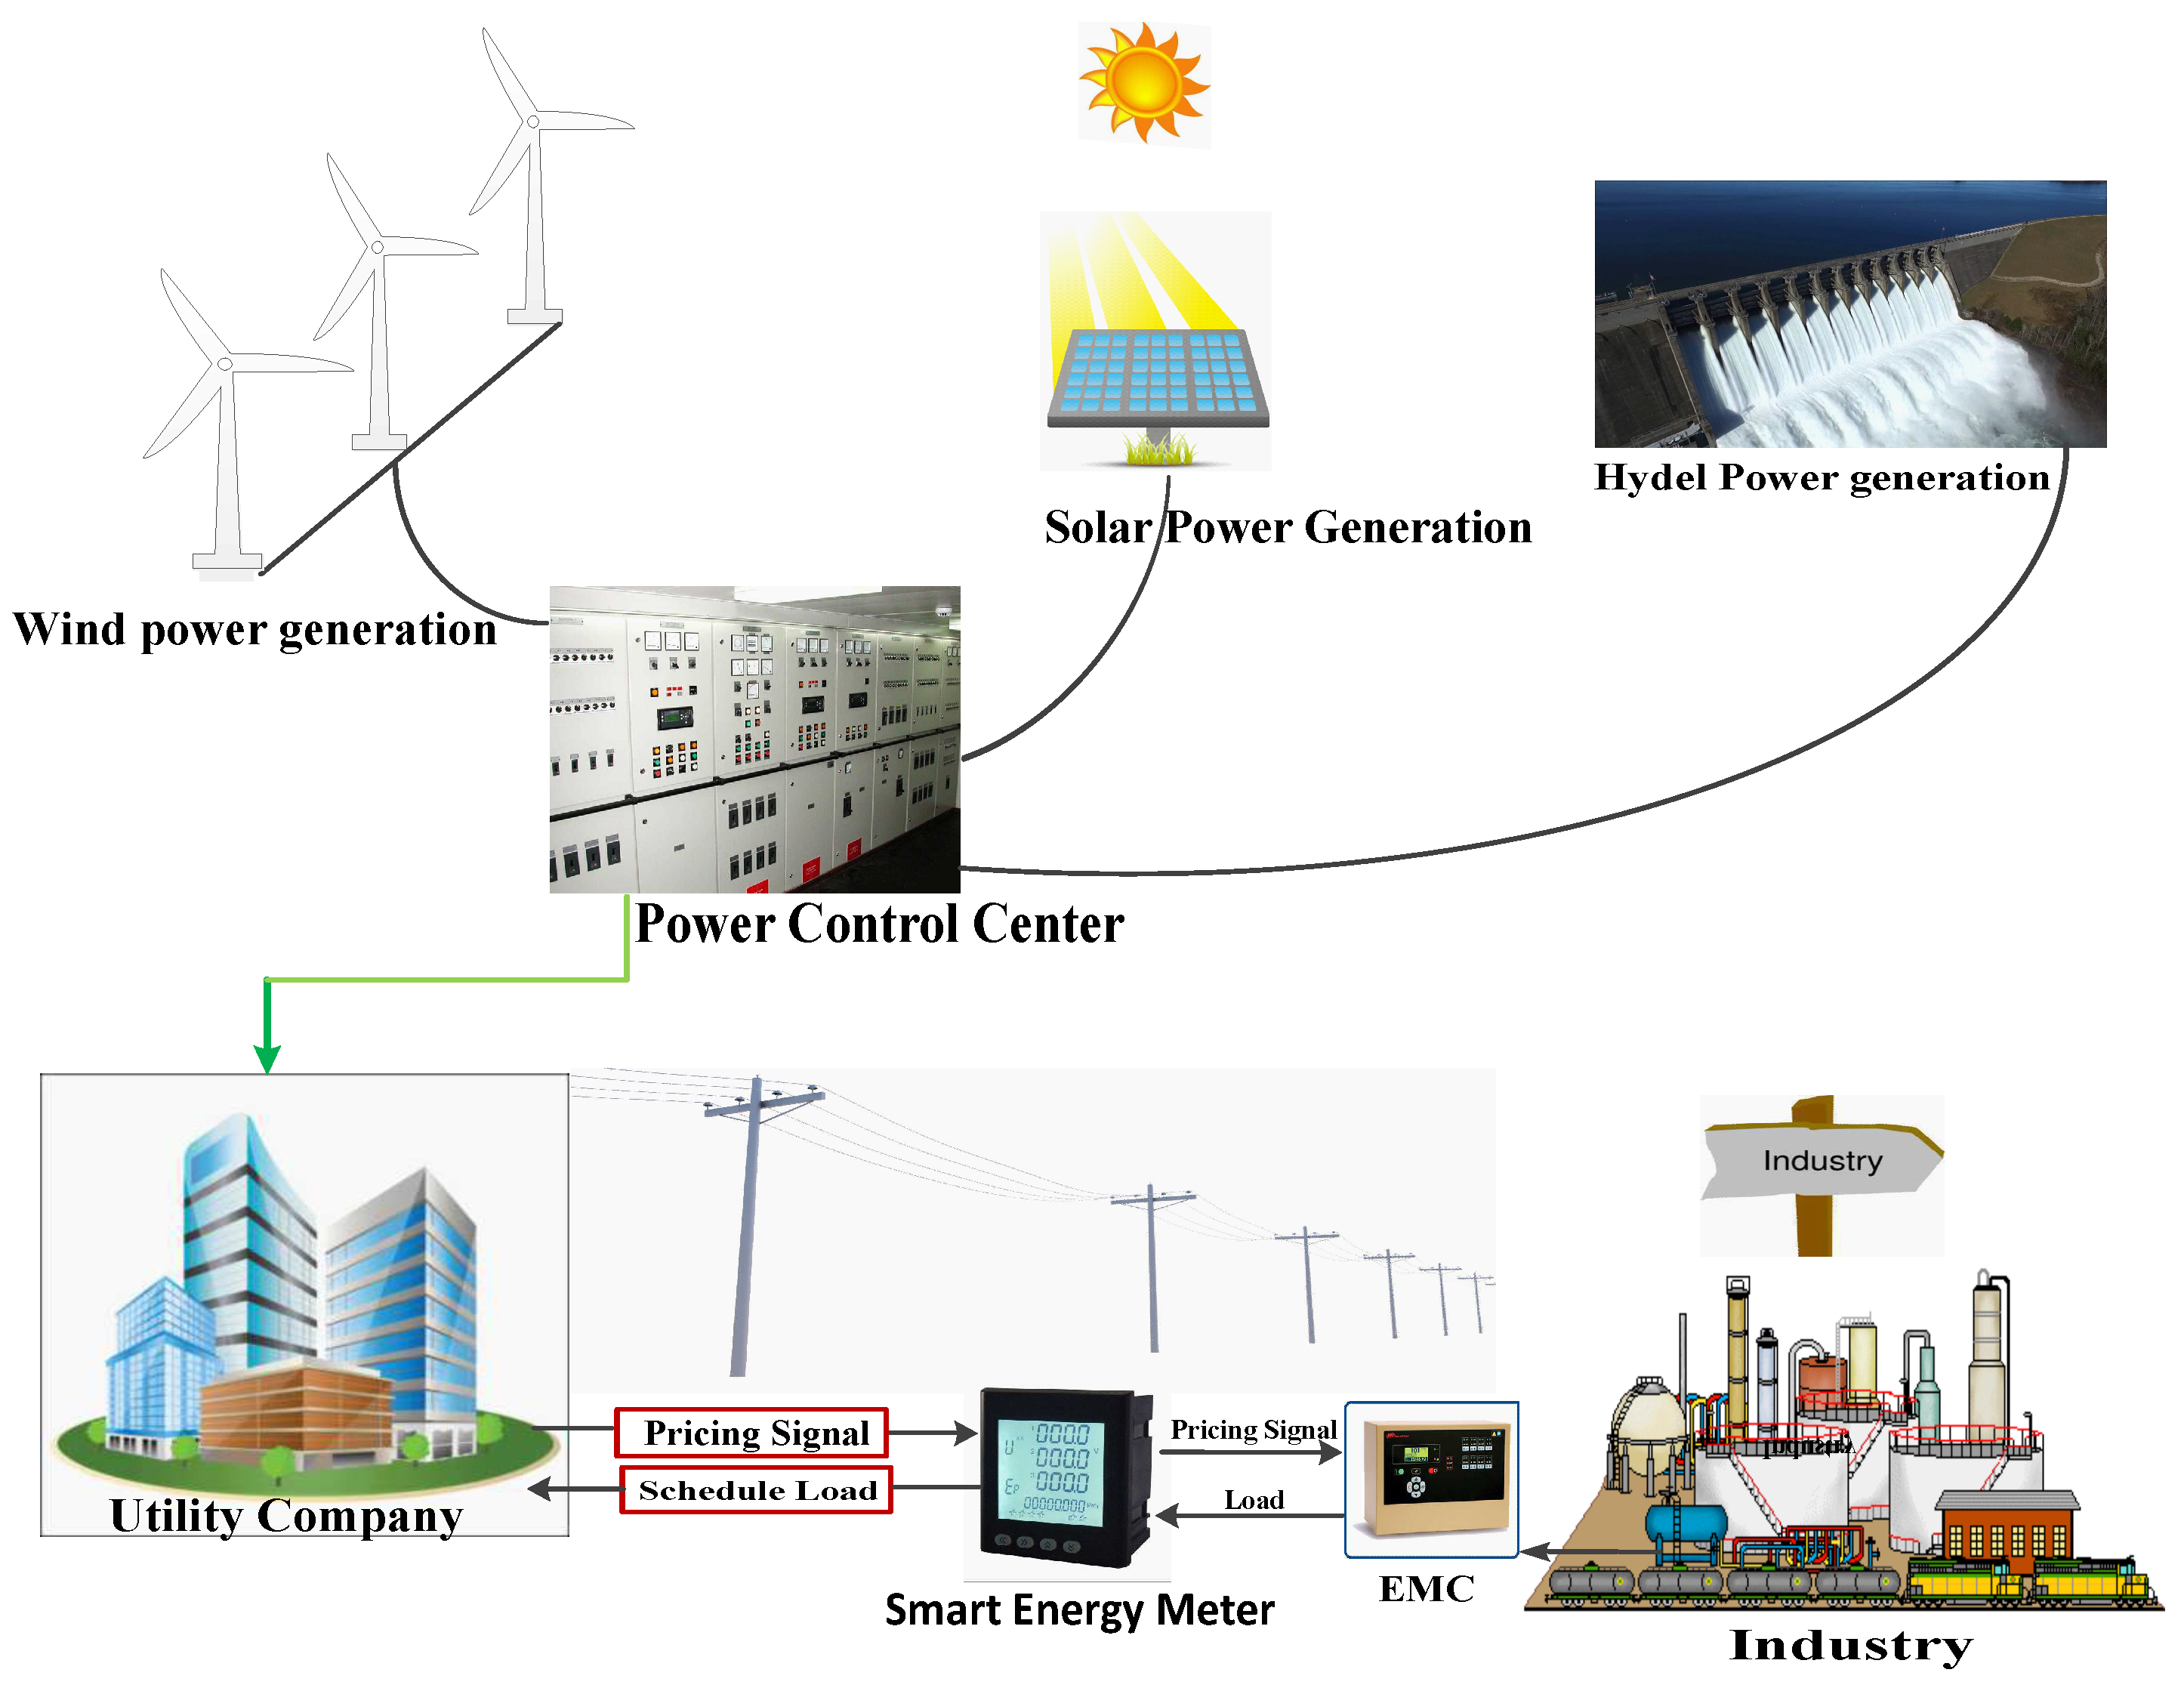
The EMS in SG consists of two sides—DSM and supply-side management (SSM). We are considering DSM in an industry that consists of machines, EMC and SM. SM has AMI technology, which helps in the two-way communication between consumers and utility. Different machines send their power consumption patterns to EMC. EMC then schedules the load according to the pricing signal received from utility. SM receives the pricing signal and forwards it to EMC. Simultaneously, it receives power consumption pattern from EMC and sends it to utility. The communication between SM and utility is through different wireless networks i.e., Wi-Fi, GSM, ZigBee, Home Area Network (HAN) or a wired medium such as power line communication (PLC). In this paper we are considering an industry (woolen mills) that consists of six AOMs. The DAP pricing signal is used for electricity bill calculation and the time horizon for load scheduling is considered to be one hour.
Figure 1 depicts the system model architecture of the proposed scheme.
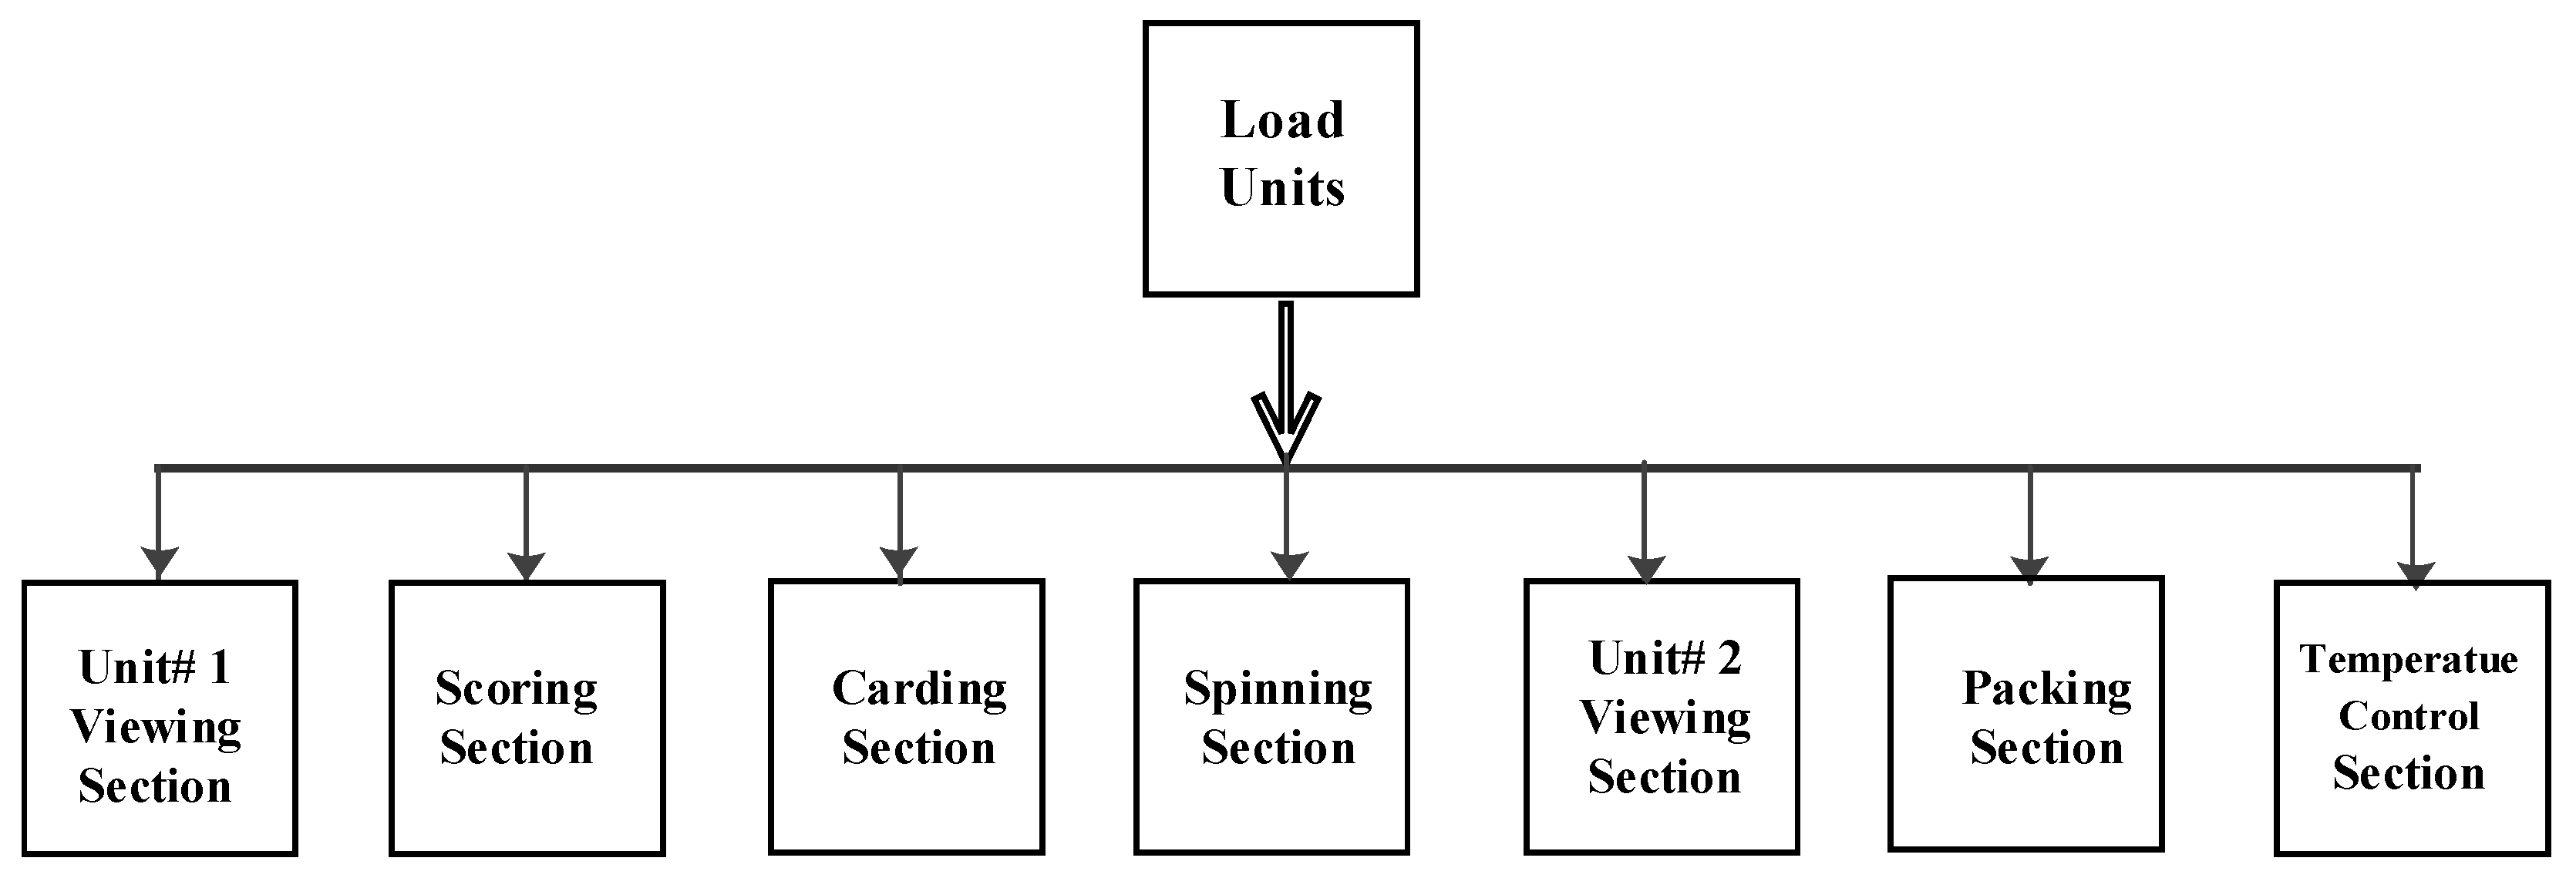
Table 1 depicts the load units (LU) with their respective power ratings and the length of operational times (LOTs), while
Figure 2 shows these load units in the block diagram form.
In the industry system model with load units, shown in
Figure 2, scoring section takes 150 kW power and consists of only one type of motor, i.e., induction motor of 10 hp. Carding section takes 50 kW power and consists of two types of motors, induction motors of 10 hp and slip ring motors of 50 hp. Spinning section takes 200 kW power and consists of one type of induction motors of 100 hp each. Weaving section takes power of 250 kW and consists of three types of motors—stepper motors of 0.5 hp, induction motors of 10 hp and induction motors of 2.5 hp. Packing section takes power of 100 kW and comprise of induction motors of 5 hp and slip ring motors of 10 hp. The temperature control section takes 100 kW of power. It is just like an AC plant. The connected load is 900 kW from utility and the running load is 400 kW to 550 kW. The average load of the mill is 400 kW, which shows that at a time 3 to 4 machines are in running position. The maximum demand indicator (MDI) is considered to be 500 kW. The machines in the industry stop working based on production, because it follows demand and supply mechanism.
3. Literature Review
The important matters which need to be addressed in the distribution system are minimization of cost, stability of SG by the reduction of PAR, and user comfort maximization. Presently, power consumption is increasing due to increase in population. Traditional grid (TG) cannot fulfill the present energy requirements. In order to meet user demand, we must increase the power generation through thermal power plants, nuclear power plants and renewable energy sources such as wind and solar. To handle this integration complexity of power resources, the concept of SG arises. SG is environmentally friendly because it uses the available power resources efficiently among users. To overcome energy optimization problems, different optimization mechanisms are used in SG. In [
31], through the convex programming (CP) technique, the cost of electricity is reduced, which is only achieved by compromising user comfort. Reduction in consumer bill for their electricity usage is addressed by authors in [
32,
33] using optimization techniques, i.e., MILP, ILP and MILP, but RES and user comfort have not been considered. In [
34] the authors have used MILP technique to minimize the electricity cost. However, RES and user comfort are ignored. The techniques which are discussed above are incapable of dealing with a huge number of machines or consumer appliances. In order to overcome this flaw, researchers move towards probabilistic models. Different meta-heuristic models are proposed for solving the problem of energy optimization. This research paper deals with two meta-heuristic population-based algorithms i.e., GOA and CSA. In our work, we are going to evaluate these techniques based on different objectives such as the reduction of electricity bills, PAR, and user frustration. To apply our proposed algorithms to real-world problems, we have considered a case study of a textile industry that comprises different independent sections (i.e., load units).
4. Problem Formulation
The design of the power system, which is perfect and confident, must begin with user needs and comfort. In this paper we must tackle the aforementioned problems, using the following objective function:
where
is the total consumed energy, while
is the energy pricing signal issued by utility and
is the consumer waiting time for starting-up the switched-on machines.
and
are scaling parameters of the two segments of the objective function. The worth of these parameters could be either “0” or “1” so that
+
= 1. This means that if a consumer wants minimization of the electricity bill, the waiting time will increase as a penalty. However, if the consumer is not interested in bill reduction, his waiting time will be zero.
Our main goal is to turn-ON the load in those hours which have low per-hour cost and turn-OFF or reduce the load when cost per hour is high; however, we have to keep in mind that we must use such type of constraints such that no peak is created for the period of low-demand hours.
Our main target is to lessen the consumed energy cost, calculated in Equation (
1) to minimize the load for the period of high consumer demand. The total cost can be calculated using Equation (
2) as follows;
where
is the total cost in 24 h,
t represents the time in hours,
is the initial time,
is the final time,
is the electricity price per hour and
is the power rating of each machine in the industry.
Equation (
3) shows the total scheduled load, calculated over 24 h.
In this equation
is the total load in 24 h and
is the per-hour load, given by;
where
could be either “1” or “0” to show the ON–OFF status of a machine in a load unit, while
is the power rating of each machine in its respective load unit.
PAR is the ratio of the maximum load (
) in a given interval of time to the average load (
) and can be calculated as follows;
5. Proposed Schemes
In this section, two bio-inspired optimization algorithms—GOA and CSA—are discussed in detail for energy-scheduling purposes. Their mathematical models, pseudocodes, and fitness functions are given for finding an optimum solution of the energy-scheduling problem.
5.1. Grasshopper Optimization Algorithm (GOA)
GOA is the meta-heuristic population-based optimization technique [
35]. Grasshoppers are insects and are considered harmful to crops. The main property of grasshoppers is to form a swarm although they are seen separately in nature. The swarm assembled by grasshoppers is one of the largest swarms of all the creatures in the world and it is considered to be the nightmare for farmers. The lifecycle of grasshopper consists of egg, nymph, and adult. The eggs hatch for ten months, the nymph grasshopper born. Nymph grasshoppers jump over each other and start rolling and eat everything that comes in their way. After some time, they become adults and start swarming in the air.
GOA basically focuses on the social behavior of grasshoppers. Every member of the swarm consists of a single insect, positioned in a search space ‘S’ and moving within its bound. Here we are considering the two important motions of grasshopper. The first is the cooperation of grasshoppers which show slow movements when it is in larvae phase, and dynamic movements, when it is in insect form. The second movement is foraging for food.
The grasshopper agents are generated randomly, to form a swarm. The best search agent is chosen based on fitness value evaluation. The best grasshopper agent starts moving toward another individual in its surrounding. Thus, all the search agents start a motion toward the best grasshopper search agent.
shows the migration of
ith search agent towards the target search agent. Mathematically it is given as follows:
In the above equation
shows the direction of wind,
shows the gravitational force on
ith grasshopper and
is the social interaction, which is considered to be the main movement part in grasshopper motion. Mathematically it is given as follows;
where
is the position vector from
ith grasshopper to
jth grasshopper and
is the distance between two grasshoppers, which is given by;
and
S is the social interaction force which is given as:
where
a is attractive scale length,
d grasshoppers in-between distance and
f is the strength of social forces.
In Equation (
6), the gravitational force
is calculated as follows:
where
g denotes the constant of gravitational force and
is the unit vector.
Now
component in Equation (
6) is given as follows;
where
v is the constant drift velocity and
denotes the unit vector.
According to proposed mathematical model in [
33];
We modify this model for the purpose of our energy optimization problem as follows:
where
and
are the upper and lower bounds respectively in the
D dimension,
is the decreasing parameter which shrink the comfort zone and
is the value of
D dimension of the target agent. The gravitational force has been neglected and wind force is considered in the direction of target agent.
can be calculated as follows;
where
is the upper-limit and
is the lower-limit of
,
is the number of iterations and
is the maximum number of iterations. The aforementioned equations are used for the creation of flock in free-space.
GOA algorithm working steps are given in Algorithm 1.
| Algorithm 1: A step-by-step process of the GOA algorithm. |
 |
5.2. Cuckoo Search Algorithm (CSA)
Cuckoo search algorithm is a bio-inspired meta-heuristic algorithm proposed by [
36]. In order to explain the cuckoo search mechanism, every individual cuckoo bird lays one egg in a single interval of time and in the randomly chosen nest of other birds, where the host nest quantity is kept fixed and the probability of host to discover the egg is
. It is variable whether the host bird leaves the nest and make another nest or throws the eggs of another bird from the nest. For optimizing the problem, fitness function is set as objective function. In this case, eggs in the nest is considered to be the solution (to the problem) and the dumping of cuckoo egg is a new solution. If the solution present previously in the nest is not better, then the old solution is replaced with a new one. For reproduction, the nest contains the best quality of eggs which is known as the local solution.
air trips, known as flights, are performed for finding the solution to best globally.
In the above equation is the new solution, is the current status, is the transition or step size. Frye and Reynolds have recently found with the recent study of fruit-fly flight. The fruit-fly explores its landscape by a series of straight flights with a sudden turn of , leading to intermittent scale free search pattern.
CSA algorithm is given in Algorithm 2.
| Algorithm 2: Pseudocode of proposed CSA Algorithm. |
 |
6. Results and Discussions
In this section, results and simulations work are explained in detail. To show legitimacy and benefits of our proposed work, we have considered a MATLAB computing environment for simulations. For the solution of the energy optimization problem, simulation of our proposed scheduling schemes are performed. To check out the performance of our algorithms i.e., GOA and CSA, we are considering different parameters such as total energy consumption, PAR, consumed energy expenditure and user comfort. Moreover, in the industrial sector, automatic operating machines(AOMs) are being used as they can work independently and could be turned ON/OFF any time during 24 h.
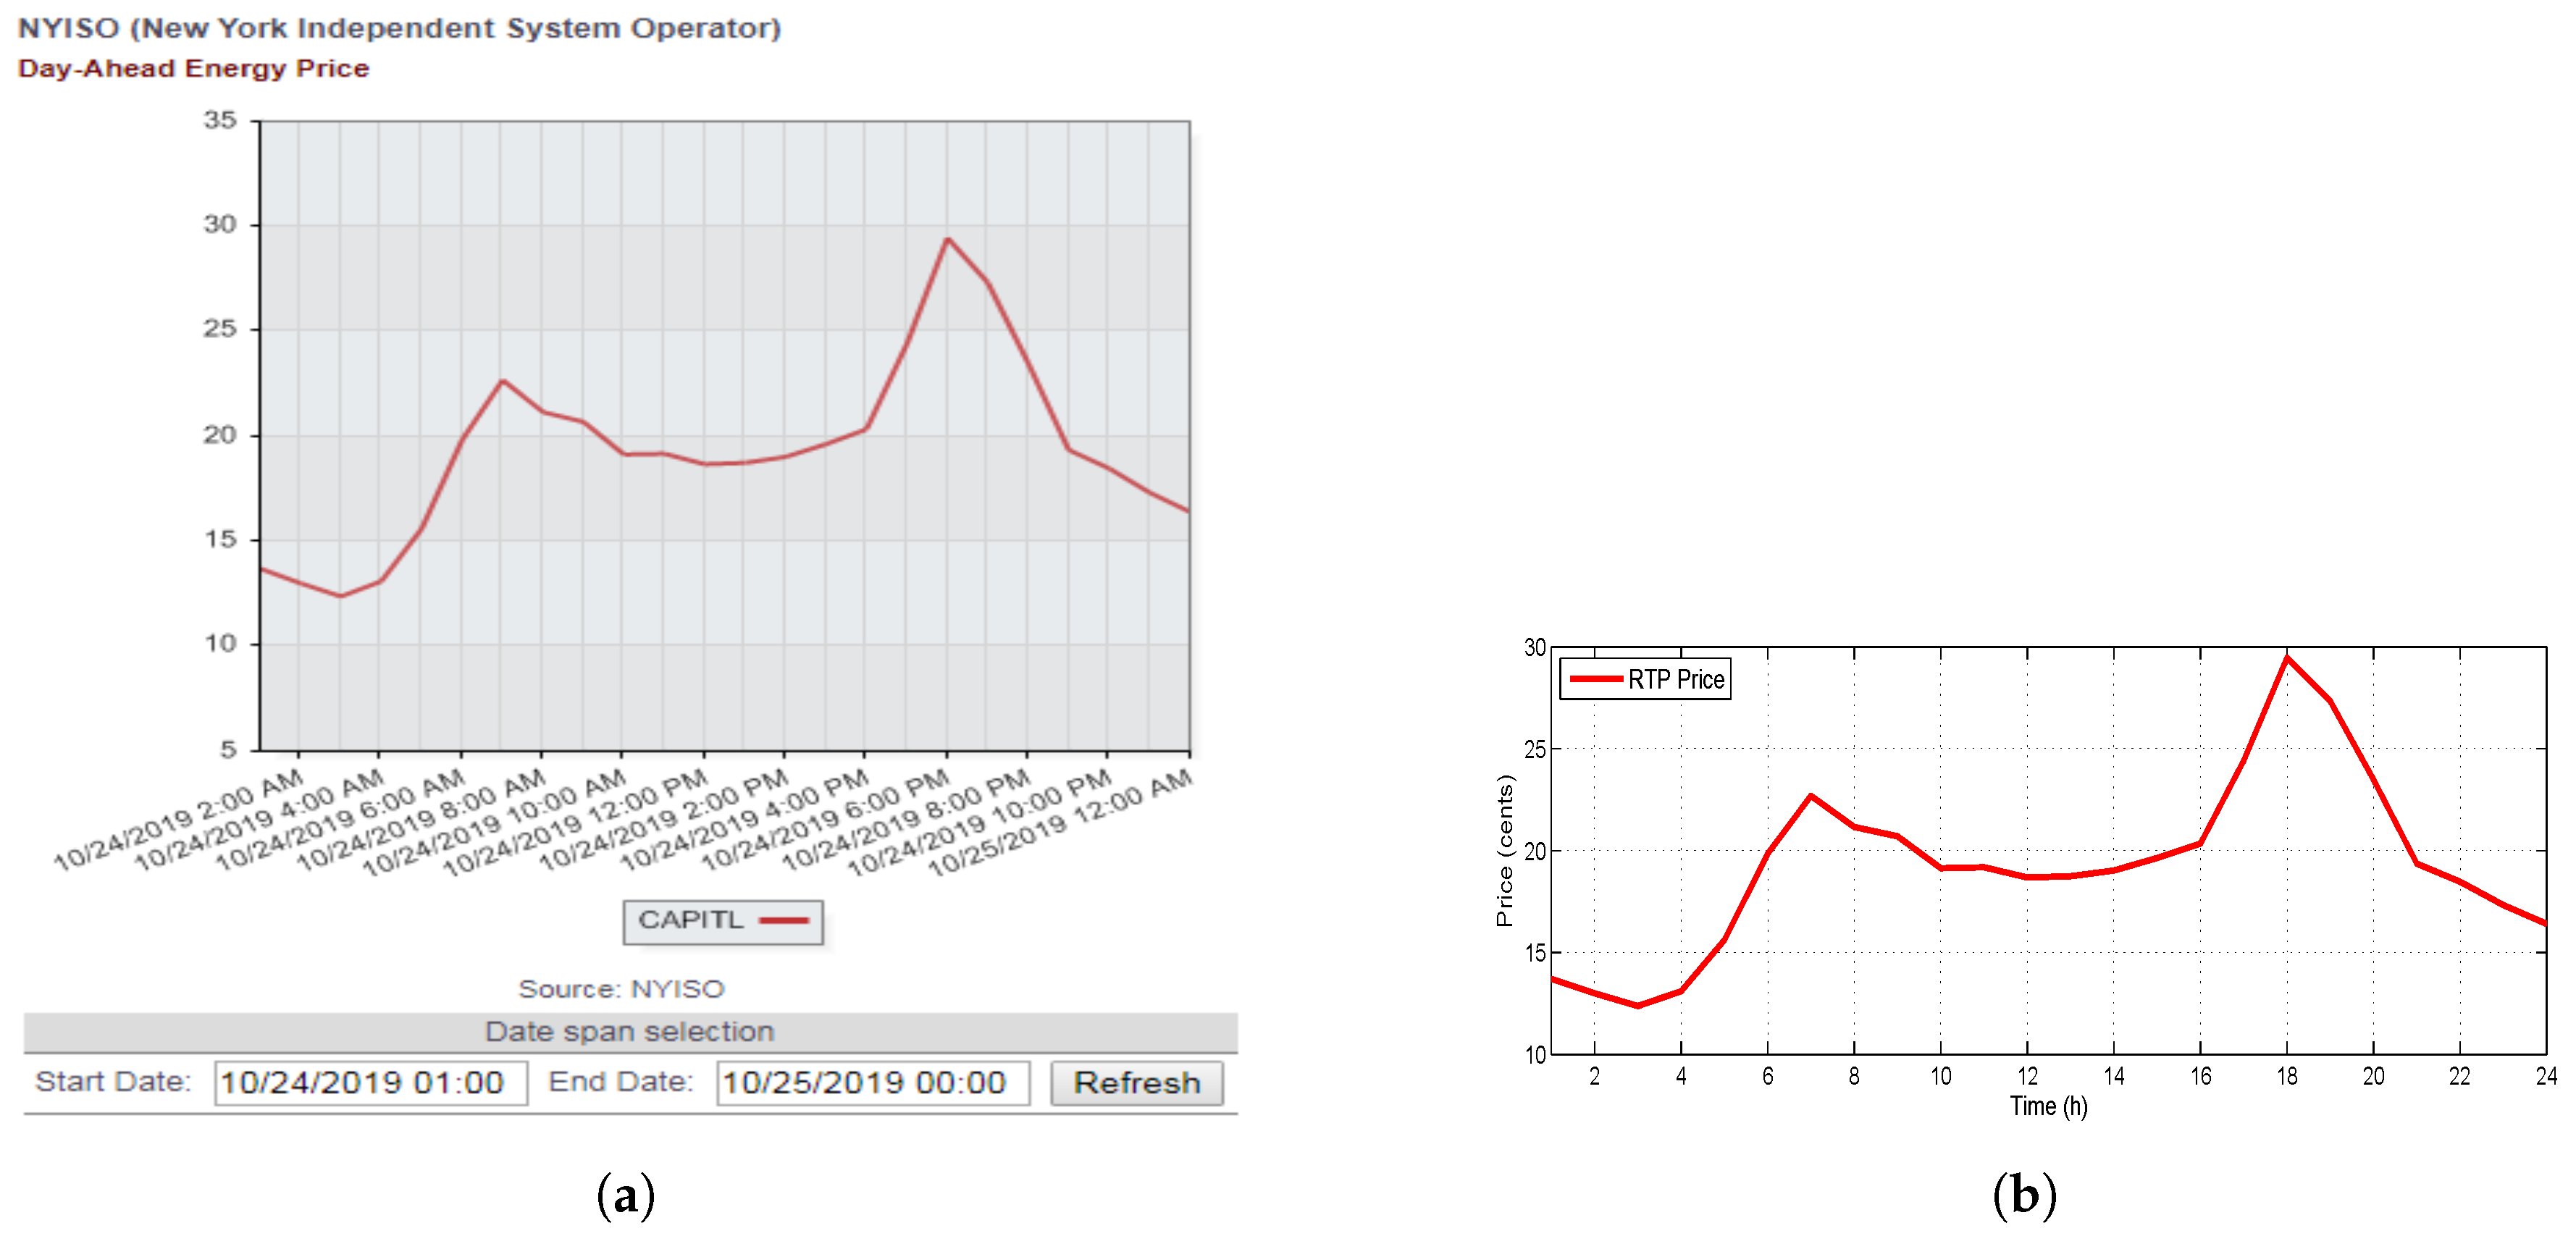
6.1. Pricing Signal
The day-ahead pricing (DAP) signal, shown in
Figure 3 issued by the utility, is reproduced and used for the manipulation of consumed energy bill.
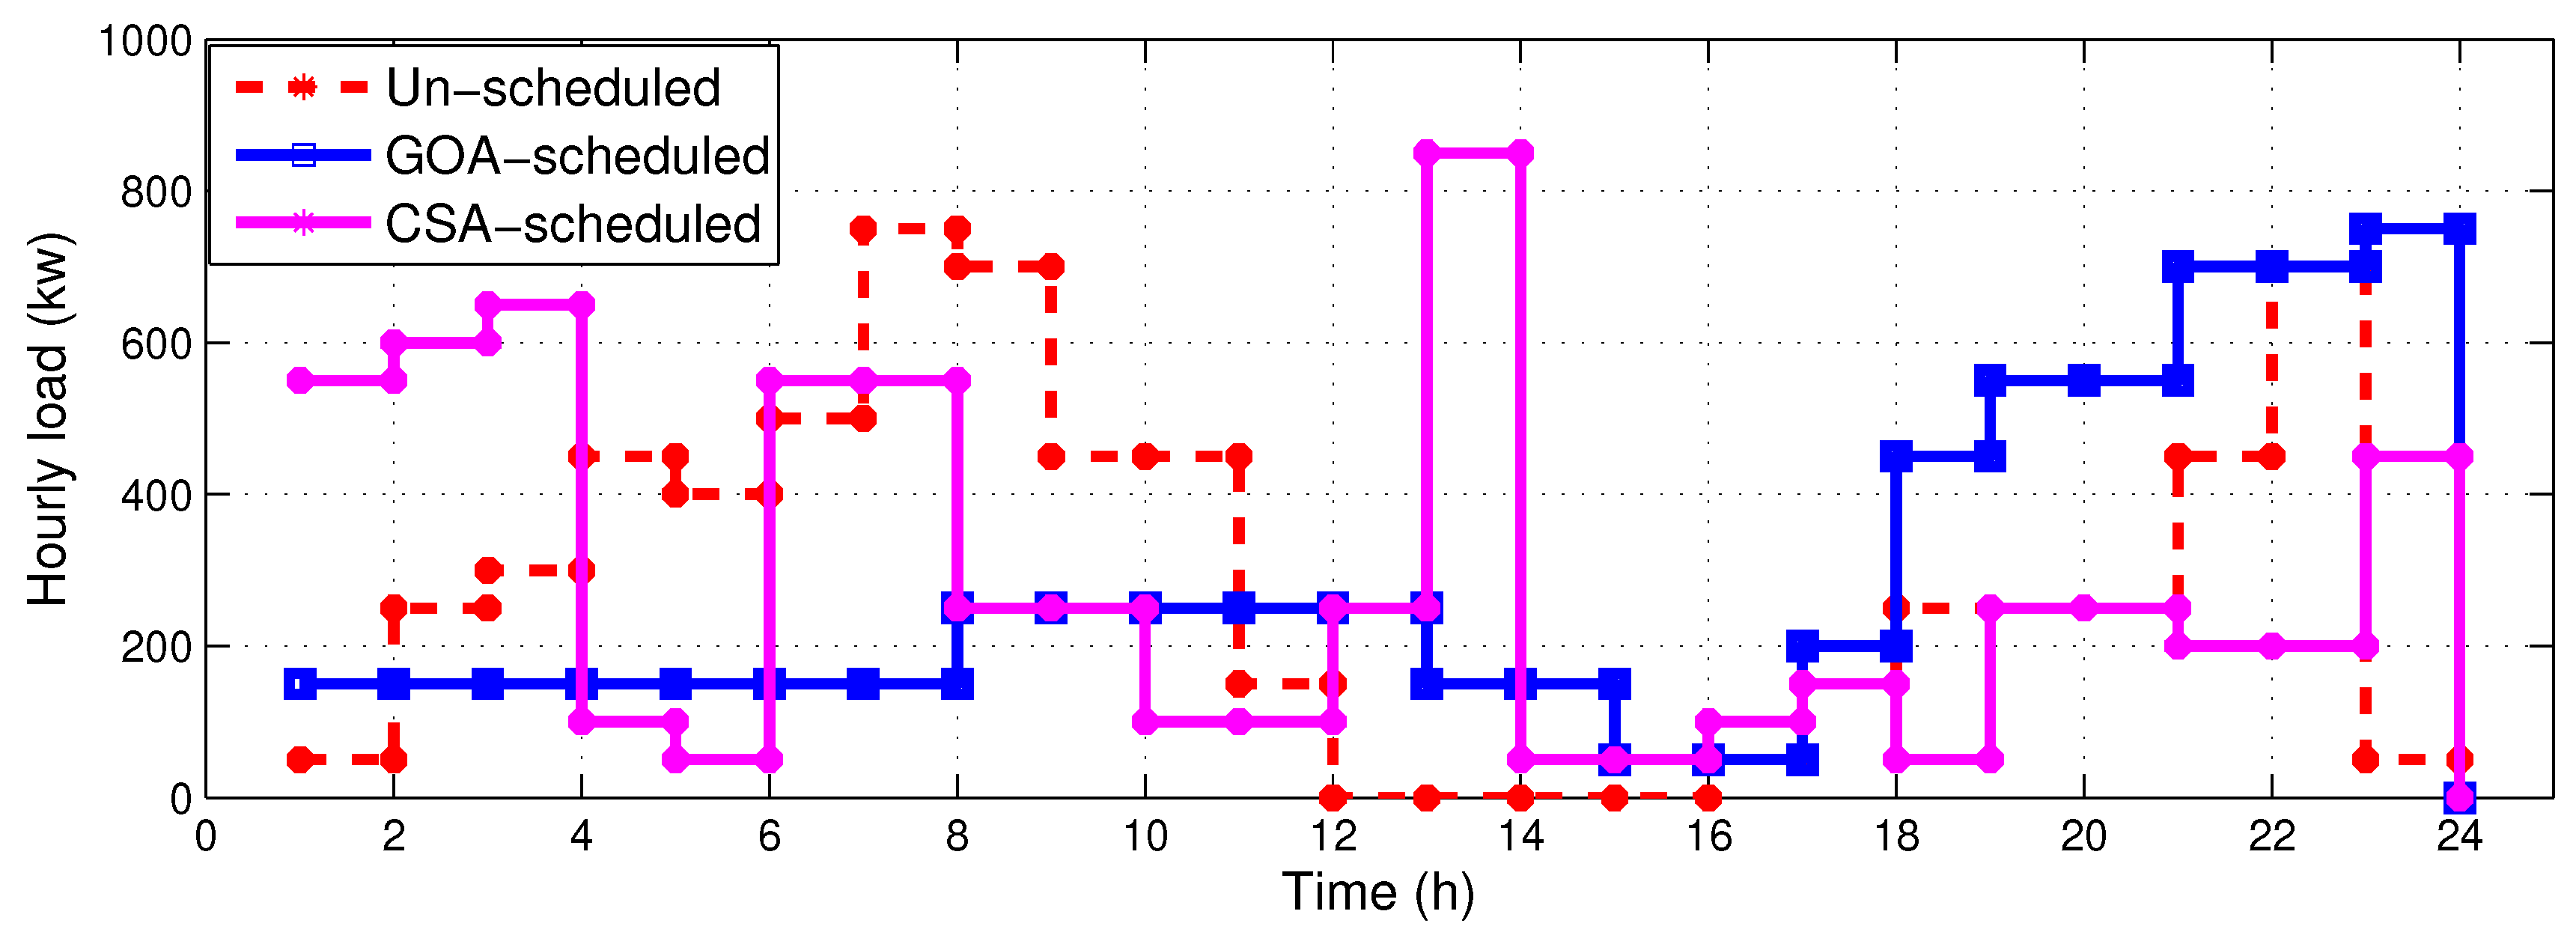
6.2. Per-Hour Power Consumption
Figure 4 shows the graph of power consumption per hour. The consumption pattern shows that in unscheduled cases, more power is consumed in high demand time and thus creates the peak load. After the scheduling of the load through algorithms, power consumption in high demand time is shifted to low-demand hours. From the graph it is clear that a GOA-scheduled load pattern is a bit uniform and is low during the first high price between 6.00 and 8.00 hr and during highest price at 18.00 hr as per the DAP signal shown in the
Figure 3.
Figure 4 depicts that CSA-scheduled-load pattern shows a bit of a variable response. Although the load is not totally shifted from the first high price between 6.00 and 8.00 hr, during highest price at 18.00 hr, CSA gives tremendous reduction in load pattern.
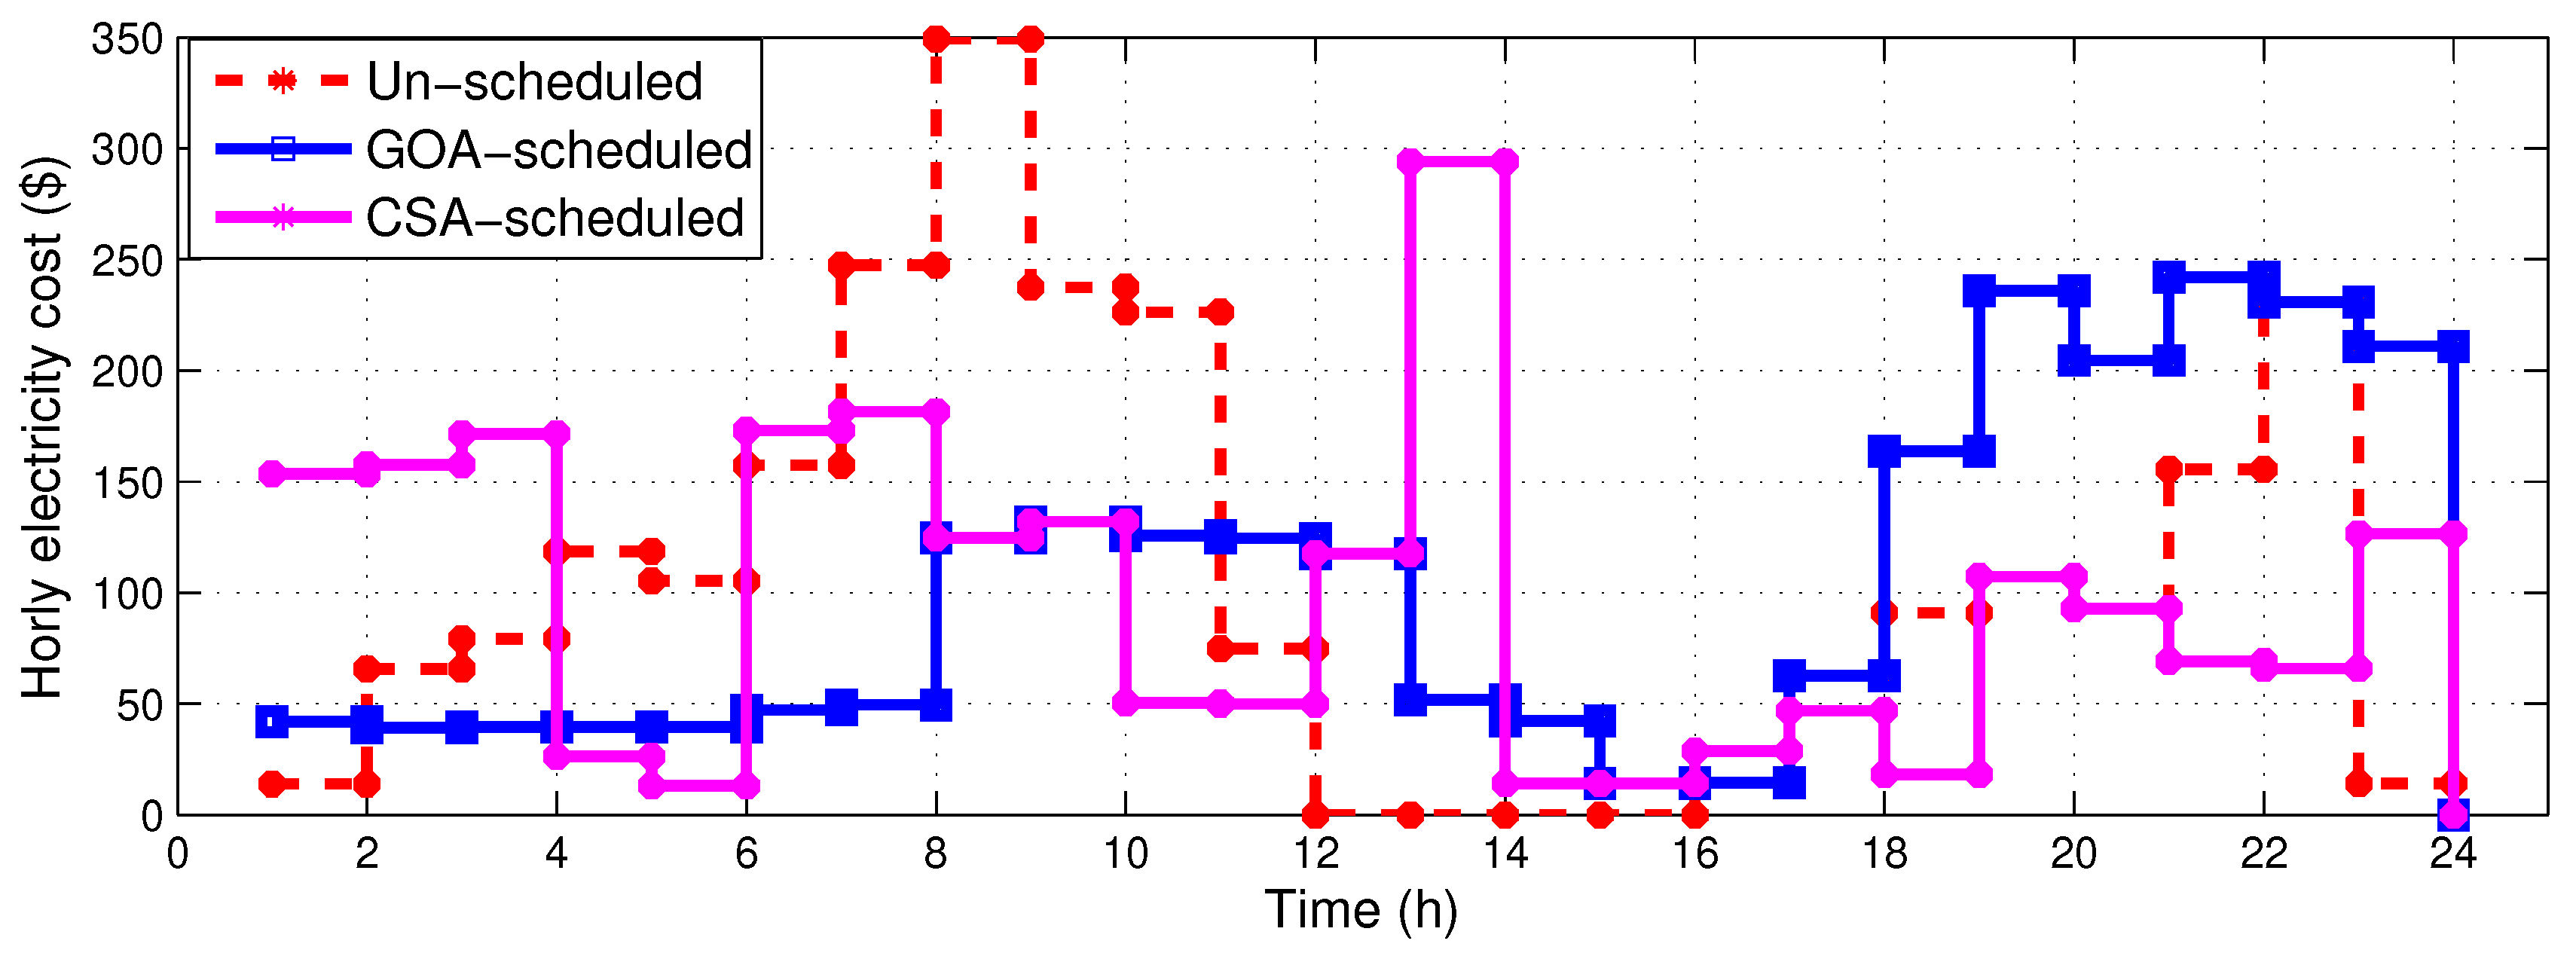
6.3. The Hourly Consumed Energy Price
Figure 5 elaborates the graph of per-hour consumed energy price. The result illustrates that in unscheduled cases, the company must pay higher cost because the peak load is created in on-peak hours. However, in the scheduled-load case, the load is shifted from timing of high load demand to low-demand hours and thus reduces the cost per hour. GOA-scheduled load-per-hour cost is again a bit uniform due to its load pattern, and gives reduced total cost as is shown in
Figure 6. However, due to the variable nature of the CSA-scheduled-load pattern, its total cost is a bit more than the GOA-scheduled load cost, but still it is less than unscheduled-load cost.
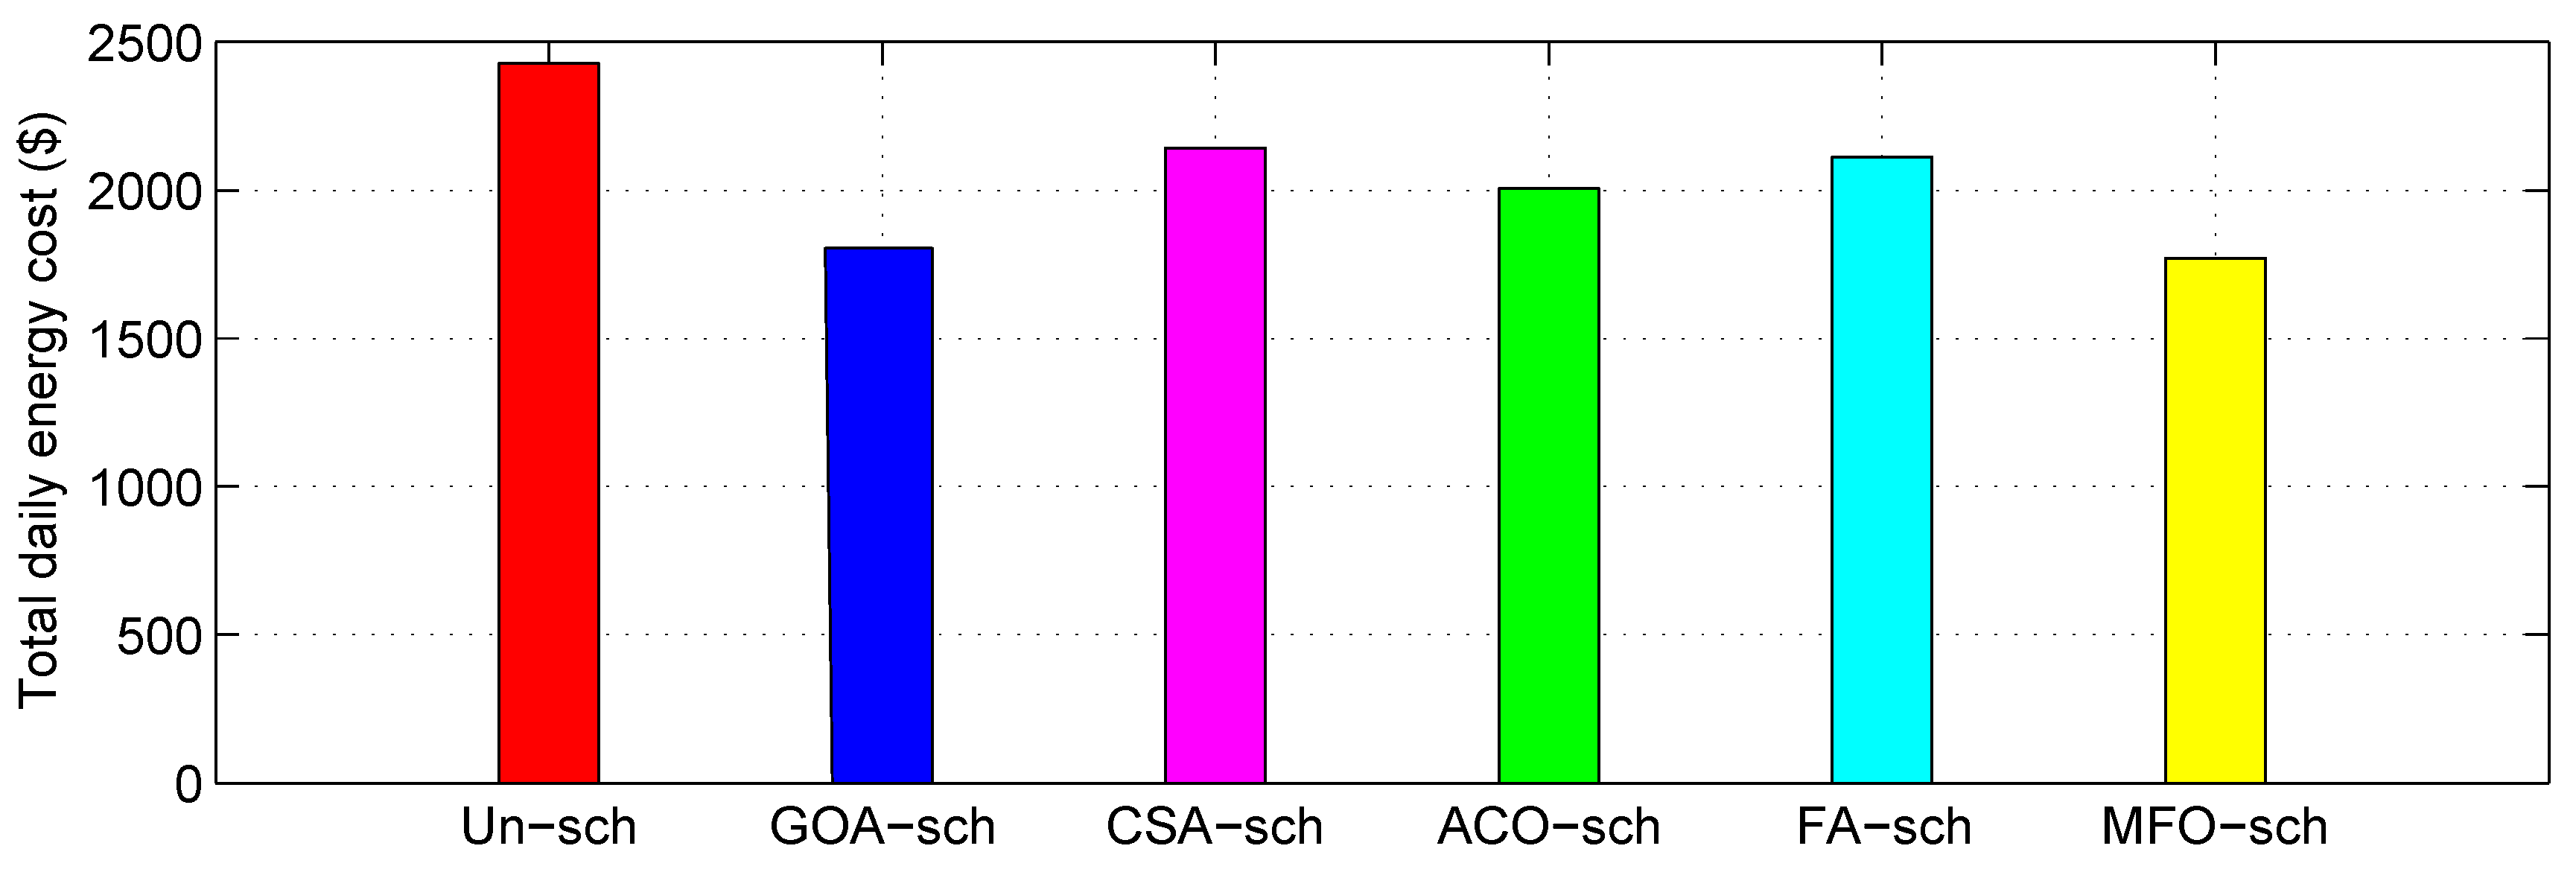
6.4. Total Daily Average Cost
Figure 6 shows the total daily average cost in case of unscheduled load compared to load scheduled using different algorithms. The figure depicts that the unscheduled-load total daily cost is 2397.21
$. However, after scheduling, the total daily cost for GOA-scheduled load is 1768.27
$ and for CSA it is 2147.28
$ per day. These results show that by using optimization algorithms, we can reduce our total cost. GOA gives better results in reducing per-day energy cost compared to CSA. The figure also depicts a comparison of the proposed algorithms with the most modernistic optimization algorithms such as ant-colony optimization (ACO), firefly algorithm (FA) and moth-flame optimization (MFO) algorithm. We did not show FA, ACO and MFO results of per-hour load and its respective cost in
Figure 4 and
Figure 5 to avoid congestion. However, using the same scenario, we showed a comparison of our proposed algorithms’ scheduled-load cost, not only with unscheduled-load cost, but also, with FA, ACO and MFO algorithms scheduled-load cost.
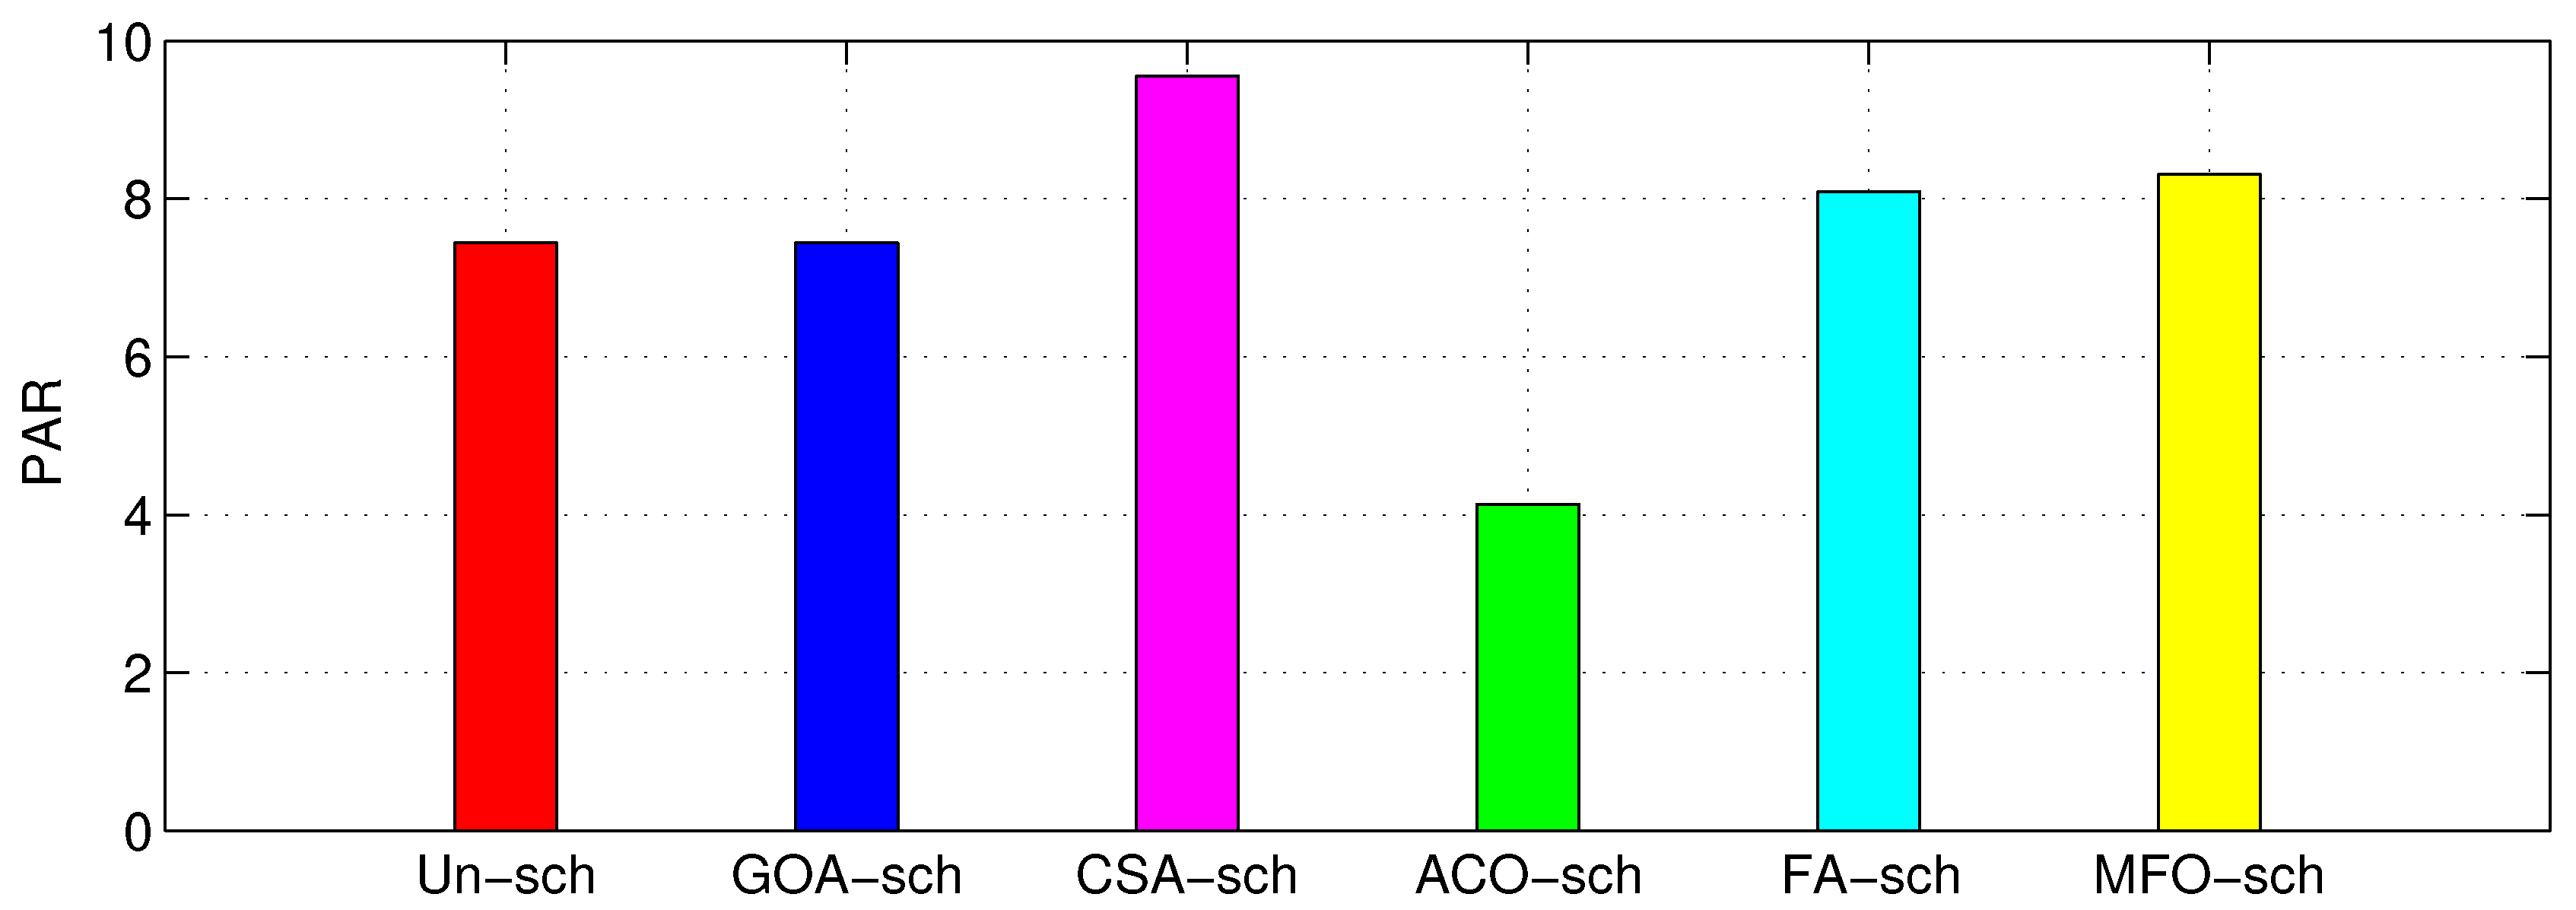
6.5. PAR
Figure 7 shows PAR results, which tells the stability of a grid. When the PAR value increases or decreases, it affects the stability of a grid. Due to the reduction in cost, PAR is not reduced. GOA-scheduled load gives the same PAR as that of unscheduled load; however, CSA-scheduled-load PAR is more than both unscheduled and GOA-scheduled load PARs. The figure also depicts a comparison of the proposed algorithms PAR with the most modernistic optimization algorithms such as ACO, FA and MFO algorithm PARs. However, using the same scenario, ACO-scheduled-load PAR is less out of all algorithms.
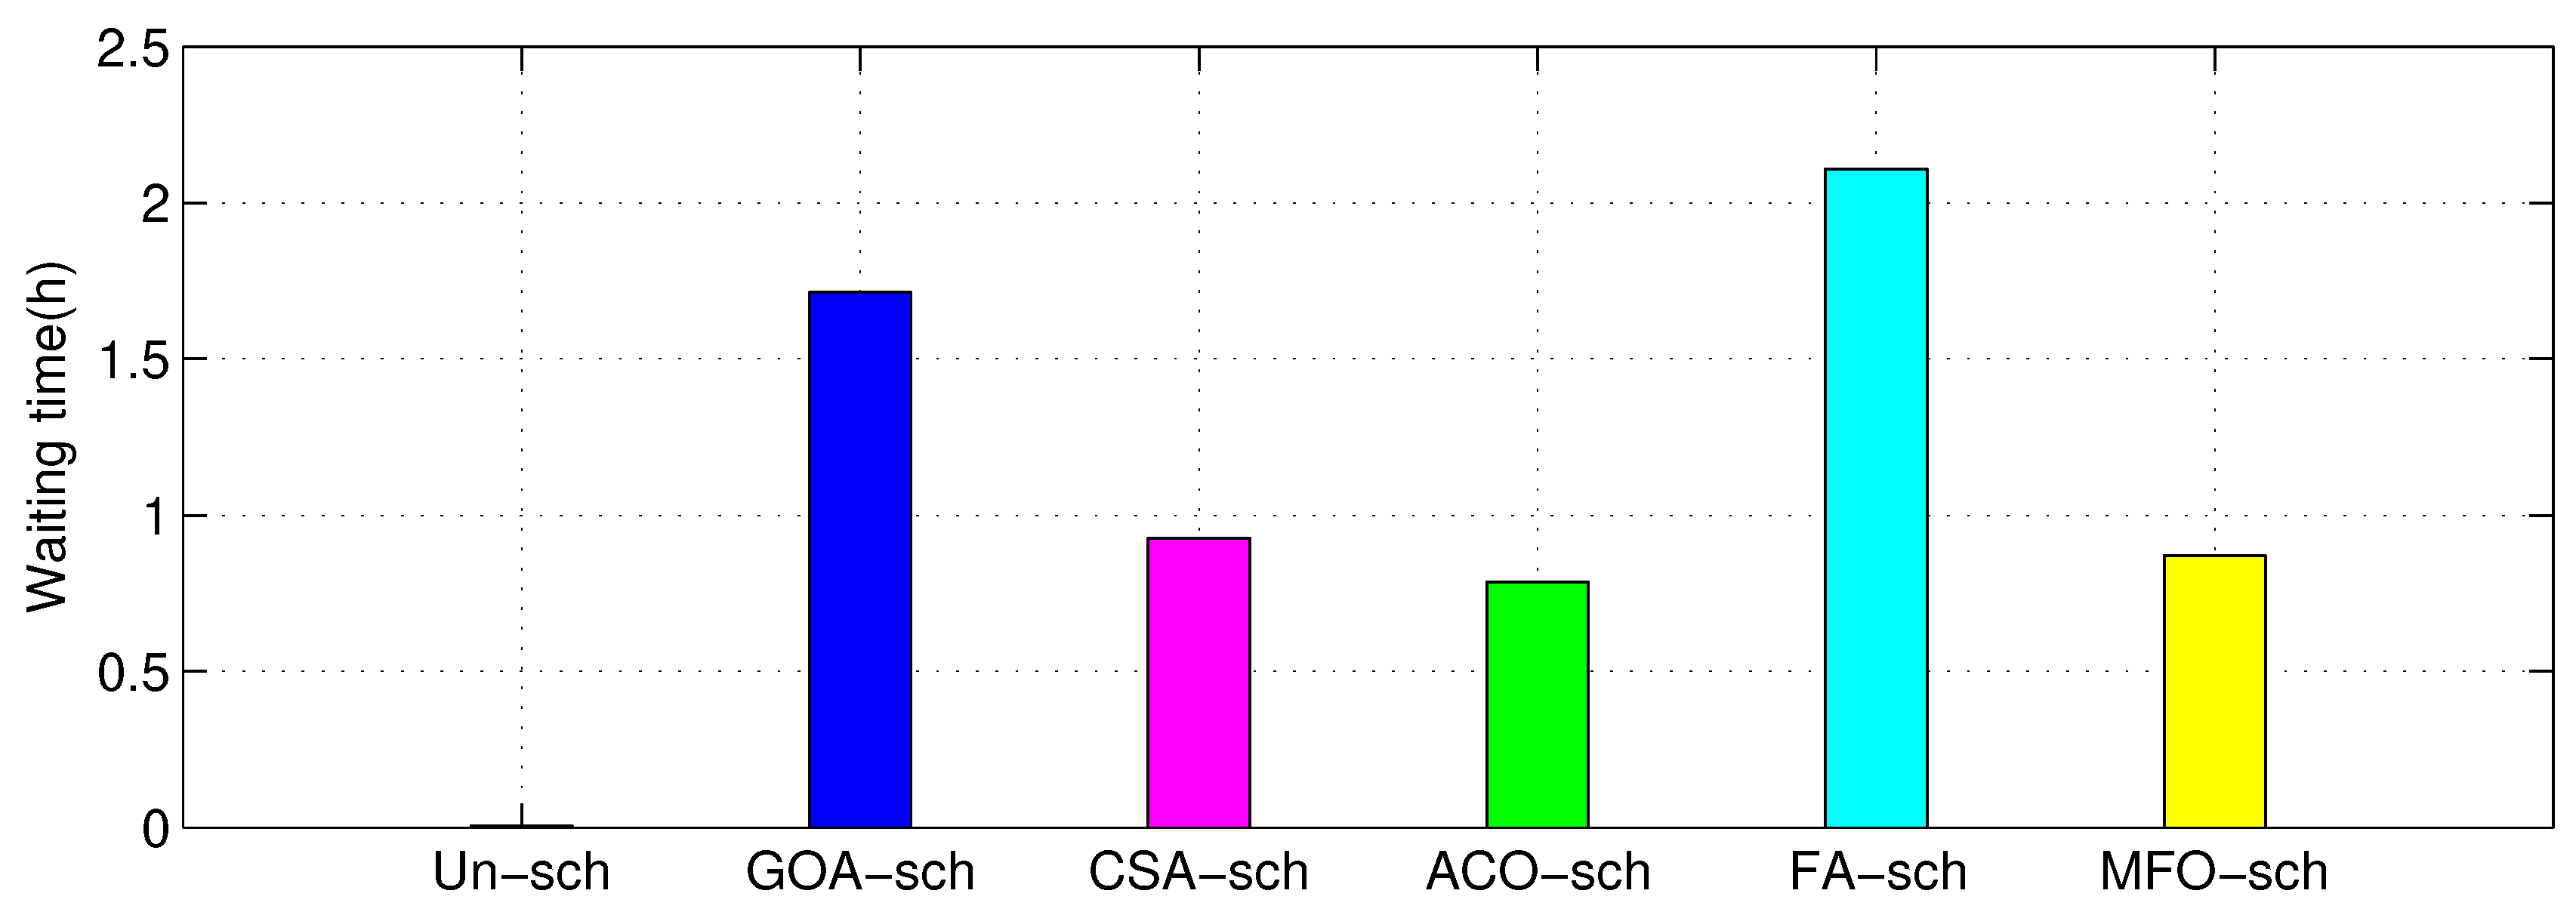
6.6. Machines Average Waiting Time
Figure 8 shows the average waiting time of machines for each technique. It is that time interval, when a consumer switches on a machine, but due to scheduling for reduction of cost, the machine does not start operation. Therefore, the consumer must wait for a specific amount of time
. The figure shows that the waiting time of GOA is higher than CSA. It is because GOA has reduced the cost more than CSA. Therefore, for cost reduction, GOA is good, however, for those consumers who want to reduce their waiting time, CSA scheduling is good.
Figure 8 also depicts a comparison of the proposed algorithms with ACO, FA and MFO algorithms. ACO gives better results in cases of waiting time.
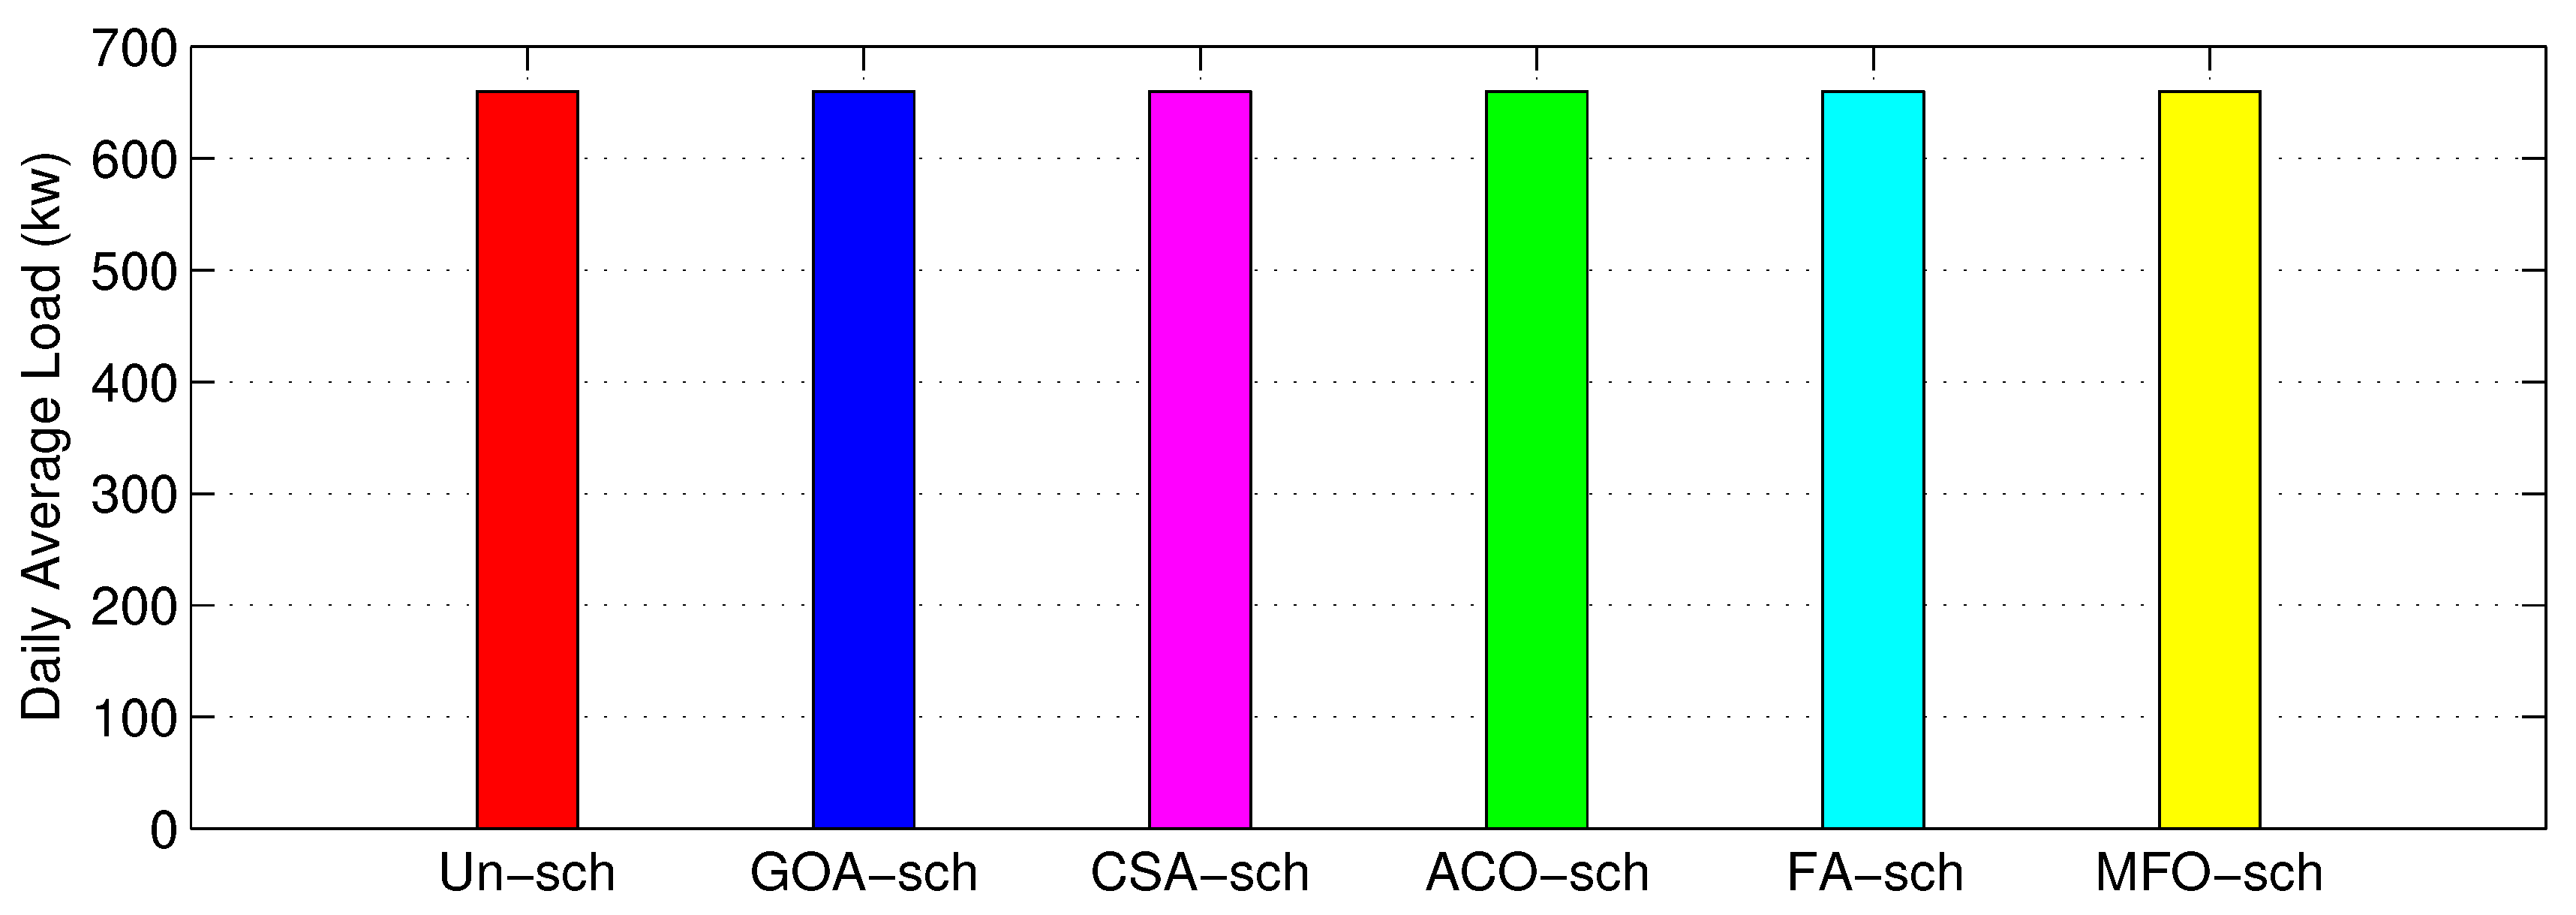
6.7. The Total Daily Average Load
Figure 9 shows that the total daily load is same in the case of unscheduled and scheduled with different algorithms. It is clear from the figure that, irrespective of the scheduling algorithms, the total daily load remains the same. Scheduling algorithms only shift the load to low cost or low demand hours; however, they do not reduce the total daily load run by the industry.
Table 2 depicts a comparison of the proposed algorithms with the unscheduled load in terms of minimization of consumed energy price, PAR and user average time of waiting. A comparison of the proposed algorithms with recently applied algorithms such as the ACO, FA and MFO algorithms is also shown in the table.
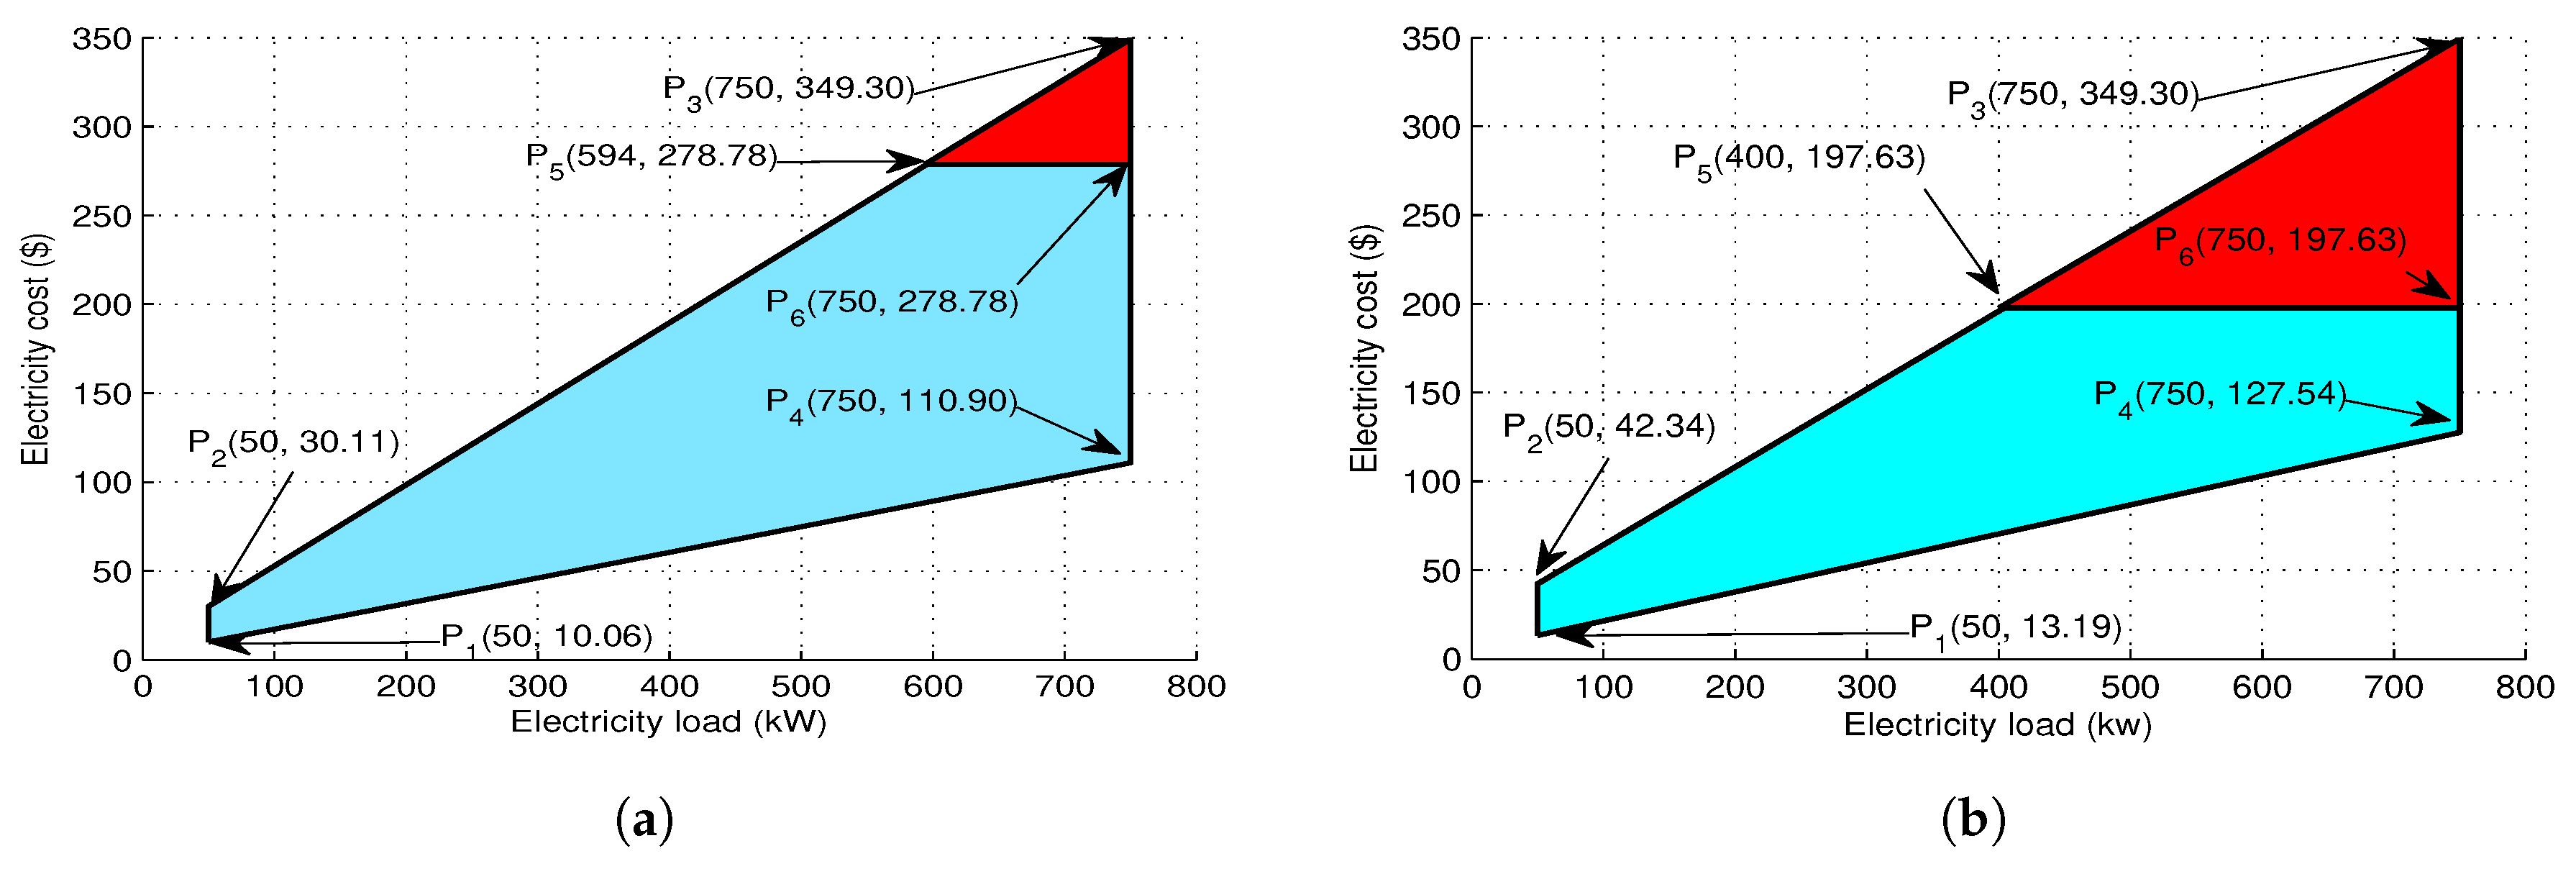
6.8. Feasible Regions
A feasible region is a set of all possible points. Due to the scheduling of the load, cost minimization is decided based on the pricing signal issued by the utility, using different algorithms. We have considered the DAP signal for our calculations.
Figure 10a shows the feasible region for GOA algorithm. Point
(50, 10.06) gives the minimum load with minimum cost, and point
(50, 30.11) gives the minimum load with maximum cost in any interval of time. It usually happens when the minimum load is running in peak hours with high energy cost. Similarly, point
(750, 394.30) gives the maximum load with maximum cost in the case of the unscheduled load. Point
(750, 110.90) gives the maximum load during off-peak hours with minimum cost.
(594, 278.78) puts a threshold on the maximum cost after scheduling with GOA. It continues until point
(750, 278.78) reaches, which gives a point of the maximum load with reduced cost.
Figure 10b shows all these points for CSA scheduling. It is clear from these figures that CSA performs better as compared to GOA in the case of cost minimization.
Table 3 describes the run-time of GOA and CSA algorithms for a single day using a laptop with Intel (R) processor of core i5 capability and with 4GB RAM.
7. Conclusions and Future Work
In this paper, we have illustrated a DSM strategy for the energy optimization problem. We have divided industrial load into different load units. We have proposed and practically applied two bio-inspired optimization schemes—GOA and CSA—to these load units for scheduling the automatic operated machines according to the day-ahead pricing signal. We checked out the performance of our two proposed algorithms based on total consumed energy, reduction of PAR, cost and user comfort in terms of waiting time, compared to unscheduled load. We also tested and compared the performance of our proposed algorithms with state-of-the-art algorithms ACO, FA and MFO. Simulation results show that by applying bio-inspired techniques, we can minimize the consumed energy price by shifting some load to low-demand load hours, without disturbing its operation. Because of this, the burden on utility is reduced in the form of PAR and maximized user comfort. In future work, further bio-inspired techniques for smart and optimum energy use should be explored, and the application of multi-objective techniques should be carried out in commercial, residential, and educational sectors. Renewable energy sources should be considered for further reduction of energy price and peak-to-average ratio.
Author Contributions
All the authors equally contributed, edited, revised and approved the manuscript. All authors have read and agreed to the published version of the manuscript.
Funding
This work is supported by Endicott College of International Studies, Woosong University, Daejeon, Korean research fund.
Acknowledgments
The authors would like to thank, Endicott College of International Studies, Woosong University, Daejeon, Korea for supporting this work.
Conflicts of Interest
The authors declare no conflict of interest.
References
- Electricity Customers. Available online: https://www.epa.gov/energy/electricity-customers (accessed on 20 February 2019).
- Ananthavijayan, R.; Karthikeyan Shanmugam, P.; Padmanaban, S.; Holm-Nielsen, J.B.; Blaabjerg, F.; Fedak, V. Software Architectures for Smart Grid System-A Bibliographical Survey. Energies 2019, 12, 1183. [Google Scholar] [CrossRef]
- Rahimi, F.; Ipakchi, A. Demand response as a market resource under the smart grid paradigm. IEEE Trans. Smart Grid 2010, 1, 82–88. [Google Scholar] [CrossRef]
- Khalid, A.; Javaid, N.; Mateen, A.; Khalid, B.; Khan, Z.A.; Qasim, U. Demand Side Management using Hybrid Bacterial Foraging and Genetic Algorithm Optimization Techniques. In Proceedings of the 2016 10th International Conference on Complex, Intelligent, and Software Intensive Systems (CISIS), Fukuoka, Japan, 6–8 July 2016; pp. 494–502. [Google Scholar]
- AboGaleela, M.; El-Sobki, M.; El-Marsafawy, M. A two level optimal DSM load shifting formulation using genetics algorithm case study: Residential loads. In Proceedings of the IEEE Power and Energy Society Conference and Exposition in Africa: Intelligent Grid Integration of Renewable Energy Resources (PowerAfrica), Johannesburg, South Africa, 9–13 July 2012; pp. 1–7. [Google Scholar]
- Zhao, Z.; Lee, W.C.; Shin, Y.; Song, K.B. An optimal power scheduling method for demand response in home energy management system. IEEE Trans. Smart Grid 2013, 4, 1391–1400. [Google Scholar] [CrossRef]
- Entriken, R.; Hu, R.; Skorupski, R.; Ye, Y. A mathematical Formulation for Optimal Load Shifting of Electricity Demand. IEEE Trans. Smart Grid 2015. [Google Scholar] [CrossRef]
- Fresco Contreras, R.; Moyano, J.; Rico, F. Genetic algorithm-based approach for optimizing the energy rating on existing buildings. Build. Serv. Eng. Res. Technol. 2016, 37, 664–681. [Google Scholar] [CrossRef]
- Tang, L.; Zhao, Y.; Liu, J. An improved differential evolution algorithm for practical dynamic scheduling in steelmaking-continuous casting production. IEEE Trans. Evol. Comput. 2014, 18, 209–225. [Google Scholar] [CrossRef]
- Liu, B.; Kang, J.; Jiang, N.; Jing, Y. Cost control of the transmission congestion management in electricity systems based on ant colony algorithm. Energy Power Eng. 2011, 3, 17. [Google Scholar] [CrossRef]
- Tsui, K.M.; Chan, S.C. Demand response optimization for smart home scheduling under real-time pricing. IEEE Trans. Smart Grid 2012, 3, 1812–1821. [Google Scholar] [CrossRef]
- Tang, Y.; Luo, C.; Yang, J.; He, H. A chance constrained optimal reserve scheduling approach for economic dispatch considering wind penetration. IEEE/CAA J. Autom. Sin. 2017, 4, 186–194. [Google Scholar] [CrossRef]
- Yanan, W.; Jiekang, W.; Xiaoming, M. Intelligent scheduling optimization of seasonal CCHP system using rolling horizon hybrid optimization algorithm and matrix model framework. IEEE Access 2018, 6, 75132–75142. [Google Scholar] [CrossRef]
- Liu, H.; Zhou, M.; Guo, X.; Zhang, Z.; Ning, B.; Tang, T. Timetable optimization for regenerative energy utilization in subway systems. IEEE Trans. Intell. Transp. Syst. 2018, 20, 3247–3257. [Google Scholar] [CrossRef]
- Chen, R.; Sun, H.B.; Guo, Q.L.; Li, Z.G.; Deng, T.H.; Wu, W.C.; Zhang, B.M. Reducing Generation Uncertainty by Integrating CSP With Wind Power: An Adaptive Robust Optimization-Based Analysis. IEEE Trans. Sustain. Energy 2019, 12, 583–594. [Google Scholar] [CrossRef]
- Anvari-Moghaddam, A.; Guerrero, J.M.; Vasquez, J.C.; Monsef, H.; Rahimi-Kian, A. Efficient energy management for a grid-tied residential microgrid. IET Gener. Transm. Distrib. 2017, 11, 2752–2761. [Google Scholar] [CrossRef]
- Khan, Z.A.; Zafar, A.; Javaid, S.; Aslam, S.; Rahim, M.H.; Javaid, N. Hybrid meta-heuristic optimization based home energy management system in smart grid. J. Ambient. Intell. Humaniz. Comput. 2019, 10, 4837–4853. [Google Scholar] [CrossRef]
- Bouakkaz, A.; Haddad, S.; Martin-Garcia, J.A.; Mena, A.J.G.; Castaneda, R.J. Optimal Scheduling of Household Appliances in Off-Grid Hybrid Energy System using PSO Algorithm for Energy Saving. Int. J. Renew. Energy Res. 2019, 9, 427–436. [Google Scholar]
- Khan, N.; Riaz, M. Reliable and Secure Advanced Metering Infrastructure for Smart Grid Network. In Proceedings of the International Conference on Computing, Electronic and Electrical Engineering (ICE Cube), Quetta, Pakistan, 12–13 November 2018; pp. 1–6. [Google Scholar] [CrossRef]
- Jing, R.; Zhu, X.; Zhu, Z.; Wang, W.; Meng, C.; Shah, N.; Zhao, Y. A multi-objective optimization and multi-criteria evaluation integrated framework for distributed energy system optimal planning. Energy Convers. Manag. 2018, 166, 445–462. [Google Scholar] [CrossRef]
- Sulaiman, M.H.; Mustaffa, Z.; Aliman, O.; Daniyal, H.; Mohamed, M.R. An application of Moth-Flame Optimization algorithm for solving optimal reactive power dispatch problem. In Proceedings of the 4th IET Clean Energy and Technology Conference (CEAT 2016), Kuala Lumpur, Malaysia, 14–15 November 2016; pp. 1–5. [Google Scholar] [CrossRef]
- Safdarian, A.; Fotuhi-Firuzabad, M.; Lehtonen, M. A Distributed Algorithm for Managing Residential Demand Response in Smart Grids. IEEE Trans. Ind. Inform. 2014, 10, 2385–2393. [Google Scholar] [CrossRef]
- Wang, J.; Cao, J.; Li, B.; Lee, S.; Sherratt, R.S. Bio-inspired ant colony optimization based clustering algorithm with mobile sinks for applications in consumer home automation networks. IEEE Trans. Consum. Electron. 2015, 61, 438–444. [Google Scholar] [CrossRef]
- Leithon, J.; Sun, S.; Lim, T.J. Demand Response and Renewable Energy Management Using Continuous-Time Optimization. IEEE Trans. Sustain. Energy 2018, 9, 991–1000. [Google Scholar] [CrossRef]
- Graditi, G.; Di Silvestre, M.L.; Gallea, R.; Sanseverino, E.R. Heuristic-Based Shiftable Loads Optimal Management in Smart Micro-Grids. IEEE Trans. Ind. Inform. 2015, 11, 271–280. [Google Scholar] [CrossRef]
- Rahbar, K.; Chai, C.C.; Zhang, R. Energy Cooperation Optimization in Microgrids With Renewable Energy Integration. IEEE Trans. Smart Grid 2018, 9, 1482–1493. [Google Scholar] [CrossRef]
- Ullah, I.; Khitab, Z.; Khan, M.N.; Hussain, S. An Efficient Energy Management in Office Using Bio-Inspired Energy Optimization Algorithms. Processes 2019, 7, 142. [Google Scholar] [CrossRef]
- Qi, J.; Lai, C.; Xu, B.; Sun, Y. Leung, K. Collaborative Energy Management Optimization Toward a Green Energy Local Area Network. IEEE Trans. Ind. Inform. 2018, 14, 5410–5418. [Google Scholar] [CrossRef]
- Ullah, I.; Hussain, S. Time-Constrained Nature-Inspired Optimization Algorithms for an Efficient Energy Management System in Smart Homes and Buildings. Appl. Sci. 2019, 9, 792. [Google Scholar] [CrossRef]
- Dileep, G. A survey on smart grid technologies and applications. Renew. Energy 2020, 146, 2589–2625. [Google Scholar] [CrossRef]
- Molderink, A.; Bakker, V.; Bosman, M.G.; Hurink, J.L.; Smit, G.J. Domestic energy management methodology for optimizing efficiency in smart grids. In Proceedings of the 2009 IEEE Bucharest PowerTech, Bucharest, Romania, 28 June–2 July 2009. [Google Scholar]
- Sousa, T.; Morais, H.; Vale, Z.; Faria, P.; Soares, J. Intelligent energy resource management considering vehicle-to-grid: A simulated annealing approach. IEEE Trans. Smart Grid 2012, 3, 535–542. [Google Scholar] [CrossRef]
- Soares, J.; Sousa, T.; Morais, H.; Vale, Z.; Faria, P. An optimal scheduling problem in distribution networks considering V2G. In Proceedings of the 2011 IEEE Symposium on Computational Intelligence Applications In Smart Grid (CIASG), Paris, France, 11–15 April 2011; pp. 1–8. [Google Scholar]
- Feisst, C.; Schlesinger, D.; Frye, W. Smart Grid, the Role of Electricity Infrastructure in Reducing Greenhouse Gas Emissions; White Paper; Cisco Internet Business Solution Group: San Jose, CA, USA, 2008. [Google Scholar]
- Saremi, S.; Mirjalili, S.; Lewis, A. Grasshopper optimization algorithm: Theory and application. Adv. Eng. Softw. 2017, 105, 30–47. [Google Scholar] [CrossRef]
- Yang, X.-S.; Deb, S. Cuckoo search via Levy flights. In Proceedings of the 2009 World Congress on Nature & Biologically Inspired Computing (NaBIC 2009), Coimbatore, India, 9–11 December 2009; pp. 210–214. [Google Scholar]
- Day-Ahead Pricing (DAP). NYISO (New York Independent System Operator). Available online: http://www.energyonline.com/Data/GenericData.aspx?DataId=11&NYISO___Day-Ahead_Energy_Price (accessed on 25 October 2019).
© 2020 by the authors. Licensee MDPI, Basel, Switzerland. This article is an open access article distributed under the terms and conditions of the Creative Commons Attribution (CC BY) license (http://creativecommons.org/licenses/by/4.0/).


