Fourier Coefficients Applied to Improve Backscattered Signals in A Short-Range LIDAR System


 ,
, 
Abstract
1. Introduction
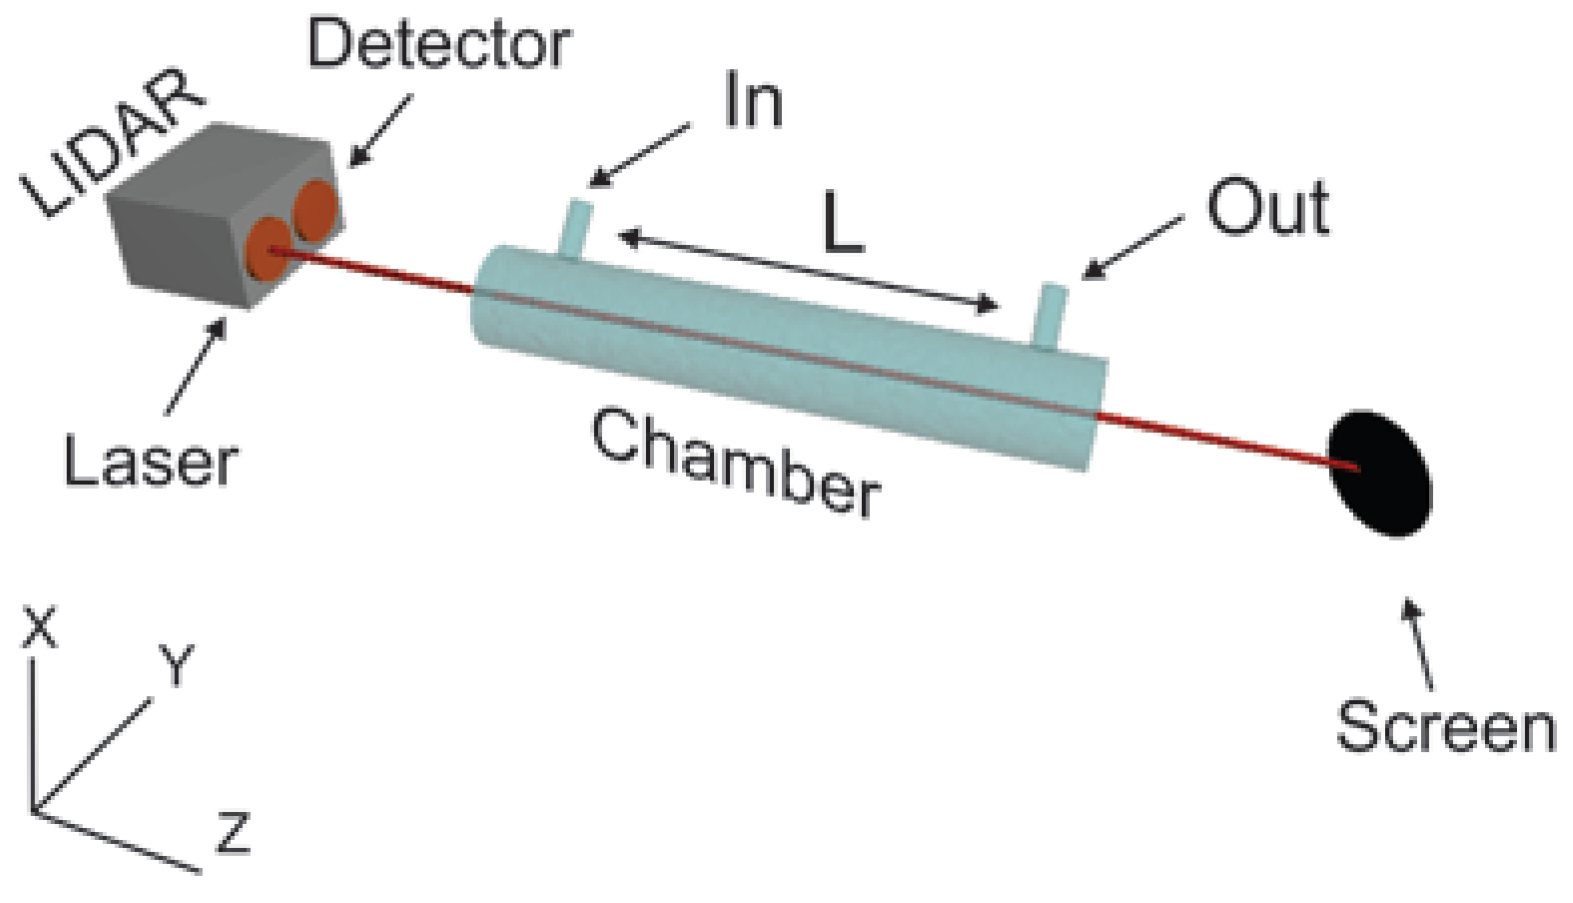
2. Experiment
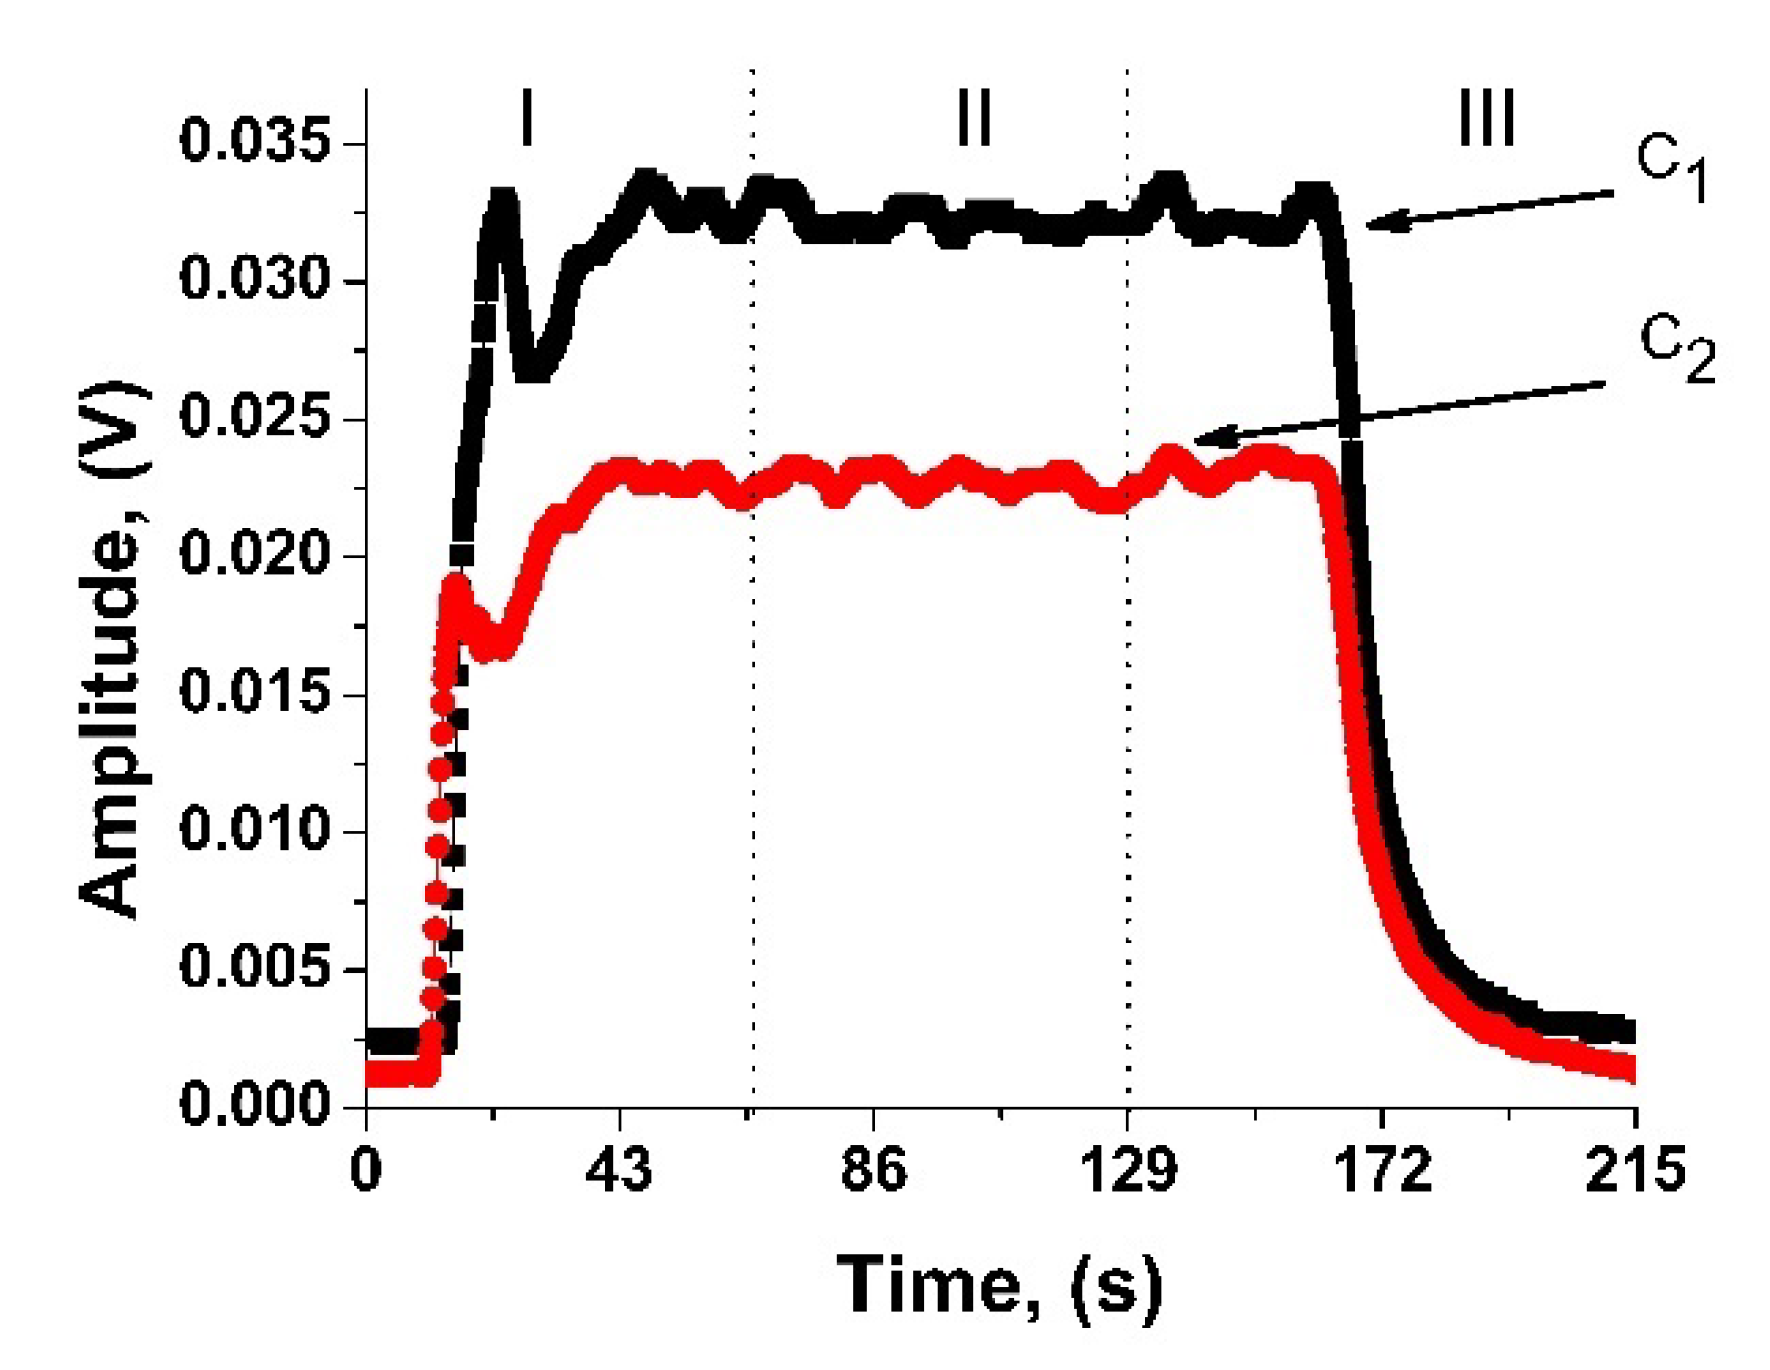
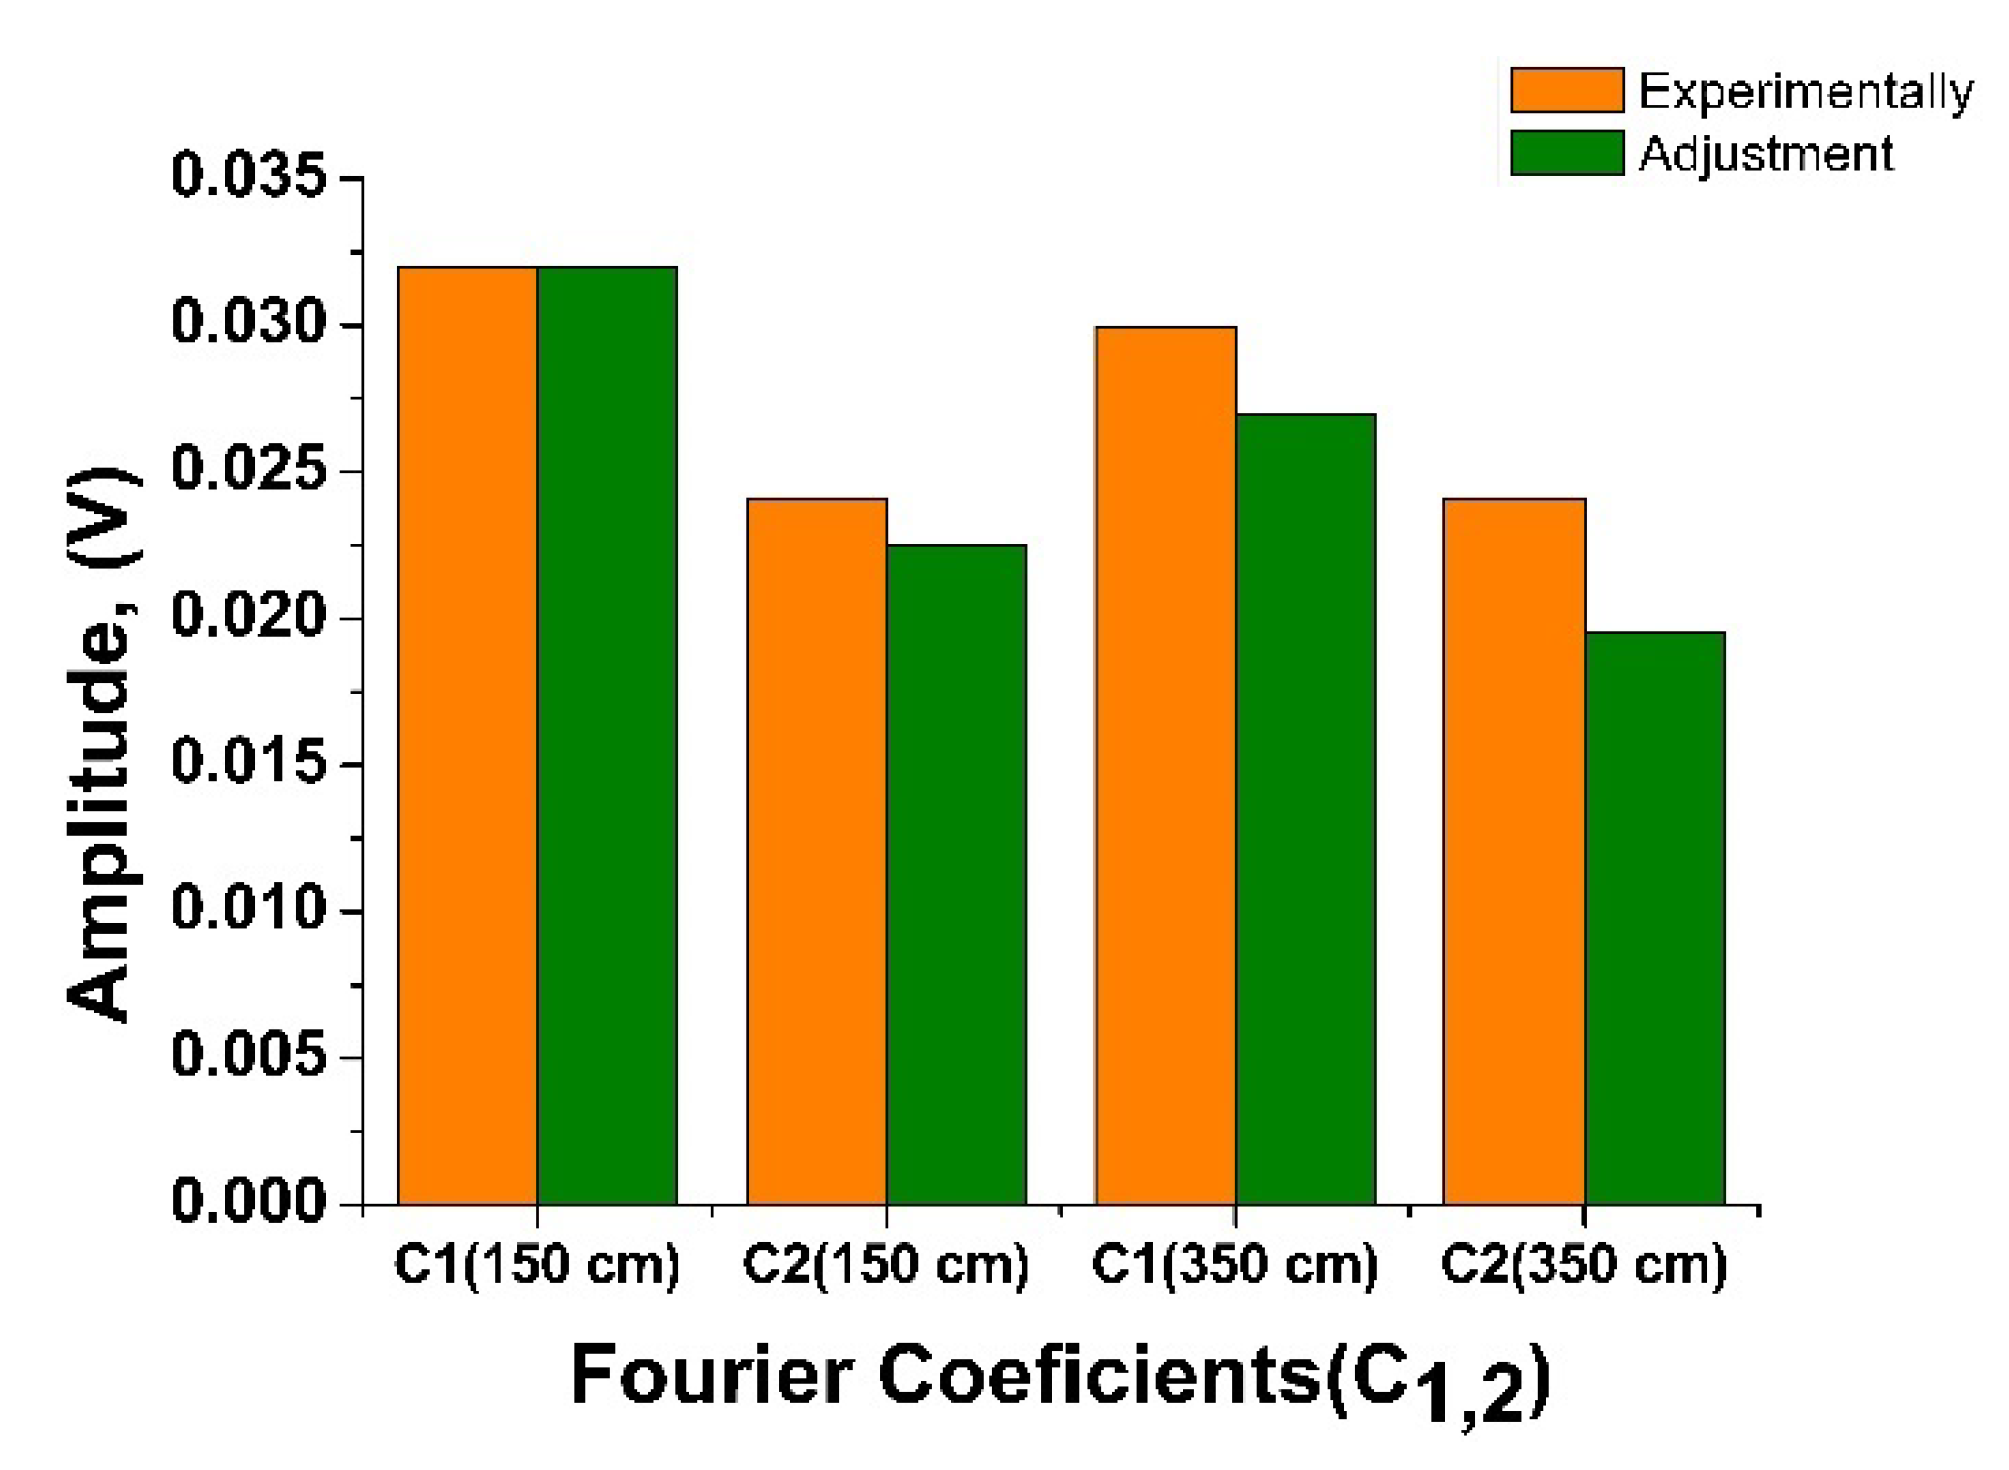
3. Results and Discussion
4. Conclusions
Author Contributions
Funding
Acknowledgments
Conflicts of Interest
References
- Kumar, G.A.; Patil, A.; Patil, R.; Park, S.; Chai, Y. A LiDAR and IMU integrated indoor navigation system for UAVs and its application in real-time pipeline classification. Sensors 2017, 17, 1268. [Google Scholar] [CrossRef] [PubMed]
- Jaboyedoff, M.; Oppikofer, T.; Abellán, A.; Derron, M.H.; Loye, A.; Metzger, R.; Pedrazzini, A. Use of LIDAR in landslide investigations: A review. Nat. Hazards 2012, 61, 5–28. [Google Scholar] [CrossRef]
- Weitkamp, C. (Ed.) Lidar: Range-Resolved Optical Remote Sensing of the Atmosphere; Springer Science & Business: Berlin/Heidelberg, Germany, 2006; Volume 102. [Google Scholar]
- Dwivedi, Y.; Rai, S.B.; Singh, J.P. Spectroscopic Techniques for Security, Forensic and Environmental Applications, Chemistry Research and Applications; Nova Science Publishers Incorporated: New York, NY, USA, 2014. [Google Scholar]
- Castrejón-García, R.; Varela, J.R.; Castrejón-Pita, J.R.; Morales, A. The laser-backscattering equations and their application to the study of the atmospheric structure. Rev. Mex. Física 2002, 48, 513–518. [Google Scholar]
- Castrejón-García, R.; Varela, J.R.; Hernández Utrera, O.; Altamirano-Robles, L. Design and development of an elastic-scattering lidar for the study of the atmospheric structure. Rev. Mex. Física 2017, 63, 49–54. [Google Scholar]
- Rairoux, P.; Schillinger, H.; Niedermeier, S.; Rodriguez, M.; Ronneberger, F.; Sauerbrey, R.; Wöste, L. Remote sensing of the atmosphere using ultrashort laser pulses. Appl. Phys. B 2000, 71, 573–580. [Google Scholar] [CrossRef]
- Kashani, A.G.; Olsen, M.J.; Parrish, C.E.; Wilson, N. A review of LIDAR radiometric processing: From ad hoc intensity correction to rigorous radiometric calibration. Sensors 2015, 15, 28099–28128. [Google Scholar] [CrossRef] [PubMed]
- Wu, S.; Liu, Z.; Liu, B. Enhancement of lidar backscatters signal-to-noise ratio using empirical mode decomposition method. Opt. Commun. 2006, 267, 137–144. [Google Scholar] [CrossRef]
- Tian, P.; Cao, X.; Liang, J.; Zhang, L.; Yi, N.; Wang, L.; Cheng, X. Improved empirical mode decomposition based denoising method for lidar signals. Opt. Commun. 2014, 325, 54–59. [Google Scholar] [CrossRef]
- Chang, J.; Zhu, L.; Li, H.; Xu, F.; Liu, B.; Yang, Z. Noise reduction in Lidar signal using correlation-based EMD combined with soft thresholding and roughness penalty. Opt. Commun. 2018, 407, 290–295. [Google Scholar] [CrossRef]
- Dávila Pintle, J.A. Fourier description of lock-in. Rev. Mex. Física E 2013, 59, 1–7. [Google Scholar]
- Lathi, B.P. Signals, Systems and Communication; John Wiley and Sons: Hoboken, NJ, USA, 1965. [Google Scholar]
- Hwei, P.H. Fourier Analysis; Simon and Shuster: New York, NY, USA, 1970. [Google Scholar]
- Meade, M.L. Lock-In Amplifiers: Principles and Applications (No. 1); Peter Peregrinus Ltd.: London, UK, 1983. [Google Scholar]


© 2020 by the authors. Licensee MDPI, Basel, Switzerland. This article is an open access article distributed under the terms and conditions of the Creative Commons Attribution (CC BY) license (http://creativecommons.org/licenses/by/4.0/).
Share and Cite
Gómez-Arista, I.; Dávila-Pintle, J.A.; Montalvo-Montalvo, N.; Rubin-Alvarado, A.A.; Bravo-García, Y.E.; Reynoso-Lara, E. Fourier Coefficients Applied to Improve Backscattered Signals in A Short-Range LIDAR System. Electronics 2020, 9, 390. https://doi.org/10.3390/electronics9030390
Gómez-Arista I, Dávila-Pintle JA, Montalvo-Montalvo N, Rubin-Alvarado AA, Bravo-García YE, Reynoso-Lara E. Fourier Coefficients Applied to Improve Backscattered Signals in A Short-Range LIDAR System. Electronics. 2020; 9(3):390. https://doi.org/10.3390/electronics9030390
Chicago/Turabian StyleGómez-Arista, Iván, José A. Dávila-Pintle, Nancy Montalvo-Montalvo, Abel A. Rubin-Alvarado, Yolanda E. Bravo-García, and Edmundo Reynoso-Lara. 2020. "Fourier Coefficients Applied to Improve Backscattered Signals in A Short-Range LIDAR System" Electronics 9, no. 3: 390. https://doi.org/10.3390/electronics9030390
APA StyleGómez-Arista, I., Dávila-Pintle, J. A., Montalvo-Montalvo, N., Rubin-Alvarado, A. A., Bravo-García, Y. E., & Reynoso-Lara, E. (2020). Fourier Coefficients Applied to Improve Backscattered Signals in A Short-Range LIDAR System. Electronics, 9(3), 390. https://doi.org/10.3390/electronics9030390