1. Introduction
Industries have been looking for efficient ways to operate, aiming to minimize the costs of production. In this context, supply chain management plays an essential part in reducing the total production value expenses. Different company types and sizes implement Just in Time (JIT) or lean production systems to reduce production costs [
1,
2]. The main idea is to implement pickups and deliveries of goods, meeting fixed time windows, taking into account both the amount of work and the optimization of stock levels [
3,
4,
5]. Logistics need to find a balance between agility, financial costs, and quality of service.
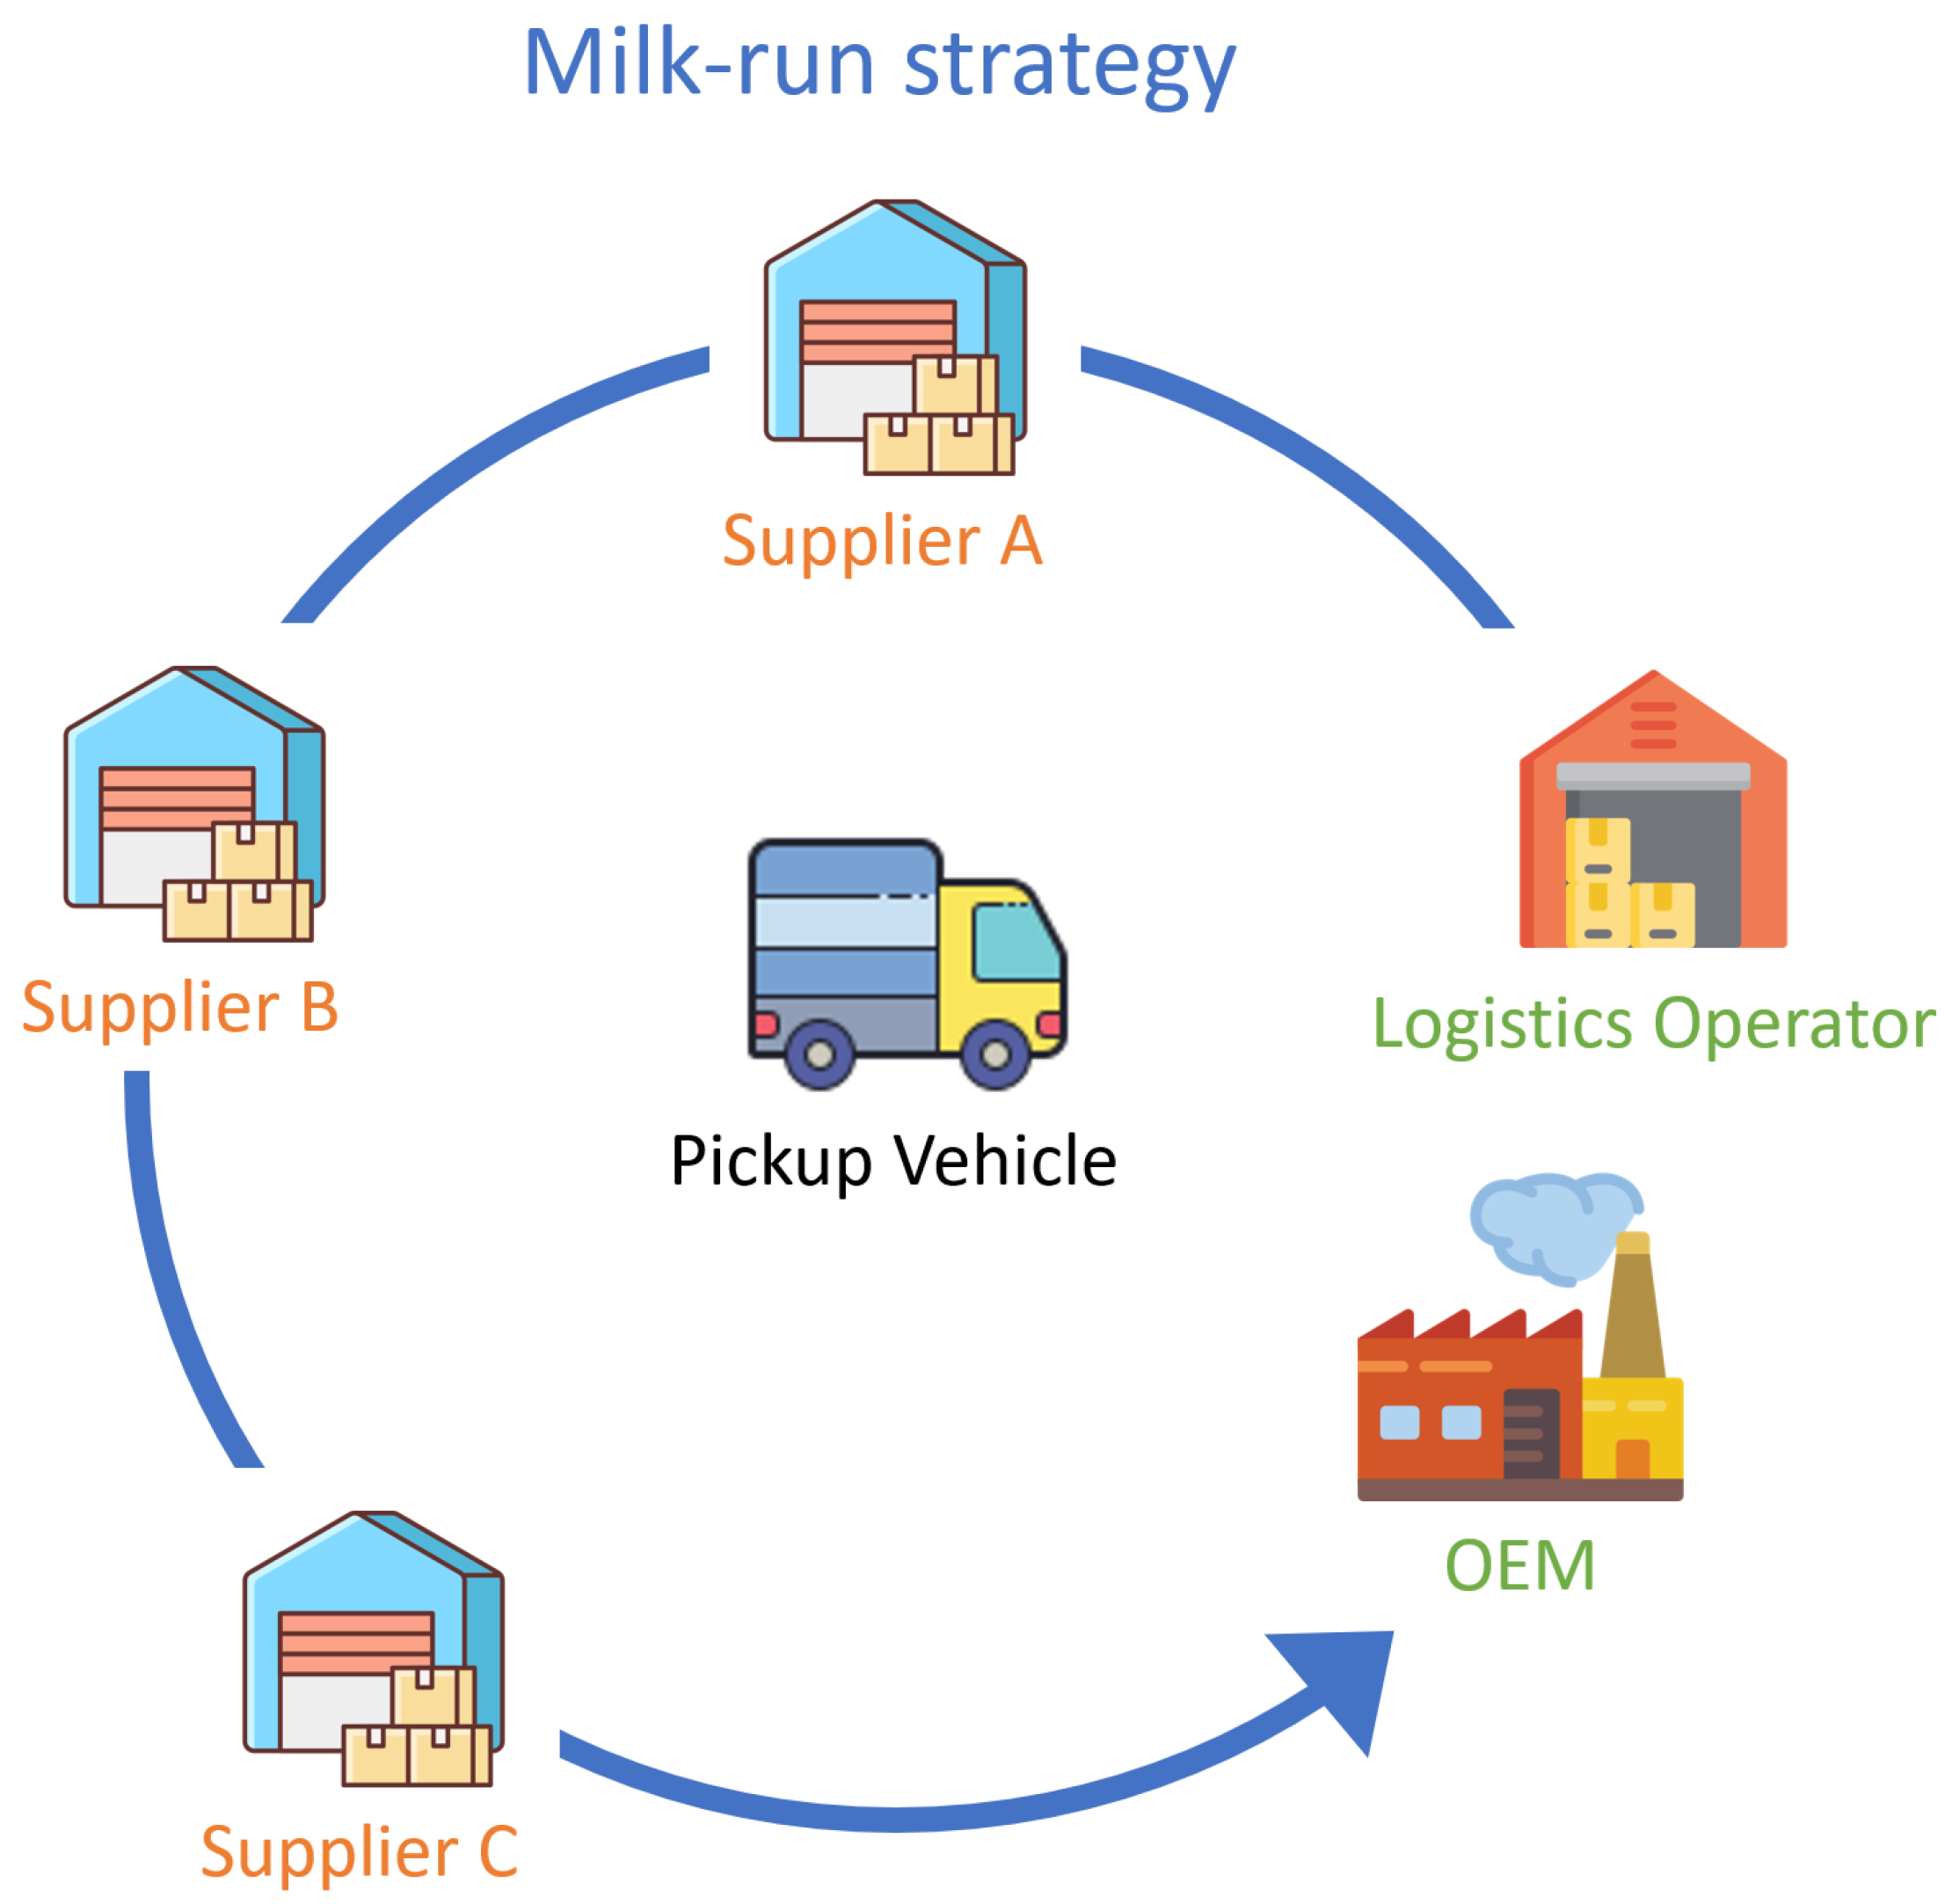
Milk-run is a logistics strategy of good collection/delivery. In this strategy, an empty vehicle goes from a logistics operator to suppliers for collecting goods following a predefined route and returning to the company that requested the service [
4,
6].
Figure 1 illustrates a Milk-run operation. This strategy affords an economical transport approach, as it allows the aggregation of small and frequent orders in a single pickup vehicle [
7].
In addition to reducing costs, this strategy provides a reduction in traffic and, consequently, in fuel consumption and gas emissions [
4,
5,
8]. Milk-run has widely been used due to the following reasons [
4]:
Reduction of warehouse spaces by small and frequent collections, and a decrease in maintenance and labor costs;
Reduction of transportation costs by aggregating orders in a single pickup vehicle;
Improvement of the production line because of a synchronization between suppliers and Original Equipment Manufacturer (OEM), and delivery with higher precision;
Enhancement of vehicle loading rates due to shortening of the total distance traveled, and cargo reduction;
Reduction of delivery of low-quality goods since the OEM company can now quickly identify a problem with the goods, inform the supplier, and minimize the production line impact
A significant reduction of OEM inventories by outsourcing the manufacturing of certain goods.
Collecting goods from different suppliers increases the operation time when compared to a direct shipment from the supplier to the OEM company [
6]. However, this issue becomes less problematic if all route participants are located in the same geographic region.
The milk-run pickup routing problem is a variation of the vehicle routing problem (VRP), where information about the location of the supplier and its collected cargo volume must be considered in the planning of the route [
4]. The VRP consists of determining
m routes. A vehicle route starts at a specific point, the pickup vehicle visits customers in a predefined sequence and returns to the starting point. Each customer must be visited once and the total cargo must not exceed the vehicle capacity. All relevant information for the planning of the routes, such as location and customer demands, and estimated service time, is assumed to be known by the planner before the routing process begins. This information does not change after the routes have been defined [
9]. The vehicle routing aim is to minimize the overall distribution costs. However, aspects such as multiple depots, different types of commodities, and time windows complicate the model to solve the VRP.
Given the variation of collection times, the total pickup time limit required by the OEM company is not always fulfilled by the operator, compromising agreements, and the OEM production line. Transporting goods from the OEM company suppliers is complicated, requiring strict logistic operation quality control for all parties [
5,
7,
8,
10]. In dynamic vehicle routing problems (DVRP), not all relevant information for the routing process is known when the planning begins, and they can change after the initial route [
9,
11]. DVRP requires solutions that work in real-time, using algorithms that meet these features.
In dynamic routing systems, customers may have their requests rejected if they are unable to be added to the initial route. This would offer the possibility for the request to be serviced in the next day. In cases where the request is urgent, the logistics operator can forward it to a competitor [
9] or send it to an auxiliary vehicle [
11]. The complexity of dynamic vehicular routing problems is directly associated with the number of requests, the customer’s geographical distribution, and the number of dynamic events to be considered.
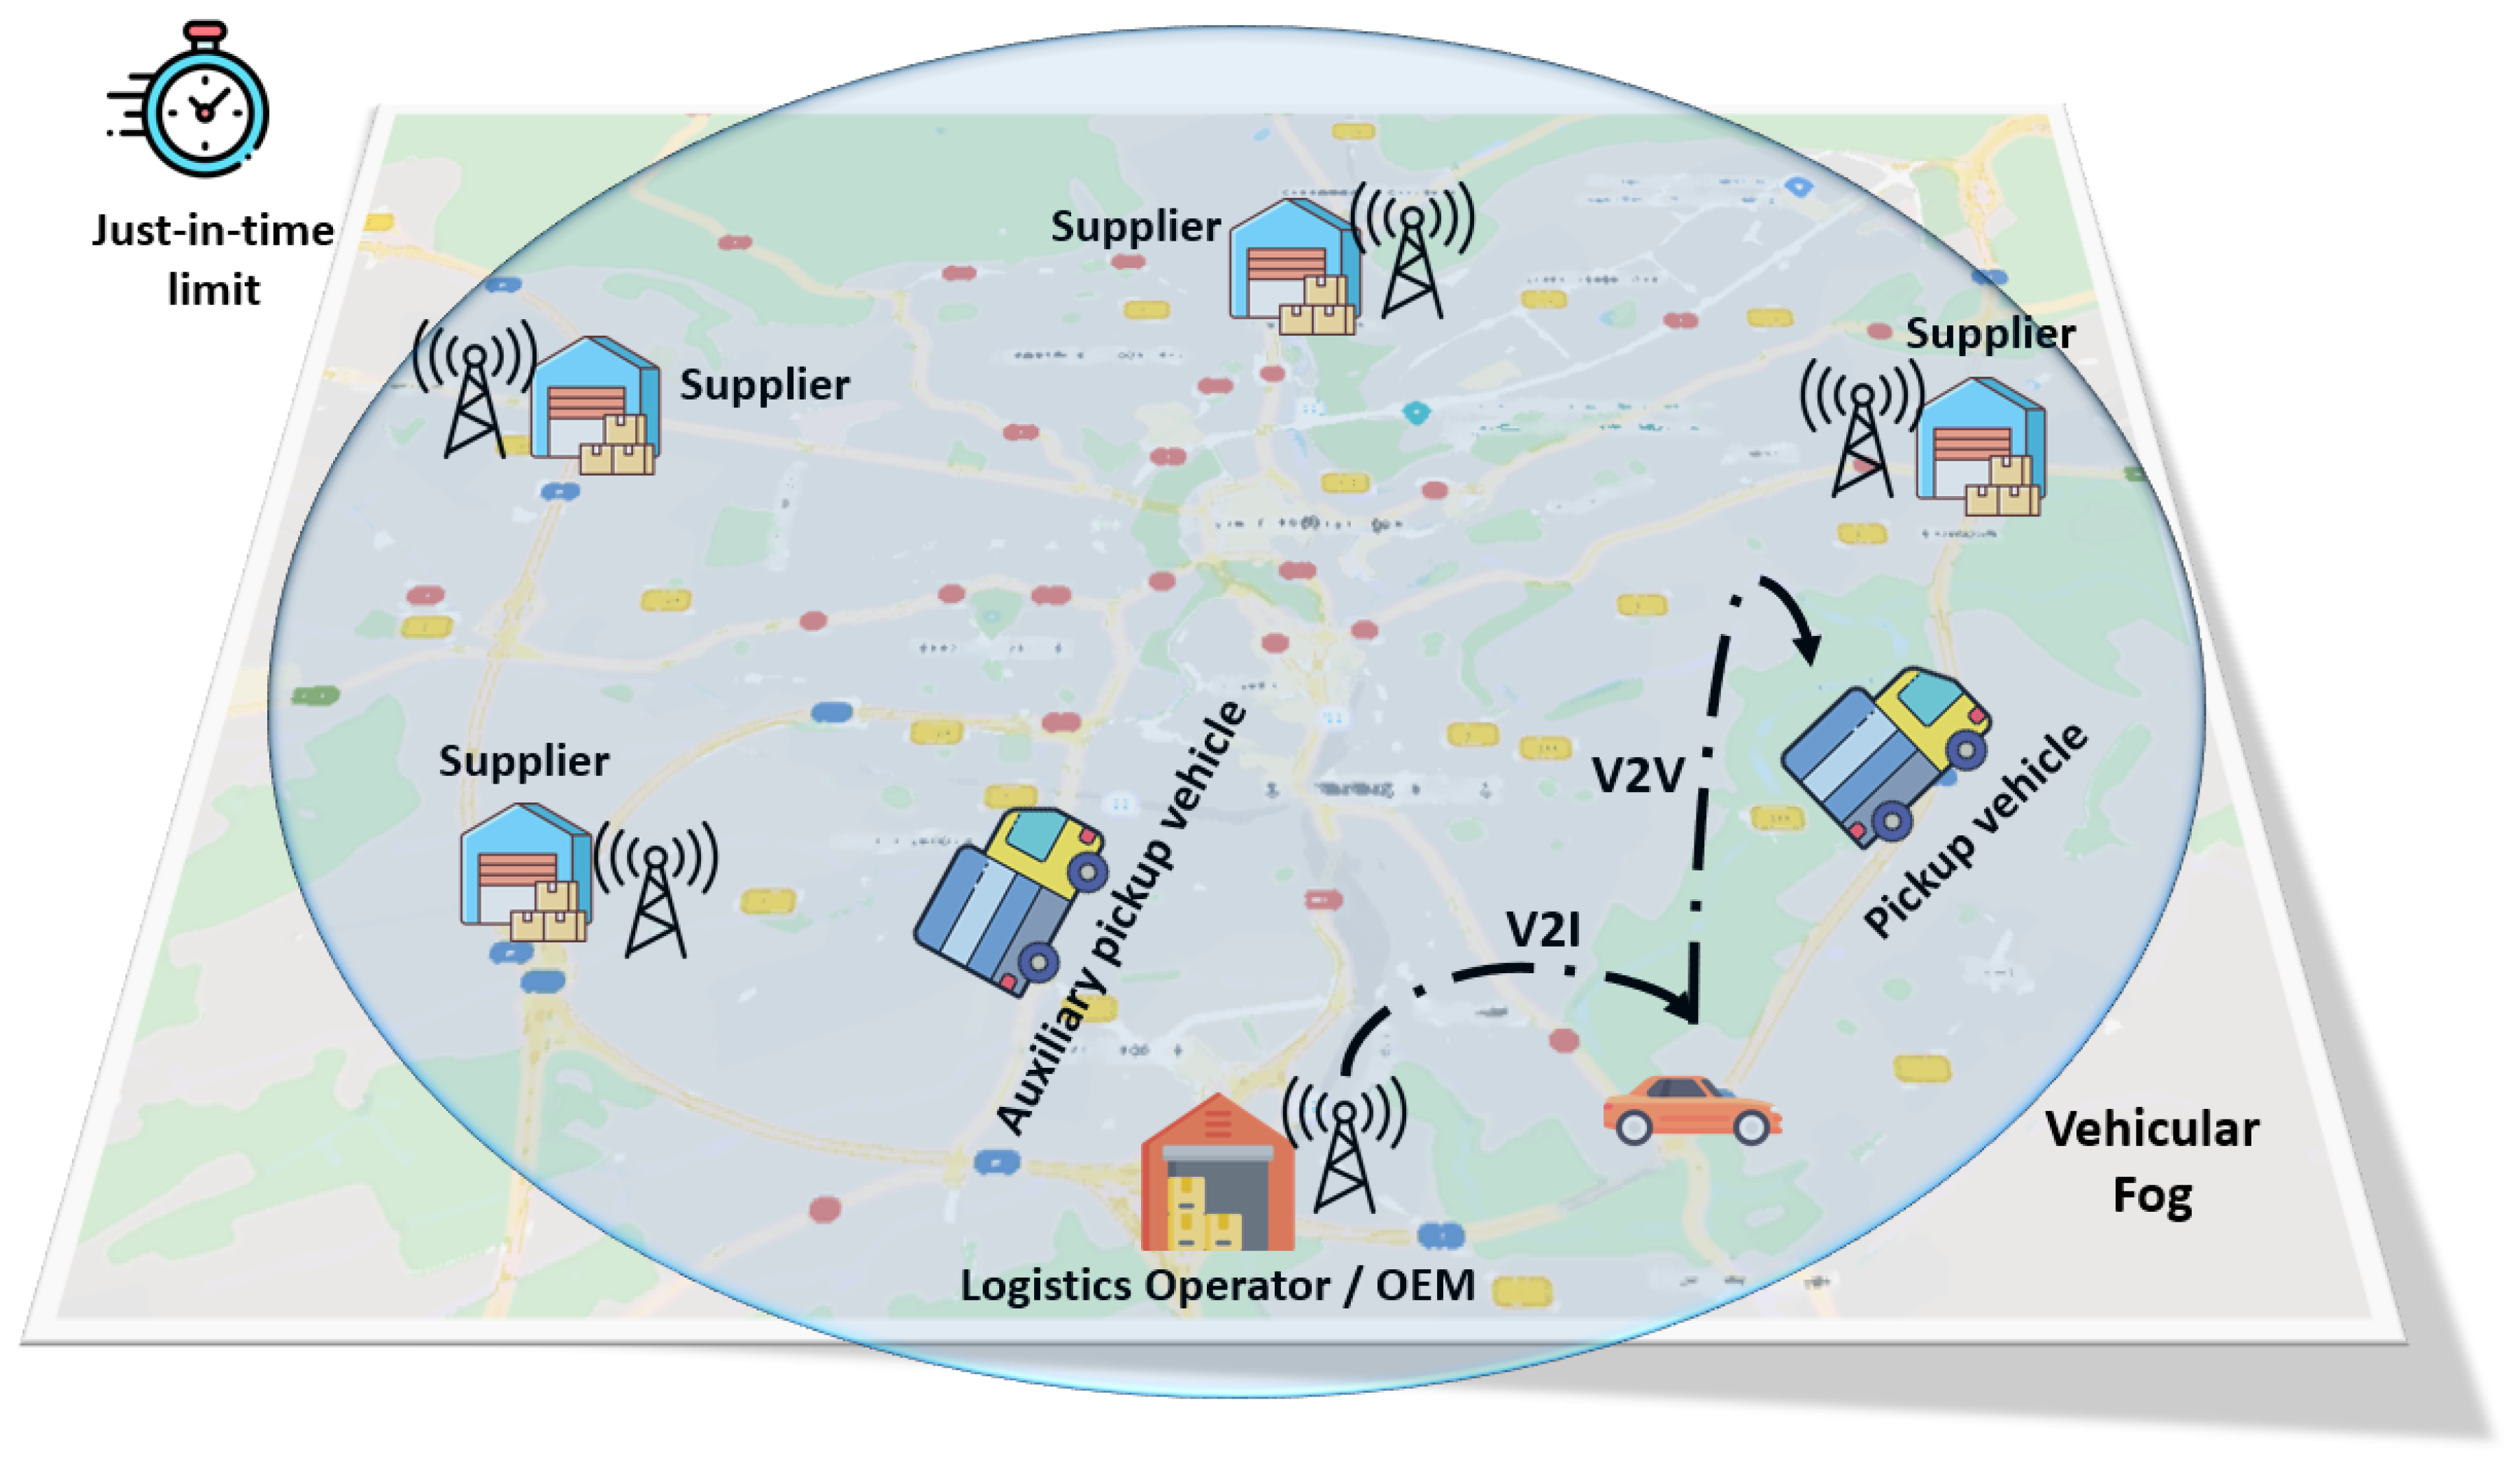
The complexity of logistics, and its importance as one of the main economic activities of the supply chain, enhance the role of information and communications technology (ICT) as a means of improving the visibility, responsiveness and efficiency levels in the supply chains that depend on transport operations [
12]. Intelligent transport systems (ITS) has become the next big transportation management initiative in Europe and other parts of the world and an important step are the vehicular networks for the realization of the ITS.
In order to maintain information updated in the routing system, a communication between vehicle and logistics operator is essential. Ideally, vehicle position must be known by the logistics operator at any given time for decision-making [
9]. The use of Vehicular Ad hoc Networks (VANETs) in ITS applications allows for efficient milk-run operations by enabling updated data in real-time management tasks. For many ITS applications, VANETs became an essential pillar because they enable vehicle to vehicle communication (V2V), as well as communication between vehicle and infrastructure (V2I) [
13,
14,
15]. In a vehicular network, there is no central coordinator for communication. Although some applications use roadside units (RSUs), these applications are expected to work with reliability using decentralized communication. The adoption of VANETs generates deployment and setup costs, but, after installation, it will help to improve shared resources and reduce the transportation and logistics costs [
16].
In VANETs, the nodes do not need to get authorization to enter the network and send messages, and they can disconnect at any moment [
17,
18]. This type of communication allows vehicles to share different types of information, as safety for accident prevention, post-accidents messages, or traffic jams [
14,
17]. Dynamic network topology based on vehicle mobility and the impact of radio propagation on the environment is another challenge [
17]. The vehicular networks must work appropriately in a range of conditions, including sparse and dense vehicle traffic. The use of VANETs in logistics scenarios was previously studied by [
12,
19,
20]; however, in these works, milk-run operations were not addressed as the main focus.
Some vehicular applications require communication between vehicles located in a specific geographical area or location. If there is a traffic jam or an accident, all vehicles around the event should be warned. For the vehicles moving away from this area, this information is not relevant. For these types of applications, GeoNetworking is an adequate choice [
21]. GeoNetworking protocols are composed of a set of features that use vehicle geographical information for ad-hoc communication. The messages are directly forwarded without the need to know the network topology [
21,
22,
23].
Fog computing paradigm can meet several requirements for the proper functioning of VANETs, by shifting the cloud computing servers to the edge of the network. Fog computing implements an intermediary layer that provides support for geographic data distribution and low latency in communication and processing [
24], and offers computing, storage, and communication services between end nodes and the cloud [
25,
26]. These characteristics drove the trend towards integration of fog computing with VANETs to develop new ITSs. This paper focuses on this trend to investigate the vehicle routing problem in milk-run operations.
This paper presents a new approach to solve the dynamic vehicle routing problem using VANETs and fog computing. Our proposed solution, called Dynamic Milk-Run Vehicle Routing Solution (DMRVR), is based on an integrated V2V and V2I vehicular network architecture and uses a dynamic routing algorithm to build pickup routes. Supplier delay messages are sent in the vehicular network, so the dynamic routing algorithm can make the changes along the pickup routes when necessary. When a pickup vehicle perceives a route delay due to congested traffic flow, it might change the pickup route to satisfy the agreement. This paper’s major contribution is a solution where every decision is made by using the supports of a VANET architecture that includes vehicular fogs, without using Internet services. This paper is an extended version of our previous work [
27]. This work adds a new mechanism to provide reliable message exchanges in case of communication failure. Additionally, the solution evaluation was improved, considering new experiment scenarios and metrics. We also compared our simulation findings with the solution proposed in [
10].
This paper is organized as follows.
Section 2 summarizes and compares a set of related works with the proposed solution.
Section 3 gives a detailed description of DMRVR. An assessment of the DMRVR by simulation is described in
Section 4, through different performance metrics for the dynamic vehicle routing efficiency. It also analyzes the performance of vehicular network with different vehicle density. Finally,
Section 5 concludes the paper and discusses future works.
2. Related Work
Presently, it is common practice for the OEM supply chain setting [
28] of leading industries to acquire components from suppliers and assemble them into final products for the end costumers. Electronic equipment producers, such as computers and automobile industries, are typical OEM examples. In accordance, stakeholders are forced to replace the traditional receiving, inspecting, and storage pattern by commit-to-delivery JIT business agreements [
29]. To deal with this challenge in the evolving industry framework, all participants must develop integrated production and transport scheduling strategies to reduce adverse tardiness effects when supplying the main OEM production line [
10,
30].
Associated with the OEM production process, logistics operators usually adopt the milk-run scheme to collect components and parts from suppliers and transport them, over planned routes, to the company production line. Trucks are dispatched at specified periods, visiting a number of suppliers to collect components or sub-products [
4,
11,
31] and take them to the production line.
The objective of this research is to analyze a milk-run routing strategy integrated with the supplier’s production scheduling. This strategy seeks to minimize tardiness levels when delivering parts, and components to the OEM production line, under a commit-to-delivery JIT framework [
10,
32].
It is common to have interruptions in OEM production processes that affect production performance. They include machine breakdowns, demand fluctuations, reorder problems, set-up interruptions, unexpected urgent orders, etc., along with traffic delays and disruptions in the transportation network. It is crucial to appropriately handle such interruptions in a flexible manufacturing system to optimize overall operational performance. When an unforeseen disruption occurs, the scheduling is modified to maintain established efficiency levels or to improve performance if possible. Such action will permit the company to cope with uncertainties in the productive process and thereby anticipate corrective measures to avoid disruptions in the system. In practice, the development of predictable schedules for systems with uncertainties is usually tricky. To the logistics agents, who collect and transport OEM components from the supplier’s premises to the main company, it is vital to have a reliable order release delay forecast to marshal their activities.
Vehicle routing problems have a vast range of research, and one of its aspects is the studies that involve intermodal issues. Ref. [
33] focuses on finding the best route for shipments through an international intermodal network. The problem is formulated as a multi-objective multimodal flow problem with time windows, being an NP-hard problem. The authors [
34] present a framework to support decisions for intermodal transport networks combining the advantages of simulation and optimization methods. It considered a dynamic and stochastic environment in intermodal transport, offering solutions that minimize costs and reduce the negative impact of transportation activities. In [
35], the authors investigate a routing problem considering flexible delivery time windows and demand/capacity uncertainty in a road-rail intermodal transport system. This study aims to minimize the total costs generated in the intermodal road and rail transport activities, revealing the effects of demand imprecision and routing optimization capacity. Ref. [
36] presents a multi-objective routing model for managing the transportation of hazardous materials in a multimodal road-rail network. Routing optimization uses diffuse smooth time windows to optimize delivery, improving the quality of the transport service. As these are works with proposals to solve intermodal problems, the complexities involved are more significant than that of the present work. Another critical factor to consider is that none use vehicular networks to monitor loads’ displacement, not making real-time changes to the routes.
A good part of the integrated production and distribution scheduling models presented in the literature includes vehicle routing problems, which are concerned with the optimal route design to be assigned to a fleet of vehicles to perform a set of tasks (pickup, delivery, servicing, etc.). Due to the continuing developments in telecommunication, computing, and information technologies, dynamic vehicle routing and scheduling problems have received special research attention in the past years [
37]. Refs. [
38,
39,
40,
41] consider more general VRP problems. More specifically, Refs. [
10,
11] consider VRP associated with scheduling vehicle problems in milk-run settings. One important point to consider in the solution of dynamic scheduling and routing problems, apart from the mathematical modeling itself, is to define real-time control policies and procedures, starting with the analysis of current disruptions such as machine breakdowns, material shortages, job cancellation, change in job priority, traffic delays, etc. [
42], and followed by the establishment of corrective solutions in a dynamic way [
43].
We selected eight related works [
5,
10,
11,
12,
19,
20,
44,
45] focusing on VANETs in logistics and milk-run operations, which are discussed in this section.
In [
12], the authors analyzed the use of wireless vehicular networks to support the needs of multi-modal logistics in ports. The evaluation serves to test the practicability of an ITS that supports real data traffic. The solution uses dedicated short-range communications (DSRC) based wireless vehicular networks in a V2I architecture. The network coverage is approximately 1000 m, composed of four access points connected by an IP network and a central server. The vehicles used to transport goods within the seaport terminal represent the mobile nodes. The authors analyzed four scenarios, assuming that vehicles were moving at a maximum of 30 mph, and the loading and unloading cycle time was 20 min. In the most complicated scenario, the maximum communication delay was 2.7 s. For the authors, this indicates that the use of wireless vehicular networks in multimodal logistics solutions could be appropriate. Although the authors measured a low communication delay, they did not demonstrate that V2V communication could enhance the solution’s effectiveness.
M-DVRP [
19] describes a solution for a multi-objective dynamic vehicle routing problem that uses vehicular networks (802.11p communication protocol). The authors used a time seed-based solution using particle swarm optimization (TS-PSO) to split the problem into smaller routing problems. Five variables for modeling the problem were defined: geographical position of orders, customers, service time, the expected time for attendance, and level of customer satisfaction. NS-2 and SUMO simulators were used for the M-DVRP evaluation and compared the particle swarm optimization efficiency against the genetic algorithm (GA). The comparison demonstrated that TS-PSO optimizes the identified problem’s multi-objective function better than GA, using a smaller amount of vehicles. It is essential to highlight that the authors do not consider any delay due to traffic jams or customer problems. Moreover, the simulation did not assess the vehicular network performance.
Another solution [
11] examined the dynamic vehicle designation to perform milk-run operation pickups in an area subjected to traffic jams. The routing solution consists of a pickup vehicle fleet composed of the main and auxiliary vehicles. The latter is activated when the main vehicles cannot perform their pickups due to traffic congestions caused by accidents, heavy storms, etc. The solution regularly verifies if the vehicle is behind schedule. In case of delays, the solution transfers part of the tasks from the main to the auxiliary vehicle. The results showed that the dynamic formulation considerably improved the general service level compared with the static version. One restriction of this formulation was the assumption of a relatively significant number of supplier locations typical in product delivery cases but not typically encountered in OEM collecting milk-run systems. The only tardiness variable analyzed in the paper was related to all components’ total delivery time at the OEM assembling line. Delays observed in the collecting process, at each supplier location, were indirectly considered as random variables. The same happened with delays in vehicle displacements over the routing network. As this solution has no vehicle communication technology, it only verifies if the vehicle is behind schedule when they arrive at the supplier. The vehicle can also not change the current route when it is stuck in a traffic jam, damaging the route performance. The evaluation did not use road traffic mobility simulators.
A smart logistics vehicle management system in [
20] collects information (vehicle condition, current location, speed, goods characteristics) from different sources, analyzes them, and makes decisions. This solution comprises three modules: (a) data collection module using sensors and RFID tags; (b) communication module responsible for sending data to the control center; (c) computation module that uses big data techniques to analyze data. For text data, 2 g technology is used, and, for audio and video streaming, 3 g and 4 g should be used. The authors only described the system and its features but did not implement the solution. Data transmission (2 g, 3 g, and 4 g) can generate additional costs for the vehicle owner.
Guner et al. [
5] proposed a dynamic vehicle routing solution for milk-run operations with time windows considering traffic jams. The Michigan ITS Center supplied real traffic data from freeways and highways in the Detroit metropolitan area. The solution uses the Gaussian Mixture Model (GMM) and Markov Decision Process (MDP) to model the recurrent congestion based on historical ITS traffic data. The pickup routes are created based on travel time, avoiding usually congested streets and highways. The application has one distribution center and four suppliers’ sites. The evaluation compared the dynamic solution to a static solution, where routes were created only considering the fastest travel time. Although Ref. [
5] has close similarities with the present work, it does not consider the time spent by the vehicle when collecting cargo at the supplier’s premises, considering only the vehicle travel times along the arcs of the route. However, in our work, we assume all the added times to form the total time up to delivering the components at the OEM, due to the diverse random nature of the variables and the specific objectives of this research. Additionally, this solution does not use any vehicular communication.
The authors in [
10] proposed a vehicle routing scheme to perform an OEM milk-run pickup service that considers supplier production line delays. The pickup vehicles have a predefined pickup route created by a Simulated Annealing (SA) algorithm. The solution performs the entire pickup operation within a time window determined by the OEM. The solution calculates delay probability at the supplier once the pickup vehicle arrives. The vehicle waits for a predefined time, and, after that, if the delay continues, it heads to the next supplier, and an auxiliary pickup vehicle is sent in its place. The delay is only verified while the vehicle is at the supplier, forcing it to stay there, at least for the predefined time.
A route guidance application that uses data analysis is proposed by [
44]. Real-time traffic data are acquired by RSUs and sent to a Traffic Command Center (TCC), which can calculate the optimal route for a vehicle. RSUs located on each road section measures the traffic flow by the received Cooperative Awareness Messages (CAMs) from the vehicles and send the flow information to the TCC using LTE. A car sends a request to the TCC to get the shortest route to its destination. The TCC calculates the shortest path using the density information and the density history at that time of the day as well. The results obtained from the simulation demonstrated that, to get the best route, it is necessary to use the density information stored in a database at the TCC. Despite considering traffic jams, the route is calculated once and it is not changed during the displacement. The RSUs send information from the TCC using LTE, which can be relatively costly in a big city scenario.
The authors in [
45] proposed an efficient parallel genetic algorithm for the vehicle routing problem. The proposed parallelism is based on multi-core Central Processing Units and many-core Graphics Processing Units. It tries to compare the two processors’ power in parallelizing genetic algorithms. The authors propose using the solution in a vehicular cloud computing (VCC) environment, where a vehicle acts as a leader. Through the Internet, the leader communicates with the traffic management that must execute the proposed solution using the information received, resulting in the ideal routing for the entire road network in the city. Despite presenting the use of VCC, the authors do not simulate the vehicular network.
Table 1 compares the related works’ features. The use of VANETs in logistics scenarios is recent. Five works used some vehicular communication but without using milk-run operation approaches. Three of them used the 802.11p protocol, one used mobile telecommunication networks, and the other one proposed VCC use. None of them are based on fog computing. The other three milk run presented solutions did not use any vehicular communication.
Six of these works used different vehicle routing algorithms to plan the routes. Ref. [
11] used a genetic algorithm with 3-opt optimization to create the pickup route. Ref. [
19] used a time seed-based solution using particle swarm optimization to split the problem into smaller dynamic vehicle routing problems. The Ref. [
5] approach considers travel time, avoiding congested highways, and Ref. [
10] used a SA to create a pickup route. Finally, Ref. [
44] did not specify the used algorithm, and Ref. [
45] used a parallel genetic algorithm.
Considering milk-run operations, Refs. [
5,
10,
11] presented solutions that use dynamic vehicular routing to change routes during displacement. However, in these works, the changes can only occur when the vehicle is at the supplier, not allowing modifications during the tour. These modifications would only be possible if these solutions used a vehicular network. Six works used simulation environments for their evaluation. Nevertheless, only one used a network simulator bidirectionally coupled with an urban mobility simulator aiming to make the most realistic simulations.
Our proposed solution (DMRVR) stands out from the related works because it uses a fog-based vehicular network in a milk-run operation to provide dynamic vehicle routing. DMRVR features will be presented in the next section and are included in the last line of
Table 1 3. DMRVR Solution
An OEM company, its orders, its suppliers, a logistics operator, and its pickup vehicles are the elements that composed a Milk-run operation. The OEM company requires that the route’s total operation time to deliver/pick up the goods is performed within a Just-in-Time (JIT) limit. Problems with the supplier production line or traffic jam delays can occur during the route, causing tardiness. In this case, the logistics operator will send auxiliary vehicles to cover the pickup locations removed from the initial route. The process is over when the last pickup vehicle drops the products at the OEM company. The treatment of supplier’s manufacturing delays [
46], together with the delays generated by adverse traffic conditions and by road disturbances (road maintenance, accidents, external effects such as weather conditions, etc.), must be treated in accordance with a decision process, formalized through appropriate algorithms to be discussed next.
3.1. Uninterrupted Milk-Run Cycle
This situation is observed when the vehicle is able to perform, in a tour, the complete milk-run cycle, collecting all the components from the various suppliers and delivering them to the central OEM company in due time.
The vehicle starts at the OEM premise to load the empty containers into the truck used to transport the components. It takes minutes to perform this action. Next, the vehicle travels towards supplier 1. Along the way, it spends a time , which includes effective vehicle travel, delays on the route, bypasses, etc., to supplier 1. At supplier 1, the vehicle may be subjected to a tardiness time , due to manufacturing problems. The loading time at supplier 1 is . All variables are random. This process continues tentatively performing the planned visits until the last supplier n.
When the last supplier n is served, the vehicle travels to the OEM facility, spending a time . The unloading time at the OEM is .
Suppose the vehicle is at supplier
k. The stochastic regeneration point (i.e., the transition stage) of the truck evolution process is assumed to be the instant when the vehicle has finished the collecting task at supplier
k and is ready to depart to the next supplier
. The accomplished cycle time up to this stage
k is:
where
is the historical vehicle elapsed time up to the regeneration stage
k. Hence,
is a deterministic variable because it represents the sum of times that effectively have occurred.
From stage
k on, one deals with variable expectation times, here represented generally by
. Adding up all the feature times from stage
k, to the delivery of components at the OEM company, one has:
where
is the expected cycle time from stage
k up to final delivering components to the OEM production line. In fact, Equation (
1) deals with real observed variable values, whereas (
2) represents projected values. It is assumed that variables
,
,
,
and
are statistically independent, and
n is sufficiently large. Then,
can be approximated by a normal distribution (due to the central limit theorem of Statistics). Thus, adding up the variances of the variables in (
2), one gets
. Let
, which is the total cycle time. Let
be the limiting time imposed by the OEM to receive the components from the logistics operator at the assembling line.
The effective available time, at stage
k, to accomplish the complete routing cycle, collecting components from the
remaining suppliers, is
, with
, since
and
are deterministic variables. Letting
and
, one has
. Let
the probability that
, as follows:
and let
be the acceptable upper limit for probability
, or, in other words, the OEM company requires from the suppliers and the logistics operator that
. Then, three situations may occur:
The milk-run process is at stage k, with : then, the vehicle is allowed to advance to the next client , for collecting components without any restriction;
The milk-run process is at stage k, with : then, it is necessary to alleviate some collecting visits from the vehicle, in order to reduce the value of , and searching for a solution such that . When this alleviation process is accomplished, the vehicle resumes its collecting visits along the milk-run route, collecting components from the remaining suppliers in the list. The backlog collecting tasks will be performed by one or more auxiliary vehicle(s);
The milk-run process is at stage n (i.e., the vehicle has just arrived at the OEM production line), but , and then . It means that, even trying to respect the OEM time limit by transferring collecting tasks to an auxiliary vehicle, the established time has been nevertheless surpassed. This situation leads to diverse problems for the OEM company—for instance, levying suppliers and/or the logistics operator with penalties, maintaining an inventory of components to cope with eventual backlogs, selecting additional suppliers, etc. This is a situation to be avoided to a maximum.
3.2. Interrupted Milk-Run Cycle at Stage k
This situation is observed when it results at a general stage k of the routing. Hence, this visiting pattern is not feasible. Thus, at this stage k, the system investigates the possibility of reducing the number of collecting visits in the milk-run. Accordingly, the system transfers one or more non-serviced visits to an auxiliary vehicle until getting a solution with .
If
, when
assumes a large value due to unexpected traffic conditions, the model will remove backwards the last remaining suppliers from the route, one by one, until it gets to
. On the other hand, when the delay
at the supplier
i is too large, leading to
, the supplier
i will be removed from the route. In both situations, an auxiliary vehicle will be assigned to perform the collection of components from the removed suppliers. Although this operational scheme might not be optimal to define changes in the basic vehicle routing, our solution adopted an approximate formulation due to the computational limitations of the simulation modeling. In a further research effort, the authors intend to improve the model considering more robust inserting and removing task alternatives, in the route resetting, as in [
47], for example.
3.3. Overall Tardiness
For a generic OEM milk-run, when the system gets to state
upon delivering the components at the central OEM industry, the historical overall milk-run discrete-time is:
Thus, the effective tardiness value for the milk-run under analysis is given by:
The objective of the routing model is to investigate the best OEM milk-run configuration that leads to a minimal expected tardiness value over a given period of operational time. The main problem variables are: (a) the number of supplier’s collecting visits in the route, their locations, and operating characteristics, (b) the basic visiting sequence; (c) the times along the route; (d) the cargo volume and values for each supplier; (e) production tardiness data for each supplier; (f) traffic characteristics and delays.
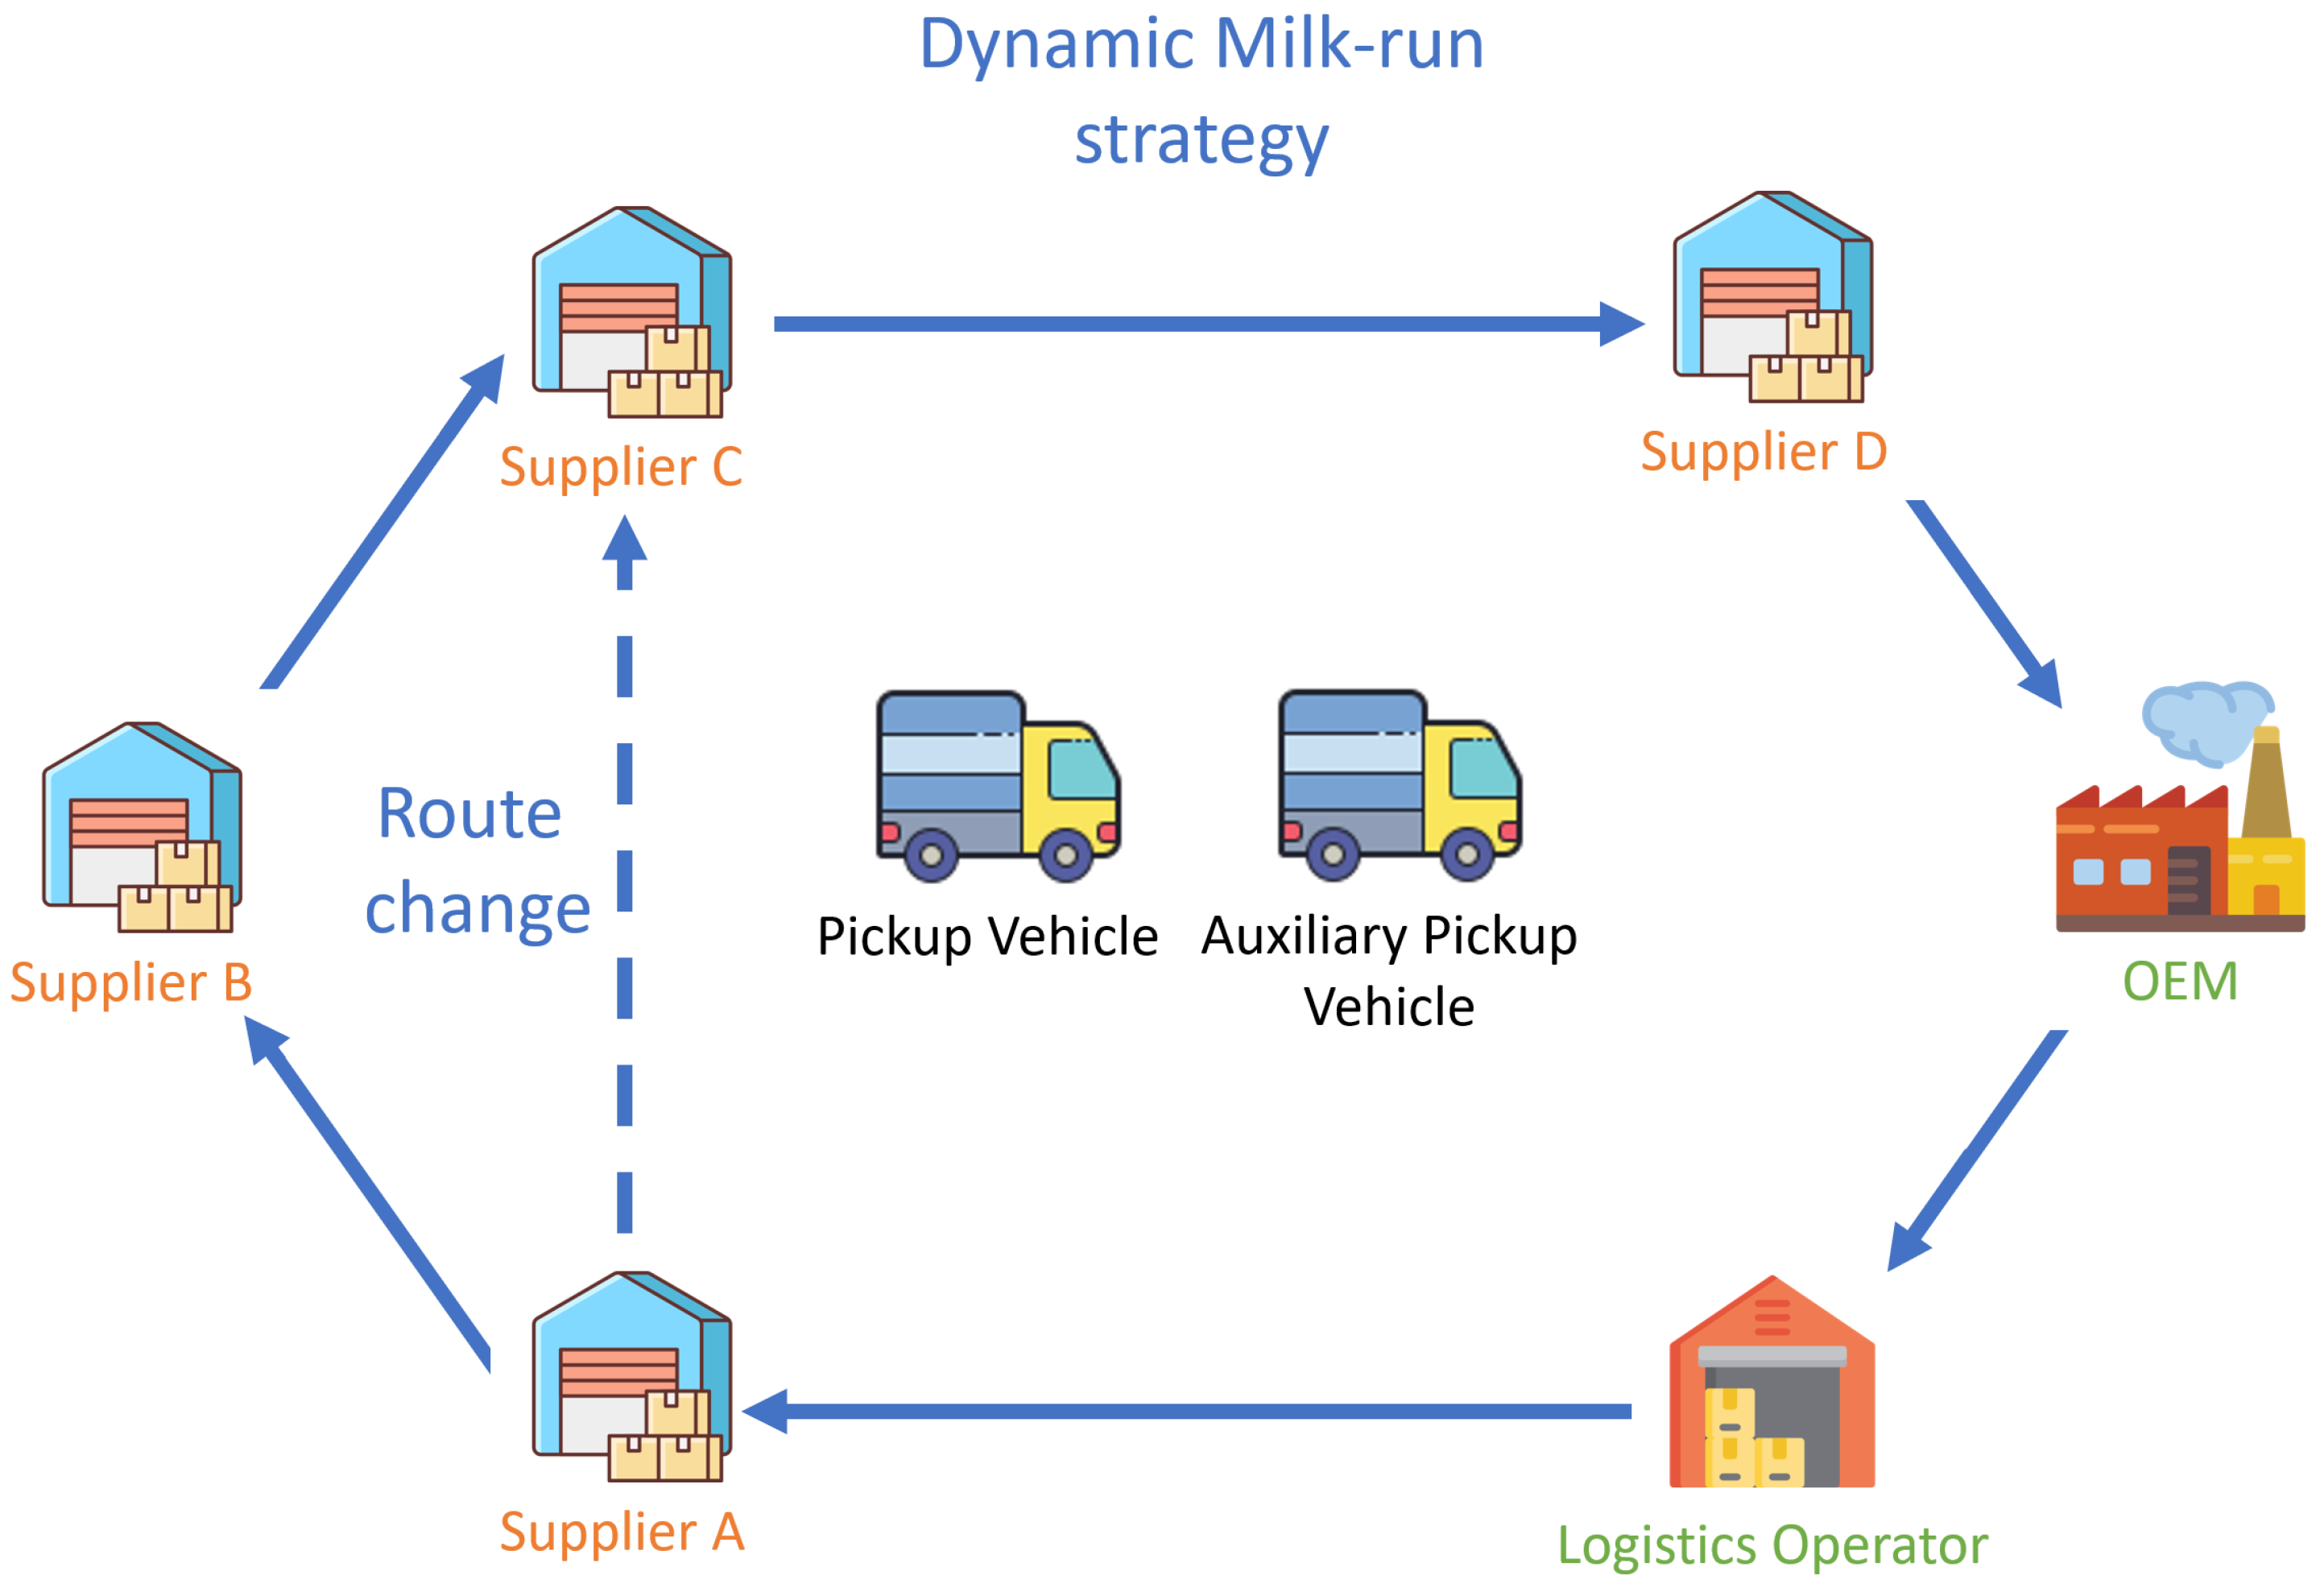
Figure 2 illustrates a Dynamic Milk-run operation.
3.4. Solution Modeling
DMRVR is composed of the
LogisticsService and the
VehicleService applications. The
LogisticsService, at the logistics operator, is responsible for (1) managing the pickup vehicle routes, (2) for coordinating messages to the pickup vehicles, and (3) for activating the auxiliary pickup vehicle.
VehicleService, an embedded application in the pickup vehicle, is in charge of (1) tracking delays during the course and (2) for receiving
LogisticsService notifications about delays from the suppliers. Once a delay is identified, the
VehicleService application performs dynamic routing to comply with the total pickup time limit (JIT limit) demanded by the OEM company. Different from
Section 3.1 stochastic regeneration point, where the pickup vehicle must be at the supplier, in DMRVR, the regeneration point is calculated by the
VehicleService during the vehicle routing course, except when he is loading or unloading the goods, or waiting in line for attendance.
3.5. Vehicular Network Model
The two main features in GeoNetworking are addressing and routing/forwarding. Due to special requirements for information dissemination, GeoNetworking uses a slightly modified approach for addressing compared to most modern networks. The target receivers of a data packet may be specified by the following addressing schemes:
GeoUnicast: is a scheme similar to the common unicast. The unique node identifier and the node geographic position are used to route the packet towards the destination. If the location of the destination is not known by the original node, this information is acquired by the location service [
21,
22];
Topological Broadcast: this scheme addresses all nodes that can be reached with most
n hops. The process is similar to common broadcast, with the addition of a distance control feature for the dissemination [
21,
22].
GeoAnycast and GeoBroadcast: these schemes address at least one or all nodes inside a specified destination area, respectively. The destination area is defined and provided by the upper network layer of the sender that makes the request [
21,
22,
48].
The routing and forwarding operations may have different characteristics, depending on the type of addressing scheme, which demand specific algorithms. Routing protocols are one of the principal elements of vehicular networks, and they allow message routing in different conditions [
49]. The line forwarding process is used at different moments by GeoUnicast, GeoBroadcast, and GeoAnycast addressing schemes. In GeoUnicast, the packet must be forwarded to the destination node location. In GeoBroadcast and GeoAnycast, if the sender node is not in the destination area, the line forwarding is used to route the packet until it reaches the destination area. Once the packet reaches the destination area, GeoBroadcast can use different flooding algorithms [
21,
22,
48,
50].
Line forwarding can use two basic approaches [
21]: Greedy Forwarding (GF) and Contention-Based Forwarding (CBF). In greedy forwarding, the next hop is selected explicitly by the current forwarder (sender-based approach). In contention-based forwarding, the selection is made implicitly among all candidate nodes through a decentralized coordination function (receiver-based approach). To improve the GeoBroadcast flooding efficiency, CBF can also be used.
The proposed solution relies on a hybrid vehicular network architecture, where V2V and V2I communications take place. RSUs are placed at the logistics operator, at the suppliers, and at some strategic locations. They offer higher communication coverage and intermediary nodes for the message dissemination protocol.
Figure 3 illustrates the DMRVR solution. For communication technology, DMRVR adopts ETSI ITS-G5 and the IEEE 802.11p standards. The logistics operator and pickup vehicles perform the solution by acting as fog nodes. The other vehicles on the road and RSUs are considered fog relays. Without using the Internet, the
LogisticsService application sends messages to the
VehicleService through the IEEE 802.11p network.
Unicast protocols are unsuitable for reliable communication because of the head of line blocking problem in vehicular networks. This problem occurs when a node sends messages to an unavailable node in the network [
51]. The use of a topologically-scoped broadcast protocol also does not meet the proposed solution requirements because the amount of hops is set when the message is sent. The message may not reach the destination node. Thus, this protocol is more used in applications where the number of hops is small.
Due to the issues mentioned above, the DMRVR solution applies the message dissemination GeoBroadcast protocol defined by ETSI ITS-G5 [
22,
48,
50]. This protocol broadcasts messages to a targeted area. Only the destination nodes (pickup vehicles) can understand the message. When the node that sent the message is not located in the target area, the protocol uses line forwarding routing based on greedy forwarding. The current node identifies which neighbor node is closest to the target area, and selects the relay node. The approach’s advantages are fewer hops and more efficient use of the communication channel. Whenever the sending node is located in the target area, DMRVR uses a contention-based forwarding routing algorithm.
3.6. Initial Route Calculation
DMRVR adopts a scheme similar to [
11], where the pickup vehicle route is optimized with a 3-optimal tour (3-opt) algorithm [
52]. DMRVR uses GA to calculate the initial pickup route, where a chromosome represents the supplier’s route. The fitness function, used to evaluate the route, minimizes the pickup vehicle’s total distance traveled. It considers the distances between the logistics operator and the suppliers, as well as the distance to return to the OEM company. Equation (
6) gives this function:
where
q is the number of pickup locations;
is the vehicle displacement time from the logistics operator to the first supplier;
is the sum of the displacement between a
j supplier until its successor
; and
is the return time to the OEM company.
The GA evolutionary process adopts the crossover and the mutation genetic operator. For the crossover operation, our solution applies a cycle crossover (CX). DMRVR adopts a simple random permutation of two elements of the chromosome for the mutation. Once the GA process is completed, the solution sorts the new population through the fitness function and executes the 3-OPT algorithm. The GA process was defined with an initial population of 10 chromosomes, a mutation rate of 15%, and 50 replications. The optimal route converged to a minimum distance of 21.75 km in all cases.
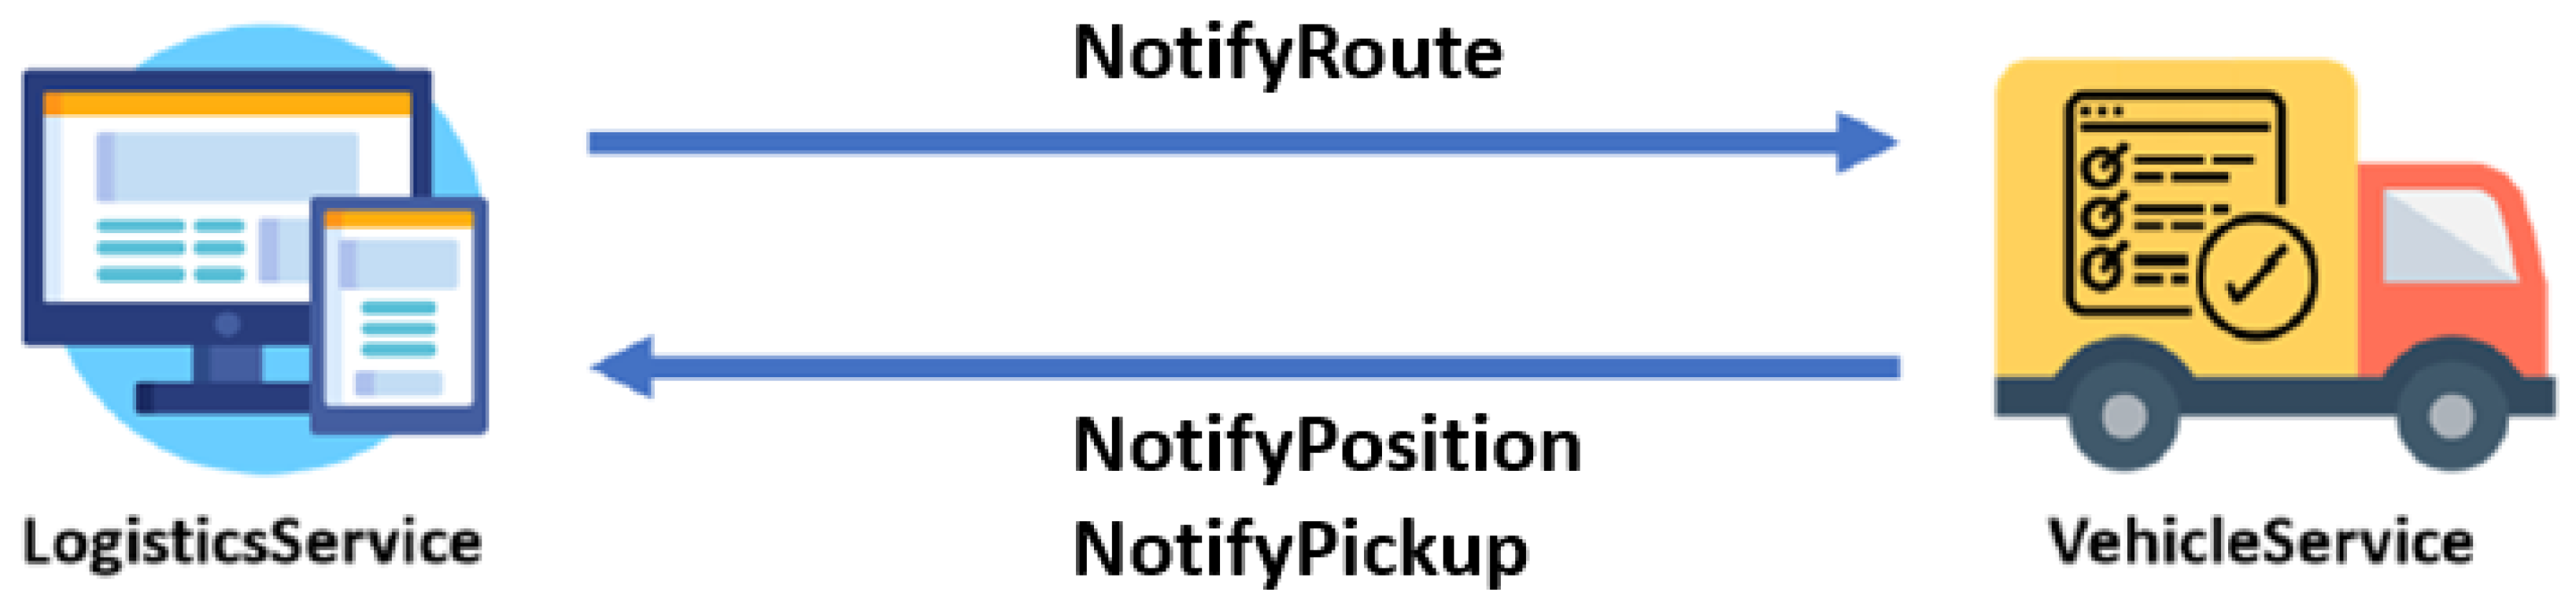
Once the initial pickup route is defined,
LogisticsService sends a
NotifyRoute message to the vehicles using the vehicular network. After the pickup of goods by the vehicle, the
VehicleService application sends a
NotifyPickup message to the
LogisticsService. The
VehicleService sends a
NotifyPosition message to the
LogisticsService app to inform its geographic position every 30 s.
Figure 4 shows the messages exchanged between the operator and the vehicles during a normal route.
3.7. Traffic Jam Treatment
The
VehicleService application makes decisions based on events generated by their background processes and received messages from the
LogisticsService application through the vehicular network. A pickup vehicle begins its route after receiving a
NotifyRoute message from the operator. A delay management (DM) process, part of the
VehicleService application, starts automatically when a pickup or auxiliary vehicle begins its route. DM process runs in the background to identify if the vehicle is behind in schedule due to traffic jams. When the required time to finish the course is higher than a specified JIT limit, the DM process recognizes a delay. The DM process calculates the vehicle’s displacement time to each supplier based on the vehicle’s geographic position and the Euclidean distance for each supplier. If the
VehicleService application identifies a delay, it may remove one or more suppliers from the route so that the vehicle attends the JIT limit. If a supplier needs to be removed, the
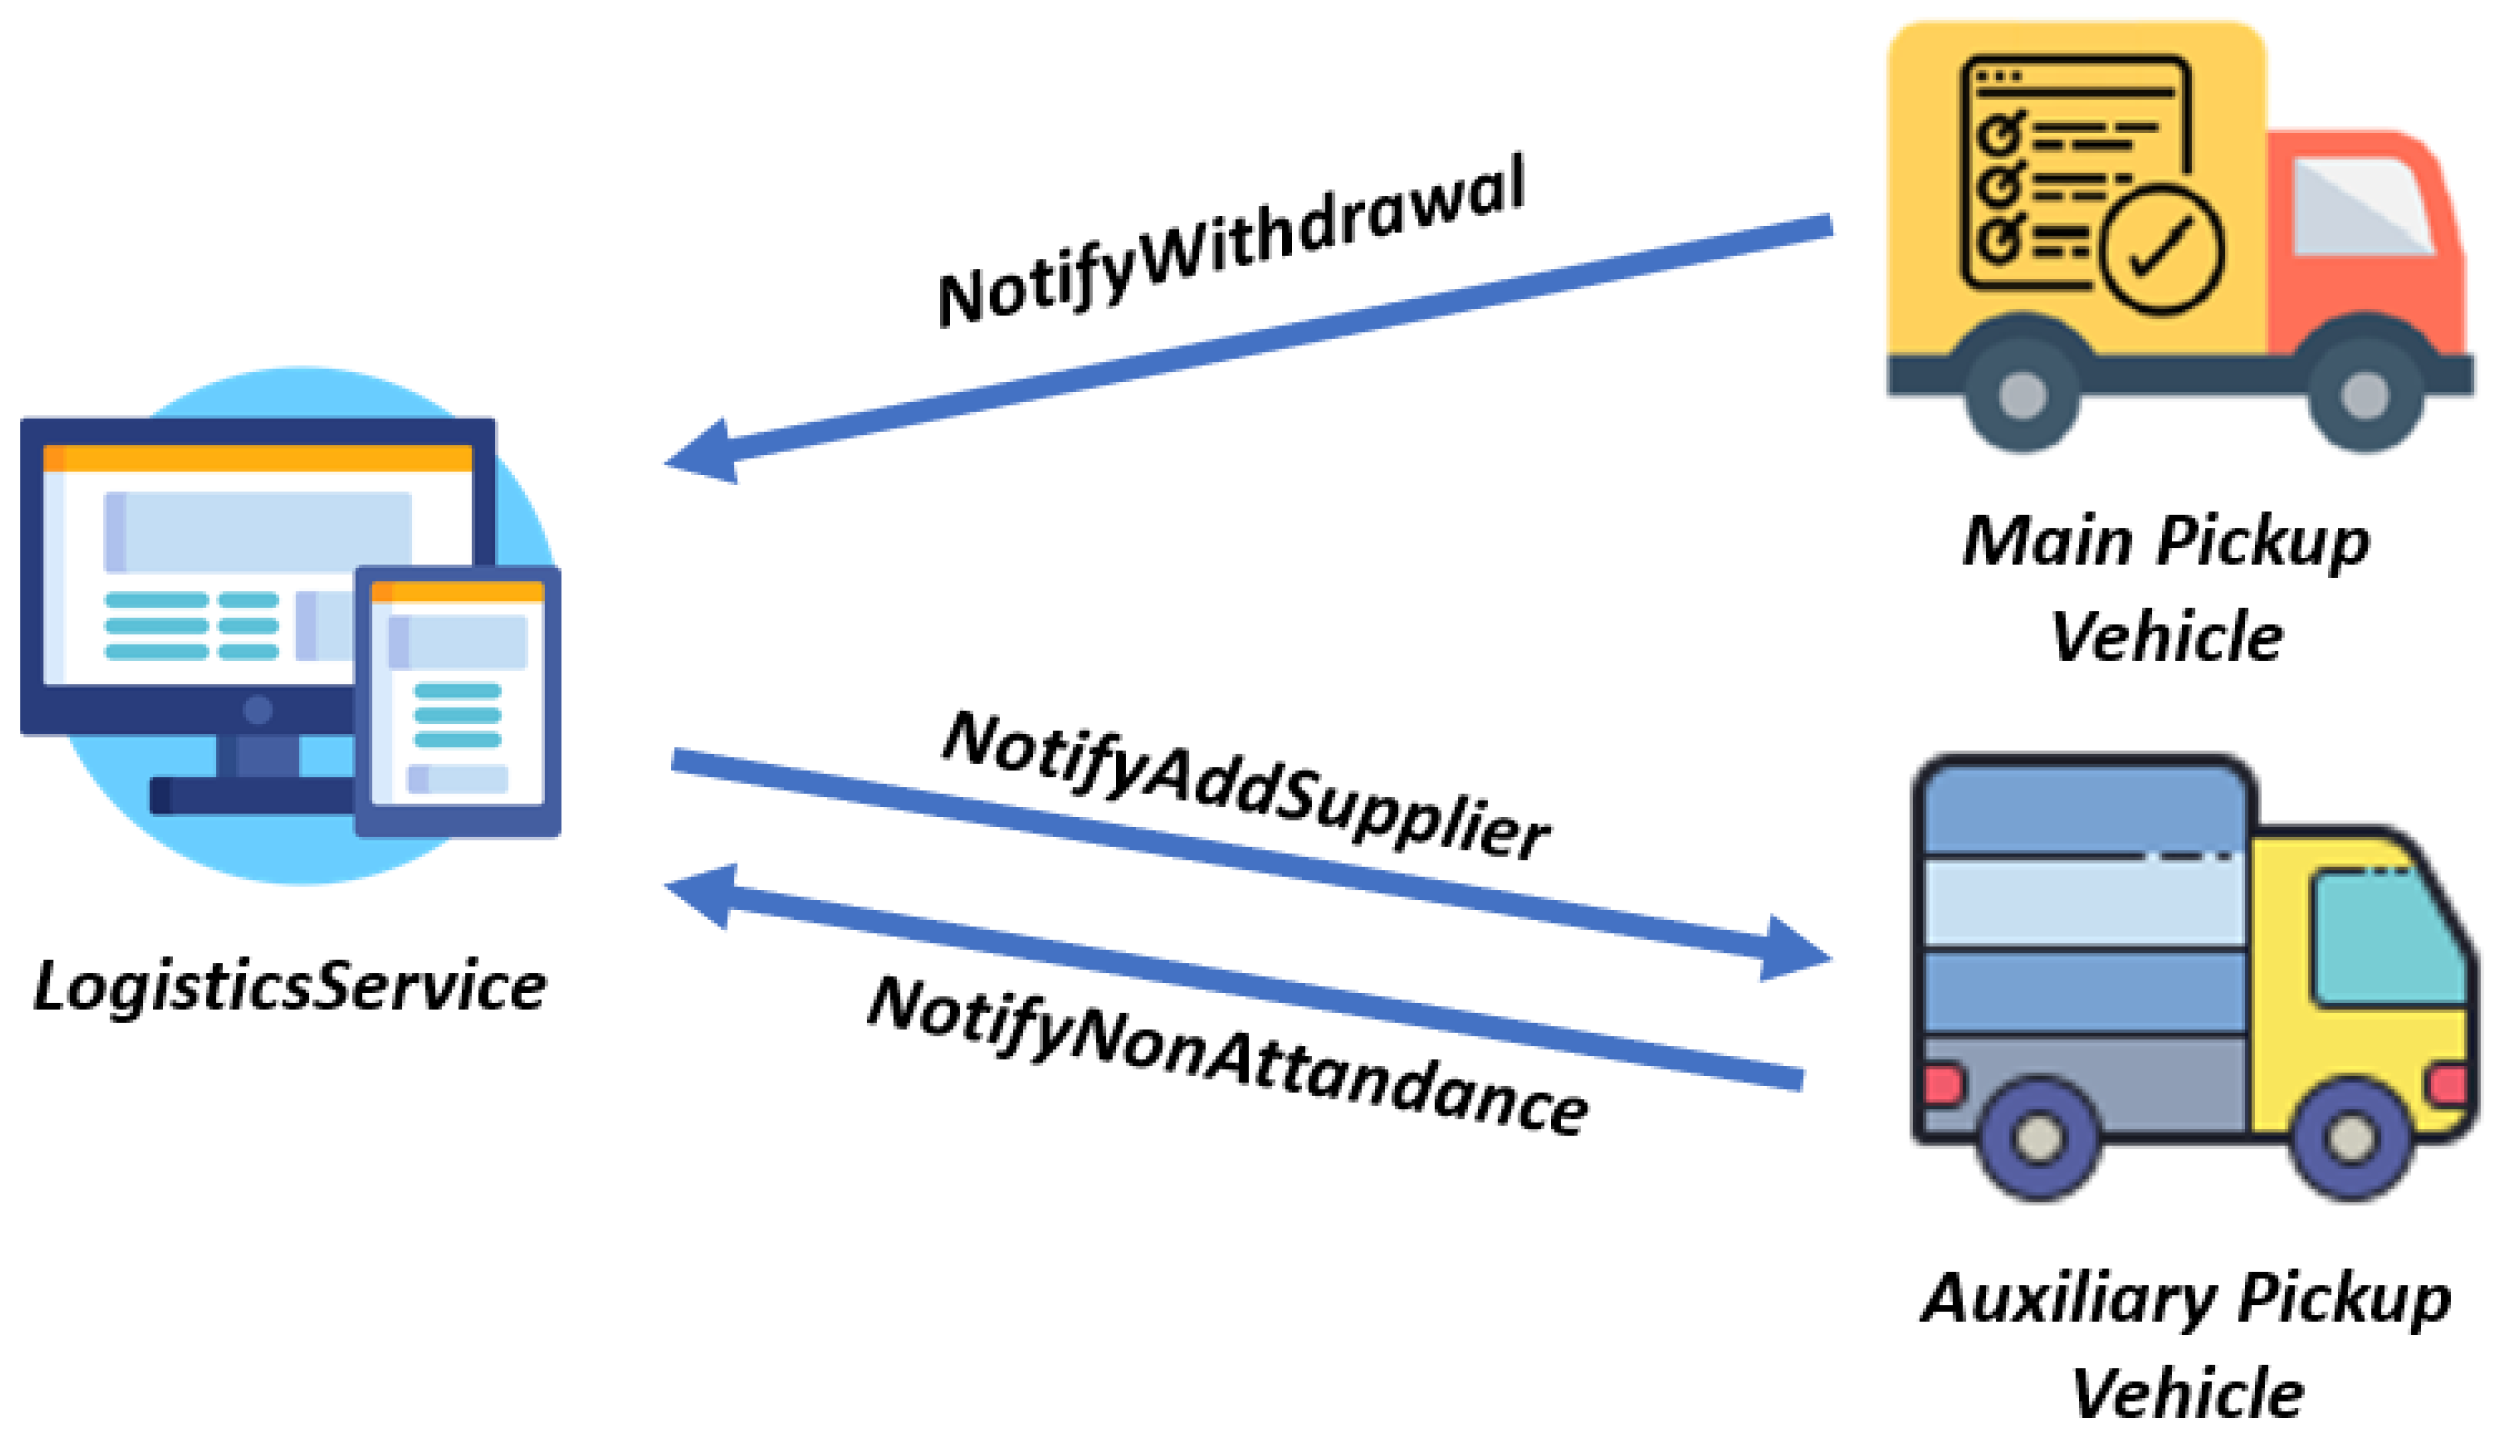
VehicleService will send a
NotifyWithdrawal message to the
LogistcsService and will change the vehicle route. Algorithm 1 shows the working process of the delay management (DM).
| Algorithm 1: Delay management (DM) process |
 |
When the
LogisticsService application receives a
NotifyWithdrawal message from
VehicleService, it triggers an auxiliary pickup vehicle by sending a
NotifyAddSupplier message. This last message informs that the
VehicleService application installed in the auxiliary vehicle must add one or more pickups to its route. Before changing the route, the
VehicleService always checks if it is possible to attend the suppliers within its total pickup time limit. When a pickup is possible, the
VehicleService application sends a
NotifyPickup message back to the
LogisticsService. On the other hand, when a new pickup can not be completed by the auxiliary vehicle, the
VehicleService sends a
NotifyNonAttendance message to the logistics operator.
Figure 5 shows the messages exchanged between the
LogisticsService and the
VehicleService applications when the auxiliary vehicle cannot perform the pickup.
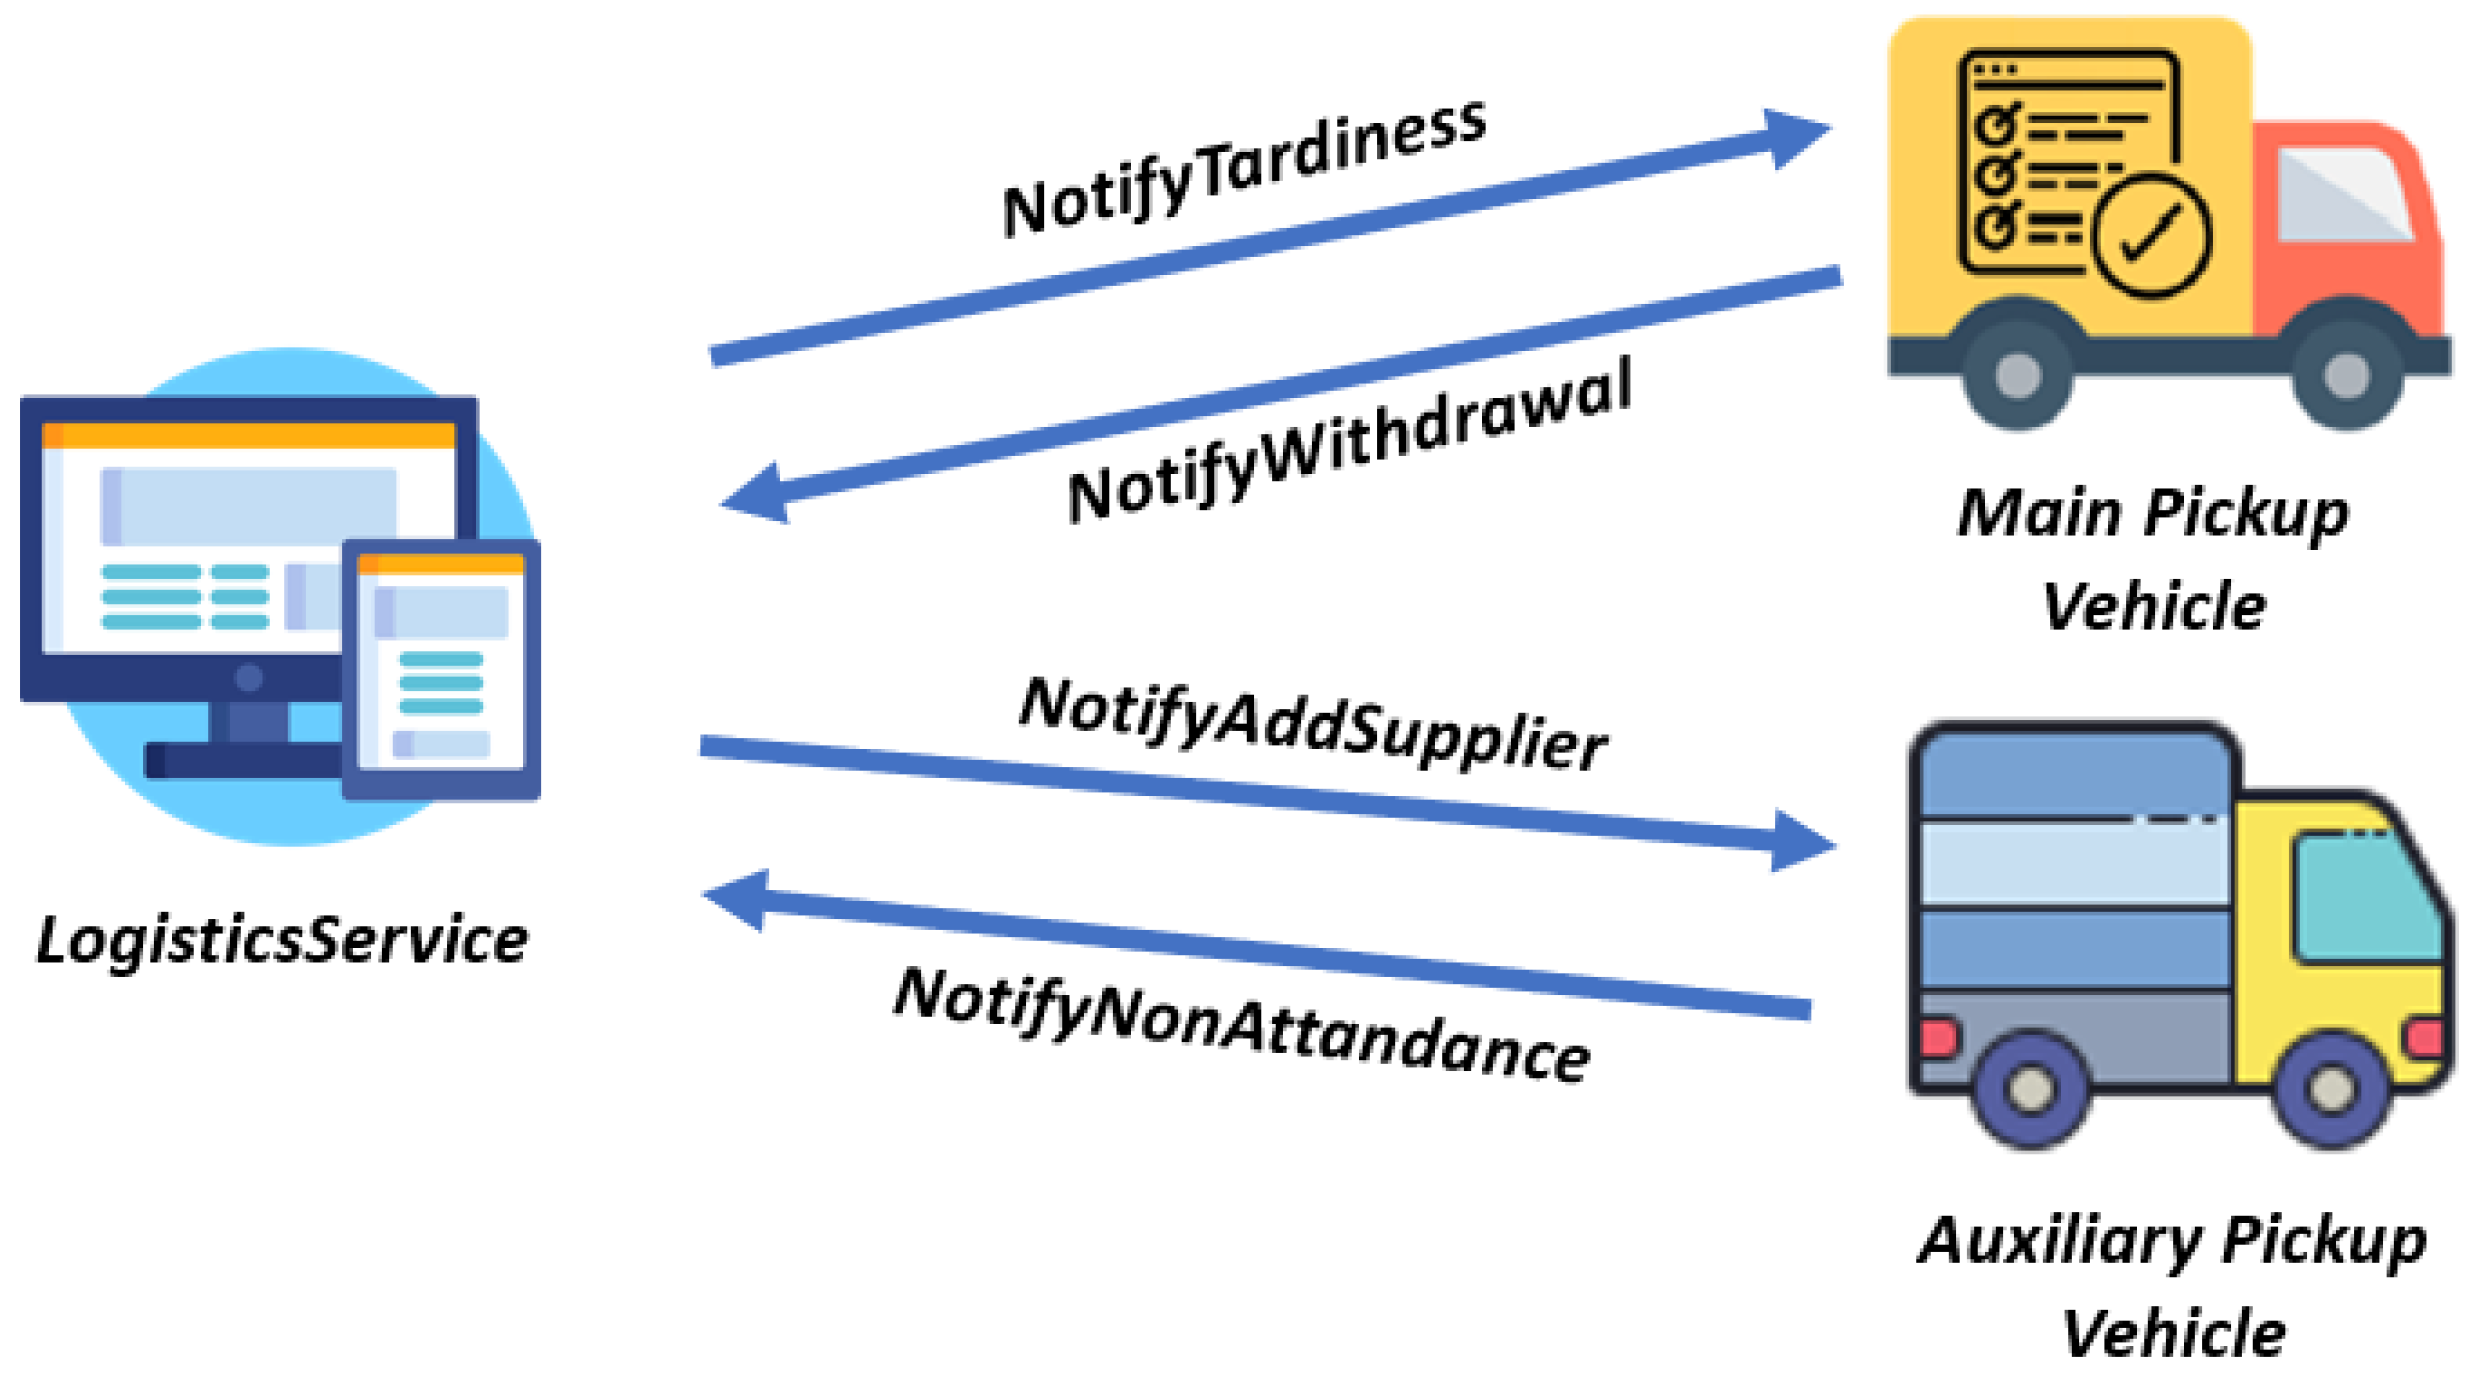
3.8. Supplier Production Line Delay Treatment
The LogisticsService application is responsible for receiving and managing the messages from the VehicleService application, which is performed by auxiliary and pickup vehicles. When the LogisticsService gets a notification from the supplier that tardiness occurs, it verifies if the delay is more significant than the delay limit defined in the LogisticsService. If it happens, the application sends a NotifyTardiness message to the main vehicle, indicating the supplier delay, and a NotifyAddSupplier message to the auxiliary pickup vehicle, so it takes over this pickup.
Algorithm 2 shows how
VehicleService examines the supplier delay. When a
NotifyTardiness message is received by the main pickup vehicle, the
VehicleService verifies if the supplier lateness
is higher than a
delay limit. If it is higher, the
VehicleService takes out this supplier from the route. When the delay is lower,
VehicleService evaluates if the tardiness will damage the total route time. If the new total time is higher than the JIT limit, the
VehicleService takes out the supplier from the route and sends the
NotifyWithdrawal to the logistics operator.
| Algorithm 2: Supplier tardiness analyses |
 |
When the
LogisticsService application receives a
NotifyWithdrawal message from
VehicleService, the handling of the message is the same as explained above.
Figure 6 illustrates the messages exchanged between the
LogisticsService and
VehicleService when a supplier production line delay is identified.
3.9. Composition of DMRVR Messages
Every DMRVR message has at least two fields: a unique identifier (
id) and the time that the message was sent (
sendTime).
Table 2 shows the DMRVR messages and
Table 3 their respective fields.
4. Evaluation of the DMRVR Solution
Our solution was executed with the OMNet++ and the SUMO software bidirectionally coupled. We used the Artery framework [
53], applying the ETSI IT5-G5 setting, in accordance with European specifications, considering V2X communication, as the GeoNetworking and Basic Transport Protocol (BTP) alternatives [
50].
Table 4 shows the parameters of the solution, which are based on the applications analyzed in [
53,
54,
55,
56].
The SUMO Traffic model (LuST) developed for the City of Luxembourg was applied [
57] reflecting specific mobility characteristics. By taking the City of Luxembourg as reference, depicting a common topology of mid-sized European cities, we were able to set up a realistic scenario. Traffic demand was inserted with realistic traffic information and mobility patterns. This has permitted calibrating and validating the model with regard to traffic flow situations. The model involved an area of 155.95 km
, 930.11 km of roads, 88.79 km of highways, and a total of 203 traffic lights. A total of 4000 vehicles were considered along the running peak period from 8:00 a.m. to 6:00 p.m. [
57].
We developed an algorithm with the Python language to set up the initial route. The LogisticsService was setting in the RSU of the logistics operator. In the sequel, the VehicleService application was inserted in the simulation of the main vehicles, and in the operation of the auxiliary vehicles as well.
The LogisticsSercice and the VehicleService framework applications include characteristics from the ITS-G5 Middleware proposed in the Artery scheme. The broadcast messages that cover a circular target area and were setup in GeoBroadcast (GBC) elements are specified according the ETSI ITS-GS. The GeoNetwork protocol leads the original node to rebroadcast the former element when it does not get the expected acknowledgment (ack) messages from the destination node. The messages in the DMRVR setting are organized to use this scheme.
Intended to evaluate the impact of possible supplier tardiness occurrence, the
LogisticsService can estimate its
p tardiness probability. Specifically for supplier (
), such probability
is represented by a negative exponential distribution, as depicted in Equation (
7) [
10]:
where
is the imposed tardiness limit, and
is the expected supplier tardiness value, given the tardiness in fact occurs. When
p is less than
, the model assumes that the related supplier shows a tardiness value equal to
minutes.
In the application case, it was assumed that the logistics operator has one basic pickup vehicle in operation, plus one auxiliary vehicle, and eight suppliers to attend the OEM company requisites. A 3 h period has been set as the OEM upper limit to perform all the collecting tasks and returning back to the OEM depot.
Table 5 show the solution parameters, which were obtained with the data presented in [
10,
11].
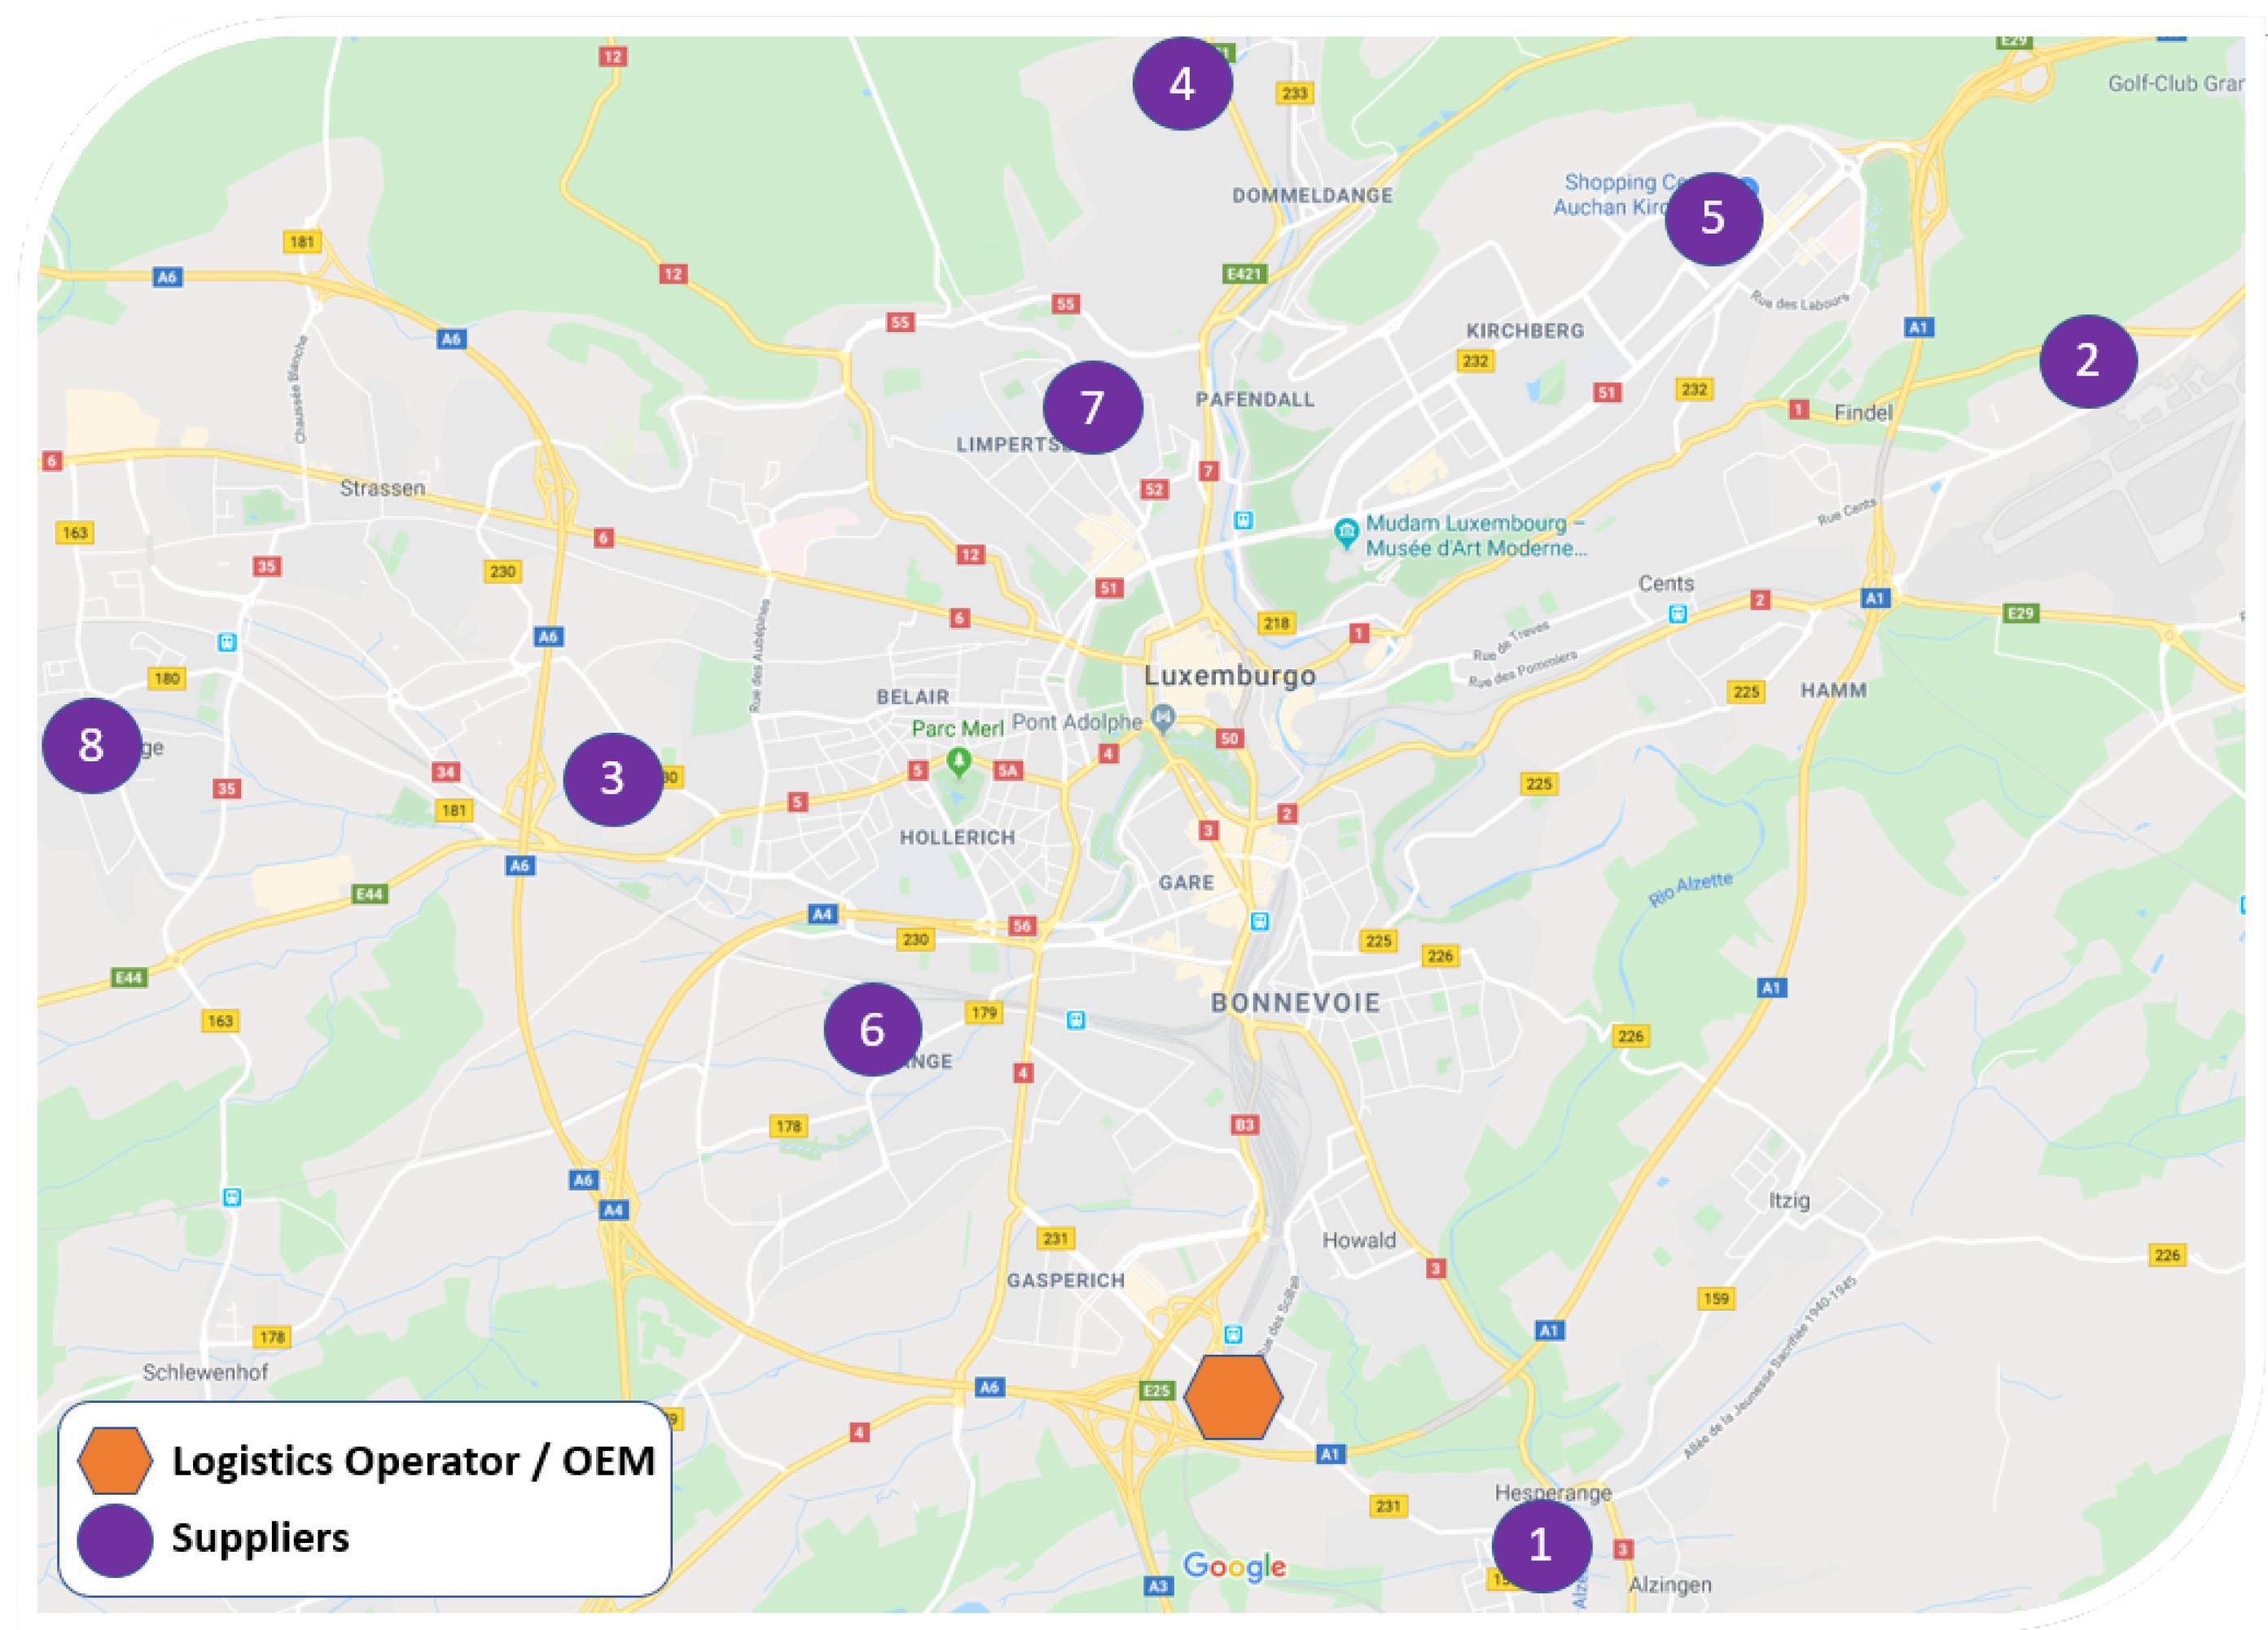
The eight suppliers and the logistics operator were randomly spread out over the Luxembourg city area, as shown in
Figure 7. Nine RSUs were also distributed in the area, eight within the suppliers’ lots, and one in the logistics operator premises. RSUs located at suppliers were solely intended as relay nodes. In order to cope with low coverage of the nine RSUs in part of the scenarios, two more RSUs were inserted to enlarge coverage. Their locations were set out empirically.
Table 6 presents some pickup route characteristics, including the collected cargo quantity at each supplier, the probability of tardiness occurrence, and the expected tardiness values. The last OEM line in
Table 6 reflects the total delivered product load at the OEM production line.
Four different vehicle densities were considered in the model, covering situations from sparse to dense scenarios. This was done to reflect the dynamic pickup vehicle routing efficiency, as well as the impacts on the vehicular network. The adopted vehicle density intervals in the simulation were: 175–600; 303–1200; 500–3900, and 716–4600 vehicles, respectively. Considering the extended modeling area of the LuST, and the high number of vehicles in dense scenarios, the resulting simulation times reached more than 190 h in some cases. That situation, with computation times that are too long, was a limiting factor during the trials.
Table 7 depicts the observed simulation times for all analyzed scenarios.
4.1. Evaluating Efficiency in the Dynamic Vehicle Routing
The average time to perform the component collecting route was computed, plus the tardiness time observed at the supplier’s factory. The average time to perform the route is computed via Equation (
8). The collecting route is considered efficient when
, given by (
8), does not exceed the JIT upper restriction:
where
is the loading time of the empty container into the vehicle,
is the vehicle displacement time from the logistics operator to the first supplier,
is the time to move the vehicle from supplier
i to supplier
,
is the production tardiness at supplier
i, if any,
is the vehicle loading time at the supplier
i,
is the return time to the OEM company, and
is the unloading time at the OEM main industry production line.
We have used a density upper value of 3900 vehicles to analyze the vehicle routing efficiency. This density value was assumed because such a value was close to the logistic situation observed in LuST. A total of 30 cases were ran in the simulation.
The results on the dynamic vehicle routing efficiency have been compared with the results shown in [
10], employing the same simulators and variables.
Table 8 depicts such results. The expected time to perform the pickup route in the DMRVR model was 164 min, while, in [
10], it was 176 min. However, the 180 min upper limit was surpassed in 37% of the ran cases in [
10]. Such results indicated a non-compliance situation regarding the agreement between the OEM leader firm and the logistics operator, also reflecting a disruption in the main OEM production line. On the other hand, the utilization of an auxiliary pickup vehicle led to a higher total cost along the milk-run operation. In addition, the DMRVR used an auxiliary pickup vehicle in 86% of our simulation runs, as compared with 87% in [
10].
Comparing further, the expected time delay that the collecting vehicle had to wait at the suppliers’ docks was 8 min in our model, against 14 min in [
10]. In addition, DMRVR was able to offer anticipated information to the logistics operator about supplier expected tardiness in their manufacturing plant. Such information is sent further to the collecting vehicle, possibly before the latter arrives at the supplier dock. Thus, the logistics operator will be to make possible operational adjustments in order to reduce delays in the overall milk-run time. This feature represents an advantage point as compared to [
10].
In 20% of the simulated cases, DMRVR has taken out one supplier from the milk-run setting as a result of the accumulated suppliers delays and traffic congestion. Such information was not sent to the logistics operator, leading to a fault since an auxiliary vehicle was not sent by the latter to collect the components from the supplier, with a possible negative impact on the OEM overall performance.
Solving this kind of problem, which can negatively affect the OEM supply chain, we developed a queuing improvement in the DMRVR framework. Whenever a NotifyWithdrawal message is broadcasted in the LogisticsService, the message is inserted in the queue. Provided the acknowledge message (ACK) from the LogisticsService is not received in five seconds, the VehicleService again sends the NotifyWithdrawal message. Such a process is repeated until the VehicleService finally recognizes the ACK message. Inserting this feature into the model, its failure rate to attend the suppliers was reduced to zero percent.
4.2. Impacts on the Vehicular Network
Three metrics were adopted to evaluate the DMRVR impacts on the vehicular network:
Success rate: represented by the frequency the messages arrive at the destinations. Such metric checks whether the vehicular network has been able to supply the required communication, thus evaluating if the system is able to perform the pickup operation. For this metric, NotifyPickup messages were considered;
Average end-to-end delay: which measures the expected time a message takes to get to the destination node from the origin. Such a delay represents the difference between the moment the message has been received, less the time it has been effectively sent. NotifyPickup messages were part of this metric;
Maximum transmission distance: it refers to the longest distance covered by the broadcasted messages up to the destination node.
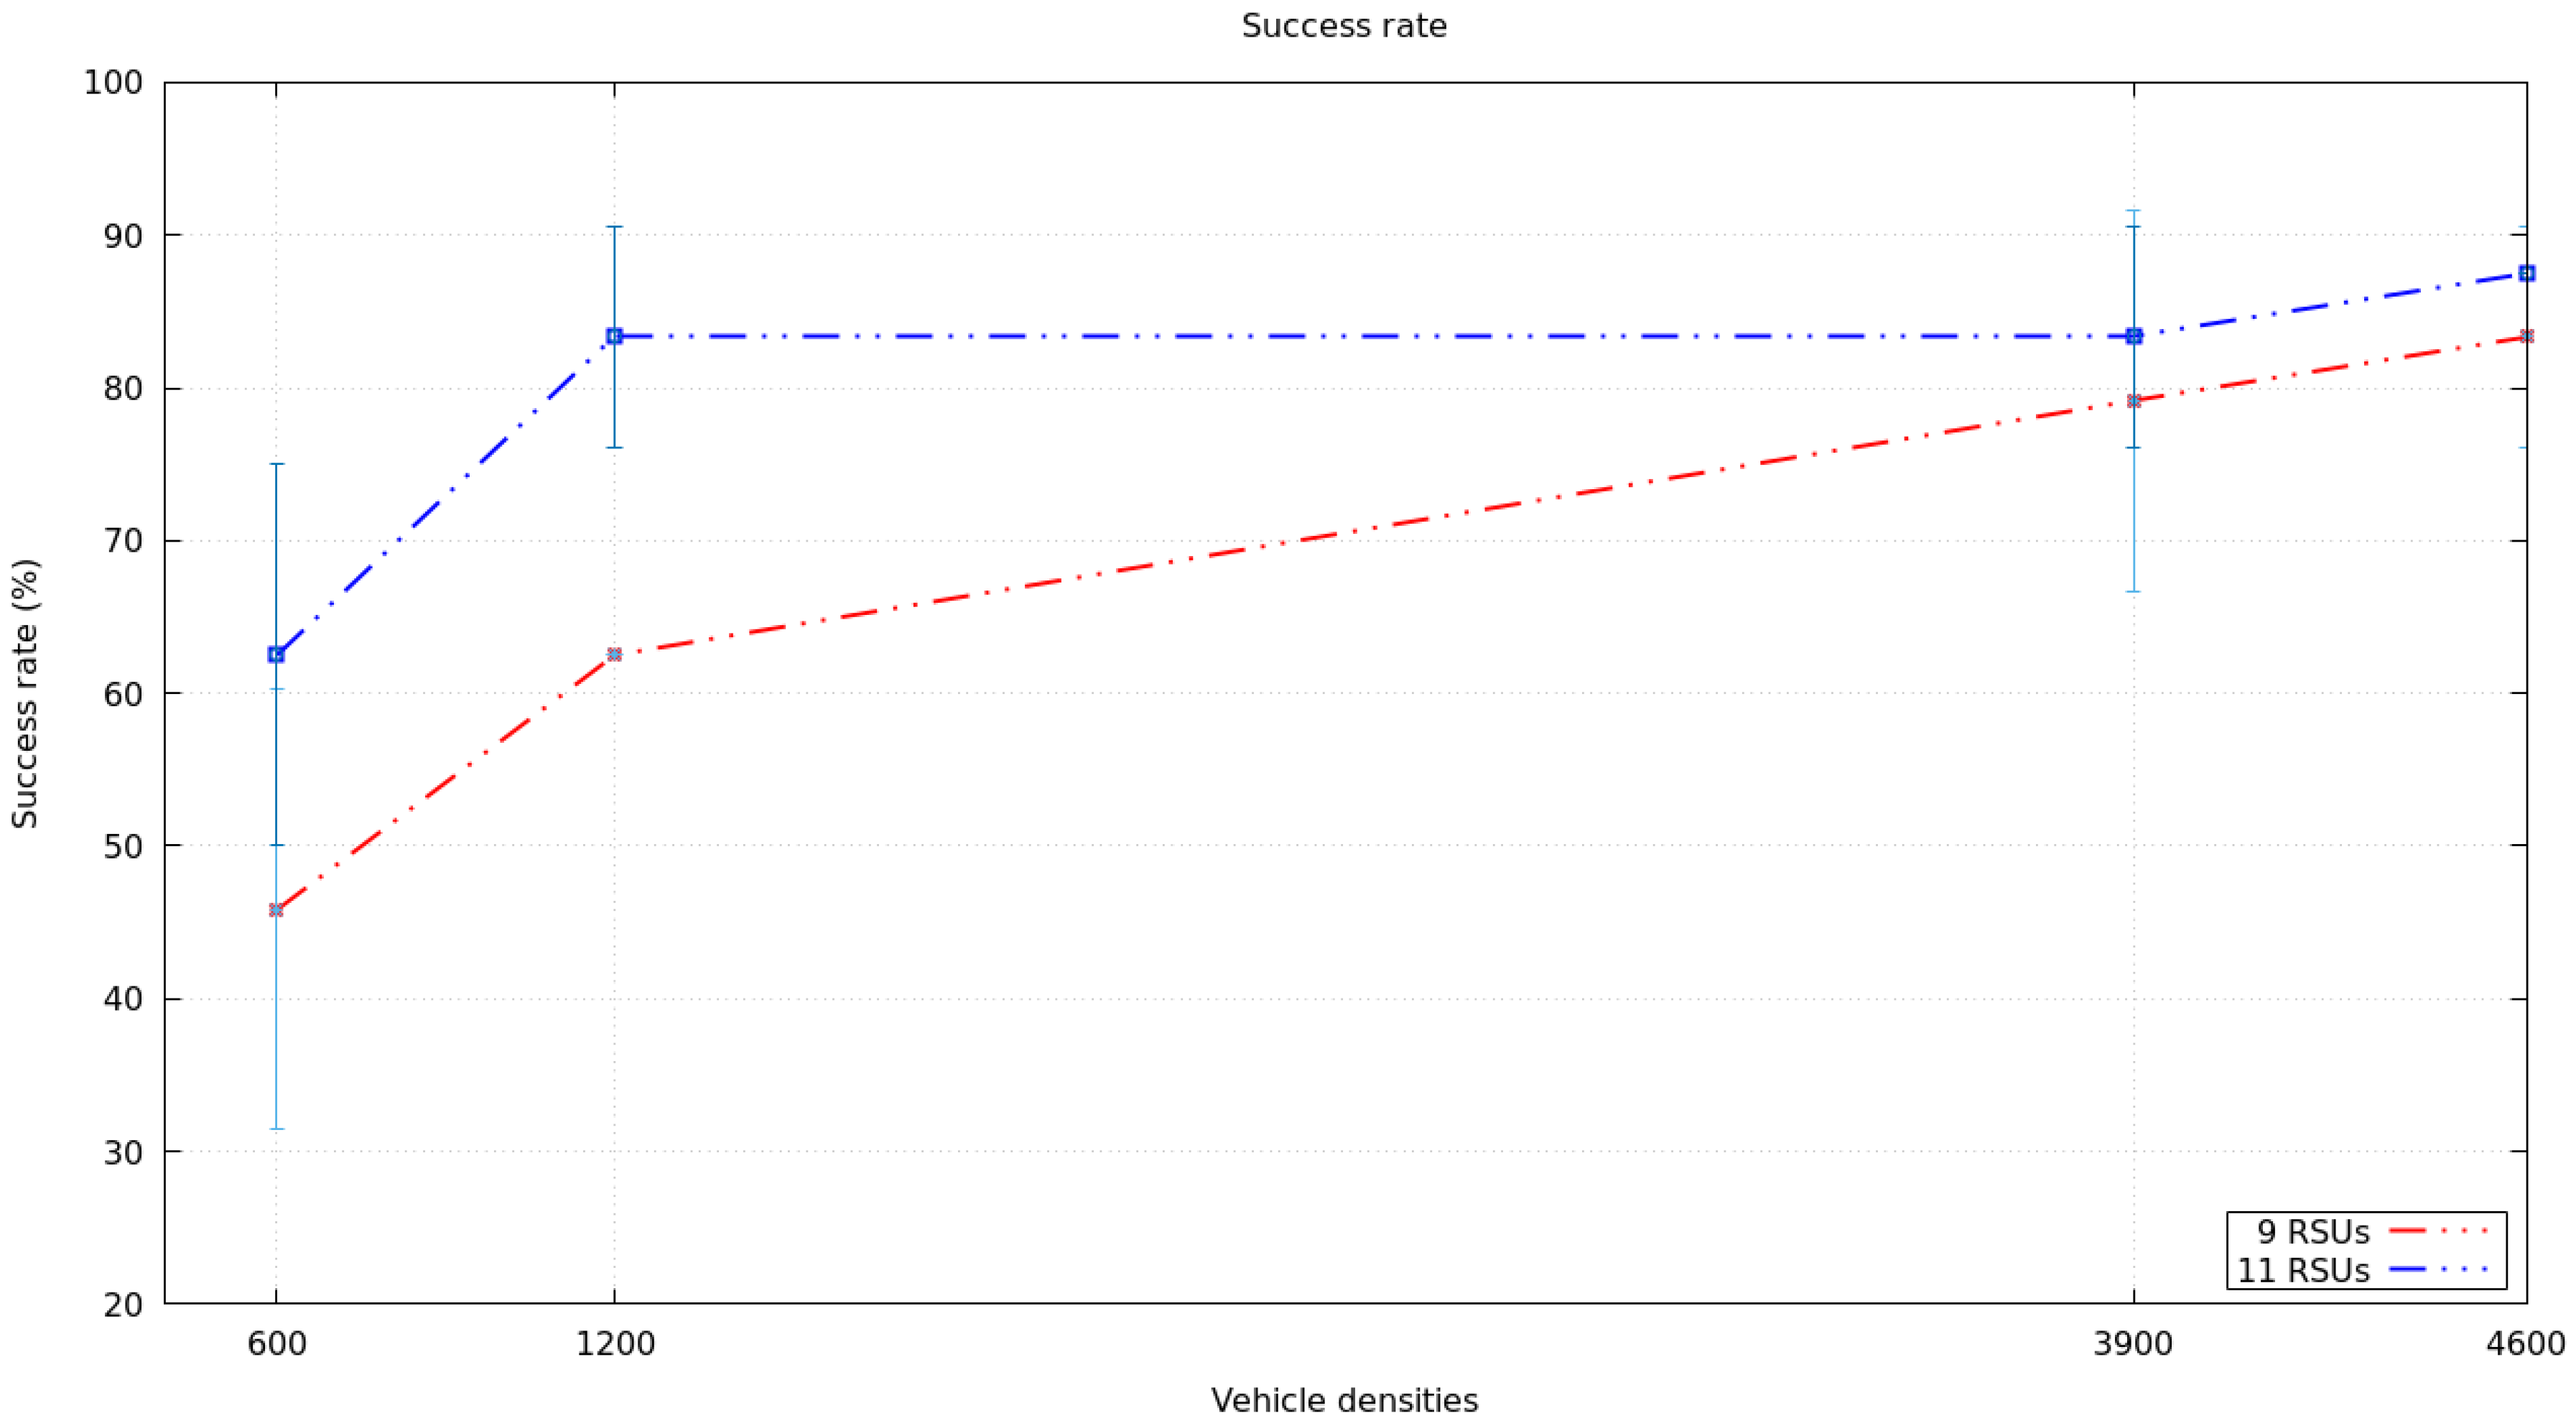
Figure 8 shows the message delivery success rate for the
NotifyPickup messages considering the four vehicle densities, given different quantities of RSUs. With nine RSUs, from which eight are suppliers, and 1 is located within the logistics operator premises, the message delivery success rate raised from 45.83% (sparse scenario) to 83.33% (dense scenario). In areas with low vehicle network coverage, two more RSUs have been inserted, and the delivery success rate enlarged from 62.5% to 91.33%. Such feature has shown that the vehicle density influences positively the success rate, due to the more advantageous utilization of the multi-hop effect. On the other hand, when one adds RSUs in the communication area, the success rate raises, especially in sparse scenarios.
Although DMRVR did not send any critical messages, it was observed that low message delivery rate may generate communication failures between the logistics operator and the collecting vehicles, leading to management problems and milk-run efficiency reduction. Accordingly, one concludes that the number of RSUs in addition to vehicle densities along the route, must be considered when planning milk-run operations of this kind.
It is important to note that the message delivery success rate may be also influenced by a faulty selection of a relay node. When a GBC packet is received, the node checks out which neighbor is closest to the destination area, and takes it as a forwarder, or relay node.
A wrong node selection can be made when the selected node is no longer available in range because it has moved away in the meantime. In our simulations, this situation occurred in some cases, affecting the success rate. According to [
50], the neighbor’s table showing the nodes is only updated whenever a beacon packet has been received. Such a table presents a 20 s timeout. Thus, the dissemination protocol will remove a node (outside coverage area) only after 20 s.
To improve the success rate, one has to use acknowledgment messages (ACK) in all messages DMRVR, and not only in NotifyWithdrawal communication. We were not able to evaluate this form of use in all messages due to the fact that the simulations showed too long times. We intend to analyze the advantages and disadvantages of employing acknowledgment ACK messages in a future work.
The vehicular network impacts detected with the model are summarized in
Table 9. With nine RSUs, the end-to-end delay time has shown to be lower than one second for all vehicle densities. However, with 11 RSUs, the time increased to the range from 8.35 up to 22.14 s, depending on different densities. The maximum transmission distance slightly increased as a function of vehicle density: it increased from 9385 m to 9777 m with nine RSUs, and in the range from 9719 up to 9725 with 11 RSUs. This behavior difference occurred because the nine RSUs were positioned at the edge of the LuST map, whereas the other two RSUs were set at the city central part. The findings were as expected and are suitable for the study case’s features.
5. Conclusions
The evidence from this study points towards the idea that the use of a vehicular network merged with fog computing contributes to provide a novel solution to the dynamic vehicle routing problem (DVRP) concerning milk-run operations. In the literature review, we did not find other studies proposing the use of VANET based application in milk run operations.
The solution described in [
10] only identifies the supplier’s delay when the pickup vehicle is already at the supplier, generating unnecessary travel times. Our solution (DMRVR) allows the pickup vehicles and the logistics operator to maintain updated information about the suppliers and the vehicle positions by using the vehicular network. This feature enables faster and more accurate decision-making, avoiding possible losses for the OEM. Different from [
11], when DMRVR identifies that the pickup vehicle is behind schedule and is not going to make all the pickups, our solution removes suppliers from the route. Thus, the pickup vehicle immediately sends its new route to the logistics operator. This approach allows the auxiliary pickup vehicle to start its displacement as soon as possible within the JIT limit imposed by the OEM.
In our simulated-based experiments, the real-time communication between the logistics operator and the vehicles allowed delays (from the suppliers or traffic jams) to be analyzed in time to make changes to the route. We noticed that, in sparse scenarios (lower density of vehicles), the addition of RSUs increased the message delivery rate; however, some messages were lost, which can negatively affect the OEM supply chain.
Due to the simulation model size, one of the main limitations of this work was the processing time. In the most representative scenario with a peak density of 4600 vehicles, the simulation time averaged 195 h. Any change in the model or execution of new algorithms became too time-consuming. Further experimental investigations are needed to analyze the dynamic vehicle routing considering different types of milk-run operations, supplier numbers and locations, addition, and removal of suppliers from the route. Future work should focus on enhancing the message delivery reliability. We also suggest developing a new mechanism to identify the most optimized RSU distribution. Finally, our results are promising, and other VANET-based logistics applications should use DMRVR.


