Review

Closing the Wearable Gap-Part VII: A Retrospective of Stretch Sensor Tool Kit Development for Benchmark Testing

1
Department of Industrial & Systems Engineering, Mississippi State University, Mississippi State, MS 39762, USA
2
Department of Human Factors & Athlete Engineering, Center for Advanced Vehicular Systems (CAVS), Mississippi State University, Starkville, MS 39759, USA
3
Department of Electrical & Computer Engineering, Mississippi State University, Mississippi State, MS 39762, USA
4
Department Kinesiology, Mississippi State University, Mississippi State, MS 39762, USA
5
Department of Agricultural & Biological Engineering, Mississippi State University, Mississippi State, MS 39762, USA
6
National Strategic Planning and Analysis Research Center (NSPARC), Mississippi State University, Starkville, MS 39759, USA
*
Author to whom correspondence should be addressed.
Electronics 2020, 9(9), 1457; https://doi.org/10.3390/electronics9091457
Submission received: 7 August 2020 / Revised: 28 August 2020 / Accepted: 1 September 2020 / Published: 7 September 2020
(This article belongs to the Special Issue Application of Wireless Sensor Networks in Monitoring)

Abstract

:
This paper presents a retrospective of the benchmark testing methodologies developed and accumulated into the stretch sensor tool kit (SSTK) by the research team during the Closing the Wearable Gap series of studies. The techniques developed to validate stretchable soft robotic sensors (SRS) as a means for collecting human kinetic and kinematic data at the foot-ankle complex and at the wrist are reviewed. Lessons learned from past experiments are addressed, as well as what comprises the current SSTK based on what the researchers learned over the course of multiple studies. Three core components of the SSTK are featured: (a) material testing tools, (b) data analysis software, and (c) data collection devices. Results collected indicate that the stretch sensors are a viable means for predicting kinematic data based on the most recent gait analysis study conducted by the researchers (average root mean squared error or RMSE = 3.63°). With the aid of SSTK defined in this study summary and shared with the academic community on GitHub, researchers will be able to undergo more rigorous validation methodologies of SRS validation. A summary of the current state of the SSTK is detailed and includes insight into upcoming experiments that will utilize more sophisticated techniques for fatigue testing and gait analysis, utilizing SRS as the data collection solution.

Graphical Abstract

1. Introduction

Feedback plays an important role in sports as real-time adjustments in training methods based on performance can help both coaches and athletes enhance output while mitigating the risk of injury [1]. Due to the employment of varying training techniques used across multiple baselining and recovery philosophies, multiple sports, and varying levels of competition, ambiguity can arise in how to best develop and optimize the performance of an athlete. Regardless of the programming paradigm, a central need for strength and conditioning (S&C) coaches is the ability to define performance improvements objectively [2]. For this reason, data collection has long been a part of the daily routine for S&C coaches. Initially, these data collection methods involved manual reporting and subjective observation. However, widespread adoption of sports monitoring devices, such as wireless wearable sensor systems that offer valuable insight into athlete performance, are changing the methods utilized by S&C coaches regardless of their coaching philosophy [2]. By using wearables to capture and then examine performance data in near real-time, it is possible to provide the coach or athlete with immediate feedback, enabling coaches to adjust training programs such that they enhance workload output while mitigating the athlete’s future risk of injury [3]. Regardless of the tool and method used for data collection, the quality of the information is often the limiter for coaches looking to make genuinely informed decisions [4].

1.1. Athlete Data Collection Limitations

Understanding sports biomechanics is critical for mitigating injury risk and improving performance. Movement biomechanics are traditionally evaluated using optical systems, the gold standard method for motion capture [5]. These motion capture systems, however, are generally constrained by their capture volume due to camera set-up and are usually restricted to laboratory environments. Additionally, reflective markers take time to mount and can impede the performance of the tasks under investigation. Conversely, the complexity of the movement and task being assessed often leads to marker occlusion [6]. Wearable technology is an alternative approach to camera-based motion capture with the potential to overcome these limitations. Wearable systems can provide real-time feedback within actual sports environments and during live training and competitions—a feature not easily accessible through video analysis. Wearable systems are designed to be compact, lightweight, wireless, portable, and unobtrusive to facilitate maximum mobility while being used during a task, thereby allowing for monitoring of athletes outside of a laboratory setting and in their natural environment [7].
There are several types of sensors, namely, inertial measurement units (IMUs) and microelectromechanical sensors (MEMs). These include a combination of accelerometers, magnetometers, and gyroscopes used to collect biomechanical measurements. Wearable sensors are now the most commonly used data collection system in several different sports, such as swimming [8], snowboarding [9], baseball [10], rowing [11], skiing [12], netball [13], football [14,15], rugby [15], and general athletics [16]. Despite the increasing utilization of wearable sensors in sports, they do present usage limitations. Ferromagnetic objects in the vicinity of wearables can alter measurements from inertial-based systems. Inaccurate positioning can impact both data precision and integration, further resulting in errors during the extrapolation of positional data from acceleration measures. Accuracy is further brought into question as certain movements may lead to unnecessary or noisy data, sensor displacement, or general failure of the sensors and their connections to the data capturing devices [17,18]. Soft robotic sensors (SRS), a novel system of sensors that measure strain and can be used to collect movement measurements when stretched across a joint axis, may provide an alternative to the use of IMUs mounted on rigid circuit boards. SRS can be described as a textile-based conductive material sensor technology with electrical properties that change when subjected to mechanical deformation [17]. When properly placed on the human body across a joint, stretching or flexing an SRS will cause a geometrical change that induces an equal, linear response in the electrical properties, allowing these sensors to detect and quantify motions, such as the flexion and extension of fingers, elbows, or knees [17].

1.2. Origins of Closing the Wearable Gap Research

In June 2017, a National Science Foundation (NSF) Innovation Corps (I-Corps) training site pilot grant funded an investigation on new athletic wearable technology. A series of interviews were conducted around the country with S&C coaches and athletic trainers for both men and women sports at the collegiate and professional level. According to the responses from the I-Corps interviewees, there were trust concerns regarding the data from the wearable sensors due to consistent inaccuracies and lack of transparency regarding how correlations were being made. Besides, these wearable sensors failed to capture preferred movement information (such as ground reaction forces and foot-ankle complex movements) [2,19]. The intent of the “Closing the Wearable Gap” paper series was to determine whether SRS could be repurposed for motion capture through a custom-made wearable application. The motivation behind this study was to eliminate the problems found by IMU-based wearable solutions, such as drift. With a clear goal provided by athletic practitioners to capture data “from the ground up”, the paper series aimed to evaluate the use of SRS to measure kinematic and kinetic data at the foot-ankle complex. The researchers focused on capturing foot-ankle complex movements in near real-time as the mobility of the foot and ankle influences the closed kinetic chain of the lower body and, ultimately, human movement as a whole [20]. This SRS-based solution has many advantages for both the athletic and rehabilitation industries as an excessive movement beyond the normal range of motion can result in ankle sprains [21,22]. Applying SRS at the foot-ankle complex may help provide information to the coaches, trainers, and therapists to aid in preventing injuries and validating proper ankle rehabilitation and training exercises. The advancements in the field of SRS may also be applicable to “industrial athletes”. The term “industrial athlete” applies to anyone who earns a living through intellectual and physical abilities, performing jobs involving motor skills that require motor abilities, such as strength, flexibility, coordination, and endurance-much like a sports athlete [23]. Industrial athletes often perform repetitive motion tasks over the course of multiple hours, and, when performed improperly, this can lead to musculoskeletal disorders and, in turn, may need the same level of attention as a sports athlete from a rehabilitation team [24]. Advancements in SRS technology can be used to help athletes of all types by monitoring parameters associated with injury risk, continuous health, and well-being.

1.3. SRS Validation Gaps

Soft robotic sensors are thin, strap-like electronic sensors that respond to mechanical deformations and, when stretched, create a linear voltage shift, measured either in resistance or capacitance. Research and development of SRS in both academia and industry have seen a recent increase [25,26,27,28,29,30,31,32,33]. Numerous efforts have been made to develop flexible, stretchable, and sensitive SRS due to the potential diversity of their applications, such as rehabilitation and personal monitoring [34,35,36,37,38], structural health monitoring [39,40,41,42], sports performance monitoring [3,18,36,43], human motion capture for entertainment systems [44,45,46], and mass measurement [47]. Depending on the type of material and manufacturing processes, the sensors react to the applied strain with different response mechanisms.
Linearity is an essential response parameter of SRS as it provides consistency and precision to signal detection. Linearity relates to the relation between the relative shift of the electrical signal and the strain applied, which, if truly linear, can be represented graphically as a straight line. The linear working range of the SRS depends on the textile substratum properties and how the conductive components have been integrated into the textiles [48,49]. Though there has been advancement in testing and development of new wearable SRS with different substrates for health monitoring and human motion detection, there is little information available related to linearity testing tools. Most efforts have been devoted to improvements in sensing performance, sensor applications, and manufacturing processes. Electromechanical tests have been conducted by attaching the sensors to off-the-shelf, commercially available motorized testing stages/machines, universal testing machines, or motion controllers, which apply cyclic stretch/strain to the sensors with electrical responses recorded using a multimeter [46,48,49,50,51,52,53,54,55]. Some experiments include manual stretching and relaxation of SRS over multiple cycles with changes in its electrical values recorded using a digital multimeter [37,44]. Because there is little in the way of standardized benchmark testing for SRS, the researchers address this gap by developing their own stretch sensor tool kit (SSTK) to capture sensor characteristics during foot-ankle complex movements, as detailed in Section 2. Furthermore, as discussed previously, the purpose of the Closing the Wearable Gap series was to take these new types of sensors (SRS) and determine if the solutions developed by the research team can be repurposed for motion capture via a customized wearable technology application. For this research paper series, verification and validation studies were performed and documented to establish confidence in the capabilities of the linearity of these SRS sensors and methodologies developed to test them.
Mississippi State University’s (MSU’s) Athlete Engineering research team was funded by NSF to design and develop wearable devices using SRS to capture the kinematics and kinetics of human movement. Throughout the process of validating the use of SRS to collect this data, the researchers have developed multiple methods to validate SRS electrical properties, enhance data analyses, and establish ideal SRS mounting designs. This paper outlines all steps taken toward sensor validation and the iterations developed for testing methodologies and introduces the newest sock prototype for human subject experiments based on lessons learned from previous experiments. This progression will be viewed from the aspects of (a) materials testing of the SRS, (b) automation of the data analysis software, and (c) development of the hardware and software prototype. All SSTK solutions developed for this NSF initiative are shared on GitHub and linked from Table 1.
Figure 1 represents a visual timeline of the three components developed for the SSTK in terms of SRS validation and laboratory experiments. All the elements presented in Figure 1 can be found in sequential order in the narrative.

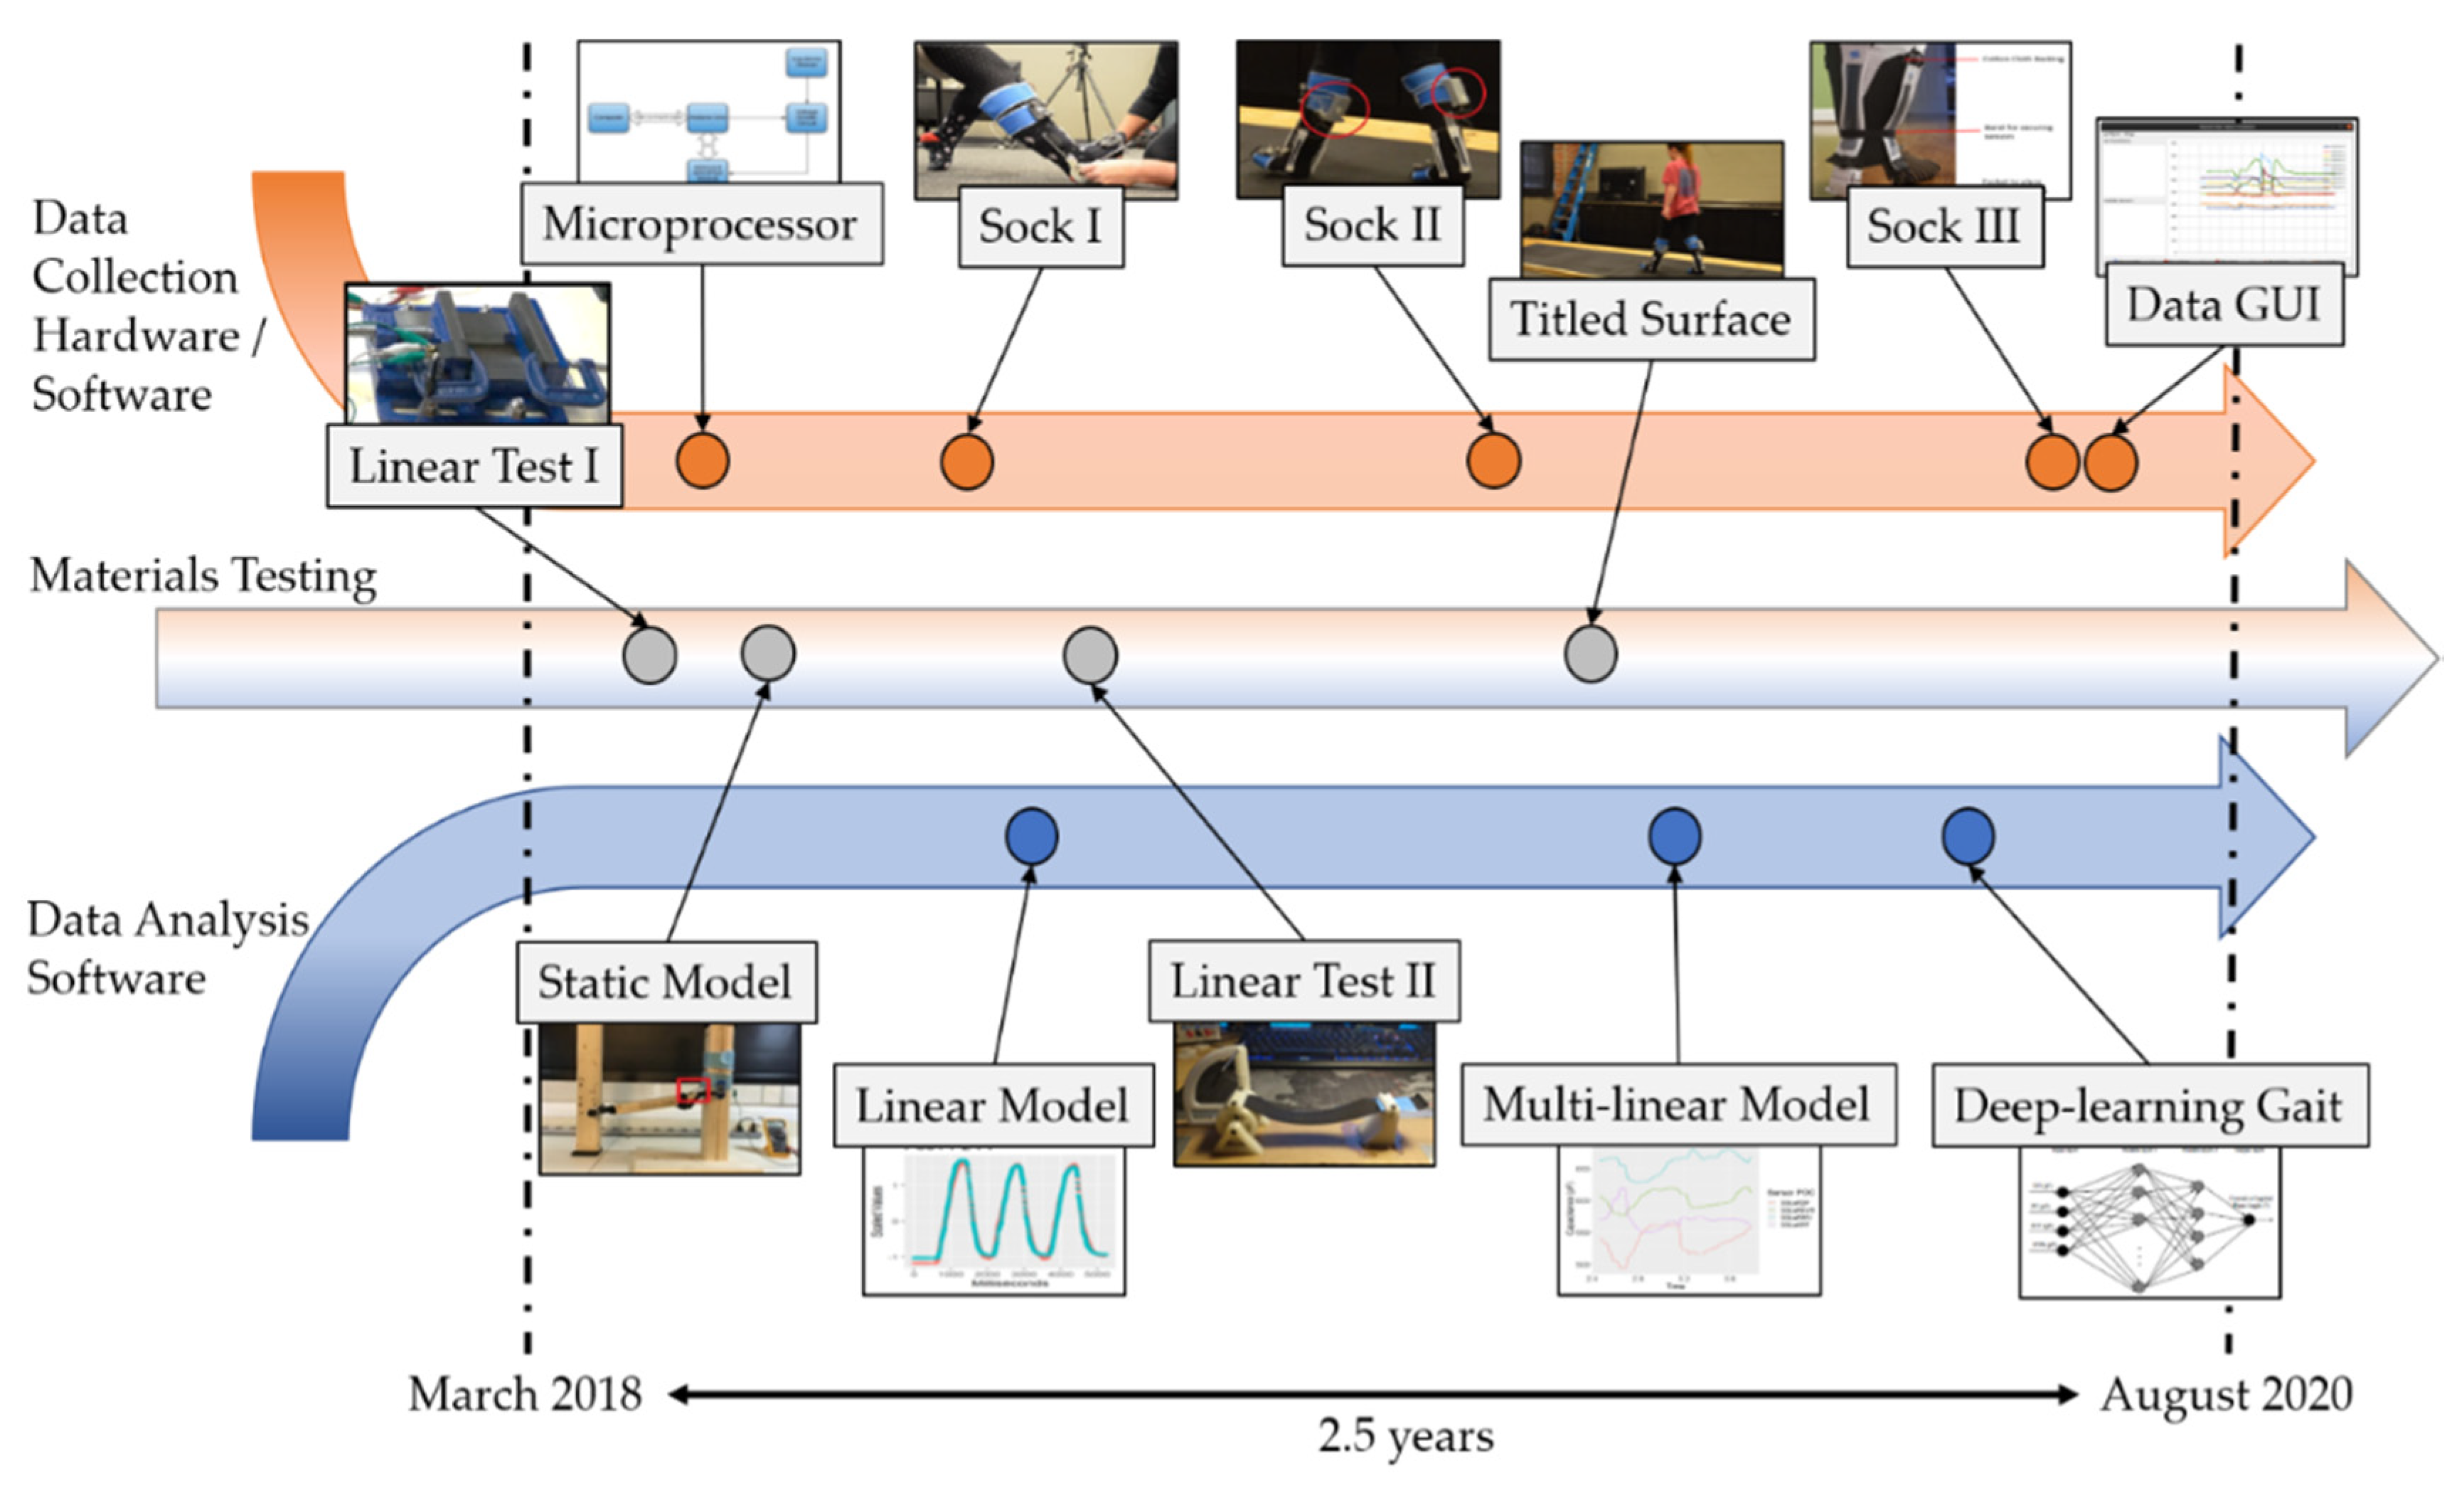
2. Material Testing Tools

One of the initial goals of the Closing the Wearable Gap series was to validate that the electrical output of the SRS changed linearly when stretched under different simulated ankle movements [19].

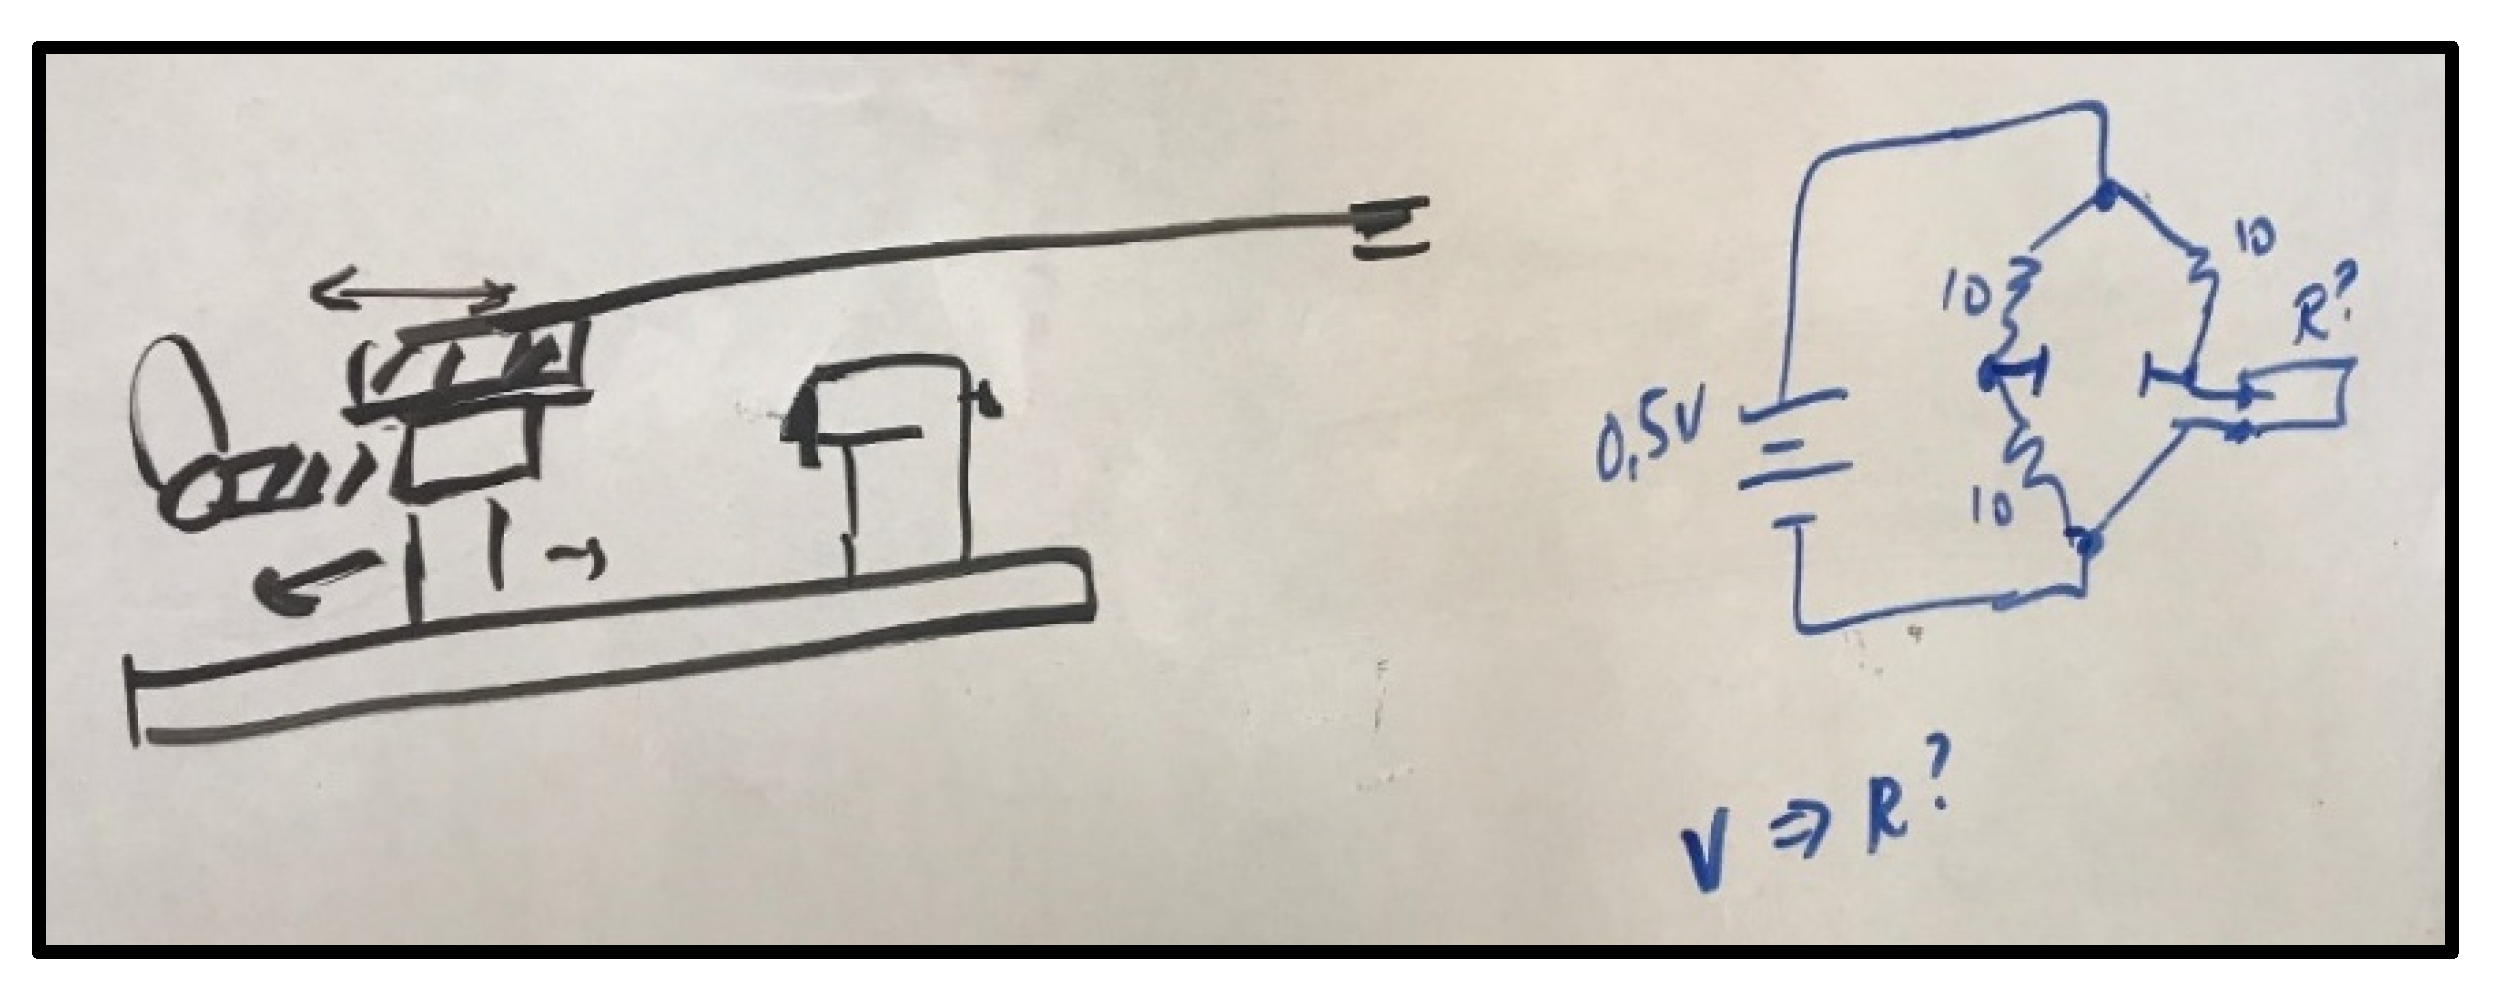
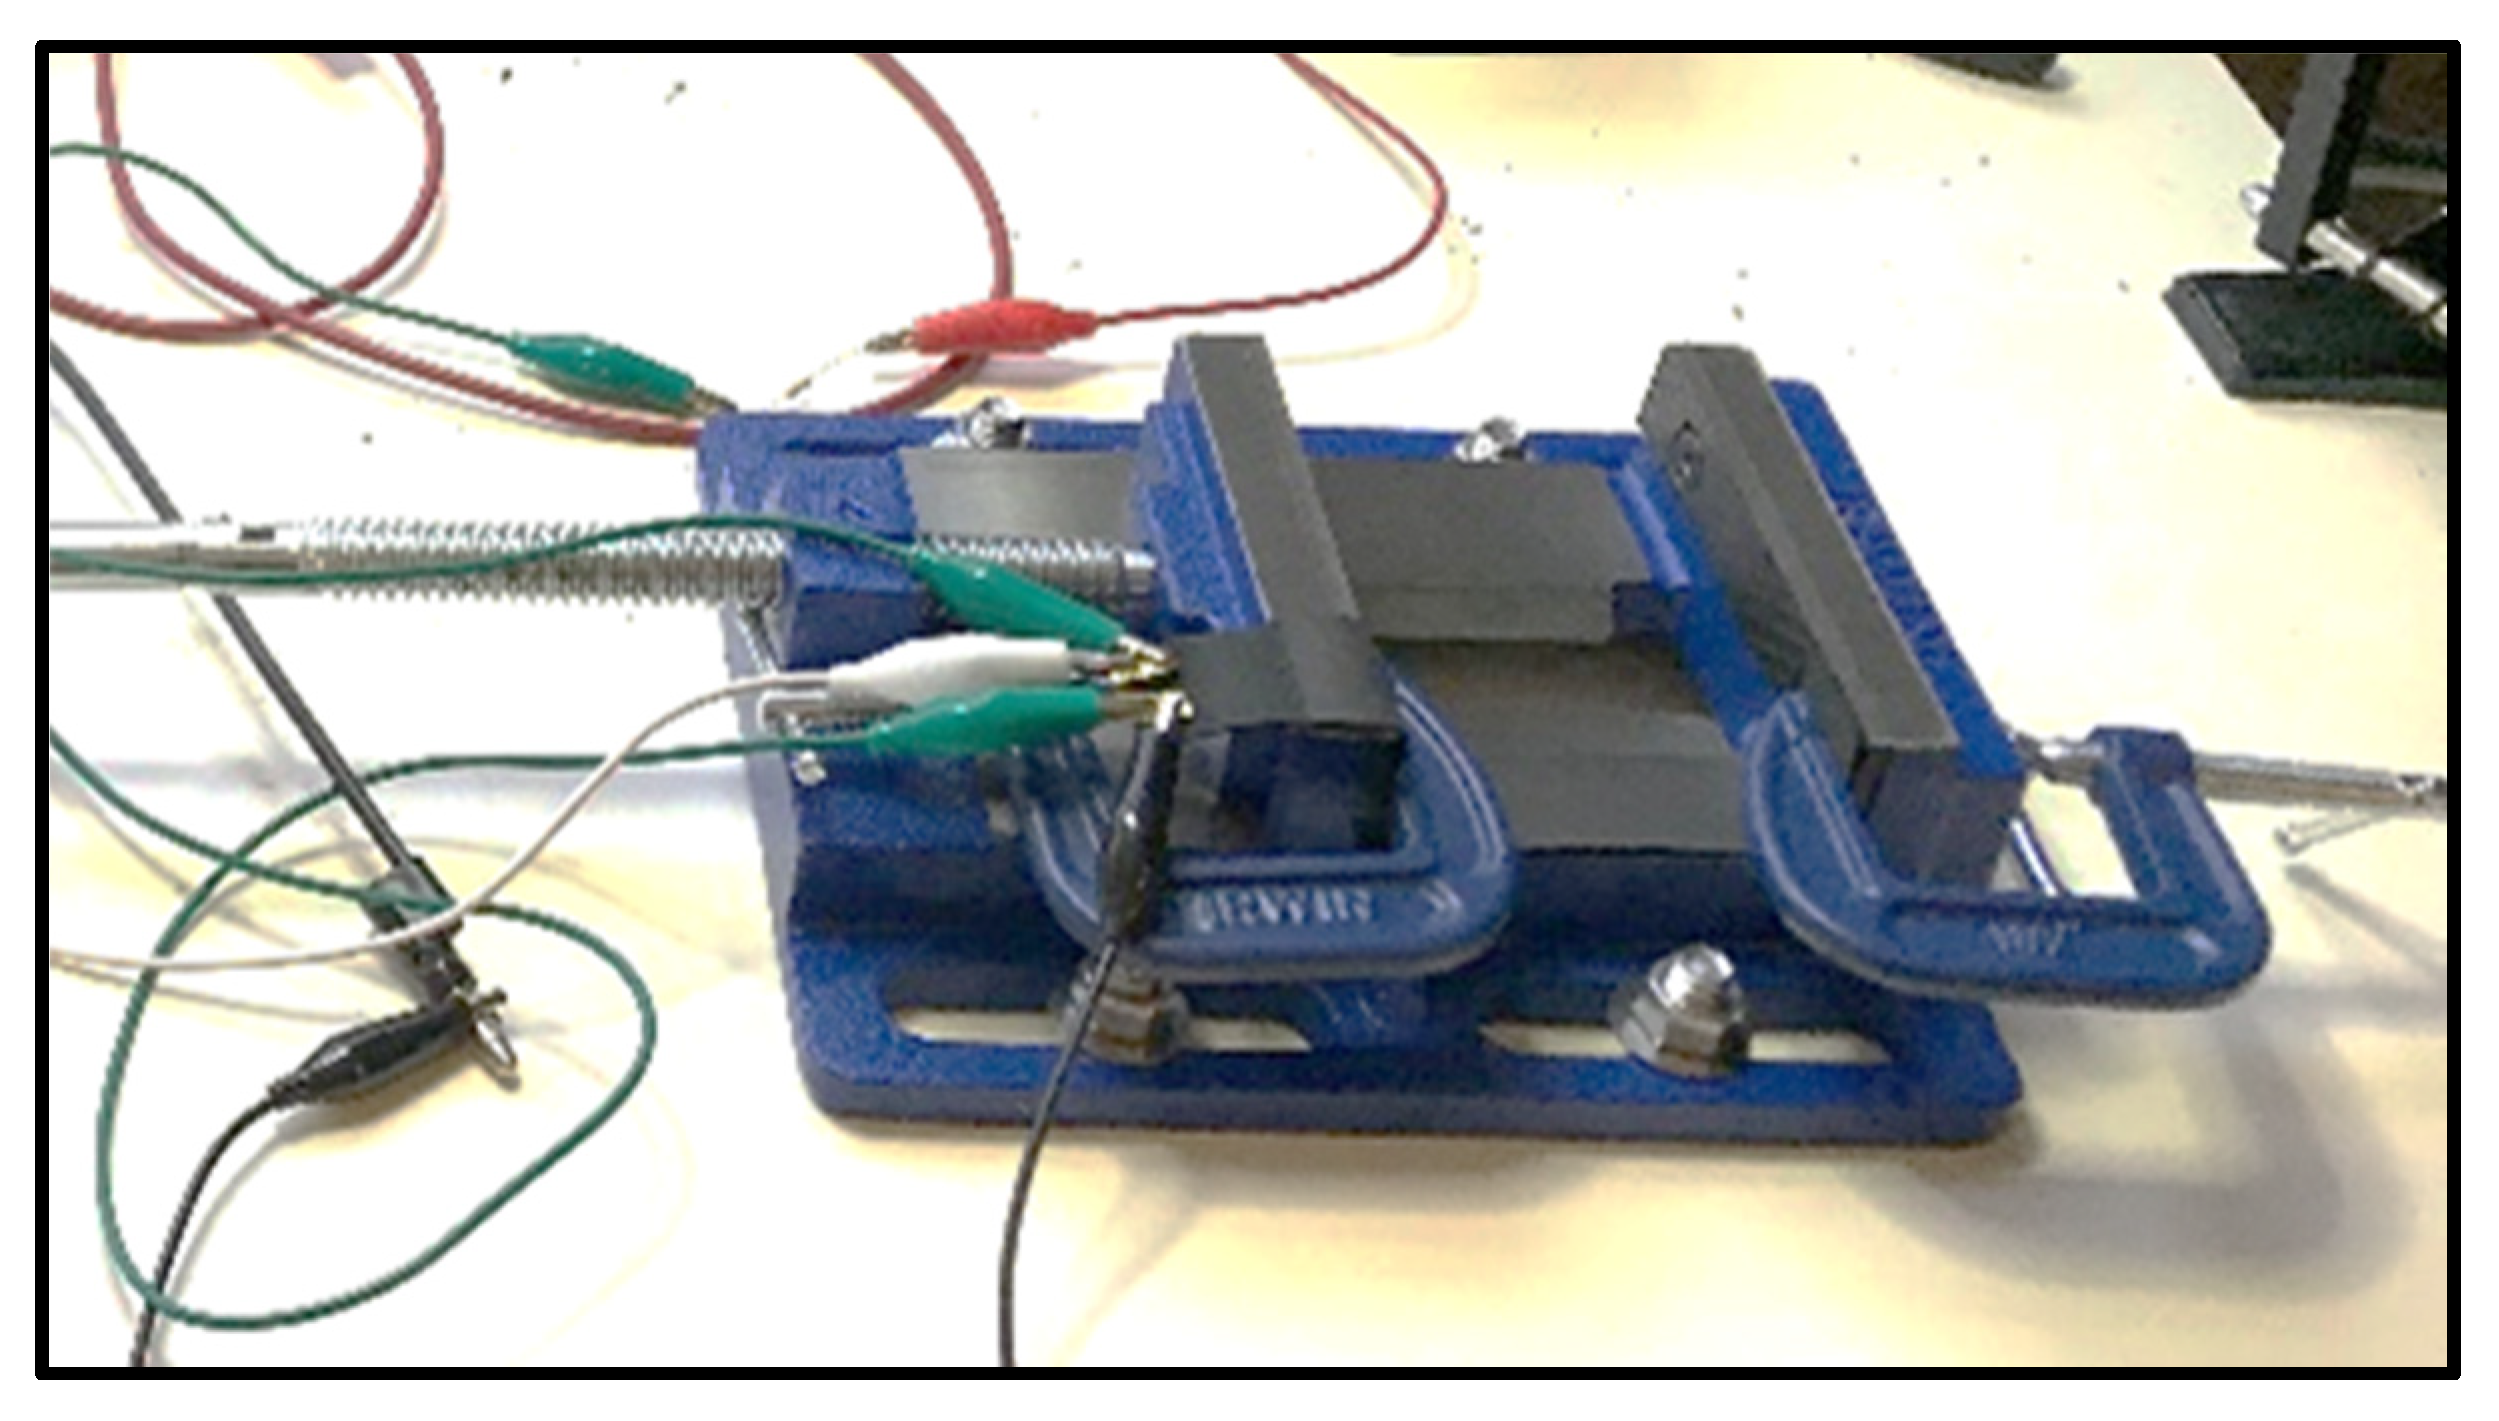
2.1. Linearity Testing Iteration I

The researchers first constructed a testing apparatus using a drill press vise and clamps to stretch the sensor in a stable and consistent manner while taking measurements at various stretched lengths. An early concept drawn when designing this testing method is depicted in Figure 2. An IRWIN four-inch drill press vise was mounted on a table to stretch the sensor in a consistent manner. A vise screw located on one side of the drill press vise was used to adjust one side of the drill press vise, being turned 180° after every measurement is taken. The length of the portion of the sensor being stretched was measured using a digital caliper, as shown in Figure 3 and Figure 4. To accurately measure the linearity of the sensor’s output in relation to stretch, the sensor had to undergo some amount of strain prior to the first measurement. The SRS was stretched to approximately 20 mm longer than its initial resting length. Several measurement methods, including an Agilent TM micro-ohm meter, a Wheatstone bridge circuit, and a constant current voltage divider circuit, were used and compared to each other to collect electrical output from the SRS. An additional test was conducted where linearity was measured under different temperatures. The researchers used a heat gun to heat the sensor, and a handheld temperature sensor was used to monitor the temperature of the sensor and to ensure it was kept at the same temperature. The obtained results indicated no dramatic impacts on the SRS linearity. More details on these studies can be found in Closing the Wearable Gap Part I [19].
In hindsight, data for this experiment should have also been collected when compressing the sensor instead of only when stretching the sensor; this would have better incorporated hysteresis into the linear model if it was present in the sensor’s electrical output. If the sensor returned to the initial position and its output did not match what it was at the beginning, this would indicate that the sensor was undergoing hysteresis or was damaged, which would cause a linear modeling approach to become less reliable.

2.2. Linearity Testing Iteration II

In a later experiment validating the use of SRS on the wrist, the researchers designed and developed a testing apparatus that imitated a wrist motion. The apparatus consisted of a fixed clamp on one end, through which the sensors were connected to a microcontroller subsystem, as shown in Figure 5. The other end of the apparatus consisted of a lever, which was used to move and bend the sensor from its 90° resting position to the final position at 0° in 3° increments. The measurement results from the microcontroller subsystem showed a linear relationship between angle and resistances, exhibiting a measurable change in resistance between every increment. Some drawbacks remained, such as the need to manually adjust the stretch of the sensor and difficulty with selecting the angle adjustments on the apparatus.

2.3. Static Model Testing

Prior to performing any human subjects testing, the researchers built a mechanical model of the ankle joint complex to simulate the usage of SRS to measure planar movements. The mechanical model was designed to mimic joint movements of the human ankle in the sagittal and frontal planes. This wooden ankle model was constructed by researchers using (0.0508 × 0.1016) m pine and 0.0095 m rubber flooring material, which were securely screwed into the wood, as shown in Figure 6. The sensor was connected to a Wheatstone bridge circuit to collect measurements. Further details on the ankle model design can be found in Closing the Wearable Gap Part I [19].
The model was used to capture variations in SRS output relative to simulated ankle movements in the frontal plane and sagittal plane. Based on goniometer values, the frontal plane motion is divided between inversion (INV) for positive values and eversion (EVR) for negative values. The sagittal plane motion is divided between plantar flexion (PF) for negative values and dorsiflexion (DF) for positive values. Two smartphones were calibrated using a carpenter’s bubble level running the RIDGID level iOS application to measure the angles for the sagittal and frontal plane. Smartphone measurements were verified by means of an electronic goniometer. The smartphones were supported using elastic bands on the static model. One experimenter moved the model, while the second experimenter observed and documented the multimeter voltage output. This experiment highlighted the challenge of handling pre-strain when testing for linearity. That is, when the SRS is in neutral position (0°), there needs to be some amount of strain present in the SRS so that there is always a change in SRS output to coincide with any change in the joint angle. Results from the analysis of the data collected during static model testing can be observed in Closing the Wearable Gap Part I [19].
This experiment also brought to light the need for more than one SRS to reliably measure the total range of motion (ROM) in both planar movements. The researchers encountered an issue with the elasticity of the sensors used for this experiment, as some sensors would break due to being stretched beyond their limitations, which was not enough to capture total ROM. When simulating the DF movement, which is the movement of the foot upward toward the shin, the sensor could not be measured with enough pre-strain when mounting it on the ankle model. Consequently, it was determined that a sensor would need to be placed on the heel of the foot for future experiments to accurately collect kinematic data in the sagittal plane. The output of the SRS was also direction agnostic. When simulating INV and EVR, it was not possible to determine which motion was occurring when only one SRS measured movement. This same principle was applied to knowing whether a sensor was being stretched due to movement in the sagittal or frontal plane. This understanding of limitations led to the decision to use four SRS for future experiments to individually capture the four foot-ankle complex movements.

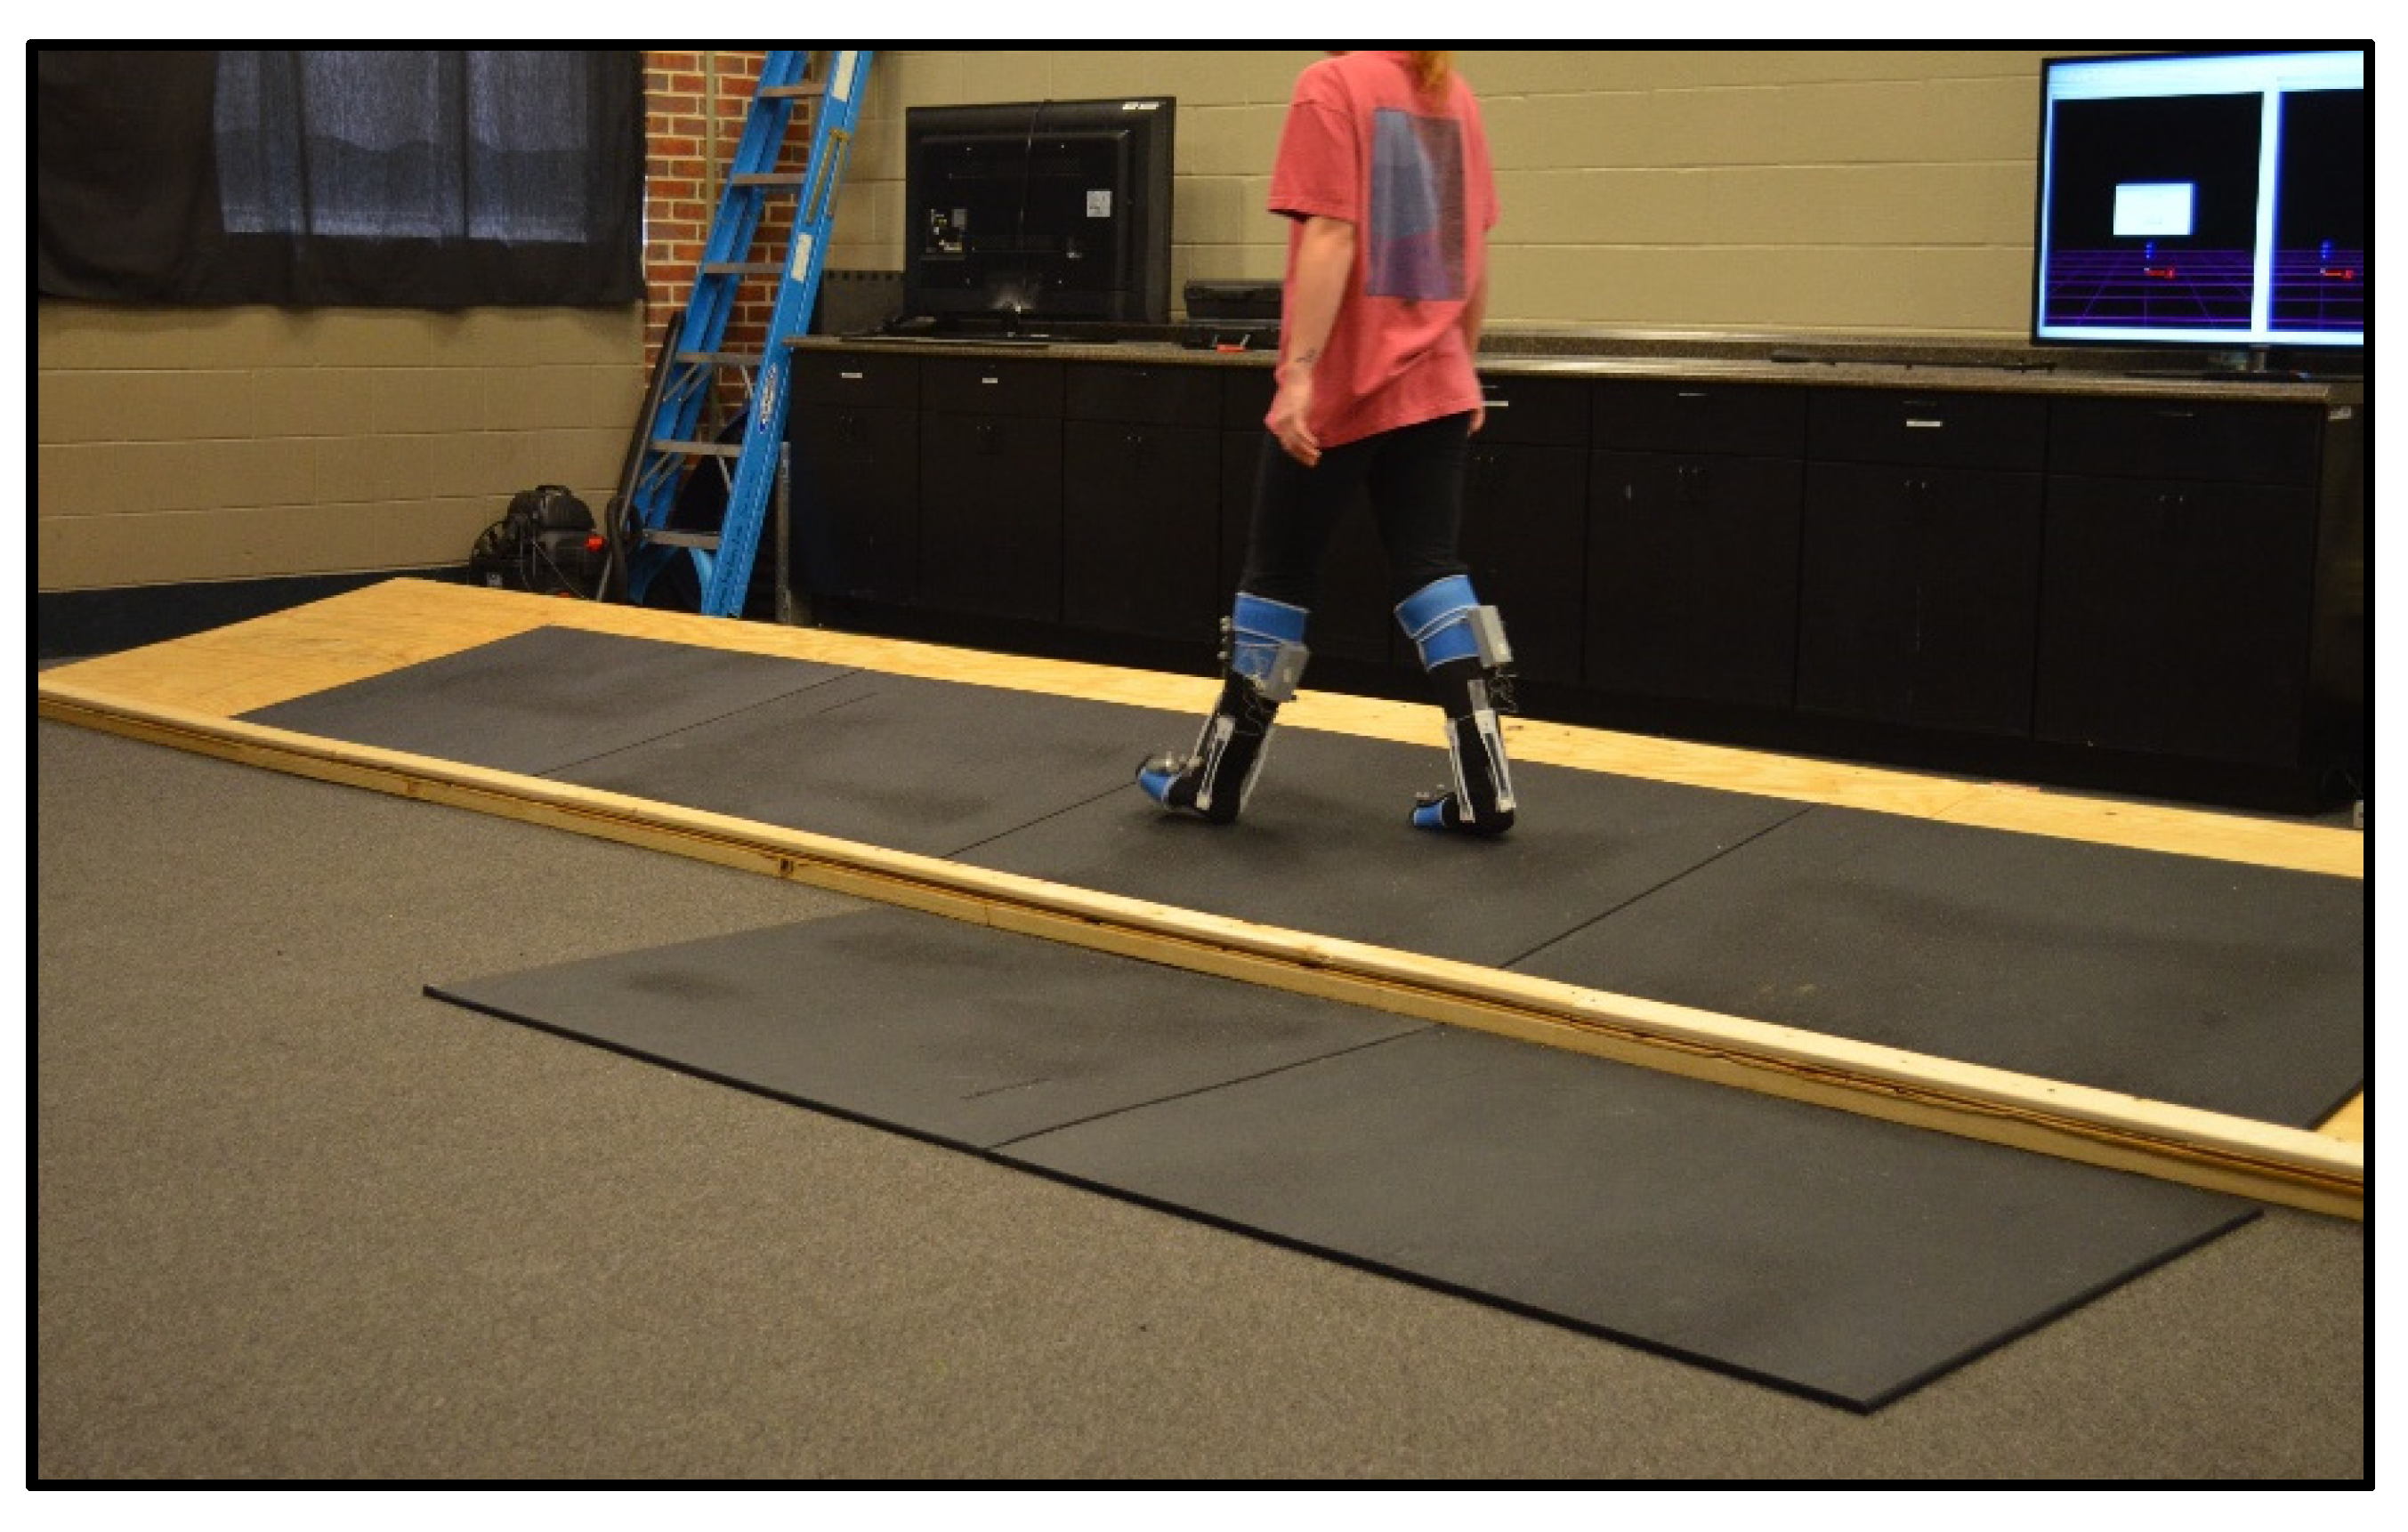
2.4. Tilted Surface Platform

Once the researchers completed the initial experiment using the wooden ankle model, a study using human subjects was conducted where optimal placement and orientation configuration (POC) on the ankle joint complex was determined [56]. The details of the mounting methods for the SRS onto a sock have been discussed later in this narrative. Once optimal POCs were determined for each of the four foot-ankle complex movements (PF, DF, INV, and EVR), the researchers then conducted trials, validating the accuracy of SRS to predict kinematic data during gait [57].
To perform the gait trials, the researchers created two different walking platforms: flat surface and tilted surface platform (TSP). When walking on level ground or a flat surface, PF at the heel strike continues until the onset of midstance, and progressive DF occurs from heel off until 40% of the cycle when PF begins again. During the swing phase, the DF of the ankle joint occurs until the heel strike [58]. Multiple gait biomechanics studies state that the motions of PF and DF are the major contributors to overall ankle motion when walking on even surfaces. The average PF and DF range of motion of the ankle have been measured at 40°–56° and 13°–33° on a flat surface, respectively [58,59,60,61]. Since walking on a flat surface does not induce significant EVR and INV at the foot-ankle complex, the TSP was constructed so that a greater ROM for INV and EVR could be recorded for the participants during self-paced gait cycles. An example of a participant walking across the TSP is shown in Figure 7.
The TSP designed for the study was derived from a walkway built for a railroad ballast surface in which the similar participant’s INV and EVR for rearfoot motions characteristics were studied [62]. The TSP was a 1.22 m wide, 7.32 m long wooden framework with a mass of more than 54.43 kg. The mass of the TSP prevented it from slipping during the participant trials. The platform walkway was tilted at 10° to increase the INV and EVR motions of the foot-ankle complex during gait cycles. The surface angle for the TSP was validated using a digital bubble level application on an iPhone. The flat surface and the TSP were placed parallel to each other. Both surfaces were covered with the same type of rubber mats to avoid confounding variables on the walking surface. Because of the motion asymmetry created by the transverse slope, participants were asked to walk in both directions along with the inclined surface platform. Additional details on the dynamic gait experimental procedures and testing can be found in Closing the Wearable Gap Part IV [57].
The TSP was able to successfully augment the ROM of INV and EVR while participants walked across it. However, one challenge that arose from the construction of the TSP was that the platform itself was large, heavy, and difficult for the researchers to move around. This meant that the TSP had to essentially remain in place for the entirety of the experiment. This imposed limits on how the TSP, along with the flat surface, was arranged for the experiment. Lastly, the researchers had to deal with a challenge common to conducting gait analysis with motion capture, which is a limited capture space. While tilted walking for long durations will not be feasible, future gait studies conducted on a treadmill would permit the researchers to collect a larger amount of gait data more quickly without the need to continuously check to ensure the motion capture system is properly tracking the participant.

3. Data Analysis Software

To validate the proposed testing tools as well as the sensor mount designs introduced in Parts II-IV and Part VI of the Closing the Wearable Gap series, data analysis had to be conducted for numerous trials. A large portion of this process was automated through the writing of scripts in R and MATLAB to handle the preprocessing. These scripts were designed with the intention of further use and optimization in later experiments.

3.1. Simple Linear Modeling Analysis for SRS Placement on the Foot

Closing the Wearable Gap Part II focused on determining the optimal POC of SRS measurements using human subjects who performed foot movements in a seated, non-weight bearing (NWB) position. The data collected was validated against kinematic data collected from a 12-camera motion capture system. The POC considerations for the SRS have been discussed in detail in the results section of the Part II paper [56]. The foot-ankle complex kinematic data for each degree of freedom were determined using the MotionMonitor TM software’s Grood–Suntay angle orientation. The raw values of the SRS were measured using a Bluetooth-enabled microprocessing unit, which connected to the SRS through a serial peripheral interface (SPI).
Several pre-processing procedures were performed to compare the data between MotionMonitor TM and the SRS. One of the issues faced by the researchers was that the 3D motion capture data were sampled at 100 Hz, while the SRS data were sampled at approximately 25 Hz. Further, the samples collected for the SRS were not evenly spaced over time due to limitations of the smartphone application. To mitigate this issue, the researchers used an R approximation function to interpolate the SRS value based on the timestamps collected from MotionMonitor TM, bringing the sensor data up to 100 Hz. After approximating the sensor outputs, the researchers aligned the data over time with the motion capture output as there were slight delays observed due to manually starting the data recording on each measurement system. The researchers overcame this by using the cross-correlation technique, which measures the similarity between two signals based on a time shift [63], aiding in the determination of the proper data time alignment. The time alignment was based on the movement performed during the trial. Once the data was properly formatted, the researchers created a linear model based on the output of the sensor versus the kinematic motion capture data to provide a measure of how well the SRS modeled the data of motion capture.
Furthermore, the MotionMonitor TM data was recorded in two columns (sagittal plane (PF/DF) and frontal plane (INV/EVR) joint angles), whereas the SRS data was recorded in four columns (PF, DF, INV, and EVR). For certain sensors to properly model the motion capture data, the dataset needed to be flipped; that is, PF and EVR were recorded as negative changes in MotionMonitor TM, but they were recorded as positive changes in the SRS data. If PF or EVR movements were being performed, the MotionMonitor TM data had to be inverted for the positive linear relationship between two datasets to be maintained. The analysis process for this study was implemented in R.

3.2. Multiple Linear Modeling Analysis for Gait Analysis

Closing the Wearable Gap Part IV focused on comparing SRS wearable solution data based on 3D motion capture while participants walked across flat and sloped surfaces [57]. The purpose of this study was to examine SRS‘s success in modeling the kinematic data at the foot-ankle complex during participant gait cycles. A similar methodology for data preprocessing was undertaken as in Part II [56], where SRS data was upsampled, and cross-correlation was used to align the data. For gait correlation, a Savitzky–Golay filter was applied to smooth the SRS data and adjust for aliasing when upsampling the data. Individual gait cycles were extracted from each of the trials. The researchers performed analysis using individual linear models, analogous to Part II, where one sensor was used per foot-ankle complex movement [56]. The researchers realized, however, that this approach was not a practical method of analyzing the gait assessments as it led to poor results. Multiple joint actions of the foot-ankle complex take place concurrently during the gait cycle. Because of this simultaneous motion of the foot-ankle complex and the sensor placements, a coupling of movements occurred, in which the sensor was affected by the movements they were not positioned to measure. This is a natural occurrence of the tri-planar movement that takes place at the foot-ankle complex, defined as supination and pronation. The researchers developed a multivariable linear model to address this issue, improving the prediction accuracy of the motion capture data (RMSE = 1.96°, R2 = 0.854) [57]. All four SRS sensors on each foot were then used to predict the output of the sagittal plane and frontal plane movements. The researchers conducted combinational experiments, utilizing multivariable regression models to understand how much data would be lost on the removal of different sensors. Using these combinational methods, the researchers developed several models, including one where PF and DF sensors were used to predict sagittal plane motion, while the INV and EVR sensors were used to predict frontal plane motion. Other models were generated, with each sensor being removed individually. The goal behind the individual elimination of each sensor was to understand if any sensor data was redundant. However, looking at the results obtained on the removal of sensors, the research team preferred to move forward with the one-to-one ratio of sensors on the primary foot-ankle movement. The results for each of the sensor combinations investigated are outlined in Part IV [57].
Another challenge introduced to the researchers during the gait analysis for Part IV was the desire to analyze the trials as individual gait cycles [57]. Every trial needed a minimum of two gait cycles, and some trials also contained a third gait cycle if the participant was still in the capture space of the motion capture system. Each gait cycle, as discussed previously, is defined as the data collected from the first heel strike of the specified foot to the second heel strike of the same foot. Unfortunately, there was no way to automate this using the kinematic data from the motion capture system. The researchers had to replay each trial manually and note the timestamps at which every heel strike occurred. The researchers developed an additional R script to read these values and trim the data files accordingly so that they could be analyzed as individual gait cycles. This contributed to the decision to attach pressure sensors to the next sock prototype at the heel so that the heel strikes would not need to be manually identified in post-processing, and the notation of gait cycles could be automated.

3.3. Deep Learning Methods for Gait Analysis

When analyzing the data for Part IV, the researchers found that the output of the SRS was coupled with multiple movements of the foot-ankle complex. Because of this, the researchers realized that the output of the SRS mounted on the foot could change due to stretch along one or more planes of movement. More advanced modeling approaches were investigated to address this issue. In Closing the Wearable Gap Part VI, the researchers revisited the gait data collected from the Part IV study to evaluate the model’s accurateness and validity using deep learning methods [64]. To establish more accurate models, both linear and nonlinear relationships between SRS and 3D motion capture measurements were investigated. Moreover, to assure the validity of developed models on the new data, the models were trained with a subset of the dataset using k-fold cross-validation. In this study, three different approaches—(a) multivariable linear regression, (b) artificial neural network (ANN), and (c) long short-term memory (LSTM) network—were applied to investigate the SRS functionality in capturing foot-ankle complex movement against the 3D motion capture system. The researchers developed prediction models to approximate the sagittal and frontal plane joint angles of the ankle obtained from the motion capture system. The multivariable linear regression from the Part IV study was included to be compared to the new techniques introduced in the Part VI paper. The ANN and LSTM network investigated the more complicated and nonlinear relationship between the SRS and motion capture data. The models were developed for each participant separately, and the network architectures were designed to fit the specific walking pattern of each individual. Further details on the implementation of these deep learning approaches can be found in [34].
In the Part VI study, feed-forward neural networks with backpropagation were developed, and different network architectures were tested on the dataset for each participant, with different input-output combinations to determine the best fit for each one. Networks with one and two hidden layers using 1 to 10 neurons were tested. The input layer consisted of four neurons designed for input attributes, including data received from the four SRS placed on the socks. These input variables were fed into the neural network for training the weighted vectors of the network, and the output of the neural network was the prediction of the 3D motion capture data. The output layer consisted of one neuron, producing the output of the network.
The authors developed an LSTM network with six layers, including an LSTM with 125 hidden states, a dropout layer with a 50% dropout rate, followed by another LSTM layer with 100 hidden states and another dropout layer with a 50% dropout rate, a fully connected layer, and a regression layer. The authors developed eight different models for each participant to analyze the relationship between the SRS capacitance measurements (PF, DF, INV, and EVR) with the sagittal plane and frontal plane outputs of the 3D motion capture system on both feet during the gait movement on two walking surfaces (flat surface and TSP). The models were trained and tested using k-fold cross-validation. Due to LSTM’s complexity, the researchers were unable to design and apply many architectures to find the best-fitted architecture for each participant. However, doing so might improve the LSTM performance. Results indicated that the ANN model performed the best (average RMSE = 3.63), while the multivariable linear regression and LSTM models performed modestly (average RMSE = 3.94 and = 3.98, respectively) [64].

4. Data Collection Devices

Throughout the Closing the Wearable Gap series, the researchers iteratively improved the mounting method for the SRS, as well as investigated how to best measure and collect data.

4.1. Initial Microprocessor Testing

Traditionally, biomechanical data collection is often confined to a research laboratory due to the requirements of the equipment for optical motion capture. One of the purposes of this research was to take SRS and determine whether they can be repurposed for motion capture, outside the laboratory settings, via a customized wearable sensor technology application for collecting real-time data. To collect real-time data, the researchers created a basic microcontroller-based prototype to collect data from four SRS at one time. For the Part I paper, this prototype consisted of an Arduino Uno R3, an ADS1116 16-bit analog to digital converter (ADC), and an array of four voltage divider circuits. The ADC module, being low-power, precise, and I2C-compatible, has an incorporated programmable gain amplifier (PGA) and a digital comparator, along with a wide operating supply range, making ADS1116 well suited for sensor measurement applications. The PGA offers an input range from ±256 mV to ±6.114 mV, enabling precise large- and small-signal measurements. The ADC module was thus able to detect small voltage changes, useful for increasing sensitivity to changes in stretched sensor lengths. This initial prototype gave the researchers an idea of how to collect measurements from multiple SRS. Due to the ADC and voltage divider circuits being connected via a breadboard, the researchers believed there was some noise introduced that would be mitigated via a custom printed circuit board (PCB) design. The researchers encountered some difficulty with measuring multiple sensors accurately as each SRS had a different electrical output without being stretched, despite being the same length. This led to the decision to use a voltage divider circuit to measure the SRS, as it could better handle a range of values among different SRS. When compared to the Agilent TM micro-ohm meter, the computing unit had an average percent error of 1.55% [19]. More details on the design decisions and implementation of this prototype can be found in [19].

4.2. Sock Prototype: Iteration I

Closing the Wearable Gap Part II tested the reliability of the SRS for foot movements by mounting the SRS on the foot-ankle complex of 10 participants in an NWB, sitting position. The purpose of the study was to examine various SRS placements and orientations by using four SRS to measure foot movements and validate against motion capture data [56]. The end goal of this research was to create a fully SRS-integrated, sensor-laden compression sock, which could be used for future trials. INV, EVR, PF, and DF were tested individually to choose appropriate POC for sensors configured to monitor each type of movement. Each participant wore a specialized compression sock from which the SRS could be tested consistently for all POCs for each participant [58,65].
The researchers needed to build mounts for the sensor to attach them to the socks, while still being able to easily shift the sensors to different POCs between trials. This led the researchers to use Velcro mounts, which would enable them to quickly remove and attach sensors to participants and provide consistency of placement and orientation across trials. The researchers had to use E6000 clear adhesive to attach the Velcro to the socks because the adhesive did not work well enough when the sensors were stretched, sometimes causing sensors to fall off the sock. Although the concept worked well enough for the experiment, the use of superglue and multiple Velcro mounts made the sock stiff and difficult to don and doff. As the analysis involved comparison with the 3D motion capture system, the researchers also needed to make sure the motion capture reflective clusters could be mounted over the sensors to monitor joint angles. Athletic straps were wrapped around the foot and shank for mounting the clusters. Figure 8 shows the initial attempts to use Velcro to attach the sensors to the sock to conduct the studies of placement and orientation configurations.
Closing the Wearable Gap Part III focused on validating the use of SRS during an unexpected and expected slip and trip perturbations to detect foot-ankle complex kinematics. The researchers only measured PF and DF along the sagittal plane for the data collection. One of the problems faced when performing the experiment with the sock prototype was the need for a stable enclosure to accommodate the SRS module. The athletic strap wrapped around the participant’s shank was used by the researchers as a mount for the sensor module and battery pack (shown in Figure 9). Since the study included a treadmill that induced the perturbations for the slip and trip, the jerking motion that occurred during the slip and trip would sometimes loosen the strap, and the researchers would have to remount the module.

4.3. Sock Prototype: Iteration II

For the gait study performance in Part IV, the researchers designed and 3D printed an enclosure to avoid the strap loosening issue for future experiments (Figure 10) [57]. The enclosure would house both the sensor module and the battery pack. The researchers designed the enclosure to include loops for the athletic strap to run through, allowing it to be easily mounted on the shank of the participant. This resolved the issue of the module falling or loosening during jerky movements. These arrangements, however, still had some disadvantages. There was an abundance of wiring from the sensors that had to be wrapped and tucked behind the athletic straps to avoid disruption to the participants during the trials. Adding to this, the Velcro, which was superglued to the socks, as described previously, created difficulty in donning and doffing of the sock, which resulted in damage to the socks. These problems led to the development of new methods of sensor mounting for future studies and a new prototype of the sock.

4.4. Sock Prototype: Iteration III/Current

The most recent iteration of the sock prototype addressed several problems with super gluing the Velcro and sensor mountings to the sock. As seen in Figure 11, the researchers utilized a hook-and-eye method for connecting the sensors to the sock. This made it easier to mount and detach the sensor from the sock as the Velcro would get attached to and sometimes damage the sock. A band was used to secure the sensors, prevent them from moving during participant trials, and make the SRS flush with the natural curvature of the ankle joint. Initially, the researchers used paper backing to attach the hooks on the socks, which, although useful, was not strong enough to withstand multiple movements caused during the tests and continuous donning and doffing of the sock. To attach the 3D printed enclosure to the sock, the researchers used button snaps. One-half of the snaps were attached to the case of the enclosure, and the second half was attached near the top of the sock. The hook and eye attachments, paper backing, and the button snaps were all hand-stitched onto the sock. The paper backing had been replaced by a woven cotton cloth, stiffened with fusible interfacing. Compared to the paper backing, the cotton fabric backing was even more durable and could withstand further movements and multiple participant tests. This cloth backing, on the top part of the sock, was sewn using a zigzag stitch on a sewing machine. The bottom backing was sewn on the sock by hand. The hooks were then sewn on the cloth backings by hand. The researchers agreed, as discussed previously, for the gait analysis of Part IV, to add pressure sensors to the sock prototype to automate the gait cycle notation. The researchers stitched a pocket at the bottom of the sock to attach these pressure sensors utilized in Part V [65] to the bottom of the foot, as shown in Figure 12. In addition, the cables/wire handling problems were resolved by sewing a covering on the socks, through which wires could be fed to the sensors to prevent tangling or bending. The pocket for pressure sensors, as well as the covers for wiring, was made of a cotton knit fabric.
When developing the SSTK equipment, intentional design must be at the forefront of the process for ease of use and practicality. The researchers were presented with the challenge of creating a new enclosure that would be both easy to disassemble and able to manage the excess wires without creating a potential hazard to the sensors. The computer-aided design (CAD) tool Autodesk Fusion 360 TM was used to build a model of the sensor board, as seen in Figure 13. This sensor board model was used to form the enclosure’s basic framework.
The cutouts were made for the wire connections, the power switch, and the snap buttons that would hold the enclosure on the sock. The edges of the enclosure were rounded for aesthetics and prevented the cable from rubbing against the edge of the box and potentially damaging the wire sheathing. A visualization of this portion is provided in Figure 14.
Stand-offs were then developed to support the sensor in the enclosure to keep it from shifting during participant movement. One of the challenges presented by the enclosure configuration was a simpler way of accessing the sensor when working in the laboratory while performing the trials. Using screws on all four corners to secure two sides of the enclosure together would make the process of opening the enclosure and accessing the sensors more tedious. A snap case concept was used to make the method of opening and closing the enclosure less difficult and enable smoother and faster access to the sensors. This was accomplished by creating a 45° extrusion on one-half of the case and a matching divot on the other half, with the extrusion being smaller to ensure that there were no fitment issues. This allowed for easy disassembly with no external tools required. Figure 15 provides a visual for this design.
The near-final case enclosure feature to mitigate all previous laboratory testing concerns was to develop a method for wire management. The wire management system was designed such that the wires could be wrapped or minimized depending on the necessary length needed for the participant. The wire management system, as shown in Figure 16, used two alignment holes and eight magnet slots to secure the cover. Pegs were used to align the cover with the holder, and an additional eight magnets were used to secure the cover to the holder. Lastly, all edges of the wire management system were smoothed using a fillet tool in the 3D design software to ensure no rough or sharp areas contacted the wires. Figure 16 features this casing in use along with its respective model design, while Figure 17 visualizes the differences in wire management between sock prototype iterations.
After lab testing, a few underlying issues with the design of the wire holder were identified. Being that each sensor has its own wire, the design of one large spool proved to be an issue as individual wires would become tangled when wrapping around a single spool. This overlapping would make the process of removing individual sensors nearly impossible, meaning that if one sensor were to be removed, all sensors would have to be removed from the sock. To combat this, smaller spools were made for each of the six sensor wires such that each wire had its own spool to wrap around. Each spool utilized a single magnet at the top for securing the wire holder cover coupled with the attracting magnet to prevent the wires from unspooling. This new system is shown in Figure 18.
In addition to the upgraded wire management system, a redesign of the sensor board resulted in a smaller iteration of the enclosure using similar methods to those shown in Figure 13, Figure 14 and Figure 15. Figure 19 visualizes the new enclosure and wire management system placed on a gridded mat for scale reference.
This enclosure and wire management system will be the iteration taken in the laboratory for prototype validation, as static and dynamic movements from Closing the Wearable Gap papers Part II and Part IV are reassessed.

4.5. Data Collection Graphical User Interface (GUI)

A software application has been written to interface with the hardware module in order to better sample the stretch sensor data as well as function as a tool for researchers and can be used during participant trials to view the data in real-time and review recorded data. This decision was made considering the relatively low and inconsistent sampling rate that occurred due to the off-the-shelf smartphone solution utilizing Bluetooth functionality. This new system was needed to support data collection from multiple modules simultaneously while being captured or sampled at a faster rate. The application was developed in Python 3 using the Qt5 library to create the GUI. This new GUI presents several features that will enable improvements in the data collection process for the researchers as it assists with automating certain tasks, such as labeling trials. The new feature set from the GUI includes the ability for the experimenter to assign names to individual device channels, preventing the mislabeling of data series. Furthermore, collected data is plotted both during and after the recording event, allowing researchers to immediately verify the successful execution of the trial. Finally, its modular architecture and open-source license allow support for any remote data capture device to be integrated into the software. Figure 20 shows an example of the GUI being used to visualize the data collection in real-time.

5. Discussion of Limitations
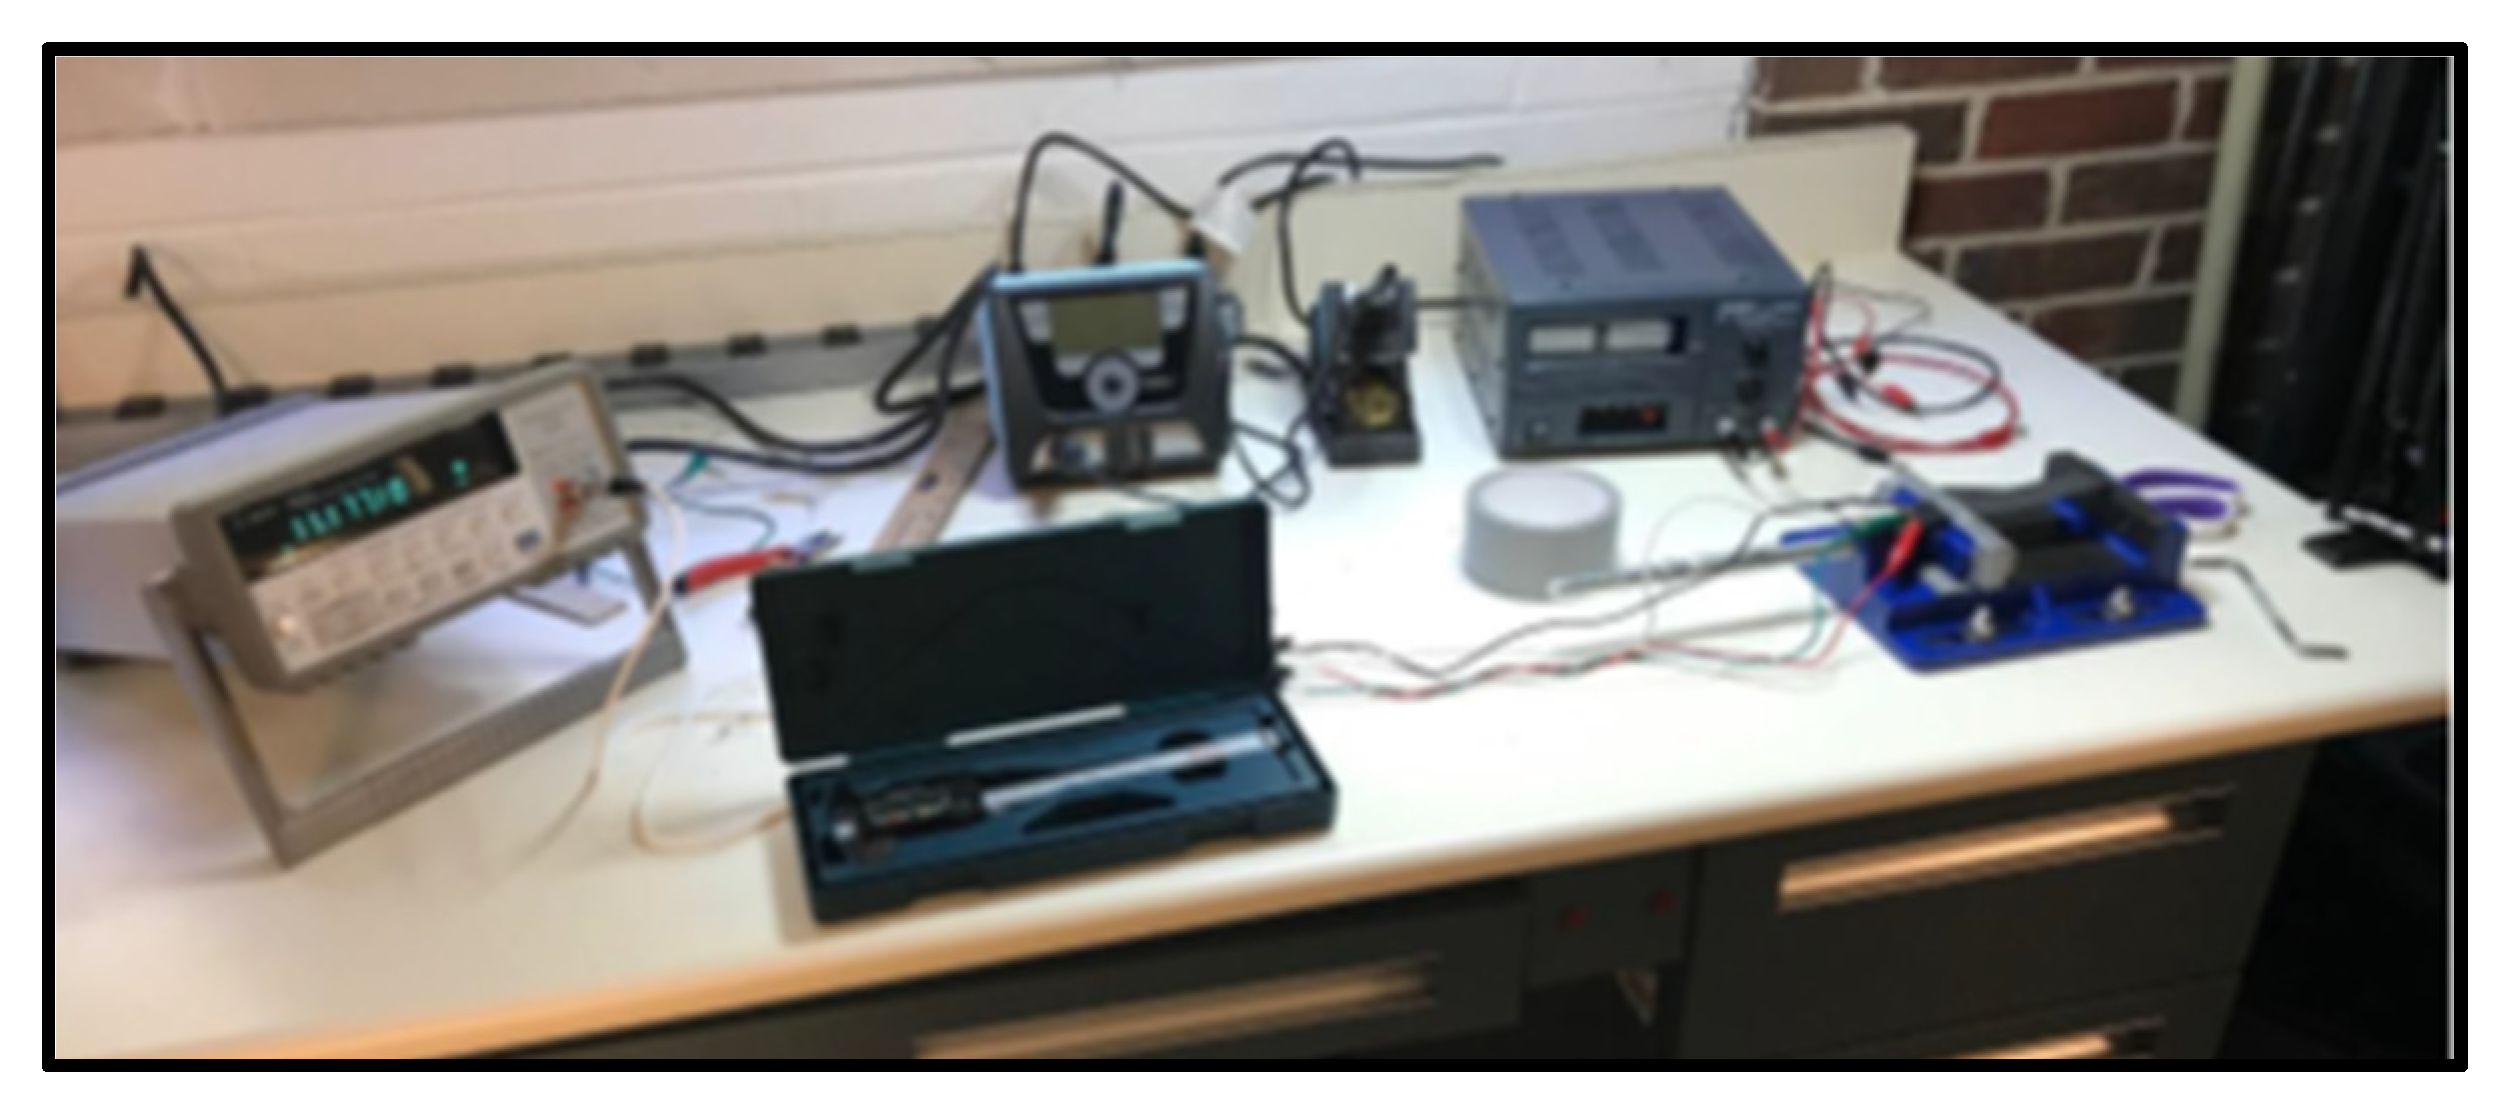
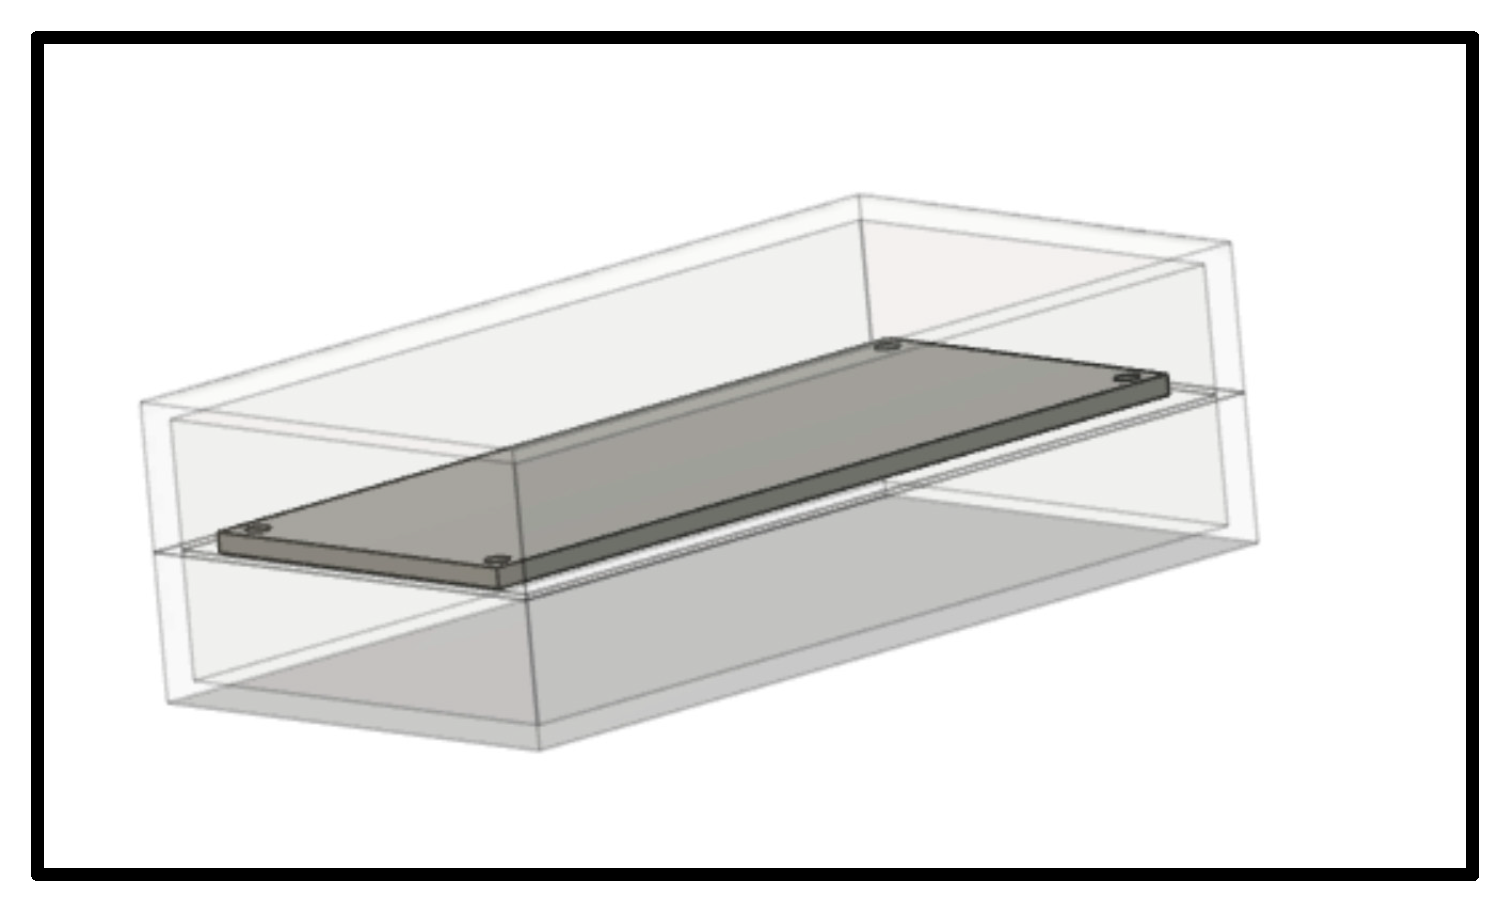
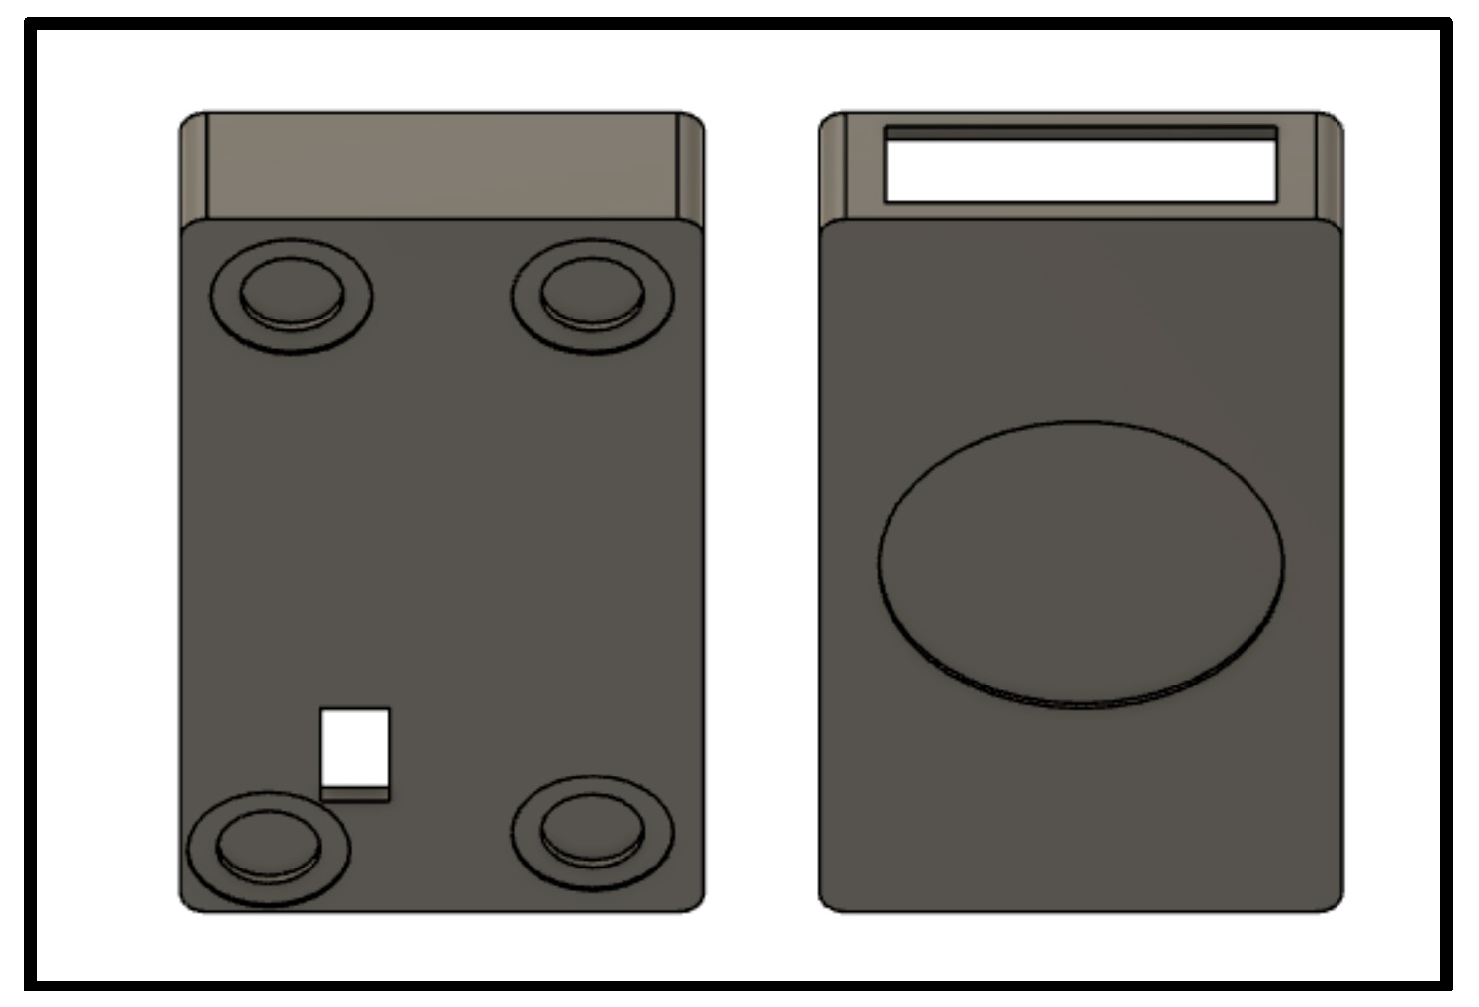
To the knowledge of the researchers performing this study, this research, where an SSTK was developed to aid SRS validation and wearable prototyping in a laboratory, is the first of its kind. As is documented in detail, several constraints were found during the series of investigative procedures and will be revisited.
(a)
The computing unit created for Closing the Wearable Gap Part I demonstrated minor noise levels, creating a variance in the electrical output at the time of data capture readings. The researchers recognized the importance of a breadboard during the initial design stages but suggested quickly moving to a PCB design.
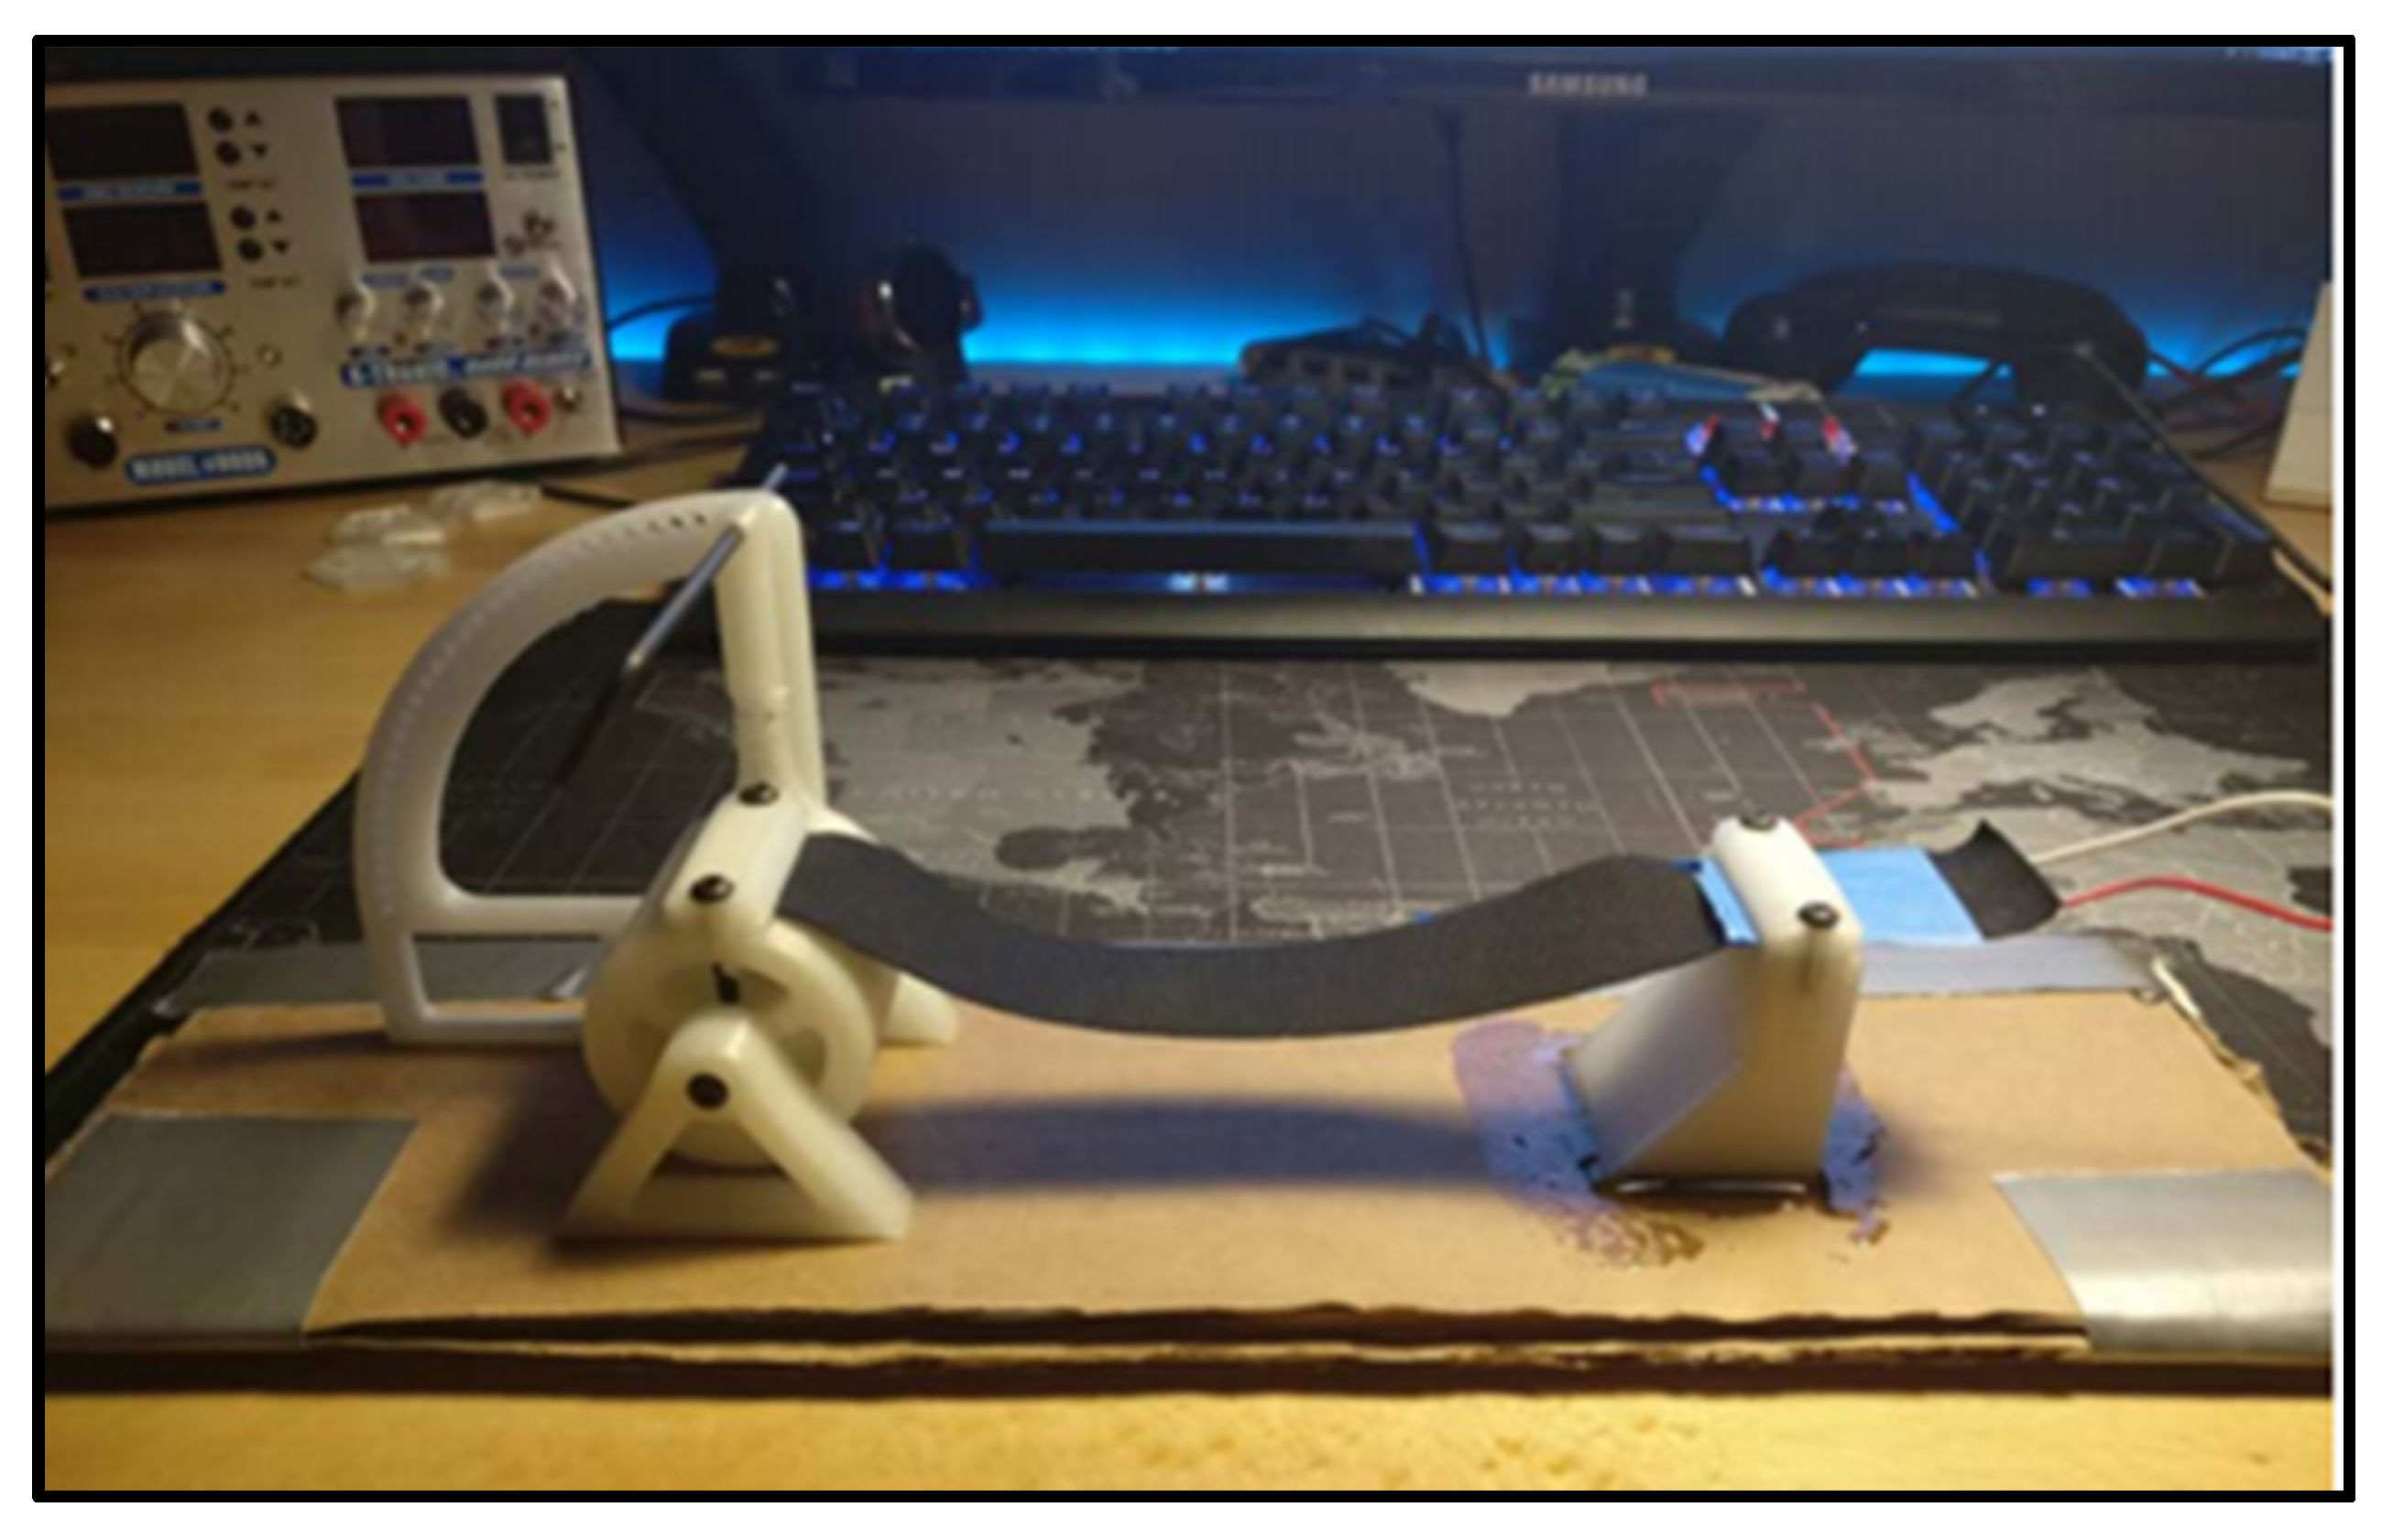
(b)
The original wooden ankle model that was developed from an earlier model published in the literature [66] presented limitations. The rubber flooring material used to manipulate the wooden ankle joint for INV and EVR movements was problematic for the researchers during the experiment. A considerable amount of force had to be applied to manipulate the model to certain joint angles, which was a data collection issue, as well as an ergonomic concern, affecting the wrists and hands of the researchers. The researchers suggested the use of a more flexible material that would be easier to move and manipulate for future model developments.
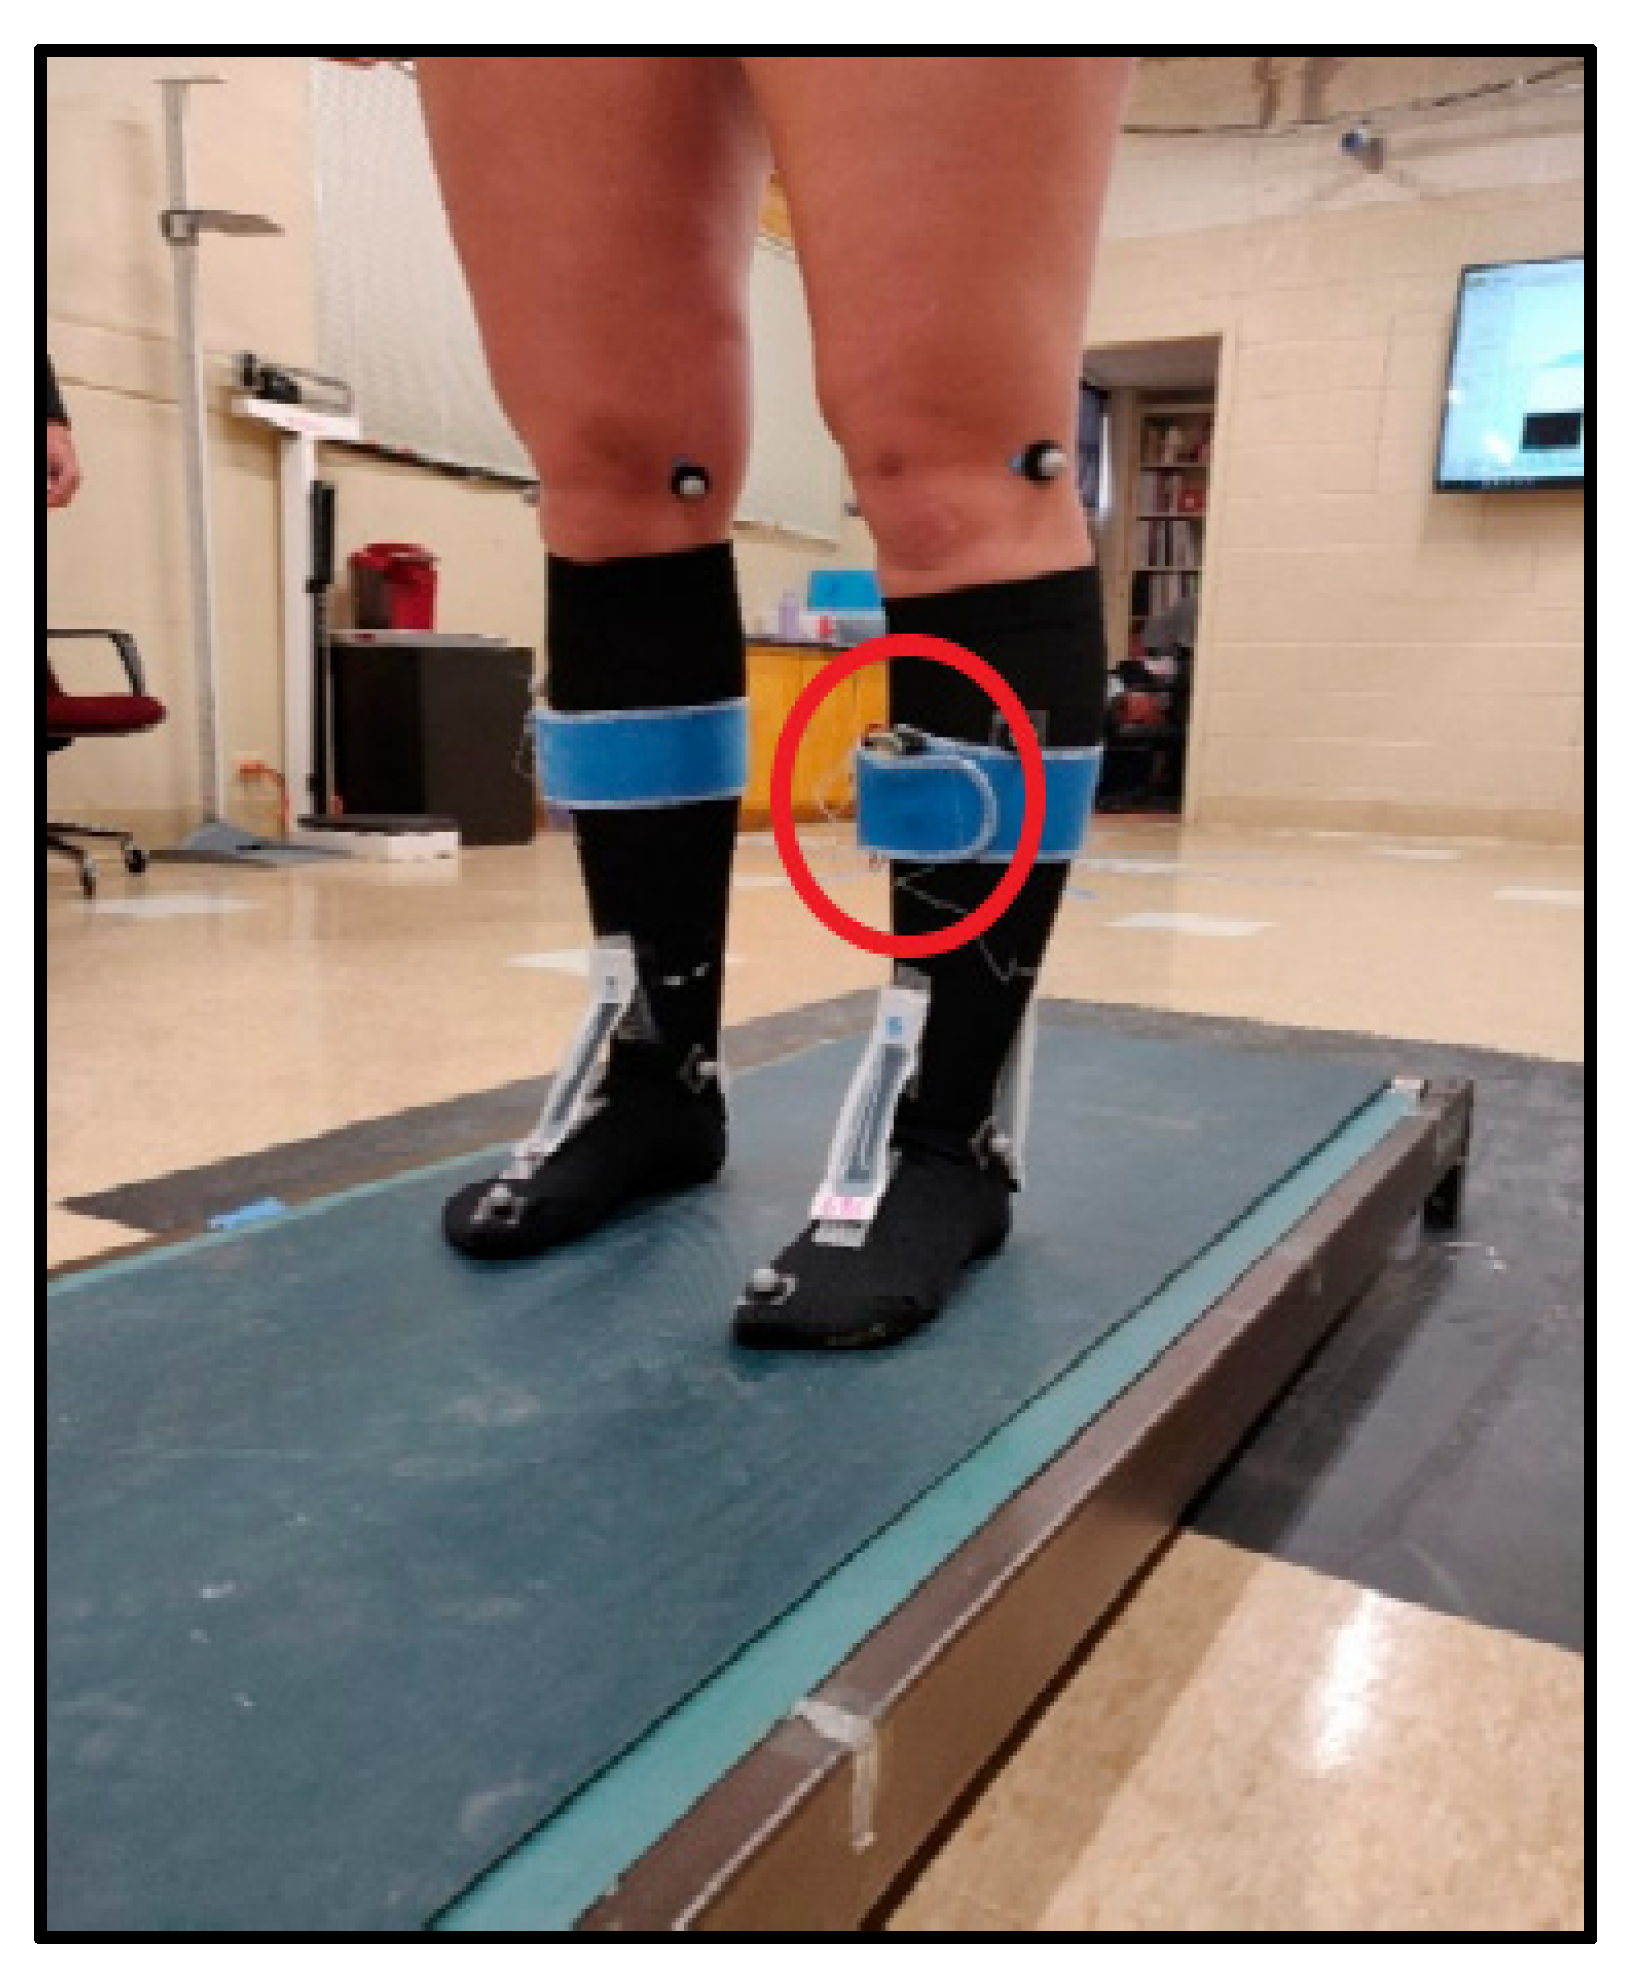
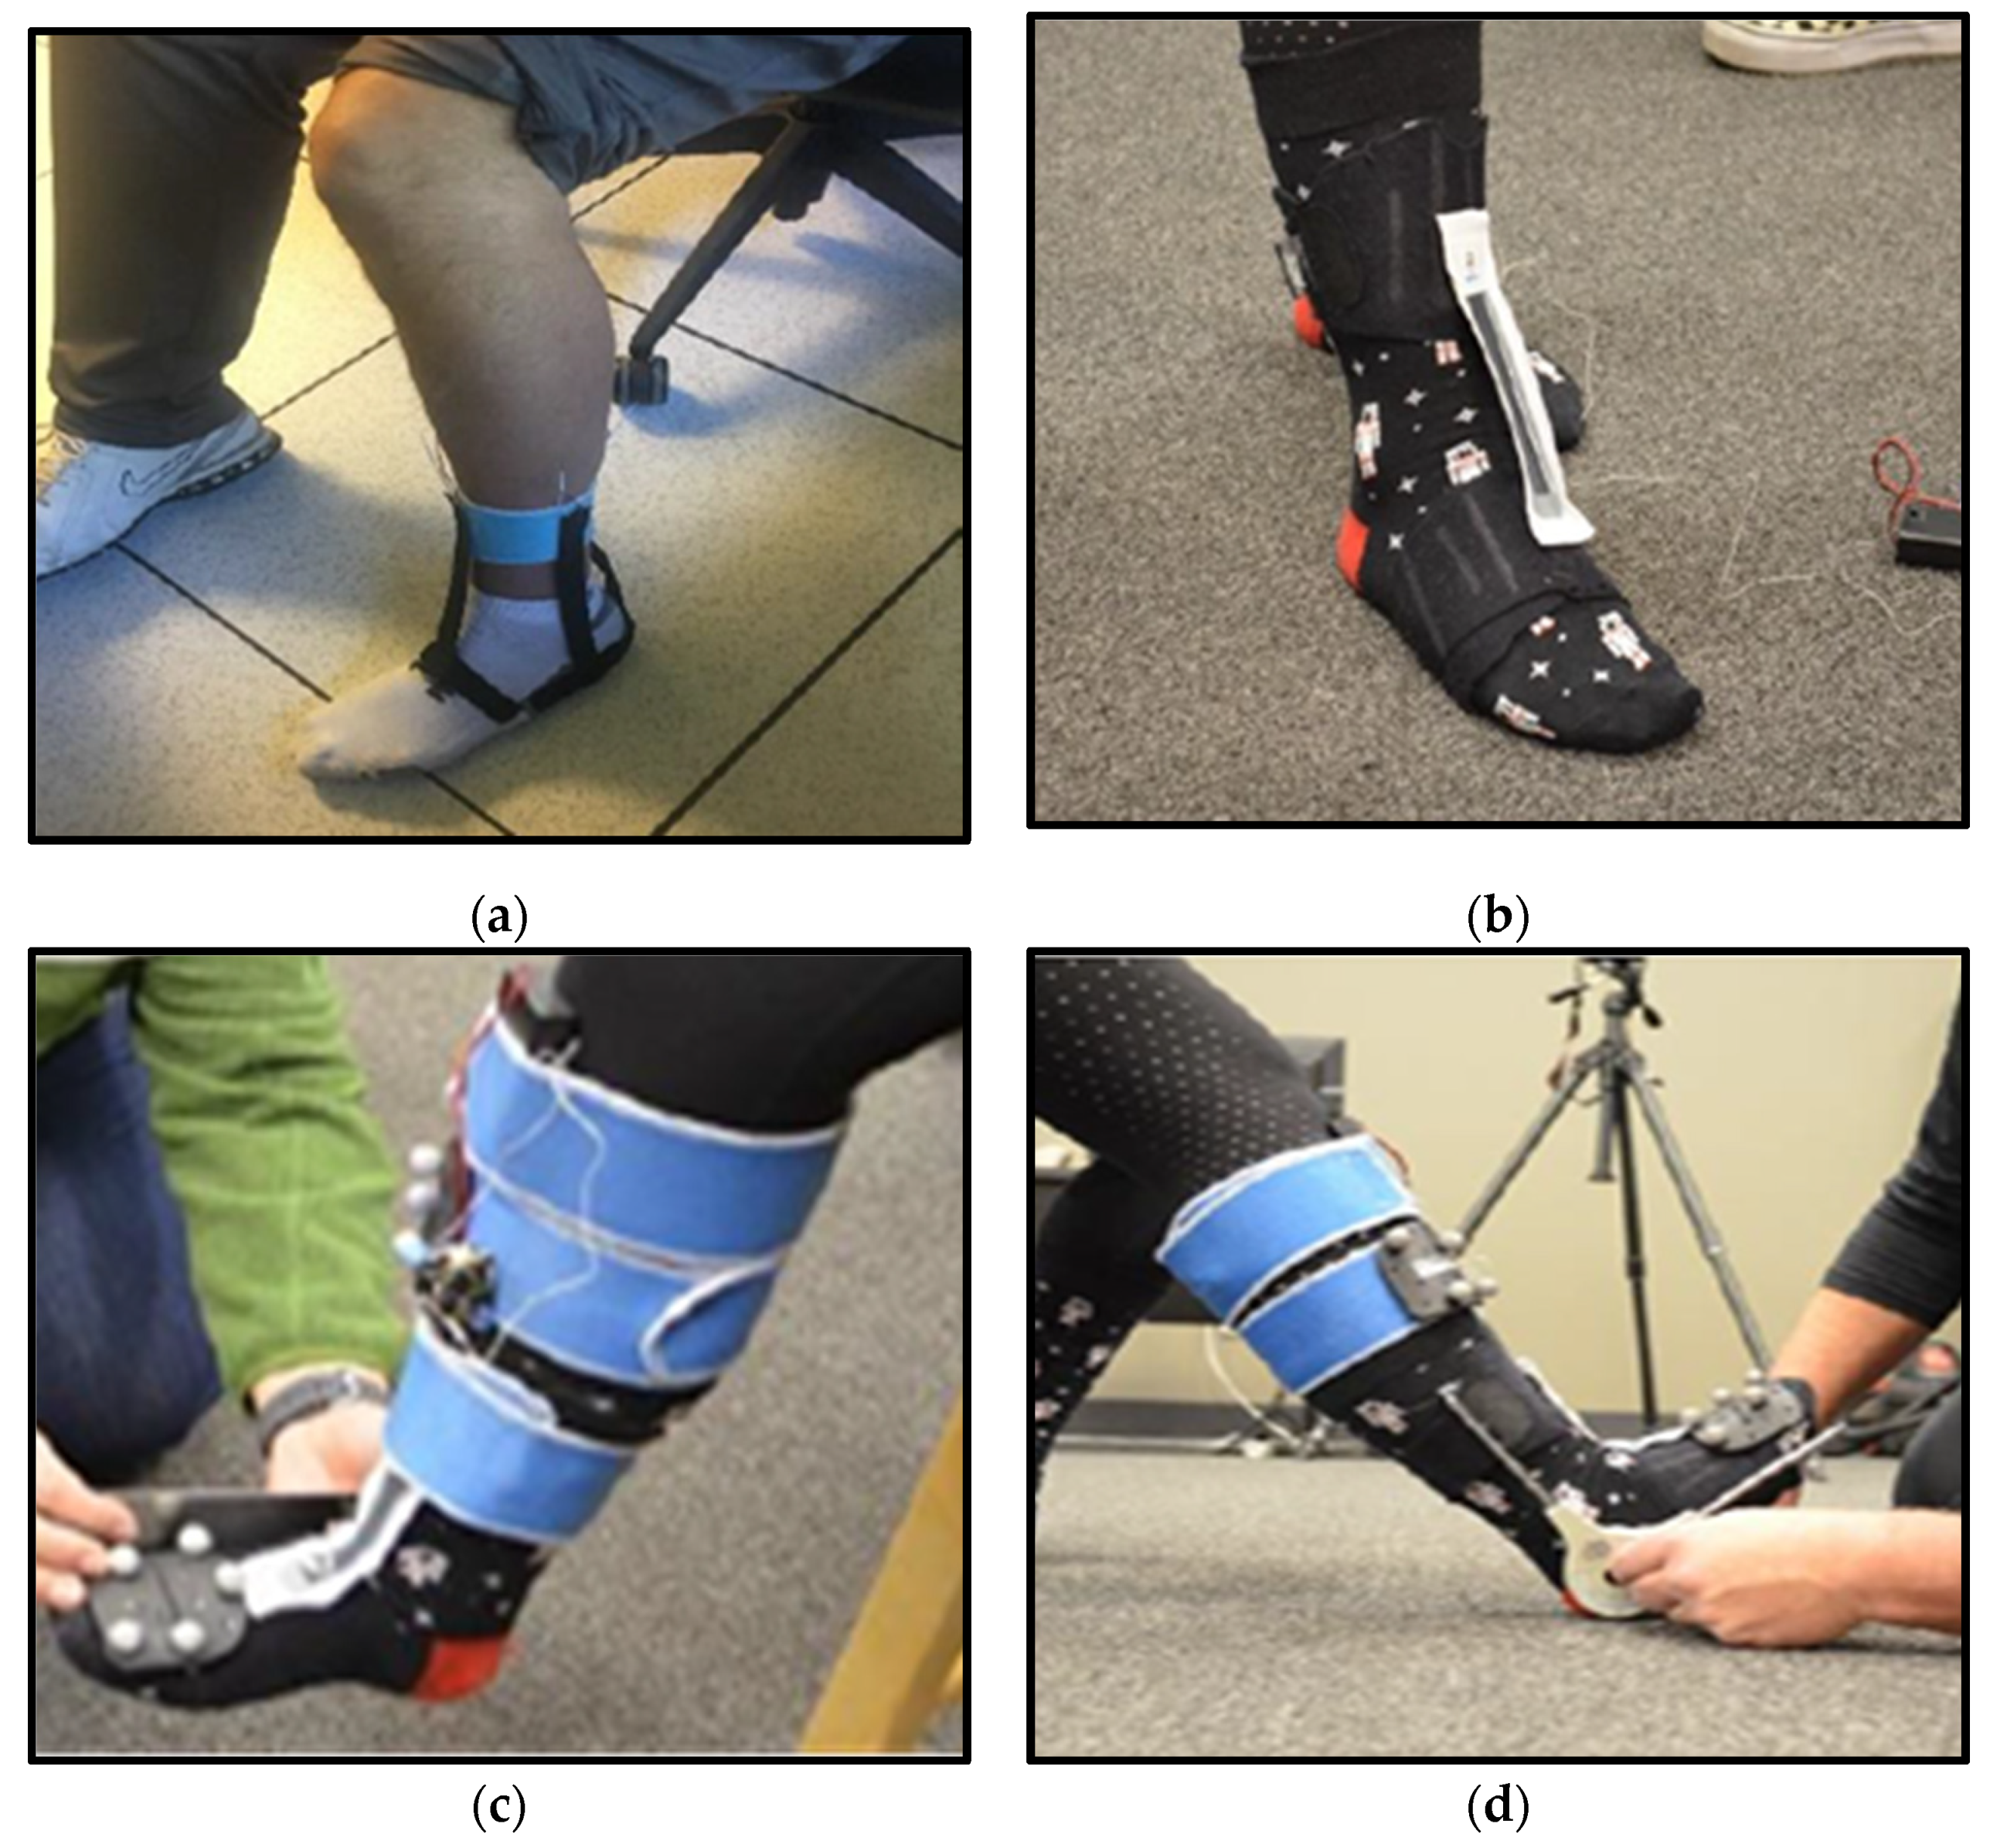
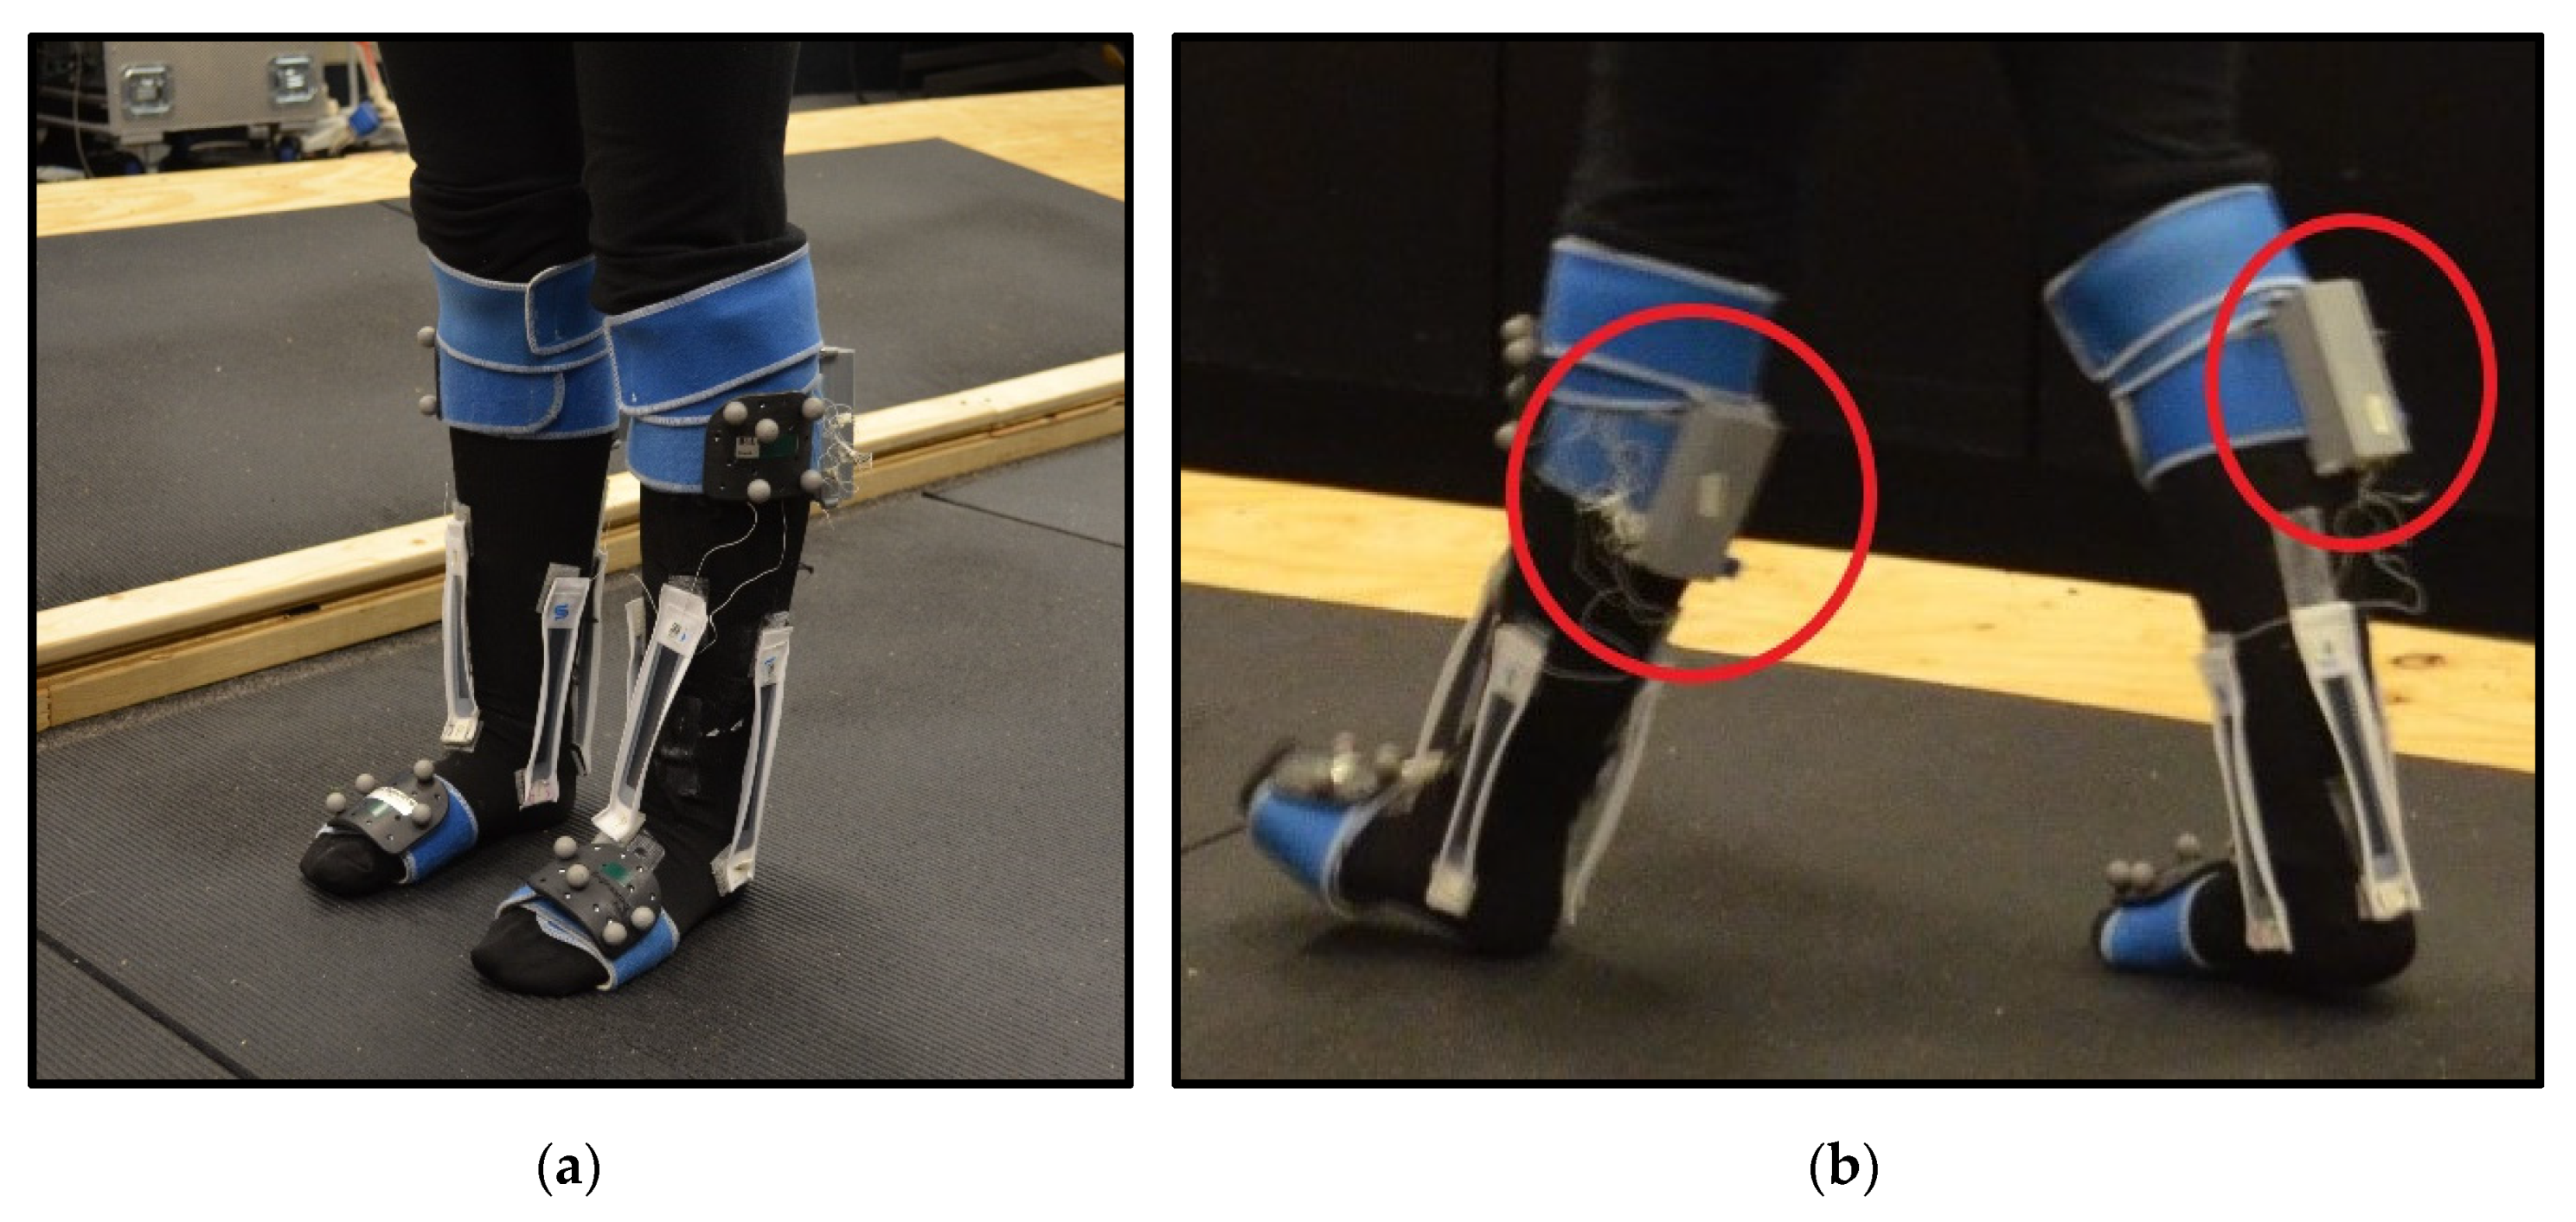
(c)
Variance in participant’s gait patterns and stride lengths while walking on the flat surface and TSP created a lot of additional data cleaning. Gait research conducted by David Winter shows that every individual’s gait cycle is unique [67]. This variation in gait patterns made it more challenging to create prediction models that could generalize data well. The researchers transitioned to using multivariable linear models to minimize the effect of coupled movements, influencing the outputs of the SRS as well as deep learning techniques to improve predictability. The new sock prototype discussed in Section 4.2 was developed as a reliable SRS mounting approach to maintain consistency between different SRS data collection sessions and to avoid possible pre-strain problems. Sock prototype Iteration III will ensure that SRS can be mounted on the sock fabric only in one manner. Therefore, the deep learning model can be successfully trained as there is experimental confidence that all participant data collection sessions for SRS measurements are repeatable and reliable. Furthermore, deep learning needs a vast amount of data to properly train a model. To collect more data to train the deep learning algorithms, conducting longer trials to collect a higher number of gait cycles will be essential.
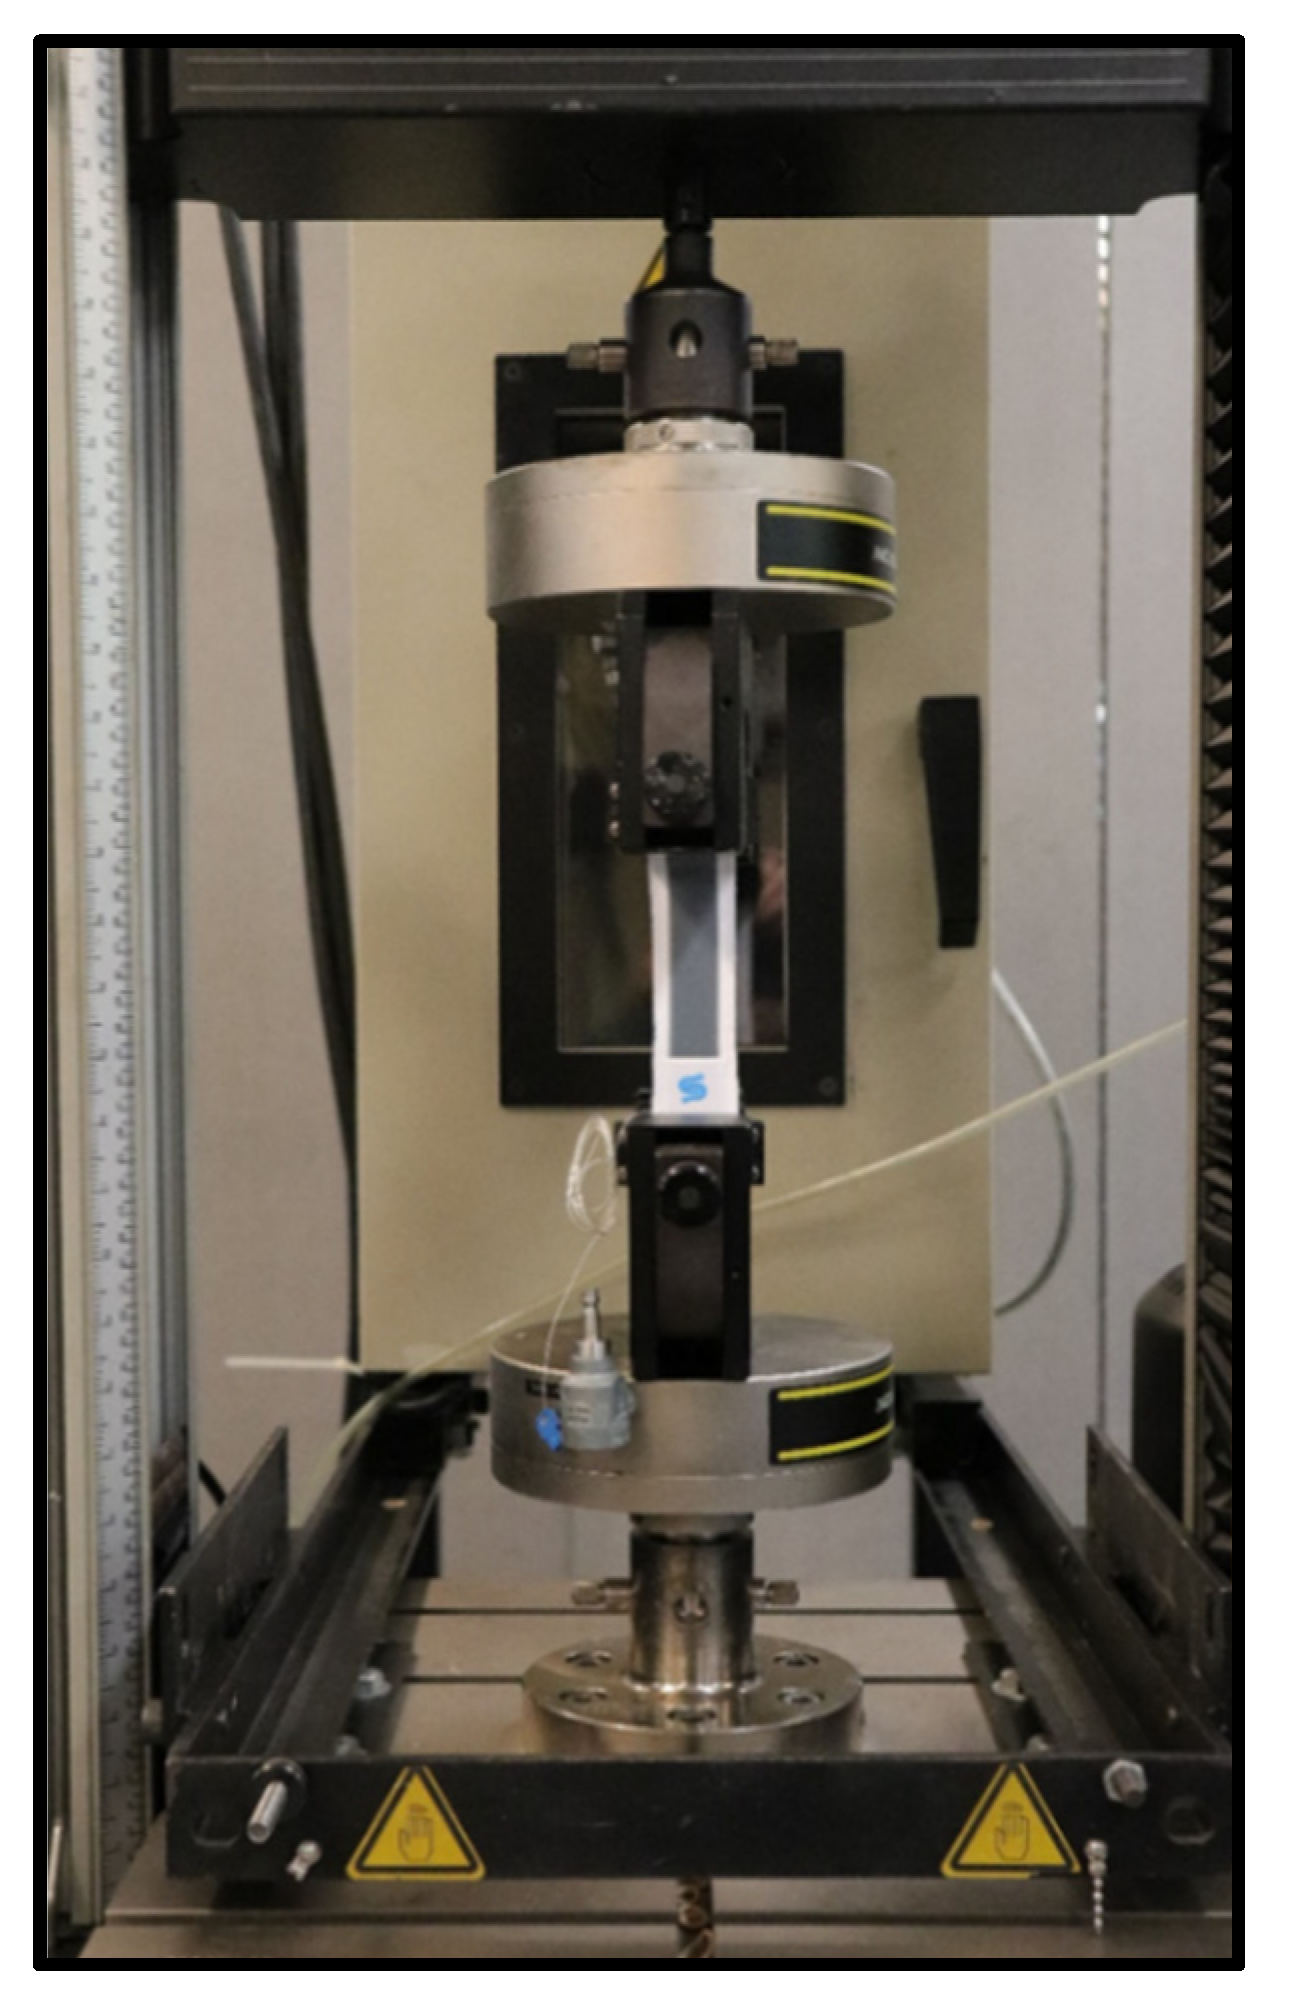
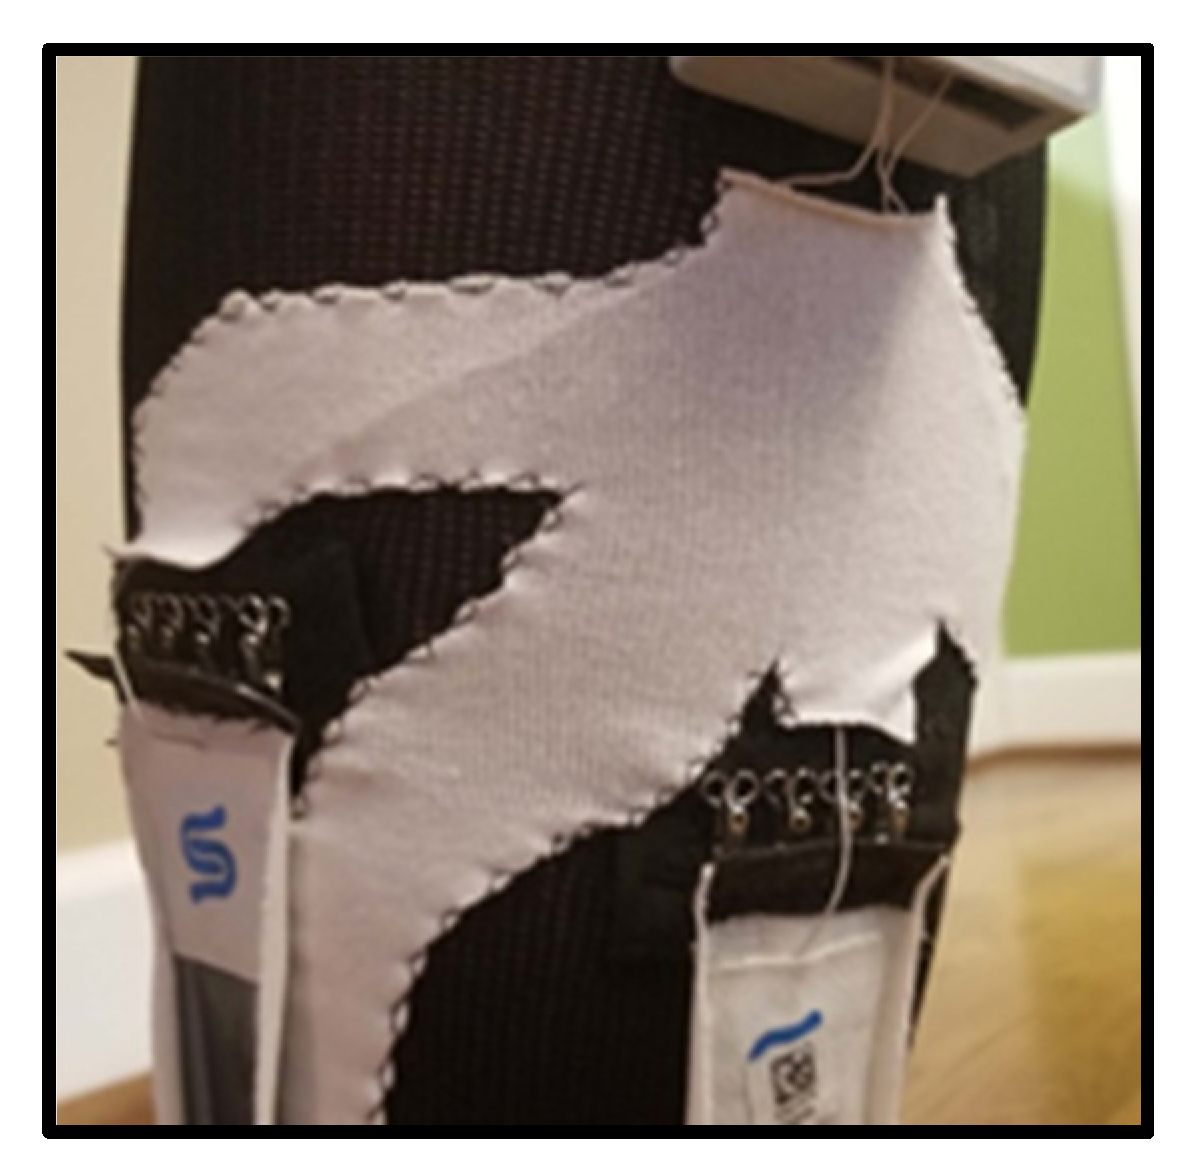
(d)
During the many initial linearity studies conducted by the researchers, numerous sensors were broken at the contact point after completing several measurement cycles while testing them on the drill vise fixture. Berlin et al. indicated that the conductive fibers might have mechanical properties somewhat different from those of normal textile fibers, causing them to react differently to deformation, bending, and extension. Chemical effects should also be considered. Because of certain deformations, gradual yet steady fiber migration eventually causes the SRS to crack at the point of contact [68]. Thus, depending upon the fiber type and fabric structure, having a reliable contact point was found to be critically important. Further, excellent flexibility and stretchability are crucial components that can provide monitoring systems with the ability to continuously track the human body’s physiological signals without being invasive. For this, researchers quickly found that it is necessary to consider the stretchability of the sensors based on the context of the area of research and the joint upon which the SRS is to be mounted. Most of the manufacturers provide a datasheet, indicating that the sensor can be stretched up to a certain proportion of its original length. Understanding the physical limitations of sensors became required learning for new members of the research team prior to experimentation.
(e)
The researchers used resistance-based SRS for Closing the Wearable Gap Part I, whereas capacitance-based sensors have been used to-date for the remaining Closing the Wearable Gap paper studies. Before swapping from resistance-based SRS to capacitance-based SRS, several factors were considered. The electrical properties of the sensors under applied strain were a primary reason for the change in the SRS type. Hysteresis is important to consider when using the sensor in real-life applications as it results in an increase in a change in the output of the SRS at rest, making it more difficult to predict with a model [69]. An important lesson learned by the experimenters is the desire for consistent and common resting resistances, that is when the SRS is not stretched. While all the sensors were linear in their movement-to-stretch output, not all sensors had comparable resistance values at rest. When developing a reliable model, variability in the resting resistance is not preferred. In this case, there were sensors that were the same length but had various resting resistances. To overcome this issue, the researchers suggested normalizing the data such that relative change is measured as opposed to absolute change. Nevertheless, the issue of resting resistance could still be considered problematic when reproducibility and consistency of sensors are desired, as they make circuit design more challenging. Resistivity itself is often susceptible to different environmental factors, such as temperature and damage [70]. Due to the variance in resistance, a flexibly designed circuit was needed, which would add more complexity to the computing unit’s programming to determine the resting resistance for the sensors. Thus, an SRS having consistent resting resistance with known minimal hysteresis is preferred when capturing complex joint movements.
(f)
Based on other literature in the field, resistive sensors possess strong sensitivity and excellent sensing efficiency. However, they suffer from poor long-term stability and linearity as well as substantial signal hysteresis. Alternatively, studies have suggested that capacitive sensors have better stability, lower hysteresis, and high stretchability [69,70,71,72]. One of the other factors to be addressed during the preliminary analysis was whether a commercial-off-the-shelf (COTS) product existed that could already measure the SRS. Having a COTS sensor module that supports Bluetooth and connects to a smartphone companion application for real-time data collection can help save a great deal of time when carrying out preliminary studies. It is also important to note the number of sensors a module can record simultaneously when measurements of multiple movements are desired, as well as the supported sampling rate and whether that sampling rate is consistent. There are some companies that have fully developed software applications with various raw data streaming functionalities, while others give basic demonstrations.

6. Future Scope

Moving forward, a new iteration of experiments need to be performed to validate the most recent implementations of the hardware, sock prototype, and data analysis software. To collect a dataset that is more suitable for deep learning analysis, a new gait study will be conducted where participants will walk on a treadmill, while SRS and motion capture data are collected for longer periods of time. This will strengthen the accuracy of the deep learning models as there will be a stronger presence of patterns in the data for the models to analyze. This will also help determine the efficacy of the most recent sock prototype. Additionally, the sock prototype will be evaluated while shoes are worn to investigate how the models are affected during gait.
For sensors to be cost-effective and practical for everyday use, the sensors must be fatigue-resistant. Previous studies have assessed the durability of stretch sensors via cyclic tensile testing; however, the testing methodologies employed and the reported results are considerably varied, making it difficult to make direct comparisons regarding the efficacy of the sensors. Additionally, many of the studies focus only on the low-cycle fatigue (LCF) properties of the sensors, but for physiological studies, such as gait analysis, high-cycle fatigue (HCF) data are needed. To assess the fatigue life of the stretch sensors used in the sock, the sensors will be subjected to quasi-static, LCF, and HCF tensile tests. During each test, the electrical output of the sensor will also be assessed. The information gleaned from the tests will help to provide a more complete picture of the true durability of the sensors.
To perform the SRS fatiguing tests on an Instron ™ tension and compression machine (Instron, Norwood, MA, USA), sensor clamps have been developed to hold a set of SRS for long-term, many iteration fatigue testing. They are designed using an extrusion and divot method to increase surface area and clamp force on the sensors to prevent any kind of slippage over the many hours, days, or even weeks of continuous LCF and HCF testing. One side of the case utilizes a 45° extrusion, while the other mimics the opposing side with a divot. The two sides of the clamps are secured using screws to ensure that the sensor is secured effectively (Figure 21). Preliminary testing has already been completed to confirm that the sensor clamps work effectively with the Instron TM machine, and extensive data collection will be performed in the future for fatigue testing validation. The setup for the experiment is shown in Figure 22.
Finally, as the mounting method for sensors on the ankle becomes finalized, further research can be done using stretch sensors on other parts of the body while undergoing other human activities. One of the next steps for this would include using stretch sensors to model kinematics at the knee joint while a participant is riding a stationary bicycle. Other activities will include collecting data outside of the laboratory environment in athletic settings, such as basketball. In terms of conducting research with other types of SRS, future work will need to be done to create a module that is sensor-agnostic with a daughter board designed for each type of SRS (based on electrical properties and connection-type) that will connect to a primary data collection module.

7. Conclusions

The NSF I-Corps training process has taught the Athlete Engineering research team the criticality of capturing requirements from the end-user practitioner, which, in this case, is the S&C coach, athletic trainer, or any other practitioner charged with making health and safety decisions that keep all athlete types protected during improvement-based training. During a series of interviews, S&C coaches have explained the importance of having technology solutions that exist outside of the laboratory while being equally as trustworthy and effective in their data collection. IMU-based wearables close this gap somewhat, but, due to their drift and other inconsistency issues, SRS provides an option that may further “Close the Wearable Gap”, as has been presented in the researchers’ ongoing paper series. To utilize SRS, another gap has to be closed, and that is the creation of SSTK solutions that would provide repeatability and reliability to the testing and validation of SRS. The research team has gained a great amount of knowledge regarding SRS and how to best evaluate their ability to model kinematic data. Several testing apparatuses have been constructed as part of the SSTK to validate the SRS against direct stretch and stretch-related movements to simulated and actual foot movements. A suite of analysis scripts has been developed in R and MATLAB to preprocess and analyze SRS and motion capture data by means of linear and multi-linear regression as well as deep learning techniques. Further, several iterations of a sock prototype have been constructed, where the researchers gradually improve the methods for mounting SRS to socks for participant trials. The researchers now look towards conducting a new series of experiments, utilizing a new hardware prototype, software GUI, and sock mounting technique, to collect more robust datasets for further validation and progression of SRS design in modeling human kinetic and kinematic data.

Author Contributions

Conceptualization, P.T., D.S., R.F.B.V., and J.E.B.; Data curation, D.S., W.C., P.P., E.P., C.M., S.D., A.T., and T.L.; Formal analysis, D.S., W.C., S.D., R.F.B.V., J.E.B., H.C., A.K., T.L., B.K.S., and R.K.P.; Funding acquisition, R.F.B.V., J.E.B., H.C., A.K., B.K.S., and R.K.P.; Investigation, P.T., D.S., W.C., P.P., E.P., C.M., S.D., A.T., K.P., L.C., R.F.B.V., J.E.B., H.C., A.K., T.L., B.K.S., and R.K.P.; Methodology, P.T., D.S., R.F.B.V., J.E.B., and H.C.; Project administration, P.T., D.S., and R.F.B.V.; Resources, R.F.B.V., J.E.B., H.C., A.K., T.L., B.K.S., and R.K.P.; Software, D.S., W.C., P.P., and S.D.; Supervision, D.S.; Validation, D.S., W.C., P.P., E.P., C.M., A.T., R.F.B.V., J.E.B., H.C., A.K., T.L., B.K.S., and R.K.P.; Visualization, P.T., D.S., W.C., E.P., C.M., L.C., and R.F.B.V.; Writing—original draft, P.T., D.S., W.C., E.P., C.M., S.D., A.T., K.P., and R.F.B.V.; Writing—review and editing, P.T., D.S., R.F.B.V., J.E.B., H.C., A.K., T.L., B.K.S., and R.K.P. All authors have read and agreed to the published version of the manuscript.

Funding

This research was funded by the National Science Foundation under NSF 18511—Partnerships for Innovation award number 1,827,652.

Acknowledgments

We thank the anonymous reviewers for their helpful suggestions for improving the paper.

Conflicts of Interest

The authors declare no conflict of interest.

References

  1. Burch, R.F.; Strawderman, L.; Piroli, A.; Chander, H.; Tian, W.; Murphy, F. The importance of baselining division 1 football athlete jumping movements for performance, injury mitigation, and return to play. In Proceedings of the Advances in Intelligent Systems and Computing, Berkeley, CA, USA, 24–28 July 2009; Springer: Berlin/Heidelberg, Germany; 970, pp. 332–344. [Google Scholar]
  2. Luczak, T.; Burch, R.; Lewis, E.; Chander, H.; Ball, J. State-of-the-art review of athletic wearable technology: What 113 strength and conditioning coaches and athletic trainers from the USA said about technology in sports. Int. J. Sports Sci. Coach. 2019, 15, 26–40. [Google Scholar] [CrossRef]
  3. Coyle, S.; Morris, D.; Lau, K.-T.; Diamond, D.; Moyna, N. Textile-based wearable sensors for assisting sports performance. In Proceedings of the 2009 Sixth International Workshop on Wearable and Implantable Body Sensor Networks, Berkeley, CA, USA, 3–5 June 2009; pp. 307–311. [Google Scholar] [CrossRef] [Green Version]
  4. Carmines, E.G.; Zeller, R.A. Validity. In Reliability and Validity Assessment; Michael, S.L.-B., Ed.; SAGE Publications, Inc.: Iowa City, IA, USA, 1979; pp. 17–26. [Google Scholar]
  5. Van Der Kruk, E.; Reijne, M.M. Accuracy of human motion capture systems for sport applications; state-of-the-art review. Eur. J. Sport Sci. 2018, 18, 806–819. [Google Scholar] [CrossRef]
  6. Pueo, B.; Jimenez-Olmedo, J.M. Application of motion capture technology for sport performance analysis. Retos Nuevas Tend. Educ. Física Deporte Recreación 2017, 32, 241–247. [Google Scholar]
  7. Amjadi, M.; Kyung, K.-U.; Park, I.; Sitti, M. Stretchable, skin-mountable, and wearable strain sensors and their potential applications: A review. Adv. Funct. Mater. 2016, 26, 1678–1698. [Google Scholar] [CrossRef]
  8. Fantozzi, S.; Giovanardi, A.; Magalhães, F.A.; Di Michele, R.; Cortesi, M.; Gatta, G. Assessment of three-dimensional joint kinematics of the upper limb during simulated swimming using wearable inertial-magnetic measurement units. J. Sports Sci. 2015, 34, 1073–1080. [Google Scholar] [CrossRef] [PubMed]
  9. Krüger, A.; Edelmann-Nusser, J. Biomechanical analysis in freestyle snowboarding: Application of a full-body inertial measurement system and a bilateral insole measurement system. Sports Technol. 2009, 2, 17–23. [Google Scholar] [CrossRef]
  10. Koda, H.; Sagawa, K.; Kuroshima, K.; Tsukamoto, T.; Urita, K.; Ishibashi, Y. 3D measurement of forearm and upper arm during throwing motion using body mounted sensor. J. Adv. Mech. Des. Syst. Manuf. 2010, 4, 167–178. [Google Scholar] [CrossRef] [Green Version]
  11. Bosch, S.; Shoaib, M.; Geerlings, S.; Buit, L.; Meratnia, N.; Havinga, P. Analysis of indoor rowing motion using wearable inertial sensors. In Proceedings of the 10th EAI International Conference on Body Area Networks, Sydney, Australia, 28–30 September 2015. [Google Scholar]
  12. Nakazato, K.; Scheiber, P.; Müller, E. Comparison between the force application point determined by portable force plate system and the center of pressure determined by pressure insole system during alpine skiing. Sports Eng. 2013, 16, 297–307. [Google Scholar] [CrossRef]
  13. Shepherd, J.B.; Giblin, G.; Pepping, G.-J.; Thiel, D.V.; Rowlands, D. Development and validation of a single wrist mounted inertial sensor for biomechanical performance analysis of an elite netball shot. IEEE Sens. Lett. 2017, 1, 1–4. [Google Scholar] [CrossRef]
  14. Akins, J.S.; Heebner, N.R.; Lovalekar, M.; Sell, T.C. Reliability and validity of instrumented soccer equipment. J. Appl. Biomech. 2015, 31, 195–201. [Google Scholar] [CrossRef]
  15. Blair, S.; Duthie, G.; Robertson, S.; Hopkins, W.; Ball, K.A. Concurrent validation of an inertial measurement system to quantify kicking biomechanics in four football codes. J. Biomech. 2018, 73, 24–32. [Google Scholar] [CrossRef] [PubMed]
  16. Philpott, L.K.; Weaver, S.; Gordon, D.; Conway, P.P.; West, A.A. Assessing wireless inertia measurement units for monitoring athletics sprint performance. IEEE Sens. 2014 Proc. 2014, 2199–2202. [Google Scholar] [CrossRef] [Green Version]
  17. Heikenfeld, J.; Jajack, A.; Rogers, J.; Gutruf, P.; Tian, L.; Pan, T.; Li, R.; Khine, M.; Wang, J.; Kim, J.; et al. Wearable sensors: Modalities, challenges, and prospects. Lab A Chip 2018, 18, 217–248. [Google Scholar] [CrossRef] [PubMed] [Green Version]
  18. Tang, S.L.P. Wearable sensors for sports performance. In Textiles for Sportswear; Elsevier: Amsterdam, The Netherlands, 2015; pp. 169–196. [Google Scholar]
  19. Luczak, T.; Saucier, D.; Burch, V.R.F.; Ball, J.; Chander, H.; Knight, A.; Wei, P.; Iftekhar, T. Closing the wearable gap: Mobile systems for kinematic signal monitoring of the foot and ankle. Electronics 2018, 7, 117. [Google Scholar] [CrossRef] [Green Version]
  20. Jamwal, P.K.; Hussain, S.; Tsoi, Y.H.; Ghayesh, M.H.; Xie, S.Q. Musculoskeletal modelling of human ankle complex: Estimation of ankle joint moments. Clin. Biomech. 2017, 44, 75–82. [Google Scholar] [CrossRef] [Green Version]
  21. Chinn, L.; Hertel, J. Rehabilitation of ankle and foot injuries in athletes. Clin. Sports Med. 2010, 29, 157–167. [Google Scholar] [CrossRef] [PubMed] [Green Version]
  22. Hertel, J. Functional anatomy, pathomechanics, and pathophysiology of lateral ankle instability. J. Athl. Train. 2002, 37, 364–375. [Google Scholar]
  23. Amtmann, J.; Hegg, S. The industrial athlete and flexibility. Prim. Health Open Access 2016, 6. [Google Scholar] [CrossRef]
  24. Sevier, T.L. The industrial athlete? Occup. Environ. Med. 2000, 57, 285. [Google Scholar] [CrossRef]
  25. Chen, S.; Wei, Y.; Wei, S.; Lin, Y.; Liu, L. Ultrasensitive cracking-assisted strain sensors based on silver nanowires/graphene hybrid particles. ACS Appl. Mater. Interfaces 2016, 8, 25563–25570. [Google Scholar] [CrossRef]
  26. Din, S.; Xu, W.; Cheng, L.K.; Dirven, S. A stretchable multimodal sensor for soft robotic applications. IEEE Sens. J. 2017, 17, 5678–5686. [Google Scholar] [CrossRef]
  27. Jiao, Y.; Young, C.W.; Yang, S.; Oren, S.; Ceylan, H.; Kim, S.; Gopalakrishnan, K.; Taylor, P.C.; Dong, L. Wearable graphene sensors with microfluidic liquid metal wiring for structural health monitoring and human body motion sensing. IEEE Sens. J. 2016, 16, 7870–7875. [Google Scholar] [CrossRef]
  28. Lee, H.; Cho, J.; Kim, J. Printable skin adhesive stretch sensor for measuring multi-axis human joint angles. In Proceedings of the 2016 IEEE International Conference on Robotics and Automation (ICRA), Stockholm, Sweden, 16–21 May 2016; pp. 4975–4980. [Google Scholar]
  29. Liao, X.; Song, W.; Zhang, X.-Y.; Huang, H.; Wang, Y.; Zheng, Y. Directly printed wearable electronic sensing textiles towards human–machine interfaces. J. Mater. Chem. C 2018, 6, 12841–12848. [Google Scholar] [CrossRef]
  30. Park, Y.-L.; Chen, B.-R.; Wood, R.J. Design and fabrication of soft artificial skin using embedded microchannels and liquid conductors. IEEE Sens. J. 2012, 12, 2711–2718. [Google Scholar] [CrossRef]
  31. Kramer, R.K.; Majidi, C.; Sahai, R.; Wood, R.J. Soft curvature sensors for joint angle proprioception. In Proceedings of the 2011 IEEE/RSJ International Conference on Intelligent Robots and Systems, Francisco, CA, USA, 25–30 September 2011; pp. 1919–1926. [Google Scholar]
  32. Yi, F.; Lin, L.; Niu, S.; Yang, P.K.; Wang, Z.; Chen, J.; Zhou, Y.; Zi, Y.; Wang, J.; Liao, Q.; et al. Stretchable-rubber-based triboelectric nanogenerator and its application as self-powered body motion sensors. Adv. Funct. Mater. 2015, 25, 3688–3696. [Google Scholar] [CrossRef]
  33. Shen, Z.; Yi, J.; Li, X.; Mark, L.H.P.; Hu, Y.; Wang, Z. A soft stretchable bending sensor and data glove applications. In Proceedings of the 2016 IEEE International Conference on Real-time Computing and Robotics (RCAR), Angkor Wat, Cambodia, 6–9 June 2016; pp. 88–93. [Google Scholar]
  34. Chander, H.; Burch V, R.F.; Talegaonkar, P.; Saucier, D.; Luczak, T.; Ball, J.; Turner, A.; Arachchige, S.N.K.K.; Carroll, W.; Smith, B.K.; et al. Wearable stretch sensors for human movement monitoring and fall detection in ergonomics. Int. J. Environ. Res. Public Health 2020, 17, 3554. [Google Scholar] [CrossRef]
  35. Giorgino, T.; Tormene, P.; Lorussi, F.; De Rossi, D.; Quaglini, S. Sensor evaluation for wearable strain gauges in neurological rehabilitation. IEEE Trans. Neural Syst. Rehabil. Eng. 2009, 17, 409–415. [Google Scholar] [CrossRef]
  36. Helmer, R.; Farrow, D.; Ball, K.A.; Phillips, E.; Farouil, A.; Blanchonette, I. A pilot evaluation of an electronic textile for lower limb monitoring and interactive biofeedback. Procedia Eng. 2011, 13, 513–518. [Google Scholar] [CrossRef]
  37. Liu, C.-X.; Choi, J.-W. An embedded PDMS nanocomposite strain sensor toward biomedical applications. In Proceedings of the 2009 Annual International Conference of the IEEE Engineering in Medicine and Biology Society, Minneapolis, MN, USA, 2–6 September 2009; Volume 2009, pp. 6391–6394. [Google Scholar]
  38. Lorussi, F.; Scilingo, E.P.; Tesconi, M.; Tognetti, A.; DeRossi, D. Strain sensing fabric for hand posture and gesture monitoring. IEEE Trans. Inf. Technol. Biomed. 2005, 9, 372–381. [Google Scholar] [CrossRef]
  39. Dharap, P.; Li, Z.; Nagarajaiah, S.; Barrera, E.V. Nanotube film based on single-wall carbon nanotubes for strain sensing. Nanotechnology 2004, 15, 379–382. [Google Scholar] [CrossRef]
  40. Kang, I.; Schulz, M.; Kim, J.H.; Shanov, V.; Shi, D. A carbon nanotube strain sensor for structural health monitoring. Smart Mater. Struct. 2006, 15, 737–748. [Google Scholar] [CrossRef]
  41. Li, X.; Levy, C.; Elaadil, L. Multiwalled carbon nanotube film for strain sensing. Nanotechnology 2008, 19, 045501. [Google Scholar] [CrossRef] [PubMed]
  42. Zhang, J.; Liu, J.; Zhuang, R.; Mäder, E.; Heinrich, G.; Gao, S.-L. Single MWNT-glass fiber as strain sensor and switch. Adv. Mater. 2011, 23, 3392–3397. [Google Scholar] [CrossRef] [PubMed]
  43. Helmer, R.; Farrow, D.; Lucas, S.; Higgerson, G.; Blanchonette, I. Can interactive textiles influence a novice’s throwing technique? Procedia Eng. 2010, 2, 2985–2990. [Google Scholar] [CrossRef] [Green Version]
  44. Lu, N.; Lu, C.; Yang, S.; Rogers, J.A. Highly sensitive skin-mountable strain gauges based entirely on elastomers. Adv. Funct. Mater. 2012, 22, 4044–4050. [Google Scholar] [CrossRef]
  45. Rautaray, S.S.; Agrawal, A. Interaction with virtual game through hand gesture recognition. In Proceedings of the 2011 International Conference on Multimedia, Signal Processing and Communication Technologies, Aligarh, India, 17–19 December 2011; pp. 244–247. [Google Scholar]
  46. Xiao, X.; Yuan, L.; Zhong, J.; Ding, T.; Liu, Y.; Cai, Z.; Rong, Y.; Han, H.; Zhou, J.; Wang, Z.L. High-strain sensors based on ZnO nanowire/polystyrene hybridized flexible films. Adv. Mater. 2011, 23, 5440–5444. [Google Scholar] [CrossRef]
  47. Yang, X.; Zhou, Z.Y.; Zheng, F.Z.; Zhang, M.; Zhang, J.; Yao, Y.G. A high sensitivity single-walled carbon-nanotube-array-based strain sensor for weighing. In Proceedings of the TRANSDUCERS 2009—2009 International Solid-State Sensors, Actuators and Microsyst. Conference, Denver, CO, USA, 21–25 June 2009; pp. 1493–1496. [Google Scholar]
  48. Amjadi, M.; Park, I. Carbon nanotubes-ecoflex nanocomposite for strain sensing with ultra-high stretchability. In Proceedings of the 2015 28th IEEE International Conference on Micro Electro Mechanical Systems (MEMS), Estoril, Portugal, 18–22 January 2015; pp. 744–747. [Google Scholar] [CrossRef]
  49. Liang, A.; Stewart, R.; Bryan-Kinns, N. Analysis of sensitivity, linearity, hysteresis, responsiveness, and fatigue of textile knit stretch sensors. Sensors 2019, 19, 3618. [Google Scholar] [CrossRef] [Green Version]
  50. Campigotto, A.; Leahy, S.; Choudhury, A.; Zhao, G.; Lai, Y. A novel strain sensor using a microchannel embedded in PDMS. J. Biomed. Eng. Inform. 2018, 4, 1. [Google Scholar] [CrossRef]
  51. Guo, X.; Huang, Y.; Cai, X.; Liu, C.; Liu, P. Capacitive wearable tactile sensor based on smart textile substrate with carbon black/silicone rubber composite dielectric. Meas. Sci. Technol. 2016, 27, 045105. [Google Scholar] [CrossRef]
  52. Hu, S.; Dai, M.; Dong, T.; Liu, T. A textile sensor for long durations of human motion capture. Sensors 2019, 19, 2369. [Google Scholar] [CrossRef] [Green Version]
  53. Mattmann, C.; Clemens, F.; Tröster, G. Sensor for measuring strain in textile. Sensors 2008, 8, 3719–3732. [Google Scholar] [CrossRef] [PubMed]
  54. Nakamoto, H.; Ootaka, H.; Tada, M.; Hirata, I.; Kobayashi, F.; Kojima, F. Stretchable strain sensor with anisotropy and application for joint angle measurement. IEEE Sens. J. 2016, 16, 3572–3579. [Google Scholar] [CrossRef]
  55. Totaro, M.; Poliero, T.; Mondini, A.; Lucarotti, C.; Cairoli, G.; Ortiz, J.; Beccai, L. Soft smart garments for lower limb joint position analysis. Sensors 2017, 17, 2314. [Google Scholar] [CrossRef] [PubMed]
  56. Saucier, D.; Luczak, T.; Nguyen, P.; Davarzani, S.; Peranich, P.; Ball, J.E.; Burch, R.F.; Smith, B.K.; Chander, H.; Knight, A.; et al. Closing the wearable gap-Part II: Sensor orientation and placement for foot and ankle joint kinematic measurements. Sensors 2019, 19, 3509. [Google Scholar] [CrossRef] [Green Version]
  57. Saucier, D.; Davarzani, S.; Turner, A.; Luczak, T.; Nguyen, P.; Carroll, W.; Burch, V.R.F.; Ball, J.; Smith, B.K.; Chander, H.; et al. Closing the wearable gap—Part IV: 3D motion capture cameras versus soft robotic sensors comparison of gait movement assessment. Electronics 2019, 8, 1382. [Google Scholar] [CrossRef] [Green Version]
  58. Chan, C.W.; Rudins, A. Foot biomechanics during walking and running. Mayo Clin. Proc. 1994, 69, 448–461. [Google Scholar] [CrossRef] [Green Version]
  59. De Vries, G.; Roy, K.; Chester, V.L. Using three-dimensional gait data for foot/ankle orthopaedic surgery. Open Orthop. J. 2009, 3, 89–95. [Google Scholar] [CrossRef] [Green Version]
  60. Lundberg, A.; Goldie, I.; Kalin, B.; Selvik, G. Kinematics of the ankle/foot complex: plantarflexion and dorsiflexion. Foot Ankle 1989, 9, 194–200. [Google Scholar] [CrossRef]
  61. Doan-Johnson, S.; Veillette, C. Biomechanics of the foot and ankle. In OrthopaedicsOne—The Orthopaedic Knowledge Network; 2011; Available online: https://www.orthopaedicsone.com/display/Main/Biomechanics+of+the+foot+and+ankle (accessed on 6 August 2020).
  62. Kwon, Y.-H.; Hutcheson, L.; Casebolt, J.B.; Ryu, J.-H.; Singhal, K. The effects of railroad ballast surface and slope on rearfoot motion in walking. J. Appl. Biomech. 2012, 28, 457–465. [Google Scholar] [CrossRef]
  63. Rhudy, M. Time alignment techniques for experimental sensor data. Int. J. Comput. Sci. Eng. Surv. 2014, 5, 1–14. [Google Scholar] [CrossRef]
  64. Davarzani, S.; Saucier, D.; Peranich, P.; Carroll, W.; Turner, A.; Parker, E.; Middleton, C.; Nguyen, P.; Robertson, P.; Smith, B.K.; et al. Closing the wearable gap—Part VI: Human gait recognition using deep learning methodologies. Electronics 2020, 9, 796. [Google Scholar] [CrossRef]
  65. Luczak, T.; Burch V, R.F.; Smith, B.K.; Carruth, D.W.; Lamberth, J.; Chander, H.; Knight, A.; Ball, J.; Prabhu, R. Closing the wearable gap—Part V: Development of a pressure-sensitive sock utilizing soft sensors. Sensors 2019, 20, 208. [Google Scholar] [CrossRef] [PubMed] [Green Version]
  66. Fuller, E. Center of pressure and its theoretical relationship to foot pathology. J. Am. Podiatr. Med. Assoc. 1999, 89, 278–291. [Google Scholar] [CrossRef] [PubMed]
  67. Winter, D.A. Biomechanical motor patterns in normal walking. J. Mot. Behav. 1983, 15, 302–330. [Google Scholar] [CrossRef]
  68. Berlin, A.A.; Joswik, R.; Ivanovich, V.N. Modern application of nanoengineered materials. In Engineering Textiles: Research Methodologies, Concepts, and Modern Applications, 1st ed.; Alexander, A.B., Roman, J., Nikolai, I.V., Eds.; CRC Press: New York, NY, USA, 2015; pp. 247–278. [Google Scholar]
  69. Atalay, O. Textile-based, interdigital, capacitive, soft-strain sensor for wearable applications. Materials 2018, 11, 768. [Google Scholar] [CrossRef] [Green Version]
  70. Homayounfar, S.Z.; Andrew, T.L. Wearable sensors for monitoring human motion: A review on mechanisms, materials, and challenges. SLAS Technol. Transl. Life Sci. Innov. 2019, 25, 9–24. [Google Scholar] [CrossRef]
  71. Jean-Mistral, C.; Iglesias, S.; Pruvost, S.; Duchet-Rumeau, J.; Chesné, S. Dielectric elastomer for stretchable sensors: Influence of the design and material properties. Proc. SPIE 2016, 9798. [Google Scholar] [CrossRef]
  72. Gu, J.; Kwon, D.; Ahn, J.; Park, I. Wearable strain sensors using light transmittance change of carbon nanotube-embedded elastomers with microcracks. ACS Appl. Mater. Interfaces 2019, 12, 10908–10917. [Google Scholar] [CrossRef]
Figure 1. SSTK (stretch sensor tool kit) development timeline, depicting the three elements of SRS (soft robotic sensors) validation and SRS-based wearable development: materials testing, data analysis software, and data collection hardware/software.
Electronics 09 01457 g001
Figure 2. Early concept of SRS linearity testing apparatus.
Electronics 09 01457 g002
Figure 3. Micro-ohm meter testing setup (Iteration I).
Electronics 09 01457 g003
Figure 4. Drill vise fixture with SRS (Iteration I).
Electronics 09 01457 g004
Figure 5. Wrist motion test apparatus (Iteration II).
Electronics 09 01457 g005
Figure 6. Ankle model prototype; SRS is highlighted in red.
Electronics 09 01457 g006
Figure 7. Participant walking across a tilted surface platform (TSP).
Electronics 09 01457 g007
Figure 8. Early attempts at using Velcro to attach sensors to the sock. (a) The initial attempt at mounting SRS with Velcro, (b) SRS mounting SRS to ankle straps with Velcro on SRS only, (c) SRS mounted with motion capture clusters and sensing module, and (d) SRS mounted while the foot is being calibrated to the neutral position.
Electronics 09 01457 g008
Figure 9. A sock prototype was used for the slip and trip experiment. SRS module location in the red circle.
Electronics 09 01457 g009
Figure 10. (a) Second sock prototype iteration; (b) 3D printed enclosures circled in red in the right image.
Electronics 09 01457 g010
Figure 11. Hook and eye attachment to hold SRS in place.
Electronics 09 01457 g011
Figure 12. Sock prototype featuring wire coverings and band to form-fit SRS.
Electronics 09 01457 g012
Figure 13. Model board used to form a basic structure of the enclosure.
Electronics 09 01457 g013
Figure 14. Cutouts for mounting and sensor accessibility.
Electronics 09 01457 g014
Figure 15. Snap case design for ease of access to the sensor.
Electronics 09 01457 g015
Figure 16. Wire management system. (a) CAD model version, (b) 3D printed version.
Electronics 09 01457 g016
Figure 17. SRS sock mounting system iterations: (a) Iteration II and (b) Iteration III.
Electronics 09 01457 g017
Figure 18. Updated wire management system.
Electronics 09 01457 g018
Figure 19. Finalized wire management system on smaller board enclosures. (a) Top view of enclosure, (b) side view of enclosure, note opening on the side for the charging port.
Electronics 09 01457 g019
Figure 20. GUI (graphical user interface) design, displaying data from ten SRS.
Electronics 09 01457 g020
Figure 21. (a) CAD model version of SRS clamps, (b) 3D-printed SRS clamps for Instron low-cycle fatigue (LCF) and high-cycle fatigue (HCF) fatigue testing.
Electronics 09 01457 g021
Figure 22. Instron TM fatigue testing setup.
Electronics 09 01457 g022
Table 1. GitHub location of all SSTK solutions developed as part of the Closing the Wearable Gap paper series.
Item (Hyperlink)Description
Soft Sensors Research RepositoryPublicly available GitHub repository used to distribute and showcase hardware/software tools to the community (contains items listed below).
openSRS-manager GUIA software tool used to communicate with/control custom hardware, assist with lab data collection, and visualize/export data.
openSRS-labkit-v1 Hardware/FirmwarePCB design files, 3D case models, and firmware source code for custom lab data collection kit.
Biomechanics Data Analysis Scripts (Statistical)SRS/MOCAP data analysis using general statistical techniques.
Biomechanics Data Analysis Scripts (Deep Learning)SRS/MOCAP data analysis using deep learning/machine learning techniques.
Publicly Available DatasetsDeidentified raw experiment data for public use.

