Abstract
Although the deployment of 5G networks has already started, there are still open questions regarding propagation at millimeter-wave frequency bands. Several propagation campaigns have been carried out at several bands previously identified by regulatory organizations, but due to the wide range of allocated segments of spectrum and the variety of possible propagation scenarios, more measurement campaigns are needed. In this regard, the Universidad Politécnica de Madrid (UPM) has taken millimeter-wave measurements at 26, 32, and 39 GHz bands in an indoor corridor scenario in line-of-sight (LOS) conditions with two antenna configurations (a horn antenna has been used in transmission whereas horn and omnidirectional antennas have been used in reception), and the main results are presented in this paper. The obtained path loss results have been compared with existing millimeter-wave propagation models.
1. Introduction
One of the four main requirements for 5G deployment is the use of millimeter-wave bands [1] (commonly defined to include the frequency range from 10 to 300 GHz [2]). These bands have traditionally been intended for fixed, backhaul connections, but they may also be used to provide mobile network coverage (up to several tenths of meters) in indoor user scenarios. The International Telecommunication Union Radiocommunication Sector (ITU-R) has proposed a roadmap to develop “International Mobile Telecommunications (IMT) for 2020 and beyond”, setting up the stages for the 5G research activities [3]. Nowadays, the focus is being drawn towards very high frequency bands reaching up to the D band and the sub-THz bands for beyond 5G technologies (with several campaigns being conducted at such bands [4]).
The ITU-R in the World Radiocommunication Conferences of 2015 [5] and 2019 [6] identified the frequency bands 24.25–27.5 GHz and 37–43.5 GHz for use by administrations wishing to implement the terrestrial component of IMT and kept an allocation of the 32-GHz band for mobile services. Based on that, several countries [7,8] and companies [9] have provisionally identified possible bands to be utilized in the short-, middle-, and long-term. Three of these are the 24.25–27.5 GHz, 31.8–33.4 GHz, and 37–40.5 GHz (hereinafter named as 26, 32, and 39 GHz bands, respectively) [10].
A significant number of research groups have conducted or are conducting propagation campaigns, an extensive list of which can be found in [11]. Most of the collected data from past experimental campaigns have served for the development of models oriented specifically to millimeter-wave, such as the 5GCM [11], 3GPP 5G [12], ITU-R Rec. P.1238-10 [13], mmMAGIC [14], and METIS [15] models. These have provided several formulations for estimating the path loss at different scenarios and at a wide range of frequencies. Although they use similar regression fittings—such as the close-in (CI), floating intercept (FI), close-in with frequency dependency (CIF), and alpha–beta–gamma (ABG)—their provided coefficients are usually different. This occurs because of the differences between the propagation experiments, such as different type of antennas, measured frequencies, scenario, and environment characteristics. Measurements in a variety of propagation scenarios and bands are necessary for characterizing the channel properly, in order to validate the existing channel models and to develop new ones.
Characterizing the propagation in indoor scenarios (InH, Indoor Hotspot) is of great interest. The richness in multipath contributions caused by reflections and diffractions in surrounding objects (including walls and floor) and people, and the guiding effect in hallways or corridors are some of the distinctive features for this scenario. The Rec. ITU-R P.2040-1 [16] states that a building structure such as a corridor can be considered as a waveguide, this theory shows good agreement with other measurement propagation characteristics in the corridor in the frequency range from 200 MHz to 12 GHz with no pedestrian traffic (as the type of measurements used here).
Recent campaigns have been reported results at several indoor scenarios such as [17], where measurements at 28 GHz have been collected in an indoor industrial scenario; channel measurements at the same frequency band are presented for a library environment in [18] and for a subway platform and for a factory environment in [19]; path loss measurements at 31 GHz have been provided in [20] for two distinct indoor airport buildings; also, path loss at three frequency bands (12.55–14.15 GHz, 25–28.3 GHz, and 67–73 GHz) and for two environments (factory and corridor) have been analyzed in [21]. The frequency bands of 26, 32, and 39 GHz have been addressed in [22] with LOS conditions in a hall scenario with common obstruction in such environment, focusing on the delay spread and modeling the path loss results with the CI fitting. Measurements in an indoor corridor at 19, 28, and 38 GHz bands have been presented in [23], and their path loss results were fitted with functions such as the CI, FI, CIF, and ABG (the two last for only one frequency).
The recommendation ITU-R P.1238-10 [13] collects several sets of power loss coefficients (N = 10·n, with n being the path loss exponent, PLE), floor penetration loss factors and standard deviation of shadow fading for frequencies ranging from 0.8 to 325 GHz and several indoor scenarios such as Residential, Office, Commercial, Factory, Corridor, and Data Center. Nevertheless, there are various frequency bands for which no coefficients are provided.
According to the above, the number of campaigns conducted at lower and middle millimeter-wave bands (from 6 to approximately 40 GHz) may be considered as not enough in order to fully characterize the propagation channel in a wide number of scenarios and propagation conditions. Thus, more campaigns are needed for adequately characterizing the channel.
The GTIC Radiocommunication research group of the UPM is carrying out a propagation measurement campaign to assess path loss at millimeter-wave frequencies in indoor scenarios. The available equipment can reach up to 40 GHz.
The objective of this paper is to present the path loss results at three millimeter-wave frequency bands, namely 26, 32, and 39 GHz, taken in an indoor corridor scenario with LOS condition, to provide the path loss fitting coefficients, and to carry out a statistical analysis of the deviations between the measurement results and the fitted models. More specifically, the main objective is to estimate the coefficients for several regression fittings (such as the CI, FI, CIF, and ABG) and to compare them with those provided in the literature for 5G and similar scenarios. Regarding the deviations between measurements and models, both flat (shadow) fading and frequency-selective (multipath) fading are analyzed. Preliminary results for the 26 and 39 GHz path loss measurements were presented in [24,25]. In summary, we contribute with new measurements for the corridor scenario for which not many results have been previously published, and we carry out an analysis regarding the frequency-selective fading, which has been less treated in millimeter-wave campaigns.
After this introduction, the remainder of this paper is structured as follows: In Section 2, the experimental setup and the processing applied to the data are described in detail. The path loss fitting models are presented in Section 3. Section 4 presents the measurement results for the InH corridor and their CI, FI, CIF, and ABG fittings and compares these with millimeter-wave available models (i.e., the 3GPP 5G, 5GCM, ITU-R P.1238-10 Rec., and mmMAGIC); the analysis of flat and frequency-selective fading is also presented in this section. Finally, some conclusions are drawn in Section 5.
2. Millimeter-Wave Experimental Setup
Channel sounders are the equipment commonly used to characterize the propagation channel but are quite expensive. The experimental setup presented here is more affordable compared with channel sounders, although it has limitations in the amount of analyses that can be carried out.
The millimeter-wave setup is composed by a transmitter and a receiver unit. Figure 1 shows a block diagram of the complete setup with some of the main equipment characteristics. Two antennas are connected to the transmitter unit (via the switch in Figure 1), although only one is used for this experiment.
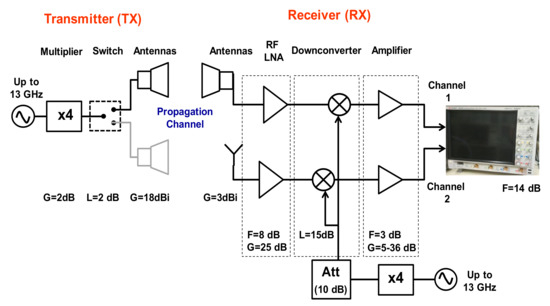
Figure 1.
Transmitter and receiver scheme (main characteristics of each device are shown below them, with G, L, F, Att, and LNA standing for gain, losses, noise figure, attenuation, and low noise amplifier, respectively).
The surrounding structures and materials have a great impact on the propagation. Indoor propagation is affected by reflections in the objects (including walls and floor) and diffraction around them; transmission loss through walls, floors, and other obstacles; channeling of energy, especially in halls; and the movements of people and objects in the room, including one or both ends of the radio link [13].
The InH measurements were taken in a typical corridor scenario at the UPM in LOS condition at distances ranging from 3 to 65 m, approximately. The corridor cross-section is 2.41 m wide by 2.89 m high, with wooden doors, walls of lightweight concrete, and a false ceiling of gypsum along it (the corridor can be seen in the background in Figure 2). There are also emergency doors, which remained open during all measurements. In addition, several small metallic trash bins, fire extinguishers, wooden shelves with crystals, and a metallic water dispenser are placed along the corridor. During the measurements, the corridor was clear of people.
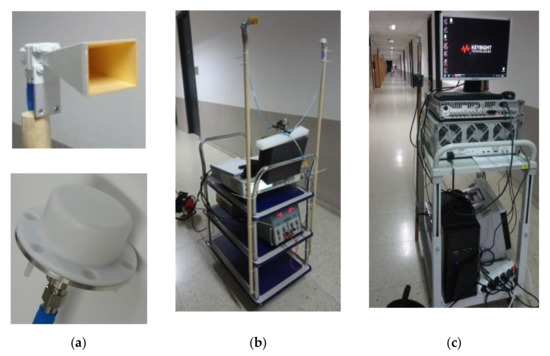
Figure 2.
Main setup components: (a) horn (top) and omnidirectional (bottom) antennas; (b) transmitter unit; and (c) receiver unit.
2.1. Transmitter Unit
The transmitter unit is seen in the left side of Figure 1. The first device is an N5173B ENG-X-513 signal generator that can reach up to 13 GHz and delivers an output power of 10 dBm. This generator—from Keysight Technologies, Santa Rosa, CA, USA, as are also the RF LNA (Low Noise Amplifier) amplifiers, the downconverter, the intermediate frequency (IF) amplifiers, and the oscilloscope on the receiver side—delivers a simple RF tone. To reach the bands of interest, an order-four frequency multiplier MAX4M260400 from Miteq is used. The switching device seen after the multiplier and before the antennas is not necessary for this campaign (it is used for other types of measurements). This device has no further impact than its loss.
2.2. Receiver Unit
This unit is represented in the right part of Figure 1. Two receiving antennas are used: the same horn antenna type used in the transmitter and an omnidirectional QOM-SL-26-40-K-SG-R from Steatite Q-par (see Figure 2a bottom), with a gain from 2 to 4 dBi in the 26 to 40 GHz range.
The signal is received simultaneously with the two antennas and the corresponding receiving chains. After each of the two receiver antennas, a USB U7227F-8F amplifier (RF LNA in Figure 1) is used. The amplified signals are fed into an M9362AD01-F50 quad downconverter located on a PXI (PCI eXtensions for Instrumentation, which is a commonly used modular instrumentation platform) M9018A controlled by a PC. In the downconverter, each signal is translated to an 11.4-MHz IF by multiplying them with a LO (local oscillator) signal that comes from a signal generator identical to the one in the transmitter side. The LO signal is attenuated with a 10-dB SA40-15 attenuator to meet the 4-dBm limitation in the downconverter input power.
The resulting signals from the down-converter are amplified by an IF M9352A-H02 amplifier/attenuator. These down-converted and amplified signals are captured with a four-channel DSOS104A oscilloscope. Each received signal is approximately a 11.4-MHz tone, with a drift of few hundreds of Hz caused by differences in the generator frequencies. These signals are captured by the oscilloscope at 40 Msamples/s. The captures last 3 s (limited by the amount of memory available at the oscilloscope). The receiver unit, mounted on a trolley, can be seen in Figure 2c together with the corridor where the measurements were taken.
The main characteristics of the different devices are collected in Table 1.

Table 1.
Main parameter values at the three frequencies.
2.3. Data Gathering and Processing
After gathering the measurements, the two signals captured by the oscilloscope are saved as HDF5 files in the oscilloscope, and a MATLAB-based processing stage is applied. The first part of this processing consists in down-converting the signals to a nominal frequency of 10 kHz and down-sampling to 40 ksamples/s. The actual frequency will have a drift of a few hundreds of Hz, as previously mentioned.
In the next step, an 8th-order band-pass Butterworth filter with a 2-Hz bandwidth is used to remove noise. Since the signal is essentially a 3 s portion of a sinusoid, the filter bandwidth can be made very small to increase the signal to noise ratio but should be larger than the inverse of the signal duration.
To compensate the frequency drift, the filter is applied at different, closely spaced positions in a ±1-kHz range around the nominal frequency of 10 kHz, and the position that maximizes the output power is selected. The resulting powers for the two received signals are recorded. Computation of the path loss from the received power is done by means of a calibration step, which will be described later.
Measurements are taken for eight frequency values centered approximately at 26, 32, or 39 GHz, covering a 140-MHz bandwidth in steps of 20 MHz, and this process is done three times for each distance. The resulting 24 values are averaged, so that each point displayed in the path loss graphs represents the average of 24 measurements. The objective of this procedure is to reduce the multipath fading effects. For each of the three measured bands, the transmitter was moved along the corridor, maintaining the receiver in a fixed location. Several transmitter and receiver locations were used to limit the site-specific characteristics (the impact of surrounding objects and the transmitter and receiver location on the measurements), as it was done in [26,27]. The transmitter and receiver antennas are positioned at approximately 1.5 m height above the floor.
2.4. Calibration Procedure
A calibration procedure must be carried out in order to estimate a calibration constant (C) that accounts for all the system contributions to the received power (i.e., antenna gains, device losses/gains, cable losses, etc.) apart from the propagation path loss (PL). This constant is used for converting received powers into path loss values.
The calibration constant is estimated from the received power at distances (d, in meters) in the 3–15 m range (), measured without surrounding obstacles and using horn antennas at both ends. In these conditions, the propagation can be considered to be similar to free space and thus the path loss PL(d) equals the free space path loss (FSPL)(d) = 20log(4πd/λ), with the wavelength λ in m. Then, C is calculated as:
The constant C is later used for obtaining the path loss, for all distances, in a horn-to-horn configuration (a horn antenna at each end, referred in the rest of the paper as Horn configuration):
For a horn-to-omnidirectional configuration (using an omnidirectional antenna at the receiver and referred to as Omni from now on), C has to be modified to account for the difference between the gains of the horn () and the omnidirectional () antennas. The expression is analogous to (2) but with C replaced by C[dB] :
3. Path Loss Channel Propagation Models
The models addressed here can be classified as site-general models [13]; these require little path or site information and implicitly consider the obstacles as part of the distance-dependent loss. Site-specific models, on the other hand, would explicitly consider the loss due to each wall or obstacle. Site-general models are useful for initial system planning and interference assessment.
The models are obtained by fitting the measurements to a generic expression. Four path loss propagation fittings are used: the CI, FI, CIF, and ABG. The first two are single-frequency models, whereas the others are multi-frequency ones.
The Close-In free space reference distance (CI) path loss fitting is given by (4):
where is a reference distance, here equal to 1 m. The path loss exponent is the only adjustment coefficient. In general, n lower than 2 are expected in LOS indoor scenarios [11]. The large-scale channel fluctuations due to shadowing are modeled as , a Gaussian random variable with zero-mean and standard deviation .
A more complex but more accurate model is the floating-intercept (FI) path loss fitting, which requires the adjustment of two coefficients instead of one:
where is equal or higher than 1 m, is a floating-intercept coefficient (in dB), is the slope that characterizes the dependence between the loss and the distance, and is a shadow fading Gaussian random variable similar to the one used in the CI model.
A multi-frequency approach can be and is considered, with this approach the frequency-dependent loss beyond the first meter caused by the surrounding environment for indoor environments is taken into account [28]. This includes a frequency-dependent coefficient into the PLE, having then a CI with a frequency-dependent path loss exponent (CIF). This model uses also the physically motivated free space path loss anchor at 1 m as the CI model does. The CIF model is:
where is the carrier frequency in GHz, b is an optimization parameter that represents the path loss slope of the linear frequency dependence, is a zero-mean Gaussian random variable (in dB) describing the large-scale signal fluctuations, and is a reference frequency that serves as the balancing point or center for the linear frequency dependence of PLE and is based on the weighted average of all frequencies represented by the model. It is calculated as:
where K is the number of unique frequencies and is the number of path loss data points corresponding to the k-th frequency . Another approach, not used here is to assume as the minimum investigated frequency [29].
Another multi-frequency type approach is the ABG model, defined as:
where is an offset parameter; describes the slope of the path loss with the logarithm of the distance; describes the path loss frequency dependence; and is a Gaussian random variable representing large-scale, shadowing signal fluctuations.
As can be seen from the formulations, the ABG model is a generalization of the FI for multiple frequencies, and the FI can be obtained if a single frequency is used [26]. In addition, it can be reduced to the CI if is equal to , to the PLE n and to 2.
Here, four models will be compared with the coefficients derived from our measurements: the 3GPP TR 38.901 [12] (or 3GGP 5G), the 5GCM [11], the Rec. ITU-R P.1238-10 [13], and the mmMAGIC [11] models.
4. Experimental Results and Modeling
Three types of results are presented here: path loss, shadow (flat) fading, and multipath (frequency-selective) fading. The path loss results are obtained using the procedure described in Section 2. This gives rise to a set of data points in a path loss-distance plot, where each point is the average of the 24 measurements taken in different frequencies at a given distance. Shadow fading is computed as the difference (in dB) between each of those data points and the path loss predicted by the fitted model at that distance using:
Multipath fading is computed as the difference between each of the 24 individual measurements and their average (that is, the data point), and therefore captures any frequency-dependent fluctuations.
4.1. Path Loss Results
Path loss results for both Horn and Omni configurations at LOS condition are given in Figure 3 for 26, 32, and 39 GHz. The Horn and Omni measurements include each one of the 264 points at 26 GHz and 116 points at 32 GHz and at 39 GHz, respectively.
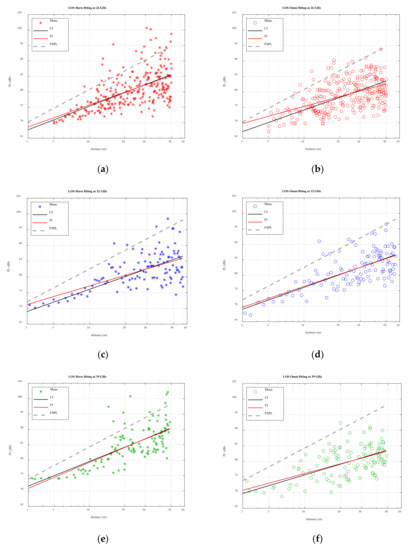
Figure 3.
Close-in (CI) and floating intercept (FI) fittings for path loss results at 26 GHz (a,b); 32 GHz (c,d) and 39 GHz (e,f) for the Horn (left hand) and Omni (right hand) configurations. FSPL is represented in each figure in gray color.
From these results, propagation is seen to be better than FSPL, as has been reported in other studies [13]. Figure 3 represents the fittings of CI and FI for the Horn and Omni configurations at the three frequency bands.
Table 2 shows the coefficients for each frequency for both the CI and FI fittings and compares them with several 5G available models (in some cases, for scenarios different from the corridor). In the table, stands for the standard deviation from the results of (9) for each fitting.

Table 2.
Coefficients for the CI and FI fittings and line-of-sight (LOS) models.
The mmMAGIC is an ABG-type model, and here it has been particularized to show its coefficients as an FI-type model for each band. The model of Rec. ITU-R P.1238-10 has a CI-type formulation and does not provide coefficients for the 32 and 39 GHz frequency bands.
When comparing the CI coefficients obtained from the fittings with those provided by the models considered in Table 2, the n derived from our measurements are lower than their counterparts 1.73 (for the 3GPP 5G and the 5GCM models and for all frequencies) and 1.92 (for the Rec. ITU-R model and only for the 26-GHz case, since no coefficients are provided for the other bands); also, our measurements have a higher standard deviation in all cases than in the models. In addition, the obtained CI coefficients are similar to the coefficients obtained in [22] for their path loss measurements with vertical-to-vertical polarization, for a different scenario.
The values of the floating-intercept parameter obtained from the FI fittings are very similar to those of the mmMAGIC model, but the values of the distance-dependent coefficient have high deviation (from 1.61 to 1.03) from 1.38 (mmMAGIC). In all cases, the obtained standard deviations are higher than 1.18 (mmMAGIC).
After applying (9) for each case, the shadow fading results are obtained. As an example, the 32 GHz case is shown in Figure 4.
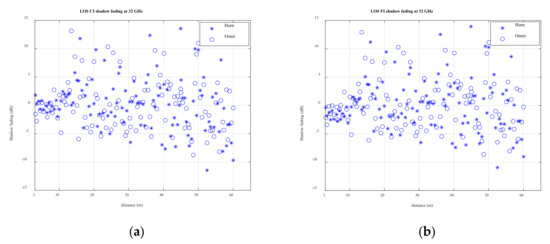
Figure 4.
CI (a) an FI (b) shadow fading for the LOS path loss results at 32 GHz.
For the three frequency bands, the trend is the same, i.e., there is little difference between the shadow fading for the CI and FI fittings (this can be seen both in the Table 2 coefficients and in Figure 4). The differences between the CI and FI shadow fading are small because the two fittings produce nearly coincident lines, as seen in Figure 3.
The path loss results have also been fitted with the ABG model, giving a representation of path loss as a function of frequency and distance, as shown in Figure 5. The fitted coefficients are given in Table 3 and are compared there with ABG-type LOS indoor models: the mmMAGIC model for an office scenario and the 3GPP 5G model for a factory scenario. None of these models provide coefficients specifically for corridor scenarios.
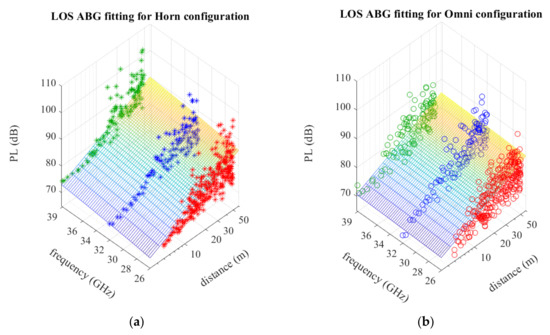
Figure 5.
Alpha–beta–gamma ABG fitting for (a) Horn (asterisk) and (b) Omni (circle) configurations at 26 (red), 32 (blue) and 39 GHz (green).

Table 3.
LOS ABG fitting and mmMAGIC coefficients.
For this case, the fitted coefficients for the Horn configuration are similar to those corresponding to the models of Table 3. On the other hand, the Omni configuration gives very different and coefficients. The differences between the fitted and mmMAGIC coefficients for an office scenario may be due to the wide range of application of the model (i.e., almost 94 GHz ranging from 6 to 100 GHz), whereas the three frequency bands addressed here are closer (only 13 GHz-range). The coefficient of the 3GPP 5G InF has greater difference with the ones derived from the measurements.
The standard deviation proposed by the mmMAGIC model is much lower than the experimental results. The value given by the 3GPP 5G InF model is closer to the experimental ones.
A CIF type LOS model has not been proposed in the literature, to the authors’ knowledge, but here, its graphical representation is given in Figure 6, and the obtained coefficients are presented for possible further analyses in Table 4, where μ is the mean value of the shadow fading.
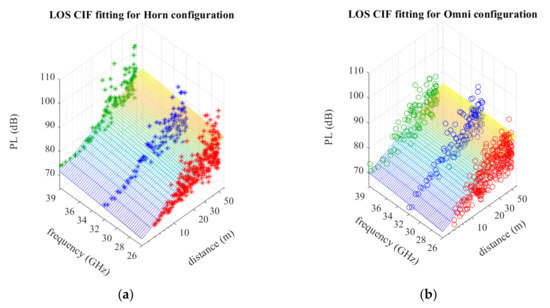
Figure 6.
Close-in with frequency dependency (CIF) fitting for (a) Horn (asterisk) and (b) Omni (circle) configurations at 26 (red), 32 (blue) and 39 GHz (green).

Table 4.
LOS CIF fitting coefficients.
In this multi-frequency fitting, there is a small deviation from the zero-mean value ( equal to 0.07 for the Horn configuration and 0.09 for the Omni). The parameter is obtained by applying (7).
4.2. Shadow Fading and Multipath Component Results
The shadow fading histograms for the Horn and Omni measurements and the CI and FI fittings are shown in Figure 7 and Figure 8 for 26 and 39 GHz, respectively. Results for the 32 GHz band are similar and are omitted for brevity. The Gaussian distributions modeled with the experimental mean and standard deviation for each case are represented in solid red line.
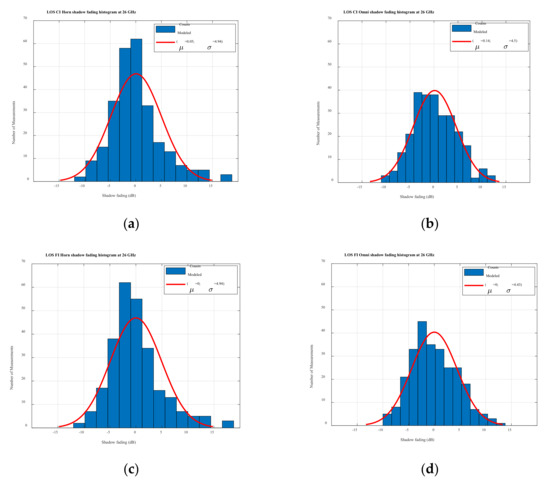
Figure 7.
LOS shadow fading histogram at 26 GHz for the (a) CI Horn, (b) CI Omni, (c) FI Horn, and (d) FI Omni cases.
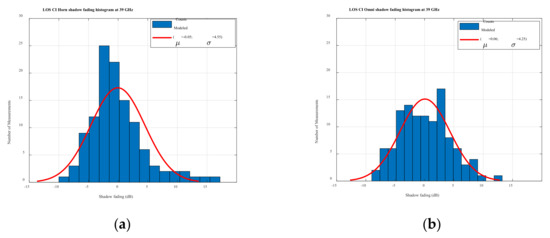
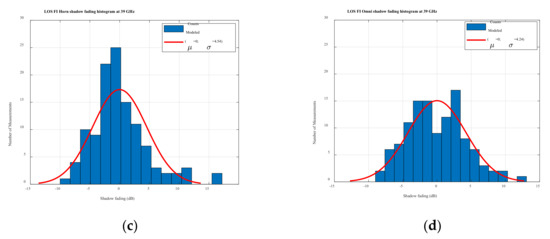
Figure 8.
LOS shadow fading histogram at 39 GHz for the (a) CI Horn, (b) CI Omni, (c) FI Horn, and (d) FI Omni cases.
The histograms approximately correspond to a Gaussian distribution as expected. The CI mean has a small variation for all cases, ranging from 0.01 to 0.15, whereas for FI the zero-mean value is met in all cases. The standard deviation values are provided in Table 2.
Regarding the multi-frequency fittings, the mean and standard deviation values are similar for the CIF and the CI fittings; and for the ABG and the FI. This is due to the relations between them (for one frequency, the ABG reduces to an FI fitting and the CIF to a CI fitting).
The frequency-selective multipath fading analysis uses the 24 individual measurements for each distance at a given frequency (giving a total of 6336 measurements for 26 GHz, 2784 for 32 GHz, and 2784 for 39 GHz). The measured values have been transformed into linear amplitude units, and each set of 24 has been divided by its mean. The resulting histograms for 26 and 39 GHz are represented in Figure 9.
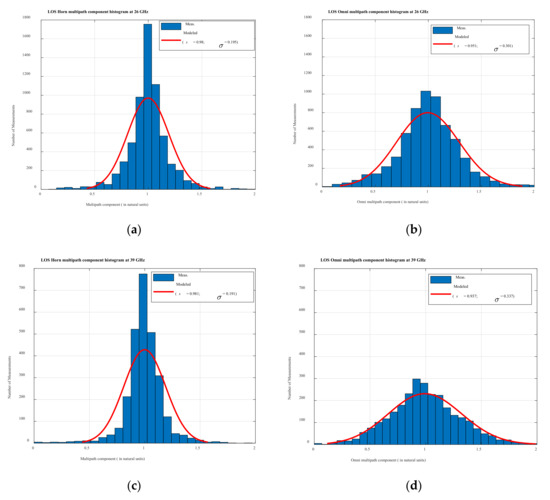
Figure 9.
LOS measurements histogram and best-fit Ricean function for the Horn configuration at 26 GHz (a) and 39 GHz (c) and for the Omni configuration at 26 GHz (b) and 39 GHz (d).
The histograms for each case can be approximately described by the Ricean probability distribution function (PDF), which is commonly used for modeling well the fading when there is a LOS component. The Ricean functions that provide the best fits are represented in solid red line in Figure 9.
where is the zero-order modified Bessel function of the first kind, s is a non-centrality parameter equal or greater than zero, and is a scale parameter higher than zero.
Although both the Horn and Omni measurements can be represented with the Ricean distribution, for the Horn case, the measurements are seen to be more concentrated around 1, whereas for the Omni case, they are more spread. This is expected, because the LOS component has a smaller relative contribution in the omnidirectional case. The parameters of the fitted Ricean distribution are shown in Table 5.

Table 5.
Ricean distribution parameters.
The scale parameters are different for the Horn and Omni configurations but are similar for the same scenario at all frequencies.
5. Conclusions
The presented LOS results at the 26, 32, and 39 GHz frequency bands contribute to the characterization of propagation in the corridor indoor scenario with LOS conditions. The Horn configuration presents a higher path loss than the Omni. As expected, the path loss is higher for the higher frequencies, on average.
The path loss exponents are below 2 in all the cases, confirming a waveguide-like propagation effect (this is mainly due to the multiple reflections in walls, floor, and ceiling) in LOS conditions. This behavior has been reported in various studies carried out by other researchers and was taken into account in the 3GPP 5G, ITU-R, and 5GCM models. The strength of this effect is variable, but maybe the type of antenna has an influence on this: a lower exponent is obtained for the omnidirectional antenna configuration than for the horn.
The coefficients provided by the ITU-R Rec. P.1238-10 LOS model for the 26 GHz band are higher than those obtained from the measurements. This recommendation, however, does not record coefficients for the corridor scenario in the 28.5 to the 51 GHz frequency range. The other tested models (i.e., 3GPP 5G and 5GCM models) provide CI and FI coefficients similar to those obtained from the measurements, even if they do not deal specifically with the indoor corridor scenario. The ABG-type mmMAGIC model coefficients are quite similar to those from our fitting for the Horn configuration.
The Gaussian distribution describes well the shadow fading behavior for both antenna configurations and all frequency bands (better for the FI and ABG than for the CI and CIF fittings). On the other hand, the frequency-selective multipath fading is well described by a Ricean distribution for all datasets.
Overall, the derived coefficients for the 26, 32, and 39 GHz bands with LOS conditions contribute to the ongoing measurement efforts for millimeter-wave systems and may help to fill in gaps in existing models.
Author Contributions
The four authors (D.P.-d.-V., L.M., J.M.R., and P.G.-d.-P.) participated in the definition of the experiment, the specification of the equipment, its purchase, and the configuration of the measurements. The software was mainly developed by D.P.-d.-V. and L.M., both of them supervised the measurements, which were carried out by the students whose participation is acknowledged. The results were discussed and validated by the four authors. The first version of the paper was prepared by D.P.-d.-V. The rest of the authors participated in the revision and preparation of the final version. Funding has been managed mainly by J.M.R. All authors have read and agreed to the published version of the manuscript.
Funding
This research was supported in part by the Ministry of Science, Innovation and Universities of Spain through the RTI2018-098189-B-I00 project.
Acknowledgments
The authors would like to thank Keysight Technologies for the help provided for the purchase and for configuration of part of the equipment used in this work. The following students have participated in the measurement campaigns: Pedro Saiz Coronado, Sergio Hernández Sáenz, Ana Martínez Martín, and Andrés Delgado Pérez.
Conflicts of Interest
The authors declare no conflict of interest. The funders had no role in the design of the study; in the collection, analyses, or interpretation of data; in the writing of the manuscript, or in the decision to publish the results.
References
- Kyösti, P.; Lehtomäki, J.; Medbo, J.; Latva-aho, M. Map-Bases Channel Model for Evaluation of 5G Wireless Communication Systems. IEEE Trans. Antennas Propag. 2017, 65, 6491–6504. [Google Scholar] [CrossRef]
- Rangan, S.; Rappaport, T.S.; Erkip, E. Millimeter-Wave Cellular Wireless Networks: Potentials and Challenges. Proc. IEEE 2014, 102, 366–385. [Google Scholar] [CrossRef]
- ITU-R. ITU towards “IMT for 2020 and beyond”. 2017. Available online: http://www.itu.int/en/ITU-R/study-groups/rsg5/rwp5d/imt-2020/Pages/default.aspx (accessed on 4 December 2019).
- Rappaport, T.S.; Xing, Y.; Kanhere, O.; Ju, S.; Madanayake, A.; Mandal, S.; Alkhateeb, A.; Trichopoulos, G.C. Wireless Communications and Applications above 100 GHz: Opportunities and Challenges for 6G and Beyond. IEEE Access 2019, 7, 78729–78757. [Google Scholar] [CrossRef]
- ITU (WRC). Resolution 238 of the Final Acts of the World Radiocommunication Conference (WRC-15), Geneva, Switzerland, 2–27 November 2015. Available online: https://www.itu.int/dms_pub/itu-r/opb/act/R-ACT-WRC.12-2015-PDF-E.pdf (accessed on 5 November 2020).
- ITU (WRC). Resolutions 242 and 243 of the Final Acts of the World Radiocommunication Conference (WRC-2019), Sharm El-Sheikh, Egypt, 28 October–22 November 2019. Available online: https://www.iata.org/contentassets/d7e421981aa64169af1a8d6b37438d4d/wrc-2019-final-acts.pdf (accessed on 5 November 2020).
- MINETAD. Plan Nacional 5G 2018-2020; Ministerio de Energía, Turismo y Agenda Digital: 2016. Available online: https://avancedigital.gob.es/5G/Documents/plan_nacional_5g.pdf (accessed on 5 November 2020).
- Ofcom. 5G Spectrum Access at 26 GHz and Update on Bands above 30 GHz; 2017. Available online: https://www.ofcom.org.uk/__data/assets/pdf_file/0014/104702/5G-spectrum-access-at-26-GHz.pdf (accessed on 5 November 2020).
- Huawei. 5G Spectrum Public Policy Position; 2017. Available online: https://www-file.huawei.com/-/media/CORPORATE/PDF/public-policy/public_policy_position_5g_spectrum.pdf?utm_medium=affiliate&utm_source=Adcell&utm_campaign=deeplink&utm_content=15554&bid=211178-26134-at102088_a186044_m12_p10763_cES&adcref=www.google.com%2F (accessed on 5 November 2020).
- RSPG. Presented at the Strategic Roadmap towards 5G for Europe: Opinion on Spectrum Related Aspects for Next-Generation Wireless Systems (5G), Brussels, Belgium; 9 November 2016. Available online: https://rspg-spectrum.eu/wp-content/uploads/2013/05/RPSG16-032-Opinion_5G.pdf (accessed on 5 November 2020).
- Aalto University; AT&T; BUPT; CMCC; Ericsson; Huawei; Intel; KT Corporation; Nokia; NTT DOCOMO; et al. 5G Channel Model for bands up to 100 GHz. In Proceedings of the 4th International Workshop on 5G/5G+ Communications in Higher Frequency Bands (5GCHFB), Singapore, 4 December 2017. [Google Scholar]
- 3GPP. Study on channel model for frequencies from 0.5 to 100 GHz. TR 38.901 v16.1.0. Available online: https://portal.3gpp.org/desktopmodules/Specifications/SpecificationDetails.aspx?specificationId=3173 (accessed on 4 December 2019).
- ITU-R Rec. P.1238-10. Propagation Data and Prediction Methods for the Planning of Indoor Radiocommunication Systems and Radio Local Area Networks in the Frequency Range 300 MHz to 450 GHz; ITU Radiocommunication Bureau: Geneva, Switzerland, 2019. [Google Scholar]
- mmMAGIC. Measurement Results and Final mmMAGIC Channel Models. H2020-ICT-671650-mmMAGIC/D2.2 v2.0. Available online: https://5g-mmmagic.eu/results/ (accessed on 4 May 2017).
- Raschkowski, L.; Kyösti, P.; Kusume, K.; Jämsä, T. METIS Channel Models, deliverable 1.4 v3. METIS Proyect Technical Report ICT-317669. Available online: https://www.metis2020.com (accessed on 6 July 2015).
- ITU-R Rec. P.2040-1. Effects of Building Materials and Structures on Radiowave Propagation above about 100 MHz; ITU Radiocommunication Bureau: Geneva, Switzerland, 2015. [Google Scholar]
- Schmieder, M.; Eichler, T.; Wittig, S.; Peter, M.; Keusgen, W. Measurement and Characterization of an Indoor Industrial Environment at 3.7 and 28 GHz. In Proceedings of the 14th European Conference on Antennas and Propagation (EuCAP), Copenhagen, Denmark, 24 April 2020; pp. 1–5. [Google Scholar]
- Erden, F.; Ozdemir, O.; Guvenc, I. 28 GHz mmWave Channel Measurements and Modeling in a Library Environment. In Proceedings of the IEEE Radio and Wireless Symposium (RWS), San Antonio, TX, USA, 26–29 January 2020; pp. 1–4. [Google Scholar]
- Ito, S.; Hayashi, T.; Yamazaki, Y.; Nakao, M.; Sakai, S.; Kurosawa, Y.; Matsunaga, A.; Yoshi, K. Measurement and Modeling of Propagation Characteristics for an Indoor Environment in the 28 GHz-band. In Proceedings of the IEEE 30th Annual International Symposium on Personal, Indoor and Mobile Radio Communications (PIMRC), Istanbul, Turkey, 21 November 2019; pp. 1–6. [Google Scholar]
- Matolak, D.W.; Mohsen, M.; Chen, J. Path Loss at 5 GHz and 31 GHz for Two Distinct Indoor Airport Settings. In Proceedings of the 27th European Signal Processing Conference (EUSIPCO), A Coruna, Spain, 18 November 2019; pp. 1–5. [Google Scholar]
- Salous, S.; El-Faitori, S. Path Loss Models and Delay Spread parameters for the Millimetre Wave Channel in Indoor Environments. In Proceedings of the 14th European Conference on Antennas and Propagation (EuCAP), Copenhagen, Denmark, 15–20 March 2020; pp. 1–5. [Google Scholar]
- Khalily, M.; Taheri, S.; Payami, S.; Ghoraishi, M.; Tafazolli, R. Indoor wideband directional millimeter wave channel measurements and analysis at 26 GHz, 32 GHz, and 39 GHz. Trans. Emerg. Telecommun. Technol. 2018, 29, e3311. [Google Scholar] [CrossRef]
- Al-samman, A.M.; Rahman, T.A.; Azmi, M.H. Indoor Corridor Wideband Radio Propagation Measurementsand Channel Models for 5G Millimeter Wave WirelessCommunications at 19 GHz, 28 GHz, and 38 GHz Bands. Wirel. Commun. Mobile Comput. 2018, 1–3. [Google Scholar] [CrossRef]
- Pimienta-del-Valle, D. Contribution to the Millimeter-Wave Propagation Characterization for Satellite and 5G Wireless Links. Ph.D. Thesis, Universidad Politécnica de Madrid, Madrid, Spain, 2019. [Google Scholar]
- Pimienta-del-Valle, D.; Hernández-Sáenz, S.; Sáiz-Coronado, P.; Mendo, L.; Garcia-del-Pino, P.; Riera, J.M. Indoor Path Loss Measurements at the 5G Millimeter-Wave Bands of 26 and 39 GHz. In Proceedings of the 13th European Conference on Antennas and Propagation (EuCAP), Krakow, Poland, 20 June 2019; pp. 1–5. [Google Scholar]
- MacCartney, G., Jr.; Rappaport, T.S.; Shu, S.; Sijla, D. Indoor Office Wideband Millimeter-Wave Propagation Measurements and Channel Models at 28 and 73 GHz for Ultra-Dense 5G Wireless Networks. IEEE Access 2015, 3, 2388–2424. [Google Scholar] [CrossRef]
- Senic, J.; Gentile, C.; Papazian, P.B.; Remley, K.A.; Choi, L.K. Analysis of E-band Path Loss and Propagation Mechanisms in the Indoor Environment. IEEE Trans. Antennas Propag. 2017, 65, 6562–6573. [Google Scholar] [CrossRef]
- Rappaport, T.S.; Xing, Y.; MacCartney, G.R.; Molisch, A.F.; Mellios, E.; Zhang, J. Overview of Millimeter Wave Communications for Fifth-Generation (5G) Wireless Networks-With a Focus on Propagation Models. IEEE Trans. Antennas Propag. 2017, 65, 6213–6230. [Google Scholar] [CrossRef]
- Piersanti, S.; Annoni, L.A.; Cassioli, D. Millimeter Waves Channel Measurements and Path Loss Models. In Proceedings of the IEEE ICC 2012-Wireless Communications Symposium, Otawa, ON, Canada, 10–15 June 2012; pp. 4552–4556. [Google Scholar]
Publisher’s Note: MDPI stays neutral with regard to jurisdictional claims in published maps and institutional affiliations. |
© 2020 by the authors. Licensee MDPI, Basel, Switzerland. This article is an open access article distributed under the terms and conditions of the Creative Commons Attribution (CC BY) license (http://creativecommons.org/licenses/by/4.0/).