1. Introduction
Currently, power LEDs emitting light of different colors are easily accessible. The light emitted by these devices is characterized by different spectra and each color is connected with the definite wavelength of the emitted light [
1,
2,
3]. In the literature, one can find a lot of information on investigations concerning the considered class of diodes emitting white light used in the lighting technique [
4,
5,
6]. Additionally, some papers refer to diodes emitting monochromatic light [
7,
8,
9].
In the paper [
10], RGB LEDs with monolithically integrated photodetectors are proposed. Such structures are used to control the color coordinates of RGB LEDs. The paper [
11] proposes precise dimming and color control of an LED system. This system uses a bicolor adjustable LED lamp and makes it possible to precisely control CCT (correlated color temperature) and radiance. In the paper [
12], the method of controlling the luminous intensity and CCT of a lighting system including white power LEDs is proposed. Analytical dependences describing the mentioned parameters of such a system are formulated and discussed.
The paper [
13] presents equations describing the influence of the diode internal temperature and electrical power dissipated in the diode on luminous efficiency and luminous flux. The mentioned dependences have the form of a polynomial of the second or third order. Additionally, a manner of determining the value of the heating power is proposed in the cited paper. Using the proposed dependences, it was shown how to estimate the value of the diode forward current, at which the emitted luminous flux has the maximum value. In the paper [
14], a dynamic version of the description of power LED properties given in the paper [
13] is proposed. The proposed equations make it possible to calculate waveforms of luminous efficiency and the internal temperature of power LEDs operating continuously in typical lighting systems or operating in the switched mode, for example, in traffic lights.
In the paper [
15], a method of measuring the internal temperature of power LEDs is proposed. This method is based on the general photo-electro-thermal theory for LED systems and the coefficient characterizing the reduction of luminous efficiency with junction temperature. Good agreement between the results of the measurements obtained with the proposed method and the data given by the producers of different types of LEDs is achieved.
The papers [
16,
17] present the theory and photo-electro-thermal model of phosphor-coated LEDs. Apart from the properties of the LED structure, the dynamic properties of phosphor coating used in power LEDs to obtain white light are also taken into account. The results illustrating the correctness of the proposed model are shown and commented upon. In the paper [
18], some results of analyses performed with the use of such a model are compared with the results of dynamic measurements.
As it is commonly known, junction temperature strongly influences the properties of semiconductor devices, for example, power LEDs [
3,
4,
6,
19,
20,
21,
22,
23,
24] and electronic networks [
25,
26]. The value of this temperature is higher than the ambient temperature due to self-heating phenomena and mutual thermal couplings between devices situated on the common PCB or a heat-sink. The value of junction temperature increases with an increase in thermal power dissipated in the considered device and it depends also on the efficiency of removal of the heat generated in this device to the surroundings [
4,
6,
27]. This efficiency could be characterized, for example, by thermal resistance or transient thermal impedance.
The influence of the device internal temperature on the electrical and optical properties of the considered devices is very important [
6,
27,
28,
29,
30]; also an increase in the device internal temperature considerably shortens the lifetime of these devices [
5,
31,
32,
33]. Another important problem is the thermal management of power LEDs. As it is shown in the paper [
5], an increase in the diode temperature equal to 20 °C can cause even a six-time decrease of its lifetime.
To characterize the thermal properties of semiconductor devices situated on the common PCB, transfer transient thermal impedances are additionally used [
6,
34,
35,
36]. While measuring these parameters, the efficiency of the conversion of electrical energy into light is of essential significance, and it depends on the colors of the emitted light [
3,
37].
On the other hand, optical properties of power LEDs are characterized by, for example, illuminance and the surface power density on the surface illuminated by these devices [
3,
38]. In our previous papers [
26,
36,
37], the method of measuring thermal and optical parameters of power LEDs is described, but its usefulness was verified only for LEDs emitting white light.
LEDs emitting light of different colors are made of various semiconductor materials [
3]. Each such material is characterized by specific values of material parameters, for example, band-gap voltage. They are also characterized by a narrower spectrum characteristic of the emitted light than power LEDs emitting white light [
3,
21]. Generally, photometric parameters characterize properties of the observed light taking into account the properties of the human eye. Due to differences between the spectrum characteristics of the considered color power LEDs with the same value of surface power density as the emitted lighting, different values of illuminance measured in the same distance from the tested diode can be observed [
3].
The manufacturer of the considered class of semiconductor devices typically gives information about the properties of these devices obtained at quasi-ideal operating conditions. In the characteristics of power LEDs presented in the catalog data, the influence of such phenomena as self-heating or mutual thermal couplings with other devices on the properties of these power LEDs is usually omitted. In order to characterize the properties of the considered devices operating in real conditions, some measurements should be performed. On the other hand, the authors could not find in the literature any systematic study describing the influence of self-heating and mutual thermal couplings on thermal and optical properties of power LEDs situated in the same packages and soldered to the common PCB.
The aim of this paper, which is an extended version of the paper [
39], is to investigate the influence of the spectra of the emitted light on the electrical, thermal, photometric and radiometric parameters of white and color power LEDs situated on the common PCB. Set-ups indispensable to measuring the mentioned parameters were designed and constructed. Measurements were performed for power LEDs situated in identical cases and emitting light of selected colors or white light of different CCT. The results of measurements obtained for the tested devices at different operating conditions are compared and discussed. In comparison with the paper [
39], we extended the description of the investigated diodes, the used measurement set-ups and the measurement methods. This paper contains new results of investigations that were performed for a bigger number of tested devices than in the paper [
39]. The new results of measurements illustrate the influence of self-heating phenomena and mutual thermal couplings between the tested devices on their optical and thermal properties.
In
Section 2, the tested devices are described.
Section 3 presents the used measurement set-ups. The results of the measurements are shown and discussed in
Section 4.
2. Tested Devices
We performed measurements for four colored and two white power LEDs by OSRAM Semiconductor [
37]. Each of these diodes emits light of different colors: LW (White), LCW (Warm White), LB (Blue), LT (Green), LY (Yellow) and LR (Red). We selected such diodes taking into account the following reasons:
- (a)
they are manufactured by a famous company,
- (b)
all the diodes are mounted in cases of the same type,
- (c)
they emit light typically used in such popular applications as hospitality, mood lighting, stage lighting, table lamp, signaling in cars and planes (for white, yellow and red LEDs), transportation, planes and ships (for green and blue LEDs).
According to the data given by the producer [
40], the maximum allowable forward current of these diodes amounts to 1 A, whereas the viewing angle is equal to 120°. The maximum admissible junction temperature of these diodes is 135 °C.
Table 1 contains values of the total luminous flux Φ
V, thermal resistance R
thj-s between the junction and the soldering point and dominant wavelength λ
max for all the tested LEDs.
The total luminous flux changes from 15 lm for a blue diode to 130 lm for a white diode at forward current equal to 0.35 or 0.4 A. The different values of forward current, at which the value of the luminous flux is measured, are given by the manufacturer. It is also worth noticing that for two diodes of the same type one can obtain values of Φ
V which differ even twice as much. The producer gives in the catalog data the information on the minimum and maximum value of the emitted luminous flux of the considered types of power LEDs and additionally defines four models of each type of the investigated diodes. Each of these models is characterized by the value of the emitted luminous flux from a range four times narrower than the range given in
Table 1. The thermal resistance of these diodes between the junction and the soldering point falls in a range from 5 to 6.5 K/W [
40]. Different values of R
thj-s prove that the properties of the semiconductor material used to produce the considered diodes can cause a change in the value of the considered parameter even by 30%. Additionally, it is apparent that the phosphor coating used in LEDs emitting white light practically does not influence the value of R
thj-s. Values of the dominant wavelength λ
max fall in a range from 467 nm to 628 nm. According to the information given by the producer diodes, LCW, LB, LT and LW are made of GaN, whereas the diodes LY and LR are made of InGaAlP [
40].
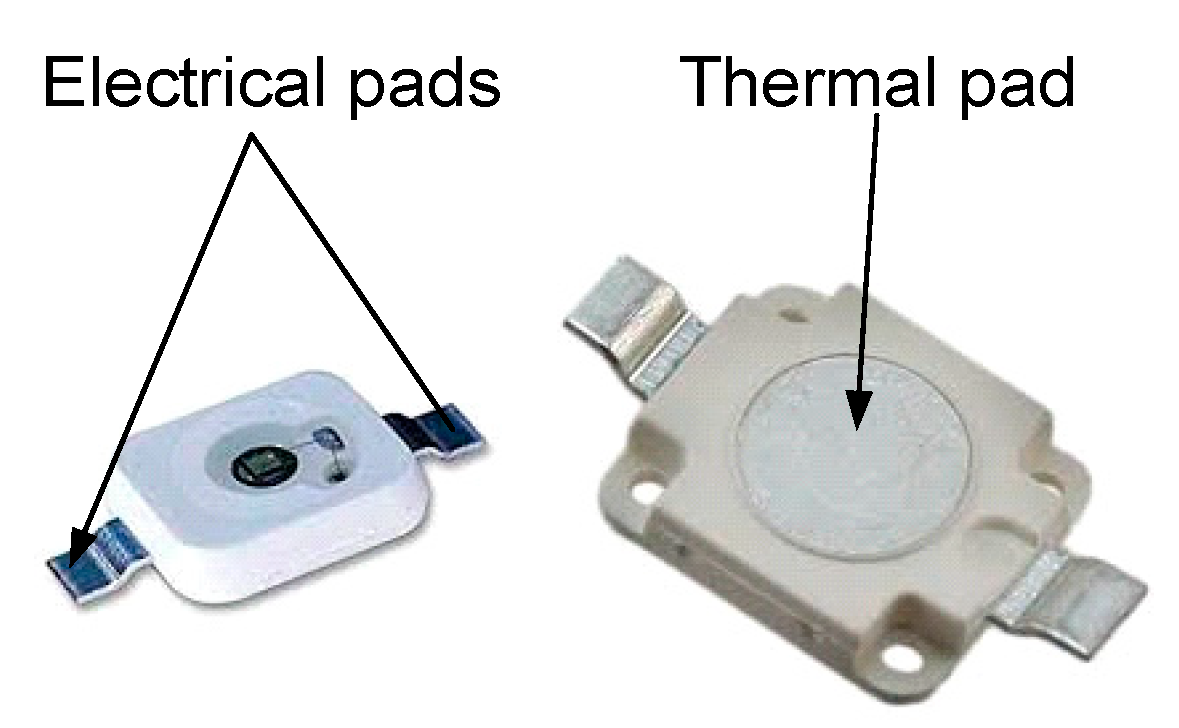
The view of the case of the considered power LEDs is shown in
Figure 1 [
41]. This case has the dimensions, 7.2 × 6.2 × 1.9 mm. It is visible that this case contains a thermal pad, which makes it possible to reduce the thermal resistance of the tested diodes [
42].
Relative emission spectra of the considered power LEDs are shown in
Figure 2.
It is visible that the presented relative emission spectra for the red and yellow diodes are very narrow, and their FWHM (Full Width at Half Maximum) is from 15 to 20 nm. The other diodes have wider spectra. For blue and green diodes the FWHM is from 30 to 40 nm. Of course, the widest spectra were measured for the LEDs emitting white light. For these diodes, two maxima are observed in the range of blue light and yellow-green light.
All the tested diodes use the same lens. Therefore, they have the same emission characteristics shown in
Figure 3. These characteristics can be approximated with the square function. As can be observed, the maximum emission angle α
max is equal to 85°.
The investigated power LEDs are assembled in identical cases and soldered in the same process to the same PCB of the dimensions 100 × 100 mm with the basis FR-4 which is glass-reinforced epoxy laminate material. It is a composite material composed of woven fiberglass cloth with an epoxy resin binder that is flame resistant. This PCB is 1.5 mm thick and contains an internal copper layer. This layer is used as the electrical connection between the anodes of all the LEDs. The tested diodes are situated in two rows lying at a distance of 18 mm from each other. In each row, the distance between the diodes is equal to 30 mm.
3. Measurements Set-Ups and Methods
Selected characteristics of the considered devices were measured with the use of two measurement set-ups. The first is dedicated to measuring the properties of the diodes operating separately. The diagram of this set-up is shown in
Figure 4. The other set-up, shown in
Figure 5, makes it possible to measure the characteristics of the tested devices with mutual thermal couplings taken into account.
Figure 6 contains a photo of the measurement set-up of the diagram shown in
Figure 5.
With the use of the set-up shown in
Figure 4, dc current-voltage characteristics of the tested diodes can be measured at a thermally steady state and such parameters of these diodes as transient thermal impedance, illuminance and the surface power density of the emitted light. In order to eliminate the influence of other lighting sources on the results of measurements, the tested diodes are situated in a light-tight chamber of the dimensions, 400 × 250 × 220 mm. In turn, a precision luxmeter and a radiometer are used to measure illuminance and the surface power density of the emitted light, respectively. These measurements can be realized at the steady state and at the transient state. Probes of the radiometer and the luxmeter are situated in the axis of the tested diodes. Therefore, measurements with the use of the mentioned instruments cannot be performed at the same time. A radiometer of the type HD2302 by DeltaOhm [
43] and the precision luxmeter L-100 by Sonopan [
44] were used. According to the user manual of the radiometer [
43], this radiometer can measure radiation of a spectral range from 400 to 1050 nm with calibration uncertainty smaller than 5%. In turn, the used precision luxmeter L-100 was calibrated by the manufacturer and its accuracy is characterized by class A by CIE.
The considered set-up makes it possible to measure real transient thermal impedance as defined in the paper [
45]. In the definition of this parameter, it is taken into account that only a part of dissipated power (heating power) causes self-heating phenomena and the other part of this power (optical power) is converted into light.
The indirect electrical method is used to measure transient thermal impedance. One can find a detailed description of this method in the paper [
27].
This method uses forward voltage V
F of the diode biased with a current of a small value I
M as a thermo-sensitive parameter. The value of such a parameter nearly linearly depends on the device internal temperature [
46,
47,
48]. Measurements of the device internal temperature are realized in three steps. At first, the thermometric characteristic V
F(T) is measured at the fixed value of the diode forward current I
M. In this step of measurements, switch S is opened and the diode is situated in a thermal chamber the temperature of which can be regulated. In the second step of measurements, switch S is closed and the internal temperature of the diode increases as a result of self-heating phenomena connected with current I
H flowing through the diode. At the thermally steady state, the diode current I
H is measured using the ammeter, forward voltage V
H is measured with the A/D converter module, illuminance with the luxmeter and the surface power density of the emitted light with the radiometer. Waveforms of the diode forward voltage are recorded using instrumentation amplifiers, the A/D converter module and a PC, whereas the heating current is measured using the ammeter. In the third step, immediately after switching off switch S, current I
M flows through the diode and the diode forward voltage V
C is measured. Using the measured waveform of forward voltage V
C(t) and the thermometric characteristic V
F(T), the value of the waveform of internal temperature T
j(t) is determined. Finally, transient thermal impedance is determined with the use of the following formula:
The value of optical power
Popt is determined with the use of the method described in [
38,
41]. In this method, in order to measure the value of optical power
Popt of the investigated power LEDs at the steady state one should [
38,
41]:
measure the surface optical power density Εe using the radiometer situated at a distance r from the surface of the LED at the end of the second step of the measurements,
calculate the average value of the relative surface optical power density using the catalog emission characteristics (dependence of relative intensity on the angle of observation α),
calculate optical power
Popt using the following formula [
49]:
In the paper [
50], it was shown that the results of measurements obtained with the use of the described measurement set-up are practically the same as the results obtained with the use of a standard T3Ster instrument [
51].
In turn, in order to measure mutual transient thermal impedances of the considered diodes, the set-up shown in
Figure 5 was used.
In the set-up shown in
Figure 5, only one diode (DUT
1) plays the role of a heater, whereas the other diodes are temperature sensors. In this set-up, E
D is the power supply voltage of the output voltage equal to 14.5 V. Devices denoted as DUT
1-DUT
6 are the tested power LEDs. Resistors R
H and R
M1-R
M6 are used to regulate the heating current I
H and to measure the current I
M of each diode. Voltage source E
GS is used to drive the gate of power MOSFET T
1. Resistor R
1 limits the value of the gate current while switching transistor T
1. Switch S
1 is open while heating diode DUT
1 and closed while cooling it.
Measurements of mutual transient thermal impedance are realized in the three steps described above, but in the third step of measurement, values of the forward voltage of all the diodes are registered. The mutual transient thermal impedance between diode DUT1 and one of the other diodes DUTi is determined with the use of the Formula (1), in which instead of Tj(t) temperature, the junction temperature of the diode DUTi must be used, whereas VH and IH correspond to the forward voltage of diode DUT1 at a forward current of the diode IH. Popt is the optical power of the light emitted by diode DUT1. In order to measure all mutual transient thermal impedances, six measurement cycles should be performed. In each cycle, any diode of the other diodes is used as a heater DUT1.
4. Measurements Results
Figure 7 illustrates the measured dependences of the forward voltage of the selected tested diodes on the temperature at a low value of forward current I
F = 10 mA. During the measurements, the considered power LEDs were situated in the thermal chamber, which stabilized the value of temperature with the error not higher than ±2 K.
It is visible that the considered dependences V
F(T) are practically linear. The slope of the measured characteristics falls in a range from −2.652 mV/K for the LB diode to −1.373 mV/K for the LW diode. The measured values of forward voltage were highest for the LB diode and lowest for the LY diode. Differences in values of forward voltage are observed due to differences in the band-gap of materials used to construct the dies of the tested power LEDs. Using the obtained results of measurements and the formula proposed in the paper [
18], values of the band-gap of the tested diodes were calculated. These values for the tested diodes fall in a range from 2.04 to 3.37 eV. Such values correspond to the semiconductor materials typically used to construct power LEDs.
Figure 8 illustrates the measured waveforms of transient thermal impedance Z
th(t) of the tested power LEDs obtained at forward current I
F = 1 A (
Figure 8a) and the dependence of thermal resistance on the central wavelength λ of the spectrum of the emitted radiation (
Figure 8b).
As visible in
Figure 8a, the thermally steady state for all the diodes is observed for the time t ≈ 2000 s. At the steady state, visible differences between values of transient thermal impedance (equal to thermal resistance R
th) for the tested power LEDs are observed. Values of thermal time constants describing each of the measured waveforms of Z
th(t) were estimated using the method described in the paper [
25]. For each of the considered devices, seven thermal time constants of values from 2.3 ms to 1800 s were obtained. These thermal time constants characterize particular components of the heat flow path of these power LEDs—from the semiconductor die to the PCB.
In turn,
Figure 8b shows that thermal resistance visibly depends on the color of the emitted light. The highest value of thermal resistance, equal to about 39.9 K/W, is observed for the LY diode, whereas the lowest value of R
th is obtained for the LT and LCW diodes. Differences between values of R
th for the mentioned diodes even reach 15%. These differences result from differences in thermal power dissipated in the considered diodes and the influence of the device internal temperature on their thermal resistance described, for example, in [
52]. The results of the measurements (points) can be correctly approximated (line) with the use of a polynomial of the third degree.
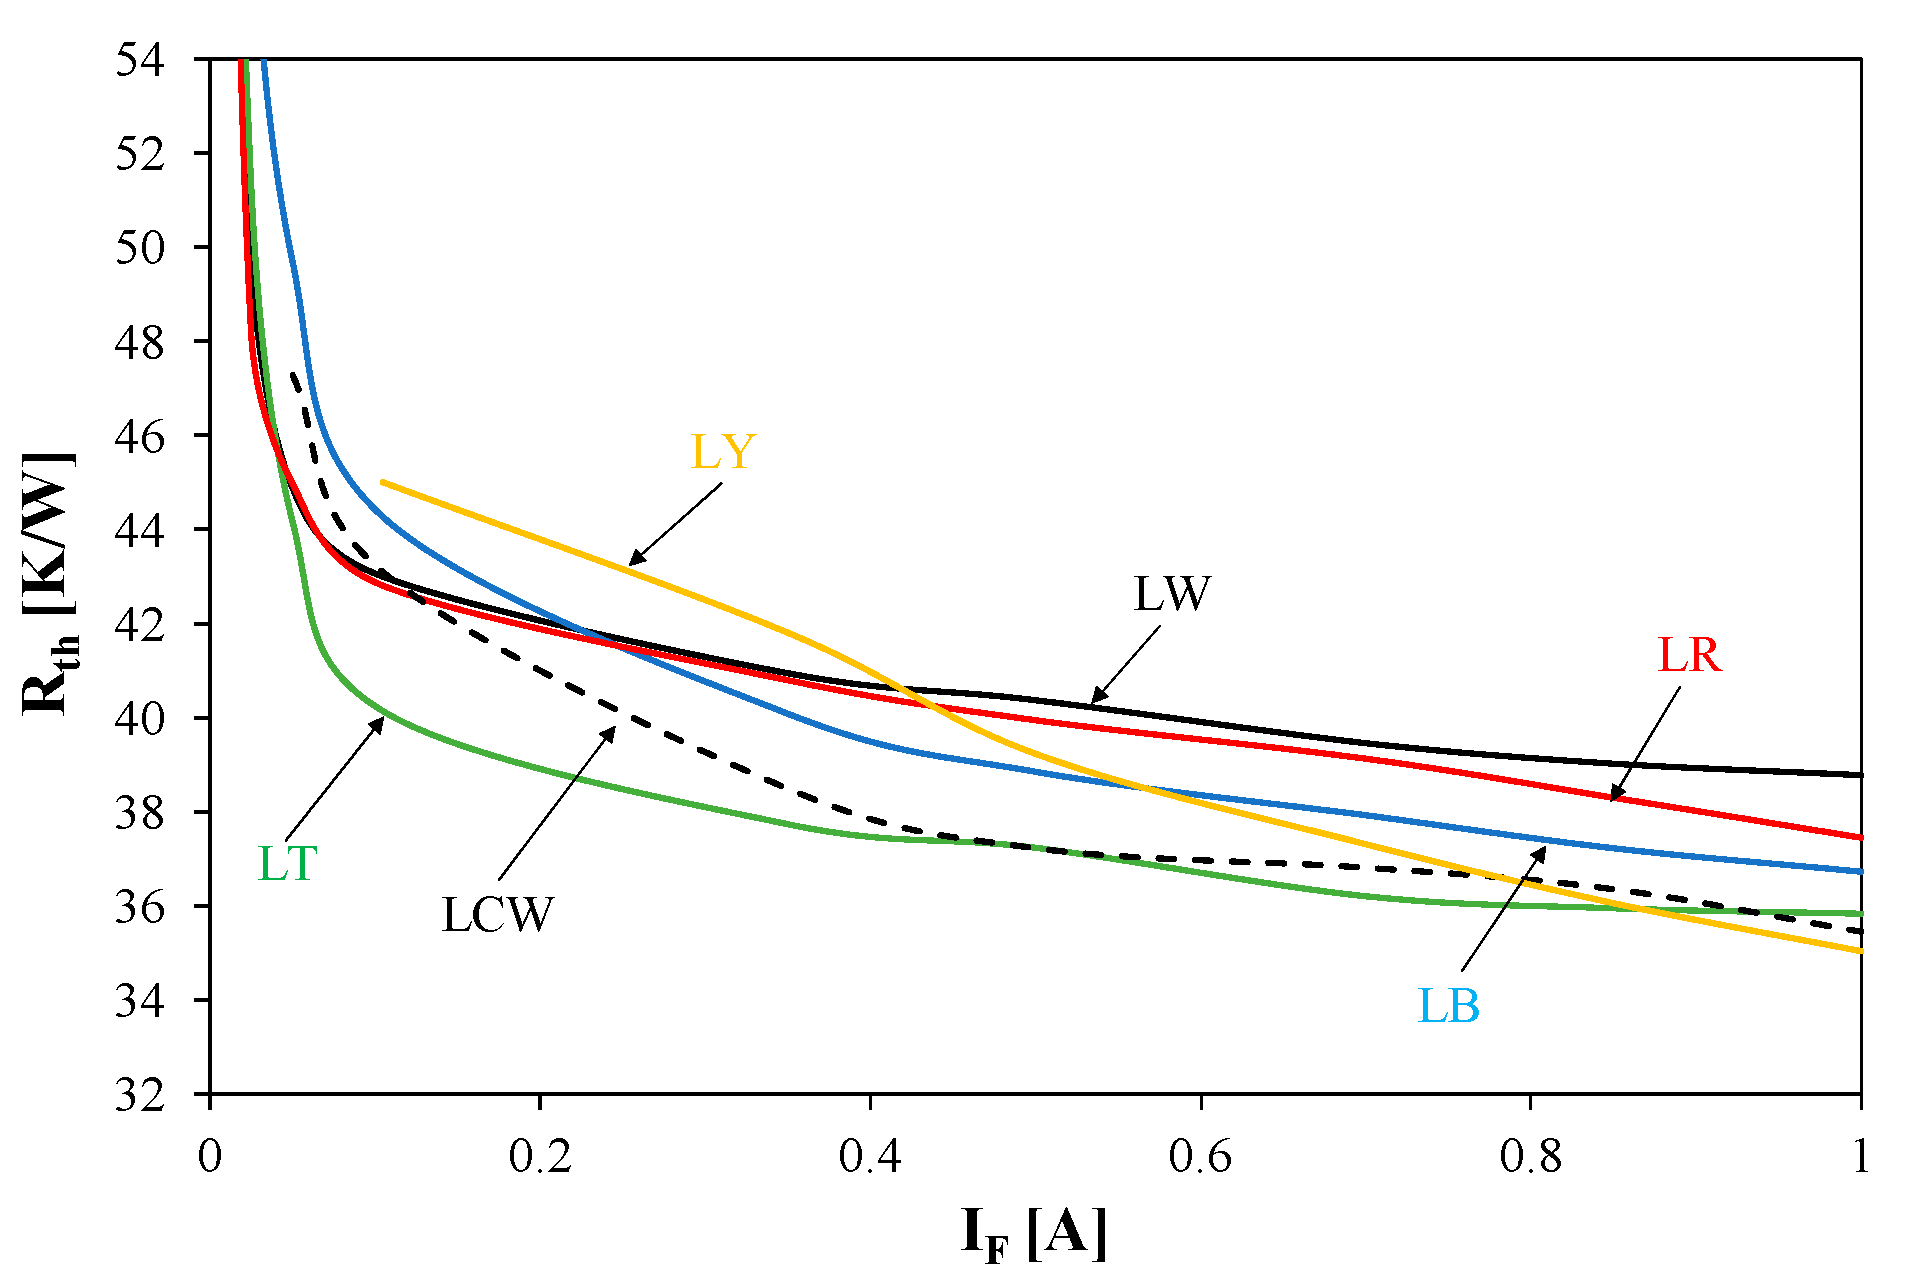
Additionally, we performed measurements of waveforms of transient thermal impedance and values of thermal resistance of all the tested power LEDs operating at different values of forward current. For example,
Figure 9 shows the measured dependences of thermal resistance R
th of these LEDs on forward current I
F.
For all the tested diodes, the dependence R
th(I
F) is a decreasing function. The slope of this dependence decreases with an increase in the current I
F. This slope is different for each of the diodes. For example, for the LT diode in the range of changes in the value of current I
F between 0.1 A and 1 A, the value of R
th decreases even by 10%. According to the considerations presented in the paper [
53], values of R
th obtained at low values of current I
F could be characterized by a big measurement error.
Figure 10 illustrates the dependences of the temperature of the soldering points of the tested LEDs on their forward current. The temperature of the soldering point T
S and ambient temperature T
a were measured with the use of thermocouples.
As can be observed, for each diode dependence TS(IF) is an increasing function. Differences between the results obtained for different diodes increase with an increase of forward current and they are equal to even 15 °C. They result from differences: in the diode forward voltage and in the efficiency of conversion of electrical energy into light of the tested diodes.
Figure 11 shows the measured dependences of the surface power density E
e of the emitted light on forward current. The measurements were performed at the thermally steady state with the use of the radiometer. The probe of the radiometer was situated in the axis of the tested diode in the distance r = 17 cm.
As visible, the considered dependence is an increasing function in a wide range of forward current. Only for the LR and LY diodes the maximum at forward current equal to I
F = 0.8 A was observed. Values of the surface power density Ε
e measured for the same value of current I
F differ from one another by even 10 times. The highest value of Ε
e was obtained for the LB diode. In turn, the lowest value of this parameter was measured for the LY diode. The presented results of the measurements show that a high value of the emitted optical power can be more easily obtained for blue light than for other colors of the emitted light. It is also worth noticing that for diodes emitting neutral white light values of Ε
e are even twice as high as for such devices emitting warm white light. The observed differences in Ε
e for the considered power LEDs are a result of the dependence of internal quantum efficiency on the wavelength of the emitted light [
3].
Figure 12 illustrates the dependences of the surface power density of the surface illuminated by the considered diodes on the central wavelength λ of the spectrum of the emitted radiation. The measurements were performed at selected values of forward current. In this figure, blue points denote the results obtained at current I
F = 25 mA, red points at I
F = 0.35 A and black points at I
F = 1 A.
As visible, values of parameter Ee measured at the same value of current IF for the considered diodes visibly differ from one another. These differences can even be triple. The highest values of parameter Ee are obtained for the LB diode, whereas the lowest for the LY diode. For each of the tested diodes, an increase in the value of forward current causes an increase in the value of Ee. When this current increases 40 times the surface power density increases only 16 times. The presented results show that it is easier to obtain a high value of the surface power density of the emitted light in the range of blue light than in the range of green, red, white or yellow light.
On the basis of the obtained results of measurements, the analytical dependence E
e(λ) in the form of a polynomial of fourth degree was proposed. The coefficients existing in this formula depend on the value of the forward current. Dependences calculated with the use of the elaborated formula are marked in
Figure 12 with lines. As visible, very good agreement between the results of measurements and calculations was obtained.
Figure 13 shows the dependences of the optical efficiency η
opt of the tested power LEDs on their forward current. Optical efficiency is defined as the quotient of the optical power of the emitted light and electrical power consumed by the considered diode. A high value of watt-hour efficiency of the conversion of electrical energy into light η
opt is very important for designers and users of the considered semiconductor devices.
It is easy to observe that the considered dependences possess the maximum value at forward current IF ≈ 25 mA. The highest value of parameter ηopt can be observed for the LB diode. This value even reaches 43%. In contrast, the maximum value of optical efficiency obtained for the LY diode is equal to only 13%. In the range of high values of forward current, exceeding 200 mA, the highest value of optical efficiency is observed for the LR diode. It can be noticed that an increase in the value of forward current in the range from 25 mA to 1 A causes even a double decrease in the value of optical efficiency. This relation shows that in order to obtain a high value of optical efficiency the tested power LEDs should operate at values of forward current much lower than their maximum allowable value declared by the producer.
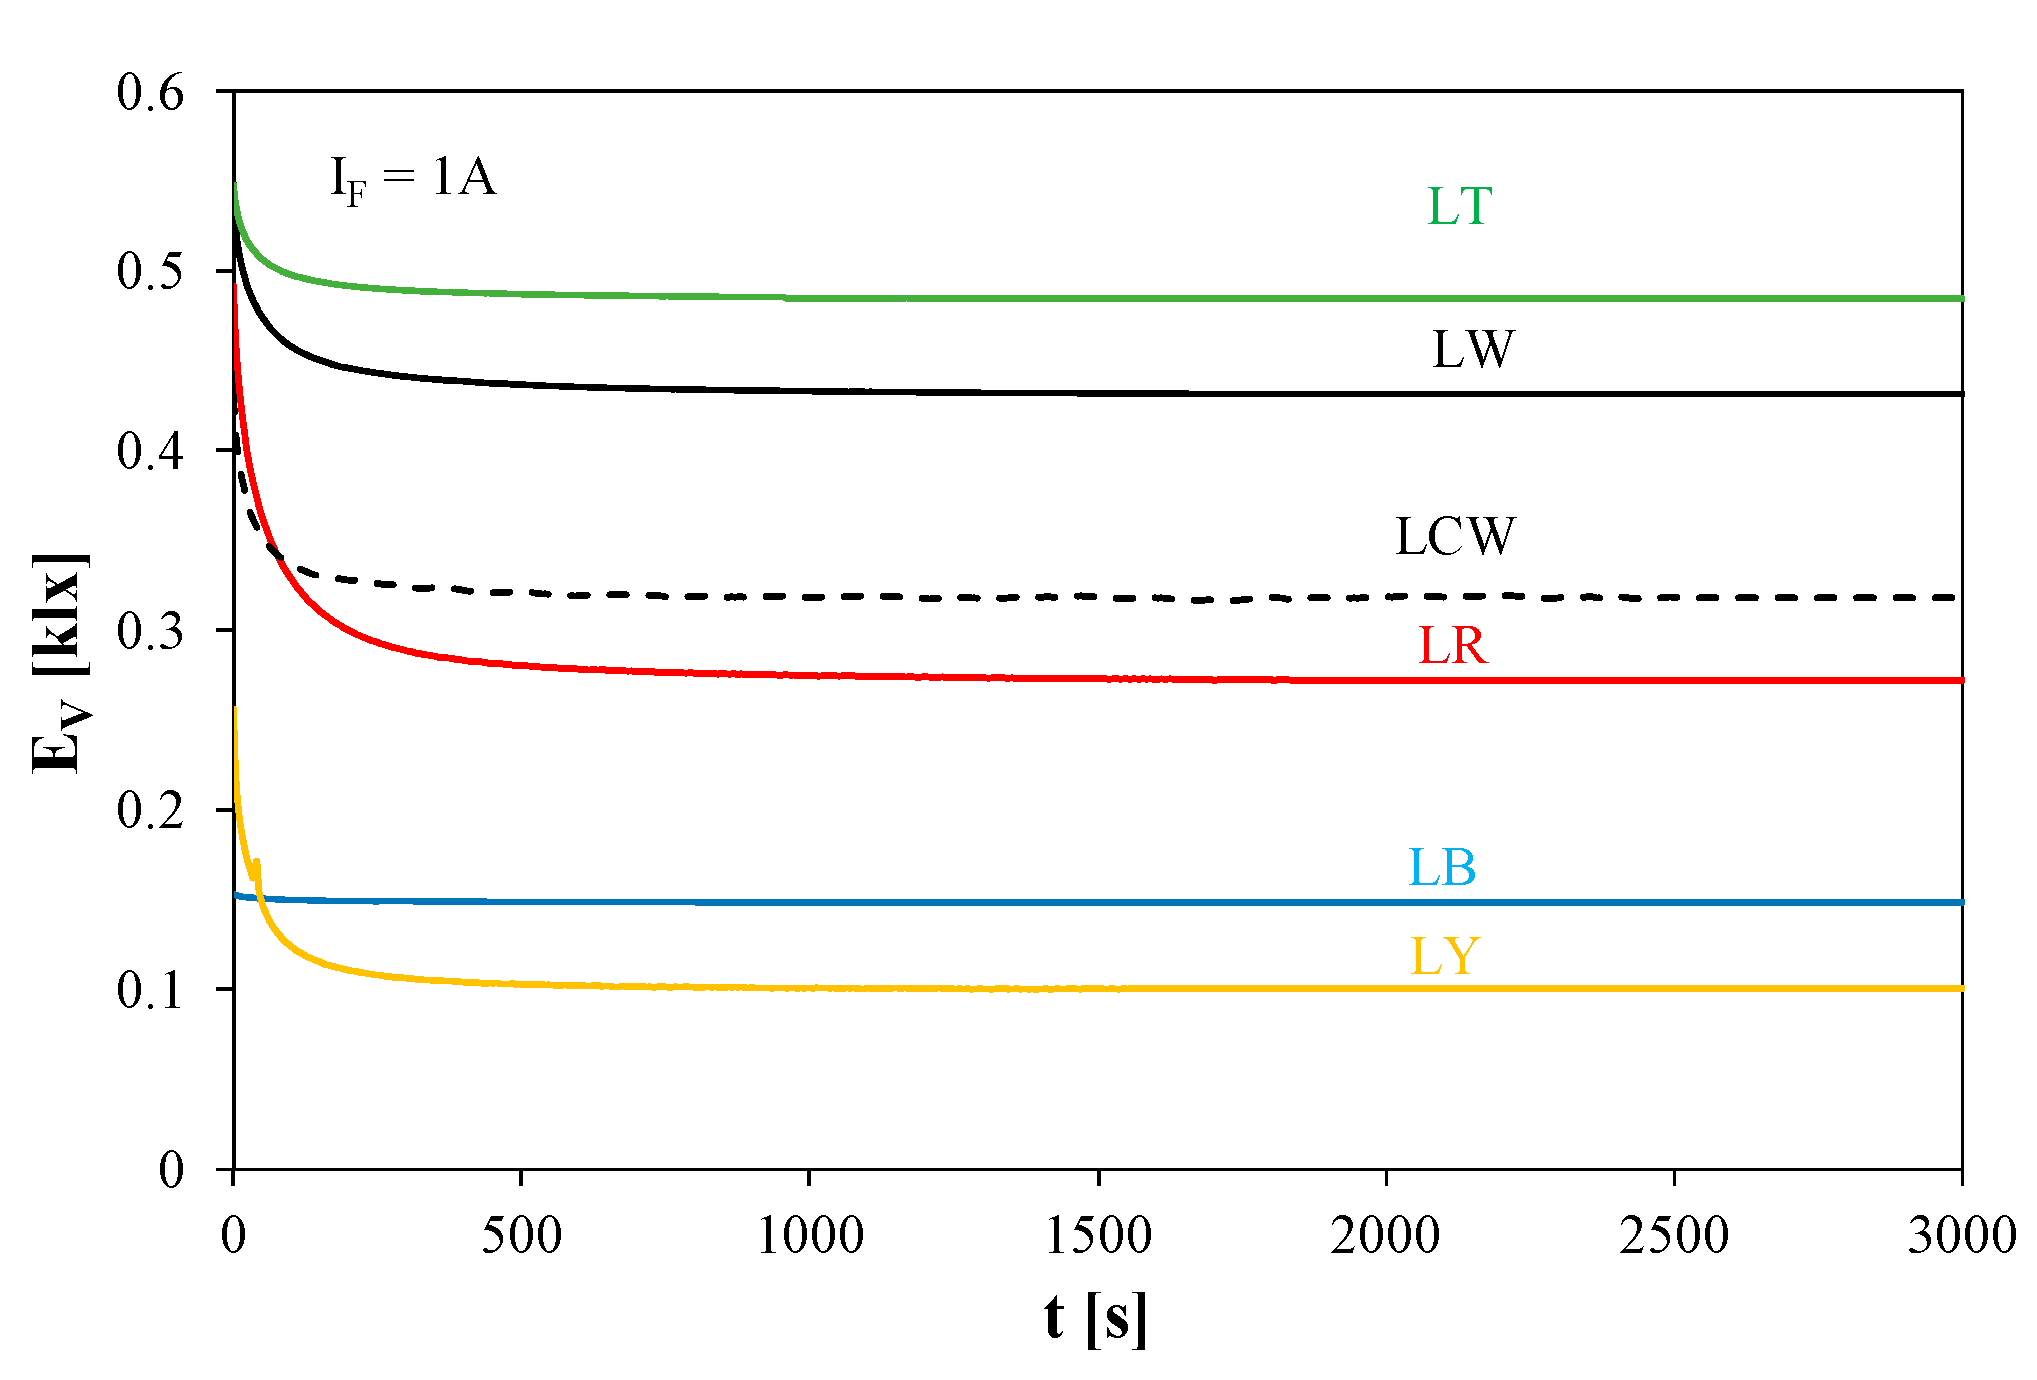
Figure 14 shows waveforms of illuminance E
V measured on the surface illuminated by the considered LEDs excited with a step of forward current of the value equal to 1 A. The measurements were performed with the use of a probe of the luxmeter situated in the axis of the tested diodes and at a distance between them equal to 17 cm.
As can be observed, the obtained waveforms EV(t) are decreasing functions of time. This is a result of self-heating phenomena occurring in these power LEDs. Values of illuminance at the steady state are highest for the LT diode and lowest for the LY diode. The obtained values of this parameter at the steady state differ from one another for the tested diodes even five times. The observed differences are a result of the quantum efficiency of the tested devices and the spectrum characteristic of the sensitivity of the human eye. This sensitivity has the highest values for green light. Due to the various spectra of the emitted light produced by each diode and the spectra of the sensitivity of the human eye, relations between values of illuminance of the considered diodes are different than relations of the surface power density characterizing the light emitted by the same diodes.
Measurements, the results of which are shown in
Figure 7,
Figure 8,
Figure 9,
Figure 10,
Figure 11,
Figure 12,
Figure 13 and
Figure 14, were performed while feeding one tested diode only. Other diodes were not fed. In contrast,
Figure 15,
Figure 16 and
Figure 17 illustrate the influence of mutual thermal couplings on the thermal and optical properties of the tested diodes.
Figure 15 illustrates waveforms of self and transfer transient thermal impedances of the tested power LEDs measured using the set-up shown in
Figure 5. Measurements were performed while heating the LT diode (
Figure 15a) and the LY diode (
Figure 15b). The LT diode was situated in the middle of the PCB including all the diodes, whereas the LY diode was close to the border of this PCB.
As visible, self-transient thermal impedances of the tested diodes differ by even 10% from one another. A higher value of this parameter is observed for the LY diode situated near the border of the PCB. It is worth noticing that transfer transient thermal impedances are much lower (even 15 times) than self-transient thermal impedances. The waveforms of mutual transient thermal impedances depend on the distance between the thermally coupled diodes. An increase in the distance between such diodes causes a decrease in the value of mutual thermal resistance and an increase in time indispensable to obtain the thermally steady state. For the diodes situated at the same distance from the heating diode, nearly the same waveforms of transfer thermal impedance were obtained.
Figure 16 illustrates waveforms of internal temperatures of all the diodes while cooling after obtaining the thermally steady state at a simultaneous power supply. The value of current I
F for each diode is equal to 750 mA.
The measured values of temperature Tj for the tested diodes differ visibly from one another. The observed differences exceed even 30 °C. This means that visible non-uniformities in temperature distribution on the PCB are observed and the use of only one value of temperature characterizing the whole PCB of the tested devices could result in high values of errors in the estimation of such temperature. It is also worth noticing that at forward current much lower than allowable, the value of junction temperature of selected diodes could be higher than their maximum allowable value due to self-heating and mutual thermal couplings between the devices operating on the common PCB.
In order to illustrate the influence of mutual thermal couplings on thermal and optical properties of the tested power LEDs, values of junction temperature T
j of these diodes and the surface power density Ε
e are measured in two cases. In the first case (denoted with red color), current I
F = 750 mA flows through one tested diode only. In the other case (denoted with green color), this current flows simultaneously through all the diodes. The results obtained at the steady state are shown in
Figure 17. During the measurements of E
e, the probe of the radiometer was situated in the distance r = 3.5 cm from the tested diode.
In
Figure 17a, it is easy to observe that the power supply of the other diodes causes an additional increase in junction temperature. This increase is lowest for the LB diode (equal to 20 °C) and highest for the LCW diode (equal to 40 °C). As a result of an increase in junction temperature, a decrease in Ε
e is observed in
Figure 17b. The biggest decrease occurs for the LR diode. It is equal to even 40%. The measurement results presented above prove that mutual thermal couplings between power LEDs situated on the common PCB could visibly and unfavorably influence values of the device junction temperature and parameters characterizing the emitted light.
5. Conclusions
This paper presents measurement results illustrating the influence of the spectra of the emitted light on selected optical and thermal parameters of power LEDs operating on the common PCB. All the tested devices are assembled in the same type of cases and soldered in the same process. The measurements were performed for diodes emitting monochromatic light (blue, red, green or yellow) or white light characterized by different values of CCT. The dies used to construct the tested devices were made of different semiconductor materials.
In contrast to the results presented by the producer, in our investigations, the thermal phenomena occurring in the tested devices were taken into account. There are self-heating and mutual thermal couplings between each pair of diodes operating on the common PCB. As a result of thermal phenomena, the measured values of optical parameters visibly differ from values given by the producer in the catalog data and the junction temperature of each diode can be much higher than the ambient temperature.
The results of the performed measurements prove that the spectra of the emitted light strongly influence such optical parameters of power LEDs as optical efficiency, illuminance and the surface power density on the surface illuminated by the tested diodes. The results of measurements of the mentioned parameters obtained for power LEDs emitting light of different spectra differ from one another by even 10 times. Radiometric parameters have the highest values for the diode emitting blue light, whereas photometric parameters are highest for the diode emitting green light. This is a result of both the physical properties of the used semiconductor dies and the spectra characteristic of the sensitivity of the human eye. Dependences of the mentioned optical parameters and thermal resistance on the central wavelength λ of the spectrum of the emitted radiation can be effectively described with the use of polynomial functions.
Analyzing the measured dependences of selected optical parameters on forward current, one can easily notice that the most favorable is the operation of the tested devices at forward current of a value much lower than the maximum allowable value given by the producer. A decrease in the value of optical efficiency at an increase in the forward current can reach even 50%.
The spectra of the emitted light visibly influence the value of thermal resistance of the tested devices. This parameter can have values which differ even by about 10% between the tested diodes. These differences could be a result of the different places of mounting for these devices on the PCB and the distance between the tested power LED and the border of the PCB. It is also worth noticing that for the considered diodes operating alone at the same value of forward current, big differences in the junction temperature of the tested devices were obtained. These differences can even exceed 30 °C. Therefore, during the formulation of a thermal model of solid state lighting sources, the junction temperature of each diode should be calculated separately.
The applied method of mounting the tested diodes limits the maximum value of the junction temperature of the tested devices to about 110 °C. It was also noticed that the differences between this temperature and the temperature of the soldering point can be higher than even 40 °C. Therefore, in order to obtain a long lifetime for the tested devices, efficient heat removal from the soldering point is needed.
In turn, the measurements performed for all the tested diodes operating together illustrate that mutual thermal couplings between power LEDs situated on the common PCB can visibly change the value of junction temperature of the tested diodes. In the case when all the diodes operate together, this temperature can be higher even by 40 °C than in the case when the diode operates alone with the same value of forward current. This increase in junction temperature Tj also causes a visible decrease in the surface power density Ee. Changes in values of Tj and Ee strongly depend on the color of the emitted light. They are lowest for the diode emitting blue light and highest for the diodes emitting yellow or red light. The changes in the values of Ee caused by mutual thermal couplings can exceed even 50%. Therefore, while modeling properties of solid state lighting sources, mutual thermal couplings between power LEDs situated on the common PCB should be taken into account.
The results of investigations presented in this paper are obtained for one family of power LEDs only, but the obtained relations between electrical, optical and thermal parameters of these devices have a universal character. The influence of self-heating and mutual thermal couplings on optical and thermal parameters of power LEDs is characterized by decreasing functions of thermal power and the distance between the thermally coupled devices. Additionally, the spectra of the emitted light influence self and transfer thermal resistances of the tested power LEDs.
The obtained results of investigations could be usable for designers of solid-state lighting sources, including power LEDs, emitting light of different colors. They can be also used as teachings to illustrate the influence of the spectra of the emitted light and thermal phenomena on the properties of selected lighting sources. In the near future, we will propose a computer model of power LEDs that will take into account the properties of the devices presented in this paper.


