Abstract
In this paper, we report on an in-house developed electronic nose (E-nose) for use with breath analysis. The unit consists of an array of 10 micro-electro-mechanical systems (MEMS) metal oxide (MOX) gas sensors produced by seven manufacturers. Breath sampling of end-tidal breath is achieved using a heated sample tube, capable of monitoring sampling-related parameters, such as carbon dioxide (CO2), humidity, and temperature. A simple mobile app was developed to receive real-time data from the device, using Wi-Fi communication. The system has been tested using chemical standards and exhaled breath samples from healthy volunteers, before and after taking a peppermint capsule. Results from chemical testing indicate that we can separate chemical standards (acetone, isopropanol and 1-propanol) and different concentrations of isobutylene. The analysis of exhaled breath samples demonstrate that we can distinguish between pre- and post-consumption of peppermint capsules; area under the curve (AUC): 0.81, sensitivity: 0.83 (0.59–0.96), specificity: 0.72 (0.47–0.90), p-value: <0.001. The functionality of the developed device has been demonstrated with the testing of chemical standards and a simplified breath study using peppermint capsules. It is our intention to deploy this system in a UK hospital in an upcoming breath research study.
1. Introduction
The diagnostic potential of breath was first utilised by ancient Greek physicians who understood that distinct odours and aromas could be related to specific diseases [1]. In recent years, applications of breath analysis have focused on the non-invasive detection of volatile organic compounds (VOCs), using different technological platforms. It has been suggested that there are over 3000 VOCs in human breath that are a combination of by-products of normal metabolic activity and, in some cases, specifically associated with a disease [2]. Changes in VOC composition or concentrations serve as potential biomarkers for the detection and monitoring of disease, such as chronic obstructive pulmonary disease (COPD) [3], colorectal cancer [4], and many more [5]. Gas chromatography-mass spectrometry (GC-MS) is generally considered the “gold standard” for breath research and is the most commonly used technique [6]. GC-MS is considered an offline method because samples need to be collected (and potentially stored) onto, for example, thermal desorption (TD) tubes or sampling bags, prior to analysis. Other commonly used technologies include proton-transfer-reaction mass-spectrometry (PTR-MS) and selected-ion flow tube mass spectrometry (SIFT-MS) [5]. These technologies are on-line methods (suitable for real-time analysis) and have been used for both disease diagnosis studies [7] and monitoring pharmacokinetics effects [8]. Although these analytical platforms are highly reproducible and accurate, they are very expensive, time-consuming, and lack portability.
To fully utilise the diagnostic potential of exhaled breath, Hunter and Dweik [9] argued that its application must be extended beyond laboratories and pilot studies to standard clinical practice and at home. The latter requires a compact, personal and portable diagnostic device, capable of sampling and analysing the breath of an individual at any time or place. The authors referred to this as a “smart breath healthy diagnostic system” (SBHDS). Since this concept was first proposed in 2008, the technological revolution of Internet-of-things (IoT) has invigorated the demand for smarter sensor solutions. This also applies to the medical and healthcare domain (so-called IoMT: internet of medical things), which seeks to integrate medical devices into IoT networks. Personalised tools for health monitoring could reduce the overall costs of care and bring numerous benefits to health professionals and patients [10]. Utilising the computing power of smartphones, these sensor systems could analyse and transmit collected data from a patient to a hospital cloud computing-based framework. We believe that personalised breath analysis devices for non-invasive diagnosis and/or monitoring of disease have potential for integration into this future IoMT-framework. However, the currently used technologies are unable to fulfil the requirements of such a device.
While no single VOC analysis technology can provide the complete diagnosis of an individual, the electronic nose (E-nose) could be considered a good option as it has significant advantages. These include low-cost, low-power (compared to GC-MS), user-friendliness, and portability. An ‘E-nose’ describes an instrument consisting of an array of cross-reactive gas sensors, coupled with pattern recognition software. It relies on each sensor in the array being different and therefore its response to an odour being unique within the array. The pattern recognition software then learns the sensor responses associated with a specific odour source [11]. This operating principle attempts to mimic the function of biological olfactory receptors by detecting a complex pattern, instead of measuring the individual constituents of a mixture. Gas sensors suitable for E-noses can be broadly divided into four main types, namely resistive, catalytic, optical, and electrochemical [12]. Resistive gas sensors are often based on semiconductor metal oxides that have been widely used for E-noses, due to their fast response/recovery time, low-cost, and sensitivity to a wide range of target gases [13]. In recent years, the application of micro-electro-mechanical systems (MEMS) technology has allowed metal oxide (MOX) gas sensors to dramatically reduce in size and power consumption. Mass-production has allowed these sensors to be produced at even lower cost. These developments provide new opportunities in medical diagnostic applications, such as SBHDS-inspired E-noses.
In a 2018 review paper [14] regarding the applications of E-noses, at least 50 papers related to non-invasive detection of human diseases; 27 of which analysed exhaled breath. The commercial E-nose instrument most frequently used (14/27) for breath was Cyranose 320 (Sensigent, Baldwin Park, CA, USA). This E-nose contains an array of 32 carbon black polymer composite (CBPC) sensors. The advantage of CBPC sensors (compared to MOX) is that they do not require high temperature operation and therefore have lower power consumption. The disadvantage of this sensing technology is that they demonstrate poor repeatability and reproducibility, due to the random nature of the polymer, and have a relatively short sensor life, compared to MOX sensors [15]. Other sensor technologies included in the review were quartz crystal microbalance (QMB), nitric oxide sensor (NOS), gold nanoparticle (GNP), and carbon nanotubes (CNT). Only three papers in the review used E-noses with MOX sensors [16,17,18]. In a different review paper, regarding the use of E-nose technology for the diagnosis of digestive and respiratory diseases using exhaled breath, MOX sensor-based E-noses are similarly under-represented (four of 23 reviewed papers) [19]. These reviews demonstrate that MOX sensors are currently under-utilised in E-nose applications for exhaled breath research. While new prototype MOX-based E-noses are currently being developed for diagnostic purposes using exhaled breath [20], these often use custom sensors or traditional commercial MOX sensors/E-noses, which have been available for many years [21]. The latest generation of commercially available MEMS MOX gas sensors have not been sufficiently evaluated for this purpose.
Some researchers have used a selection of these sensors in devices for air quality monitoring purposes [22,23], but applications in breath research are limited. The breath E-nose developed by Jaeschke et al. [24] uses many of the most relevant commercial gas sensors currently available. However, this unit focuses on a modular approach with three exchangeable sensing compartments and has not been tested using exhaled breath samples. This provides an opportunity to utilise MEMS MOX gas sensors and existing IoT platforms to develop a new generation of breath analysis E-noses.
In our previous work [25], we developed a E-nose which was referred to as WOLF (Warwick OLFaction). This system utilised 13 gas sensors and multiple sensor technologies (10 electrochemical, two optical and one photo-ionisation detector) and was intended for head-space gas analysis. In this work, we report on the development of the latest in-house built WOLF E-nose, designed specifically for breath analysis: WOLF Breath E-nose.
2. Materials and Methods
2.1. Breath Sampling
The developed unit comprises of 2 sub-systems: breath sampling and breath analysis. The breath sampling system is made up of a 16 cm long, 2 cm diameter, aluminium tube with 3D printed tube connectors on either end. These components serve as an interface between the sampling tube and the enclosure and were printed on a Form 2 printer using F2GPWH-04 material (Formlabs, Somerville, MA, USA). The front-end connector also acts as a holder for disposable one-way valve mouthpieces (6020-1, Medacx, Hayling Island, UK). The back-end connector was designed with an opening to embed a sensor module (SCD30, Sensirion, Stäfa, Switzerland). The assembly of these components is shown in Figure 1, designed using SolidWorks (ver. 2018, Dassault Systèmes, Vélizy-Villacoublay, France). The sensor module was fitted at the end of the sampling tube to monitor sampling-related parameters, such as carbon dioxide (CO2), humidity, and temperature. Tracking these parameters allows the subject (at home) or operator (in a clinical setting) to check the quality and repeatability of samples.
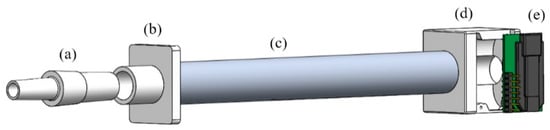
Figure 1.
3D model of sampling tube components: (a) One-way mouthpiece; (b) Front-end tube connector; (c) Sampling tube; (d) Back-end tube connector; (e) Sensor module.
The sampling tube has a volume of approximately 50 mL and can be heated to body temperature (35–37 °C) using a low-cost digital thermostat and heater relay module (W1209, HiLetgo, Shenzhen, China). The heater relay is connected to nichrome (NiCr) wire, which is coiled around the sampling tube. The tube was then wrapped in high temperature resistant Kapton tape (436-2778, RS, Corby, UK) and silicone thermal interface sheets (446-493, RS, Corby, UK) to provide some insulation. The heating procedure is initiated at start-up and takes around 10 min. Heating the sampling tube avoids condensation from forming inside, which could lead to cross-contamination from previous samples.
The integrated sampling system replicates that of the Bio-VOC breath sampler (C-BIO01, Markes Intl., Llantrisant, UK). The Bio-VOC is a commercial breath sampling kit, consisting of an open-ended hard plastic sampling tube. It has been used frequently in recent breath analysis studies [26] for the sampling of end-tidal breath. This refers to the last portion of exhaled air, which has undergone gaseous exchange with blood [27]. As the subject breathes through the tube, air is displaced, which separates dead-space gas from end-tidal breath. This displacement principle has been replicated in our sampling design. The use of one-way valve mouthpieces and heating the sampling tube further improve on the design concept of the Bio-VOC.
2.2. Breath Analysis
The breath analysis system includes a custom PCB and sensor chamber. The PCB was designed using Altium Designer (ver. 19.1.6, Altium, Chatswood, Australia). The dimensions of the PCB are 13 × 16 cm. The design has an 8 × 2.5 cm sensing area, which includes an array of 10 MEMS MOX-based gas sensors. These include both thick film and thin film sensors and the AlphaSense dual sensor is the only true ‘p-type’ material [28]. Both analogue and digital sensors were used. According to the respective datasheets, most of the sensors provide ‘total VOC’ (TVOC) readings, which produce a single measurement to represent a mixture of VOCs. The total cost of the sensors is around £200. The deployed sensors are summarised in Table 1.

Table 1.
Sensors deployed in WOLF Breath E-nose.
The sensing area is enclosed by a 3D printed sensor chamber (F2GPWH-04/Form 2, Formlabs, Somerville, MA, USA), with dimensions of 4 × 9.5 × 1.8 cm. The chamber was sealed to the PCB using an O-ring and the compartment volume is around 25 mL (excluding sensors). A miniature pump (PMM1031-NMP015, KNF, Witney, UK) was used to create a negative pressure system, which pulls gas through the sensor chamber. There is a 3-way valve (ETO-3-12, Clippard, Cincinnati, OH, USA) between the sampling tube and sensor chamber. This creates 2 flow-paths to the sensor chamber: ambient air (from the environment) or exhaled breath (from the sampling tube). Push-fit connectors and 1/8” PTFE tubing (06605-27, Cole-Parmer, St Neots, UK) were used to create the internal connections (e.g., valve to sensor chamber). The pump runs continuously (flow rate set to 500 mL/min) and pulls ambient air through the sensor chamber, when the device is in an idle state. The flow rate of the pump is controlled using a simple digital-to-analogue converter (DAC) drive circuit. There is no flow feedback, but the flow rate was measured using a flowmeter (7000 Flowmeter, Ellutia, Ely, UK) and voltage set to the desired flow rate. The switching of the valve is also controlled using a DAC drive circuit. When sampling is activated, using the LED-push button on the front-panel of the unit, the valve is triggered to switch the flow-path to that from the sampling tube. The internal layout of the components was modelled and arranged in SolidWorks prior to manufacture, as shown in Figure 2.
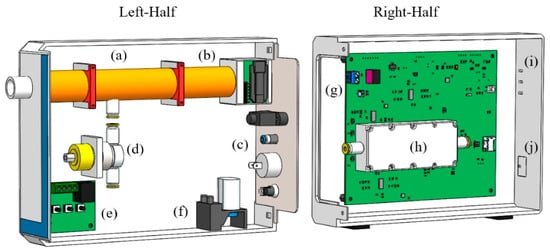
Figure 2.
Internal layout of WOLF Breath E-nose components: (a) Sampling tube; (b) Sensor module; (c) Back plate with USB, exhaust, on/off button and DC power jack; (d) 3-way valve; (e) Heater relay module; (f) Pump; (g) Custom PCB; (h) Sensor chamber; (i) Indicator LEDs; (j) Sampling button.
An internal system view of the WOLF Breath E-nose is shown in Figure 3. The red and blue arrows indicate the different flow-paths through the device. The dimensions of the unit are 7 × 16 × 23 cm and weighs less than 1 kg. An external view of the unit is shown in Figure 4.
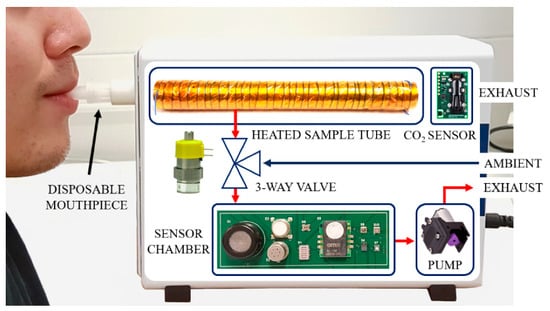
Figure 3.
Internal system view of the WOLF Breath E-nose.
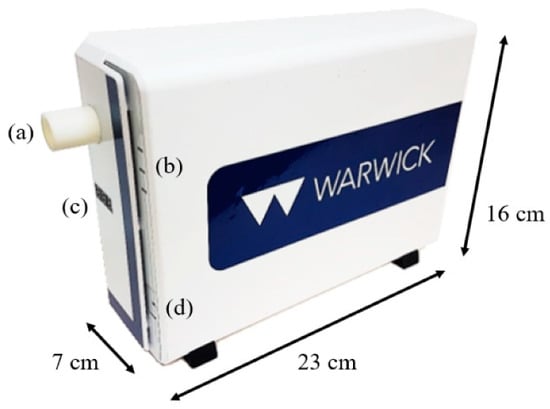
Figure 4.
WOLF Breath E-nose: (a) Mouthpiece holder; (b) LED status indicators; (c) Sampling tube temperature indicator; (d) Sampling button.
The unit can be controlled from a laptop, via wired USB, or using Wi-Fi through a simple mobile app that was developed using Blynk. This app provides a free IoT platform for Android or iOS and is compatible with commonly used IoT hardware, such as Arduino, Raspberry Pi, ESP8266 and ESP32. The ESP32 (Espressif Systems, Shanghai, China) was used as the microcontroller for our system, because it is a low-cost, low-power chip with integrated Wi-Fi and Bluetooth communication capabilities. The custom ‘WOLF Breath E-Nose’ app includes 2 tabs: sampling and analysis, as shown in Figure 5. The sampling tab includes 3 input fields to include details such as study name, subject ID and sample name. In addition to this, status indicators from the front-panel of the device are shown, as well as real-time readings of CO2, temperature and humidity from the SCD30 sensor. The parameters can be selected and plotted on the graph, as shown with CO2 in Figure 5 (left). The analysis tab shows the real-time readings from the gas sensor array. Individual or multiple outputs can be selected and plotted on the graph, as shown with CCS811 and BME680 in Figure 5 (middle). The other readings can be seen by scrolling down, as shown in Figure 5 (right). The sampling rate of the sensor data was set to 1 sample per second.
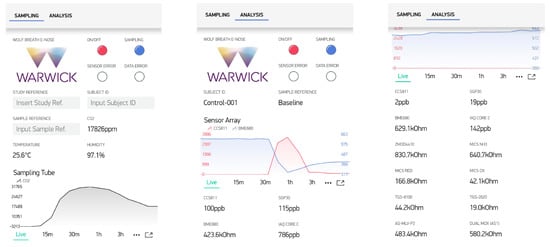
Figure 5.
WOLF Breath E-nose Blynk app; (left) Sampling tab; (middle) Analysis tab with real-time output graph; (right) Analysis tab with all sensor readings.
2.3. Electronic Design
The operating principle of MOX sensors is based on a reduction-oxidation (redox) reaction. In ‘clean’ air, oxygen is absorbed onto the gas-sensitive layer of the sensor (e.g., tin oxide). When exposed to a reducing or oxidising gas, the oxygen reacts to the target gas, which changes the conductivity of the sensitive layer, resulting in a change in current [29]. The applied voltage is fixed, to measure the change in resistance to characterise the sensor response. Traditionally, the limitations of MOX gas sensors relate to high power consumption and temporal drift [30,31]. The emergence of MEMS-technology MOX sensors has led to further miniaturisation of sensing chips and heater resistors, which has drastically reduced power consumption. In general, thick film MOX sensors are more stable than MEMS (thin film) devices, however MEMS sensors have faster response times [32]. To further reduce power consumption, duty cycling using two temperature pulsing can be used. This involves switching between a higher and lower temperature, to reduce baseline drift, decrease response time and power [33]. For this application, a heating phase of 150 ms was implemented for the analogue MEMS MOX gas sensors.
The power system of the E-nose is currently based around the input from a 12 V AC/DC mains power supply unit (709-GEM30I12-P1J, Mouser, High Wycombe, UK). The system was designed around 12 V, because this is the required voltage for the valve and heater relay module. However, in future, this device may be re-configured to be battery-operated. In addition to the improved sensor stability, the possibility of utilising duty-cycle mode is likely to be beneficial for reducing power consumption when battery-powered.
The schematic shown in Figure 6 shows a simplified circuit diagram of sensor and heater drive circuits for analogue MOX sensors. The 12-bit resolution DAC in the sensor drive circuit dictates the sensor voltage (using a constant voltage configuration) and the previously referred to duty-cycle. The second stage of the sensor drive circuit removes the offset of the voltage bias and amplifies the sensor response, in this case with a gain of 2.2. The sensor output is then read using a 16-bit resolution analogue-to-digital converter (ADC). The heater drive circuit is controlled by a DAC and provides a fixed heater voltage to the heater of the gas sensor. The heater resistance of the sensor can be calculated by measuring the voltage drop, using an ADC, across the heater load resistor. Table 2 provides a summary of the sensor and heater voltages and resistances for deployed analogue gas sensors. The values in Table 2 relating to sensor resistances represent the real resistances of the sensors used in the unit. The heater resistances are those provided by the manufacturer. The values of the sensor and heater load resistors were optimised to allow for the measurement of the widest range of RS/R0, according to their respective datasheets, where RS is the resistance of the sensor depending on the concentration of target gas(es) and R0 is the resistance of the sensor at ambient air.
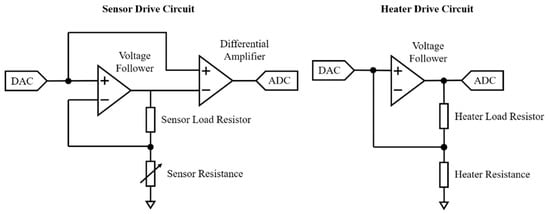
Figure 6.
Simplified circuit diagram of sensor and heater drive circuits for analogue MOX sensors.
Table 2.
Sensor and heater voltages and resistances for analogue VOC sensors.
2.4. Chemical Testing
The WOLF Breath E-nose was tested using chemical standards to calibrate the device and ensure that all sensors were functioning correctly. This is a standard approach used to calibrate gas sensor arrays [25]. For these tests, it is necessary to generate headspace gas from 3 chemicals; in this case, acetone, isopropanol and 1-propanol with 99% purity (Sigma-Aldrich, Dorset, UK). The chemicals were diluted using deionised water to concentrations of 0.1% acetone, 0.1% 1-propanol and 0.05% isopropanol. A set of 6 headspace vials were prepared for each chemical, with 1 mL in each. These were heated for 10 min at 40 ± 0.1 °C in a heater block (DB-2D Dri-Block, Techne/Cole-Parmer, Stone, UK). For testing, the vials were connected to the sensor chamber using PTFE tubing and the headspace gas was pulled into the sensor chamber using the miniature pump. The sequence of tested solutions was acetone, 1-propanol, isopropanol, [repeat] to mitigate against effects of sensor drift. After pulling the headspace gas into the chamber, the sample was disconnected to allow ambient air into the chamber. A period of 5–10 min was sufficient for sensor responses to return to baseline levels between each test. Principal component analysis (PCA) was conducted on the results. PCA is an unsupervised linear method, which reduces the dimensionality of the data by selecting a small number of linearly uncorrelated principal components (PC) that explain the majority of the variation in the data [34]. For PCA analysis, feature extraction was conducted using the difference model, whereby the maximum gas sensor response is subtracted from the stable baseline value, prior to the response [35].
In addition to these tests, the sensor array was evaluated using a gas rig to test the response to a single chemical, isobutylene, at different concentrations. A gas cylinder with a nominal concentration of 50 ppm was diluted with zero air from a zero-air generator (HPZA-7000-220, Parker, Warwick, UK) to concentrations of 2, 4, 6, 8, and 10 ppm using a custom mass flow-controlled gas mixing system. The total flow rate of the diluted gas was set to 300 mL/min and humidity was added using a water bubbler (around 60% RH, measured using the BME680 gas sensor). The test started with 1 hour of zero air, followed by 30-min of increasing concentration steps, with 30-min of zero air between each step. The experimental set-up for the gas rig testing is shown in Figure 7.
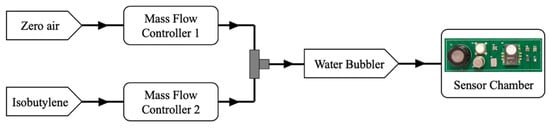
Figure 7.
Experimental gas-rig set-up for testing isobutylene concentrations.
2.5. Exhaled Breath Testing
To simulate a control vs. disease group case-control study, a peppermint breath test was conducted. Ethical approval was obtained from local research ethics committee (BSREC reference: REGO-2018-2168). A total of 18 subjects were recruited for these tests. All subjects were healthy (self-reported), male, and between the ages of 21–30 (mean age of 25.4 years and standard deviation 1.8). Previous breath analysis studies have demonstrated that factors such as age, sex, weight, lifestyle and medication can influence breath composition [36]. To minimise the effects of these confounding factors, the recruited subjects were of the same sex and age (young adults, defined as ages 18–35 years).
Subjects provided breath samples pre- and post-consumption of a 200 mg peppermint oil capsule (2851512, Boots, Nottingham, UK). The intended application of these capsules is to support a healthy digestive system and aid the normal functioning of the digestive tract [37]. However, the consumption of peppermint oil also produces a well-defined, but temporary, change in the breath profile of an individual. As the ingested peppermint oil capsule dissolves, it releases volatile aroma compounds (e.g., menthol), which can be detected in breath for up to 10 hours [38]. Investigating the ‘wash-out’ profile of peppermint oil in breath has been proposed as a method of standardising breath analysis methods by benchmarking analysis techniques. Some work relating to this has already been published using GC-MS and PTR-MS technologies [38,39]. To the best of our knowledge, this is the first peppermint breath study conducted using E-nose technology. For this study, we used the standardised intervention of peppermint oil capsules to change the breath composition of the ‘peppermint’ breath samples to simulate a ‘disease’ group. The menthol intensity has been observed to peak after 30–45 min [39]. The sampling interval between ‘baseline’ and ‘peppermint’ samples was around 45-min for the conducted experiments.
3. Results
3.1. Chemical Testing
The PCA results are shown in Figure 8 (left) as a score plot. Each sample is presented by a single point, which demonstrates the relations (similarity) between all samples. Points that lie close to each other have similar properties while points that are further away have different properties [40]. This result demonstrates good separation between the three chemicals with no overlap. The principal components PC1 and PC2 account for over 90% of the variance, which is considered a robust result [41]. This indicates that the WOLF Breath E-nose has some selectivity at distinguishing between individual chemicals.
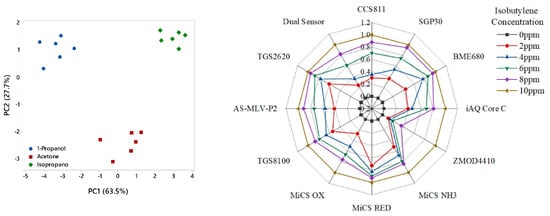
Figure 8.
Testing of chemical standards; (left) PCA results; (right) Isobutylene concentration steps radar plot of normalised features.
The results from the isobutylene concentration gas rig tests are presented as a radar plot of normalised features in Figure 8 (right). The radar plot demonstrates that the sensors consistently responded to the concentration steps. Examples of the gas sensor responses from the SGP30 and TGS-2620 sensors are shown in Figure 9.
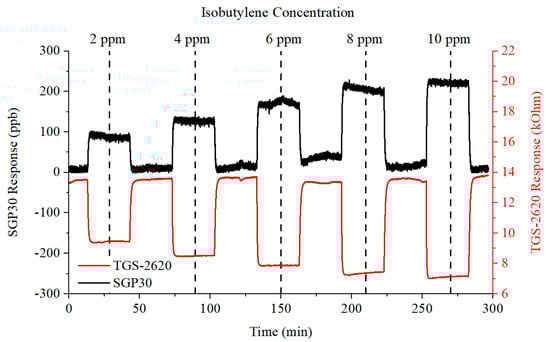
Figure 9.
SGP30 and TGS-2620 gas sensor responses to increasing concentrations of isobutylene.
3.2. Volunteer Testing
Prior to conducting the peppermint breath tests, the device was turned on and left to stabilise in ambient air for over 1 h. A minimum start-up time of 10–15 min is necessary to allow the heater relay to heat the sampling tube to body temperature. Furthermore, the gas sensors need some time to reach operating temperatures and stable baseline output readings. The warm-up and baseline stabilisation output response is shown in Figure 10.
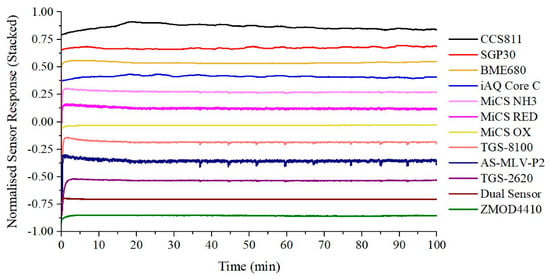
Figure 10.
Warm-up and baseline stabilisation output response.
For our volunteer experiments, subjects did not need to exhale until their lungs were as empty as possible. Instead, only four seconds of exhaled breath were required. Subjects were asked to inhale for four seconds, and then exhale normally into the device for around four seconds. This procedure can improve the reproducibility of sampling, as shown in Figure 11. These readings are from the sensor module, embedded in the back-end connector of the sampling tube. Figure 11 demonstrates that using this standardised sampling procedure produces very consistent and reproducible outputs for commonly used sampling parameters, such as CO2 and humidity. This procedure should therefore minimise sampling-related variability in exhaled breath composition. A typical sensor array output response to exhaled breath, from the same subject, is shown in Figure 12.
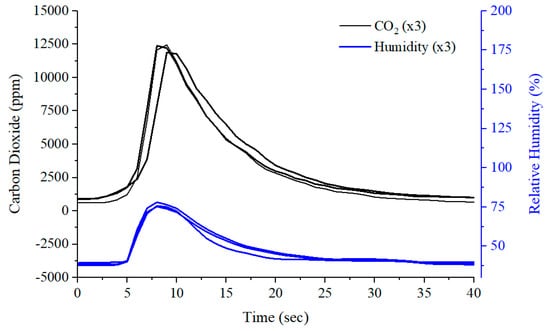
Figure 11.
Breath sampling reproducibility using carbon dioxide and humidity sensor readings.
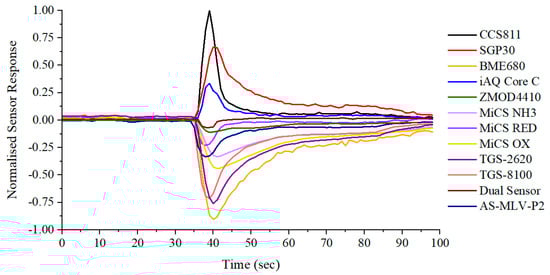
Figure 12.
Typical output response to exhaled breath.
Most applications of exhaled breath research aim to discriminate between disease states. These applications require classification analysis to distinguish between groups and aim to build and train a model that can be used as a diagnostic tool. In our previous work, a standard classification analysis pipeline has been developed and applied to urinary and breath VOC studies using E-nose technology to investigate diabetes and inflammatory bowel disease (IBD) [42,43]. The same analysis pipeline was applied to this simulated case-control study between baseline (pre-consumption) and peppermint (post-consumption) exhaled breath samples. Classification results are expressed as a receiver operating characteristic (ROC) curve, as shown in Figure 13 (left). In ROC curves, the true positive rate (sensitivity) is plotted as a function of the false positive rate (1-specificity) [44]. The area under the ROC curve (AUC) is a measure of how well parameters can distinguish between groups [45]. An area of 1.0 represents a perfect test whereas an area of around 0.5 has no discriminatory power. Good separation would result in an AUC of around 0.7 or higher [46]. The classification results were AUC: 0.81, sensitivity: 0.83 (0.59–0.96), specificity: 0.72 (0.47–0.90), p-value: <0.001. These results were achieved using the Support Vector Machine (SVM) classifier. This classifier has been used in E-nose breath studies investigating cancer [47,48], pneumonia [49], and kidney disease [50]. When classification is performed, a p-value can be calculated to infer whether the null hypothesis is true, i.e. no differences exist between groups. Traditionally, a p-value smaller than 0.05 is used as an appropriate threshold to reject the null hypothesis [5]. A radar plot of normalised features is shown in Figure 13 (right). This demonstrates consistent differences in the sensor response between baseline and peppermint samples.
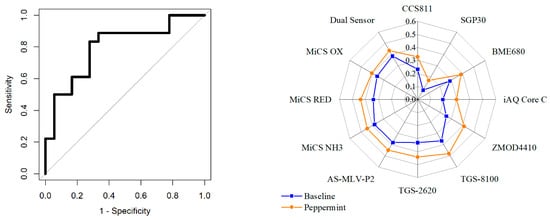
Figure 13.
Baseline vs. peppermint exhaled breath samples; (left) ROC curve; (right) Peppermint breath test radar plot of normalised features.
4. Discussion
Testing of chemical standards, to discriminate between acetone, isopropanol and 1-propanol, and concentration steps of isobutylene, were conducted to evaluate the functionality of the developed unit. The results indicate that the WOLF Breath E-nose shows selectivity to distinguish between these chemicals. Different concentrations of isobutylene were associated with changes in the sensor array response. The concentration steps for the gas rig testing was 2 ppm. Since many exhaled VOCs are observed in low ppb range, further testing is required to determine the sensitivity of the gas sensors at lower concentrations. It should however be reiterated that the E-nose approach relies mainly on the cross-sensitivity of the gas sensors to interpret a complex sensor response pattern, as opposed to the individual sensor sensitivities to specific compounds.
The repeatability testing demonstrates that the sampling procedure can produce very consistent outputs. These readings can be used to monitor the quality and consistency of collected samples. For example, if multiple breath samples are to be collected from the same individual, the CO2 output characteristics should be similar for each sample. If outliers or incorrect breathing (e.g., forced exhalation) is identified, the sample should be excluded or repeated. Volunteer testing of the system indicates that the unit is simple to use, for both the subject and operator, and comfortable for the subject. This sampling approach is non-restrictive and likely to be suitable for sampling vulnerable subjects, such as children or the elderly. The results from the peppermint study indicate that the WOLF Breath E-nose is capable of detecting the subtle change in breath composition that was induced by the consumption of peppermint oil. Restricting recruitment to young adult male subjects provided a robust experimental design. Future tests will include different age ranges and sexes, to reflect a more realistic sample group. Limited dietary control was enforced during the collection of exhaled breath samples. Strict dietary protocols and increasing the number of volunteers is likely to further improve classification results.
There are some limitations associated with the developed unit. A drawback of the MOX-based gas sensor unit is that there is an inherent variability between sensors, as a result of manufacturing processes [51]. To minimise these effects, it may be necessary to screen a large number of the same sensors to choose those with similar characteristics (e.g., sensor resistance at room temperature). While this increases development costs per unit, it is likely to be an effective method to reduce sensor variability between units. In addition to screening, the circuit design can be utilised to reduce possible problems of variability. For example, the heater drive circuit allows the real heater resistance to be calculated, which varies for different sensors of the same model. The required heater supply voltage can then be set so that the dissipated power is always the same.
If the proposed unit is intended to be used as a personalised breath analysis device, it will be necessary to be able to compare the results to other users. A calibration protocol needs to be developed to calibrate these devices regularly to evaluate whether the inter-variability between devices is acceptable for comparing breath profiles from different individuals. Such a protocol could involve benchmarking responses to a mixture of breath-related chemical standards. We have not yet evaluated how many times or how regularly the sensor array needs to be calibrated. Long-term stability testing of the system needs to be conducted in order to do this (e.g., tracking sensor drift over weeks or months).
Another limitation of MOX gas sensors is that the sensor response is affected by high levels of humidity. A strong correlation between changes in relative humidity and MOX sensor responses has been demonstrated [52]. However, since this E-nose was designed for applications in breath research, samples will inevitably have relatively high humidity levels. This was taken into account during gas rig testing by adding humidity using a water bubbler. Moreover, the effects of humidity will be relatively constant during the analysis of exhaled breath, since all samples will be associated with similar levels of high humidity.
As briefly discussed previously, sensor drift is also a critical factor for long-term monitoring applications of the E-nose. The experiments presented in this paper were conducted in a short period of a few days, where the external conditions of temperature and humidity were relatively constant. These may be considered overoptimistic testing conditions, since practical long-term testing of the device would involve changes in background conditions (temperature, humidity, and composition of ambient air) [53]. Implementation of the duty cycle mode for analogue MOX sensors is likely to improve long-term stability of the unit; however, this needs to be further investigated. The electronic circuit design also allows for further development of modulating approaches, for both the sensor and heater drives.
5. Conclusions
In this paper, we have shown the development and testing of a compact, IoT-enabled, portable E-nose for breath analysis, which deploys an array of 10 commercial MEMS MOX gas sensors. The functionality of the device was demonstrated with the testing of chemical standards (discriminating between acetone, isopropanol and 1-propanol) and a gas rig testing of isobutylene from 2–10 ppm, in 2 ppm steps. PCA results indicate that the developed unit has some selectivity at distinguishing between individual chemicals. Gas rig testing results demonstrate that the sensor array consistently responded to the concentration steps. To further evaluate the developed system, the exhaled breath of 18 young male subjects was analysed before and after consuming a peppermint oil capsule. Classification analysis of exhaled breath samples demonstrates that we can distinguish between pre- and post-consumption of peppermint capsules with AUC: 0.81, sensitivity: 0.83 (0.59–0.96), specificity: 0.72 (0.47–0.90), p-value: <0.001. These results suggest that the unit can separate subject groups based on subtle changes in exhaled breath composition. It is our intention to deploy the unit in a UK hospital in an upcoming breath research study.
Author Contributions
J.A.C. conceptualised the project. J.A.C. and A.T. designed and configured the device. Samples were collected by A.T. Gas testing was completed by S.K.A. and A.T. Data analysis was conducted by A.W. and A.T. Original draft preparation, review and editing of the manuscript were completed by A.T. and J.A.C. All authors have read and agreed to the published version of the manuscript.
Funding
This research received no external funding. The PhD of A.W. is supported by Lembaga Pengelola Dana Pendidikan (LPDP), Ministry of Finance, Republic of Indonesia.
Acknowledgments
We would like to thank our volunteer subjects for participating in the peppermint study.
Conflicts of Interest
The authors declare no conflict of interest.
References
- Phillips, M. Breath Tests in Medicine. Sci. Am. 1992, 267, 74–79. [Google Scholar] [CrossRef] [PubMed]
- Xu, M.; Tang, Z.; Duan, Y.; Liu, Y. GC-Based Techniques for Breath Analysis: Current Status, Challenges, and Prospects. Crit. Rev. Anal. Chem. 2016, 46, 291–304. [Google Scholar] [CrossRef] [PubMed]
- Besa, V.; Teschler, H.; Kurth, I.; Khan, A.M.; Zarogoulidis, P.; Baumbach, J.I.; Sommerwerck, U.; Freitag, L.; Darwiche, K. Exhaled volatile organic compounds discriminate patients with chronic obstructive pulmonary disease from healthy subjects. Int. J. Chronic Obstruct. Pulm. Dis. 2015, 10, 399–406. [Google Scholar]
- Altomare, D.F.; Di Lena, M.; Procelli, F.; Trizio, L.; Travaglio, E.; Tutino, M.; Dragonieri, S.; Memeo, V.; de Gennaro, G. Exhaled volatile organic compounds identify patients with colorectal cancer. Br. J. Surg. 2012, 100, 144–150. [Google Scholar] [CrossRef] [PubMed]
- Pereira, J.; Porto-Figueira, P.; Cavaco, C.; Taunk, K.; Rapole, S.; Dhakne, R.; Nagarajaram, H.; Camara, J.S. Breath analysis as a potential and non-invasive frontier in disease diagnosis: An overview. Metabolites 2015, 5, 3–55. [Google Scholar] [CrossRef]
- Miekisch, W.; Schubert, J.K. From highly sophisticated analytical techniques to life-saving diagnostics: Technical developments in breath analysis. TrAC Trends Anal. Chem. 2006, 25, 665–673. [Google Scholar] [CrossRef]
- Bajtarevic, A.; Ager, C.; Pienz, M.; Klieber, M.; Schwarz, K.; Ligor, M.; Ligor, T.; Filipiak, W.; Denz, H.; Fiegl, M.; et al. Noninvasive detection of lung cancer by analysis of exhaled breath. BMC Cancer 2009, 9, 348. [Google Scholar] [CrossRef]
- Beauchamp, J.; Kirsch, F.; Buettner, A. Real-time breath gas analysis for pharmacokinetics: Monitoring exhaled breath by on-line proton-transfer-reaction mass spectrometry after ingestion of eucalyptol-containing capsules. J. Breath Res. 2010, 4, 026006. [Google Scholar] [CrossRef]
- Hunter, G.W.; Dweik, R.A. Applied breath analysis: An overview of the challenges and opportunities in developing and testing sensor technology for human health monitoring in aerospace and clinical applications. J. Breath Res. 2008, 2, 037020. [Google Scholar] [CrossRef][Green Version]
- Dang, L.M.; Piran, M.J.; Han, D.; Min, K.; Moon, H. A Survey on Internet of Things and Cloud Computing for Healthcare. Electronics 2019, 8, 768. [Google Scholar] [CrossRef]
- Shurmer, H.V.; Gardner, J.W. Odour discrimination with an electronic nose. Sens. Actuators B Chem. 1992, 8, 1–11. [Google Scholar] [CrossRef]
- Kumar, P.; Deep, A.; Kim, K.-H.; Brown, R.J.C. Coordination polymers: Opportunities and challenges for monitoring volatile organic compounds. Prog. Polym. Sci. 2015, 45, 102–118. [Google Scholar] [CrossRef]
- Park, S.Y.; Kim, Y.; Kim, T.; Eom, T.H.; Kim, S.Y.; Jang, H.W. Chemoresistive materials for electronic nose: Progress, perspectives, and challenges. Informat 2019, 1, 289–316. [Google Scholar] [CrossRef]
- Wilson, D.A. Applications of Electronic-Nose Technologies for Noninvasive Early Detection of Plant, Animal and Human Diseases. Chemosensors 2018, 6, 45. [Google Scholar] [CrossRef]
- Wilson, A.D. Advances in electronic-nose technologies for the detection of volatile biomarker metabolites in the human breath. Metabolites 2015, 5, 140–163. [Google Scholar] [CrossRef] [PubMed]
- Saidi, T.; Zaim, O.; Moufid, M.; El Bari, N.; Ionescu, R.; Bouchikhi, B. Exhaled breath analysis using electronic nose and gas chromatography–mass spectrometry for non-invasive diagnosis of chronic kidney disease, diabetes mellitus and healthy subjects. Sens. Actuators B Chem. 2018, 257, 178–188. [Google Scholar] [CrossRef]
- Bruins, M.; Rahim, Z.; Bos, A.; van de Sande, W.W.J.; Endtz, H.P.; van Belkum, A. Diagnosis of active tuberculosis by e-nose analysis of exhaled air. Tuberculosis 2013, 93, 232–238. [Google Scholar] [CrossRef]
- Schnabel, R.M.; Boumans, M.L.L.; Smolinska, A.; Stobberingh, E.E.; Kaufmann, R.; Roekaerts, P.M.H.J.; Bergmans, D.C.J.J. Electronic nose analysis of exhaled breath to diagnose ventilator-associated pneumonia. Respir. Med. 2015, 109, 1454–1459. [Google Scholar] [CrossRef]
- Sánchez, C.; Santos, J.; Lozano, J. Use of Electronic Noses for Diagnosis of Digestive and Respiratory Diseases through the Breath. Biosensors 2019, 9, 35. [Google Scholar] [CrossRef]
- Kononov, A.; Korotetsky, B.; Jahatspanian, I.; Gubal, A.; Vasiliev, A.; Arsenjev, A.; Nefedov, A.; Barchuk, A.; Gorbunov, I.; Kozyrev, K. Online breath analysis using metal oxide semiconductor sensors (electronic nose) for diagnosis of lung cancer. J. Breath Res. 2019, 14, 016004. [Google Scholar] [CrossRef]
- Behera, B.; Joshi, R.; Anil Vishnu, G.K.; Bhalerao, S.; Pandya, H.J. Electronic nose: A non-invasive technology for breath analysis of diabetes and lung cancer patients. J. Breath Res. 2019, 13, 024001. [Google Scholar] [CrossRef] [PubMed]
- Santos, J.P.; Aleixandre, M.; Arroyob, P.; Suarez, J.I.; Lozano, J. An Advanced Hand Held Electronic Nose for Ambient Air Applications. Chem. Eng. Trans. 2018, 68, 235–240. [Google Scholar]
- Lozano, J.; Melendez, F.; Arroyo, P.; Suarez, J.I.; Herrero, J.L.; Camona, P.; Fernandez, J.A. Towards the Miniaturization of Electronic Nose as Personal Measurement Systems. Proceedings 2019, 14, 30. [Google Scholar] [CrossRef]
- Jaeschke, C.; Gloeckler, J.; El Azizi, O.; Gonzalez, O.; Padilla, M.; Mitrovics, J.; Mizaikoff, B. An Innovative Modular eNose System Based on a Unique Combination of Analog and Digital Metal Oxide Sensors. ACS Sens. 2019, 4, 2277–2281. [Google Scholar] [CrossRef] [PubMed]
- Westenbrink, E.; Arasaradnam, R.P.; O’Connell, N.; Bailey, C.; Nwokolo, C.; Bardhan, K.D.; Covington, J.A. Development and application of a new electronic nose instrument for the detection of colorectal cancer. Biosens. Bioelectron. 2015, 67, 733–738. [Google Scholar] [CrossRef] [PubMed]
- Lawal, O.; Ahmed, W.M.; Nijsen, T.M.E.; Goodacre, R.; Fowler, S.J. Exhaled breath analysis: A review of ‘breath-taking’ methods for off-line analysis. Metabolomics 2017, 13, 110. [Google Scholar] [CrossRef] [PubMed]
- Lourenço, C.; Turner, C. Breath Analysis in Disease Diagnosis: Methodological Considerations and Applications. Metabolites 2014, 4, 465–498. [Google Scholar] [CrossRef]
- Danesh, E.; Dudeney, R.; Tsang, J.-H.; Blackman, C.; Covington, J.A.C.; Smith, P.; Saffell, J. A Multi-MOx Sensor Approach to Measure Oxidizing and Reducing Gases. Proceedings 2019, 14, 50. [Google Scholar] [CrossRef]
- Madrolle, S.; Grangeat, P.; Jutten, C. A Linear-Quadratic Model for the Quantification of a Mixture of Two Diluted Gases with a Single Metal Oxide Sensor. Sensors 2018, 18, 1785. [Google Scholar] [CrossRef]
- Burgués, J.; Marco, S. Low Power Operation of Temperature-Modulated Metal Oxide Semiconductor Gas Sensors. Sensors 2018, 18, 339. [Google Scholar] [CrossRef]
- Abidin, M.Z.; Asmat, A.; Hamidon, M.N. Comparative Study of Drift Compensation Methods for Environmental Gas Sensors. IOP Conf. Ser. Earth Environ. Sci. 2018, 117, 012031. [Google Scholar] [CrossRef]
- Liu, H.; Zhang, L.; Li, K.; Tan, O. Microhotplates for Metal Oxide Semiconductor Gas Sensor Applications—Towards the CMOS-MEMS Monolithic Approach. Micromachines 2018, 9, 557. [Google Scholar] [CrossRef] [PubMed]
- Vergara, A.; Llobet, E.; Martinelli, E.; Di Natale, C.; D’Amico, A.; Correig, X. Feature extraction of metal oxide gas sensors using dynamic moments. Sens. Actuators B Chem. 2007, 122, 219–226. [Google Scholar] [CrossRef]
- Wlodzimirow, K.A.; Abu-Hanna, A.; Schultz, M.J.; Maas, M.A.; Bos, L.D.; Sterk, P.J.; Knobel, H.H.; Soers, R.J.; Chamuleau, R.A. Exhaled breath analysis with electronic nose technology for detection of acute liver failure in rats. Biosens. Bioelectron. 2014, 53, 129–134. [Google Scholar] [CrossRef] [PubMed]
- Yan, J.; Guo, X.; Duan, S.; Jia, P.; Wang, L.; Peng, C.; Zhang, S. Electronic Nose Feature Extraction Methods: A Review. Sensors 2015, 15, 27804–27831. [Google Scholar] [CrossRef]
- Blanchet, L.; Smolinska, A.; Baranska, A.; Tigchelaar, E.; Swertz, M.; Zhernakova, A.; Dallinga, J.W.; Wijmenga, C.; van Schooten, F.J. Factors that influence the volatile organic compound content in human breath. J. Breath Res. 2017, 11, 16013. [Google Scholar] [CrossRef]
- The Boots Company. Boots Peppermint Oil 200 mg. Available online: https://www.boots.com/boots-peppermint-oil-200mg-60-capsules-10115320 (accessed on 8 April 2019).
- Heaney, L.M.; Ruszkiewicz, D.M.; Arthur, K.L.; Hadjithekli, A.; Aldcroft, C.; Lindley, M.R.; Thomas, C.P.; Turner, M.A.; Reynolds, J.C. Real-time monitoring of exhaled volatiles using atmospheric pressure chemical ionization on a compact mass spectrometer. Bioanalysis 2016, 8, 1325–1336. [Google Scholar] [CrossRef]
- Malásková, M.; Henderson, B.; Chellayah, P.D.; Ruzsanyi, V.; Mochalski, P.; Cristescu, S.M.; Mayhew, C.A. Proton transfer reaction time-of-flight mass spectrometric measurements of volatile compounds contained in peppermint oil capsules of relevance to real-time pharmacokinetic breath studies. J. Breath Res. 2019, 13, 046009. [Google Scholar] [CrossRef]
- Jolliffe, I.T.; Cadima, J. Principal component analysis: A review and recent developments. Philos. Trans. R. Soc. A Math. Phys. Eng. Sci. 2016, 374, 20150202. [Google Scholar] [CrossRef]
- Peng, G.; Tisch, U.; Adams, O.; Hakim, M.; Shehada, N.; Broza, Y.Y.; Billan, S.; Abdah-Bortnyak, R.; Kuten, A.; Haick, H. Diagnosing lung cancer in exhaled breath using gold nanoparticles. Nat. Nanotechnol. 2009, 4, 669–673. [Google Scholar] [CrossRef]
- Esfahani, S.; Wicaksono, A.; Mozdiak, E.; Arasaradnam, R.P.; Covington, J.A.C. Non-Invasive Diagnosis of Diabetes by Volatile Organic Compounds in Urine Using FAIMS and Fox4000 Electronic Nose. Biosensors 2018, 8, 121. [Google Scholar] [CrossRef] [PubMed]
- Tiele, A.; Wicaksono, A.; Kansara, J.; Arasaradnam, R.P.; Covington, J.A.C. Breath Analysis Using eNose and Ion Mobility Technology to Diagnose Inflammatory Bowel Disease—A Pilot Study. Biosensors 2019, 9, 55. [Google Scholar] [CrossRef] [PubMed]
- Mandrekar, J.N. Receiver Operating Characteristic Curve in Diagnostic Test Assessment. J. Thorac. Oncol. 2010, 5, 1315–1316. [Google Scholar] [CrossRef] [PubMed]
- Molinaro, A.M. Diagnostic tests: How to estimate the positive predictive value. Neuro-Oncol. Pract. 2015, 2, 162–166. [Google Scholar] [CrossRef][Green Version]
- Pearce, J.; Ferrier, S. Evaluating the predictive performance of habitat models developed using logistic regression. Ecol. Model. 2000, 133, 225–245. [Google Scholar] [CrossRef]
- Hakim, M.; Billan, S.; Tisch, U.; Peng, G.; Dvrokind, I.; Marom, O.; Abdah-Bortnyak, R.; Kuten, A.; Haick, H. Diagnosis of head-and-neck cancer from exhaled breath. Br. J. Cancer 2011, 104, 1649. [Google Scholar] [CrossRef]
- Machado, R.F.; Laskowski, D.; Deffenderfer, O.; Burch, T.; Zheng, S.; Mazzone, P.J.; Mekhail, T.; Jennings, C.; Stoller, J.K.; Pyle, J.; et al. Detection of Lung Cancer by Sensor Array Analyses of Exhaled Breath. Am. J. Respir. Crit. Care Med. 2005, 171, 1286–1291. [Google Scholar] [CrossRef]
- Hockstein, N.G.; Thaler, E.R.; Torigian, D.; Miller, W.T., Jr.; Deffenderfer, O.; Hanson, C.W. Diagnosis of pneumonia with an electronic nose: Correlation of vapor signature with chest computed tomography scan findings. Laryngoscope 2004, 114, 1701–1705. [Google Scholar] [CrossRef]
- Marom, O.; Nakhoul, F.; Tisch, U.; Shiban, A.; Abassi, Z.; Haick, H. Gold nanoparticle sensors for detecting chronic kidney disease and disease progression. Nanomedicine 2012, 7, 639. [Google Scholar] [CrossRef]
- Zhang, L.; Tian, F.-C.; Peng, X.-W.; Yin, X. A rapid discreteness correction scheme for reproducibility enhancement among a batch of MOS gas sensors. Sens. Actuators A Phys. 2014, 205, 170–176. [Google Scholar] [CrossRef]
- Sohn, J.H.; Atzeni, M.; Zeller, L.; Pioggia, G. Characterisation of humidity dependence of a metal oxide semiconductor sensor array using partial least squares. Sens. Actuators B Chem. 2008, 131, 230–235. [Google Scholar] [CrossRef]
- Barsan, N.; Koziej, D.; Weimar, U. Metal oxide-based gas sensor research: How to? Sens. Actuators B Chem. 2007, 121, 18–35. [Google Scholar] [CrossRef]
© 2020 by the authors. Licensee MDPI, Basel, Switzerland. This article is an open access article distributed under the terms and conditions of the Creative Commons Attribution (CC BY) license (http://creativecommons.org/licenses/by/4.0/).