1. Introduction
The use of piezoelectric energy harvesting (PEH) technology has been widely proposed for many application areas. Wearable sensors have been powered with shoe-embedded piezoelectric harvesters [
1], ear canal dynamic motion has been used in cochlear implants [
2] and wind [
3], road [
4], or ocean vibrations [
5] have been transduced to electrical energy.
The transduction of mechanical vibration in electrical energy is one of the most promising energy sources to power internet of things (IoT) devices. The challenge of this technology is the efficiency of the power transduction [
6], as narrow band harvesters mainly generate electrical energy at specific mechanical vibration frequencies. The enhancement of this efficiency is a key research topic nowadays. Both MEMS [
7,
8] and cantilever structures [
9,
10] are constantly enhanced, multimodal vibration techniques are continuously investigated [
11] where non-linearity can increase the operational frequency and efficiency [
12], new array configurations are also tested [
13], and even the whole harvesting system is optimized [
14]. Rotatory motion applications are one of the most efficient use cases, due to the fact that the vibration remains almost constant [
15,
16,
17]. Fluid energy has been widely used as power source [
18] trying to find the best location of the piezoelectric generator (PEG) to maximize the obtained energy. Wind motion for example [
19] can provide a root mean square (RMS) voltage of 160.2 V and a maximum output power of 2566.4
W at a wind speed of 14 m/s. Ambient vibrations are more difficult to use mainly due to their low amplitudes [
20], which leads to the use of alternative structures [
21]. Acoustic energy is also used to harvest energy from noise [
22], or even vibration caused by rain is scavenged to get 2076
J of energy over a duration of 301 min [
23].
These are some examples to highlight the importance of the characterization of the mechanical vibration and the tuning of the natural resonant frequency of the piezoelectric transducer according to such vibration in order to maximize the electrical energy. The mechanical vibration in some applications is constant, being easier to tune the natural resonant frequency. But in applications whereby the mechanical vibration is aperiodic, the tuning of the piezoelectric harvester to the optimum frequency is more challenging.
Many IoT devices may be subjected to vibrations caused by different mechanical sources. This work is focused on the mechanical vibration suffered during a multimodal transportation. In this scenario, the mechanical accelerations are caused by different aperiodic vibration sources, like airplanes or trucks. In a previous work, it was proposed the tuning of a PEG aimed to harvest the mechanical energy present in aperiodic vibration sources [
24]. The concept of performing a spectrogram analysis, which does not miss the temporal information, as the discrete-time Fourier transform (DFT) analysis does, was analyzed. Thus, the harvested energy was considered instead of the harvested power. The difference of using spectrogram analysis in comparison to DFT analysis was measured with lab experiments, with vibration data of different road transports obtained from public databases.
This work proposes and validates a new frequency tuning methodology for cantilever PEGs based on spectrogram analysis for aperiodic air and road transport use case scenarios. It consists of a characterization of the mechanical vibration to obtain the spectrogram resonance frequency, the tuning of the cantilever PEG, the characterization of the harvested energy in real air and road transport scenarios and the final system validation of the autonomy enhancement of an ultra-low powered IoT device.
The paper is organized as follows: the introduction gives a short overview about real applications of powering IoT devices with PEH technology.
Section 2 presents the characterization process of the mechanical vibration and the tuning process to enhance the energy efficiency of a cantilever PEG in a lab.
Section 3 explains the evaluation of the electrical energy that is obtained during a real multimodal transport scenario to validate the frequency tuning method.
Section 4 shows the autonomy increase validation of an ultra-low powered IoT device when the proposed tuned PEG is added. Finally,
Section 5 summarizes the main conclusions.
2. Frequency Tuning of Cantilever Piezoelectric Harvesters
The selection of an appropriate natural resonance frequency is a very sensitive process to enhance the harvested energy of a PEG. The work presented in [
24] increases the energy conversion for linear vibration-based generators performing a spectrogram analysis instead of the traditional method that uses the fast Fourier transform (FFT) [
25,
26,
27,
28,
29]. In order to analyze the acceleration signal of a mechanical vibration in the frequency domain, two different signal analysis methods are applied: (i) the DFT, using the FFT, and (ii) the short-time Fourier transform (STFT) analysis of a time varying signal results in a spectrogram, which can be defined as the power spectral density (PSD). From each signal analysis method, two frequencies are obtained,
and
, respectively. Both frequencies indicate the natural resonance frequency at which the PEG should resonate, according to each of the signal analysis method, to harvest the energy of the acceleration signal efficiently. Five road transport vibration signals were used to validate the difference of the harvested energy that is obtained with the
and
. It was concluded that the harvested energy increased between 15% and 1149% if the PEG was tuned at
[
24].
This work is focused on multimodal air and road transport applications. Therefore, the first step is to characterize this type of vibration. The mechanical vibration source was the result of a 17-day multimodal transportation, that combined flights and a road transport. A commercial data logger to characterize vibrations for energy harvesting systems was utilized [
30]. The system included among other sensors, a three axes accelerometer that sensed vibrations in all three axes. A 400 Hz sampling frequency was used to measure the entire vibration. The data were recorded from a fishing port in Chile to Bilbao, including two flights and one road transport.
As a result of the 17-day multimodal transportation, one acceleration signal per axis was obtained, as shown in
Figure 1. Seven time intervals with the same duration were chosen, to make the illustration and experimental validation feasible: two take-offs, two flights, two landings, and one truck ground transportation.
Every acceleration signal in each axis was analyzed independently using the spectrogram MATLAB function, which gives the PSD progression through time at each frequency. The analysis of this result provided the natural frequency at which the piezoelectric generator harvested the maximum electrical energy. A summary of the results is shown in
Table 1, where the bold cells correspond to the
natural resonance frequency with the maximum energy spectral density for each axis.
Two piezoelectric generators from MIDE Technology Volture Manufacturer, the V22B and V21BL with natural resonance frequencies (without tip mass) of 240 Hz and 110 Hz [
31] respectively are chosen. The V22B PEG is tuned to 162.1 Hz, and two V21BL PEG are tuned to 19.7 Hz and 49.7 Hz, respectively. The experimental setup used for the tuning is shown in
Figure 2.
The experimental setup for tuning the resonant frequencies using
consisted on a two-step process. First, the admittance measurement of the PEG in the desired frequency band is calculated using an impedance analyzer. From the obtained results, the resonance frequencies (
), and anti-resonance frequencies (
) are deduced, as shown in
Figure 3. The natural frequency at which the PEG resonates generating the maximum energy needs to be located between the
and
[
32]. If this is not the case, the PEG’s natural resonance frequency must be tuned by modifying the tip mass at the end of the beam (
Figure 4).
In the second step, an electrodynamic shaker excites the PEG with a sinusoidal sweep at the target frequency, as shown in
Figure 2b. The frequency response of the piezoelectric generator varies as a consequence of the amplitude change from the excitation applied signal and the electrical load [
33]. Thus, a re-tuning of the natural resonant frequency is performed with the mean value of the amplitude of the recorded mechanical vibration signal. The pins of the PEG are connected to a programmable resistance box to perform a resistance sweep, to find the optimal load resistor that provides the maximum output power at the desired frequencies.
Once the maximum output power is obtained at the frequency specified in
Table 1, and the best value for the load resistor is obtained, the piezoelectric generator is excited with the recorded acceleration signal (
Figure 1), and its harvested energy is measured. A dSPACE DS1104 board connected to the power amplifier and the electrodynamic shaker are utilized, as shown in
Figure 2b. The control of the electrodynamic shaker is realized through an accelerometer sensor in a closed loop, replicating the desired signal. The energy obtained for each axis and tuned frequency is calculated as an integral over time of the measured power, as shown in
Table 2.
In bold is represented the maximum energy generated in each axis. The V21BL PEG generates more energy than the V22B PEG in all axes, and the V21BL PEG tuned at 19.7 Hz generates the most energy in X-Axis and Z-Axis. Nevertheless, PEG V21BL tuned at 49.7 Hz generates the maximum average harvested energy in the three axes. A fixed positioning of the cantilever can not be guaranteed during a multimodal transportation period, since the positioning of the box where the PEG is embedded may be stored in different directions during the whole trip. Therefore, the maximum average harvested energy in the three axes is considered, which corresponds to the PEG tuned at 49.7 Hz.
The PEG is tuned to 49.7 Hz by inserting three 1-gram cylindrical magnetic masses at the tip of the PEG, as shown in
Figure 4. The tip displacement is performed in a single axis, with a maximum movement from tip to tip of 4.572 mm. It has an overall dimension of 14.478 mm × 90.424 mm, with a thickness of 0.7874 mm. The PEG has a 2.54 mm embedded connector with the option to obtain a series or parallel connection configuration. In this work, a parallel configuration is chosen to double the current and the effective capacitance of the PEG, as shown in
Figure 4.
3. Characterization of Piezoelectric Energy Harvesting in Air and Road Scenarios
The new tuned PEG was characterized during a mixed air and road transport test. The harvested energy was measured with an Arduino Uno board, by means of an analog to digital converter (ADC) with a voltage range from 0 V to 5 V and 10 bits of resolution.
An Arduino shield was designed to include the rectifier circuit, a voltage divider, and a micro SD card holder, as shown in
Figure 5a. The AC signal generated by the harvester was rectified with a full-wave rectifier and a 1
F capacitor. A DC signal was obtained within 0 V and 20 V voltage range. Therefore, a voltage divider was added to limit the maximum DC voltage to 5 V. The DC voltage level was sampled at 2 Hz and stored in a micro-SD memory card. A scheme of the real characterization setup is shown in
Figure 5b.
The conversion function between the data measured during the test and the power harvested by the PEG was obtained using a N6705B DC Power Analyzer. The harvested DC signal was generated with the power analyzer, as the source signal to the ADC. The result of the conversion function is shown in
Figure 6. This function was used to convert the data measured during the test into harvested electrical power.
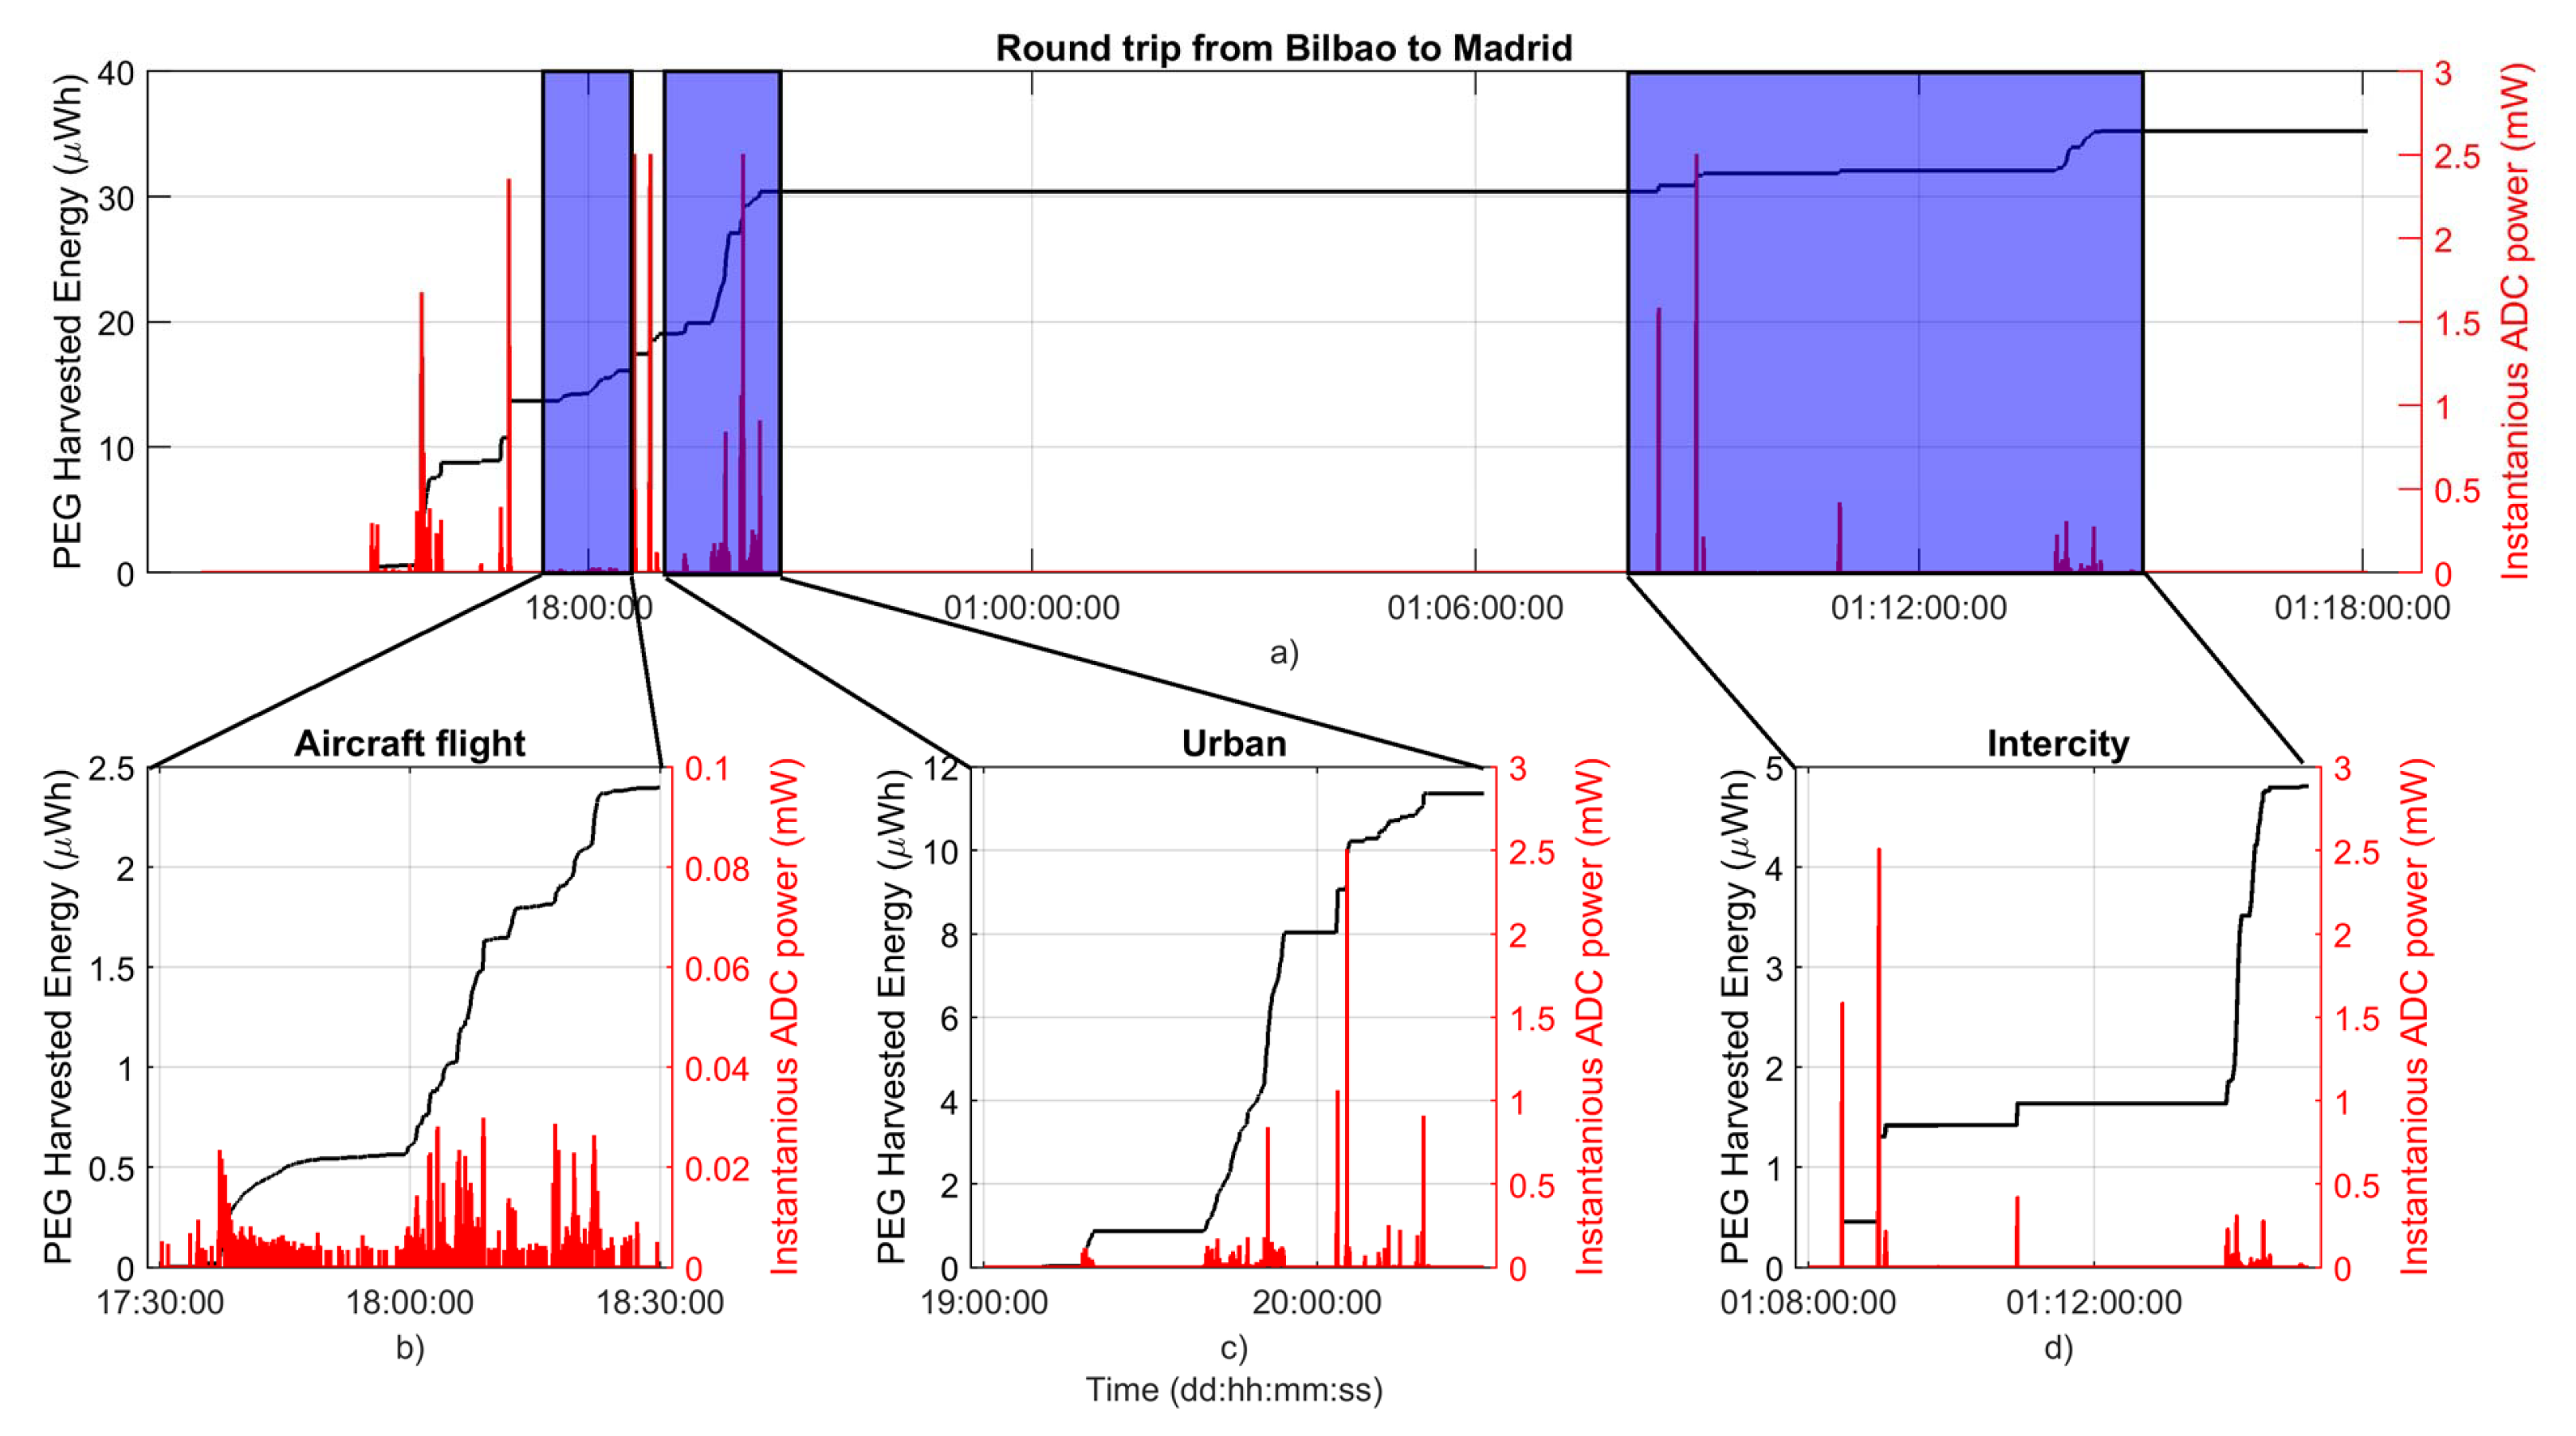
The characterization setup of the PEG was tested in a round trip from Bilbao to Madrid. The setup was loaded in an airplane and the flight took approximately 1 h to go from Bilbao to Madrid. Then, the PEG was unloaded from the aircraft and transported by a small truck into an urban area. It was stored for approximately 8 h. Finally, it was loaded into a large truck that brought it back to Bilbao. The commercial data logger to characterize vibrations for energy harvesting systems [
30] was also shipped with the characterization setup, to analyze the acceleration signals in all axes, to obtain the setup location during the test, and to confirm that the setup was transported in the z-direction. The full process is illustrated in
Figure 7.
This measurement showed the amount of energy that the PEG generated during a real, aperiodic, and multimodal transportation. The PEG was capable of providing Wh during flight (take-off, cruise flight and landing), Wh during a small truck transportation period within the airport and urban area, and Wh during large truck transportation periods on highways with constant speeds and smooth surface roads.
4. Autonomy Increase Validation of an Ultra-Low Powered IoT Device
The evaluation of the amount of energy harvested by the proposed PEG depends both on the application and on the consumption of the electronic of the IoT device. This section presents the design of an ultra-low wireless temperature data logger that monitors the cold chain of perishable products during air and road transportation. The main functions of this data logger are the measurement of the temperature, the detection of an alarm and its storage, and the transmission of the alarm to an external system or device.
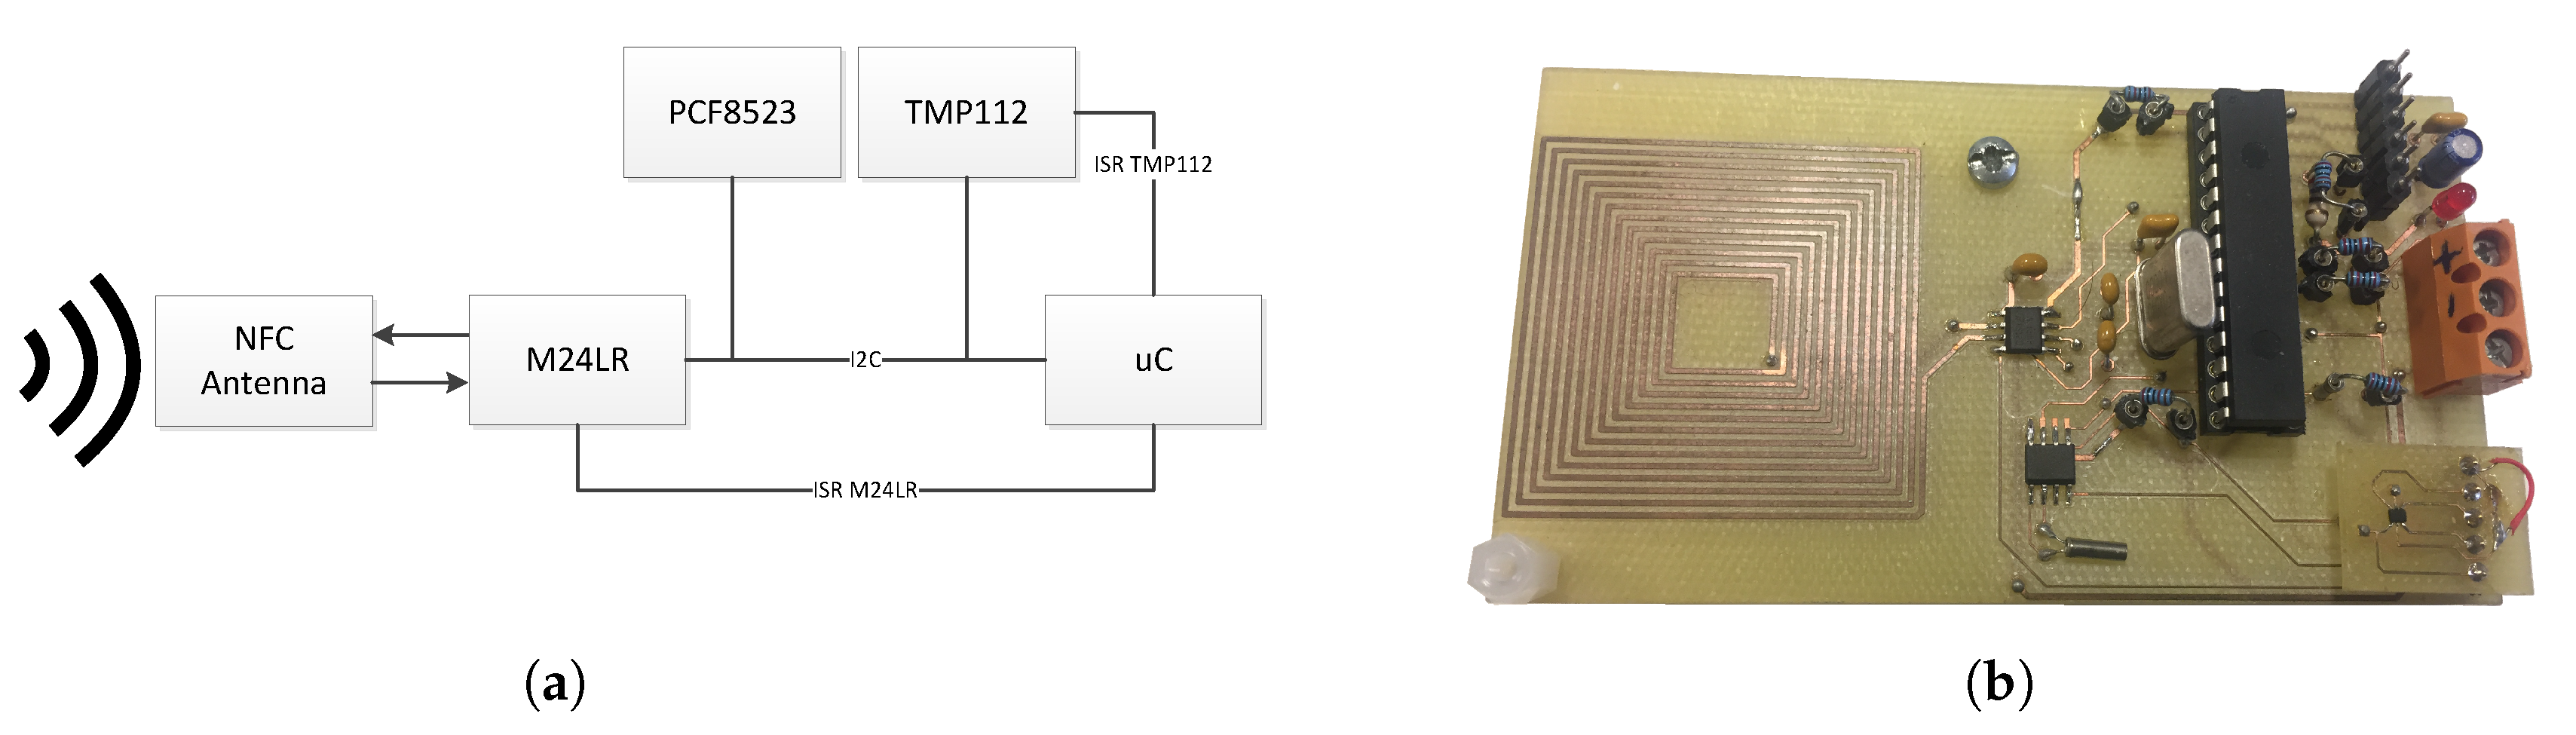
These functions are carried out by four main energy consuming electronic components respectively: a sensor, a microcontroller (MCU), a real time clock (RTC), and a radio-frequency (RF) transceiver, as shown in
Figure 8a. The data logger design is aimed at minimizing the energy consumption of these components for this specific use case. A scheme of the real IoT device for cold chain temperature monitoring is shown in
Figure 8b.
The IoT device operates with two in parallel state diagrams, as shown in
Figure 9; on one hand, the measurement and storage of the temperature, and on the other hand, the data transmission to a mobile device through near field communication technology (NFC). In the initial state of the IoT device, the MCU is in a below threshold (BTH) sleep mode. The sensor measures the temperature every
, which in this work is set to 4 s. It checks if the temperature is above a specific threshold (TH) previously stored, and if the temperature is above threshold (ATH), the sensor triggers an alarm. The MCU wakes-up and reads the RTC, storing the timestamp of the event. Then, it goes back into the sleep mode. When the temperature gets back below the TH, it wakes-up the MCU again, and the timestamp of the event is read and stored. Afterwards, it goes into the sleep mode. This duty cycle allows maximizing the sleep mode of the MCU and RTC while storing the temperature data and the duration of the cold chain break. Finally, the stored data is wirelessly transmitted to an external mobile phone with NFC when compatible with ISO 15693, avoiding any internal energy consumption. This feature adds a security layer to prevent intrusive access to the information stored.
The selection and configuration of these four electronic components is as follows. The temperature sensor is the TMP112 digital sensor with a theoretical quiescent current of 2.2 A, an active mode consumption (temperature reading and conversion) of 40 A, with a 0.0625 °C resolution, and I2C serial communication interface. It has two modes of operation: one-shot or the one that has finally been selected for continuous conversion. It provides a configurable measuring rate of 0.25 Hz, 1 Hz, 4 Hz, or 8 Hz. The storage of each conversion in a register overwrites the result of the previous measurement. It also has an interrupt mode that activates the alert pin if the temperature exceeds the value configured in the T(High) register or goes below the T(Low) register for a number of consecutive faults. In this work, a measuring rate of 0.25 Hz has been chosen, and the T(High) and T(Low) registers have been set to the same temperature threshold, to trigger one interruption when the temperature goes ATH (cold chain broken started) and to trigger another interruption when the temperature goes BTH (cold chain broken ended).
The MCU is the ultra-low-power 8-bit PIC 16LF1516. It can run up to 20 MHz with 3.7 V supply voltage and consumes approximately 240 A with a 4 MHz clock rate. The supplied current reduces to 40 nA in sleep mode with full RAM retention.
The RTC is the PCF8523 CMOS real-time clock; it provides time-stamped records optimized for low power consumption (150 nA @ 3 V). Data is transferred serially by I2C with a maximum data rate of 1000 kbit/s. The NFC transceiver is the M24LR with an interface compatible with ISO 15693 and ISO 18000-3 mode 1 NFC phones, and a 400 kHz I2C serial interface. An output pin on the M24LR exposes an RF write in progress status to avoid data races with the MCU. If the MCU is writing to the memory and the write in progress pin becomes active, the firmware will wait until the interruption is cleared before accessing the memory again. Finally, a 13.56 MHz etched RF antenna is designed on lossy FR4 substrate that matches the internal tuning capacitance of 27.5 pF. The NFC antenna harvests the energy from a NFC reading device and then the M24LR backscatters the stored temperature and timestamp data to the reader, by internally changing its output impedance back and forth. The configuration of the temperature TH and the RTC is possible through the NFC system. The first blocks of the memory are used as configuration registers, while the next blocks store the time-stamped temperature records. When it boots, the MCU enters sleep mode if not configured yet. When the work in progress pin of the M24LR becomes active, MCU wakes up, it waits until cleared and then it checks if the configuration blocks of the memory have changed. If so, TMP112 and PCF8523 are configured with those values and the MCU goes back to sleep until a temperature excursion happens or the M24LR is accessed again to modify configuration parameters.
The consumption of this data logger has been characterized with the N6705B DC Power Analyzer reproducing the same duty cycle used during the characterization of the PEG in the previous section. The power consumption of the data logger in idle mode (no sensor measurements) was 7.03 W for a time period of 4 s, in active mode (temperature reading and conversion) was 156 W for a time period of 24.3 ms, and in alarm mode (MCU and RTC recording the time-stamp in the NFC EEPROM) was 1.44 mW for a time period of 100 ms per interruption, approximately.
Figure 10 shows the comparison between the consumption of the data logger and the energy obtained from the PEG using the characterization setup illustrated in
Figure 5. The dash curve shows the power consumption of the data logger during the entire duty cycle with a temperature measurement period of 4 s and one cold chain break during 1 h, while the curve with plus ticks shows the power consumption of the same data logger, but including the energy harvested by the PEG (which is plotted in the graph with asterisk ticks). A fully charged 3.7 V battery of 100 mAh was considered. The perishable product transportation use case took approximately 30 h and the harvested energy provided an increase of 5 h, which means 16.7% more autonomy.

 ,
, 


