Abstract
Multi-core processors integrate with multiple computing units on one chip. This technology is increasingly mature, and communication between cores has become the largest research hotspot. As the number of cores continues to increase, the humble bus structure can no longer play the role of multi-core processors. Network on chip (NoC) connects components through routing, which greatly enhances the efficiency of communication. However, the communication power it consumes and network latency are issues that cannot be ignored. An efficient mapping algorithm is an effective method to reduce the communication power and network latency. This paper proposes a mapping method. First, the task is divided depending on the scale of the task. When the task scale is small, to reduce the communication distance between resource nodes, a given NoC substructure is selected to map the task; when the task scale is large, to reduce the communication between tasks, the tasks are clustered and tasks with dependencies are divided into the same resource node. Then combine with an improving ant colony algorithm (ACO) for mapping. The method proposed is being experimentally verified on NoC platforms of different scales. The experimental results show that the method proposed is very effectual for reducing communication power and network latency during NoC mapping.
1. Introduction
The system on a chip (SoC) has the characteristics of high reusability, which can greatly promote various performance indicators of the system, and is easy to implement. It has been used extensively in the field of integrated circuits. However, with the increasing integration scale of SoC, the complexity of the system will continue to increase exponentially [1], which will greatly affect the performance. To better promote the performance of the system, the traditional bus structure is also constantly being improved, but still cannot satisfy the growing needs of users. Therefore, a structure with superior scalability, relatively simple design, and high performance is necessary in order to implement on-chip communication. A Network on Chip (NoC) structure emerges at the historic moment. Most chip networks use a different clock strategy, that is, global asynchronous local synchronous clock control. The communication network is established by interconnecting routers connected to the IP core. Two-way communication between routers is utilized to exchange information between the IP cores. The routing strategy can be implemented step by step. At the same time, NoC’s network structure makes it highly scalable. The emergence of networks on a chip has solved a series of bottlenecks in the development of SoCs. With the continuous improvement of the functions of the IP core itself, its processing capacity is no longer of a major factor restricting the development of the system on a chip. How to achieve real-time communication of a large amount of data has grown to be an urgent issue for the development of the system on a chip. Therefore, the NoC has become a heated issue in today’s academic research. Due to the high integration and high clock frequency, communication power has become the biggest problem of NoC [2]. In order to decrease the communication power and network latency of NoC, an effective task mapping scheme is necessary.
At present, there are numerous mature methods for NoC’s task mapping problem. Sahu et al. [3] proposed a discrete particle swarm mapping algorithm that can be implemented to IP kernel mapping of 2D and 3D meshes to obtain lower communication power and higher performance. Khalili et al. [4] proposed a fault-tolerant multi-application mapping technology. By using a heuristic algorithm, the graph of the application core is mapped to the idle error-free core, and then the other idle error-free cores are adjusted to place other idle cores. Bayar et al. [5] proposed an effective mapping algorithm for a two-dimensional on-chip network architecture with reconfigurable switches, replacing complex routers with simple switch setting paths. Seidipiri et al. [6] determined the priority based on the communication weight of the subtask, and then proposed a heuristic mapping algorithm RASMAP. Sacanamboy et al. [7] applied the idea of AI (Artificial Intelligence) to the NoC mapping problem solution. Shekhar et al. [8] proposed a dynamic priority scheduling NoC memory access strategy and location-based allocation strategy to explicitly use scheduling strategies to improve task allocation efficiency and network utilization. Lin et al. [9] skillfully combined a genetic algorithm with the greedy algorithm, and achieved remarkable results, and an improved particle swarm algorithm. A 3D-NoC mapping algorithm based on a quantum particle swarm is proposed, which has excellent performance in large-scale task graphs. Yi et al. [10] faced the problems of three-dimensional on-chip network congestion and excessive link load, balanced the link load according to the mapping algorithm, reconstructed the link, and reduced the latency. Liu et al. [11] proposed an adaptive communication power and credibility mapping method for the reconfigurable on-chip network architecture. The evaluation index is the sum of the power and credibility weight.
At present, there are many solutions for the performance improvement of NoC mapping. The most common method is to use a heuristic algorithm to map. This paper focuses on communication power and network latency, proposes different partitioning schemes for different task sizes, and combines them with an improved ant colony algorithm for task mapping.
2. Performance Model
2.1. Communication Power Model
Communication power is the energy consumption of each node in the NoC structure. It is one of the most important indicators reflecting the performance of network-on-chip mapping. Its size is closely related to the amount of communication between nodes and the length of communication distances. This paper uses the most recognized power calculation model for 2D-Mesh structures. As shown in Equation (1), represents the communication power consumed by NoC nodes to transmit single-bit data. represents the communication power of a single bit of data on a routing node, while represents the communication power of a single bit of data on a link.
Use the Manhattan distance to represent the communication distance between NoC nodes, that is, the distance between the two nodes in the north–south direction plus the distance in the east-west direction. Assuming that the coordinates of nodes i and j are and , respectively, the Manhattan distance between the two nodes can be expressed by Equation (2).
The communication power transmitted from node i to node j includes the communication power of a link with a distance and the communication power of nodes. The total power consumed by a single bit of data can be expressed by Equation (3).
Assuming that the amount of data between nodes i and j is , the total communication power between the two nodes is expressed by Equation (4).
The total communication power of NoC topology can be obtained by adding the communication power among all nodes on NoC topology, as shown in Equation (5).
2.2. Network Latency Model
Latency is the sum of the time it takes to execute a task and the time it takes to transmit a task. It is an important indicator of the effectiveness of a mapping algorithm. The network latency of NoC is shown by in Equation (6), represents the task execution latency, and represents the task communication latency.
In this paper, it is assumed that the latency consumed by the task on the i-th node in the weighted directed acyclic graph (DAG) on the processor core is , and the total execution latency is the sum of the latency consumed by the tasks on all nodes in the DAG. It is expressed by Equation (7).
In an ideal state, that is, when the network is non-blocking, the transmission latency includes the latency of the source node sending tasks, the latency of passing the link and intermediate nodes, and the latency of the destination node receiving tasks. In the NoC mapping process, the location of the task map, the size of the task amount, and the blockage of the link must also be considered, so the latency will be greater than in the ideal state. Assuming that the transmission latency consumed by nodes i to j in NoC is , the total transmission latency is the sum of the transmission latency of all nodes, which is expressed by Equation (8).
3. Mapping Establishment
First, the task mapping process is abstracted. The task graph is described by a weighted directed acyclic graph (DAG), which is expressed as G (V, E, Q, W). The vertex in the graph represents the i-th task, directed arc , which denotes the communication relationship between task and , the weight of the vertex denotes the task amount of the vertex task , the weight on the arc denotes the communication bandwidth between the task and . Figure 1a shows a DAG with 6 tasks.
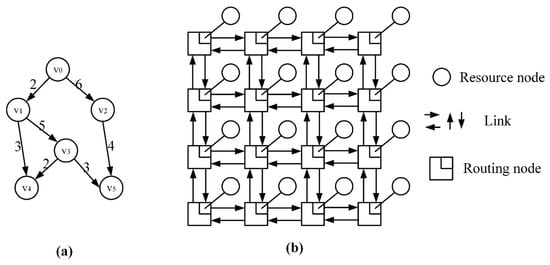
Figure 1.
(a) A DAG with 6 tasks; (b) 4 * 4 mesh structure.
Mesh structure is the main structure of the current on-chip network topology design. Each resource node is banded with a routing node. In addition to the boundary nodes, each node is connected to its surrounding four nodes. Because the mesh structure is simple in design, easy to implement, and has good scalability, this paper selects n * n mesh structure for research and analysis. Figure 1b shows a 4 * 4 mesh structure.
A traditional NoC task mapping process is that, on a given NoC platform, all tasks in the DAG are individually scheduled to the processing core unit of the NoC platform resource node, and then task mapping is performed according to the scheduling result. The whole process is shown in the Figure 2. In the task mapping process, the mapping method will be different depending on the task size, the number of processing core units, and the size of the NoC’s mesh framework. In the NoC platform of the 2D-mesh structure used in this paper, since each routing node is connected to only one resource node, it is assumed that the resource node is already bound to the routing node when mapping, and each resource node is different. At this time, the process of mapping tasks to the mesh structure is simplified, and the mesh structure is heterogeneous. In the actual mapping process, this paper considers the task size and the number of resource nodes in the mesh structure, and proposes different task division schemes for different situations.
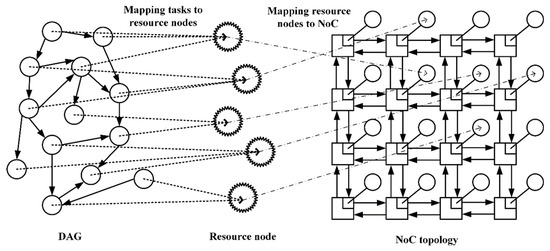
Figure 2.
Traditional NoC task mapping process.
3.1. Small-Scale Task Division Scheme
This section proposes a corresponding partitioning scheme for the case where the number of vertices of the DAG is less than the number of resource nodes in the mesh structure. In a NoC structure, the shorter the link between two nodes, the lower the communication power and network latency for communication between them. Therefore, in this case, if these tasks are mapped to the NoC platform as densely as possible, communication power and network latency will be greatly reduced.
The solution proposed in this article is the area selection (AS) method. Before mapping, select a given mesh architecture, select a sub-mesh structure, and divide the tasks into this sub-structure. Assume the number of tasks is m (m > 0), and the NoC platform is an n * n mesh structure, where m < n*n. In order to make communication between all tasks more convenient, it is best to let the selected nodes have as many connections with other nodes as possible, and the selected area must have as many free resource nodes as possible. So when choosing a area, consider the following two situations: ① Assuming the task scale and the count of NoC nodes satisfies the condition , where , then the selected sub-mesh structure is mesh; ②Assuming the task scale and the count of NoC nodes satisfies the condition , where , then the selected sub-mesh structure is or mesh.
Figure 3 shows two examples of small-scale task division. The NoC to be mapped is a 4 * 4 mesh structure. There are resource nodes that are not in the idle state in the structure, and tasks cannot be mapped to these nodes when mapping. At the same time, when an area is selected, a link failure in the structure must be considered. For example, if the link between coordinates (2,4) and (3,4) fails in the structure, the Manhattan distance between this resource node will change from 1 to 3. Both communication power and latency between cores increase. There are a total of 8 vertices in the task DAG in Figure 3a, that is, a total of 8 tasks, which meet the above conditions. ① At this time, the task needs to be mapped to a 3 * 3 sub-mesh structure. When selecting the sub-mesh structure, the objective is to avoid the location of the link failure, and let as few busy resource nodes as possible appear in the selected area. There are 10 vertices in the task DAG in Figure 3b, which satisfy the above condition ②. At this time, a 3 * 4 or 4 * 3 sub-mesh structure should be selected for mapping, and the principles followed in selection are the same as the previous ones.
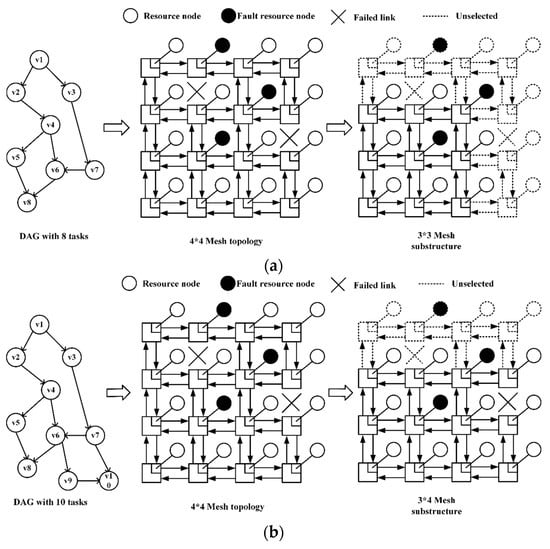
Figure 3.
(a) Division of 8 tasks; (b) division of 10 tasks.
3.2. Large-scale Task Division Scheme
This section proposes a corresponding partitioning scheme for the case where the number of vertices of the DAG is larger than the number of resource nodes in the mesh structure. In this case, it is best to map multiple tasks to the same resource node for execution. In DAG, the greater the weight of the arc between the two tasks the greater the communication bandwidth that needs to be consumed between two dependent tasks, which will consume more power and network latency. However, if these two tasks are divided to be executed on the same resource node, the communication latency between the two tasks is almost negligible. Based on this characteristic, this paper uses k-means clustering method to cluster tasks.
The k-means clustering algorithm first determines clustering into k classes, and randomly selects the initial value as the centroid of each class. Then it calculates the similarity between each sample and the centroid, and classifies the sample into the category of the centroid most similar to it. Next the algorithm recalculates the centroids of each class and repeats the previous process until the centroids no longer change, at which point the clustering is complete. To cluster tasks in a DAG, two factors need to be considered: ① grouping of tasks with large communication bandwidth into one category; ② the dependency relationship between tasks should be considered when clustering. The traditional k-means algorithm initially randomly selects the centroid, and there is no specific basis for the selection of task dependencies. If the result is not suitable, it will directly affect the result of subsequent task mapping. In order to obtain clustering results that meet the requirements of this paper, an improved k-means algorithm has the following definition.
(1) Set k value. Suppose the number of tasks is m (m > 0) and the mesh structure is n * n (0 < n * n < m). Set the k value in k-means to n * n, that is, how many resource nodes the mesh structure will divide the task into as many classes.
(2) Measure of distance. In DAG, the communication bandwidth between the vertices and represents the distance between two tasks with direct dependencies. The distance between two tasks without direct dependencies is infinite, and is expressed by Equation (9).
(3) Choice of initial centroid. Select tasks with only in-degrees or only out-degrees and fewer in-degrees or out-degrees. If there are too many such tasks or no such tasks exist, the task with the largest sum of distances from direct dependencies is selected. Let the task’s out-degree be and the in-degree be . Algorithm 1 is the pseudo code of initial centroid selection.
| Algorithm 1 Choice of initial centroid |
| Input: DAG with m tasks; n*n Mesh; Output: k initial centroids center[];/*Centroid to be determined*/ p=0; for task in DAG with outdegree=0 or indegree=0 do task->center[]; p++; end for if p=k then return center[]; end if if p>k then choose the k largest degree with the lager communication tasks; delete other p-k tasks from center[]; else choose the k-p smallest degree with the lager communication tasks; add these k-p tasks into center[]; end if return center[]; |
(4) Iteration process. After selecting the initial centroids, compare the distances between all tasks and each centroid. Select the centroids that are dependent on the task and have the largest distance for clustering. If the distance from each centroid is infinite, no clustering is performed in this iteration. Stop clustering when the clustering results no longer change. At this point, there may still be unclustered tasks. Divide the task into the cluster with the largest distance from the task, and the iteration ends. Algorithm 2 shows the pseudo code of the iterative process.
| Algorithm 2 Iteration process |
| Input: DAG with m tasks n*n Mesh; Initial centroid; Output: Clustering results; c[1],c[2],…,c[k]/*Store clustering results*/ p=0; while Not converged do for task in DAG do Calculate the distance from the task to each centroid; Choose maximum dependent distance; Cluster with this centroid; if No dependencies with centroids then Not clustering temporarily; end if end for Select the task with the largest communication value in each group as the new centroid; end while Divide unclustered tasks into classes with maximum distance dependence; return c[1], c[2],…,c[k]; |
As shown in Figure 4, the clustering process divides a DAG with 14 vertices into a 2 * 2 mesh structure, so the tasks need to be clustered into 4 clusters. First select the initial centroid. In the DAG, v1 is the vertex with only out-degrees, and v14 is the vertex with only in-degrees. These two nodes are used as the initial centroids. The other two initial centroids need to select task vertices with less task dependencies and corresponding arc weights, so v8 and v4 are selected. Then reselect centroids and continue iterating.
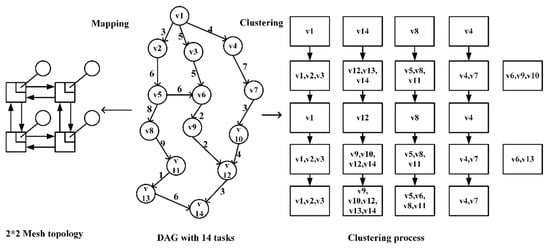
Figure 4.
Task clustering process.
4. Mapping Process
4.1. Algorithm Selection
After the tasks are divided by using the method proposed in this paper, the task mapping process can be abstracted into the process of mapping tasks to mesh structures of almost the same size. At present, heuristic algorithms are a popular solution to the task mapping problem. Common heuristic algorithms include simulated annealing algorithms (SA), genetic algorithms (GA), ant colony algorithms ACO), etc. In order to choose a heuristic algorithm that is most suitable for NoC mapping, experiments are performed on the above three algorithms. The applications selected for the experiment are three common DAGs: MPGE-4 decoding system, Video0.
3 Object Plane Decoder (VOPD), and Multi Window Display (MWD). The communication power and network latency results of the three algorithms are based on the SA. Figure 5 and Figure 6 show the results. During the experiment, it was found that the performance difference between the three algorithms was very small. For different tasks, the three algorithms show differences in performance. The experimental results alone cannot prove which of the three algorithms is the best. Therefore, the results obtained from the three DAGs can only be averaged as a basis for selection.
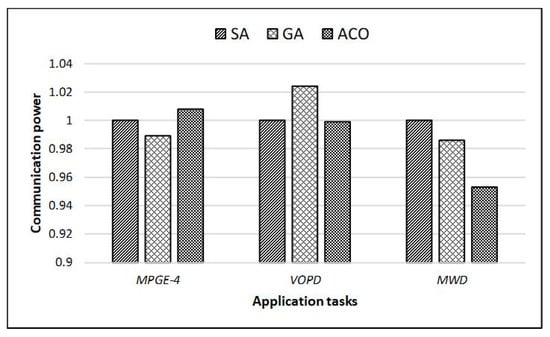
Figure 5.
Comparison of communication power of heuristic algorithms (SA, simulated annealing algorithms; GA, genetic algorithms; ACO, ant colony algorithms).
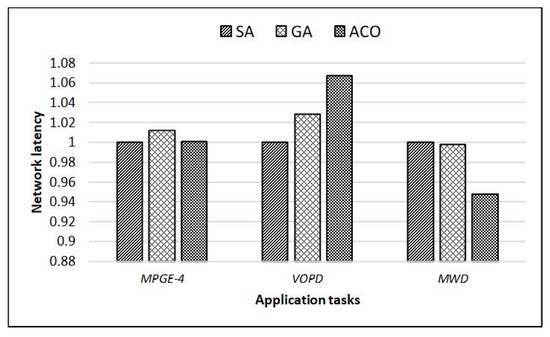
Figure 6.
Comparison of network latency of heuristic algorithms.
The ACO is a probabilistic algorithm to find the optimal path. The location of ants represents the solution of the task mapping location problem. All the locations of the entire ant colony represent the solution space of the task mapping location problem. Ants with better mapping released more pheromone. As time progressed, the pheromone accumulated on the better mapping increased, and the number of ants who chose the better mapping increased. Finally, all the ants focus on the best mapping under the effect of positive feedback, and, at this time, the corresponding solution is the optimal solution of task mapping position problem. Based on the completion of task division, this paper proposes an improved ant colony algorithm (I-ACO) to map tasks.
4.2. Traditional ACO
The basic idea of traditional ACO is that ants release pheromone on their location. When an ant encounters an location that has not yet been reached, it randomly chooses a way to go. The pheromone is released. The better the mapping location, the higher pheromone. When the subsequent ants pass the same location, they choose the location with the higher pheromone. In this way, the pheromone level on the best location will become higher and higher. After the iteration is completed, the location with the highest pheromone is the best mapping location found by ants.
When the ACO is applied to the task mapping problem of NoC, it is necessary to achieve the purpose of reducing communication power and network latency. Therefore, when choosing the path and releasing the pheromone, the estimated communication power and network latency are used as indicators, and then iteration is performed. There is an interdependence between tasks, that is, one task needs to wait for another task to complete before it can be executed, and the task will consume additional power and latency while waiting. If the mapping is based only on the best mapping method finally obtained by traditional ACO, without considering the task waiting situation, the obtained scheme may not be the optimal scheme in actual mapping.
4.3. Improved ACO
This paper proposes an improved ACO for the above-mentioned task-waiting communication power problem. The traditional ACO takes the shortest path that ants walk as the optimal solution. In this paper, a group of ants are bound together. In the end, each ant in the group walks to a different position, and then calculates the communication power and network latency that the entire group is expected to consume to select the optimal group.
(1) Suppose there are m groups of ants, with k in each group. Number the ants according to 1,2, …, k, where k is the same as the number of task vertices in a given DAG.
(2) represents the ants in the rth group of ants that have not yet been mapped. represents the resource nodes in group r that have not yet been mapped.
(3) Iteration is performed by pheromone concentration and heuristic value. The performance indicators of this article in the process of task mapping are communication power and network latency. Communication power and network latency consumed by a single task on the link, and resource nodes represent pheromone, noted as , and heuristic values, noted as , respectively. As shown in Equations (10) and (11).
(4) When the ant performs mapping, it is necessary to select the mapped node according to the probability. The probability, noted as , is calculated based on the pheromone concentration and heuristic value, as shown in Equation (12). Among them, and respectively represent the specific gravity of the two. In this paper, they are considered to be equal, so they are both set to 1.
(5) Set the maximum number of iterations as , the best mapping scheme as . Algorithm 3 shows the pseudo code of the improved ACO.
| Algorithm 3 Improved ACO |
| Input: DAG with m tasks; NoC with n*n Mesh; M groups of ants, each with m; Output: bestMapping; procedure Overall process Set maxTimes; while unreach maxTimes do Initialization; Mapping process; Update information; end while return bestMapping; end procedure procedure Initialization AntTable[]; /*Unmapped ants*/ CoreTable[]; /*Unmapped resource nodes*/ Select tasks t without In-degree; Calculate probability p; Map t to resource nodes c based on p; delete t from AntTable[]; delete c from CoreTable[]; end procedure procedure Mapping process while AntTable is not empty do selete task t without parent node or parent is not in AntTable[]; Map t to resource nodes c based on p; delete t from AntTable[]; delete c from CoreTable[]; end while end procedure procedure Update information Calculate communication power and network Latency; if better performance than before then update bestMapping; end if end procedure |
The pseudo code of improving ACO is mainly divided into initialization, mapping process, update information, and overall process.
(1) Initialization. Select a task with no degree of entry in each group of ants and calculate the probability. Randomly map it to a resource node of NoC according to probability. Delete the task from the current antTable. Remove the node from .
(2) Mapping process. Select the node in the that has no parent node or the parent node has been mapped. Map to nodes in according to probability. Repeat this process until all the ants in are mapped.
(3) Update information. Record the power consumption and delay of the current group mapping, and compare with the original optimal solution. If the set of solutions is better, the value is updated.
(4) Overall process. Set the maximum number of iterations and the total number of ant groups m. In each iteration, the m groups of ants are simultaneously initialized, mapped, and updated. Iterate repeatedly until is reached to stop the algorithm.
5. Performance Analysis
5.1. Experimental Environment
To verify the performance of the proposed scheme for mapping tasks of different scales to NoC platforms, 4 * 4 and 8 * 8 mesh structures were used to perform mapping experiments on the tasks. Tasks were randomly generated using the Task Graph for Free (TGFF) tool. TGFF can generate DAG with different computing and communication relationships according to user settings. It is particularly suitable for theoretical analysis of task mapping and task scheduling. In order to ensure accurate results, TGFF was used to randomly generate multiple groups of DAG with the same number of different structures. After each experiment was performed, the average value was obtained to obtain the final experimental results. At the same time, the gem5 simulator was used to collect statistics and output the results of communication power and network latency.
5.2. Experimental Results
5.2.1. Small Scale Task Mapping Experimental Results
To verify the performance of the small-scale task partition method proposed combined with the improved ant colony algorithm (noted as AS_I-ACO), a comparative experiment was performed. The traditional ant colony algorithm (Traditional ACO) was used as the standard to compare experimental data. When a 4 * 4 mesh structure is selected for mapping experiments, the validity of the method is verified under the condition that the number of tasks in the DAG is less than the number of resource nodes of NoC. The AS_I-ACO proposed selects the optimal area of NoC to divide the tasks according to the number of tasks, and then uses I-ACO to map the tasks. The experimental results are also compared with the results obtained by the method (noted AS_ACO) with only the NoC area selection and without the improved ant colony algorithm. During the experiment, the number of selected tasks was 5, 10, and 15, and Figure 7 and Figure 8 show the experimental results.
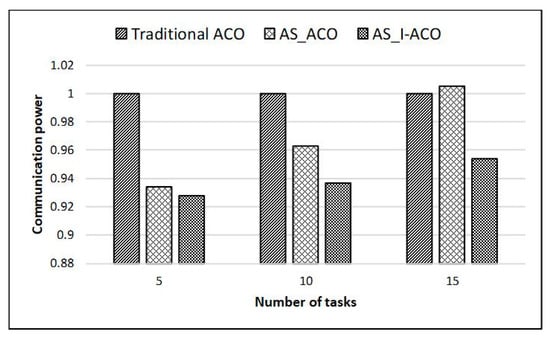
Figure 7.
Small-scale task mapping communication power results on a 4*4 mesh.
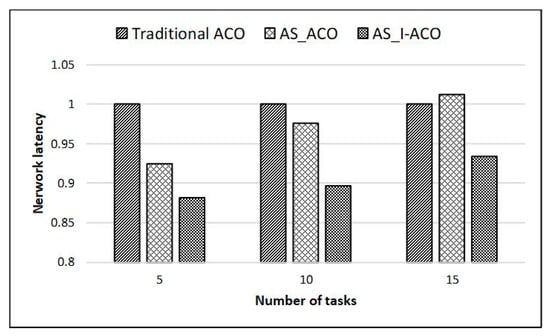
Figure 8.
Small-scale task mapping network latency results on a 4*4 mesh.
The experimental results showed that AS_ACO can improve the performance of the system to a certain extent. Compared with traditional ACO, when the number of tasks is 5, the communication power was reduced by 6.6%, and the network latency was reduced by 7.5%; when the number of tasks was 10, communication power was reduced by 3.7% and network latency was reduced by 2.4%; when the number of tasks was 15, communication power and network latency were not reduced, but slightly increased. It can be seen that when the scale of tasks is closer to the resource nodes, the effect of using only area selection on the performance improvement is less obvious, and it may even reduce performance. This is because when the scale of tasks is similar to the resource nodes, the entire NoC structure is directly selected for mapping without the need for area selection, so it is not much different from the traditional ACO.
The experimental results showed that using AS_I-ACO on this basis can effectively improve system performance. Compared with the traditional ACO, when the number of tasks was 5, the communication power was reduced by 7.2%, and the network latency was reduced by 11.8%; when the number of tasks was 10, communication power was reduced by 6.3%, and network latency was reduced by 10.3%; when the number of tasks was 15, communication power was reduced by 4.6% and network latency was reduced by 6.6%. To further verify the performance of AS_I-ACO, when the 8 * 8 mesh structure was selected for mapping experiments, the number of tasks was selected to be 40, 50, and 60, and Figure 9 and Figure 10 show the experimental results.
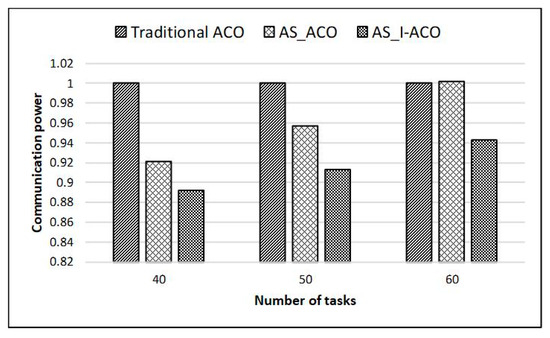
Figure 9.
Small-scale task mapping communication power results on 8*8 mesh.
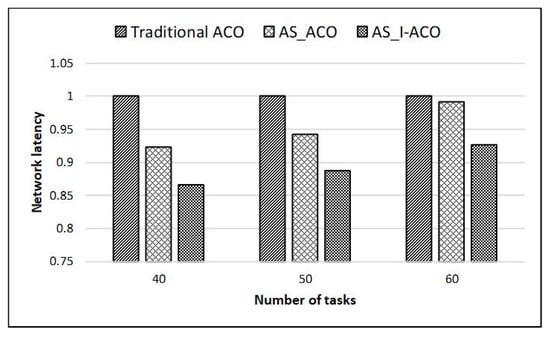
Figure 10.
Small-scale task mapping network latency results on 8*8 mesh.
The experimental results displayed a trend in the obtained data similar to the 4 * 4 NoC mapping results. Compared with the traditional ACO, AS_I-ACO reduced communication power by 10.8% and network latency by 13.4% when the scale of tasks was 40; when the scale of tasks was 50, communication power was reduced by 8.7% and network latency was reduced by 11.3%;when the scale of tasks was 60, communication power was reduced by 5.7%, and network latency was reduced by 7.4%. In summary, it is proved that using the proposed AS_I-ACO to promote the mapping performance of NoC was very effective.
5.2.2. Large Scale Task Mapping Experimental Results
The traditional ACO is still used as a standard to compare experimental data to verify the effectiveness of the method (noted as K-means_I-ACO) proposed in this paper. When a 4 * 4 mesh structure is selected for mapping experiments, the validity of the algorithm is verified under the condition that the number of tasks in the DAG is greater than the number of resource nodes of the NoC. K-means_I-ACO clusters the tasks in the DAG according to the number of resource nodes, and then uses I-ACO to map the tasks. The experimental results are compared with the results obtained by clustering tasks without using the improved ant colony algorithm (denoted as K-means_ACO). During the experiment, the number of tasks was selected to be 20, 25, and 30. Figure 11 and Figure 12 show the experimental results.
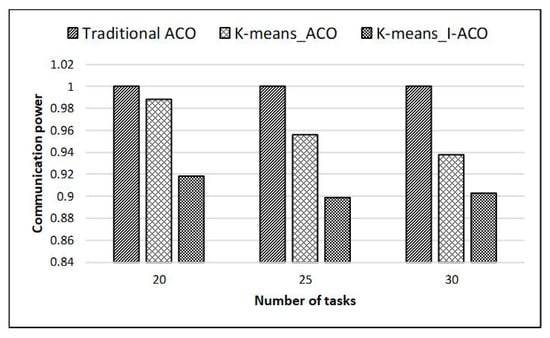
Figure 11.
Large-scale task mapping communication power results on 4*4 mesh.
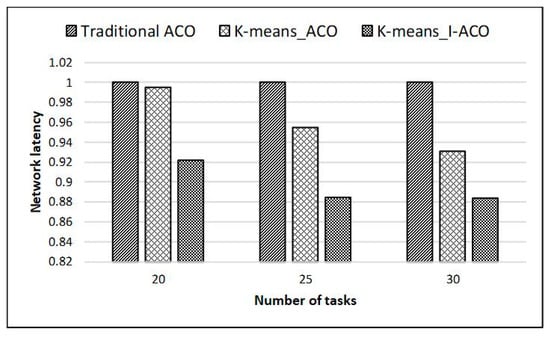
Figure 12.
Large-scale task mapping network latency results on 4*4 mesh.
The experimental results showed that K-means_ACO can promote the performance of the system to a certain extent. Compared with the traditional ACO, when the number of tasks was 20, communication power was reduced by 1.2%, and network latency was reduced by 0.5%; when the number of tasks was 25, communication power was reduced by 4.4%, and network latency was reduced by 4.5%; when the number of tasks was 30, communication power was reduced by 6.2%, and network latency was reduced by 6.9%. It can be seen that when the scale of tasks is closer to the resource nodes, the effect of using only task clustering on performance improvement becomes less obvious. Similarly, when the task size is similar to the resource node, clustering is not required.
The experimental results showed that using K-means_I-ACO on this basis can effectively improve system performance. Compared with the traditional ACO, when the number of tasks was 20, the communication power was reduced by 8.2%, and the network latency was reduced by 7.8%; when the number of tasks was 25, communication power was reduced by 10.1%, and network latency was reduced by 11.5%; when the number of tasks was 30, communication power was reduced by 9.7%, and network latency was reduced by 11.6%. To further verify the performance of K-means_I-ACO, an 8 * 8 mesh structure was selected for the mapping experiment, and the number of tasks was selected to be 70, 80, and 90. Figure 13 and Figure 14 show the experimental results.
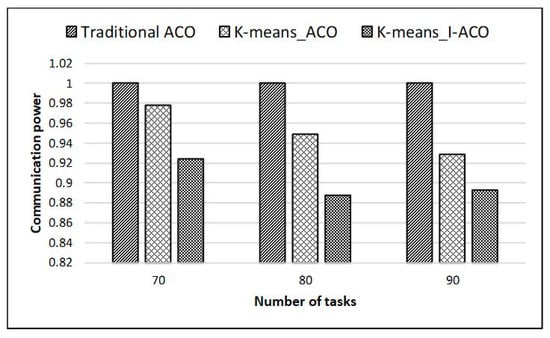
Figure 13.
Large-scale task mapping communication power results on 8*8 mesh.
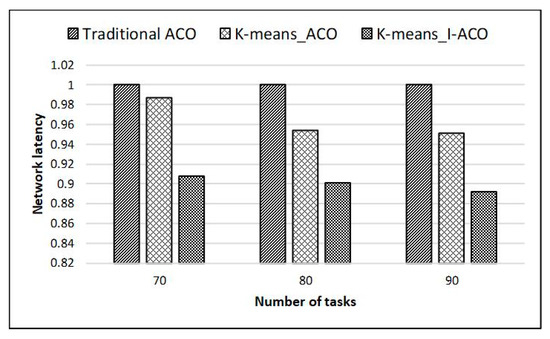
Figure 14.
Large-scale task mapping network latency results on 8*8 mesh.
The experimental results showed that the trend in the obtained data is similar to the 4 * 4 NoC mapping result. Compared with the traditional ACO, K-means_I-ACO reduced the communication power by 7.6% and the network latency by 9.2% when the scale of tasks was 70; when the scale of tasks was 80, communication power was reduced by 11.2%, and network latency was reduced by 9.9%; when the scale of tasks was 90, communication power was reduced by 10.7%, and network latency was reduced by 10.8%. In summary, it is proved that improving NoC mapping performance by using the K-means_I-ACO proposed in this paper is very effective.
5.3. Experiment Summary
Through the analysis of the above experimental results, the combination of the proposed task division scheme and I-ACO for the scale of the task in this paper has significantly improved the performance of NoC. The performance improvement is most obvious when the task size is significantly different from the number of NoC resource nodes. When the task size is similar to the number of resource nodes, the task partitioning method makes little difference; at this point, it is equivalent to relying only on I-ACO to improve performance. Therefore, the method proposed is more suitable for mapping situations where there is a gap between the task size and the number of NoC resource nodes.
6. Conclusions
This paper proposes a method to reduce communication power and network latency for the mapping of on-chip networks. First divide the tasks according to the task size. When the task scale is small, to reduce the Manhattan distance of tasks mapping to NoC, select a given NoC substructure to map the task, so that the tasks can be centralized; when the task scale is large, cluster the tasks and divide certain tasks with dependencies to the same resource node, which can greatly reduce communication power and network latency. After tasks are divided, the improved ant colony algorithm proposed is used to map the tasks to the resource nodes of NoC. Using communication power and network latency as performance indicators, experiments were performed on NoC platforms of different scales, and mapping experimental results were obtained. Compared with the traditional ant colony algorithm and the method of task division without using the improved ant colony algorithm, the experimental results obtained have improved performance, which proves that the proposed mapping scheme is effective. During the mapping process, core failures are often encountered. In future research, we will add fault tolerance mechanism. When the core fails, task mapping can be effectively completed on the premise of ensuring performance.
Author Contributions
Project administration, J.F.; supervision, J.F.; conceptualization, T.Y.; methodology, T.Y.; validation, T.Y., Z.W.; formal analysis, T.Y.; writing—original draft preparation, T.Y., Z.W.; writing—review and editing, T.Y., Z.W. All authors have read and agreed to the published version of the manuscript.
Funding
This research was funded by Beijing Natural Science Foundation, grant number 4192007.
Acknowledgments
This work is supported by Beijing Natural Science Foundation (4192007), and supported by the National Natural Science Foundation of China (61202076), along with other government sponsors. The authors would like to thank the reviewers for their efforts and for providing helpful suggestions that have led to several important improvements in our work. We would also like to thank all teachers and students in our laboratory for helpful discussions.
Conflicts of Interest
The authors declare no conflict of interest.
References
- Renteria-Cedano, J.; Rivera, J.; Sandoval-Ibarra, F.; Ortega-Cisneros, S.; Loo-Yau, R. SoC Design Based on a FPGA for a Configurable Neural Network Trained by Means of an EKF. Electronics 2019, 8, 761. [Google Scholar] [CrossRef]
- Fang, J.; Zong, H.; Zhao, H.; Cai, H. Intelligent Mapping Method for Power Consumption and Delay Optimization Based on Heterogeneous NoC Platform. Electronics 2019, 8, 912. [Google Scholar] [CrossRef]
- Sahu, P.K.; Shah, T.; Manna, K.; Chattopadhyay, S. Application Mapping Onto Mesh-Based Network-on-Chip Using Discrete Particle Swarm Optimization. IEEE Trans. Larg. Scale Integr. VLSI Syst. 2014, 22, 300–312. [Google Scholar] [CrossRef]
- Khalili, F.; Zarandi, H.R. A Fault-Tolerant Low-Energy Multi-Application Mapping onto NoC-Based Multiprocessors. In Proceedings of the 2012 IEEE 15th International Conference on Computational Science and Engineering, IEEE Computer Society, Nicosia, Cyprus, 5–7 December 2012. [Google Scholar]
- Bayar, S.; Yurdakul, A. An efficient mapping algorithm on 2-D mesh Network-on-Chip with reconfigurable switches. In Proceedings of the International Conference on Design Technology of Integrated Systems in Nanoscale Era, Istanbul, Turkey, 12–14 April 2016. [Google Scholar]
- Seidipiri, R.; Patooghy, A.; Afsharpour, S.; Fazeli, M. RASMAP: An efficient heuristic application mapping algorithm for network-on-chips. In Proceedings of the Eighth International Conference on Information Knowledge Technology, Hamedan, Iran, 7–8 September 2016. [Google Scholar]
- Sacanamboy, M.; Quesada, L.; Bolanos, F.; Bernal, A.; O’Sullivan, B. A Comparison between Two Optimisation Alternatives for Mapping in Wireless Network on Chip. In Proceedings of the IEEE International Conference on Tools with Artificial Intelligence, San Jose, CA, USA, 6–8 November 2016. [Google Scholar]
- Shekhar, M.; Ramaprasad, H.; Mueller, F. Network-on-Chip aware scheduling of hard-real-time tasks. In Proceedings of the 9th IEEE International Symposium on Industrial Embedded Systems (SIES 2014), Pisa, Italy, 18–20 June 2014; pp. 141–150. [Google Scholar] [CrossRef]
- Lin, H.; Zhang, D.; Huang, C. Research on low-power mapping for three-dimensional network-on-chip based on inproved genetic algorithm. Comput. Eng. Appl. 2016. [Google Scholar] [CrossRef]
- Yi, L.; Niu, Y.T.; Xu, C.Q. Configurable links for 3D network on-chip based on mapping algorithm. In Proceedings of the IEEE International Conference on Solid-state Integrated Circuit Technology, Hangzhou, China, 25–28 October 2016. [Google Scholar]
- Liu, L.; Wu, C.; Deng, C.; Yin, S.; Wu, Q.; Han, J.; Wei, S. A Flexible Energy-and Reliability-Aware Application Mapping for NoC-Based Reconfigurable Architectures. IEEE Trans. Larg. Scale Integr. Syst. 2015, 23, 2566–2580. [Google Scholar] [CrossRef]
© 2019 by the authors. Licensee MDPI, Basel, Switzerland. This article is an open access article distributed under the terms and conditions of the Creative Commons Attribution (CC BY) license (http://creativecommons.org/licenses/by/4.0/).