Fusion High-Resolution Network for Diagnosing ChestX-ray Images

 , ,
, , 
Abstract
1. Introduction
2. Method
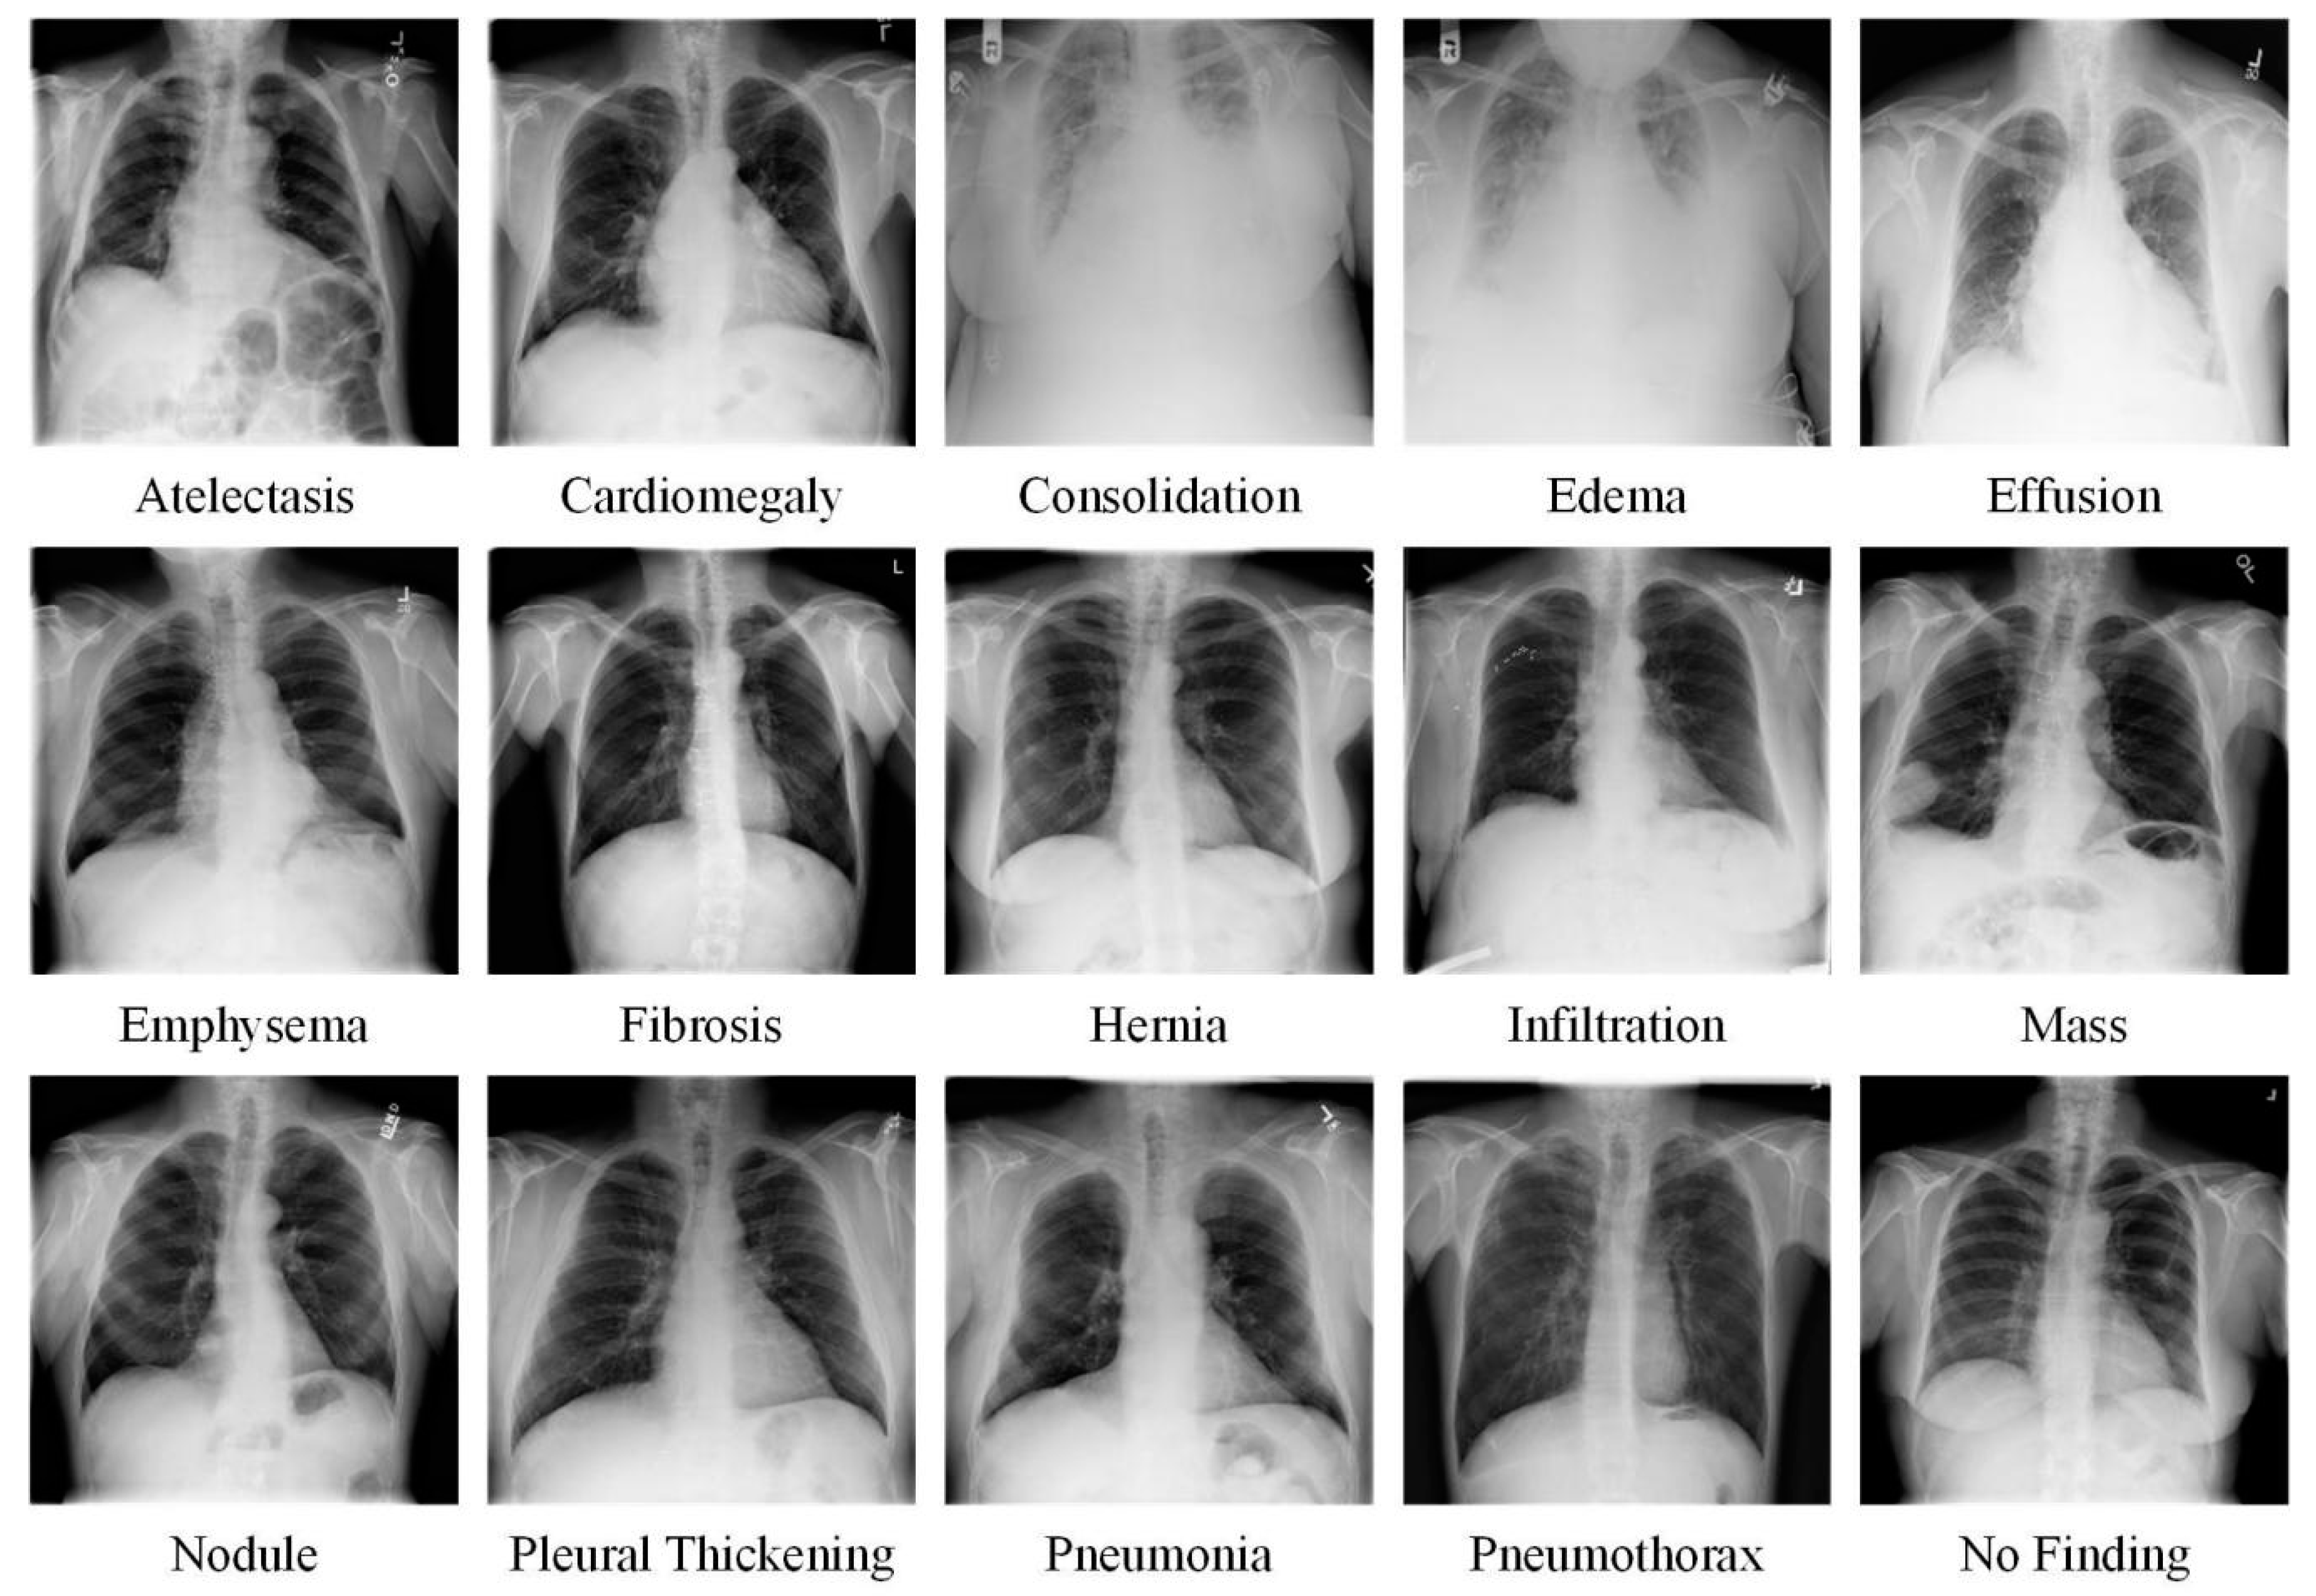
2.1. Dataset
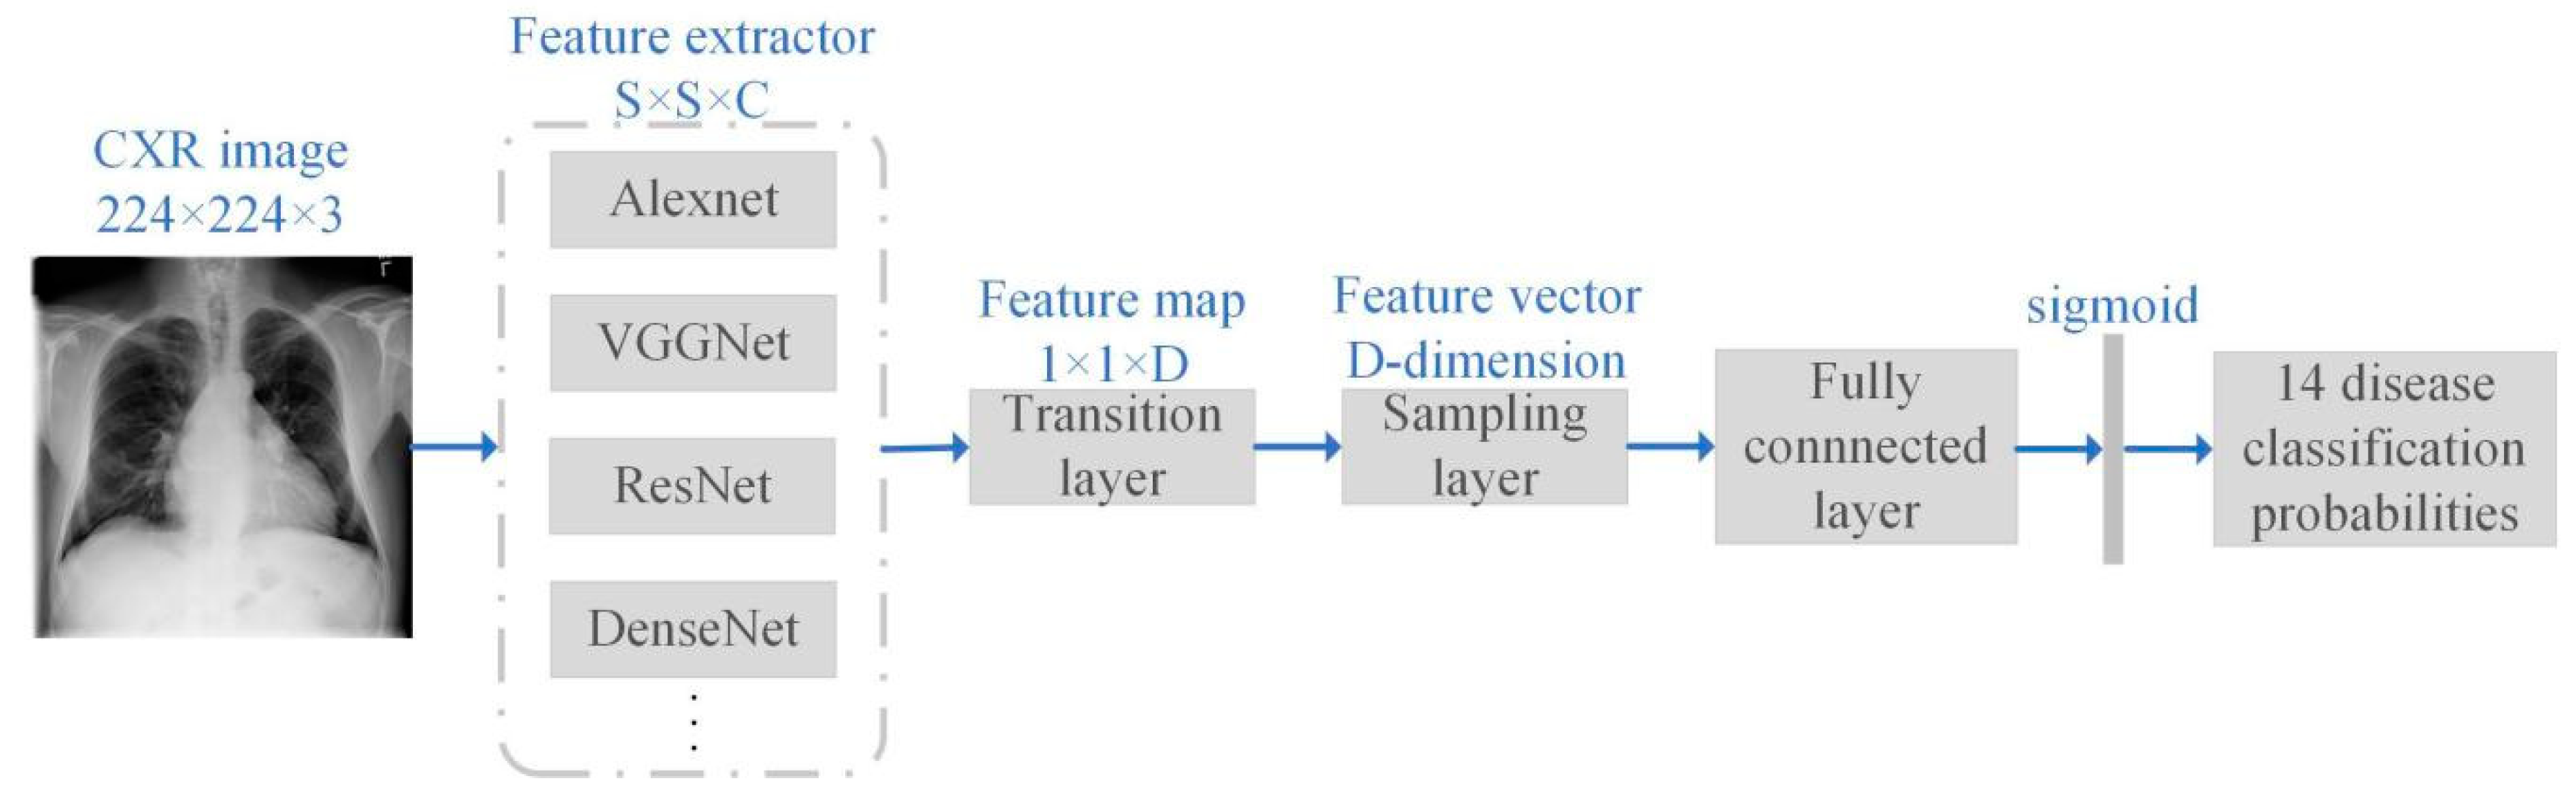
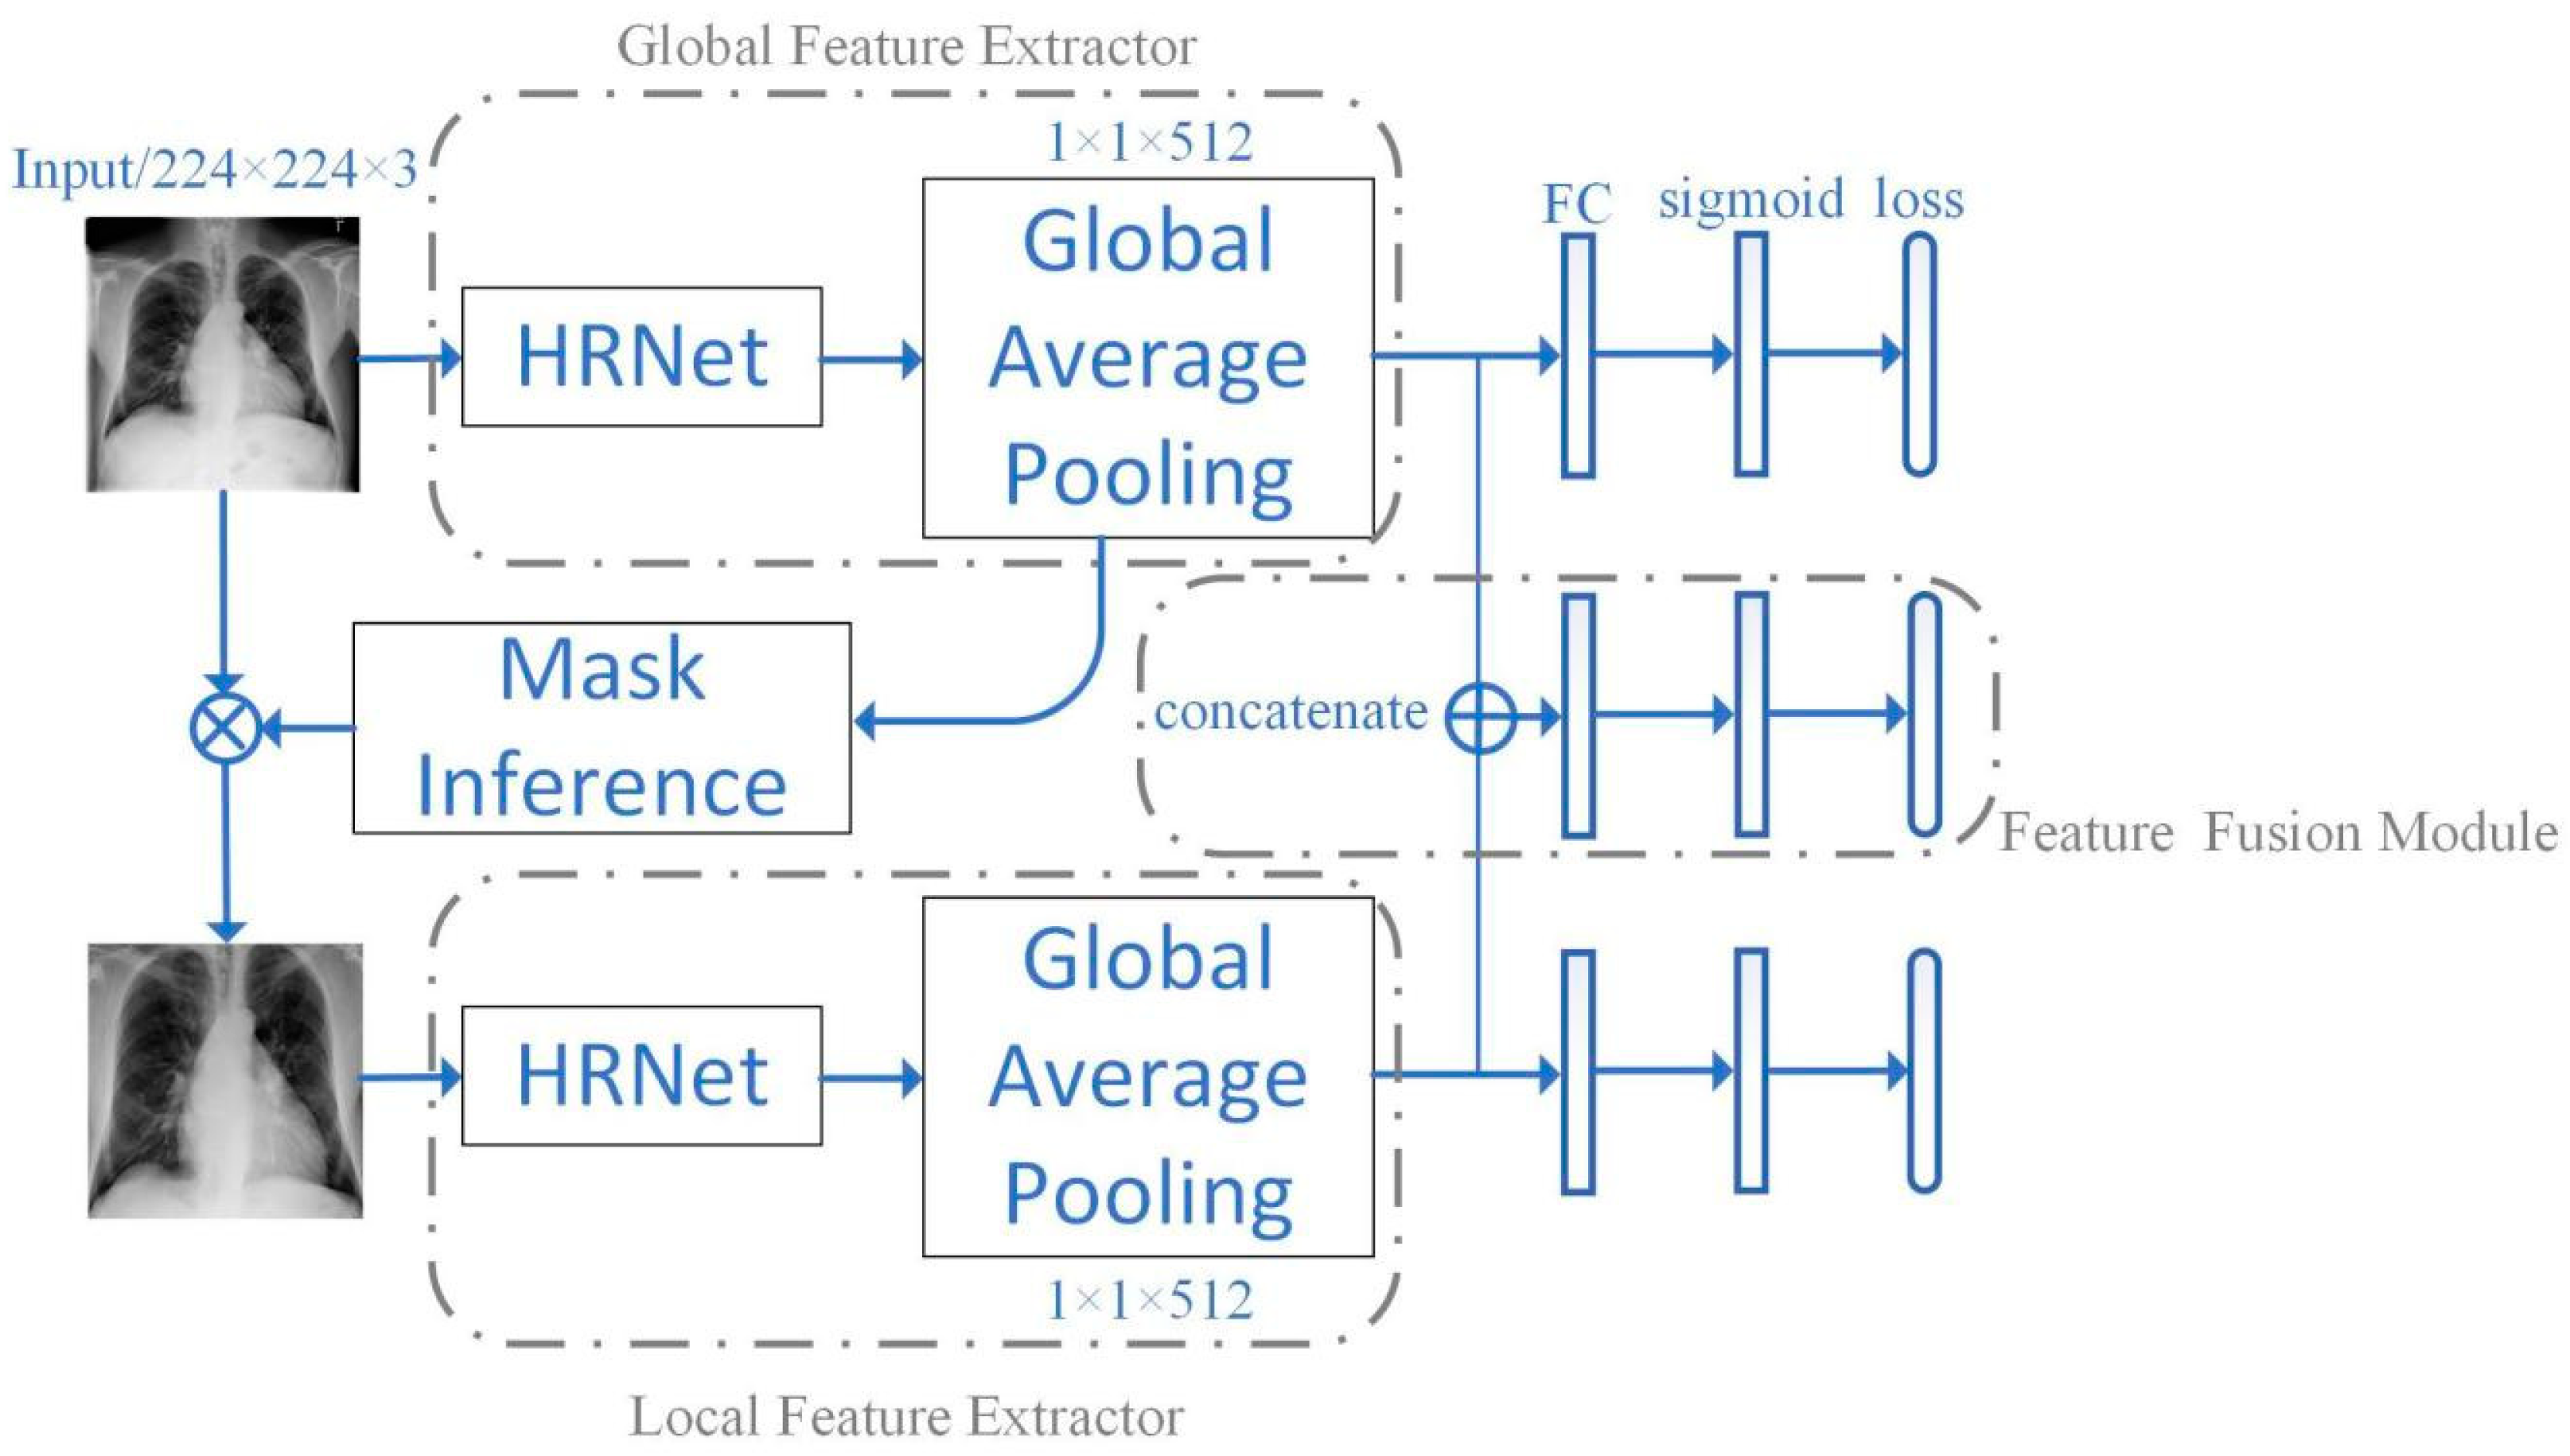
2.2. Network Framework
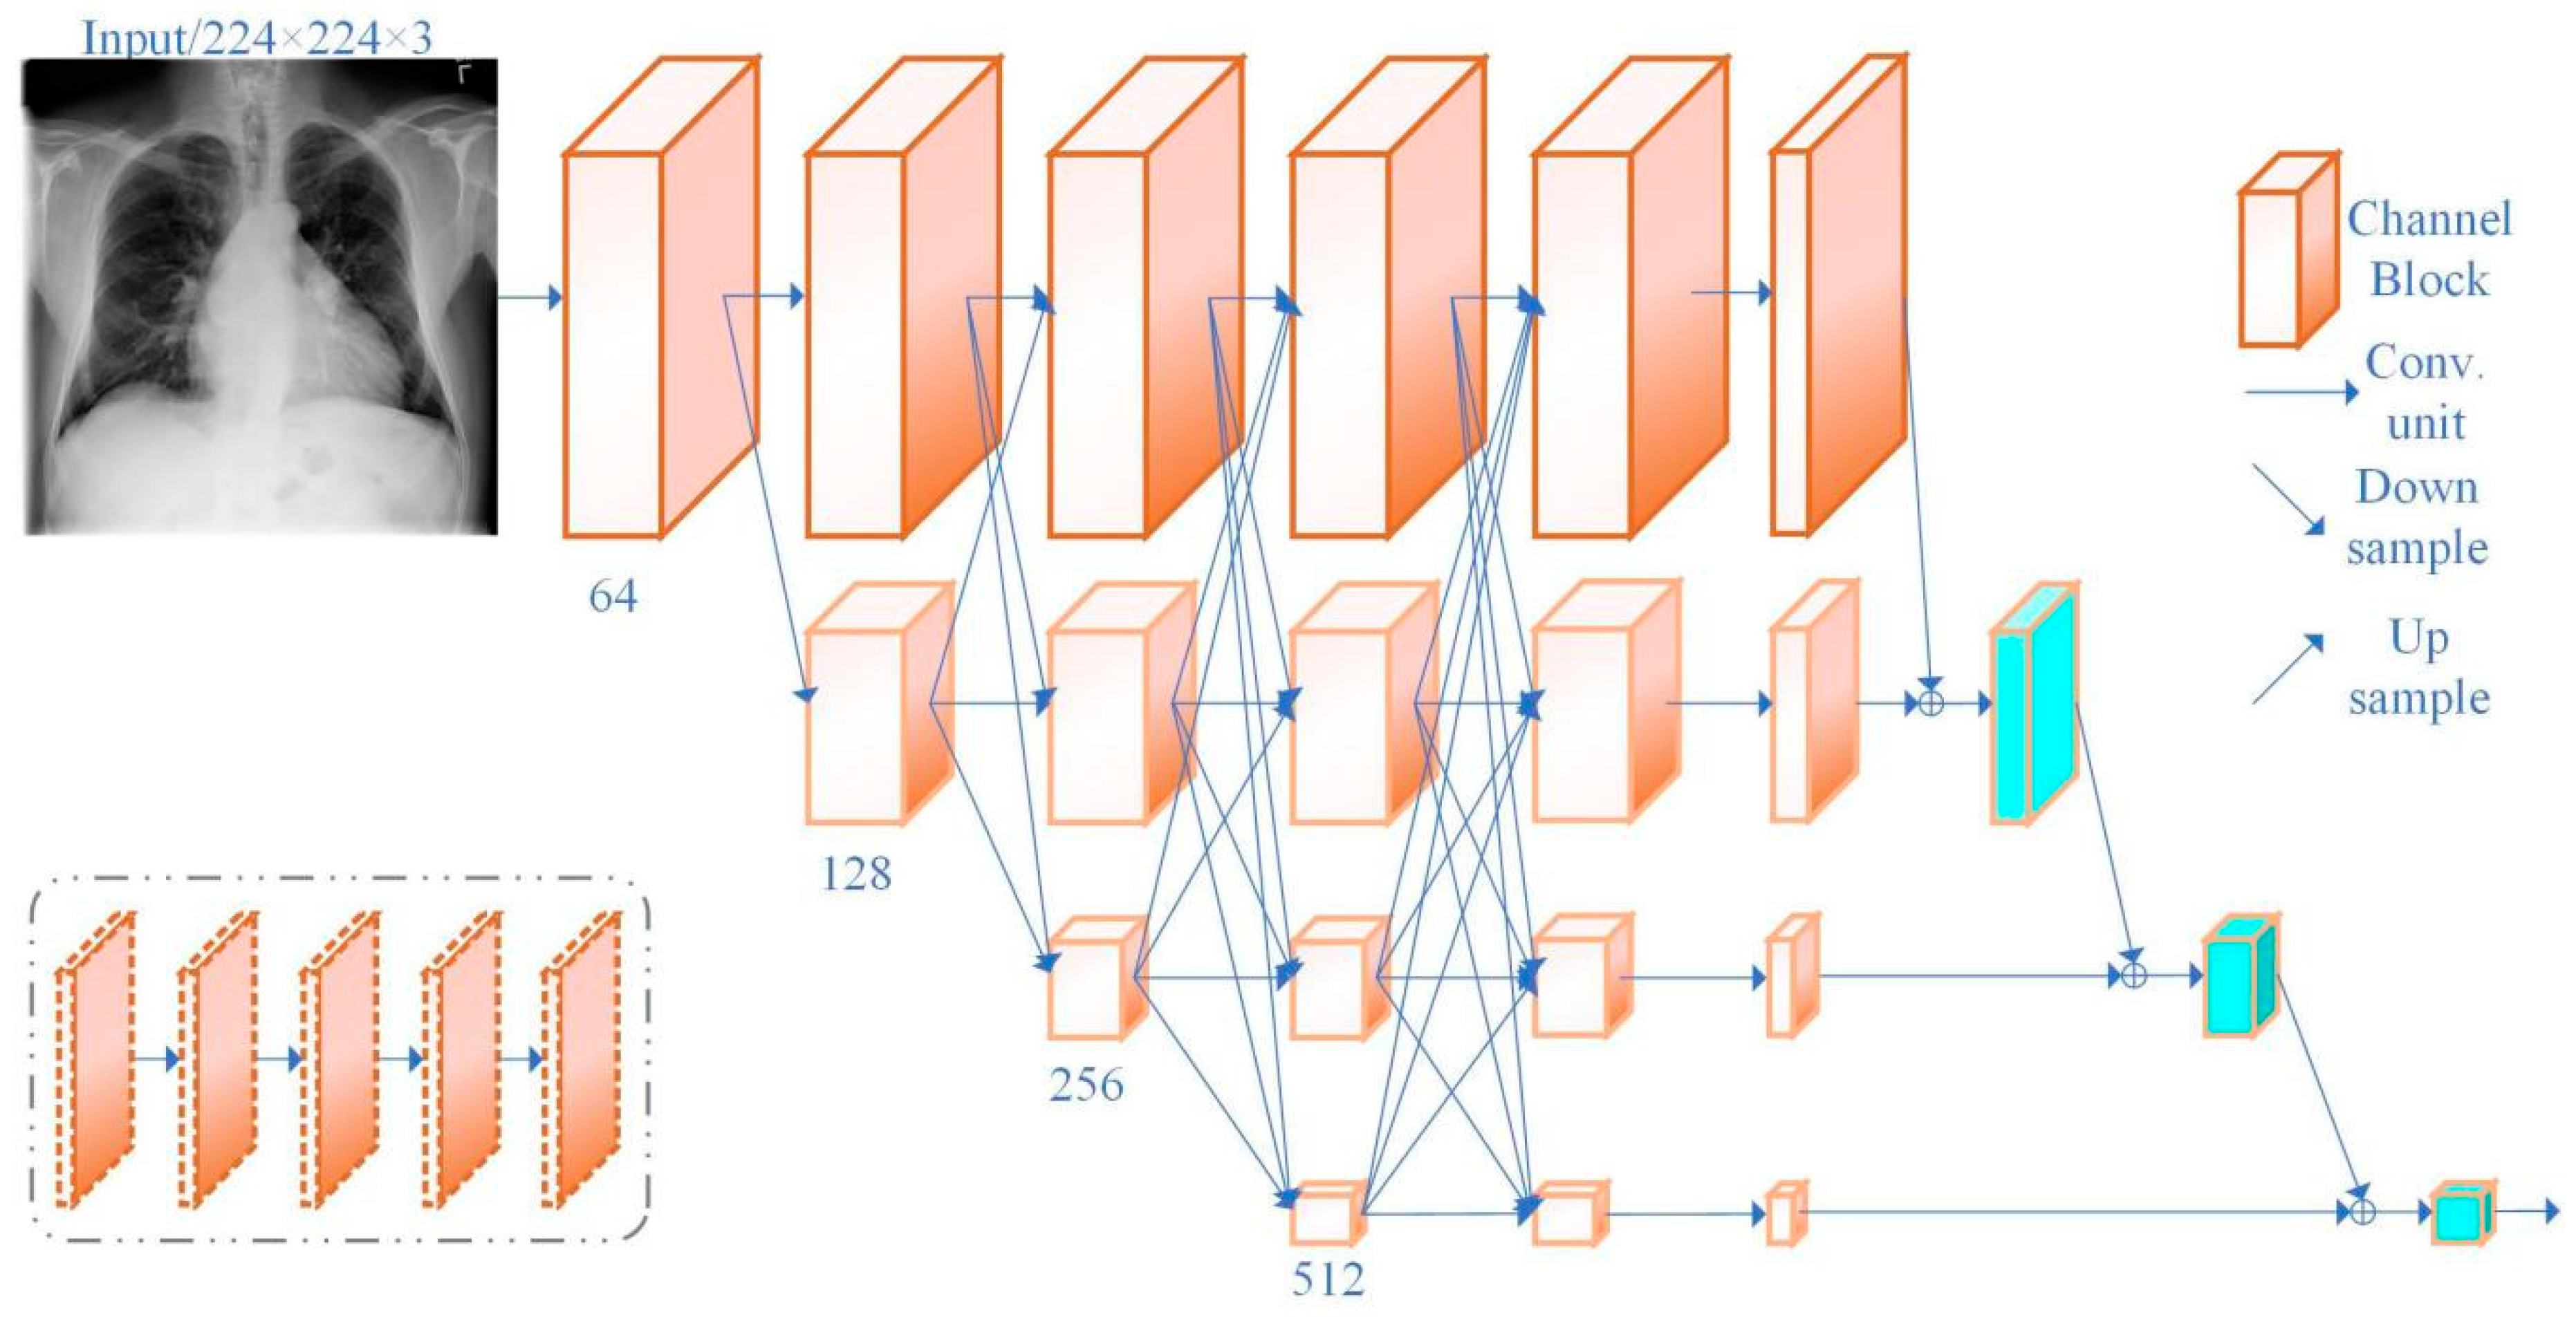
2.3. Network Structure
3. Experimental Setting
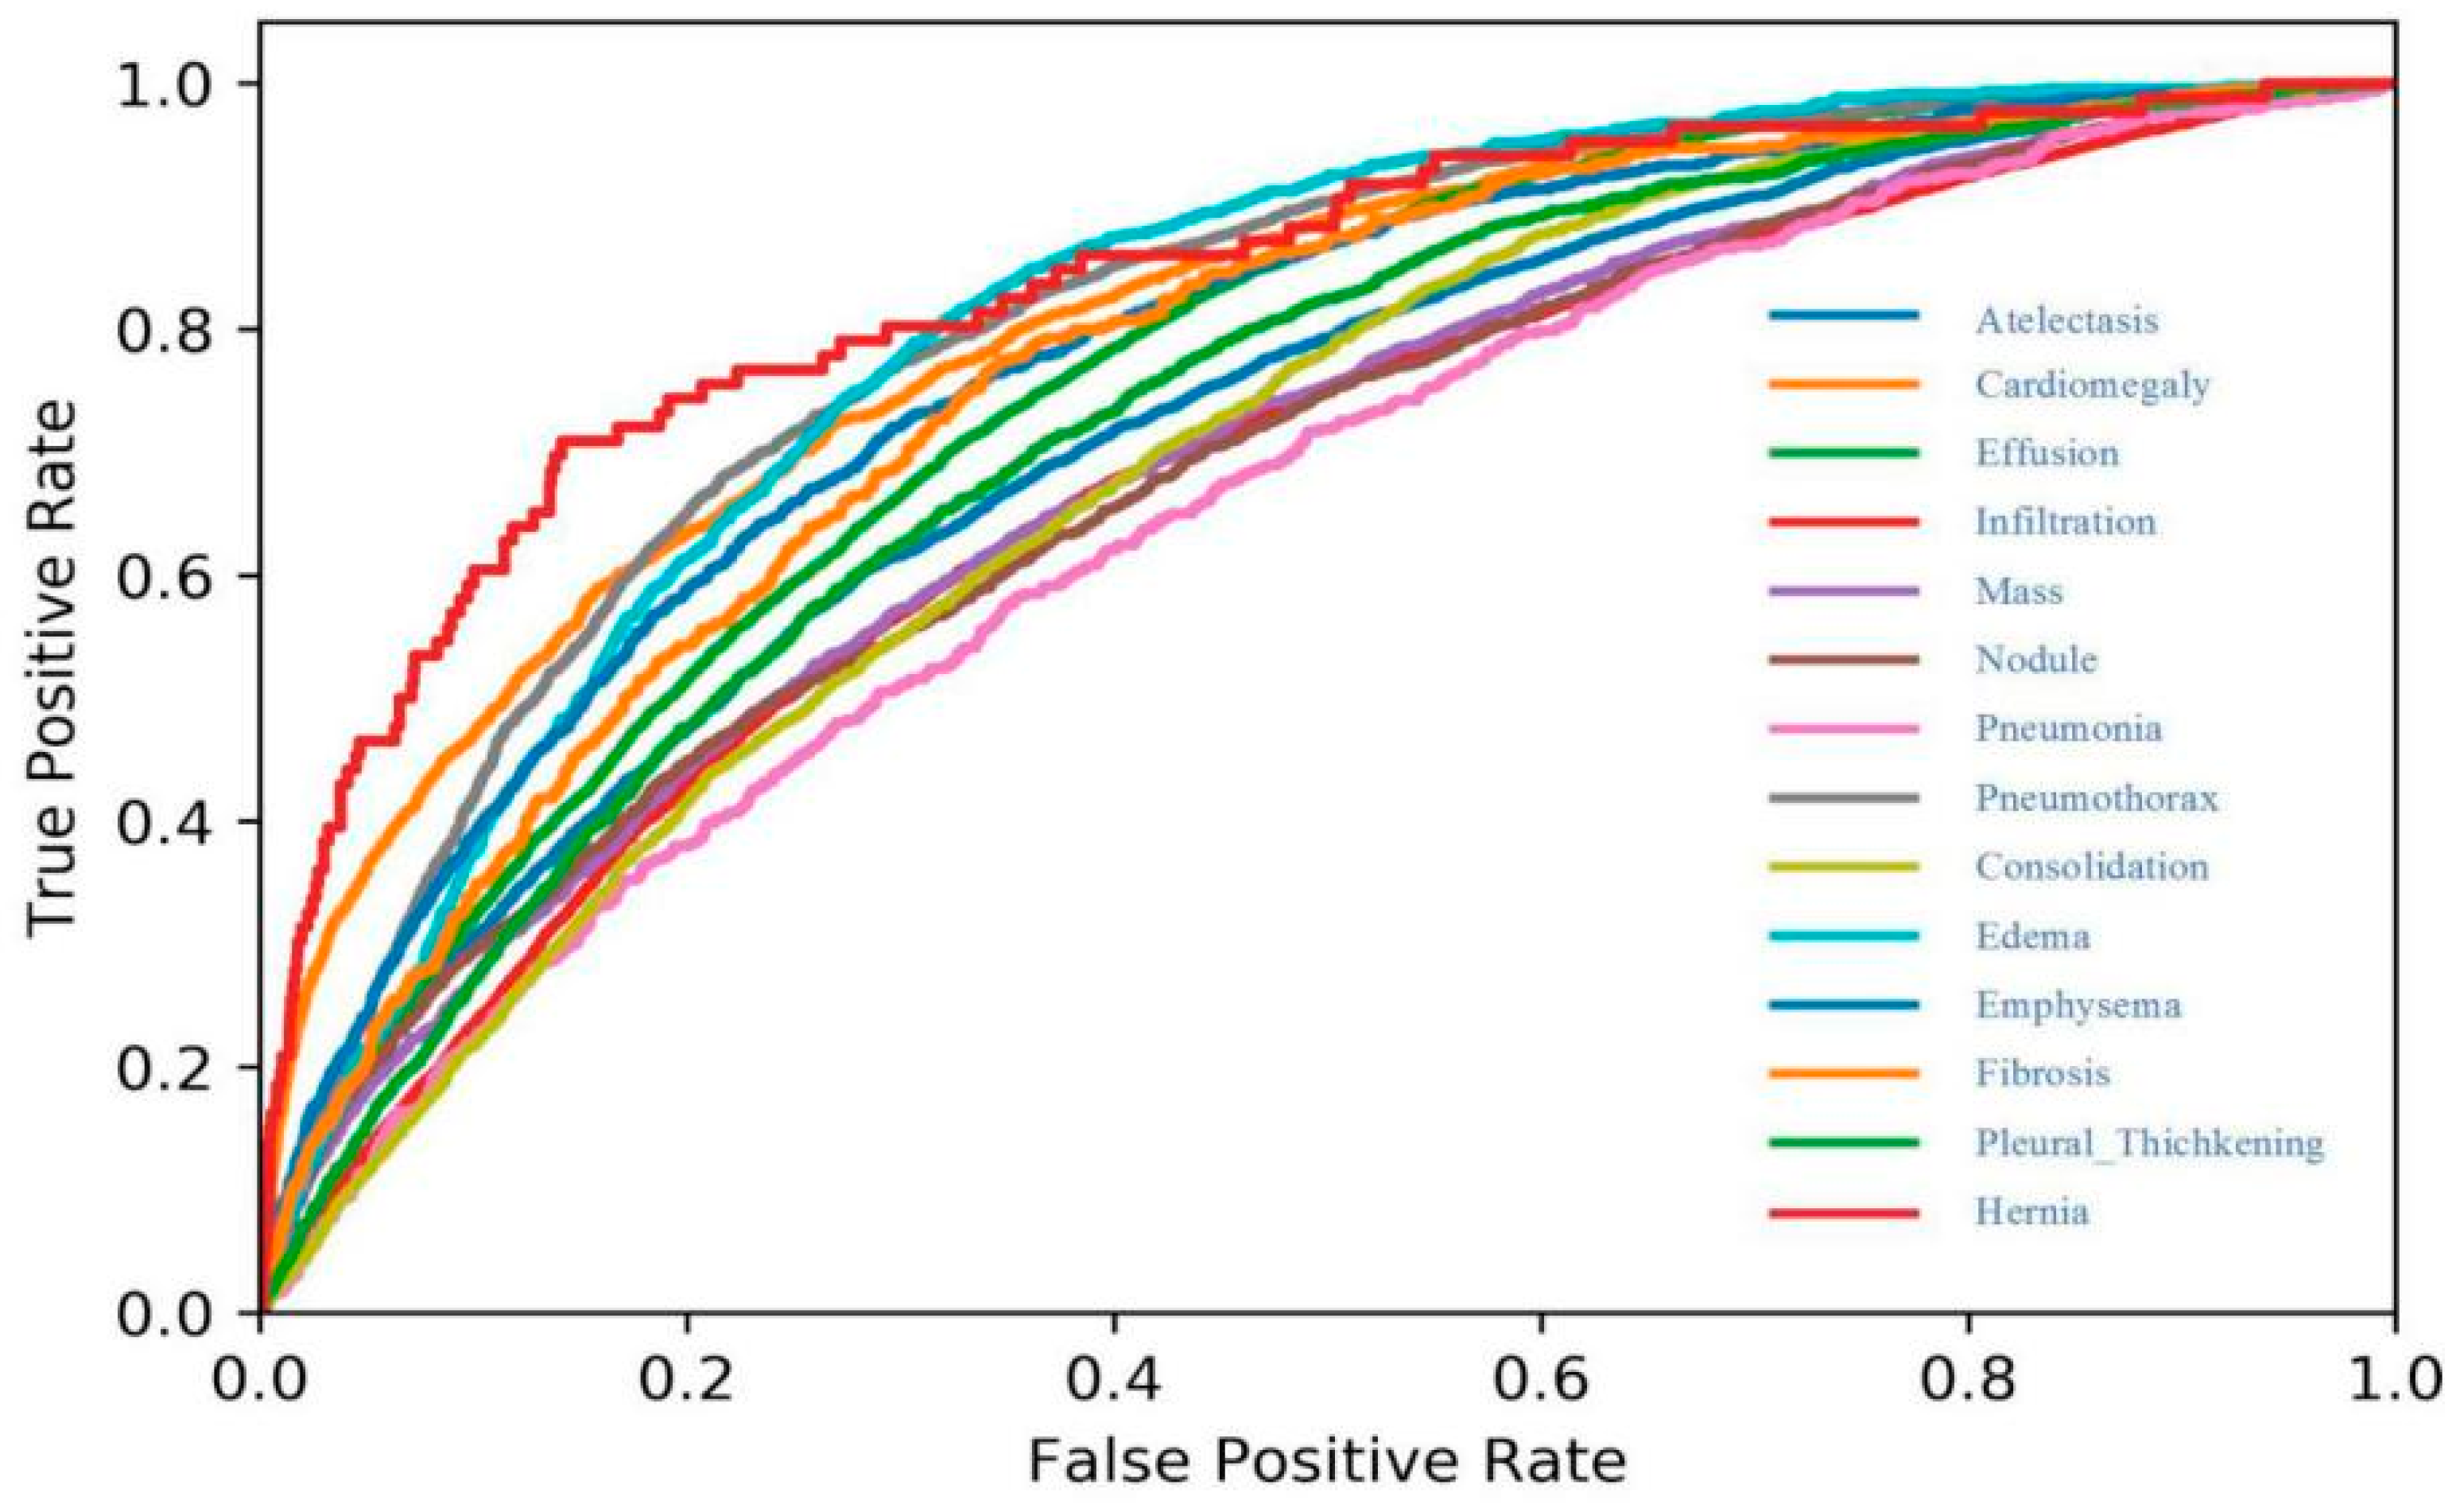
4. Results
5. Discussion
6. Conclusions
Author Contributions
Funding
Conflicts of Interest
Abbreviations
| FHRNet | Fusion High-Resolution Net |
| CXR | ChestX-ray |
| NLP | Natural Language Processing |
| CAD | Computer-Aided Diagnosis |
| CNN | Convolution Neural Network |
| NIH | National Institutes of Health |
| ROC | Receiver Operating Characteristic |
| AGCNN | Attention Guided Convolution Neural Network |
| AUC | Area Under Curve |
| LBP | Local Binary Pattern |
| HOG | Histogram of Oriented Gradients |
| SIFT | Scale-Invariant Feature Transform |
References
- Xu, S.J.; Wu, H.; Bie, R.F. CXNet-m1: Anomaly detection on chest X-rays with image-based deep learning. IEEE Access 2018, 7, 4466–4477. [Google Scholar] [CrossRef]
- Shen, D.G.; Wu, G.R.; Suk, H.I. Deep Learning in Medical Image Analysis. Annu. Rev. Biomed. Eng. 2017, 19, 221–248. [Google Scholar] [CrossRef] [PubMed]
- Lee, J.G.; Jun, S.; Cho, Y.W. Deep Learning in Medical Imaging: General Overview. Korean J. Radiol. 2017, 4, 570–584. [Google Scholar] [CrossRef]
- Qin, C.L.; Yao, D.M.; Shi, Y.H. Computer-aided detection in chest radiography based on artificial intelligence: A survey. Biomed. Eng. Online 2018, 17, 113. [Google Scholar] [CrossRef] [PubMed]
- Bertrand, H.; Hashir, M.; Cohen, J.P. Do Lateral Views Help Automated Chest X-ray Predictions. arXiv 2019, arXiv:1904.08534. [Google Scholar]
- Wang, H.Y.; Xia, Y. ChestNet: A Deep Neural Network for Classification of Thoracic Diseases on Chest 200 Radiography. arXiv 2018, arXiv:1807.03058. [Google Scholar]
- Chawla, A.; Lim, T.C.; Shikhare, S.N.; Munk, P.L.; Peh, W.C. Computer vision syndrome: Darkness under the shadow of light. Can. Assoc. Radiol. J. 2019, 70, 5–9. [Google Scholar] [CrossRef]
- Chen, J.X.; Mao, Z.J.; Zheng, R.; Huang, Y.F.; He, L.F. Feature selection of deep learning models for EEG-based RSVP target detection. IEICE Trans. Inf. Syst. 2019, 4, 836–844. [Google Scholar] [CrossRef]
- Yi, X.; Walia, E.; Babyn, P. Generative adversarial network in medical imaging: A review. Med. Image Anal. 2019, 58, 101552. [Google Scholar] [CrossRef]
- Xia, W.; Ma, C.H.; Liu, J.B.; Liu, S.B.; Chen, F. High-Resolution Remote Sensing Imagery Classification of Imbalanced Data Using Multistage Sampling Method and Deep Neural Networks. Remote Sens. 2019, 11, 2523. [Google Scholar] [CrossRef]
- Sun, T.Z.; Fang, W.D.; Chen, W.; Yao, Y.X.; Bi, F.M.; Wu, B.L. High-Resolution Image Inpainting Based on Multi-Scale Neural Network. Electronics 2019, 8, 1370. [Google Scholar] [CrossRef]
- Shen, Y.; Gao, M. Dynamic routing on deep neural network for thoracic disease classification and sensitive area localization. In International Workshop on Machine Learning in Medical Imaging; Springer International Publishing: Cham, Switzerland, 2018; pp. 389–397. [Google Scholar]
- Rajpurkar, P.; Irvin, J.; Zhu, K. Chexnet: Radiologist-level pneumonia detection on chest x-rays with deep learning. arXiv 2017, arXiv:1711.05225. [Google Scholar]
- Tang, Y.B.; Tang, Y.X.; Xiao, J. XLSor: A Robust and Accurate Lung Segmentor on Chest X-Rays Using Criss-Cross Attention and Customized Radiorealistic Abnormalities Generation. arXiv 2019, arXiv:1904.09229. [Google Scholar]
- Subramanian, V.; Wang, H.; Wu, J.T. Automated detection and type classification of central venous catheters 216 in chest X-rays. In Proceedings of the International Conference on Medical Image Computing and Computer-Assisted Intervention, Lima, Peru, 4–8 October 2019. [Google Scholar]
- Aviles-Rivero, A.I.; Papadakis, N.; Li, R.T. GraphXNet-Chest X-Ray Classification Under Extreme Minimal Supervision. arXiv 2019, arXiv:1907.10085. [Google Scholar]
- Gooßen, A.; Deshpande, H.; Harder, T. Deep Learning for Pneumothorax Detection and Localization in Chest Radiographs. arXiv 2019, arXiv:1907.07324. [Google Scholar]
- Shin, H.C.; Roberts, K.; Lu, L. Learning to read chest X-rays: Recurrent neural cascade model for automated image annotation. In Proceedings of the IEEE Conference on Computer Vision and Pattern Recognition, Las Vegas, NV, USA, 27–30 June 2016; pp. 2497–2506. [Google Scholar]
- Litjens, G.; Kooi, T.; Bejnordi, B.E. A survey on deep learning in medical image analysis. Med. Image Anal. 2017, 42, 60–88. [Google Scholar] [CrossRef]
- Tajbakhsh, N.; Shin, J.Y.; Gurudu, S.R. Convolutional neural networks for medical image analysis: Full training or fine tuning. IEEE Trans. Med. Imaging 2016, 35, 1299–1312. [Google Scholar] [CrossRef]
- Tan, Z.; Yue, P.; Di, L.; Tang, J. Deriving High Spatiotemporal Remote Sensing Images Using Deep Convolutional Network. Remote Sens. 2018, 10, 1066. [Google Scholar] [CrossRef]
- Livieris, I.E.; Kanavos, A.; Tampakas, V.; Pintelas, P. An Ensemble SSL Algorithm for Efficient Chest X-Ray Image Classification. J. Imaging 2018, 4, 95. [Google Scholar] [CrossRef]
- Heo, S.J.; Kim, Y.; Yun, S.; Lim, S.S.; Kim, J.; Nam, C.M.; Park, E.C.; Jung, I.; Yoon, J.H. Deep Learning Algorithms with Demographic Information Help to Detect Tuberculosis in Chest Radiographs in Annual Workers’ Health Examination Data. Int. J. Environ. Res. Public Health 2019, 16, 250. [Google Scholar] [CrossRef]
- Jing, L.L.; Tian, Y. Self-supervised visual feature learning with deep neural networks: A survey. arXiv 2019, arXiv:1902.06162. [Google Scholar]
- Wang, X.; Peng, Y.; Lu, L.; Lu, Z.; Bagheri, M. Chestx-ray8: Hospital-scale chest x-ray database and benchmarks on weakly-supervised classification and localization of common thorax diseases. In Proceedings of the IEEE Conference on Computer Vision and Pattern Recognition, Honolulu, HI, USA, 21–26 July 2017; pp. 3462–3471. [Google Scholar]
- Liu, H.; Wang, L.; Nan, Y.; Jin, F.; Wang, Q. SDFN: Segmentation-based Deep Fusion Network for Thoracic Disease Classification in Chest X-ray Images. Comput. Med. Imaging Graph. 2019, 75, 66–73. [Google Scholar] [CrossRef] [PubMed]
- Rajpurkar, P.; Irvin, J.; Ball, R.L.; Zhu, K.; Yang, B. Deep learning for chest radiograph diagnosis: A retrospective comparison of the CheXNeXt algorithm to practicing radiologists. PLoS Med. 2018, 15, e1002686. [Google Scholar] [CrossRef] [PubMed]
- Zhou, B.; Li, Y.; Wang, J. A weakly supervised adaptive densenet for classifying thoracic diseases and identifying abnormalities. arXiv 2018, arXiv:1807.01257. [Google Scholar]
- Kumar, P.; Grewal, M.; Srivastava, M.M. Boosted cascaded convnets for multilabel classification of thoracic diseases in chest radiographs. In Proceedings of the International Conference Image Analysis and Recognition, Montreal, QC, Canada, 27–29 June 2018; Springer International Publishing: Cham, Switzerland, 2018; pp. 546–552. [Google Scholar]
- Kovalev, V.; Kazlouski, S. Examining the Capability of GANs to Replace Real Biomedical Images in Classification Models Training. arXiv 2019, arXiv:1904.08688. [Google Scholar]
- Burwinkel, H.; Kazi, A.; Vivar, G. Adaptive image-feature learning for disease classification using inductive graph networks. arXiv 2019, arXiv:1905.03036. [Google Scholar]
- Guendel, S.; Ghesu, F.C.; Grbic, S. Multi-task Learning for Chest X-ray Abnormality Classification on Noisy Labels. arXiv 2019, arXiv:1905.06362. [Google Scholar]
- Tang, Y.X.; Wang, X.S.; Harrison, A.P.; Lu, L.; Xiao, J. Attention-guided curriculum learning for weakly supervised classification and localization of thoracic diseases on chest radiographs. In Proceedings of the International Workshop on Machine Learning in Medical Imaging, Granada, Spain, 10 September 2018; Springer International Publishing: Cham, Switzerland, 2018; pp. 249–258. [Google Scholar]
- Mao, C.; Yao, L.; Pan, Y.; Luo, Y.; Zeng, Z. Deep Generative Classifiers for Thoracic Disease Diagnosis with Chest X-ray Images. In Proceedings of the 2018 IEEE International Conference on Bioinformatics and Biomedicine, Madrid, Spain, 3–6 December 2018; pp. 1209–1214. [Google Scholar]
- Guan, Q.; Huang, Y.; Zhong, Z.; Zheng, Z.; Zheng, L.; Yang, Y. Diagnose like a radiologist: Attention guided convolutional neural network for thorax disease classification. arXiv 2018, arXiv:1801.09927. [Google Scholar]
- Zhu, Q.; Zhong, Y.; Liu, Y.; Zhang, L.; Li, D. A Deep-Local-Global Feature Fusion Framework for High Spatial Resolution Imagery Scene Classification. Remote Sens. 2018, 10, 568. [Google Scholar]
- Lin, C.J.; Lin, C.H.; Sun, C.C.; Wang, S.H. Evolutionary-Fuzzy-Integral-Based Convolutional Neural Networks for Facial Image Classification. Electronics 2019, 8, 997. [Google Scholar] [CrossRef]
- Krizhevsky, A.; Sutskever, I.; Hinton, G.E. ImageNet classification with deep convolutional neural networks. In Proceedings of the Advances in Neural Information Processing Systems 25 (NIPS 2012), Lake Tahoe, NV, USA, 3–6 December 2012; pp. 1097–1105. [Google Scholar]
- He, K.; Zhang, X.; Ren, S.; Sun, J. Deep residual learning for image recognition. In Proceedings of the IEEE Conference on Computer Vision and Pattern Recognition, Las Vegas, NV, USA, 27–30 June 2016; pp. 770–778. [Google Scholar]
- Simonyan, K.; Zisserman, A. Very deep convolutional networks for large-scale image recognition. arXiv 2014, arXiv:1409.1556. [Google Scholar]
- Huang, G.; Liu, Z.; Van Der Maaten, L.; Weinberger, K.Q. Densely connected convolutional networks. In Proceedings of the IEEE Conference on Computer Vision and Pattern Recognition, Honolulu, HI, USA, 21–26 July 2017; pp. 4700–4708. [Google Scholar]
- Sun, K.; Xiao, B.; Liu, D.; Wang, J.D. Deep High-Resolution Representation Learning for Human Pose Estimation. In Proceedings of the IEEE Conference on Computer Vision and Pattern Recognition, Long Beach, CA, USA, 16–20 June 2019. [Google Scholar]
- Behzadi-khormouji, H.; Rostami, H.; Salehi, S. Deep learning, reusable and problem-based architectures for detection of consolidation on chest X-ray images. Comput. Methods Programs Biomed. 2020, 185, 105162. [Google Scholar] [CrossRef] [PubMed]
- Yang, H.; Xu, X.Y.; Kargoll, B.; Neumann, I. An automatic and intelligent optimal surface modeling method for composite tunnel structures. Compos. Struct. 2019, 208, 702–710. [Google Scholar] [CrossRef]
- Yang, H.; Xu, X.Y. Multi-sensor technology for B-spline modelling and deformation analysis of composite structures. Compos. Struct. 2019, 224, 111000. [Google Scholar] [CrossRef]
- Xu, X.Y.; Yang, H. Intelligent crack extraction and analysis for tunnel structures with terrestrial laser scanning measurement. Adv. Mech. Eng. 2019, 11, 1687814019872650. [Google Scholar] [CrossRef]
- Xu, X.Y.; Augello, R.; Yang, H. The generation and validation of a CUF-based FEA model with laser-based experiments. Mech. Adv. Mater. Struct. 2019, 1–8. [Google Scholar] [CrossRef]
- Spinks, G.; Moens, M.F. Justifying diagnosis decisions by deep neural networks. J. Biomed. Inform. 2019, 96, 103248. [Google Scholar] [CrossRef]
- Yao, L.; Poblenz, E.; Dagunts, D.; Covington, B.; Bernard, D.; Lyman, K. Learning to diagnose from scratch by exploiting dependencies among labels. arXiv 2017, arXiv:1710.10501. [Google Scholar]
- Gündel, S.; Grbic, S.; Georgescu, B.; Liu, S.; Maier, A.; Comaniciu, D. Learning to recognize abnormalities in chest x-rays with location-aware dense networks. In Proceedings of the Iberoamerican Congress on Pattern Recognition, Madrid, Spain, 7–10 November 2018; Springer International Publishing: Cham, Switzerland, 2018; pp. 757–765. [Google Scholar]
- Gohagan, J.K.; Prorok, P.C.; Hayes, R.B.; Kramer, B.S. Prostate, Lung, Colorectal and Ovarian (PLCO) cancer screening trial of the National Cancer Institute: History, organization, and status. Control. Clin. Trials 2000, 6, 251–272. [Google Scholar] [CrossRef]


| Thorax Disease | Wang [25] | Yao [49] | Gundel [50] | FHRNet |
|---|---|---|---|---|
| Atelectasis | 0.7003 | 0.733 | 0.767 | 0.794 |
| Cardiomegaly | 0.8100 | 0.856 | 0.883 | 0.902 |
| Effusion | 0.7585 | 0.806 | 0.828 | 0.839 |
| Infiltration | 0.6614 | 0.673 | 0.709 | 0.714 |
| Mass | 0.6933 | 0.718 | 0.821 | 0.827 |
| Nodule | 0.6687 | 0.777 | 0.758 | 0.727 |
| Pneumonia | 0.6580 | 0.684 | 0.731 | 0.703 |
| Pneumothorax | 0.7993 | 0.805 | 0.846 | 0.848 |
| Consolidation | 0.7032 | 0.711 | 0.745 | 0.773 |
| Edema | 0.8052 | 0.806 | 0.835 | 0.834 |
| Emphysema | 0.8330 | 0.842 | 0.895 | 0.911 |
| Fibrosis | 0.7859 | 0.743 | 0.818 | 0.824 |
| Pleural Thickening | 0.6835 | 0.724 | 0.761 | 0.752 |
| Hernia | 0.8717 | 0.775 | 0.896 | 0.916 |
| Average | 0.7451 | 0.761 | 0.807 | 0.812 |
| Thorax Disease | Global Fusion | Local Fusion | FHRNet |
|---|---|---|---|
| Atelectasis | 0.778 | 0.783 | 0.794 |
| Cardiomegaly | 0.879 | 0.894 | 0.902 |
| Effusion | 0.822 | 0.828 | 0.839 |
| Infiltration | 0.703 | 0.697 | 0.714 |
| Mass | 0.804 | 0.816 | 0.827 |
| Nodule | 0.708 | 0.721 | 0.727 |
| Pneumonia | 0.684 | 0.692 | 0.703 |
| Pneumothorax | 0.836 | 0.844 | 0.848 |
| Consolidation | 0.758 | 0.764 | 0.773 |
| Edema | 0.827 | 0.821 | 0.834 |
| Emphysema | 0.897 | 0.903 | 0.911 |
| Fibrosis | 0.815 | 0.813 | 0.824 |
| Pleural Thickening | 0.735 | 0.453 | 0.752 |
| Hernia | 0.904 | 0.908 | 0.916 |
| Average | 0.803 | 0.806 | 0.812 |
© 2020 by the authors. Licensee MDPI, Basel, Switzerland. This article is an open access article distributed under the terms and conditions of the Creative Commons Attribution (CC BY) license (http://creativecommons.org/licenses/by/4.0/).
Share and Cite
Huang, Z.; Lin, J.; Xu, L.; Wang, H.; Bai, T.; Pang, Y.; Meen, T.-H. Fusion High-Resolution Network for Diagnosing ChestX-ray Images. Electronics 2020, 9, 190. https://doi.org/10.3390/electronics9010190
Huang Z, Lin J, Xu L, Wang H, Bai T, Pang Y, Meen T-H. Fusion High-Resolution Network for Diagnosing ChestX-ray Images. Electronics. 2020; 9(1):190. https://doi.org/10.3390/electronics9010190
Chicago/Turabian StyleHuang, Zhiwei, Jinzhao Lin, Liming Xu, Huiqian Wang, Tong Bai, Yu Pang, and Teen-Hang Meen. 2020. "Fusion High-Resolution Network for Diagnosing ChestX-ray Images" Electronics 9, no. 1: 190. https://doi.org/10.3390/electronics9010190
APA StyleHuang, Z., Lin, J., Xu, L., Wang, H., Bai, T., Pang, Y., & Meen, T.-H. (2020). Fusion High-Resolution Network for Diagnosing ChestX-ray Images. Electronics, 9(1), 190. https://doi.org/10.3390/electronics9010190