A Novel Intrusion Detection Model Using a Fusion of Network and Device States for Communication-Based Train Control Systems


Abstract
1. Introduction
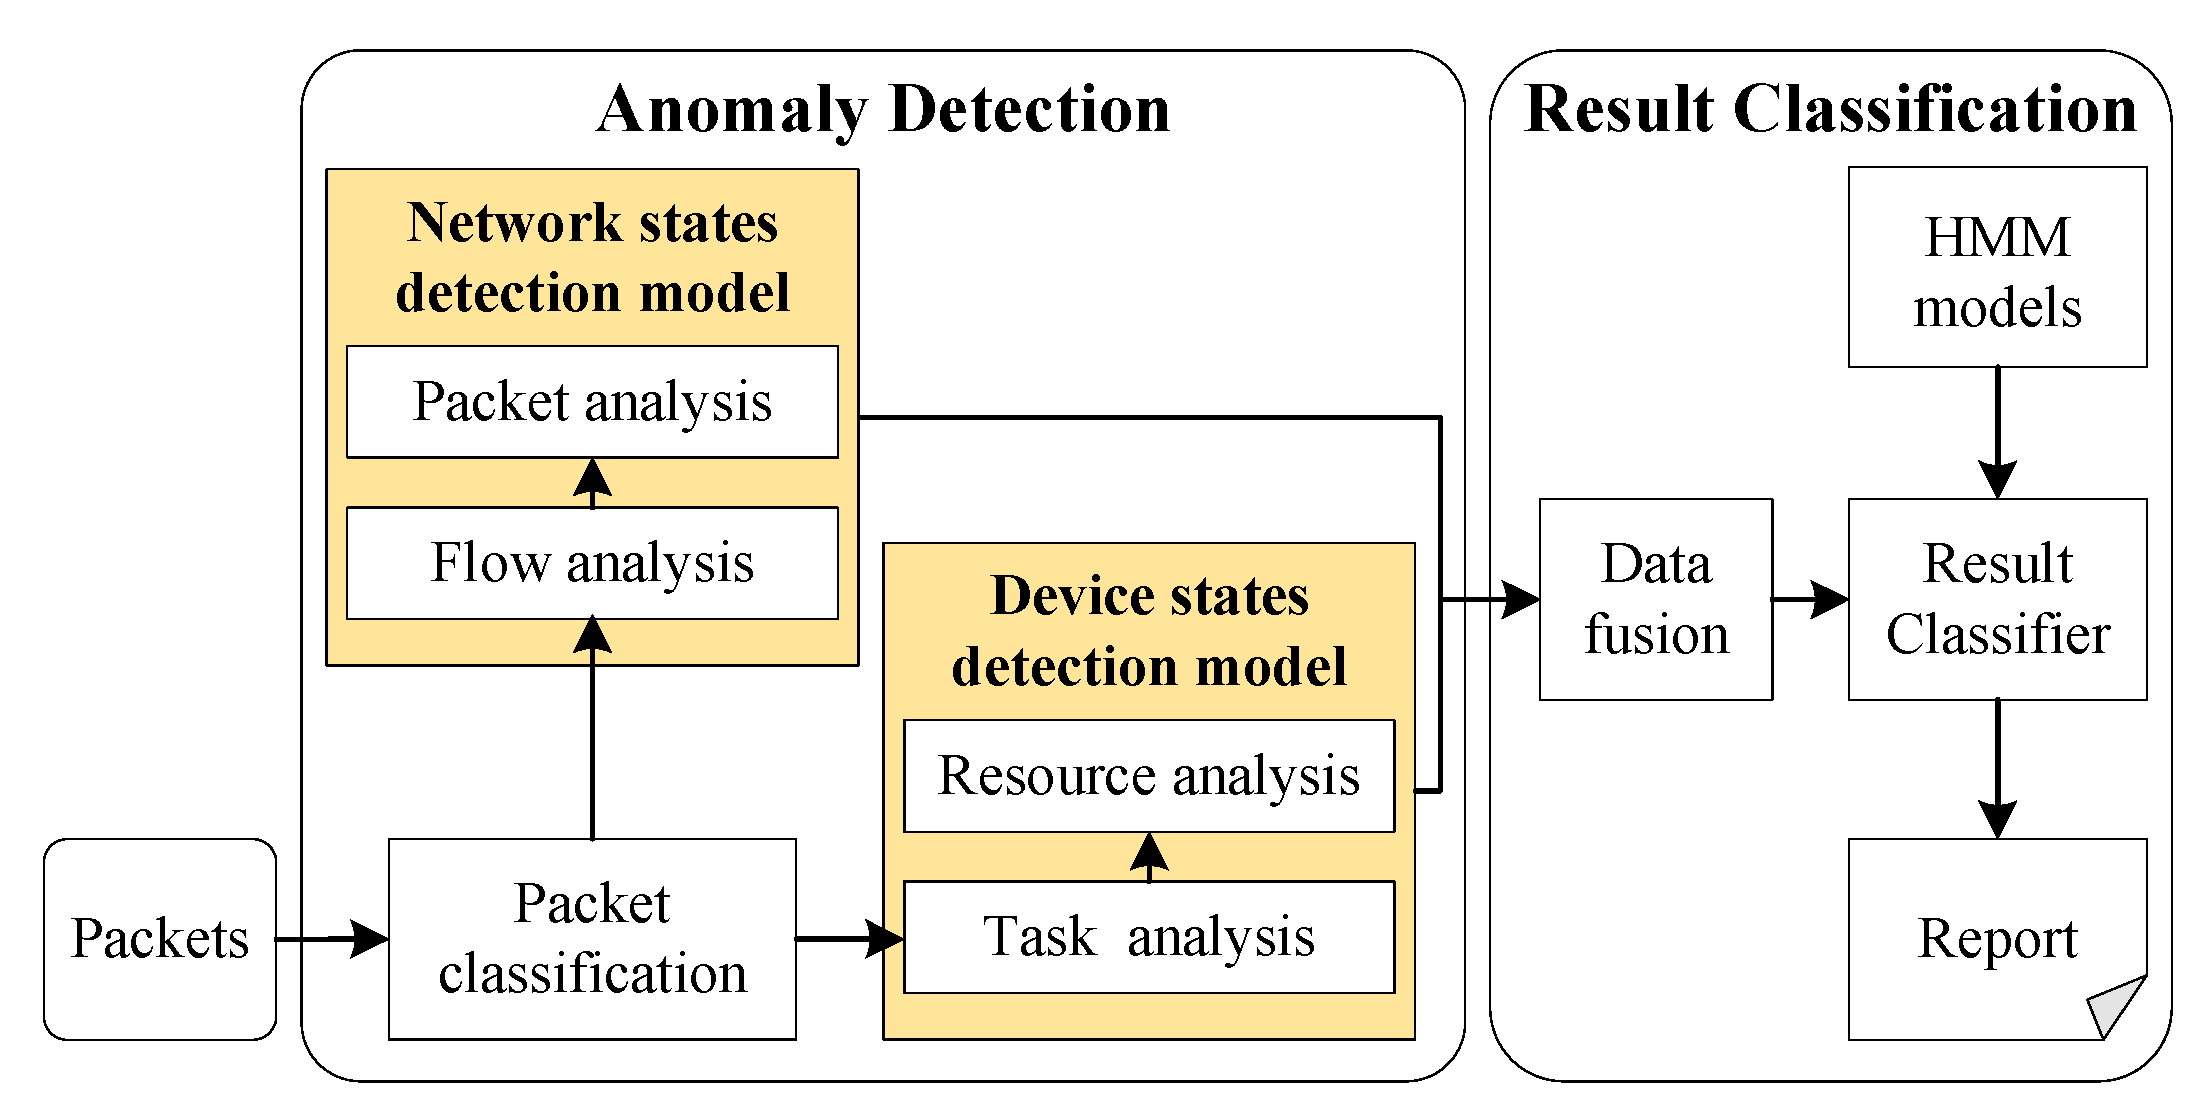
- Unlike the traditional IDS, which focus on the anomaly analysis of packets, the throughput of the network and the characteristics of the data packets in the CBTC systems are jointly considered in the detection model based on the status of networks.
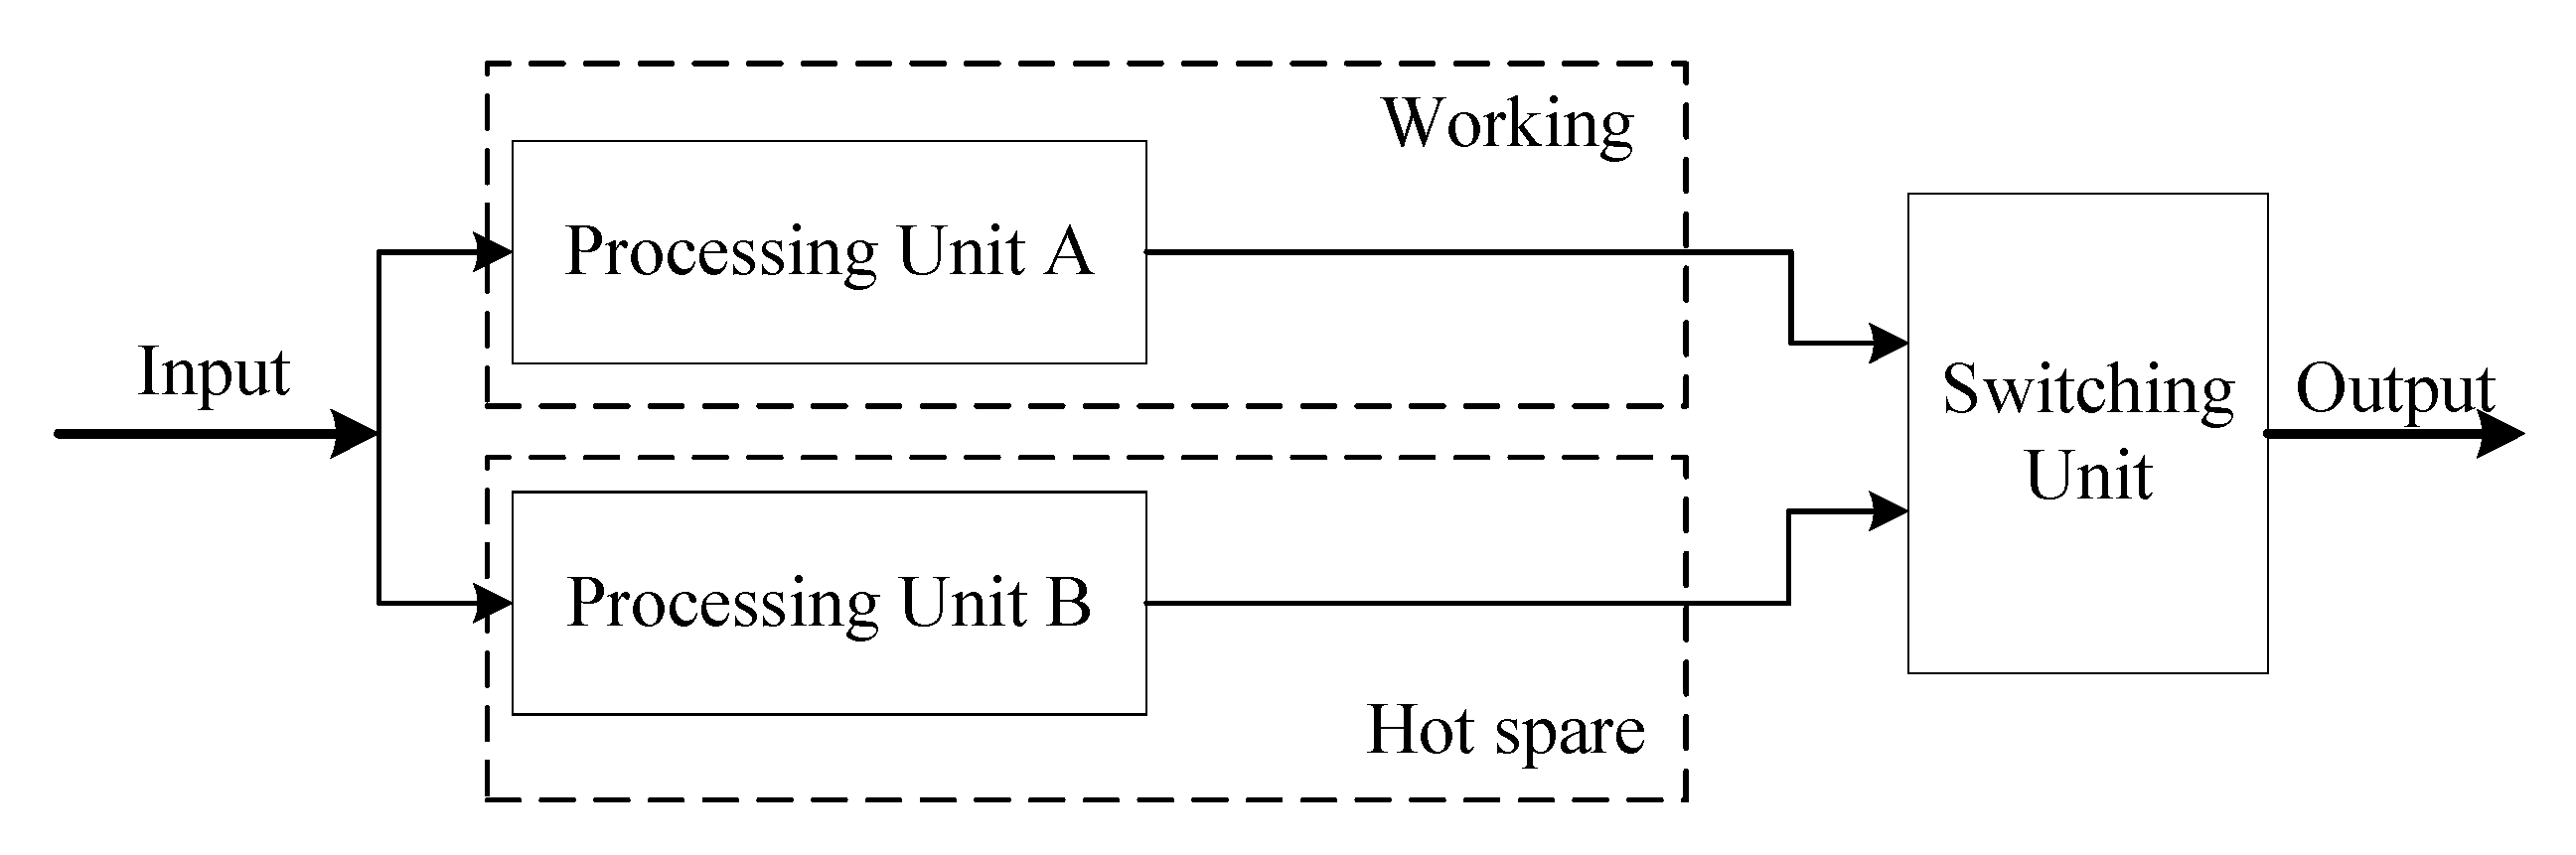
- A detection model based on the status of devices is adopted to take the fault-safe principle of CBTC systems into consideration.
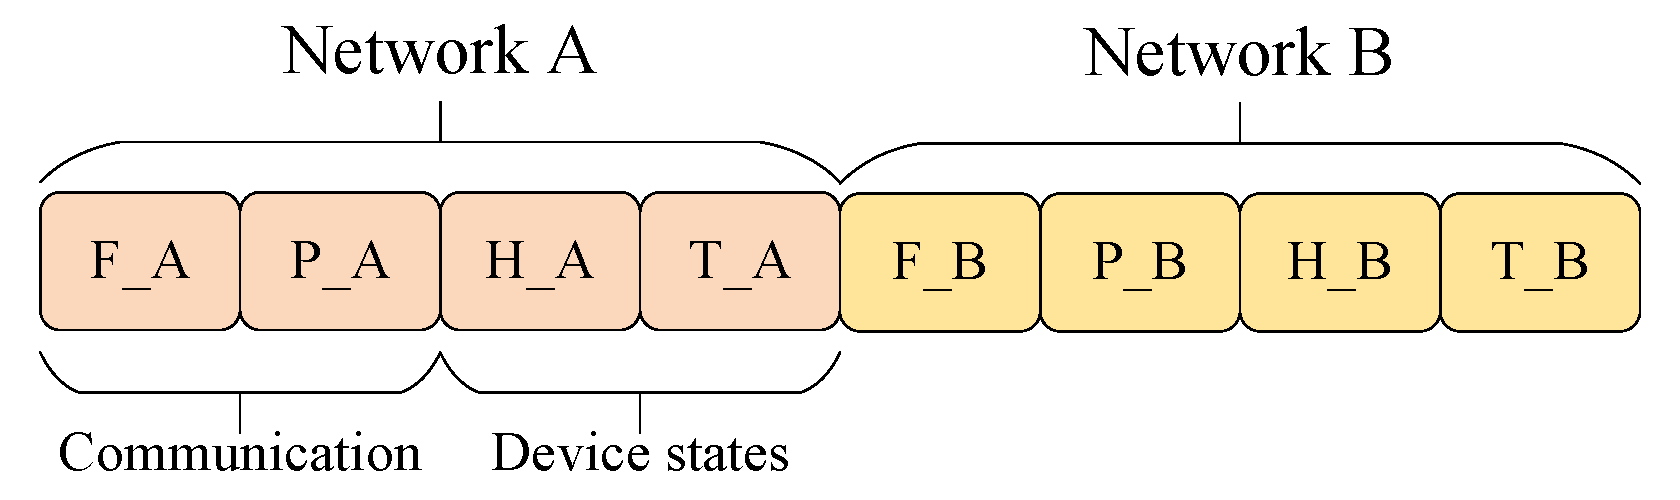
- A HMM classifier is designed that synthesizes the anomalies detected by different models. Experimental results show that the proposed IDS can differentiate cyber-attacks from random system faults.
2. Related Works
3. CBTC Systems and Cyber-Attacks
3.1. An Introduction of CBTC Systems
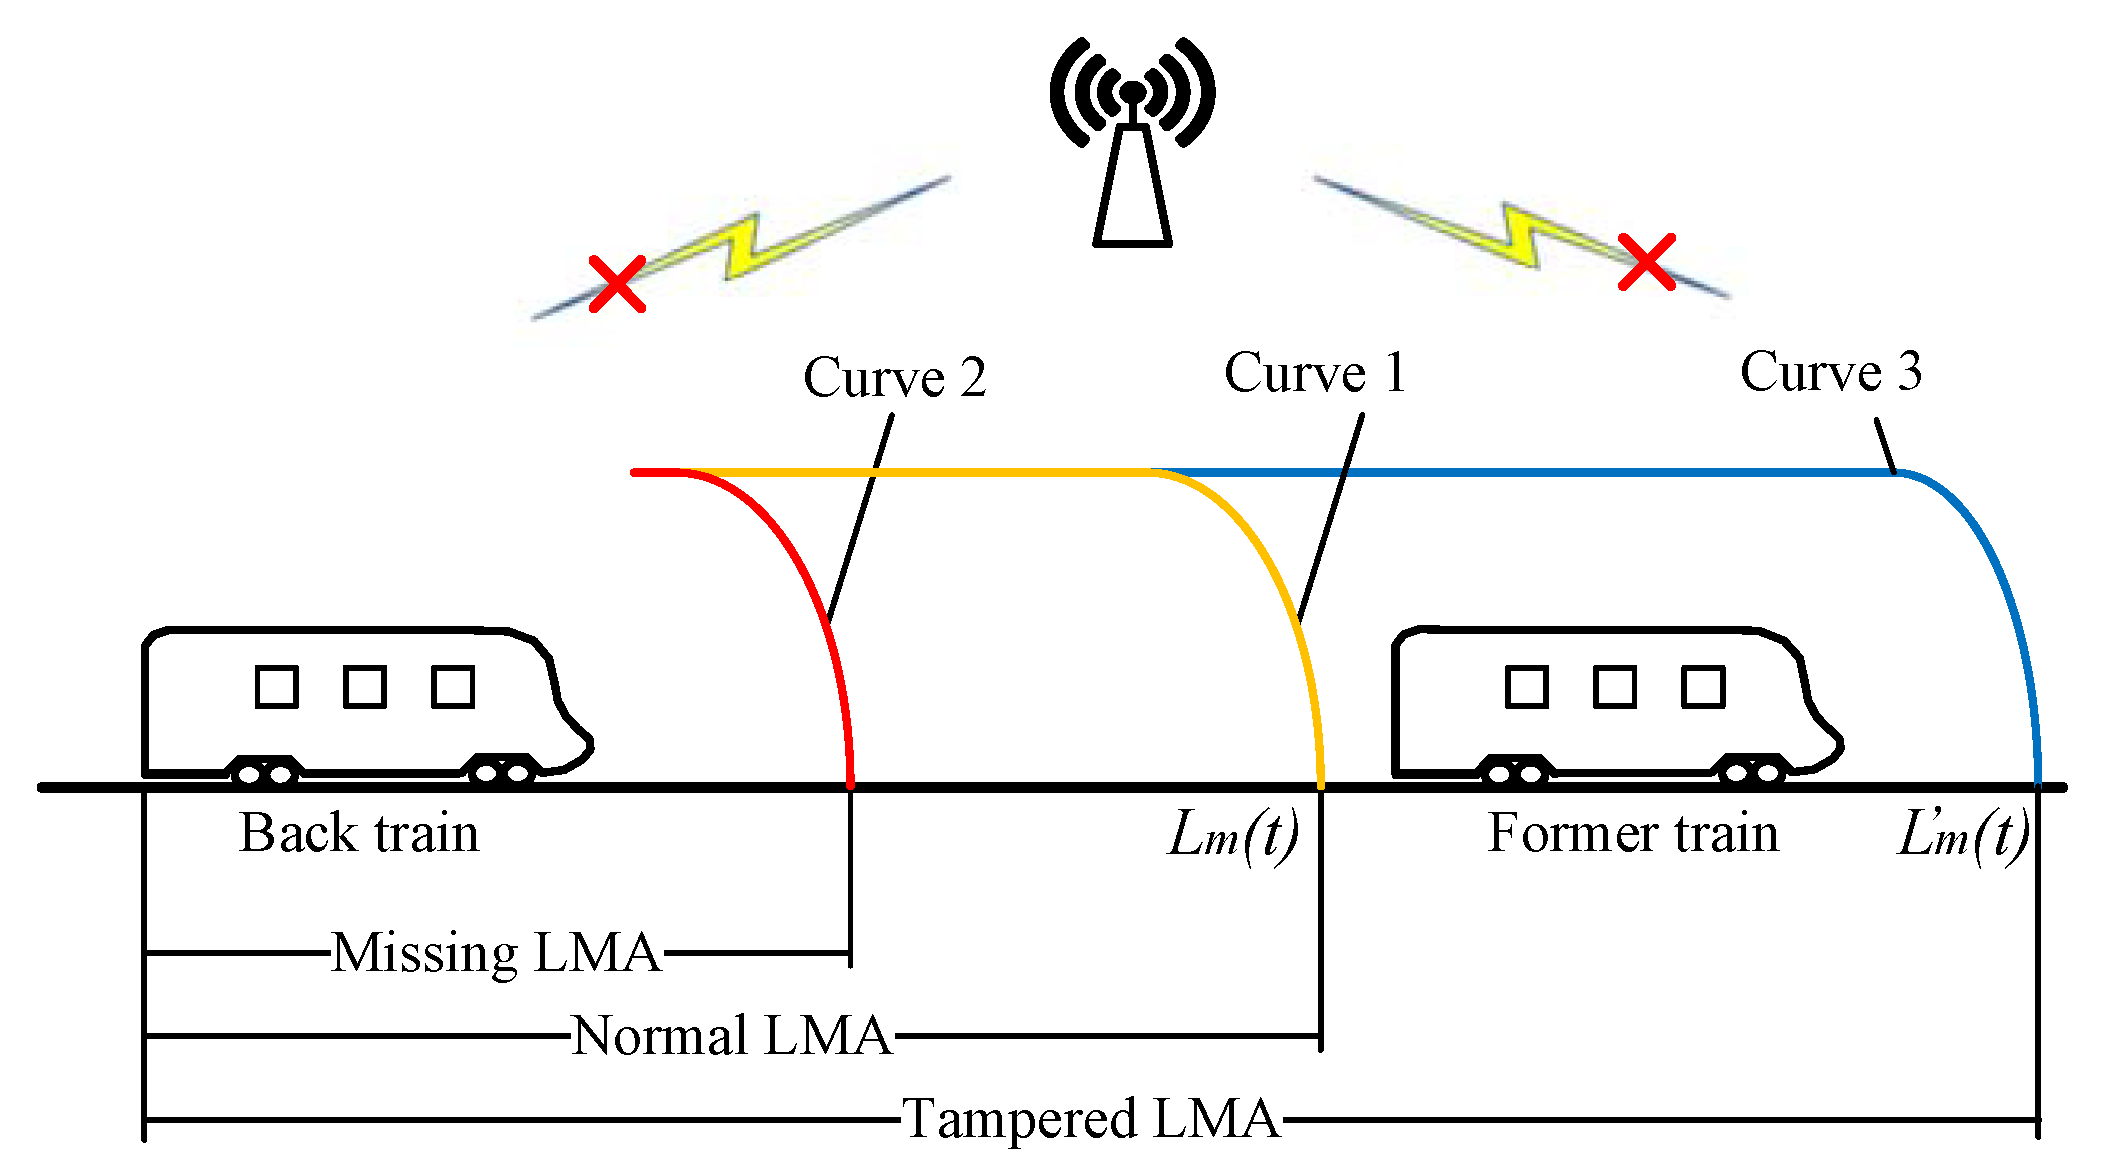
3.2. Impacts of Cyber-Attacks on CBTC Systems
4. The Intrusion Detection Model Using a Fusion of Network and Device States
4.1. The Network Detection Model
4.2. The Detection Model Based on Device States
4.3. The HMM Classifier Distinguishing Faults and Attacks
5. Experimental Data Collection
5.1. Semi-Physical Simulation Platform of CBTC
5.2. Experimental Scenarios
- Buffer overflow
- Smurf
- SYN flood
- Tamper attack
- Replay attack
- Equipment faults
- Communication faults
5.3. Experimental Data
6. Results and Discussion
6.1. Parameter Settings
6.2. Experiment Results
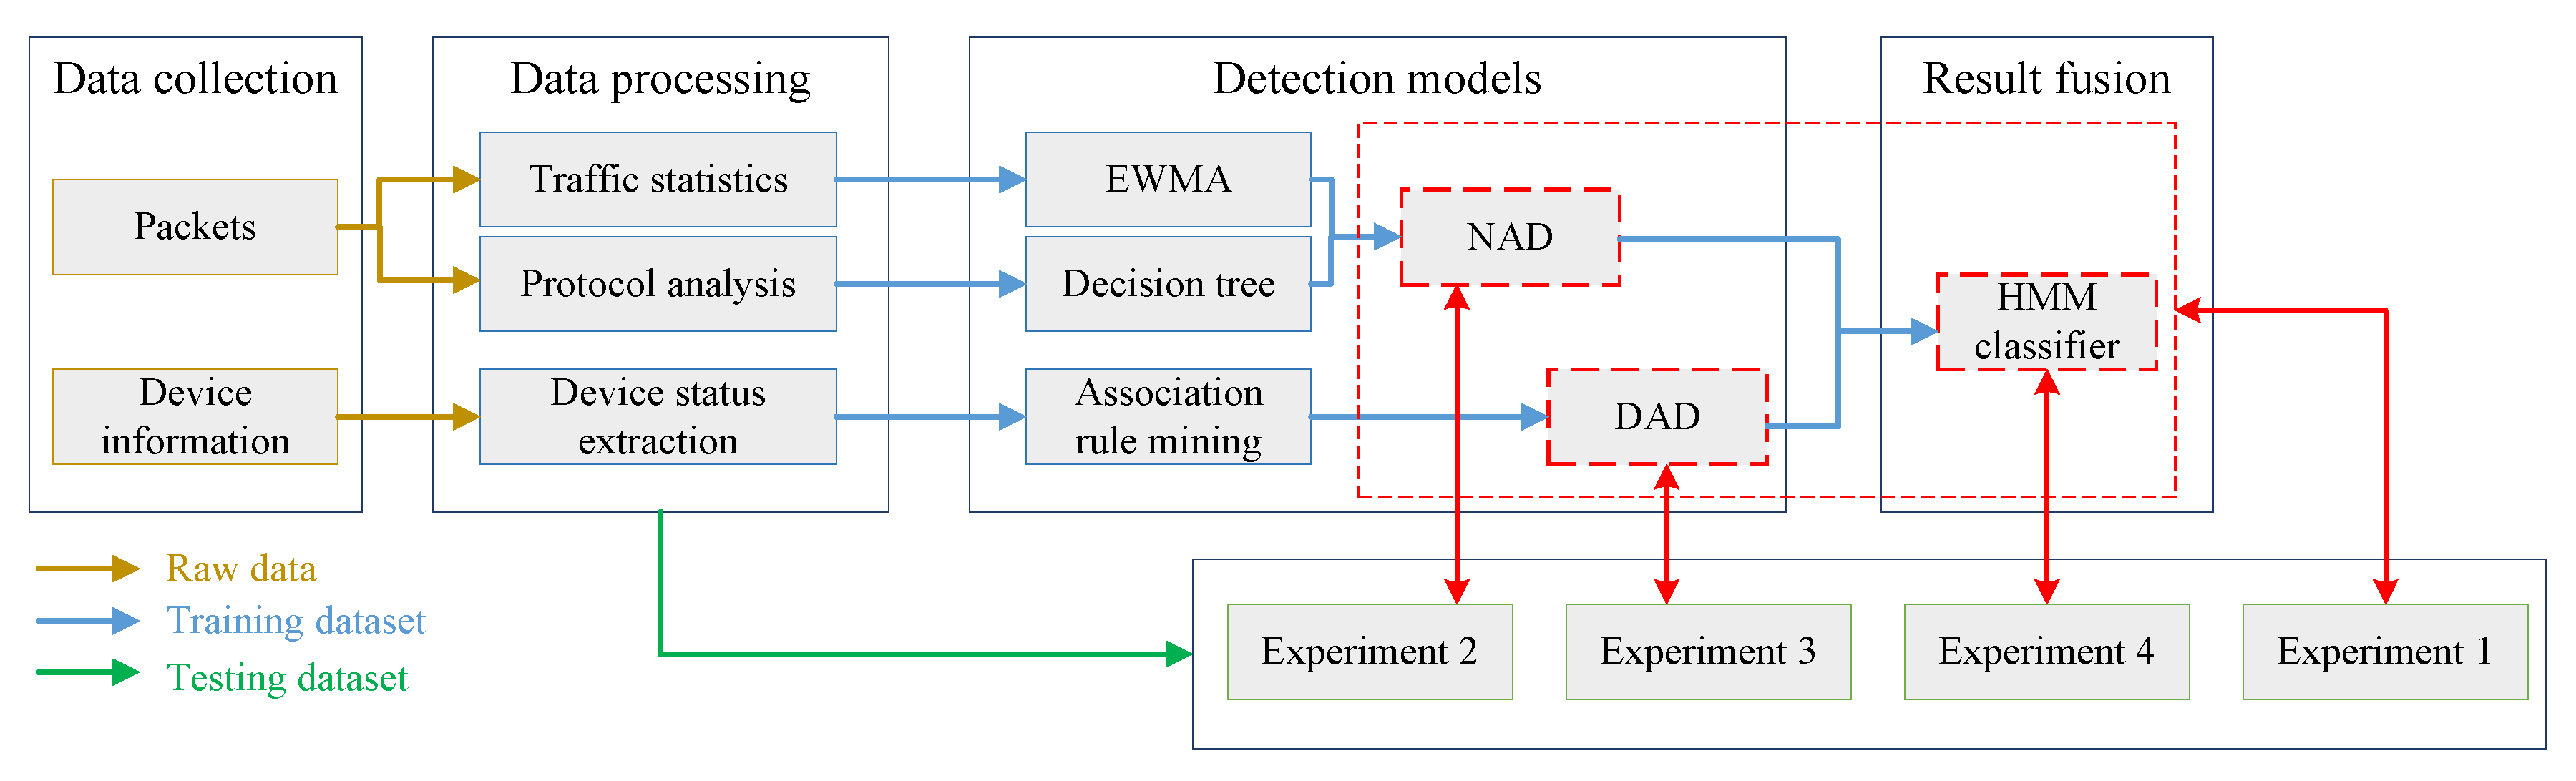
- Experiment 1
- Experiment 2
- Experiment 3
- Experiment 4
7. Conclusions
Author Contributions
Funding
Conflicts of Interest
References
- Farooq, J.; Soler, J. Radio communication for communications-based train control (CBTC): A tutorial and survey. IEEE Commun. Surv. Tutor. 2017, 19, 1377–1402. [Google Scholar] [CrossRef]
- Won, Y.; Yu, B.; Park, J.; Park, I.H.; Jeong, H.; Baik, J.; Kang, K.; Lee, I.; Son, S.H.; Park, K.J.; et al. An Attack-Resilient CPS Architecture for Hierarchical Control: A Case Study on Train Control Systems. Computer 2018, 51, 46–55. [Google Scholar] [CrossRef]
- Soderi, S.; Hämäläinen, M.; Iinatti, J. Cybersecurity considerations for Communication Based Train Control; Alstom Signalling Solutions: Florence, Italy, 2016. [Google Scholar]
- Boo, H.W. An Assessment of North Korean Cyber Threats. J. East Asian Aff. 2017, 31, 97–117. [Google Scholar]
- Chopra, S.S.; Dillon, T.; Bilec, M.M.; Khanna, V. A network-based framework for assessing infrastructure resilience: A case study of the London metro system. J. R. Soc. Interface 2016, 13, 20160113. [Google Scholar] [CrossRef] [PubMed]
- Kour, R.; Aljumaili, M.; Karim, R.; Tretten, P. eMaintenance in railways: Issues and challenges in cybersecurity. Proc. Inst. Mech. Eng. Part F J. Rail Rapid Transit 2019, 233. [Google Scholar] [CrossRef]
- Kabir, M.F.; Hartmann, S. Cyber security challenges: An efficient intrusion detection system design. In Proceedings of the 2018 International Young Engineers Forum (YEF-ECE), Costa da Caparica, Portugal, 4 May 2018; pp. 19–24. [Google Scholar]
- Basile, C.; Gupta, M.; Kalbarczyk, Z.; Iyer, R.K. An approach for detecting and distinguishing errors versus attacks in sensor networks. In Proceedings of the International Conference on Dependable Systems and Networks (DSN’06), Philadelphia, PA, USA, 25–28 June 2006; pp. 473–484. [Google Scholar]
- Ahmed, M.; Mahmood, A.N.; Hu, J. A survey of network anomaly detection techniques. J. Netw. Comput. Appl. 2016, 60, 19–31. [Google Scholar] [CrossRef]
- Aljawarneh, S.; Aldwairi, M.; Yassein, M.B. Anomaly-based intrusion detection system through feature selection analysis and building hybrid efficient model. J. Comput. Sci. 2018, 25, 152–160. [Google Scholar] [CrossRef]
- Buczak, A.L.; Guven, E. A survey of data mining and machine learning methods for cyber security intrusion detection. IEEE Commun. Surv. Tutor. 2016, 18, 1153–1176. [Google Scholar] [CrossRef]
- Han, S.; Xie, M.; Chen, H.H.; Ling, Y. Intrusion detection in cyber-physical systems: Techniques and challenges. IEEE Syst. J. 2014, 8, 1052–1062. [Google Scholar]
- Moustafa, N.; Slay, J. A hybrid feature selection for network intrusion detection systems: Central points. arXiv 2017, arXiv:1707.05505. [Google Scholar]
- Yang, Y.; McLaughlin, K.; Littler, T.; Sezer, S.; Wang, H. Rule-based intrusion detection system for SCADA networks. In Proceedings of the 2nd IET Renewable Power Generation Conference (RPG 2013), Beijing, China, 9–11 September 2013. [Google Scholar]
- Pal, K.; Adepu, S.; Goh, J. Effectiveness of association rules mining for invariants generation in cyber-physical systems. In Proceedings of the 2017 IEEE 18th International Symposium on High Assurance Systems Engineering (HASE), Singapore, 12–14 January 2017; pp. 124–127. [Google Scholar]
- Li, W.; Meng, W.; Su, C.; Kwok, L.F. Towards false alarm reduction using fuzzy if-Then rules for medical cyber physical systems. IEEE Access 2018, 6, 6530–6539. [Google Scholar] [CrossRef]
- Mitchell, R.; Chen, R. Effect of intrusion detection and response on reliability of cyber physical systems. IEEE Trans. Reliab. 2013, 62, 199–210. [Google Scholar] [CrossRef]
- Kuznetsov, A.; Smirnov, A.; Danilenko, D.; Berezovsky, A. The statistical analysis of a network traffic for the intrusion detection and prevention systems. Telecommun. Radio Eng. 2015, 74, 61–78. [Google Scholar] [CrossRef]
- Shitharth, S. An enhanced optimization based algorithm for intrusion detection in SCADA network. Comput. Secur. 2017, 70, 16–26. [Google Scholar]
- Bhuyan, M.H.; Bhattacharyya, D.K.; Kalita, J.K. Network anomaly detection: Methods, systems and tools. IEEE Commun. Surv. Tutor. 2014, 16, 303–336. [Google Scholar] [CrossRef]
- Jyothi, V.; Wang, X.; Addepalli, S.K.; Karri, R. Brain: Behavior based adaptive intrusion detection in networks: Using hardware performance counters to detect ddos attacks. In Proceedings of the 2016 29th International Conference on VLSI Design and 2016 15th International Conference on Embedded Systems (VLSID), Kolkata, India, 4–8 January 2016; pp. 587–588. [Google Scholar]
- Sindhu, S.S.S.; Geetha, S.; Kannan, A. Decision tree based light weight intrusion detection using a wrapper approach. Expert Syst. Appl. 2012, 39, 129–141. [Google Scholar] [CrossRef]
- Resende, P.A.A.; Drummond, A.C. A survey of random forest based methods for intrusion detection systems. ACM Comput. Surv. (CSUR) 2018, 51, 48. [Google Scholar] [CrossRef]
- Jahromi, A.N.; Sakhnini, J.; Karimpour, H.; Dehghantanha, A. A deep unsupervised representation learning approach for effective cyber-physical attack detection and identification on highly imbalanced data. In Proceedings of the 29th Annual International Conference on Computer Science and Software Engineering, Markham, ON, Canada, 4–6 November 2019; IBM Corp.: Riverton, NJ, USA, 2019; pp. 14–23. [Google Scholar]
- Melaragno, A.; Bandara, K.R.D.S.; Fewell, A.; Wijesekera, D. Rail Radio Intrusion Detection System (RRIDS) for Communication Based Train Control (CBTC). In Proceedings of the 2016 IEEE International Conference on Intelligent Rail Transportation (ICIRT), Birmingham, UK, 23–25 August 2016. [Google Scholar]
- Zhang, W.; Bu, B.; Wang, H. An Intrusion Detection Method of Data Tampering Attack in Communication- Based Train Control System. In Proceedings of the 2019 IEEE Intelligent Transportation Systems Conference (ITSC), Auckland, New Zealand, 27–30 October 2019; pp. 345–350. [Google Scholar]
- Gao, B.; Bu, B. A Novel Intrusion Detection Method in Train-Ground Communication System. IEEE Access 2019, 7, 178726–178743. [Google Scholar] [CrossRef]
- Zhu, L.; Yu, F.R.; Ning, B.; Tang, T. Cross-layer handoff design in MIMO-enabled WLANs for communication-based train control (CBTC) systems. IEEE J. Sel. Areas Commun. 2012, 30, 719–728. [Google Scholar] [CrossRef]
- Bu, B.; Yu, F.R.; Tang, T. Performance improved methods for communication-based train control systems with random packet drops. IEEE Trans. Intell. Transp. Syst. 2014, 15, 1179–1192. [Google Scholar] [CrossRef]
- Sedjelmaci, H.; Guenab, F.; Boudguiga, A.; Petiot, Y. Cooperative Security Framework for CBTC Network. In Proceedings of the 2018 IEEE International Conference on Communications (ICC), Kansas City, MO, USA, 20–24 May 2018; pp. 1–6. [Google Scholar]
- Tartakovsky, A.G.; Polunchenko, A.S.; Sokolov, G. Efficient computer network anomaly detection by changepoint detection methods. IEEE J. Sel. Top. Signal Process. 2013, 7, 4–11. [Google Scholar] [CrossRef]
- Machaka, P.; Bagula, A.; Nelwamondo, F. Using exponentially weighted moving average algorithm to defend against DDoS attacks. In Proceedings of the 2016 Pattern Recognition Association of South Africa and Robotics and Mechatronics International Conference (PRASA-RobMech), Stellenbosch, South Africa, 30 November–2 December 2016; pp. 1–6. [Google Scholar]
- Kwon, Y.; Kim, H.K.; Lim, Y.H.; Lim, J.I. A behavior-based intrusion detection technique for smart grid infrastructure. In Proceedings of the 2015 IEEE Eindhoven PowerTech, Eindhoven, The Netherlands, 29 June–2 July 2015; pp. 1–6. [Google Scholar]
- Silva, A.; Pontes, E.; Zhou, F.; Guelf, A.; Kofuji, S. PRBS/EWMA based model for predicting burst attacks (Brute Froce, DoS) in computer networks. In Proceedings of the Ninth International Conference on Digital Information Management (ICDIM 2014), Phitsanulok, Thailand, 29 September–1 October 2014; pp. 194–200. [Google Scholar]
- Tailor, K.S. Some Special Types of Statistical Quality Control Charts for Variables under the Assumption of Moderateness. Ph.D. Thesis, SPB English Medium College of Commerce, Surat, India, 2015. [Google Scholar]
- Umer, M.F.; Sher, M.; Bi, Y. Flow-based intrusion detection: Techniques and challenges. Comput. Secur. 2017, 70, 238–254. [Google Scholar] [CrossRef]
- Agrawal, S.; Agrawal, J. Survey on anomaly detection using data mining techniques. Procedia Comput. Sci. 2015, 60, 708–713. [Google Scholar] [CrossRef]
- Salzberg, S.L. C4. 5: Programs for Machine Learning by j. ross Quinlan; Morgan Kaufmann Publishers, Inc.: San Mateo, CA, USA, 1993. [Google Scholar]
- Zhao, W.T.; Cao, G.N.; Chen, X.X.; Ling, Z.J.; Nie, Z.P.; Tang, W.B.; Teng, G.D.; Hu, L.Q. Design of the reliable collection and control scheme of the relay node status of the train carborne control system. In ITM Web of Conferences; EDP Sciences: Les Ulis, France, 2016; Volume 7, p. 04016. [Google Scholar]
- Tang, L.A.; Han, J.; Jiang, G. Mining sensor data in cyber-physical systems. Tsinghua Sci. Technol. 2014, 19, 225–234. [Google Scholar] [CrossRef]
- Zhang, L.; Chen, Y.; Liao, S. Study on Intrusion Detection Based on Data Mining. In Proceedings of the 2018 International Conference on Engineering Simulation and Intelligent Control (ESAIC), Changsha, China, 10–11 August 2018; pp. 323–325. [Google Scholar]
- Hidayanto, B.C.; Muhammad, R.F.; Kusumawardani, R.P.; Syafaat, A. Network intrusion detection systems analysis using frequent item set mining algorithm FP-max and apriori. Procedia Comput. Sci. 2017, 124, 751–758. [Google Scholar] [CrossRef]
- Hurley, T.; Perdomo, J.E.; Perez-Pons, A. HMM-Based Intrusion Detection System for Software Defined Networking. In Proceedings of the IEEE International Conference on Machine Learning & Applications, Anaheim, CA, USA, 18–20 December 2016. [Google Scholar]
- Hindy, H.; Brosset, D.; Bayne, E.; Seeam, A.; Tachtatzis, C.; Atkinson, R.; Bellekens, X. A taxonomy and survey of intrusion detection system design techniques, network threats and datasets. arXiv 2018, arXiv:1806.03517. [Google Scholar]
- Li, Z.; Fang, H.; Huang, M. Diversified learning for continuous hidden Markov models with application to fault diagnosis. Expert Syst. Appl. 2015, 42, 9165–9173. [Google Scholar] [CrossRef]
- Alouneh, S.; Bsoul, H.; Kharbutli, M. A software tool to protect executable files from buffer overflow attacks. Int. J. Internet Technol. Secur. Trans. 2016, 6, 133–166. [Google Scholar] [CrossRef]
- Gunnam, G.R.; Kumar, S. Do ICMP Security Attacks Have Same Impact on Servers? J. Inf. Secur. 2017, 8, 274–283. [Google Scholar] [CrossRef][Green Version]
- Giraldo, J.; Urbina, D.; Cardenas, A.; Valente, J.; Faisal, M.; Ruths, J.; Tippenhauer, N.O.; Sandberg, H.; Candell, R. A survey of physics-based attack detection in cyber-physical systems. ACM Comput. Surv. (CSUR) 2018, 51, 76. [Google Scholar] [CrossRef]
- Yang, B.; Wang, X. Research on multi-class CUSUM algorithm for anomaly detection of WSN. In Proceedings of the International Conference on Intelligent Computation Technology & Automation, Changsha, China, 11–12 May 2010. [Google Scholar]
- Liu, S.; Yamada, M.; Collier, N.; Sugiyama, M. Change-point detection in time-series data by relative density-ratio estimation. Neural Netw. 2013, 43, 72–83. [Google Scholar] [CrossRef] [PubMed]
- Akbar, M.A.; Farooq, M. Application of evolutionary algorithms in detection of SIP based flooding attacks. In Proceedings of the Conference on Genetic & Evolutionary Computation, Montreal, QC, Canada, 8–12 July 2009. [Google Scholar]
- Verba, J.; Milvich, M. Idaho National Laboratory Supervisory Control and Data Acquisition Intrusion Detection System (SCADA IDS). In Proceedings of the IEEE Conference on Technologies for Homeland Security, Waltham, MA, USA, 12–13 May 2008. [Google Scholar]
- Valdes, A.; Cheung, S. Communication Pattern Anomaly Detection in Process Control Systems. In Proceedings of the IEEE Conference on Technologies for Homeland Security, Boston, MA, USA, 11–12 May 2009. [Google Scholar]
- Amini, M.; Jalili, R.; Shahriari, H.R. RT-UNNID: A practical solution to real-time network-based intrusion detection using unsupervised neural networks. Comput. Secur. 2006, 25, 459–468. [Google Scholar] [CrossRef]
- Sui, S.; Li, L.; Manikopoulo, C.N. Flow-based Statistical Aggregation Schemes for Network Anomaly Detection. In Proceedings of the IEEE International Conference on Networking, Ft. Lauderdale, FL, USA, 23–25 April 2006. [Google Scholar]
- Goh, J.; Adepu, S.; Tan, M.; Zi, S.L. Anomaly Detection in Cyber Physical Systems Using Recurrent Neural Networks. In Proceedings of the IEEE International Symposium on High Assurance Systems Engineering, Singapore, 12–14 January 2017. [Google Scholar]
- Li, L.; Yang, D.Z.; Shen, F.C. A novel rule-based Intrusion Detection System using data mining. In Proceedings of the IEEE International Conference on Computer Science & Information Technology, Chengdu, China, 9–11 July 2011. [Google Scholar]
- Kai, H.; Cai, M.; Chen, Y.; Qin, M. Hybrid Intrusion Detection with Weighted Signature Generation over Anomalous Internet Episodes. IEEE Trans. Dependable Secur. Comput. 2007, 4, 41–55. [Google Scholar]
- Tajbakhsh, A.; Rahmati, M.; Mirzaei, A. Intrusion detection using fuzzy association rules. Appl. Soft Comput. 2009, 9, 462–469. [Google Scholar] [CrossRef]


| Issues | Challenges | Solutions |
|---|---|---|
| DoS detection | Small changes in traffic flow are difficult to detect. | • Using the sequential analysis technique |
| DIA detection | Existing detection model can hardly identify DIA attacks. | • In-depth analysis of CBTC protocols. • Checking the authenticity of LMAs |
| Distinguishing attacks from faults | Faults may have the same impact as attacks do. | • Adding a detection model based on device states. • Designing an HMM classifier. |
| X | Y | s | c | ||||
|---|---|---|---|---|---|---|---|
| St | Sip | Rc | Rm | Rd | Rn | ||
| ZC1 | 192.168.1.2 | 1 | 1 | 1 | 1 | 81 | 76 |
| DSU | 192.168.7.1 | 0 | — | 1 | 1 | 77 | 90 |
| ATS | 192.168.10.11 | 0 | — | — | 2 | 69 | 71 |
| CI | — | 1 | 0 | 0 | 0 | 71 | 74 |
| Type | Category | Times | Packets | State |
|---|---|---|---|---|
| Normal | CBTC mode | 30 | 128,742 | 13,721 |
| Intermittent ATP mode | 5 | 14,263 | 2188 | |
| Attack (DoS) | Buffer overflow | 10 | 13,527 | 3418 |
| Smurf | 10 | 71,572 | 4113 | |
| SYN flood | 5 | 154,759 | 1478 | |
| Attack (DIA) | Tamper | 10 | 38,531 | 1726 |
| Replay | 10 | 82,861 | 1266 | |
| Fault | Equipment | 10 | 46,447 | 1981 |
| Communication | 10 | 10,275 | 1758 |
| TPR (%) | FPR (%) | ||
|---|---|---|---|
| 0.1 | 0.01 | 76.65 | 8.19 |
| 0.001 | 84.55 | 14.19 | |
| 0.0001 | 81.81 | 8.12 | |
| 0.05 | 0.01 | 82.41 | 7.21 |
| 0.001 | 94.49 | 7.03 | |
| 0.0001 | 93.39 | 5.74 | |
| 0.01 | 0.01 | 90.39 | 6.27 |
| 0.001 | 94.86 | 3.21 | |
| 0.0001 | 93.91 | 3.82 |
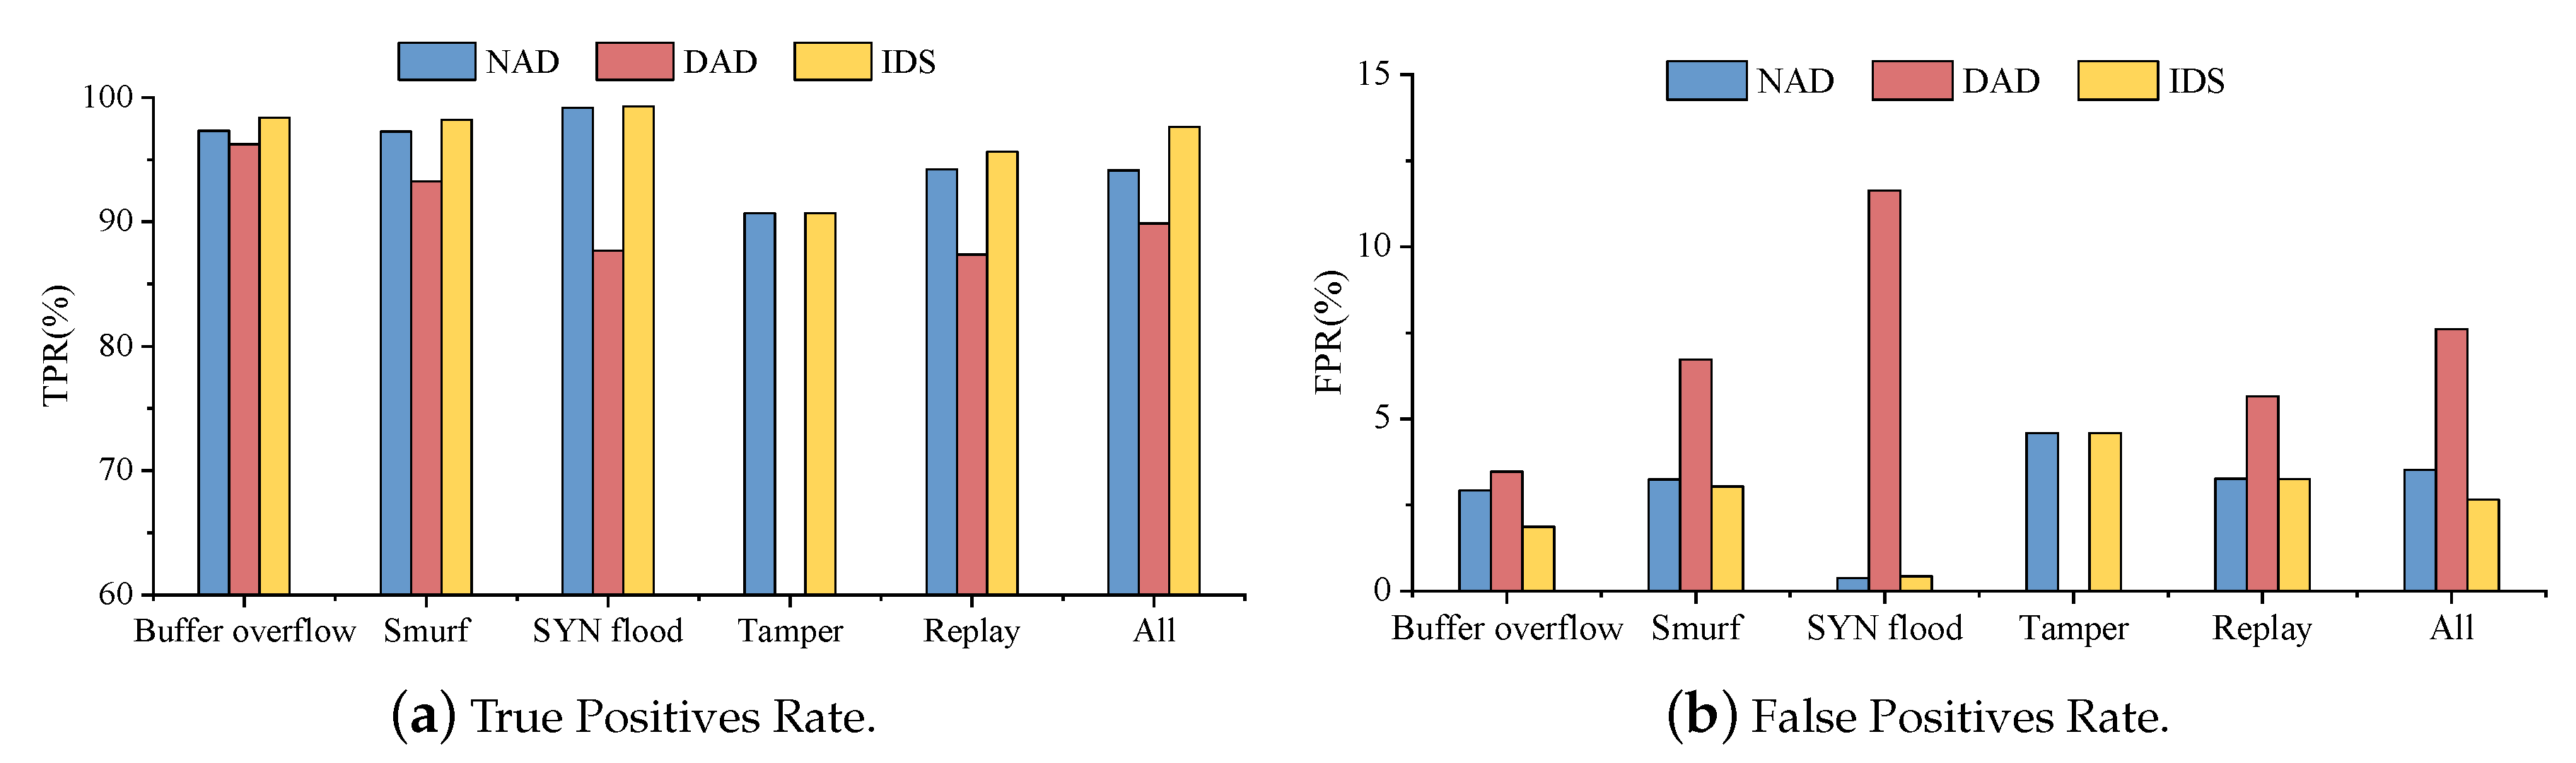
| Anomaly | TPR % | FPR % | ||||
|---|---|---|---|---|---|---|
| NAD | DAD | IDS | NAD | DAD | IDS | |
| Buffer overflow | 97.31 | 96.24 | 98.37 | 2.92 | 3.47 | 1.87 |
| Smurf | 97.25 | 93.27 | 98.20 | 3.24 | 6.72 | 3.04 |
| SYN flood | 99.16 | 87.68 | 99.29 | 0.38 | 11.64 | 0.43 |
| Tamper | 90.67 | – | 90.67 | 4.58 | – | 4.58 |
| Replay | 94.22 | 87.35 | 95.64 | 3.27 | 5.65 | 3.25 |
| All | 94.13 | 89.88 | 97.64 | 3.52 | 7.61 | 2.66 |
| IDS | Methods | Application Scenarios | DoS | DIA | ||
|---|---|---|---|---|---|---|
| TPR (%) | FPR (%) | TPR (%) | FPR (%) | |||
| [49] | Cumulative sum | Wireless network | 93.27 | 4.32 | – | – |
| [50] | Statistical change-point detection | Real-world network | 90.61 | 5.64 | – | – |
| [51] | Supervised classifiers | VoIP network | 82.17 | 0.05 | – | – |
| [52] | Traffic flow analysis and packet detection | SCADA | – | – | – | – |
| [53] | Flow-based and pattern-based | Process Control System | 99.9 | – | – | – |
| [54] | Statistical preprocessing and Neural Network | Local networks | 97.42 | 1.99 | – | – |
| [55] | Statistical feature vectors and Neural Network | KDD99 | 94 | 0.2 | – | – |
| [56] | Recurrent Neural network and Cumulative Sum | Water treatment plant | – | – | 90 | 4 |
| NAD | The statistical method and Decision Tree | CBTC | 98.86 | 1.92 | 92.95 | 3.84 |
© 2020 by the authors. Licensee MDPI, Basel, Switzerland. This article is an open access article distributed under the terms and conditions of the Creative Commons Attribution (CC BY) license (http://creativecommons.org/licenses/by/4.0/).
Share and Cite
Song, Y.; Bu, B.; Zhu, L. A Novel Intrusion Detection Model Using a Fusion of Network and Device States for Communication-Based Train Control Systems. Electronics 2020, 9, 181. https://doi.org/10.3390/electronics9010181
Song Y, Bu B, Zhu L. A Novel Intrusion Detection Model Using a Fusion of Network and Device States for Communication-Based Train Control Systems. Electronics. 2020; 9(1):181. https://doi.org/10.3390/electronics9010181
Chicago/Turabian StyleSong, Yajie, Bing Bu, and Li Zhu. 2020. "A Novel Intrusion Detection Model Using a Fusion of Network and Device States for Communication-Based Train Control Systems" Electronics 9, no. 1: 181. https://doi.org/10.3390/electronics9010181
APA StyleSong, Y., Bu, B., & Zhu, L. (2020). A Novel Intrusion Detection Model Using a Fusion of Network and Device States for Communication-Based Train Control Systems. Electronics, 9(1), 181. https://doi.org/10.3390/electronics9010181