1. Introduction
The rise in the number of vehicles is bound to have some adverse effects, including, but not restricted to, traffic congestion in densely populated areas and overburdening of the infrastructure in an urban area. It also causes a higher amount of deaths yearly, related to traffic. One such instance is an accident that took place on 2 September 2015 in the Ojuelegba suburb in Lagos, Nigeria’s capital. It all began when a container of products fell on a passenger car and a newlywed couple was killed. It resulted in a chaotic traffic scenario in which numerous cars traveling at greater speeds crashed into each other and created a huge mess that claimed numerous lives. The latest research undertaken by the World Health Organization (WHO) [
1] shows that approximately 1.25 million individuals die each year as a result of road accidents and millions more are injured, almost 49% of which are passing pedestrians and cyclists.
The aforementioned percentage of fatalities happens more in underdeveloped countries due to the dilapidated road infrastructure. If certain precautionary measures are not taken to overcome this percentage, then, by the year 2030, traffic accidents will become the fifth major cause of deaths [
2]. In this respect, instruments and systematic methods to improve road safety have been developed in the scientific community for many years.
The following points may prove invaluable in reducing the number of casualties and injuries drastically, caused by road accidents:
Providing medical help to victims of road accidents in a timely manner.
Notification about the precise situation to the first responders.
Lack of a permanent database, holding all appropriate documents and records, which can be examined as and when necessary.
The first two issues were highlighted and addressed in our earlier work [
3,
4] by proposing an application for accident detection and management. The application was able to automatically identify road accidents and send a notification to the control room situated in a specific region. However, in order to improve the reliability of an accident detection mechanism and accident data analysis, a tool is needed to produce efficient real-time visualizations. That tool can then be used to create policies and apply the best decisions by the appropriate officials. Besides properly identifying and reacting to a road accident in an effective way, it is equally essential to collect and store the required information safely, which can be used whenever necessary.
The objective of the current work is to create a system that automatically detects and provides notifications about traffic congestion in a timely manner to suppress the number of casualties, by giving prompt medical aid to the victims of the road accident. This can be accomplished by utilizing the Internet of Things (IoT) [
5,
6] combined with Vehicular Ad hoc Networks (VANETs). As the node (vehicle) in VANET has a limited processing capability, it therefore might create latency if the processing of the captured information through the camera is carried out by the node itself. Because of the high latency, the authorities may not respond with the best solution in a timely manner, causing a high rate of casualties. In order to overcome such latency, we used the concept of IoT, Edge/Cloud computing in VANET to attain the desired objectives where the information is acquired through the sensors and then that information is being processed for further analysis. Additionally, the proposed mechanism performs an analysis on the recoded data to distinguish the accidents and the regularity or the irregularity of the event, their reasons, and particular area of casualty, which help to assist the activity specialists in formalizing the traffic rules to decrease the deaths on the road.
The suggested system consists of three separate sub-systems, i.e., on-board sensors [
3,
4], edge gateway [
7] and cloud platform [
8]:
On-Board Sensors: It is capable of accurate road accident detection through an OBU, consisting of an accelerometer and a gyroscope along with identification of an accident event through Global Positioning System (GPS). It has a provision to capture images using a high-definition camera module from inside a car and then attach the captured images/data along with the other information that is sent to the destination. The complete message is routed to the edge node using a vehicular ad hoc network.
Edge Gateway: These are the entities in all the regions that are positioned in the control room. It has the responsibility to receive an accident notification and then process the sensed data. Another responsibility of Edge Gateway is to distinguish the number of casualties and the person involved in the accidents using face detection procedures. Furthermore, it processes the information received from the nodes in the network and then informs the hospital so that it can immediately dispatch the ambulance. Moreover, it has the ability to store information temporarily prior to receiving securely by the cloud server.
Cloud Platform: The last but not the least tier of the system has a responsibility to store and process information received from the edge nodes. Here, a visualization tool is used that generates a query to fetch the information from the database. It is further used to study and analyze road accident data for various functionalities such as for policy-making, including research and documentation.
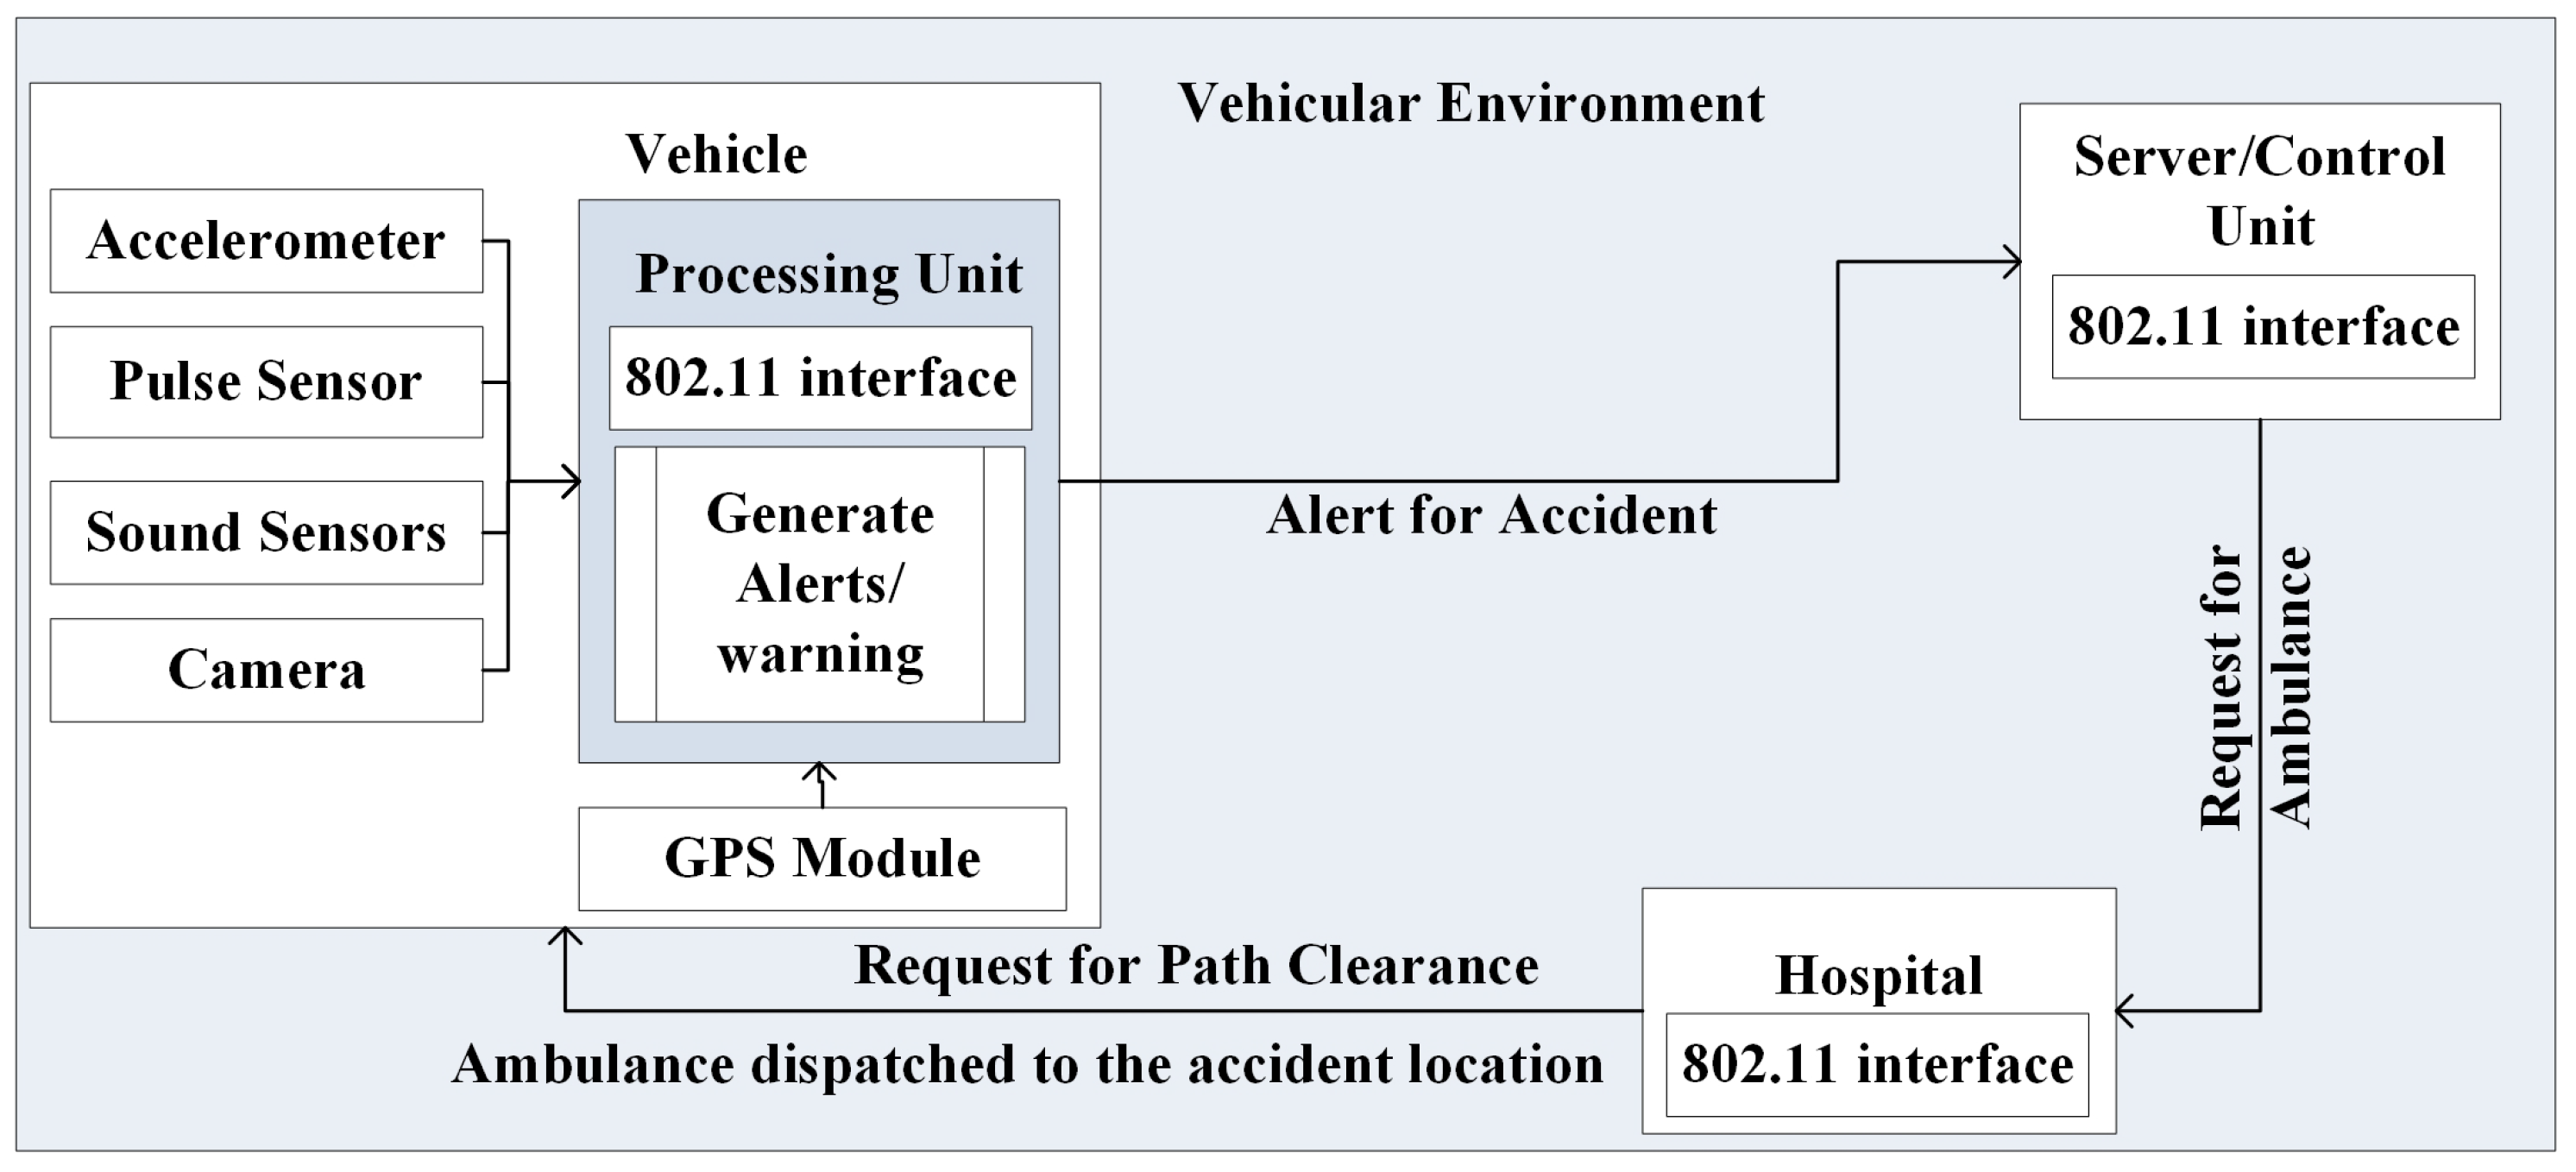
In an automotive vehicular environment, once an accident occurs, a vehicle with integrated sensors generates a notification which is sent to the intermediary via an ad hoc network. When the information is received, this device may process the received information to adjust it appropriately. When the message is ready to be processed, it is routed to the central servers over the Internet, which is received, interpreted, and processed by the concerned authorities.
There are two basic requirements for incident detection and notification: contextual awareness and timeliness. These two features in a particular system can help to identify an unpredictable situation on the road like accidents. Additionally, the system with such capabilities can solve the aforementioned problems. When an accident occurs and the system knows about the incident, then it can provide the ease to the people who are offering the rescue services, thereby, it can efficiently improve the probability of victims survival. Furthermore, a piece of visual information can also be utilized based on the camera embedded on the system. The visual information through the camera is beneficial for the rescue official to make better decisions. With this functionality, the system can provide the first responders with contextual awareness. Moreover, the system has to be delay-sensitive to detect an accident. For the system to perform better, it is required that the accident-related information should reach the nearest hospital so that the relevant authority can treat the victims or the injured persons properly.
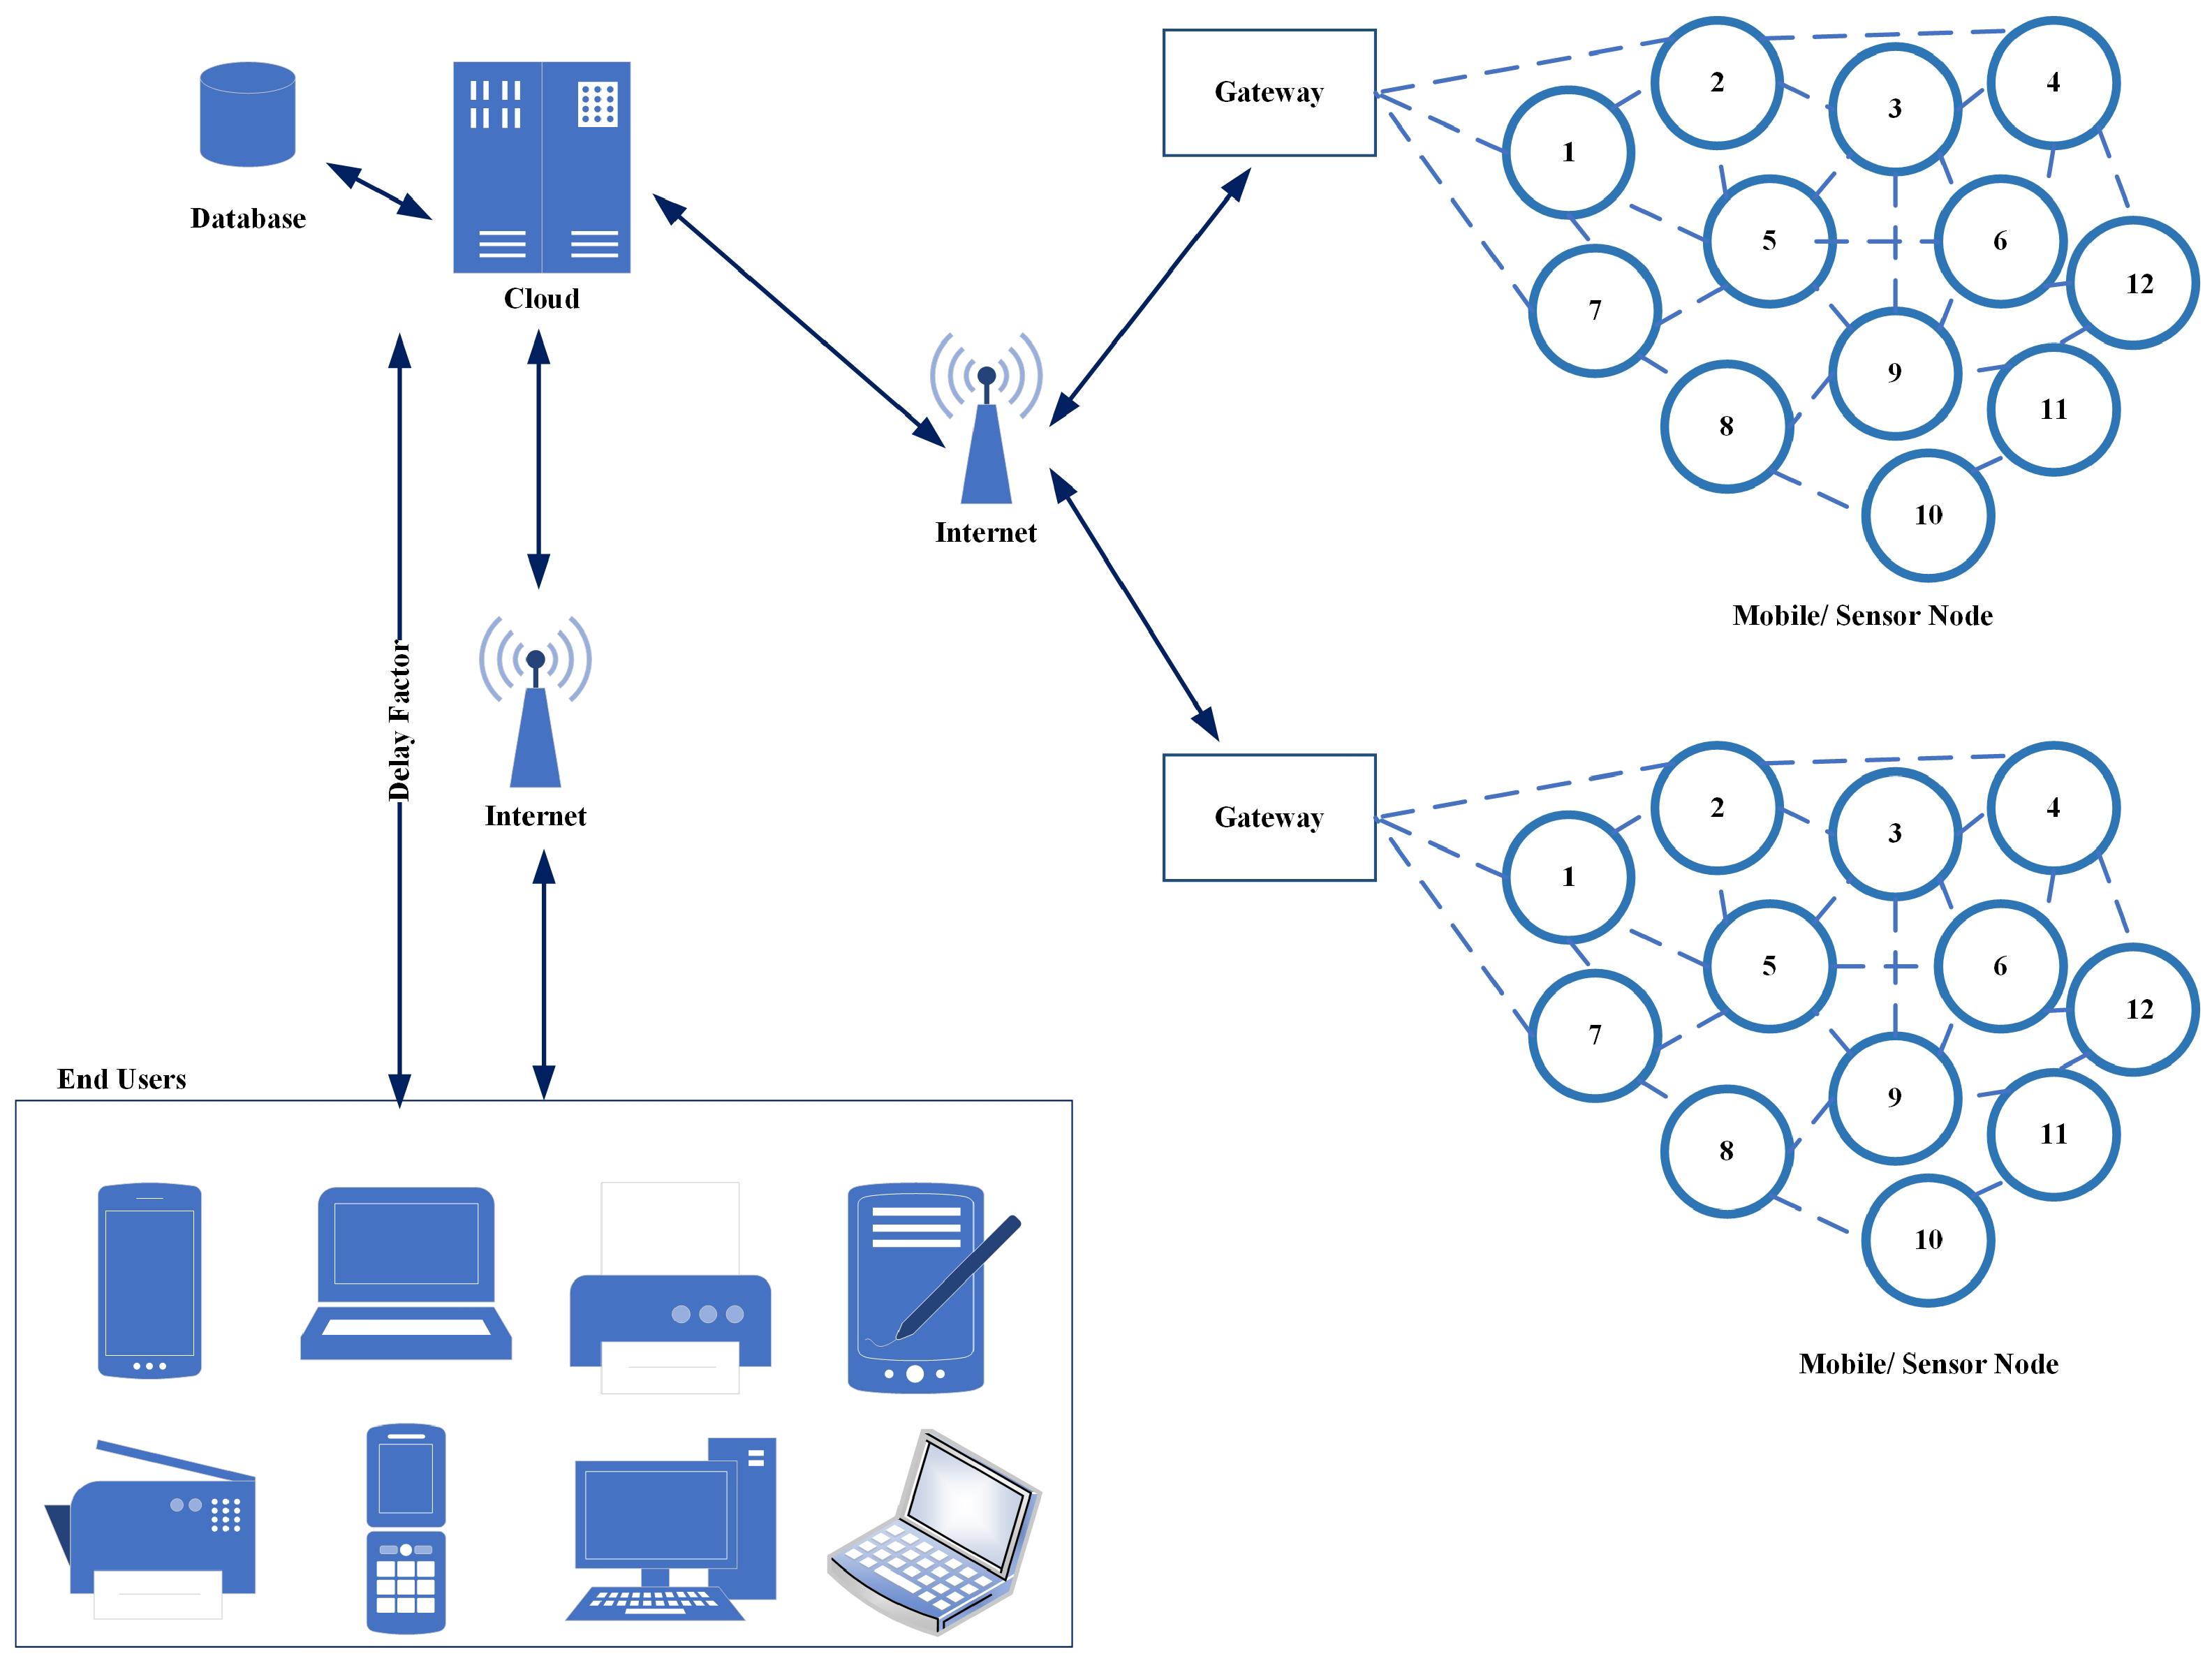
The system that supports an IoT-based vehicular environment, such as used in a compute-intensive system, provides better results within an organized way if fast processing is required. Such applications that are based on the compute-intensive nature makes it very difficult for the officials to execute resource-constrained vehicles or mobile devices. To get the optimum or maximum output somehow, the resource-intensive tasks are required to be assigned to the cloud servers. Because it has the capability of handling big data with somehow unlimited resources such as the applications that use compute-intensive features and such applications might not be available in a vehicle’s OBU. Since there is a large distance between the sensing network and the cloud itself, there is also a delay factor involved as presented in
Figure 1.
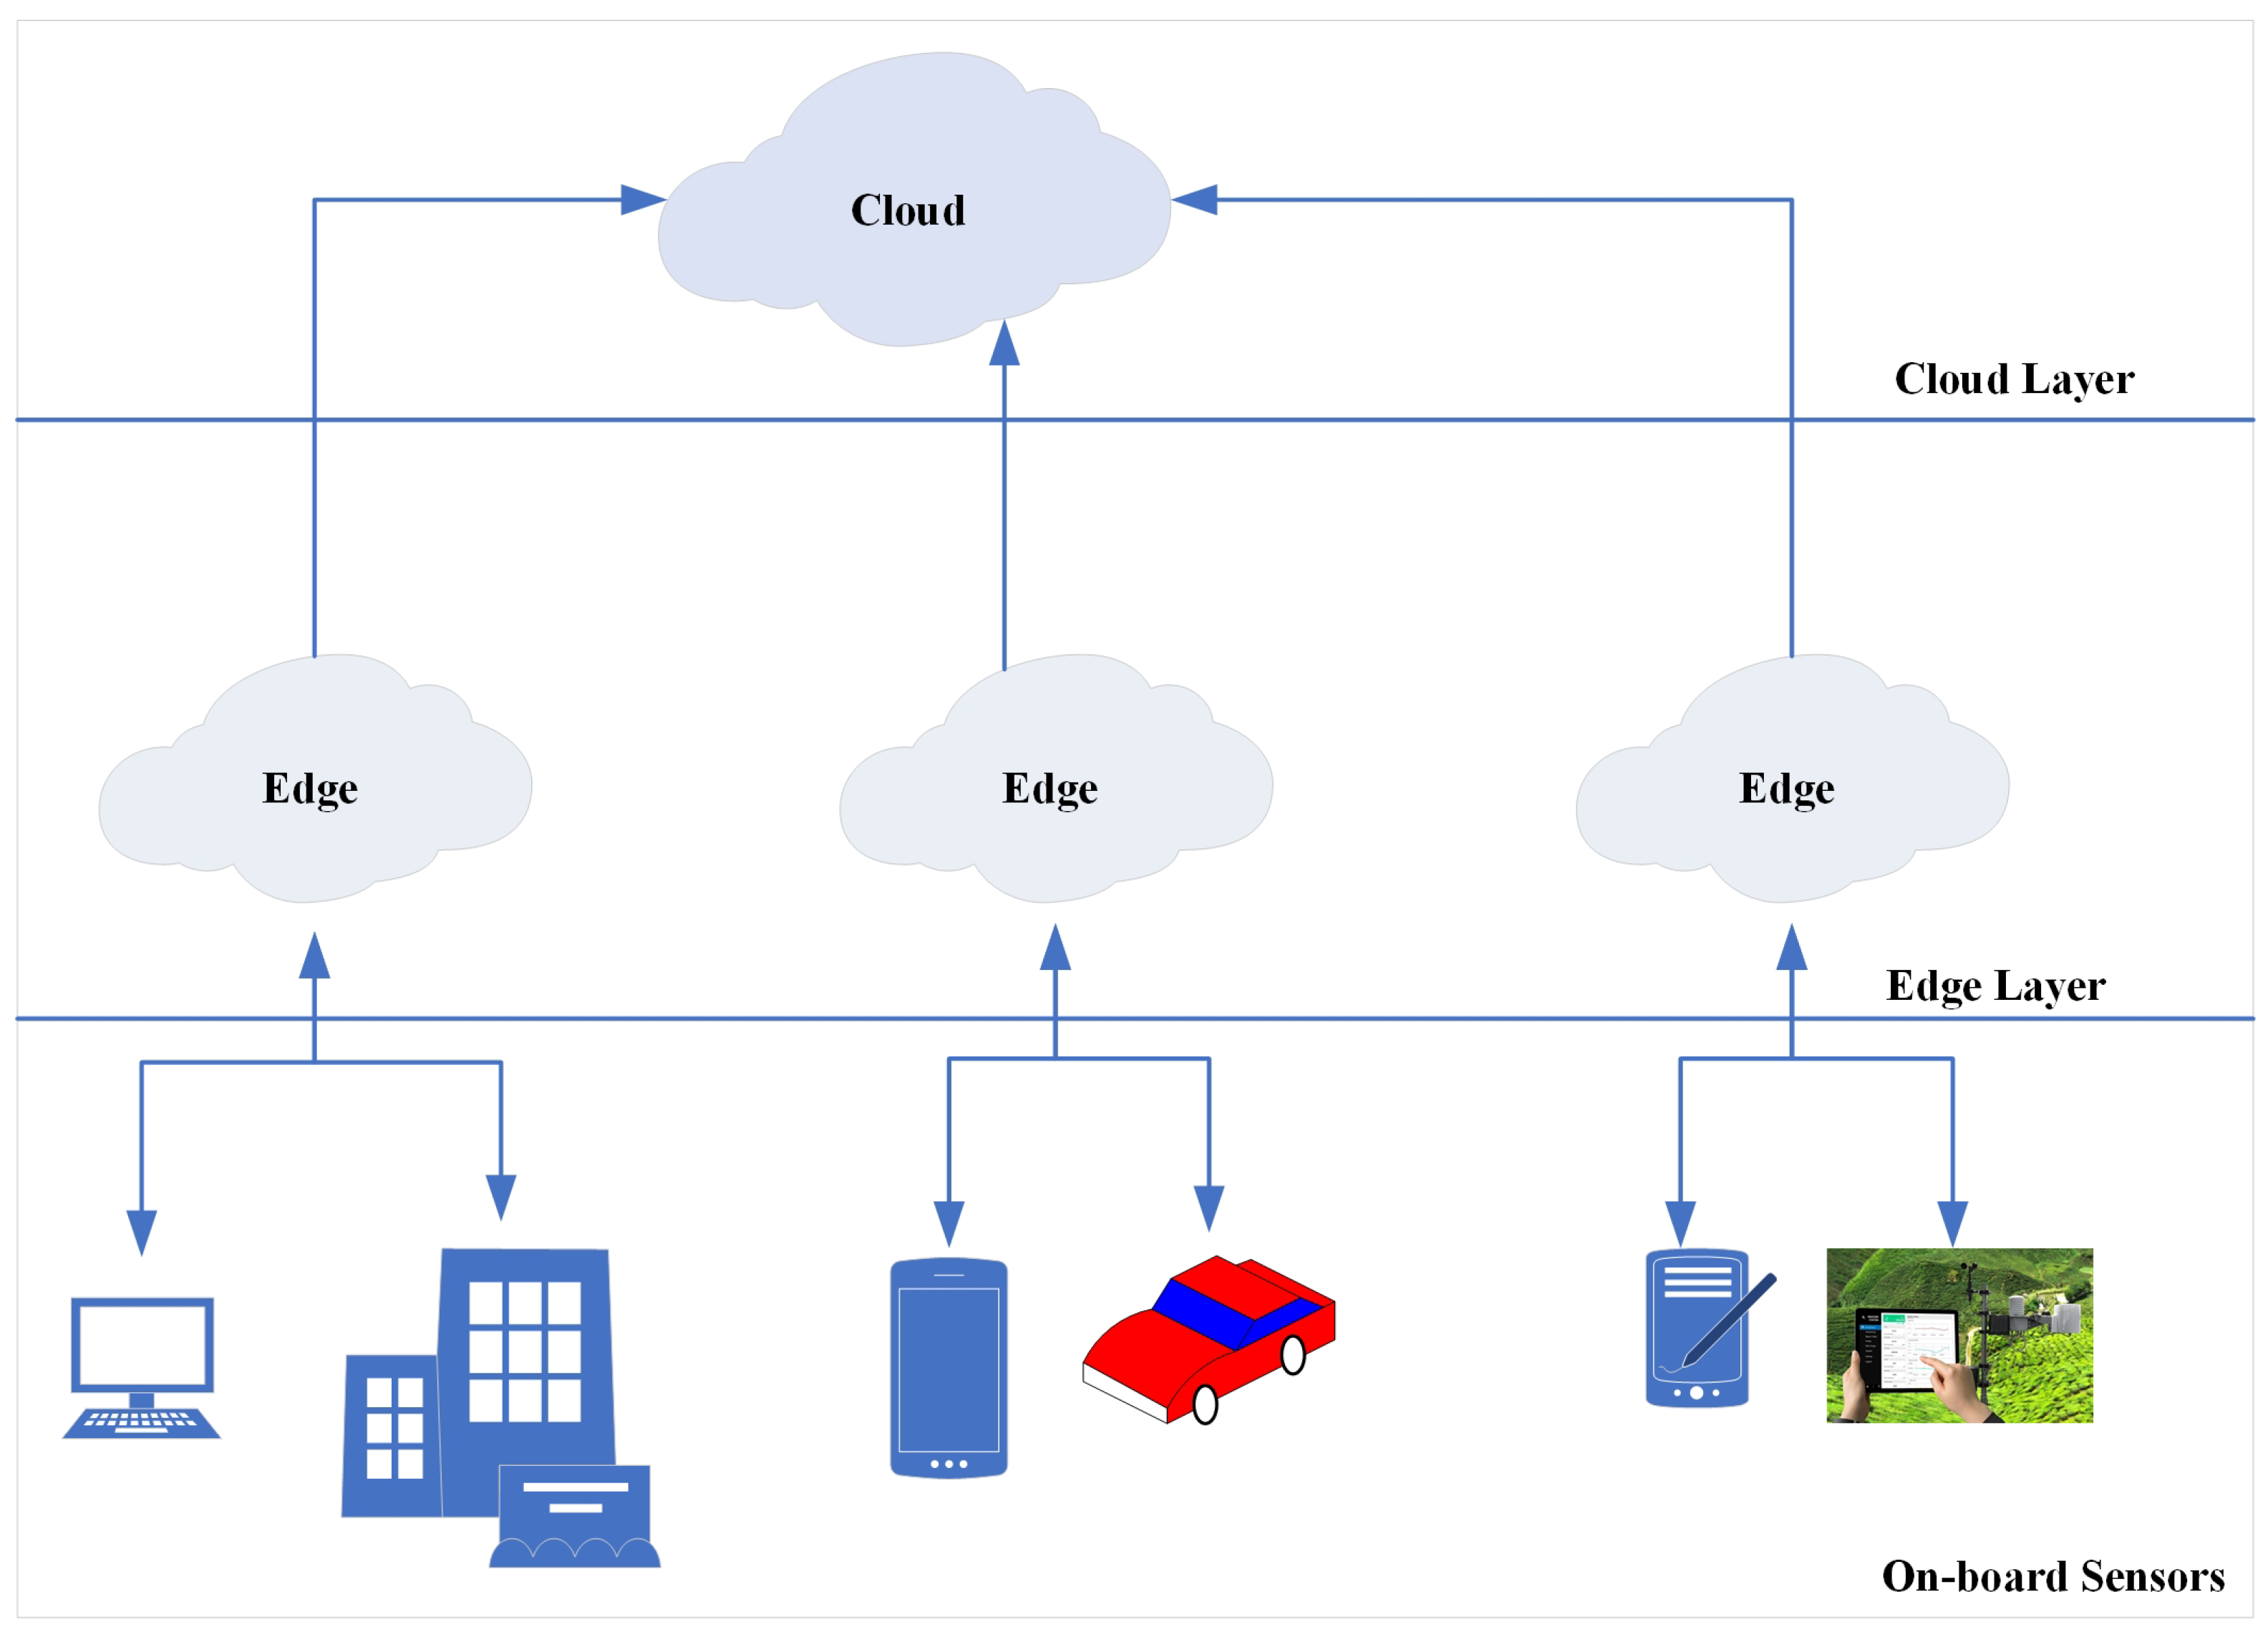
In contrary to this, cloud technology usually doesn’t provide important features like location-awareness, low-latency, and support of mobility in applications, involving vehicles [
9]. In such cases, the usability of Edge or Fog Computing is an alternative. If there exists some sort of a middle-ware between the cloud and the sensing network, which is capable of communicating with both of them simultaneously, then it represents technology as a sandwich. It includes the required situational awareness as well as decreases the duration of accident notification to reach the rescue service providers. Hence, this concept of a sandwiched tier between the centralized cloud and the distributed sensing network (as depicted in
Figure 2) is capable of handling tasks of an urgent nature locally. In other words, the computational power of a cloud server can be brought up to the edges of the vehicular sensor network, which increases the overall efficiency of the automatic accident detection and response system.
The overall contribution of the proposed system is divided into two main procedures:
The first procedure deals with the automatic accident detection mechanism that also provides a module to record the necessary information. Additionally, the system based on the implemented TestBed deals with the following three novel aspects:
- (a)
The detection of an accident with the help of sensed information through appropriate sensors where an algorithm has been developed to gather and monitor the required information. Based on the sensed information, it performs the logical computation to detect the accident. Once it is detected, it generates an alert message. This article includes the details of data processing of the accident detection module in a practical manner. Additionally, the contribution is presented through a flow chart of the proposed system to detect an accident correctly and in a timely manner.
- (b)
The second module is used to identify the location of the accident and medical service nearby. It then notifies the hospital not only about the condition of the person but also about the severity of the event based on the damage. Moreover, it stores useful information about the incident for future use.
- (c)
The third part deals with the hospital module, which not only sends the ambulance to the incident location on emergency alert, but also gathers the passenger’s status like injuries, deaths along with medical proof of alcohol and personal details like name, age, and the number of passengers, etc. This information is then sent back to another module for future use.
The second procedure deals with the analysis of stored information like the location of accidents, reasons for accidents, injuries and death statistics of the accidents that occurred in the specific region to find the reasons for accidents. The system is tested in a lab environment, and, for this, we used a library that generates data on ‘a’ and ‘c’ module mentioned in procedure-1. Then, that data are transferred using the implemented system (TestBed) and analyzed using visualization techniques. Moreover, we took the recorded realistic data of a city and we generated graphs using our proposed system to analyze the reasoning. As far as the visualization part is concerned, it enables the authorities to make proper decisions to tackle the incident and to take admissible precautions. Additionally, for the visualization part, raw data have been converted into information by passing it through the proposed system that has been developed in the Lab as a TestBed. Therefore, one of the contributions of this work is that it has created a meaningful visual output using raw data at the Cloud.
In brief, our proposed work shows great potential for practical and scientific applications. It provides a platform to test and validate the algorithms designed and developed for a vehicular environment working in an ad hoc fashion. This research work is useful for the scientific society in various ways based on the required goals and objectives of the designed applications. Since the proposed research work is applied in a vehicular environment, it is used to represent real-time statistics of an emergency system for automatic accident detection along with the road accident statistics in different regions. It is useful for the scientific society, as it shows the round-trip-time with reference to the number of hops along the route from source to destination. The society may also take advantage of knowing about the reliability factor in terms of packet delivery ratio based on the hop count value along the route within the network. Moreover, it might be helpful for the scholars and the scientific society to relate delay (latency) for emergency messages based on the characteristics of a network.
The rest of the paper is organized as follows:
Section 2 discusses similar solutions to automatically detect road accidents, its management and data analysis of road accidents.
Section 3 discusses the proposed framework to solve the identified problems of increasing road causalities due to road accidents. Furthermore, it includes details of the designed application and the hardware used in development. It also gives an overview of system implementation.
Section 4 discusses the validation of the system and the results. Additionally, it presents the data visualization of a road accident to highlight the major reasons for the accidents, discussed in
Section 4.4, which shows the importance of recorded data and visualization. Finally,
Section 5 concludes the work.
2. Literature Review
The systems that detect and notify about road accidents have been designed and developed for a very long time and have been studied well by the community of engineers and scientists [
4,
10,
11,
12]. In recent years, the applications based on an Intelligent Transport System (ITS) [
13] are becoming more data-intensive and ITS-based devices connect to the cloud computing centers to perform data processing using an Internet of vehicles (IoV) [
14]. However, such a system might create an overhead and bottleneck, when forwarding big data from geographically distributed devices, which ultimately consumes the network resources. There is another technology that reflects the role of cloud computing, which is Fog technology. This is used to distribute the processing capability to the edge of the network. This may result in a faster response to ITS application queries and may save the network resources. However, considering the dynamic environment of IoV, implementing Fog computing for real-time big data processing along with the lambda architecture is challenging [
15]. A cloud-based system proposed in [
16] provides the functionality to process the values of the real-time average speed of the vehicle to detect accidents. The system also helped to provide medical assistance and predict the severity of an accident. The major reason that has not been handled in this system was its feasibility in several scenarios.
In an emergency response system, replying in time is the most important factor, as discussed in [
17]. In this regard, an “Emergency Help Alert Mobile Cloud” (E-HAMC) has been proposed that has provided several functionalities for resource-constraint IoT devices including task off-loading and has provided latency-sensitive services as preprocessing. Here, the contact numbers of the authorities were stored and intimated appropriately when an emergency occurs. The edge and cloud functionalities were used to provide the services to automatically transfer the emergency information based on the extended portfolio of the service provider. The same application has been extended with the functionality of providing a refined location-mapping by using geographical coordinates of the location of the event. Additionally, a street-view feature along with the identification of available routes to the nearest hospital for quick medical aid have been provided. It has been shown that the overall delay can be reduced by incorporating Edge technology to the already available cloud and IoT resources based on its successful implementation. However, one major disadvantage of the system was its dependency on the smartphone. Here, someone or the victim is asked to take the picture of the emergency event or an accident, which is sent to the edge node automatically. Therefore, it is not a feasible solution as a real-time application to be dependent on the victim or the nearby person of the accident due to multiple reasons. The first and foremost reason is that the victim might not be in a better physical or mental state to use his/her phone to take a picture, and it is quite possible that, in the location where an accident took place, there is no other bystander available to take a picture. Furthermore because of the severe accident, the mobile phone or any other device with the capability of capturing the images might be damaged or destroyed. As it was completely dependent on the smartphone, which can also be out-of-battery, it is therefore not a worthy system in such a situation.
In addition to the aforementioned issues of the available approaches in the literature, one of the major and quite visible problems in the existing system is that they don’t consider the functionality of the system beyond accident detection and notification. It is important to store the information of such events and related stuff related to the incident for the authorities in order to act with the required equipment, and such data can be used to make good decisions in order to minimize future road accidents. Therefore, the solution should not only restrict itself to acquiring the data, but it also requires acquiring the data in a timely manner and then processing the information using Edge and Cloud computing technologies. However, it should also be able to provide real-time visualizations of this information. Such functionality might be useful for the authorities and the rescue professionals to prevent road accidents in a more efficient and effective manner.
3. Proposed System
The overall functionality of the proposed system is alienated into two sub-tasks: the first part enhances the module to record information e.g., the number of commuters inside the vehicle and their state as a result of the accident to our previously developed system [
4]. The second part compacts with the analysis of stored data like location of accidents, reasons for accidents, injuries and death statistics from the accidents that happened in a specific region to find an explanation of the accidents.
An application was developed and tested in [
4] to detect accidents automatically, and provide quick emergency services to the victims, which had the following characteristics:
instant detection of accidents automatically (without the involvement of any human)
precise identification of the position of an accident,
endowment of an exact and well-timed medical facility.
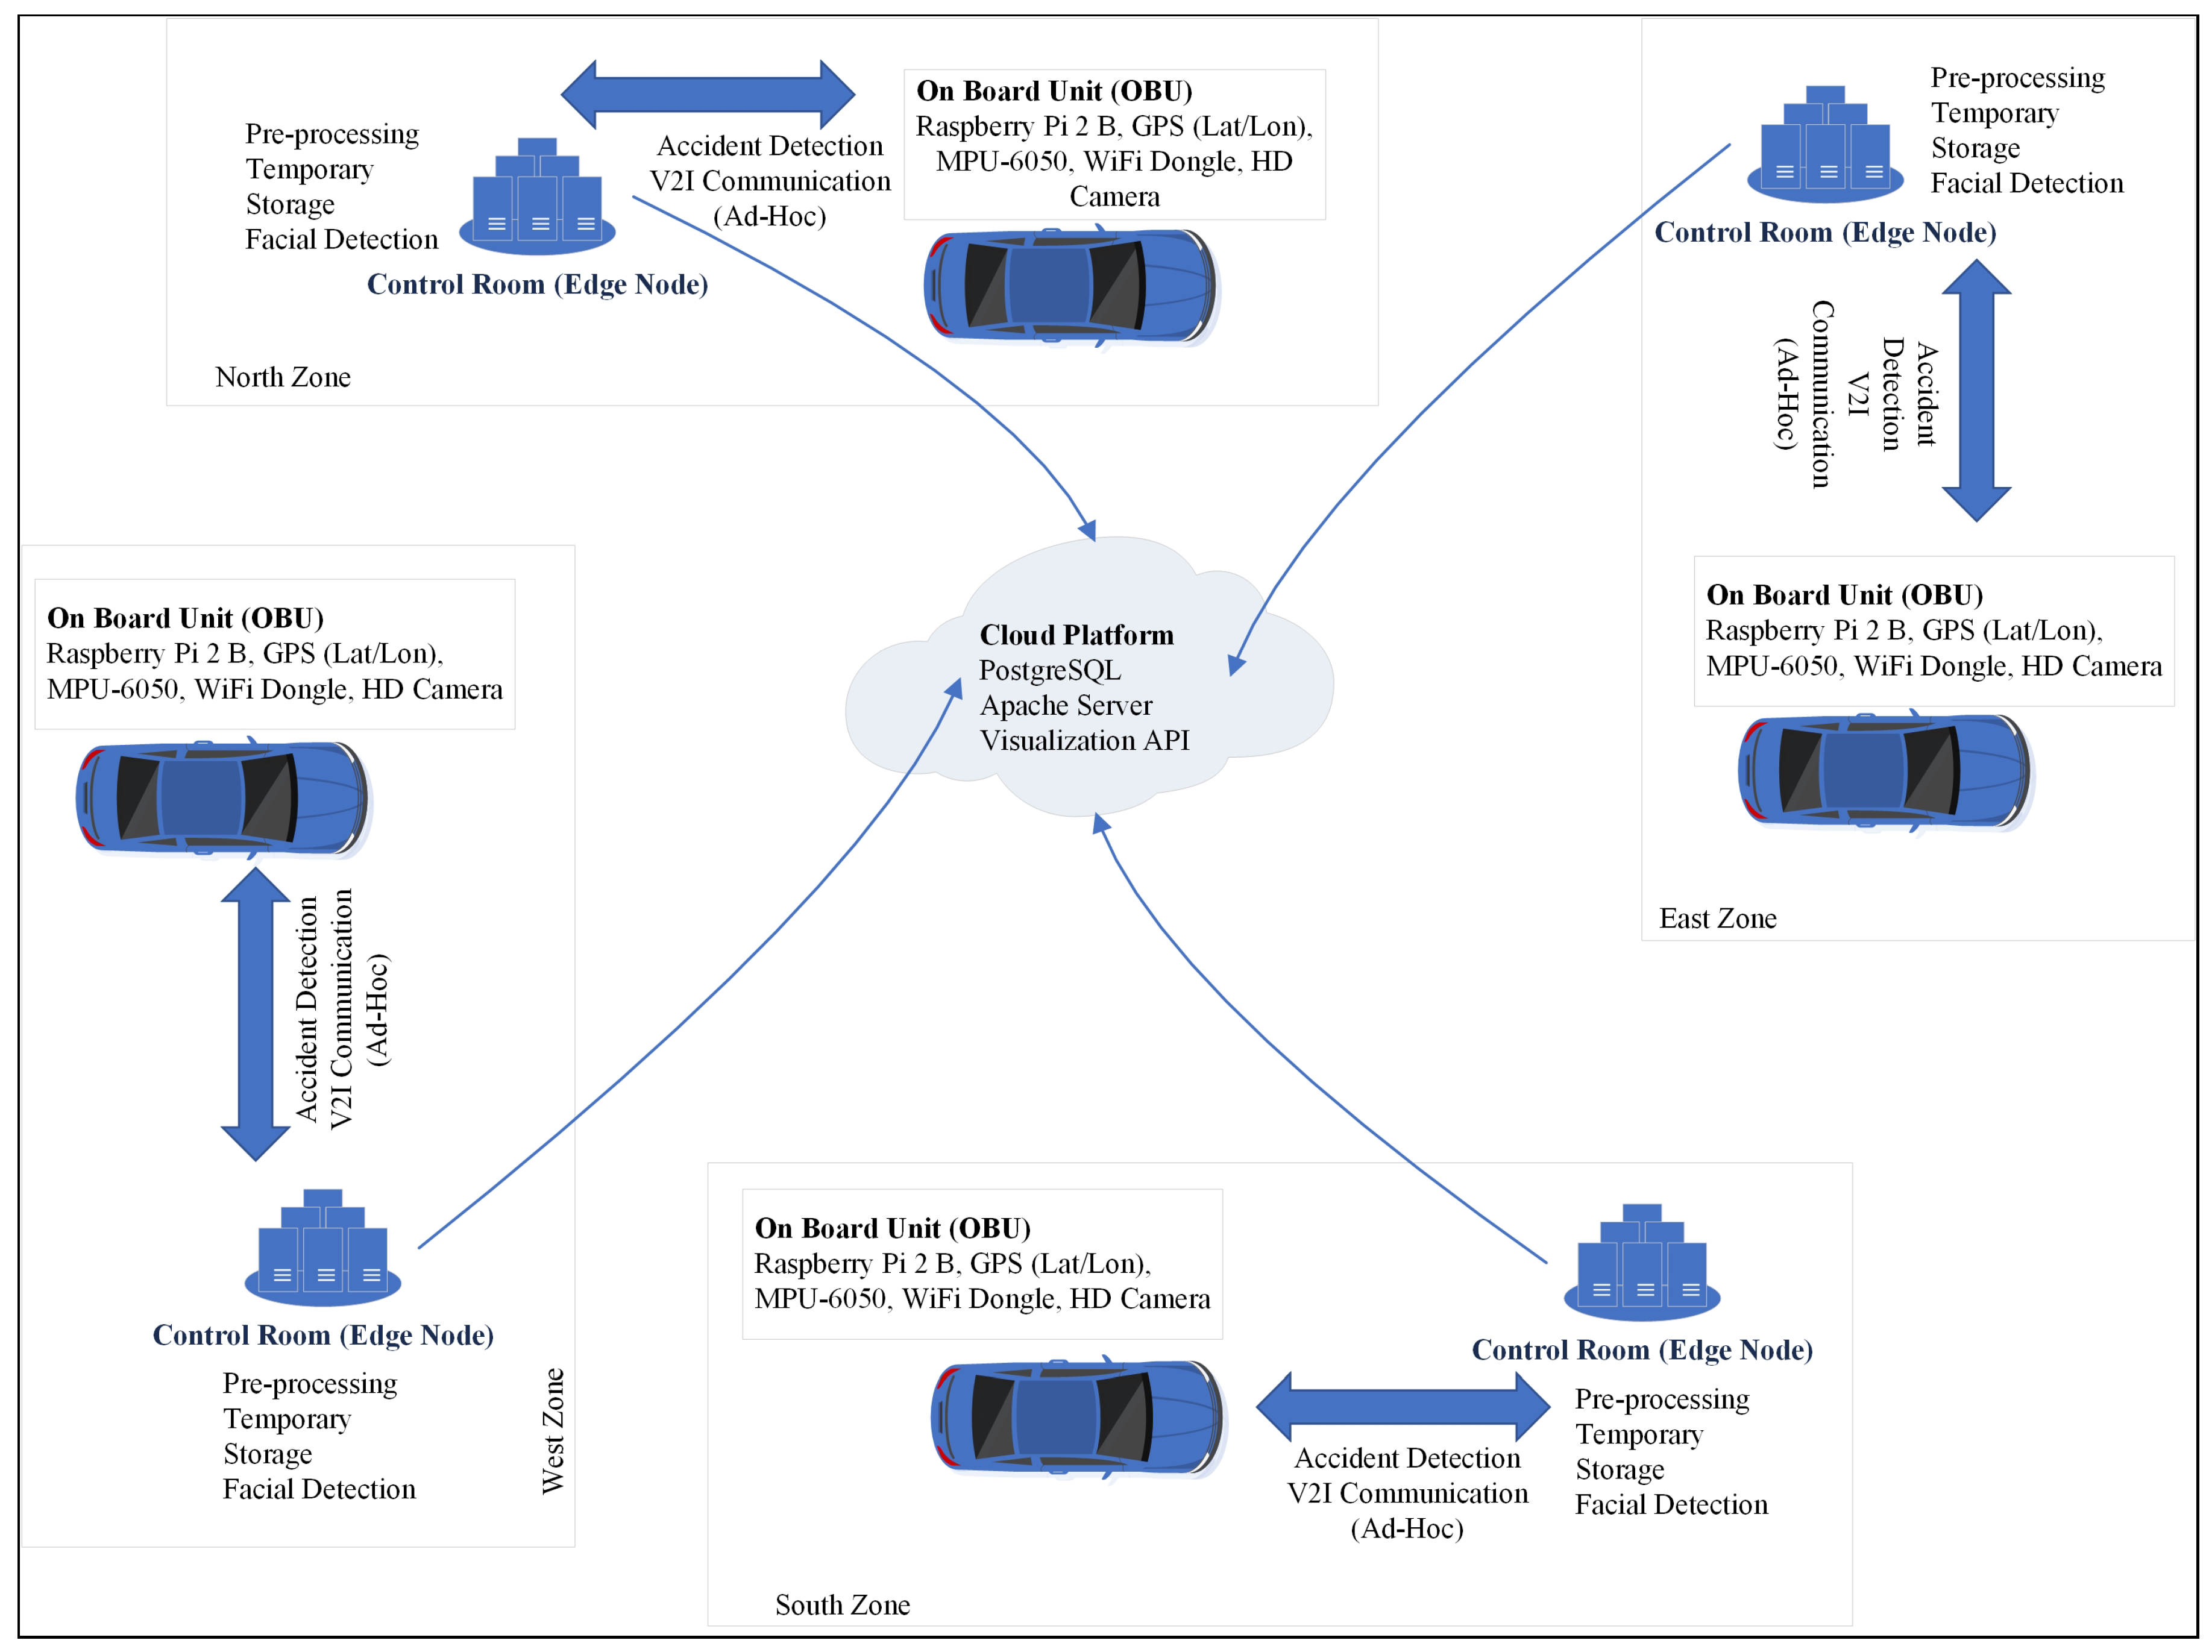
To gather precise and complete information on road crash incidents, another novel system architecture is designed and implemented. It sends gathered information to the relevant authorities like the emergency medical centers or emergency rescue and traffic management departments for additional data processing; another new system architecture is designed and implemented. It is comprised of three tiers, i.e., On-board sensors, IoT or Edge gateway, and Cloud platform as shown in
Figure 3. Each tier controls a specific task.
In each zone of the city, it is assumed that each control room is connected to the cloud platform. Therefore, an Edge node deployed at each control room is responsible for transferring the locally gathered data information (from a particular zone) to the cloud for additional data analysis.
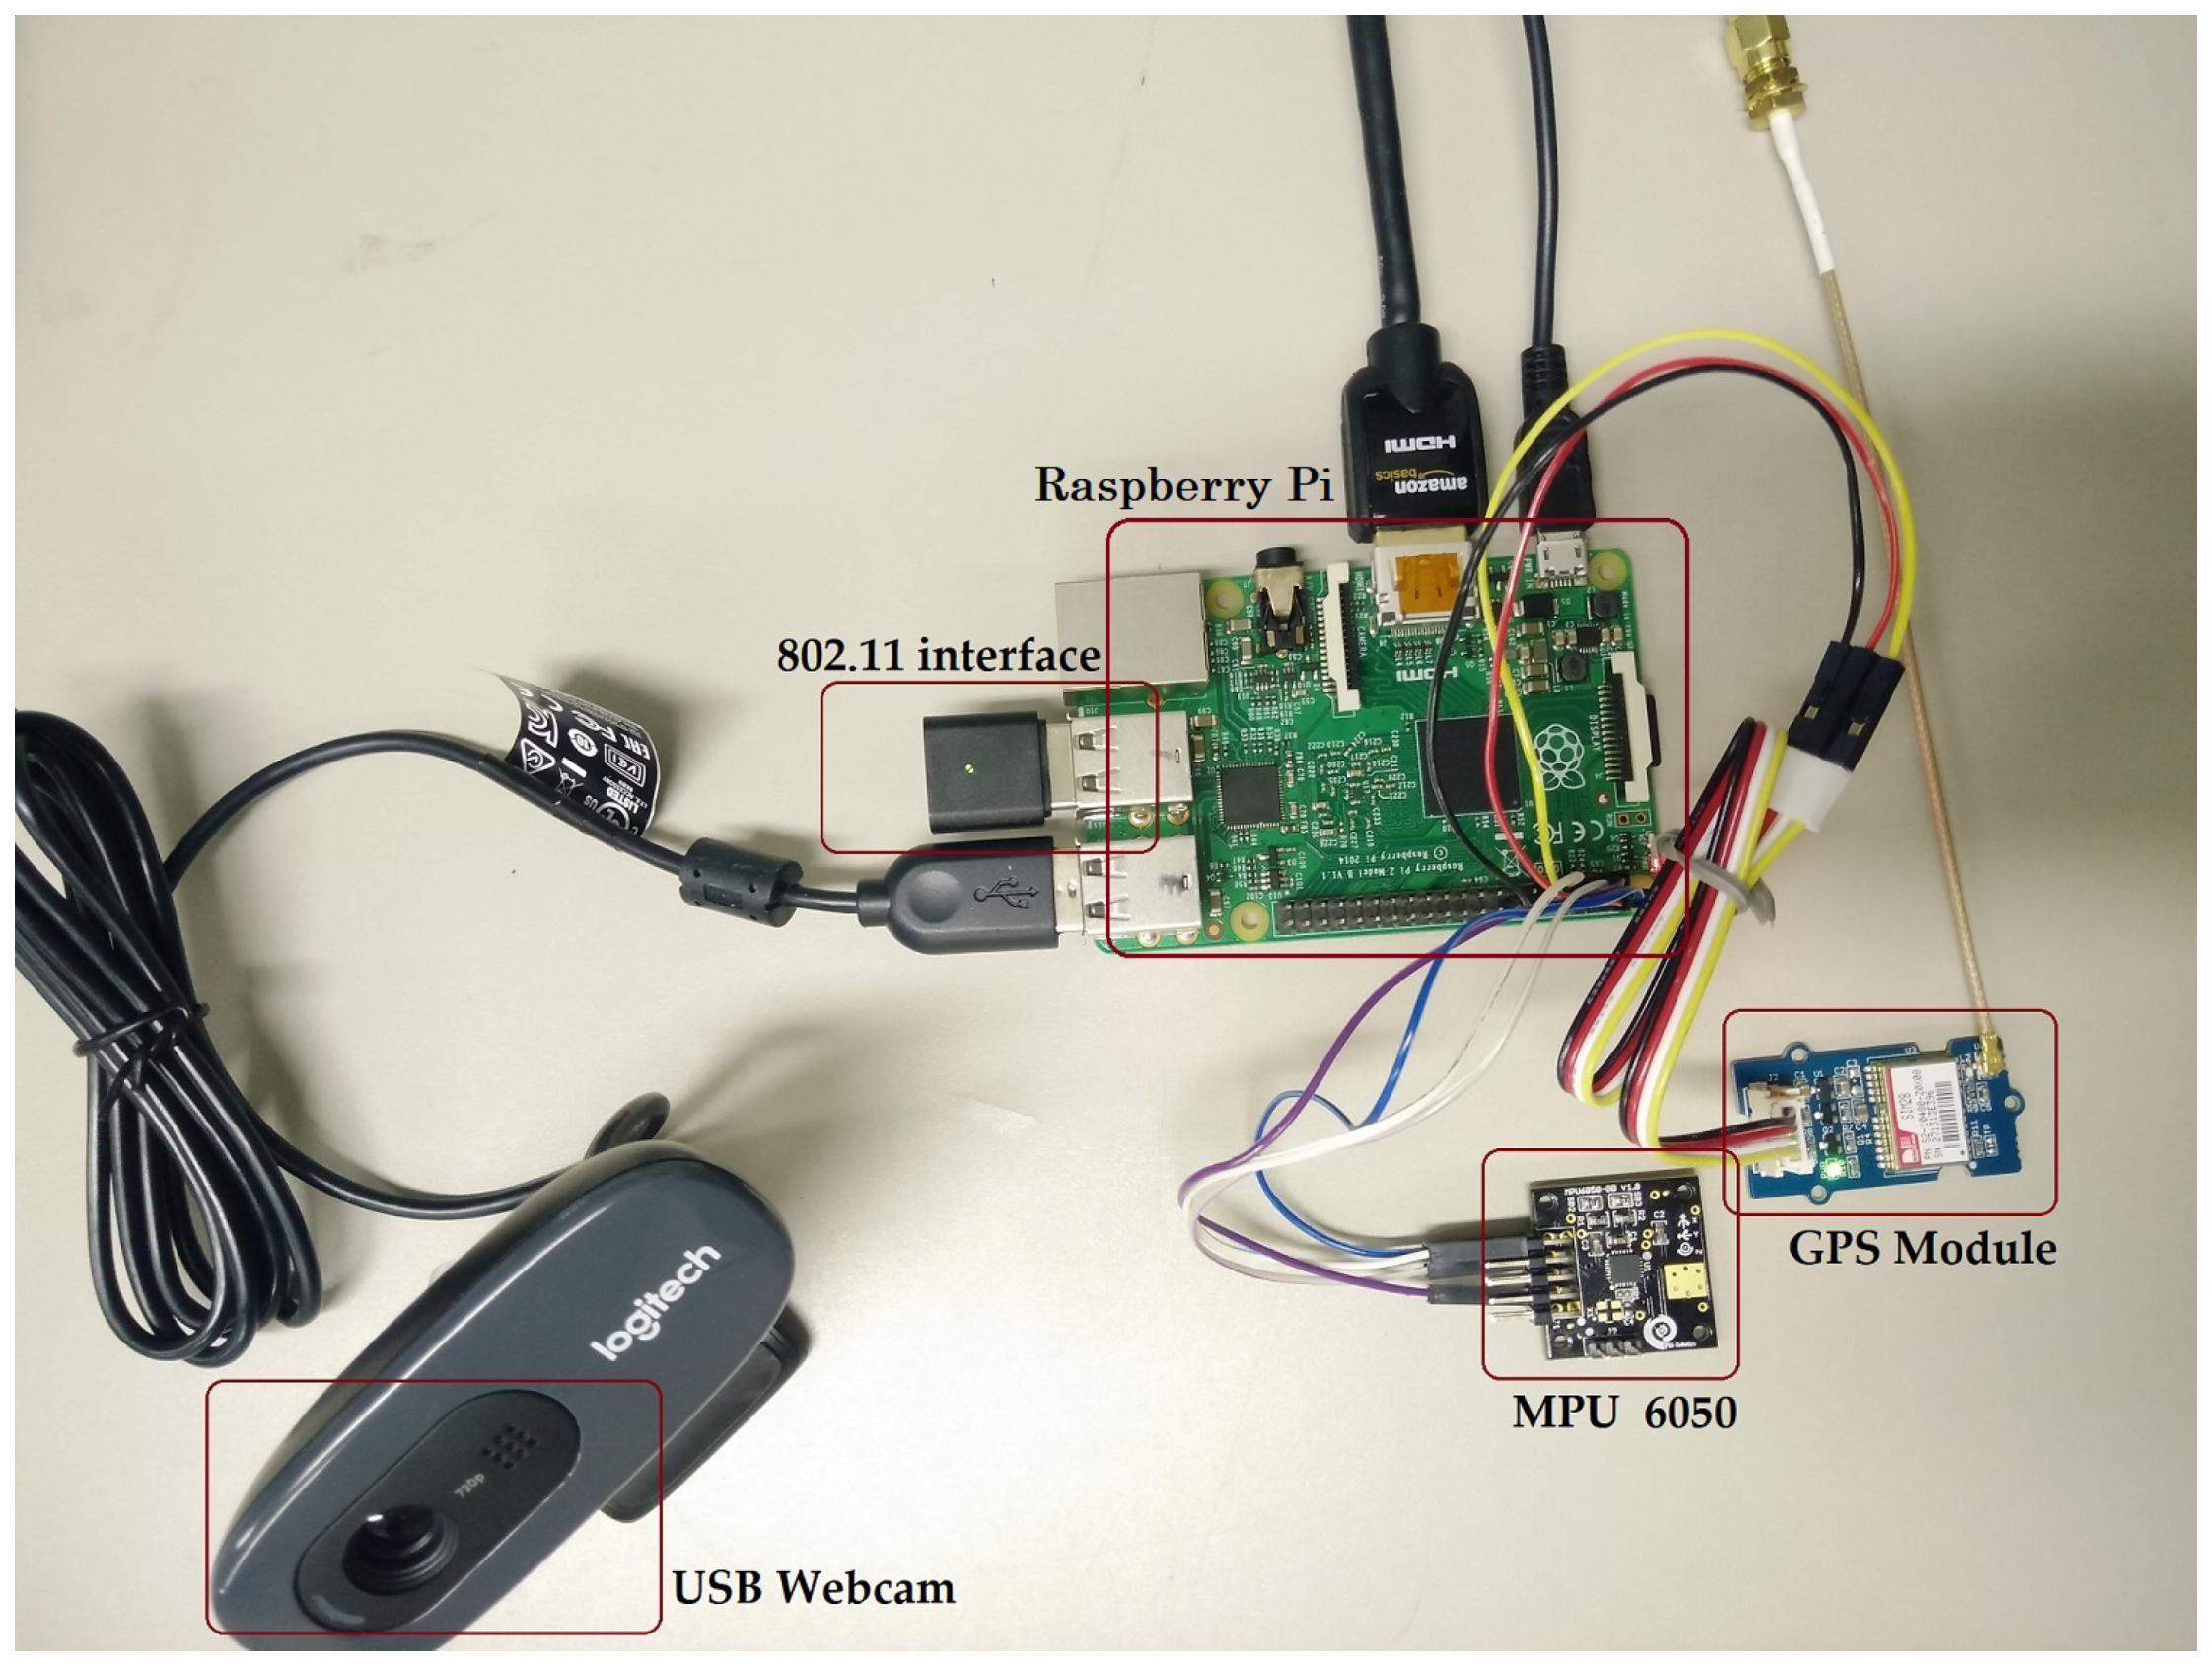
Tier 1: On-board Sensors This tier of the system consists of on-board sensors as shown in
Figure 4. In order to detect accidents, the in-vehicle OBUs constantly monitor the acceleration and orientation of the vehicle. When an accident happens, the most essential data, i.e., the date and time, the geographical location (latitude and longitude), the chassis number, and the inside temperature of the vehicle, are sent to the nearby Edge node.
Tier 1 is responsible for handling two main phases: firstly, automatic accident detection and emergency alert and, secondly, accident management as presented in
Figure 5. The proposed system architecture is deployed in each particular zone as depicted in
Figure 3, where it is handled independently in each zone. However, data are recorded in the control room of each zone, which is transferred via an Edge node deployed in each zone and further handled at the cloud. Each vehicle in a particular zone of the system is equipped with an OBU, where Raspberry-Pi, GPS, IMU, and camera modules are embedded on it. These modules help to detect the accident, and the processing unit of OBU is used to process the gathered information. When an accident is detected, it generates an alert message to the deployed control room in a particular region using Vehicle-to Vehicle (V2V) communication. The control room records the accidental data and sends an emergency alert to the hospital for the first-aid service (ambulance).
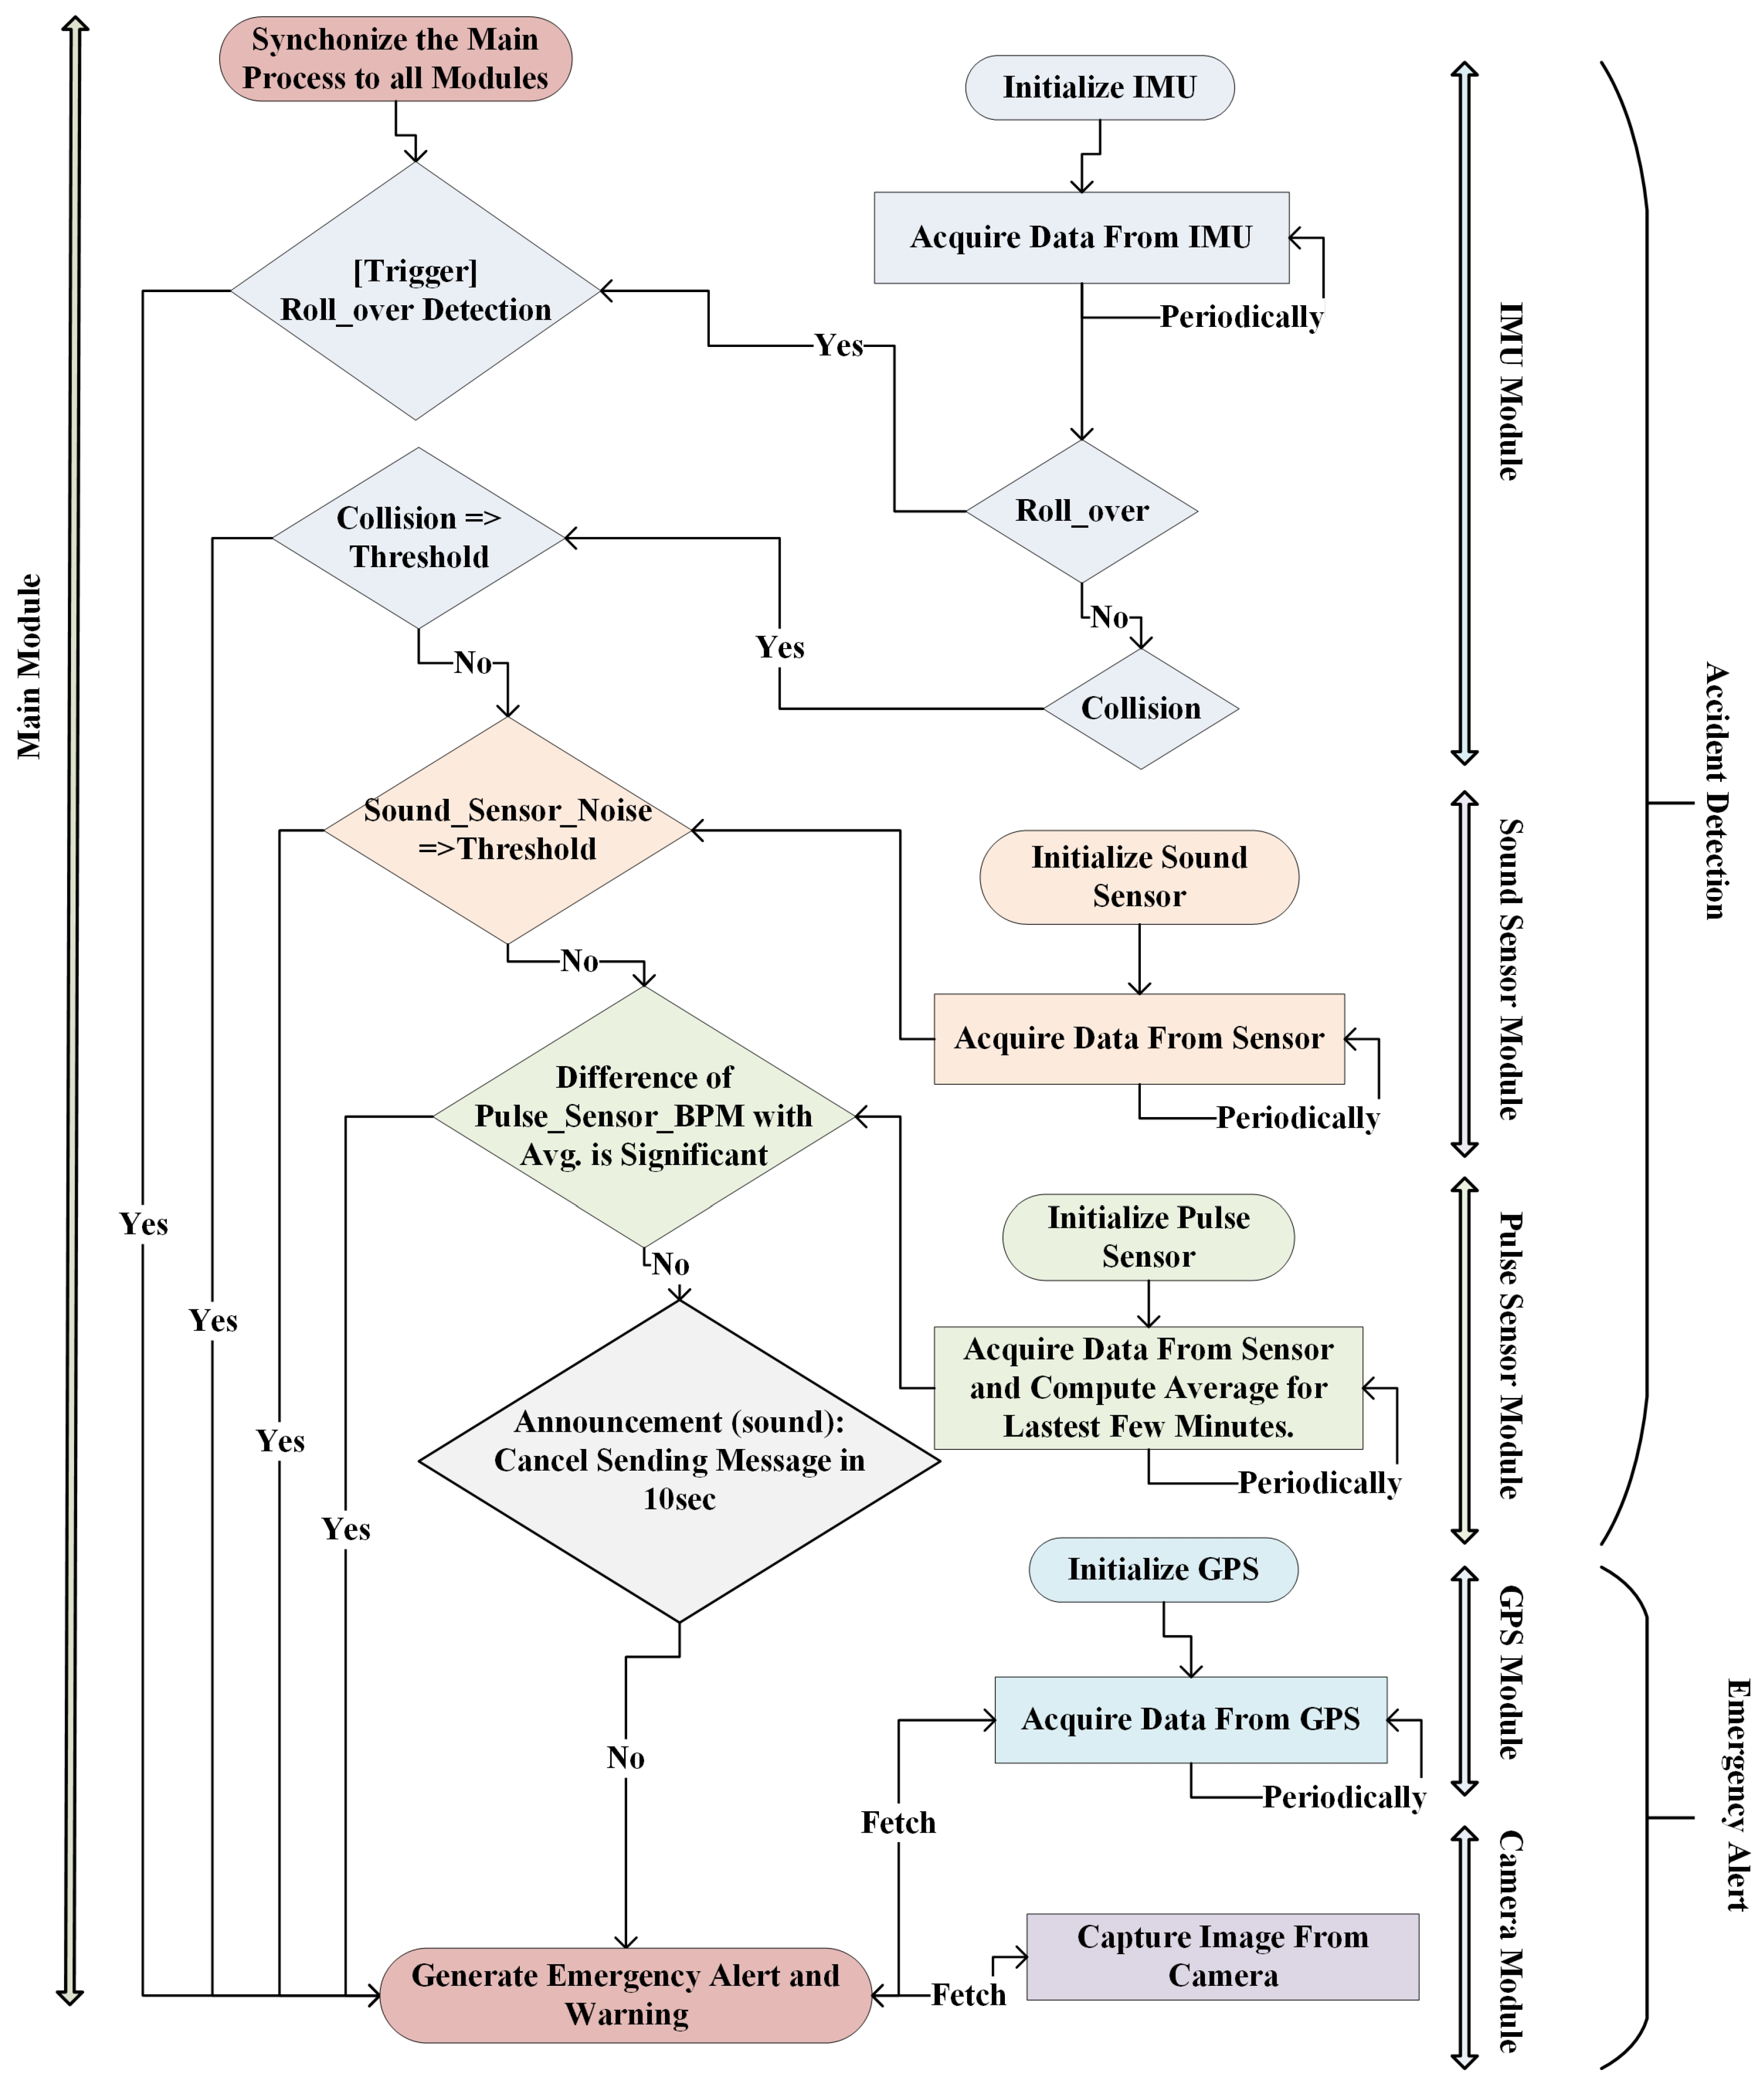
An incident like a road accident could either be a collision with other vehicles or any other object or a rollover. Whenever a collision happens, the speed of the vehicle decreases dramatically, and its acceleration can be measured by the accelerometer. Roll-overs can be detected by monitoring the angular position of the vehicle or by using angular velocities. The angular position of the vehicle is computed by using the data gathered from a gyroscope. In case of a roll-over, an emergency message is generated without incorporating the data from a glass break detector and pulse sensor, due to its severity; however, in case of collision, data from all the sensors are analyzed. The flowchart of the accident module is shown in
Figure 6. It can be seen that all the sensors are initialized and updated at regular intervals. If the collision detection is above the predefined threshold, the emergency alert is sent to the rescue services and to the nearby vehicles. Contrary to this, if the collision detection by the IMU does not exceed the threshold value, then the system will fetch data from the sound sensor. If the sensor circuitry detects a noise greater than the threshold value, then the emergency alert is sent. If there is no noise heard by the sensor circuitry, then the system will take the data from the pulse sensor. If the heart rate is above a certain threshold, then the alert message will be sent; otherwise, an alarm is generated that is usually canceled by the driver in normal circumstances. If the driver does not turn off the alarm, it is assumed that the driver is not in a condition to do so, and again an emergency alert is sent. Location coordinates and image of the vehicle from inside are fetched from the GPS module and camera module, respectively, and then it is enclosed in the emergency message.
When an accident is reported for an emergency service to a hospital, it dispatches an ambulance to the reported location quickly. Because of the incomplete information of the exact situation of the victims and lack of information regarding the number of injured persons, the paramedic staff may find it difficult to make any judgment regarding the first aid services. Instead, the additional information of a specific calamity, a better emergency medical service along with advanced technology support, first aid kits, tools, and medicines can be sent to the victims. Additionally, it would assist with providing timely help to the victims. To cope with it, a high-definition (HD) camera is integrated into the proposed system to capture the instant when the accident occurred. A Logitech HD Universal Serial Bus (USB) C270 Webcam that is capable of capturing 720 pixel, 30 (frames per second (fps)) wide-screen images [
18] was used.
Tier 2: IoT Gateway All of the smart devices are mounted on-board deployed inside the vehicle; therefore, it is more hands-on to handle and process the recorded data at the Edge. In this case, the Edge node is closer to the source of data-generation, rather than at the distant cloud. Additionally, it is not needed to send all the recorded data to the cloud, but just the refined data can be sent, thereby saving network bandwidth. Data packets traversed via relay vehicles in a multi-hop ad hoc network, connecting a Wi-Fi module of an OBU inside the vehicle to other vehicles in the neighborhood. Additionally, this communication is facilitated by an IEEE 802.11n Wi-Fi USB dongle in ad hoc mode. After traversing the whole path leading to the Edge node, the sent data shall be received at the gateway. The IoT node will then perform various tasks assigned to it, i.e., the segregation of received data to extract the useful information, storage of the associated picture, and forward transmission of the processed data. These are further conferred as follows:
Facial Detection: To identify the number of victims inside a vehicle when an accident happens, the facial-detection is acquired from the image encapsulated in the received message using Open Source Computer Vision Library (OpenCV). The state of victims like their position or stature at the time that the misfortune happened would provide helpful actualities, which would be useful for the medical team who will come to the incident. By having such actualities, the first responder can forecast how long the accident victims can endure without any medical assistance [
19].
Data Preprocessing: Sensors deployed on the OBU monitor the required parameters and acquire data when it is needed. To avoid the delay involved, the acquired data are sent to the Edge node. It is highly desirable that the recorded data from the accident location and hospital are processed closer to the edge of the network i.e., control room, before transmitting it to the cloud for long-term storage. There are two advantages; firstly, it will clean the data of any incongruities or bad information beforehand to save network bandwidth, and, secondly, the data will be wrapped in a way that is easier for the end-user at the cloud to interpret. Additionally, it avoids the extra-processing on the recorded data at the cloud. Moreover, provisional storage can be provided for the data at this node before transferring it to the cloud to avoid loss of data due to the dynamic nature of the network between the sensor nodes deployed in the mobile node and the Cloud.
Once the required information is processed close to the Edge node, it is securely cached. Then, the processed information is transferred to the central server at the cloud. In addition, the communication of edge to the cloud platform is based upon Transmission Control Protocol (TCP) because of its connection-oriented nature and reliability. This communication of the edge node from the control room to the central server at the cloud is done using the Internet as the cloud service is universally accessible through the Internet.
Tier 3: Cloud Platform The Central Control Unit (CCU) accepts accident alert notifications and takes appropriate actions. The CCU is responsible for data retrieval from the received data packets. Additionally, it provides data storage and handles visualization with the help of a front-end tool, also installed on the Cloud.
To test the implemented system on the cloud, a testbed is needed. A Testbed requires an Infrastructure as a service (IaaS) model, but, to the best of our knowledge, none of the former stated commercial service providers seemed to select it as a practical option. Consequently, a private cloud is used to implement and test the designed proposed system. The commercial cloud computing services are mostly used by start-up businesses or medium-sized enterprises to cut the costs of building their own applications, hosting on third party web-servers and maintenance. Therefore, a web server application called Apache is used to build a personal web server on a Linux-based operating system. Apache can serve HTML (HyperText Markup Language) files over HTTP (HyperText Transfer Protocol) on its own and can serve dynamic web pages using scripting languages such as PHP (Hypertext Preprocessor), with the help of additional modules. The data collected from the sensors in the Testbed may provide insightful information about the occurrences of accidents over time, in different parts of the region. Over time, when an accident occurs, its location may be identified, and effective preventive measures may be worked out, to at least lessen their occurrences, if not to completely get rid of them. In case strong preventive measures appear to be hard to implement, then at least the emergency services like ambulances and paramedic staff can be stationed nearby by identifying high-risk accident locations for the rescue operation.
Simple and rather structured data representing concrete values of accident events are acquired by the sensors. To make a comprehensive and easily-understandable analysis of this data, an open-source Relational Database Management System (RDBMS) was used with PostgreSQL for data management. PHP is used for server-side scripting so that the relevant personnel administrating the CCU is able to customize the response according to their needs, and conveniently interact with the database.
System Implementation
The proposed system is implemented by dividing it into two tasks. The first is to create a system that automatically detects and notifies about traffic congestion in a timely manner to suppress the number of casualties, by giving prompt medical aid to the victims of the road accident. The second is to analyze the recoded data to distinguish the accidents and the regularity or the irregularity of the event, their reasons, and particular area of casualty, which help to assist the activity specialists in formalizing the traffic rules to decrease the deaths on the road. We implemented this system in the laboratory. To cope with the first task, i.e., automatic accident detection and emergency notification to the control room, the successive occurrence of events is as follows:
The accident detection module detects an accident event with the help of IMU MPU6050 and the OBU takes geographical information (latitude and longitude) from the installed GPS sensor of OBU. This way, the system serves as a “black box” that can help to indicate the location of an accident, cf., in
Section 3.
When an event of an accident is detected successfully, the camera module of the system takes an image of an inner view of the vehicle involved in the crash. The acquired data information is transferred to the control room where an Edge node is deployed to handle particular data as discussed in
Section 3 Tier 1. It helps in providing the inner view of the vehicle for crucial situational awareness of the victims.
The pre-processing of the data, like identifying the number of victims via facial detection, useful data extraction and sorting, is handled at the Edge node. It also handles the temporary storage of data. Meanwhile, the server in the control room sends an emergency alert to a hospital close to the accident as discussed in
Section 3 Tier 2.
Upon reception of an alert, the hospital dispatches an ambulance along with the medical team to the location of an accident. The paramedical staff is responsible for providing first-aid to the victims at the accident location and bringing them to the medical centers, if necessary.
The information of the accident location, details of the vehicles including drivers and the status of victims are important for the traffic department. Therefore, the traffic department carries out its standard protocol and acquired useful data about the accident and the driver credentials.
Finally, the aggregated data information is recorded into the central database at the cloud platform. The recorded data can be retrieved for the desired accident information whenever it is needed. The implementation of this process is done at Tier 3 of the proposed system architecture, cf.,
Section 3 Tier 3.
In order to present a Proof of Concept, a hypothetical set of data has been generated. A Python library called Faker generated the driver credentials and the causes of these accidents. The purpose is to test the visualizations against a structured set of data. A client-side application is created with HTML, a standard markup language, used for creating web pages and web applications. PHP is used to carry out server-side interaction with an API (Application Program Interface) called Google Charts for the front-end visualization.
After successful implementation of the proposed system architecture in one region, the same procedure can be replicated in other regions. All of the recorded data from all the regions where the accident data were initially recorded locally are then transferred to the cloud using an Edge node for further processing of the stored data. To check the feasibility of the developed system, its implementation is tested in the laboratory. The accident situation was introduced manually, and, after that, the emergency alert message was disseminated in an ad hoc network via neighboring vehicles. For this purpose, an ad hoc network is deployed and configured using Robot Cars cf., [
20,
21].
4. System Validation and Results
To validate the developed system, we acquired the results for accident detection and emergency alert notification. Additionally, the system has been analyzed for packet delivery ratio and delay.
4.1. Accident Detection Phase
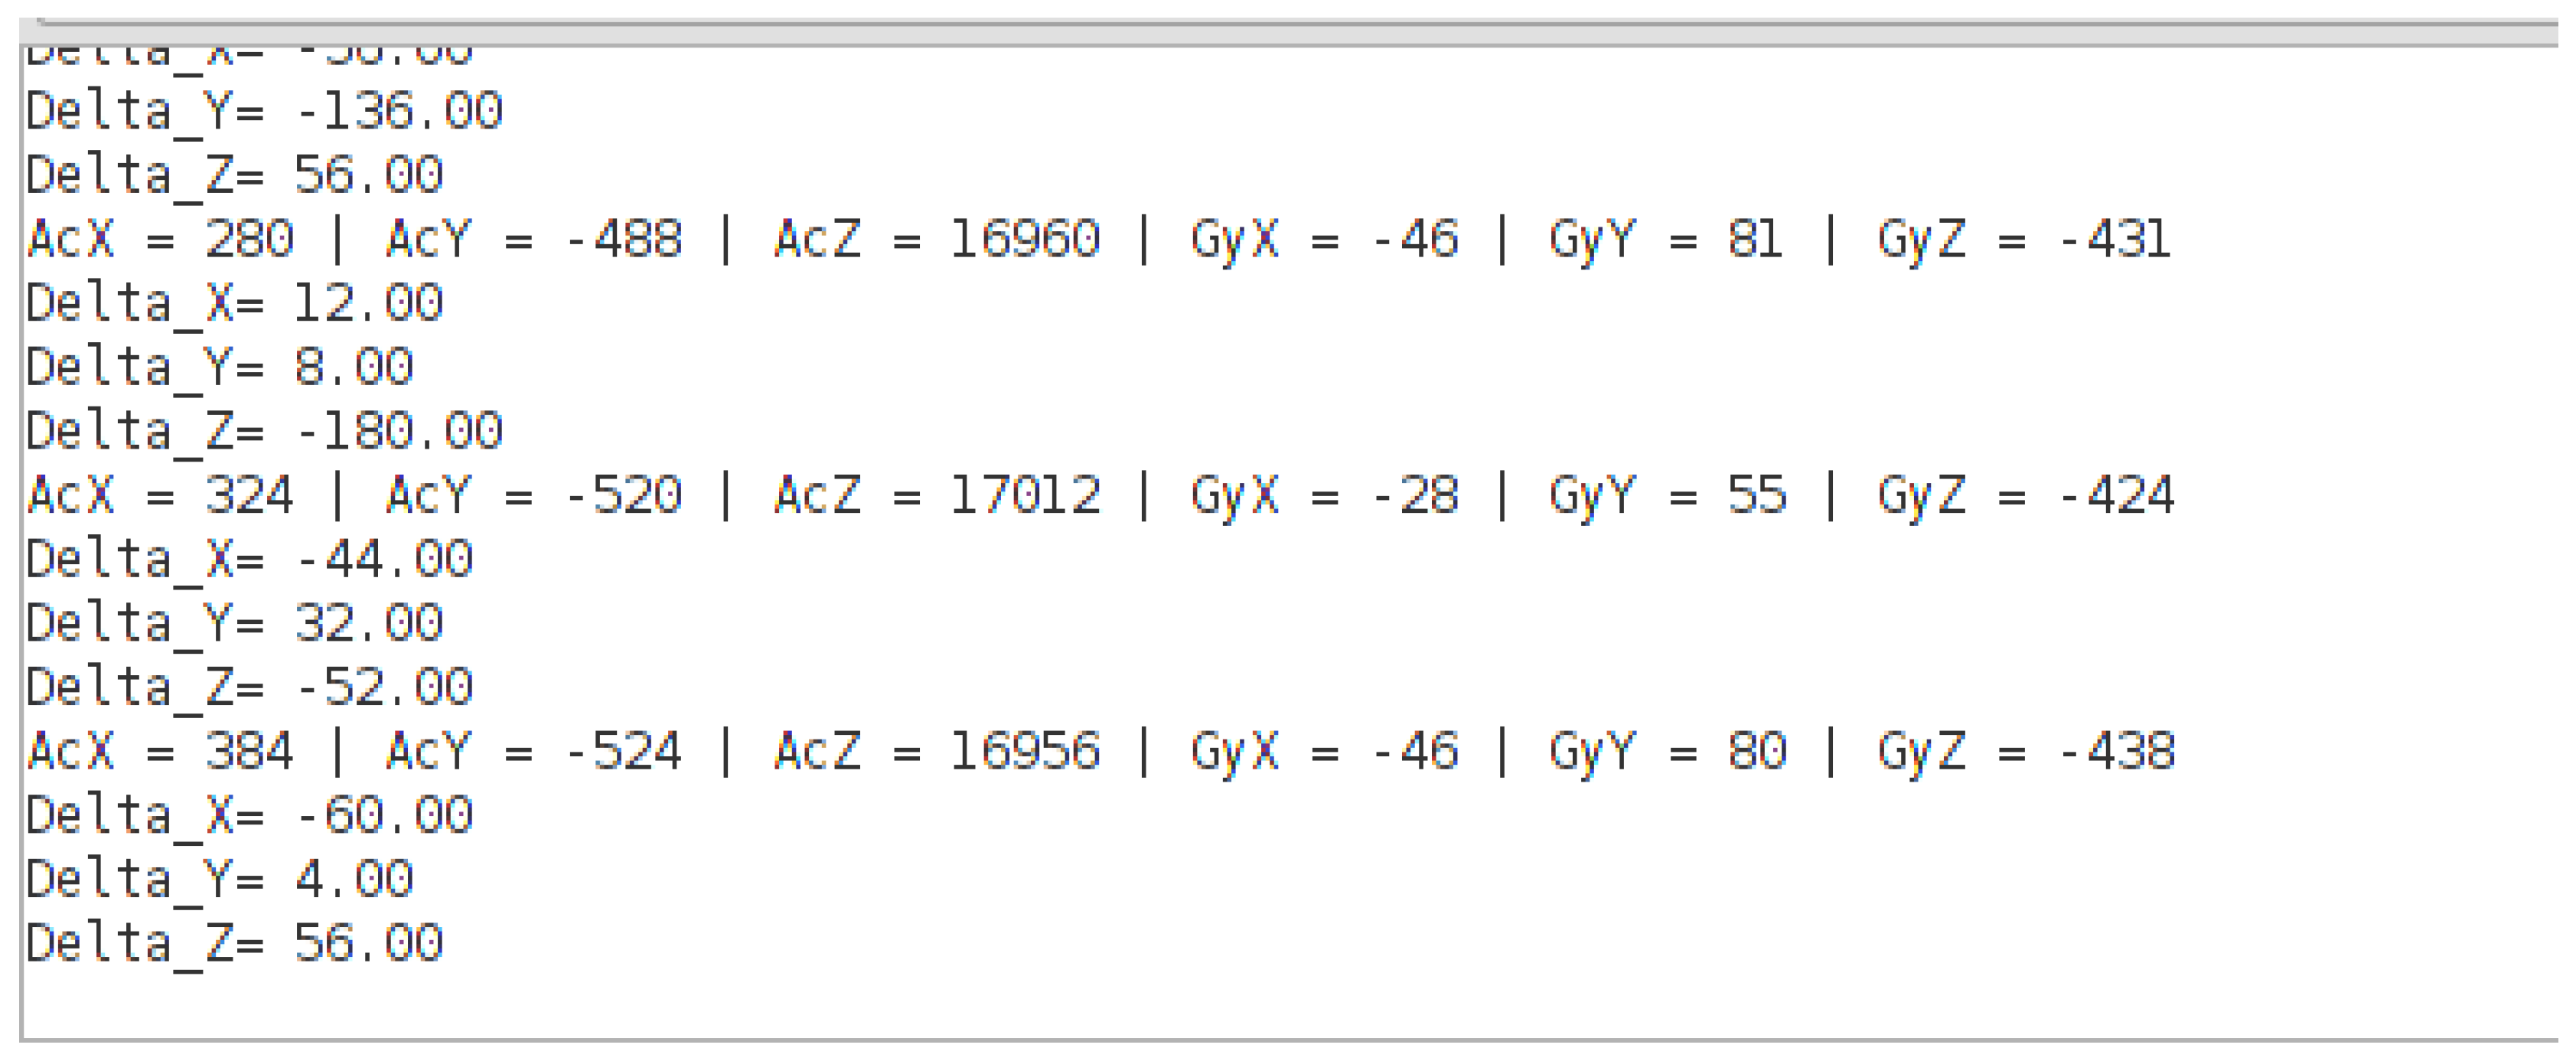
It includes the test results of the implemented system to validate its ability of accident detection. The system is able to detect events of collisions and roll-overs. In
Figure 7, the values obtained from accelerometer and gyroscope with
,
,
and
,
and
. Here,
,
and
denote the difference between two consecutive values that are obtained from an accelerometer i.e.,
with
. These values are taken after every
s in order to detect an accident.
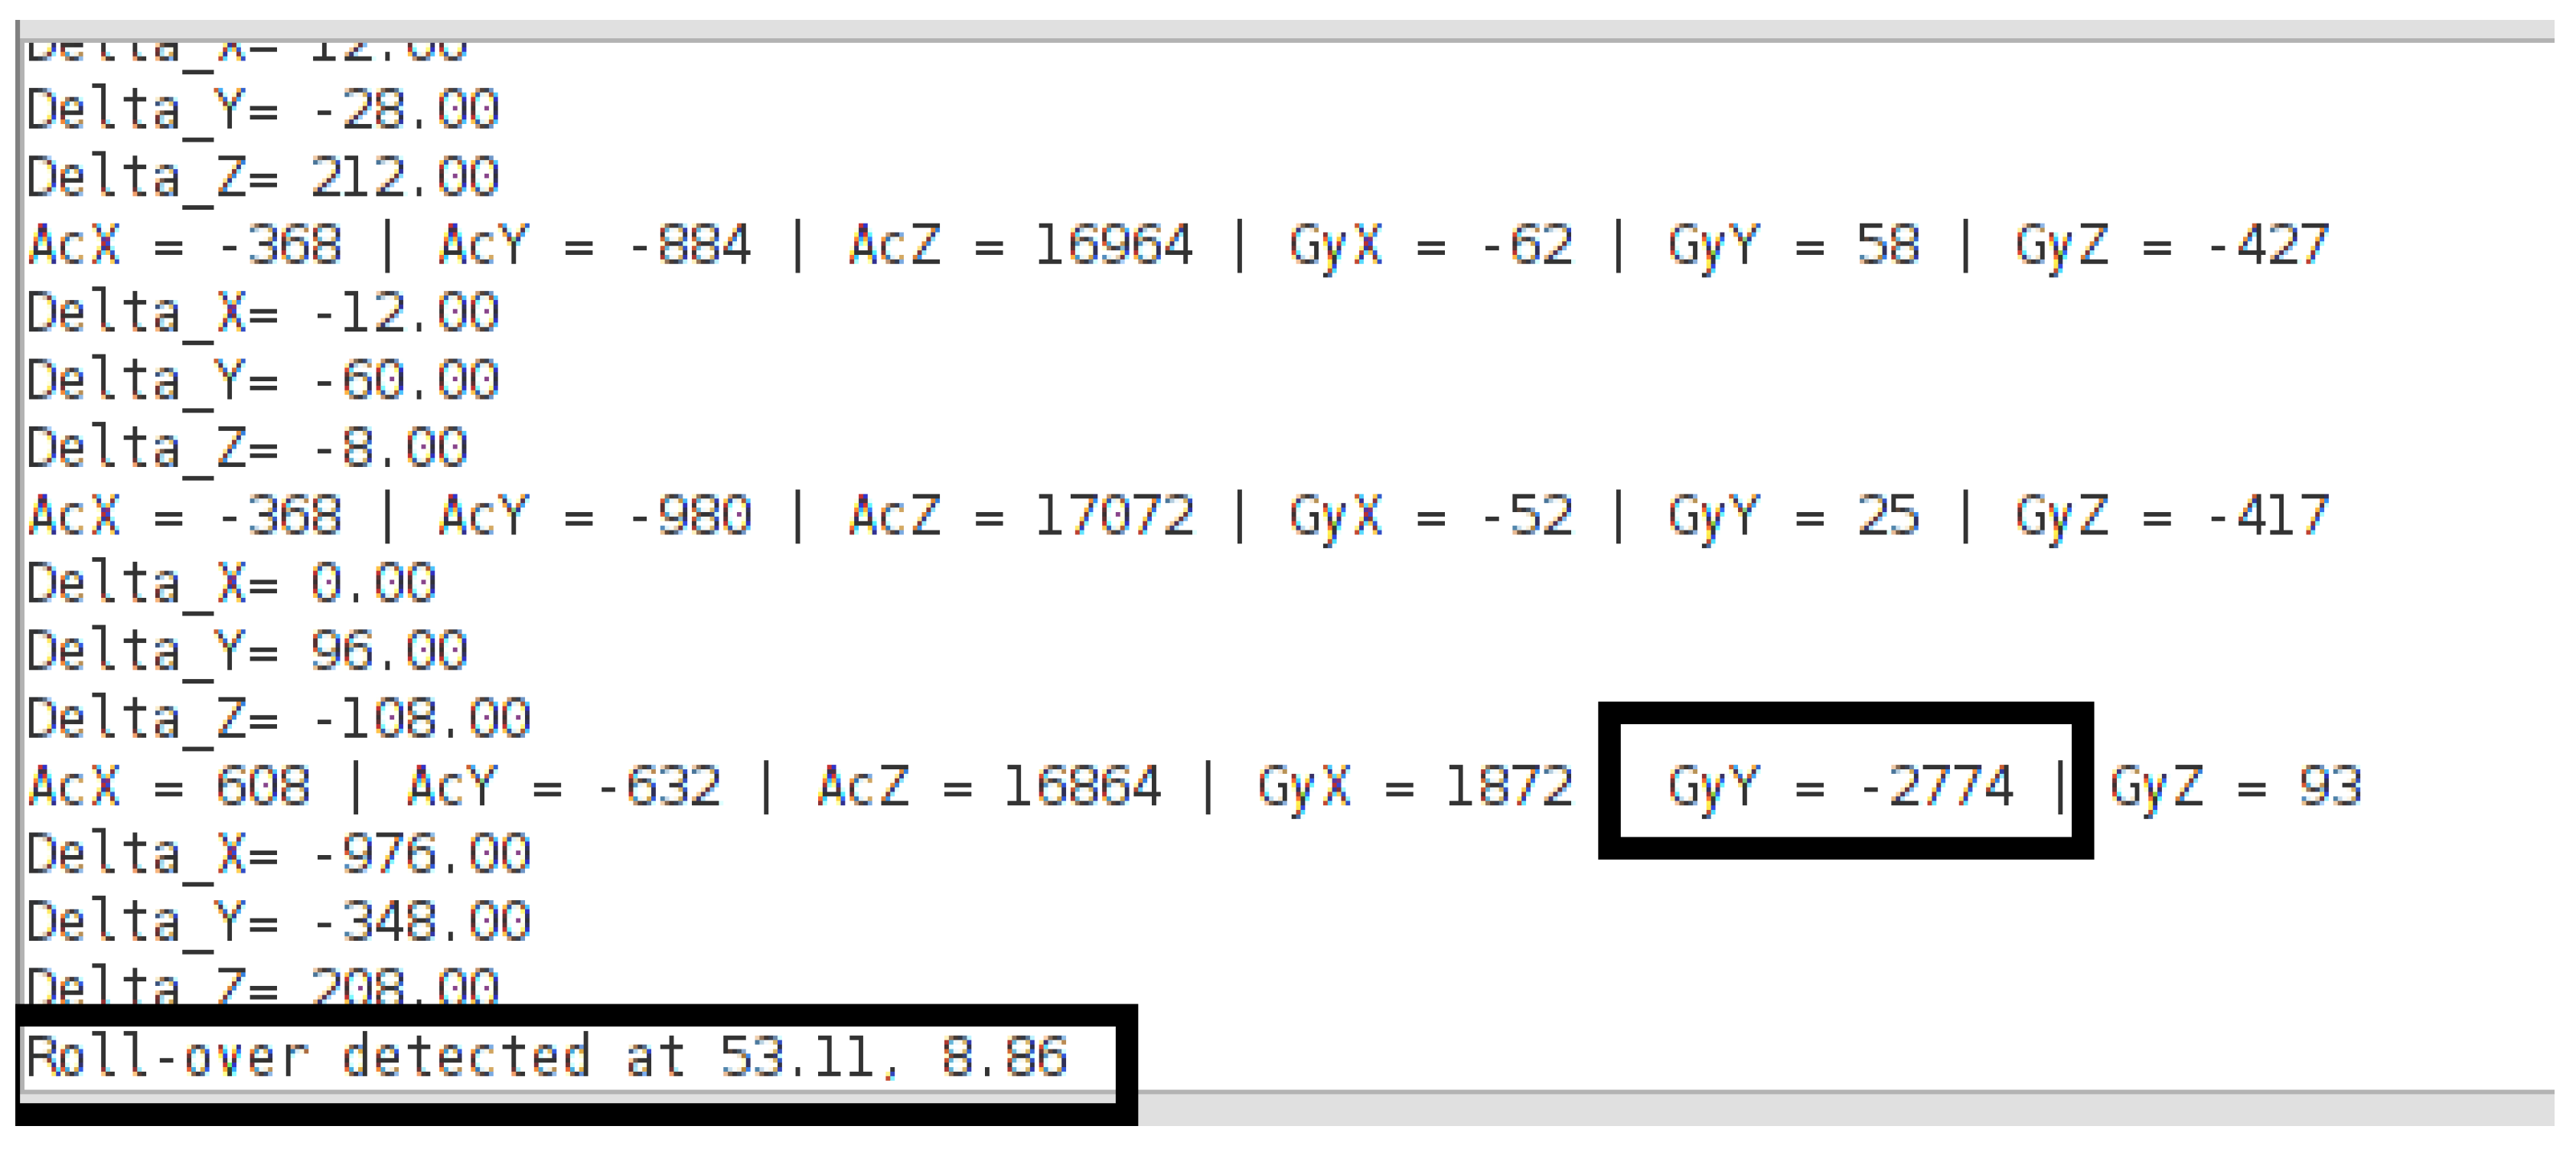
The roll-over is detected using the angular velocity. If the value of angular velocity exceeds a predefined threshold i.e.,
, a roll-over is detected as it is presented in
Figure 8.
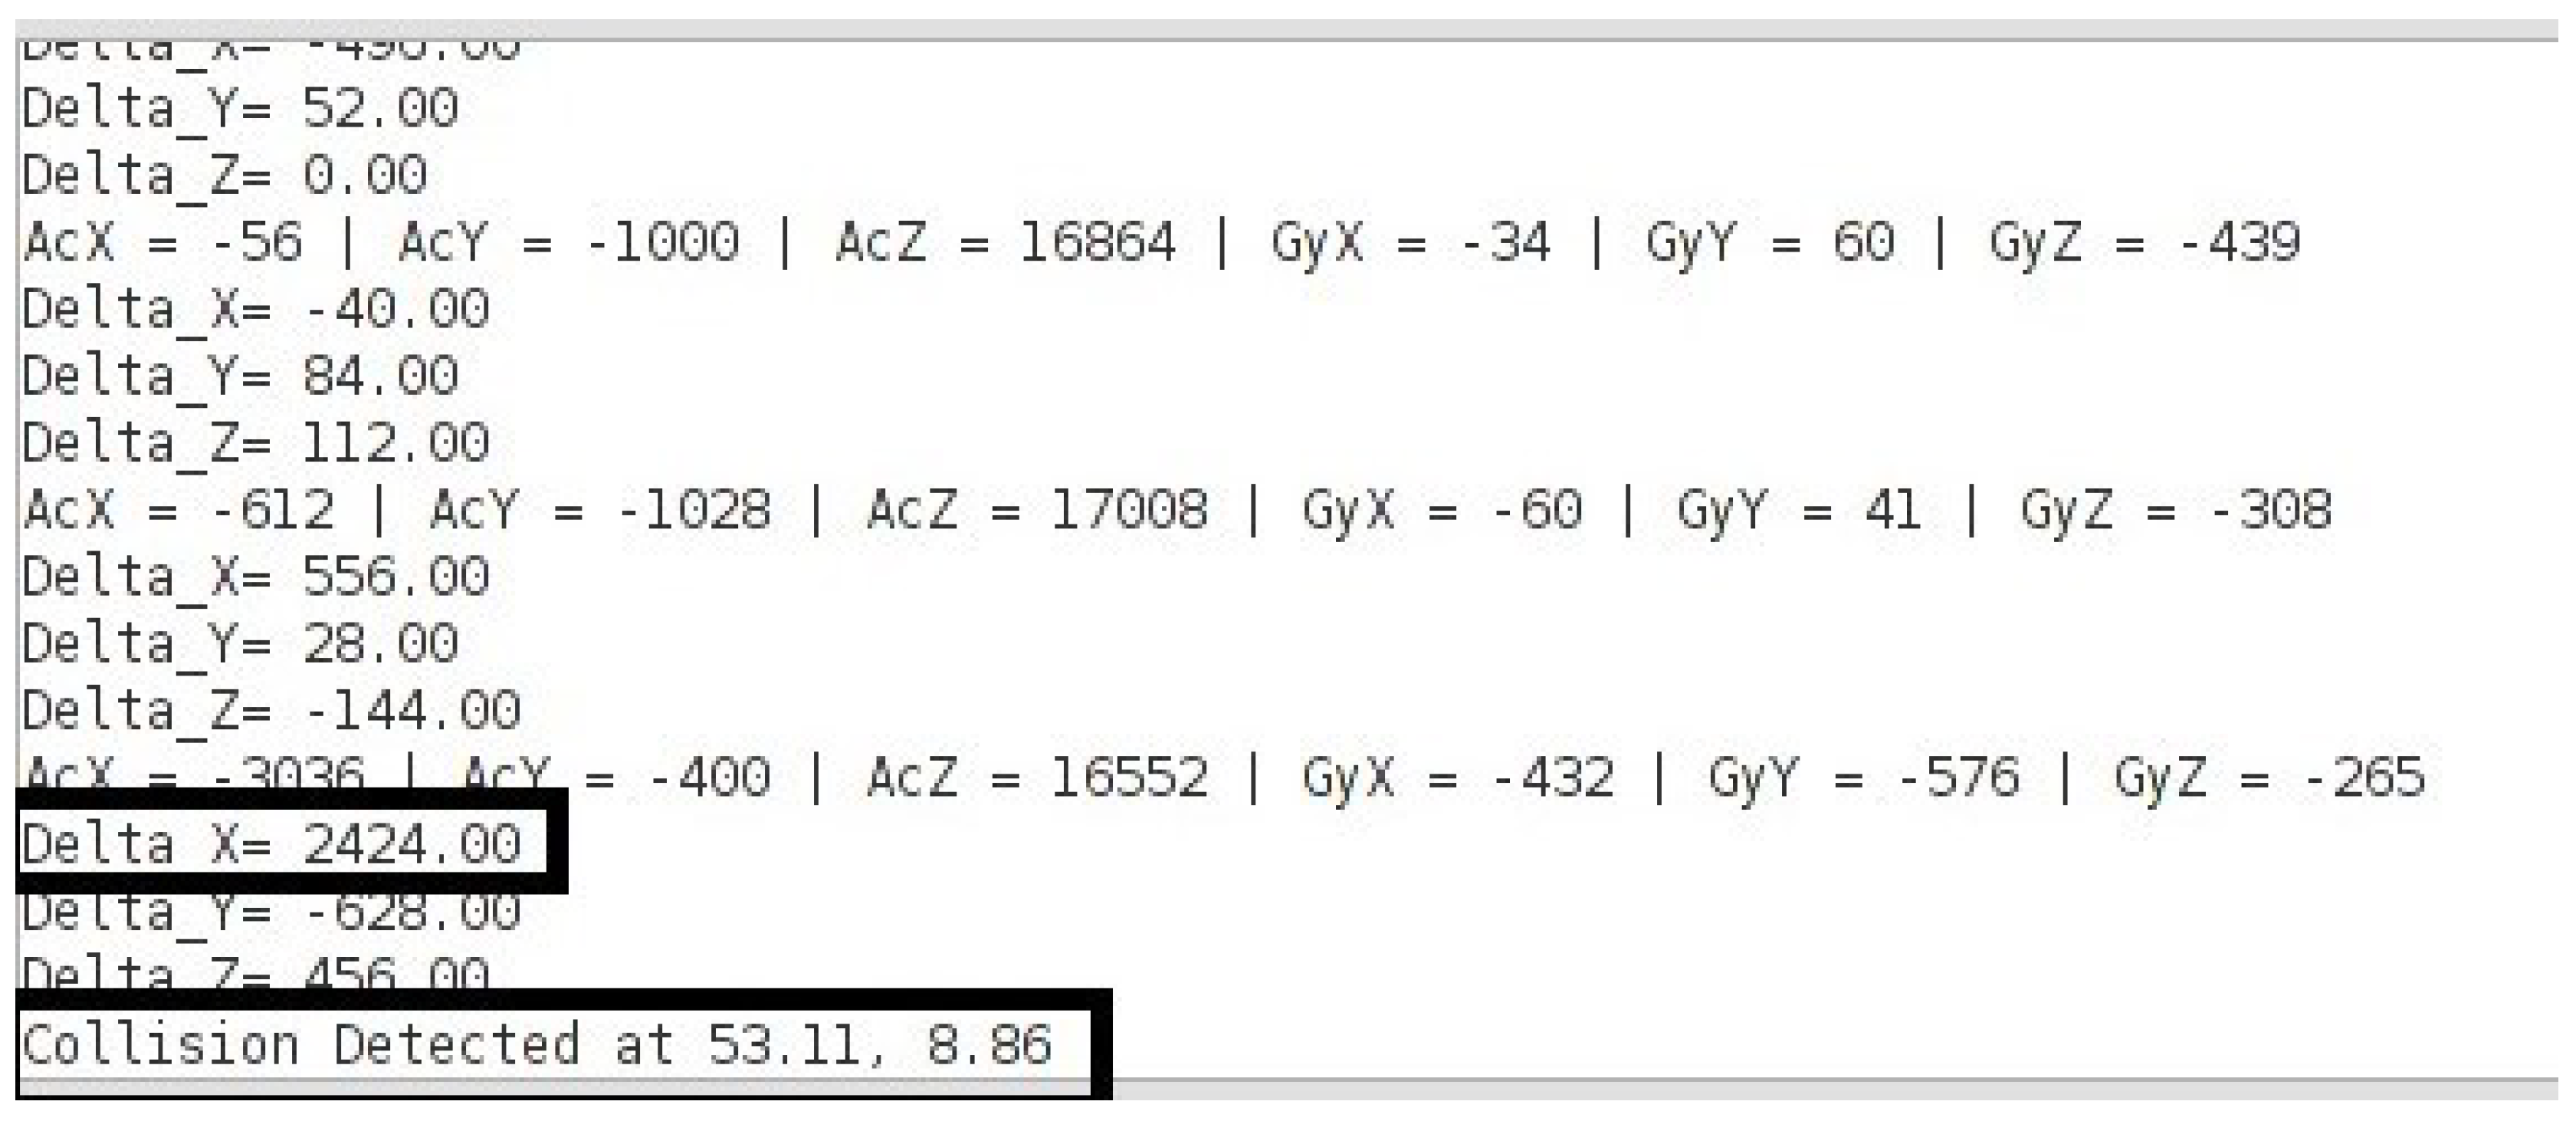
Likewise, once the change between two successive values of an accelerometer surpasses the predefined threshold i.e.,
, a collision event is prompted as demonstrated in
Figure 9.
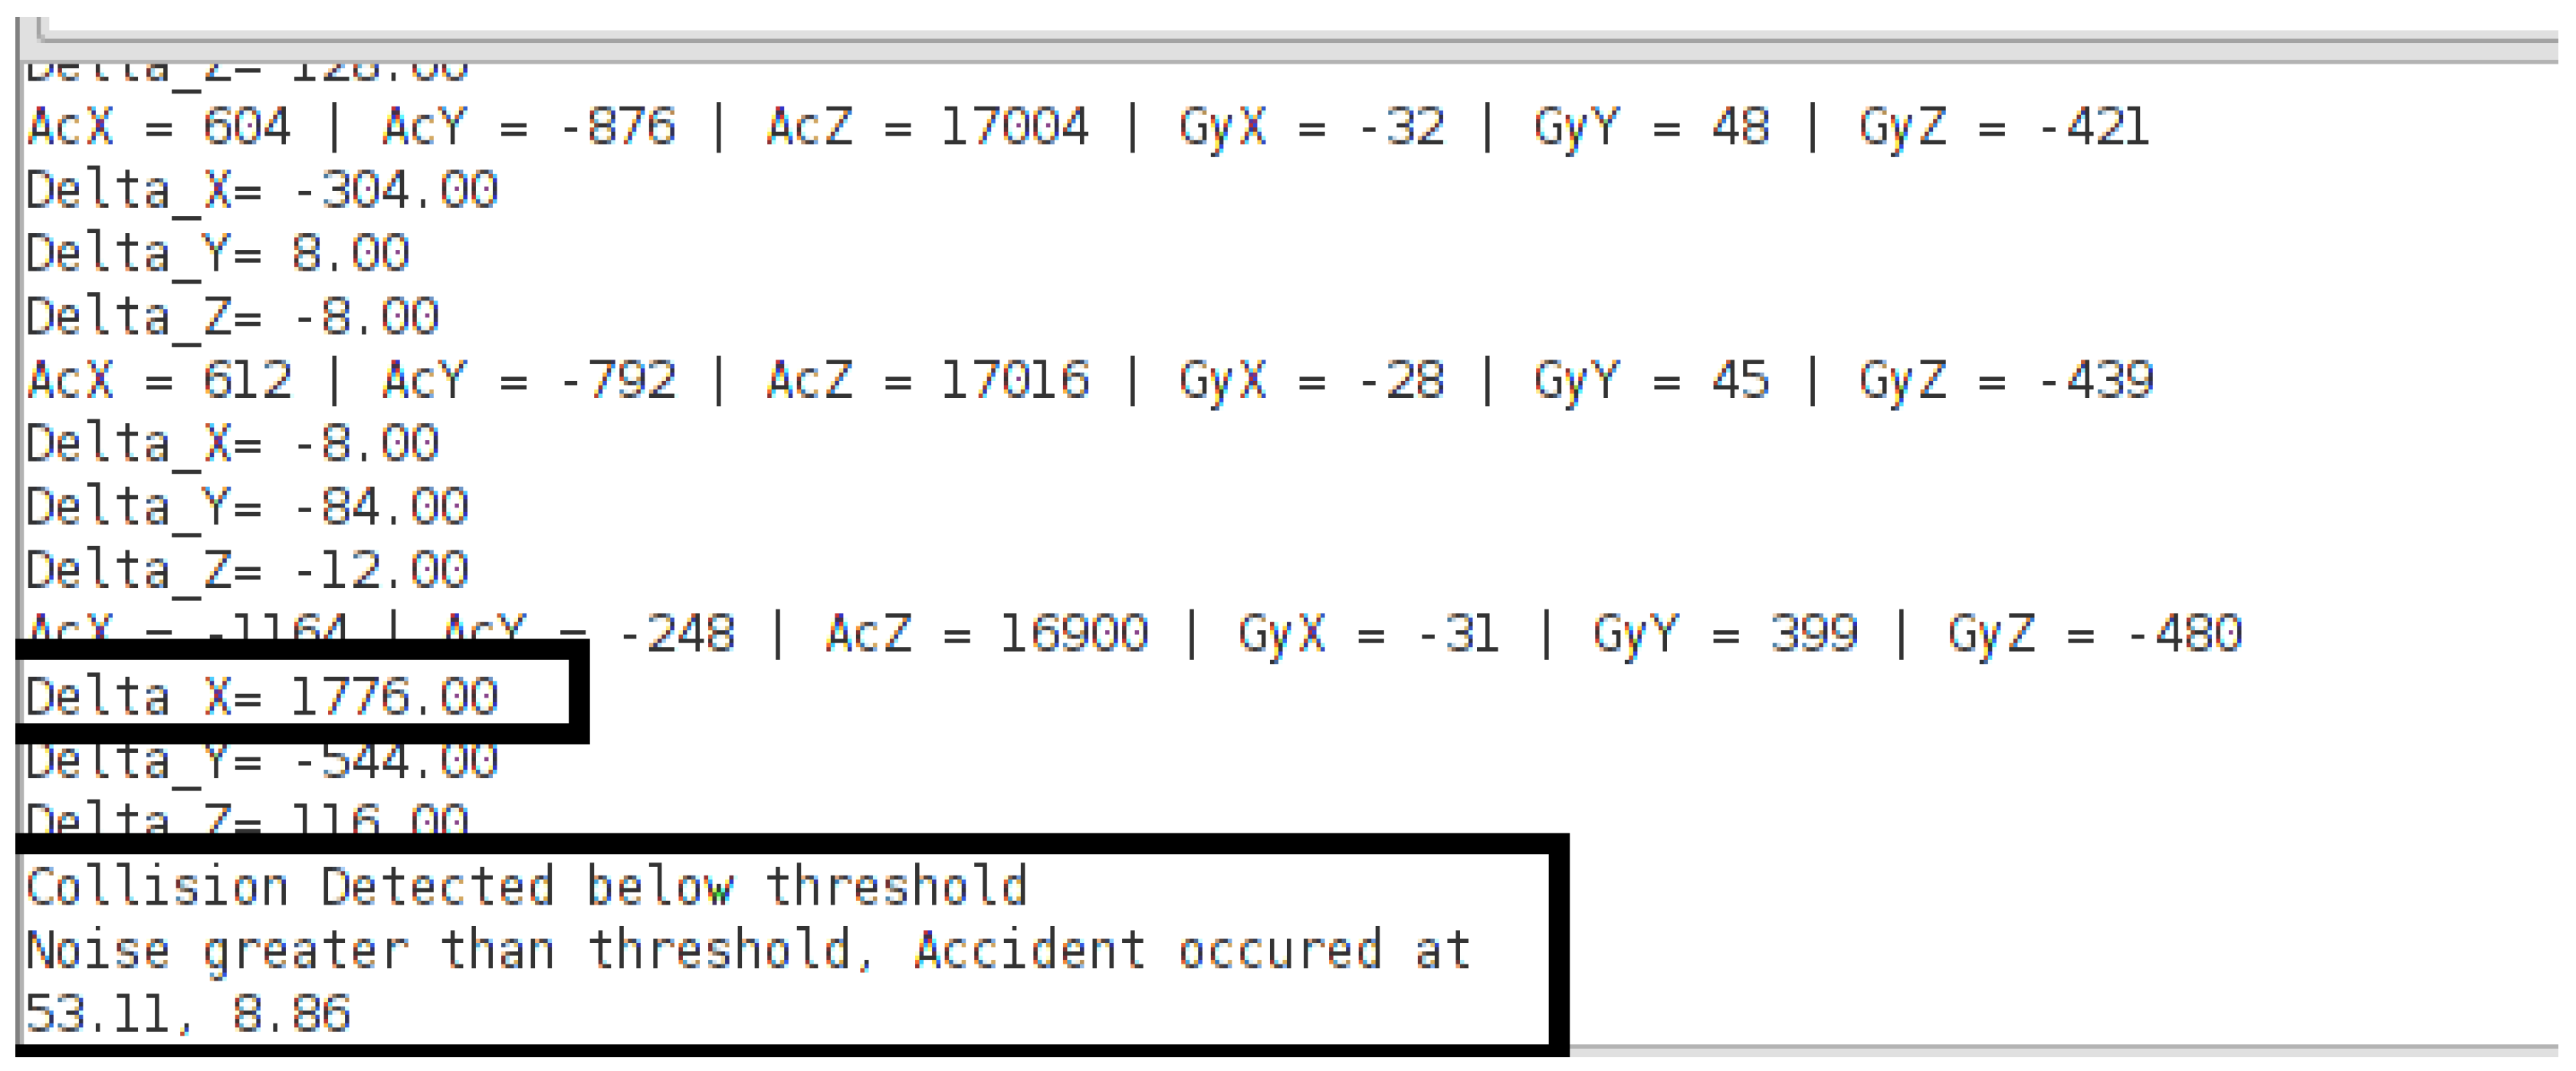
If the change is less than the predefined threshold i.e.,
, then the reason could either be a collision or emergency brakes have been applied. In this scenario, we first integrate the information from the sound sensor. If the sound sensor senses any noise and its measured value is greater than a predefined threshold, a collision detection event is initiated, as described in
Figure 10.
We accomplished several tests in the laboratory and a few of them have been discussed in this section. It is concluded from the results that the proposed system are being able to identify events within microseconds after the incident of an accident.
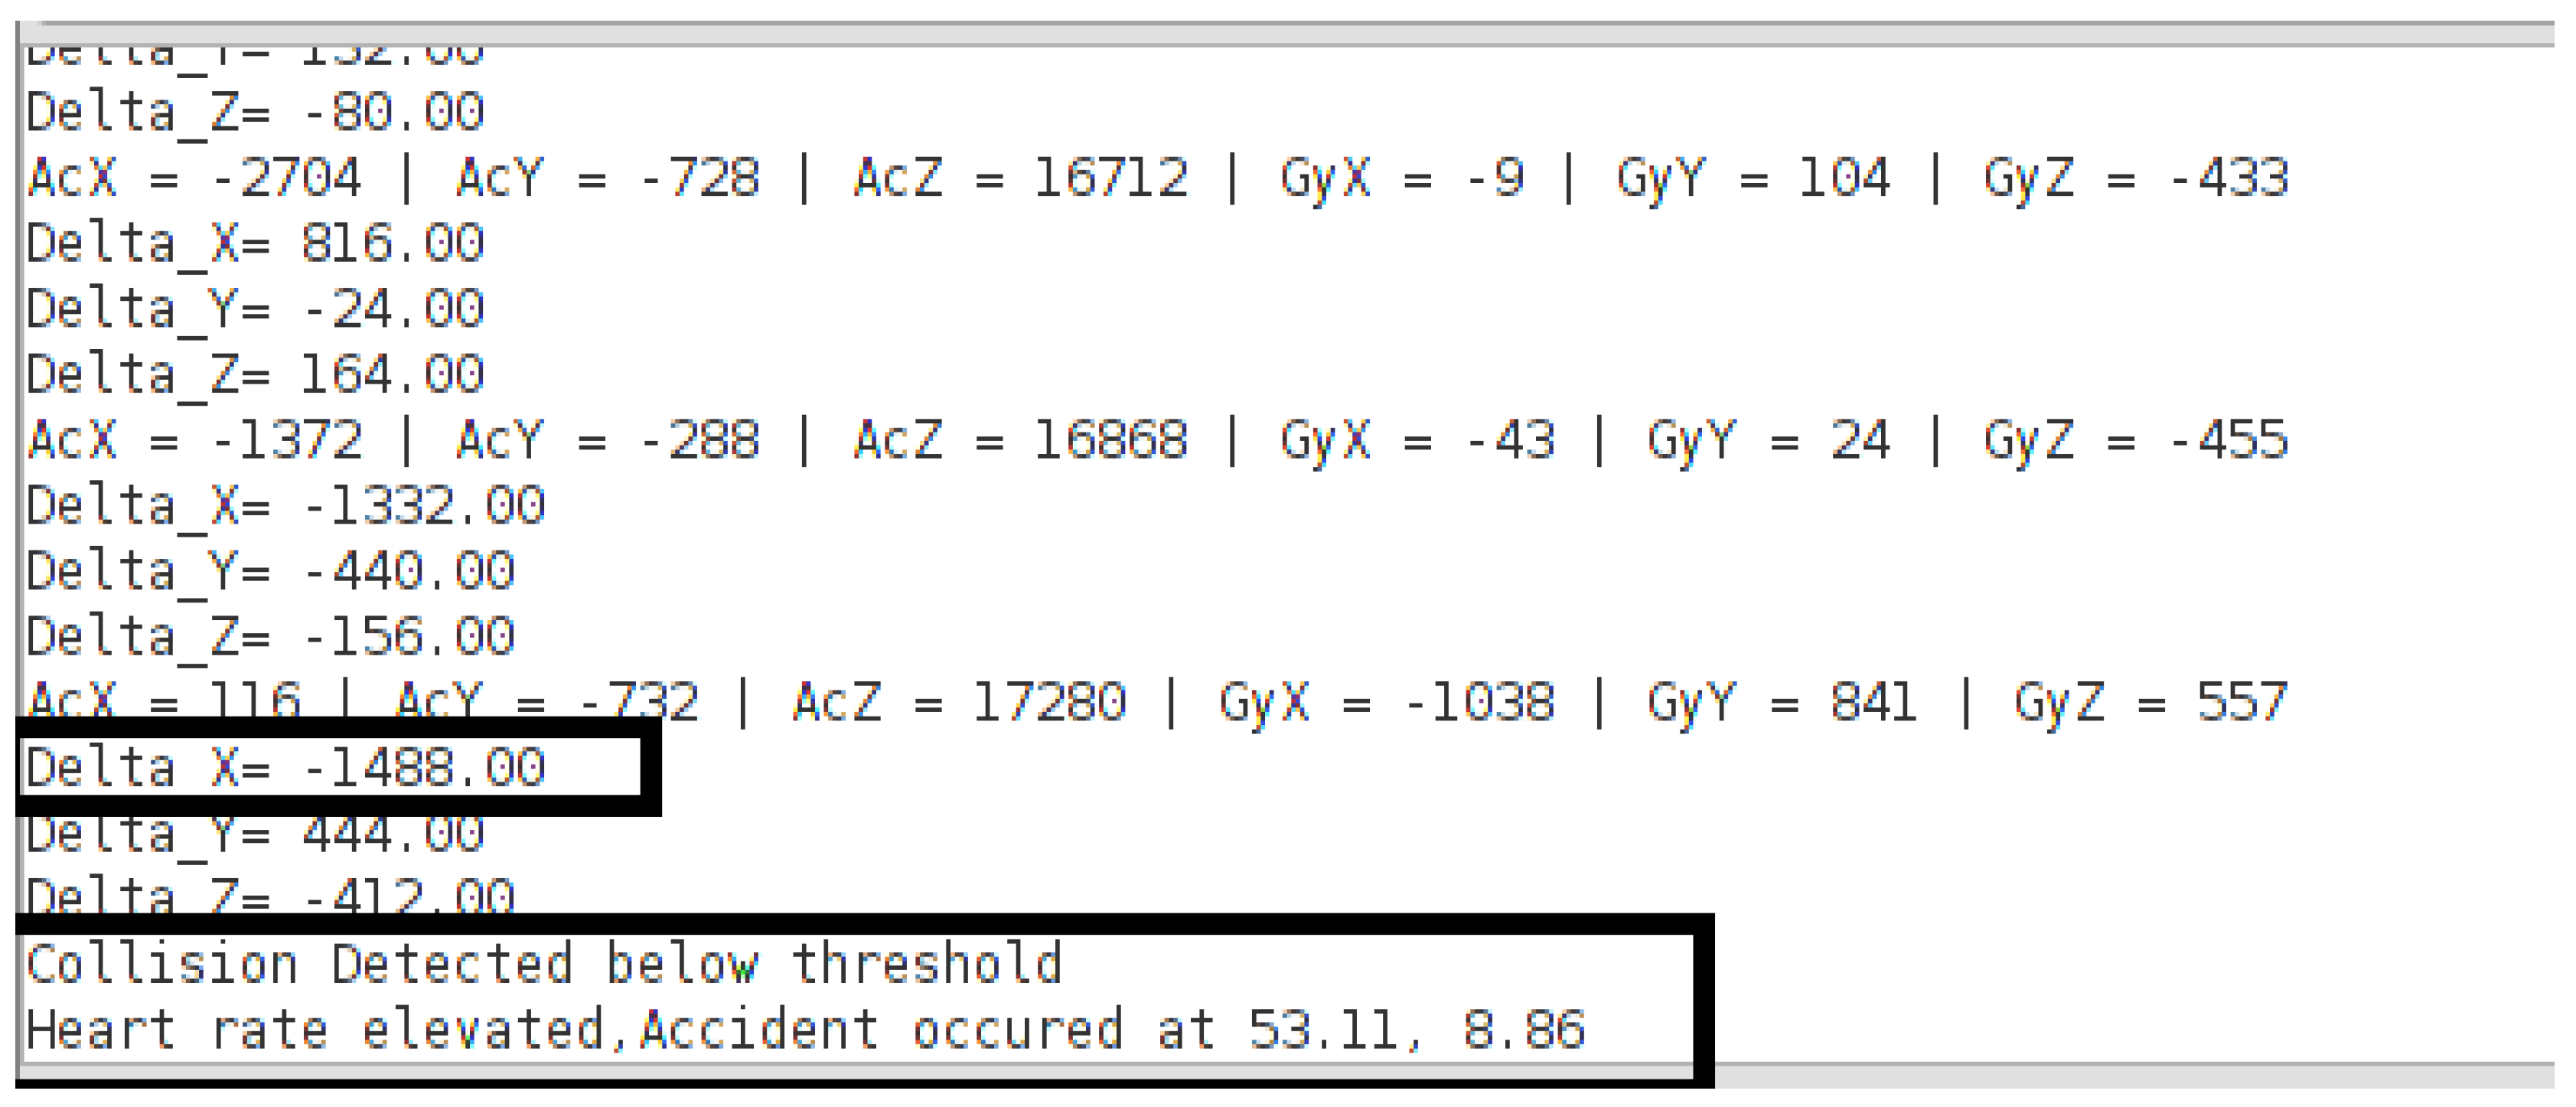
If the recorded value of a sound is less than the threshold, then it takes the readings from the pulse sensor for analysis to detect an event. Based on acquired values, if the heart rate is raised, then it considers the event of the collision to be true and the emergency alert is sent to the control room as it is depicted in
Figure 11.
4.2. Communication Phase
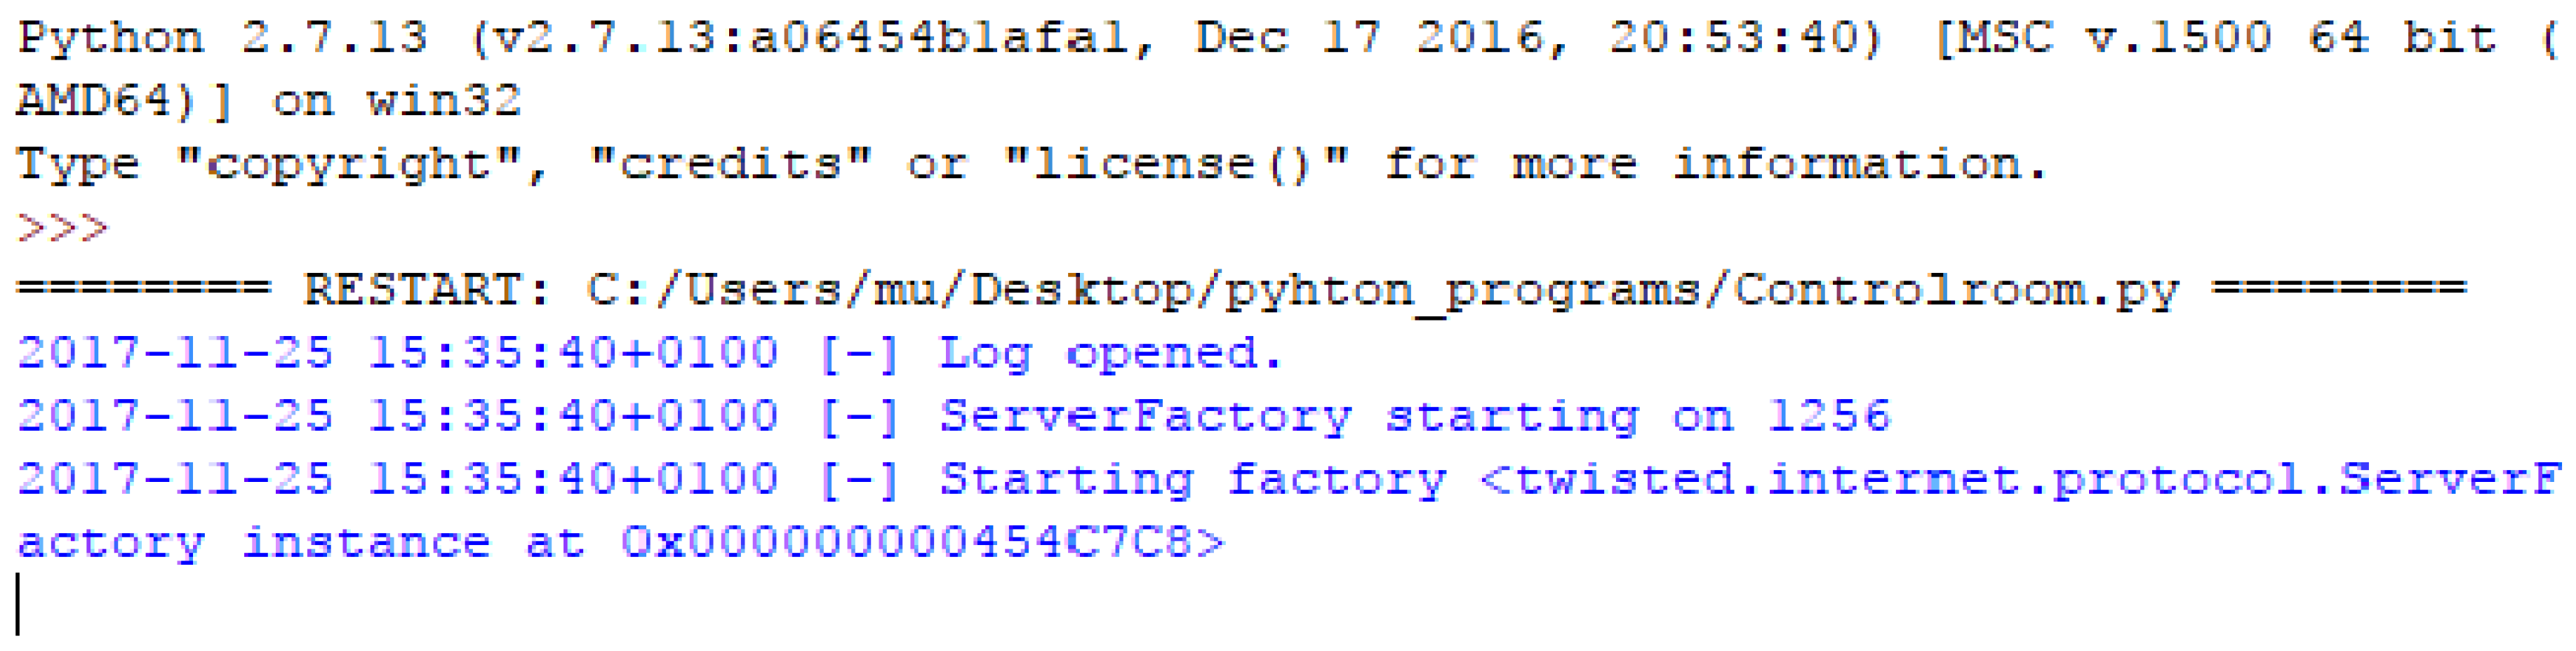
The server application is installed in the control room of a particular region. Upon booting up, the application initializes and waits for any connection request from the vehicles to become part of the ad hoc network for the emergency assistance service as depicted in
Figure 12.
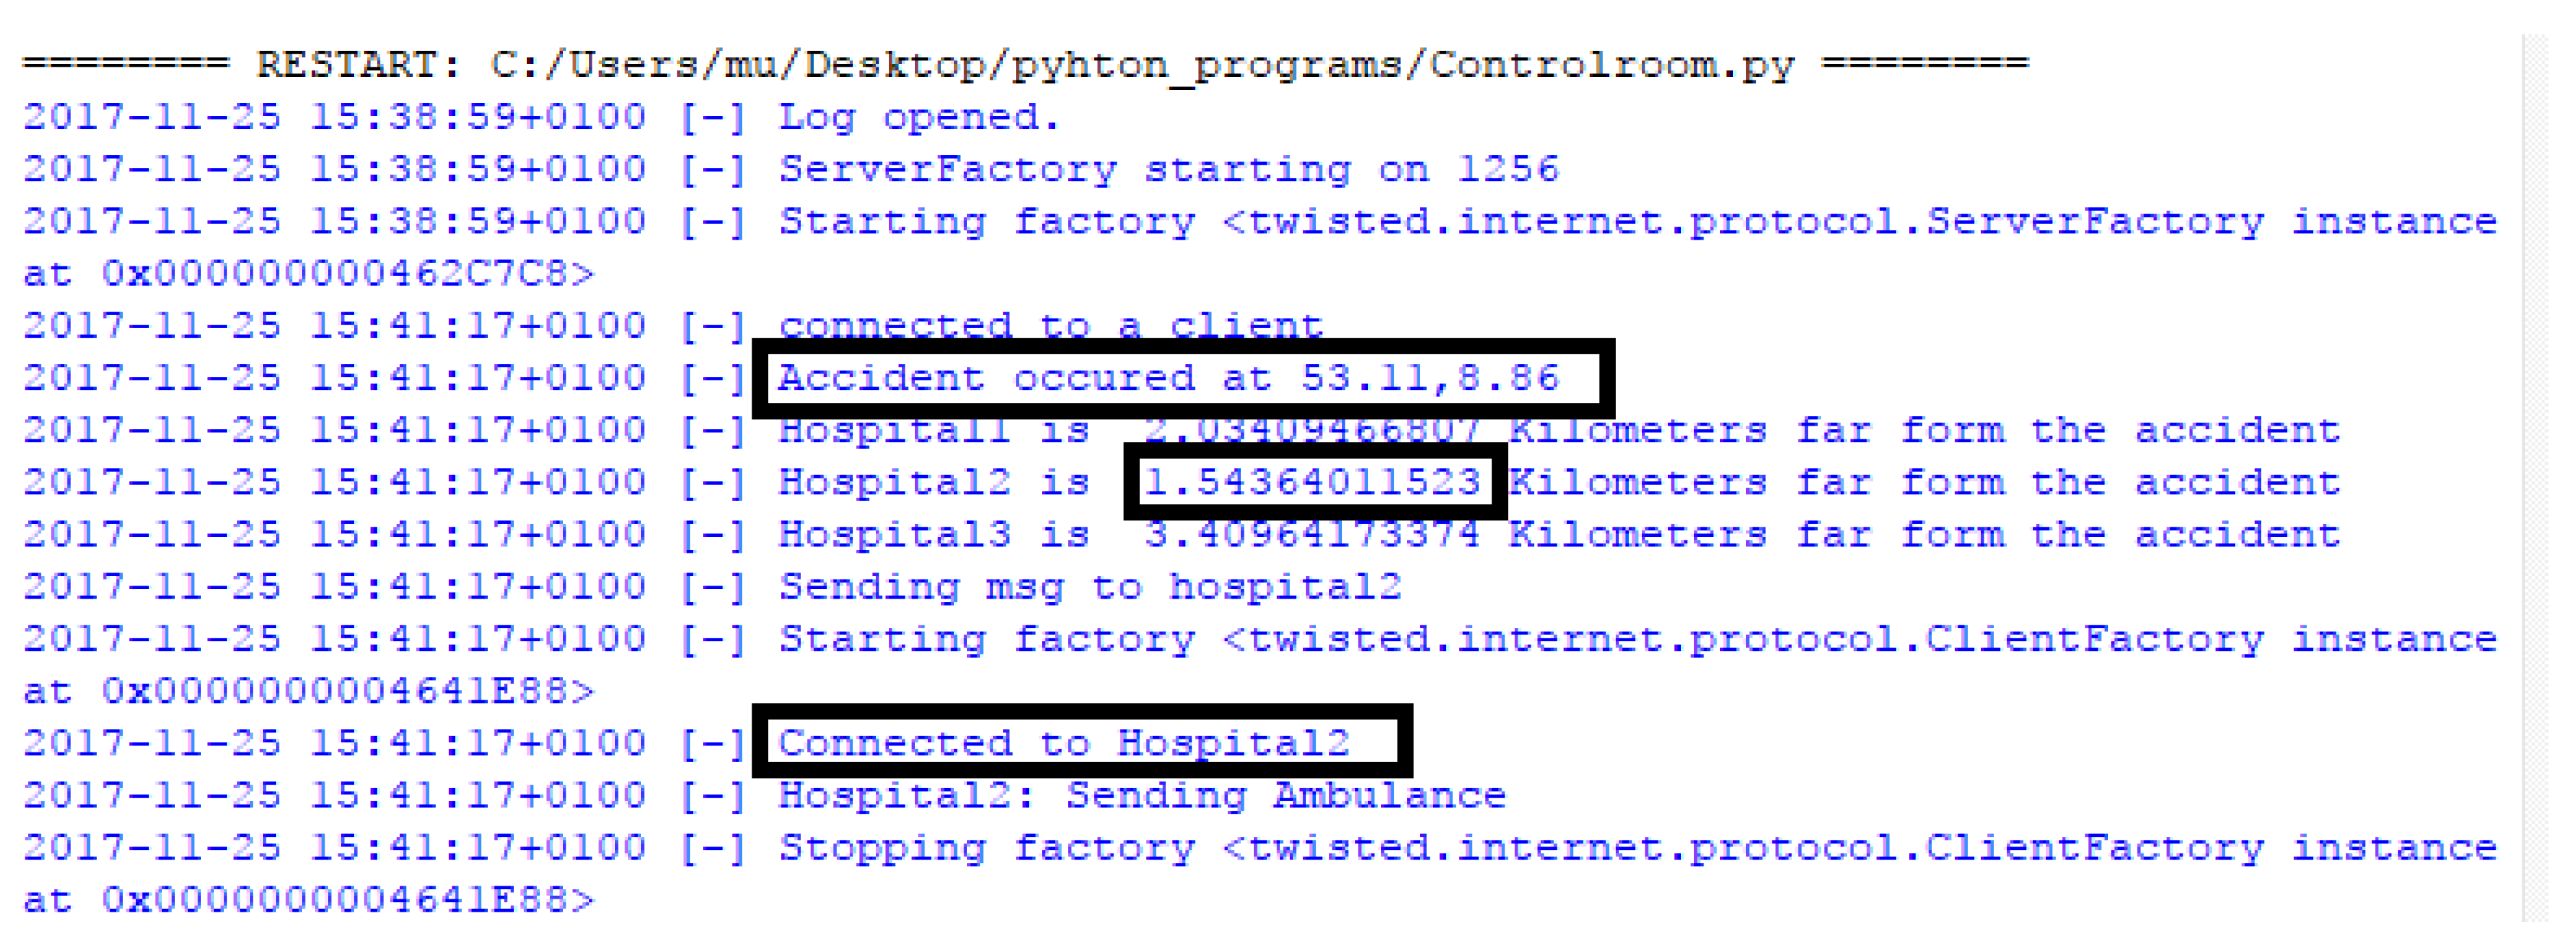
When the server receives an alert message, it excerpts the position of the road accident and finds the nearest medical center/ hospital to the location of an accident with the help of the Haversine formula. Then, it sends an emergency message to that identified hospital requesting to dispatch an ambulance along with paramedical personnel to the incident location as shown in
Figure 13. To ensure the service, an acknowledgment is sent to the control room from the hospital.
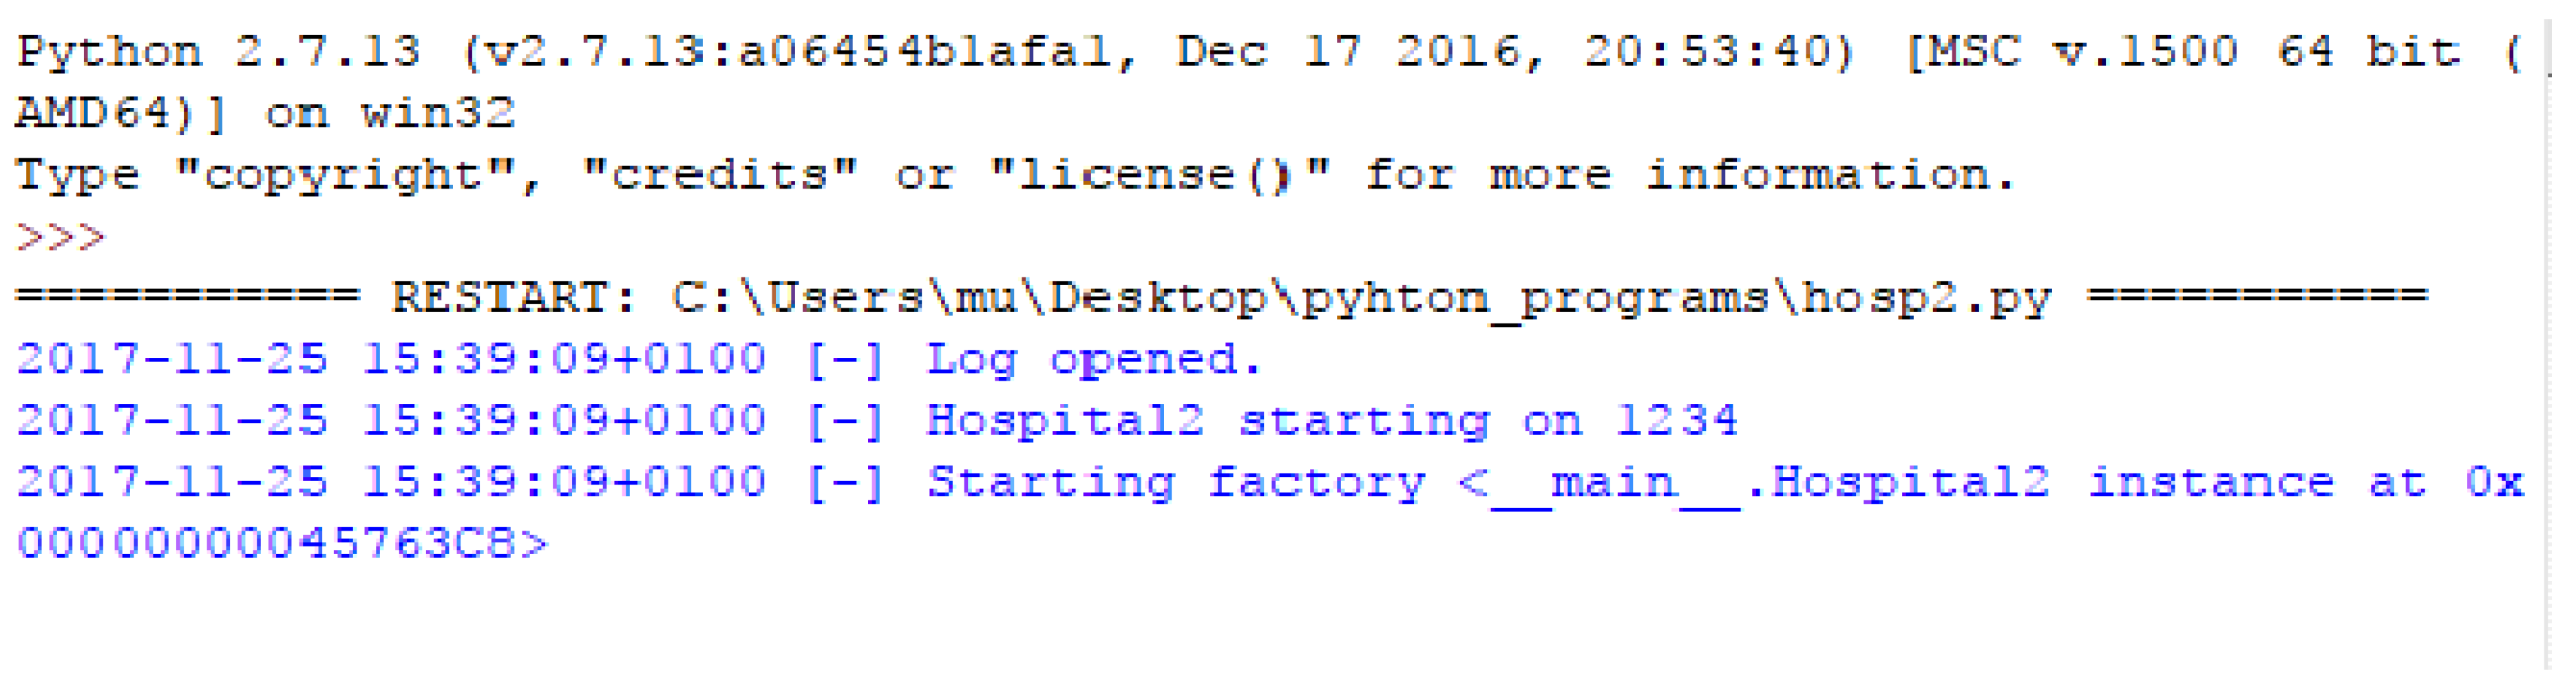
The counter client application installed in the hospital’s emergency control room is first initialized and ready to receive an emergency message from the server as depicted in
Figure 14.
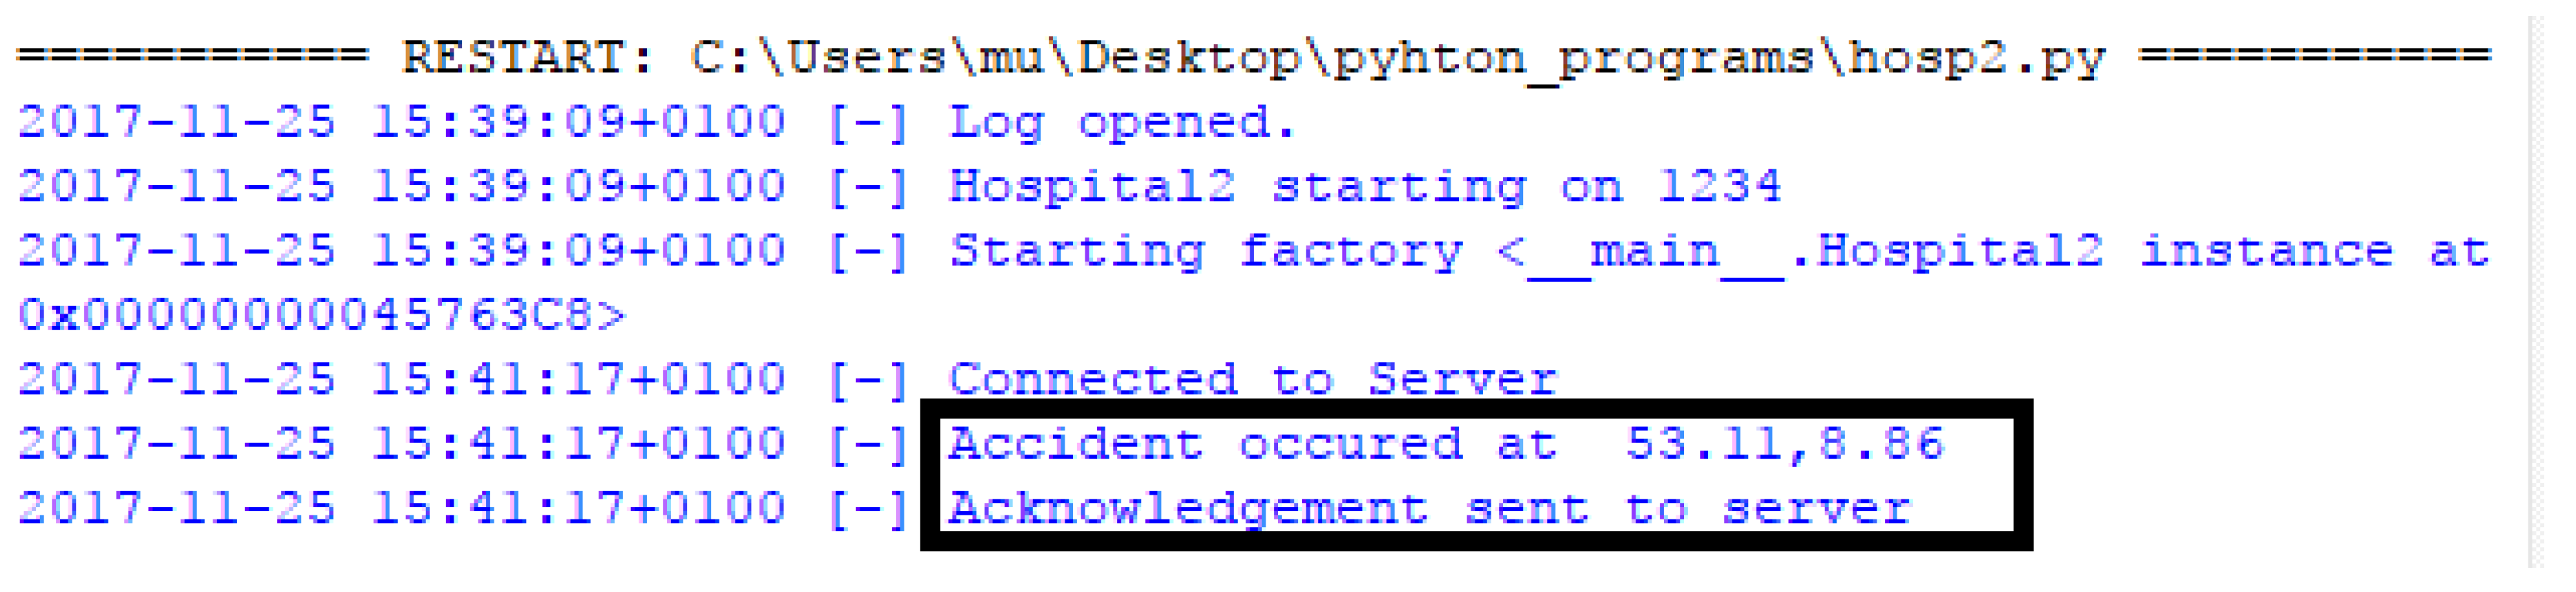
When an emergency alert is received from the control room, the client counter application at the hospital not only dispatches the ambulance to the accident location, but it also sends an acknowledgment to the server upon receiving an alert message as shown in
Figure 15. On its route towards the accident location, the ambulance broadcasts emergency messages to other vehicles for path clearance.
4.3. Performance Analysis of the System
To evaluate the performance of the system, several tests were performed in three different settings by introducing an accident-event based on the execution of the proposed applications on the developed ad hoc TestBed. For the analysis, several parameters e.g., Contention Window Size (CWS), Inter-Vehicle Distance (IVD), and Node Density (ND) have been calibrated based on the scenario. There were a total number of 24 nodes (OBUs) deployed in the lab by ensuring that 1 to 10 OBUs have to work as relay nodes. The detailed settings of OBUs such as GPS, Camera and its frame-rate are discussed in each specific scenario. To check the practicality of the system, a dense environment has been analyzed in such a way that each relay node must have at least two neighboring nodes. Thirty, sixty, and ninety events were introduced in the system on three different settings of the network to check its behavior by incrementing relay nodes in each experiment, considering between random values between 1–10 in the first, second, third experiments and so on, respectively. In each case, the slot time of , the Short Interframe Space (SIFS) of , which is and DCF Interframe Space (DIFS) of , which is have been considered. Furthermore, TwoRayGround is used as a radio-propagation model with wireless access technology of IEEE 802.11p. Moreover, the maximum transmission range and the IVD of each node in the network is configured in such a way that the total number of nodes deployed in the network can be adjusted in the Lab.
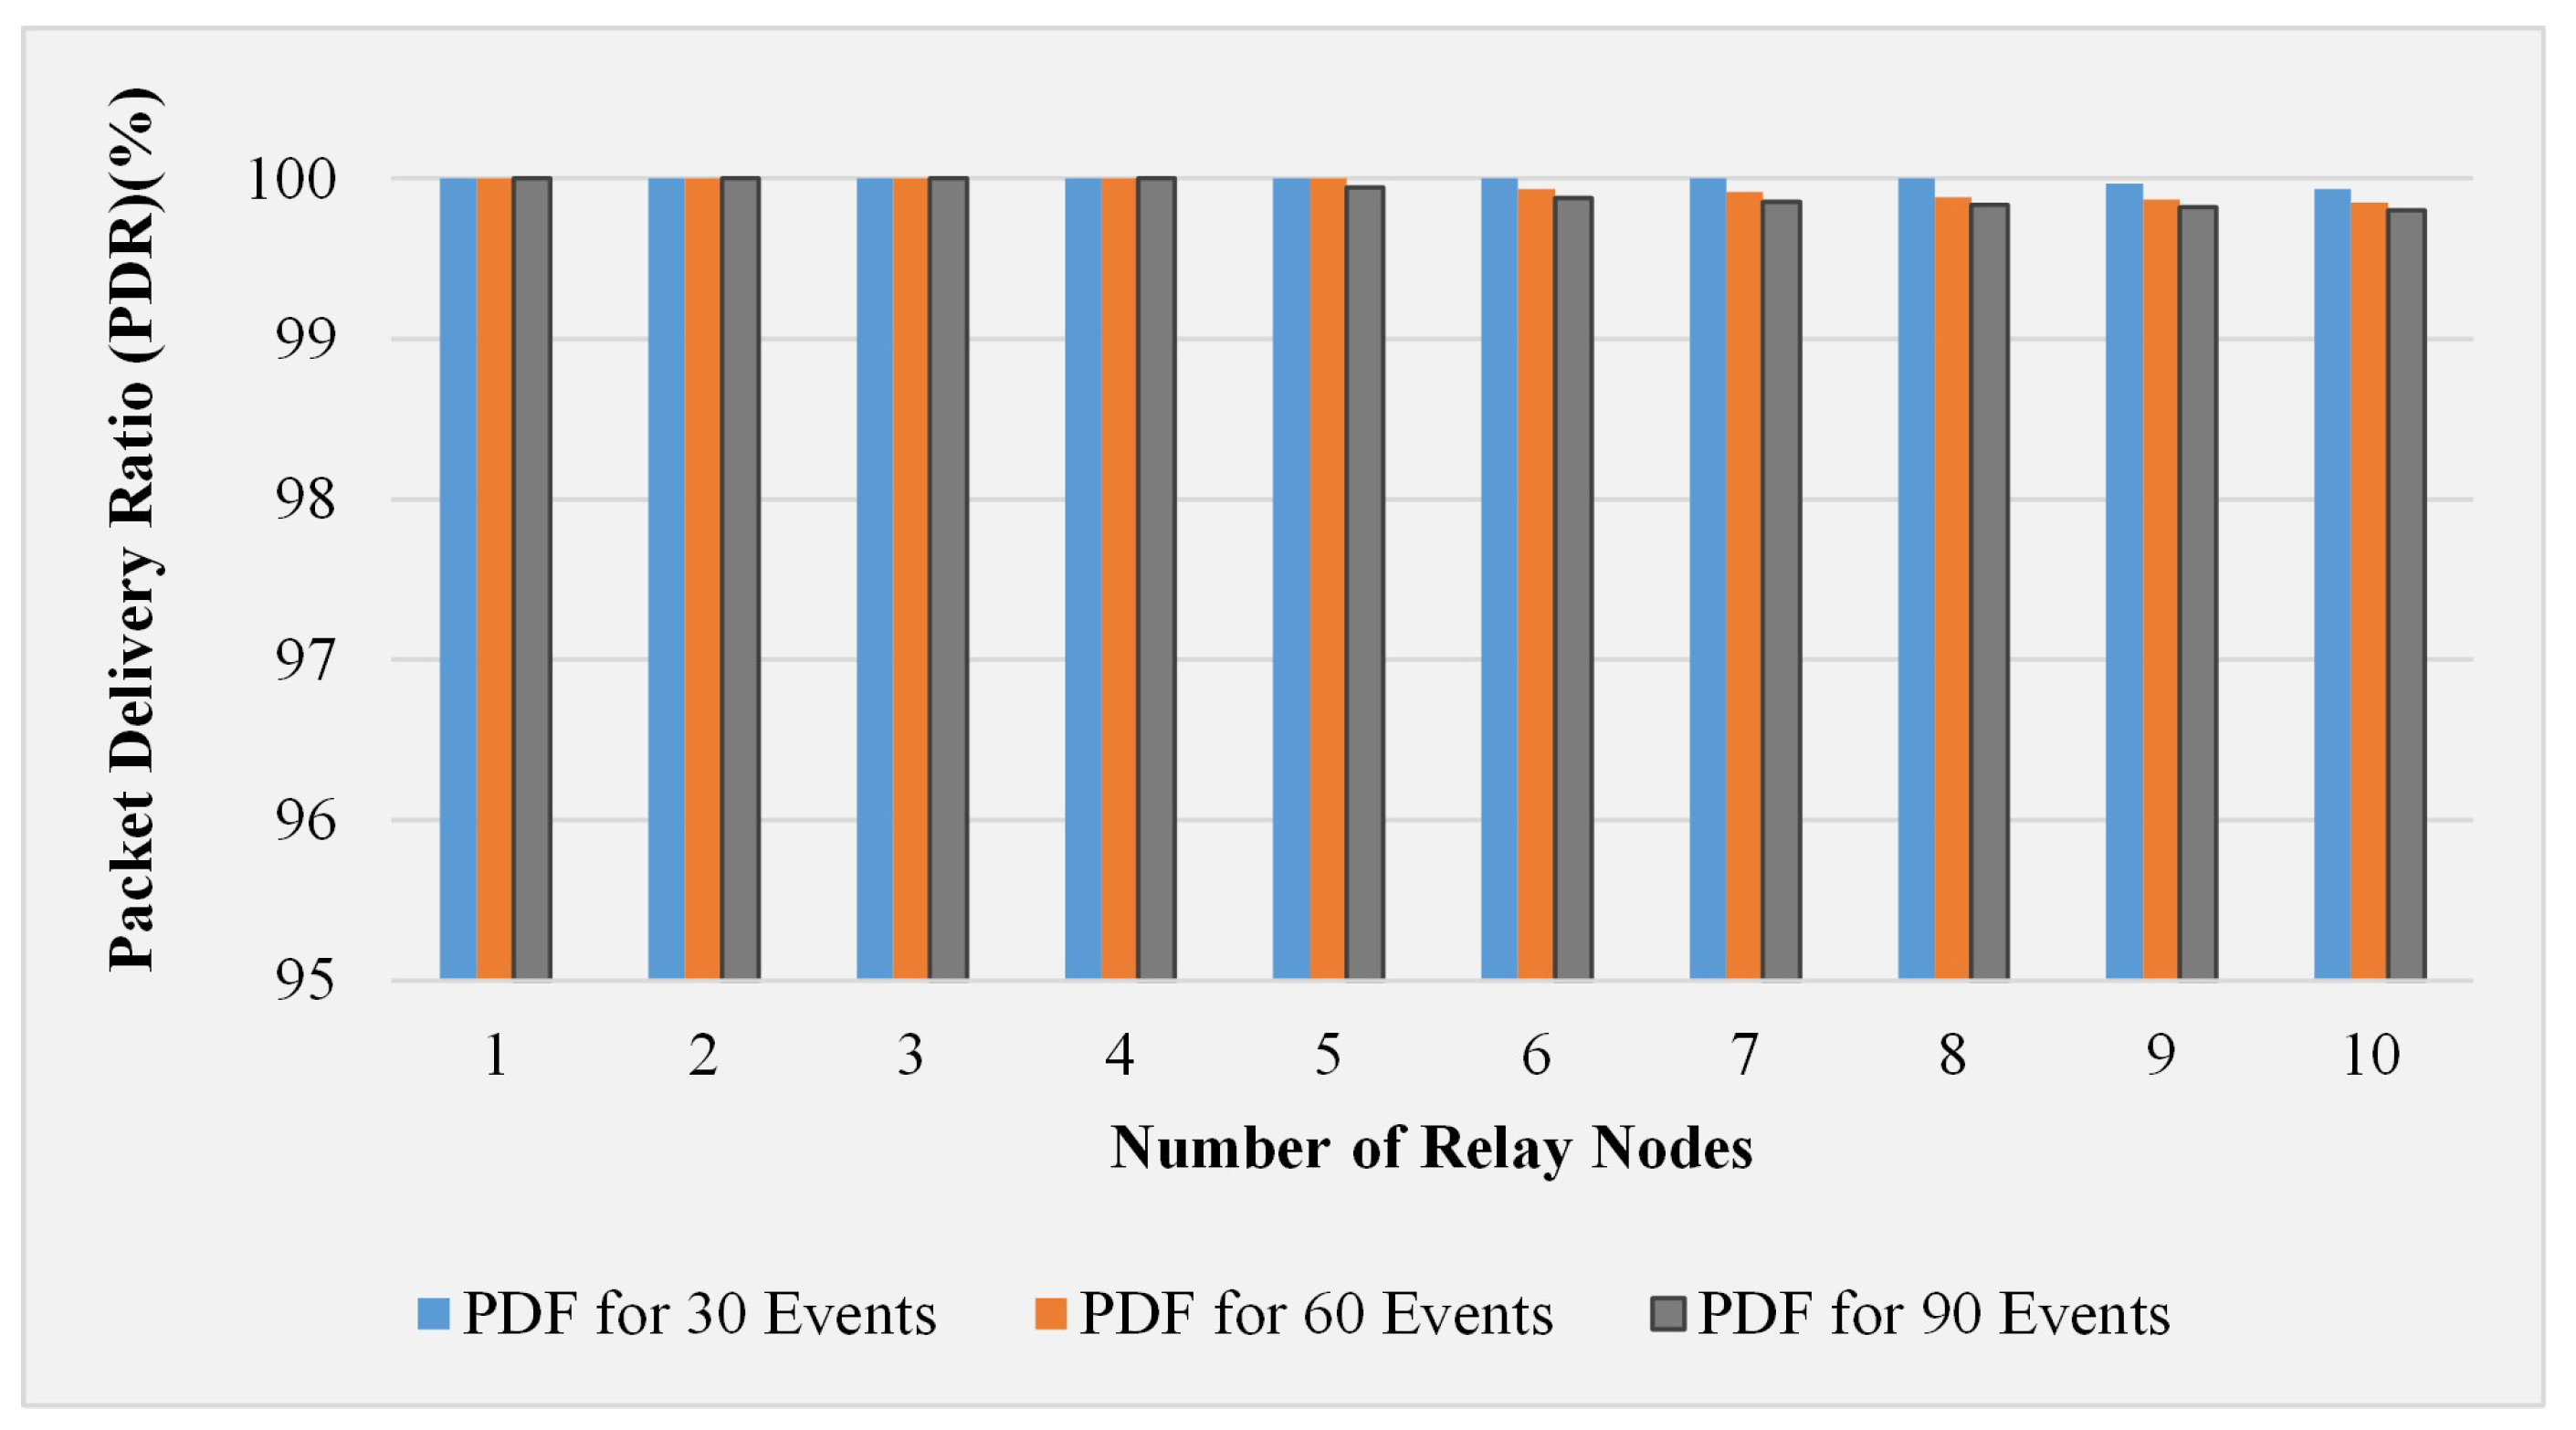
Additionally, there is no specific topology used in this work; however, the nodes are connected in such a way that there is no disconnectivity in the network. The total area of the lab where the network has been deployed around 500 square meters. The cars are moving with random speeds between 20 to 60 km/h; however, when an accident occurs, the speed decreases drastically. The nodes are deployed with a deterministic fashion, but it has been ensured that 1 to 10 OBUs have to work as relay nodes as per the scenario. Moreover, the maximum transmission range and the IVD of each node in the network are configured in such a way that the total number of nodes deployed in the network can be adjusted in the Lab. The relay nodes are those nodes that are used to forward the traffic to the next hop towards the destination or control room. The OBU that we have used has a Raspberry-Pi, GPS, IMU, and camera module embedded on it and it has a default routing procedure just like Ad hoc On-demand Distance Vector (AODV) routing. The traffic that has been sent to the control room is the Constant Bit Rate with a maximum size of 200 to 400 bytes. The traffic is being sent to the control room when an event occurs, where an event can be either a collision or rollover. The average Packet Delivery Ratio (PDR) has been computed for each setting by increasing the relay nodes, as displayed in
Figure 16. The 100% value of PDR has been observed, where the number of relay nodes were within the range of 1 to 4, which indicates that the destination node was able to receive all the sent messages successfully. However, when the number of relay nodes was greater than 4, the observed value of PDR decreases to some extent that depicts the message loss in the network. The data loss happened possibly because of interference and channel contention due to the increase in the number of nodes in a wireless medium.
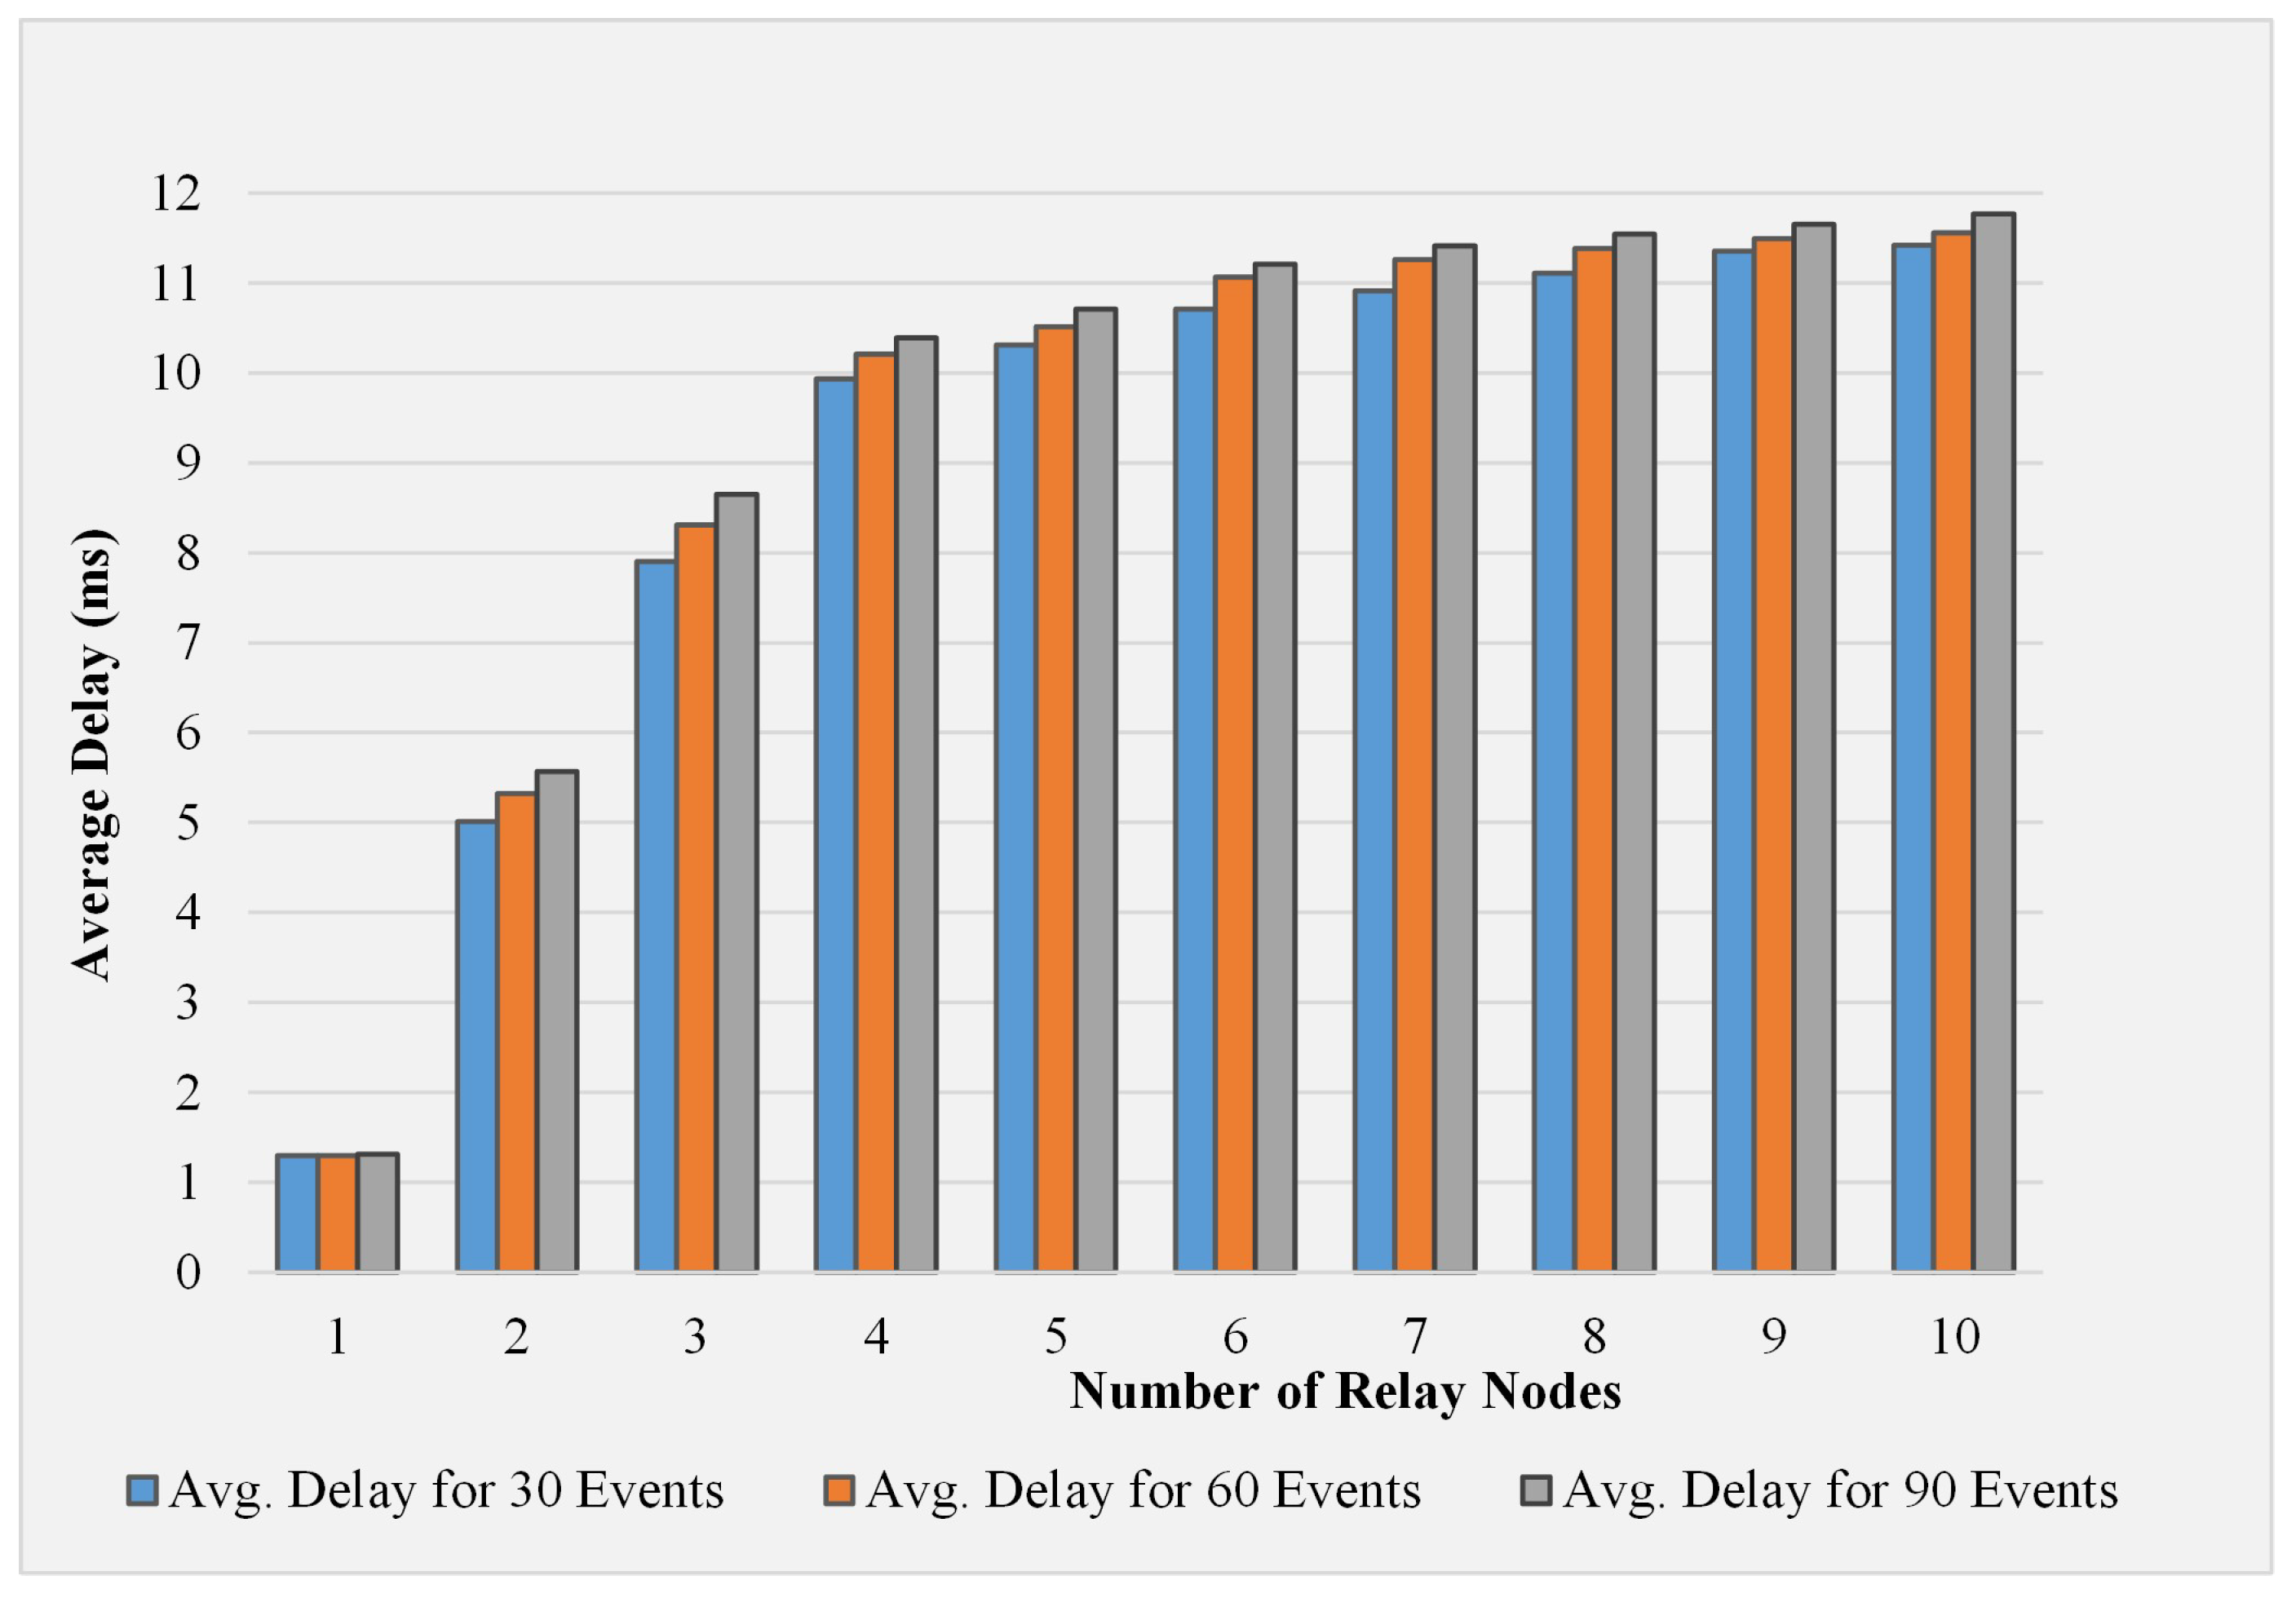
Safety and emergency applications require quick and reliable data dissemination. The proposed application is designed to meet the requirements of an emergency application, but the nature of the application can tolerate little delay. In addition to the packet delivery ratio, the average end-to-end delay has been evaluated for the generated emergency call upon each triggered event.
Figure 17 presents the comparison of average end-to-end delay with respect to the number of relays. The TestBed encompasses a limited number of vehicular nodes, and the observed delay is within the minimum requirements of the safety application.
4.4. Data Analysis of Road Accidents: Real World Statistics
A non-technical person from a relevant authority or organization would require precise data in a readable format to get actionable insights from this data. Most of the time, they need to monitor trend changes in road usage and analyze driver behavior patterns. An open-source tool is required that is visual, intuitive and interactive. Google Charts is found to have all of these features. Once a SQL query is run to fetch a certain part of the data from the database, it can then be fed to the API, which shall plot a graph on the screen accordingly. It shall make the data fairly comprehensible for the end-user. The main intention behind the visualization of the stored records was to analyze the data and make insightful observations that can lead to effective solutions in improving general road safety. In the current work, once a data visualization front end, which has been developed by utilizing HTML, PHP and Google Charts API, is up and running, it can be replicated with any set of data. In order to bring authenticity into the process of data analysis, the official road accident statistics provided on the Internet by the German authorities are acquired. Statistisches Bundesamt (or Federal Office of Statistics) is an official record of various datasets, exploring different areas of life including but not limited to the national economy, agriculture, industry, services, manufacturing, domestic trade, foreign trade, labor market, transportation, tourism, energy, environment, construction, and society. In this work, statistics regarding the road accidents accumulated by the relevant authorities over the years form the desired dataset. There is an online databank called GENESIS, holding statistics about road accidents in varied forms—for example, the number of casualties in road accidents over years or months, road accidents involving personal injury, number of seriously or slightly injured people in such accidents, or parties involved in the accident. Additionally, the statistics are based on factors like gender, age or the severity of the damage caused, and even accidents while carrying water-hazardous substances.
This data are imported into a PostgreSQL database and through SQL queries, various charts and graphs are plotted, to visualize and present the data. The data for the year 2018 is yet to be uploaded into the database. Therefore, the available data begins from 1991 up until 2017—firstly, the data for the number of people sustaining serious or slight injuries, personal injuries and the count of persons who lost their lives in these accidents examined, over the span of the last 27 years. The data are divided into the types of roads and with the information, whether these roads are inside the built-up area or outside of it. A built-up area that is sometimes referred to as a suburban or just urban area is a term primarily used in urban planning, building design, and the real estate development industry. It encompasses a developed area that consists of various buildings and structures such as residences, schools, playgrounds, educational and medical institutions, shopping malls, government, and non-government offices and other corporate organizations, normally as part of a larger developed environment such as a district, town, village, or city.
4.5. Accidents Pattern Analysis on Different Types of Roads
This section deals with the analysis of deaths, serious injuries, and light injuries as a result of accidents on the federal, district, provisional and motorways roads from 1991–2017.
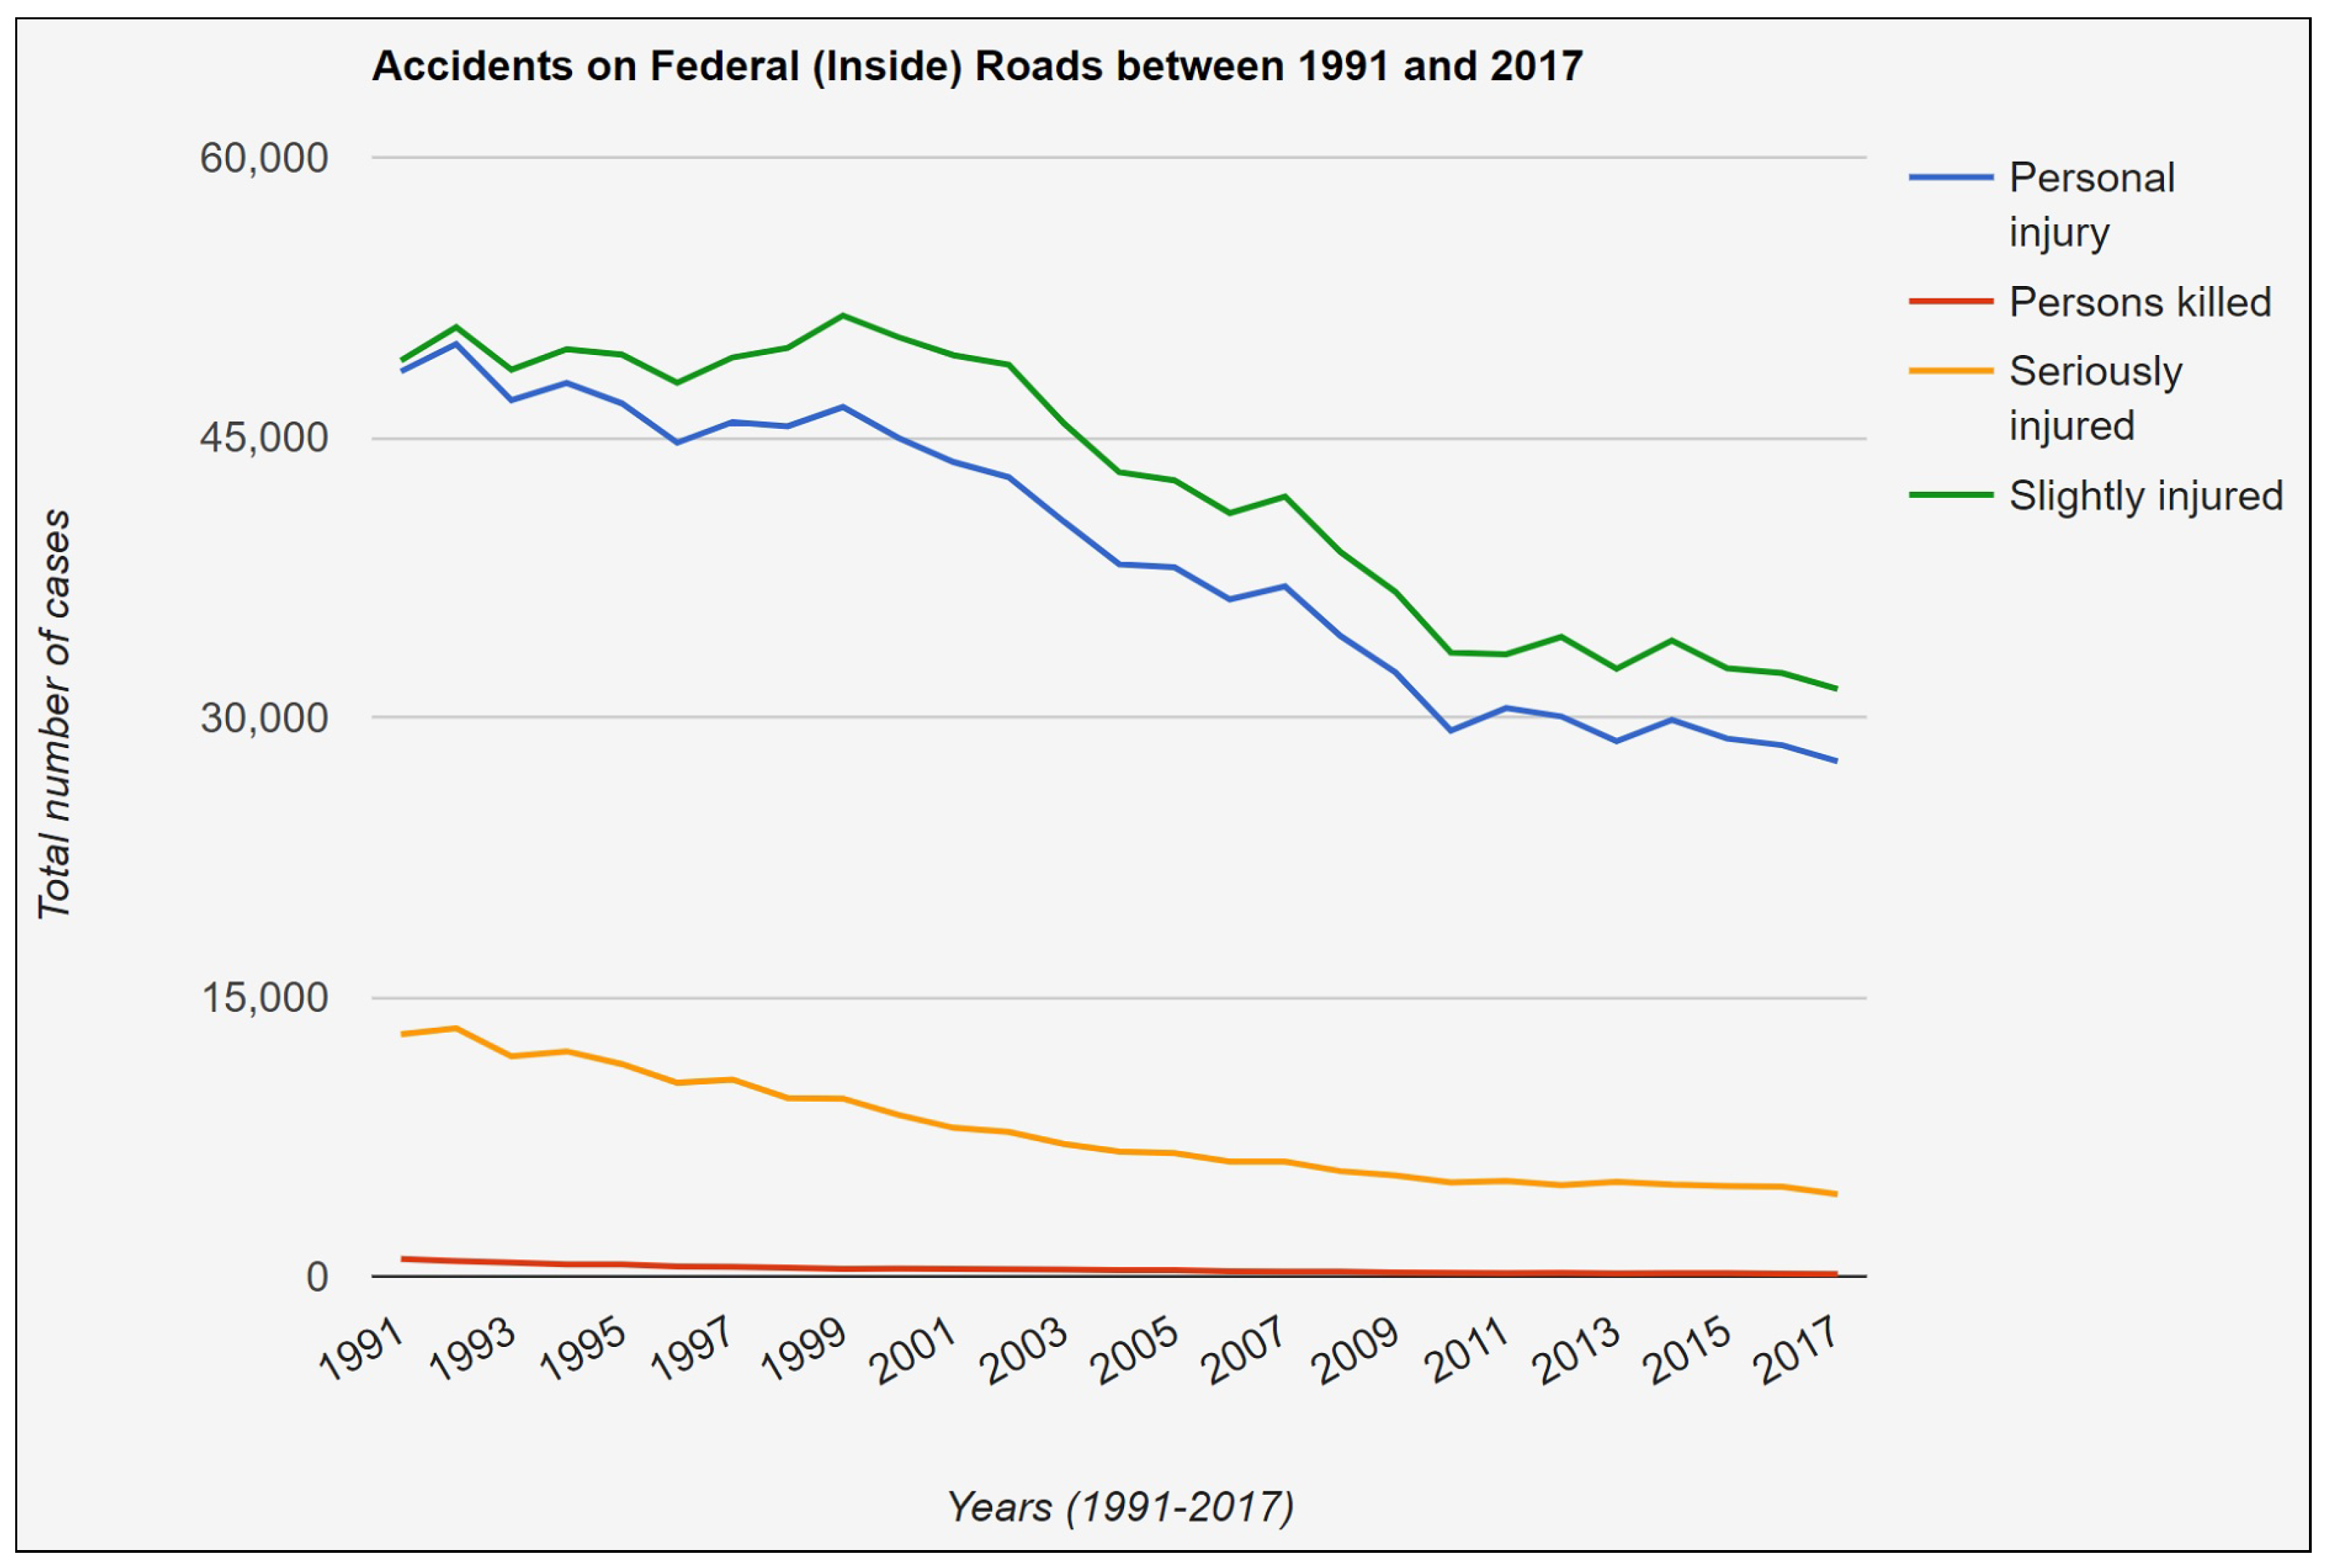
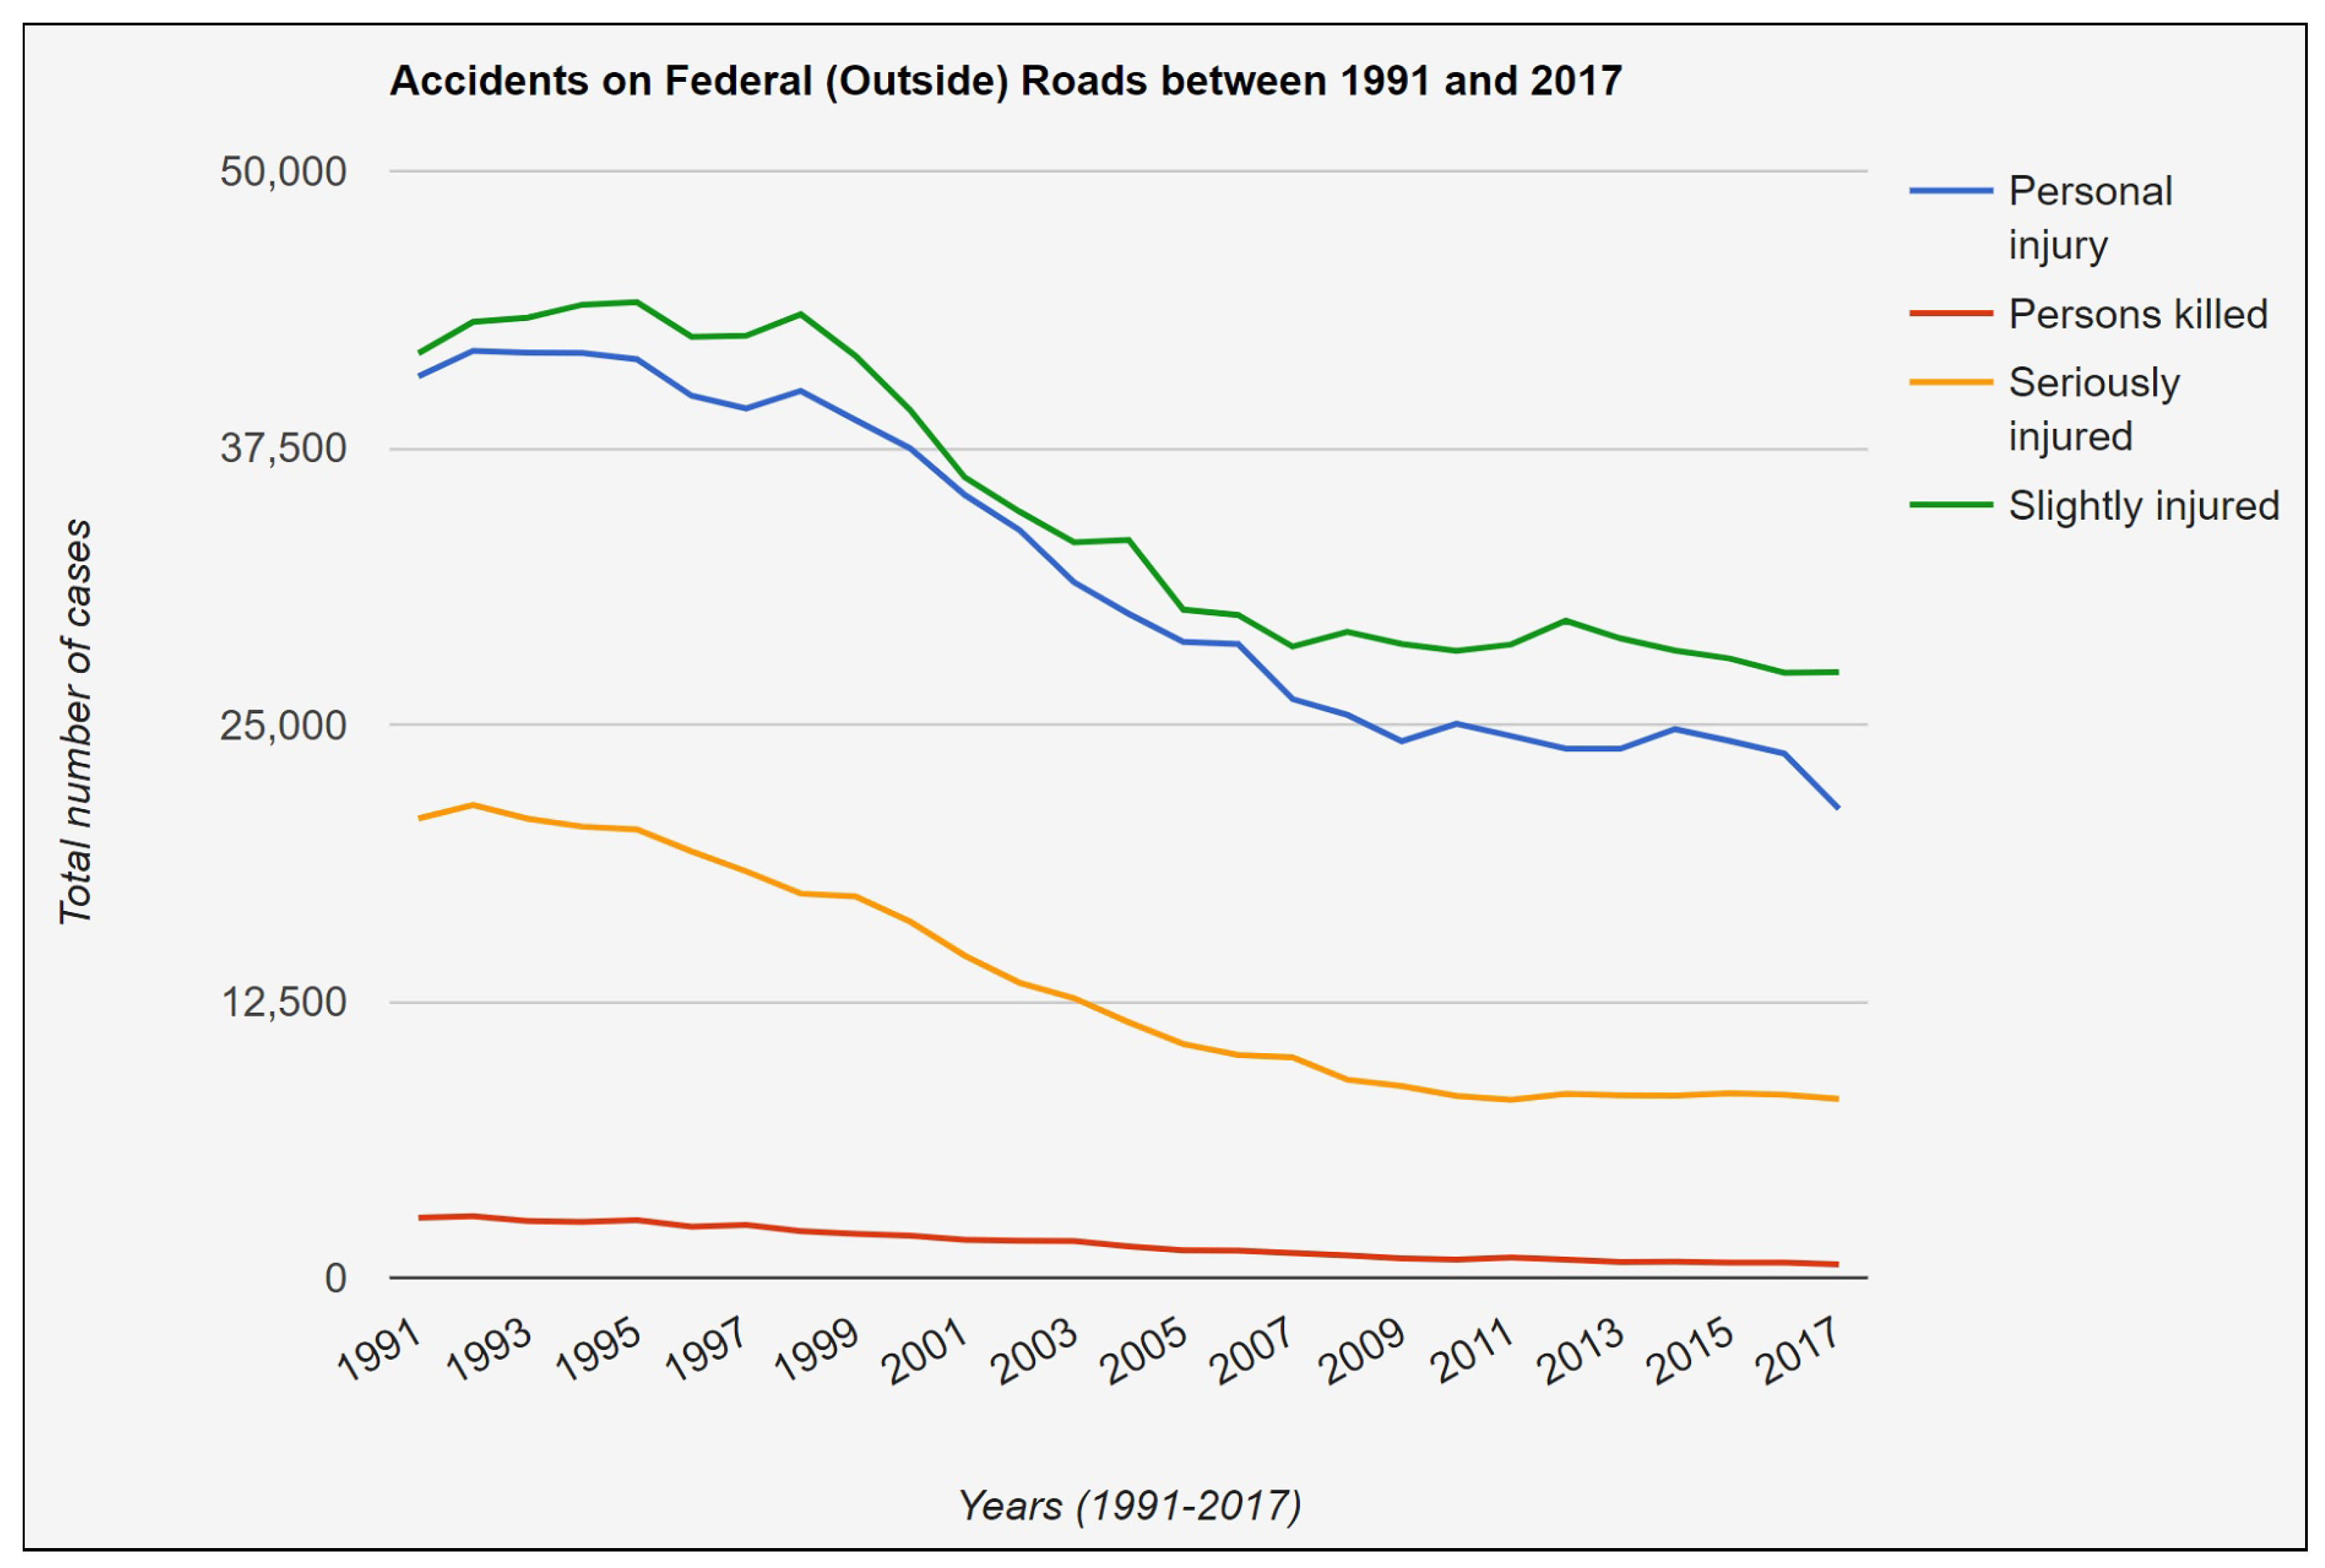
Analysis on Federal Roads:Figure 18 and
Figure 19 present the fact that varying levels of injuries caused inside the built-up areas on federal roads are higher than those caused outside of it. One main reason can be the presence of a number of activities inside the residential or commercial places when compared with the outskirts. Therefore, more accidents occur inside these populated places rather than outside of them. Though less in number, the accidents that do occur outside the city limits tend to be more brutal and severe, thus causing greater damage.
The recorded data on federal roads inside the build-up areas of era 1991–2017 presented in
Figure 18 shows that there were 1,044,451 cases of personal injuries, among them, 1,149,046 people faced slight injuries. Similarly, the recorded data on federal roads outside the built-up areas in the same era presented in
Figure 19 show that there were 858,154 cases of injuries, among them, 936,236 faced slight injuries. The difference between the numbers reverse, when the persons killed or severely wounded as a result of these accidents, are counted. There were 10,408 cases of death in the first scenario while 41,869 in other cases, which is a four-fold increase. Similarly, there were 208,959 people who faced serious injuries inside the built-up area while 357,817 were in other cases. Hence, there might be more accidents in cities or towns, but, outside of cities, these accidents are considered more dangerous due to the lack of facilities. At the same time, it is good to notice that German authorities are carrying out their duties rather effectively, and there is a stable decrease in the number of casualties and injuries over the years.
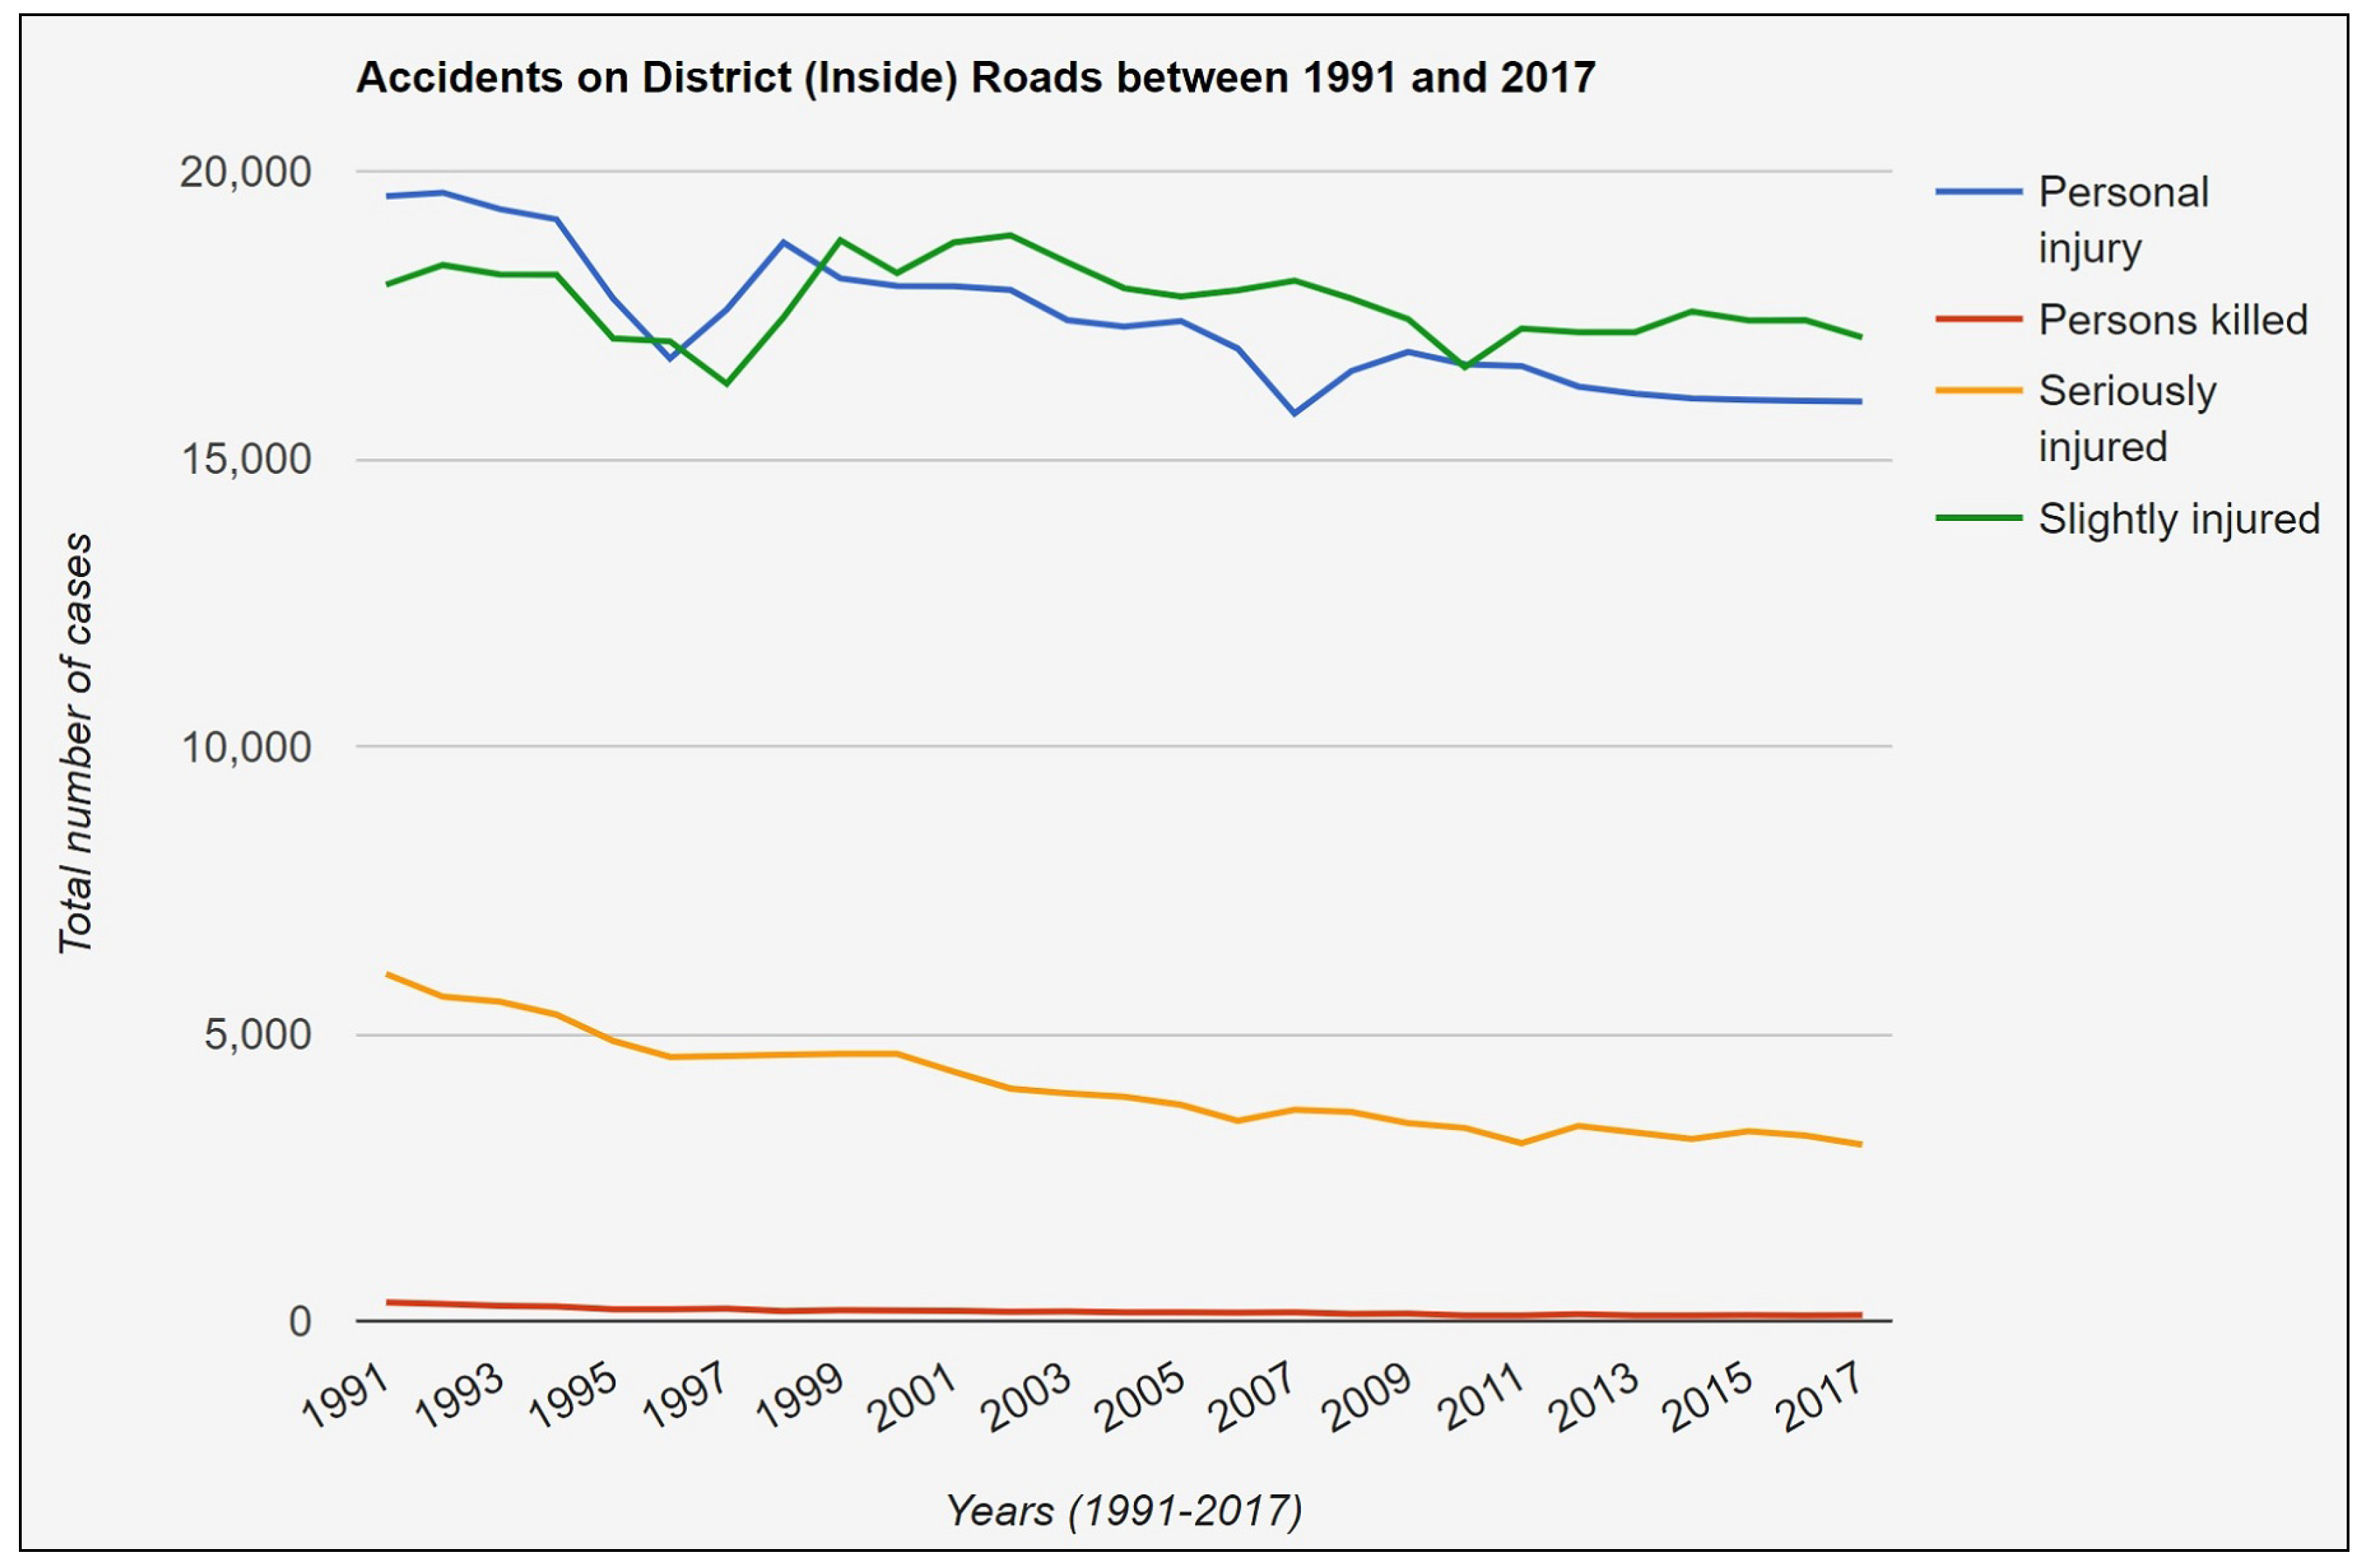
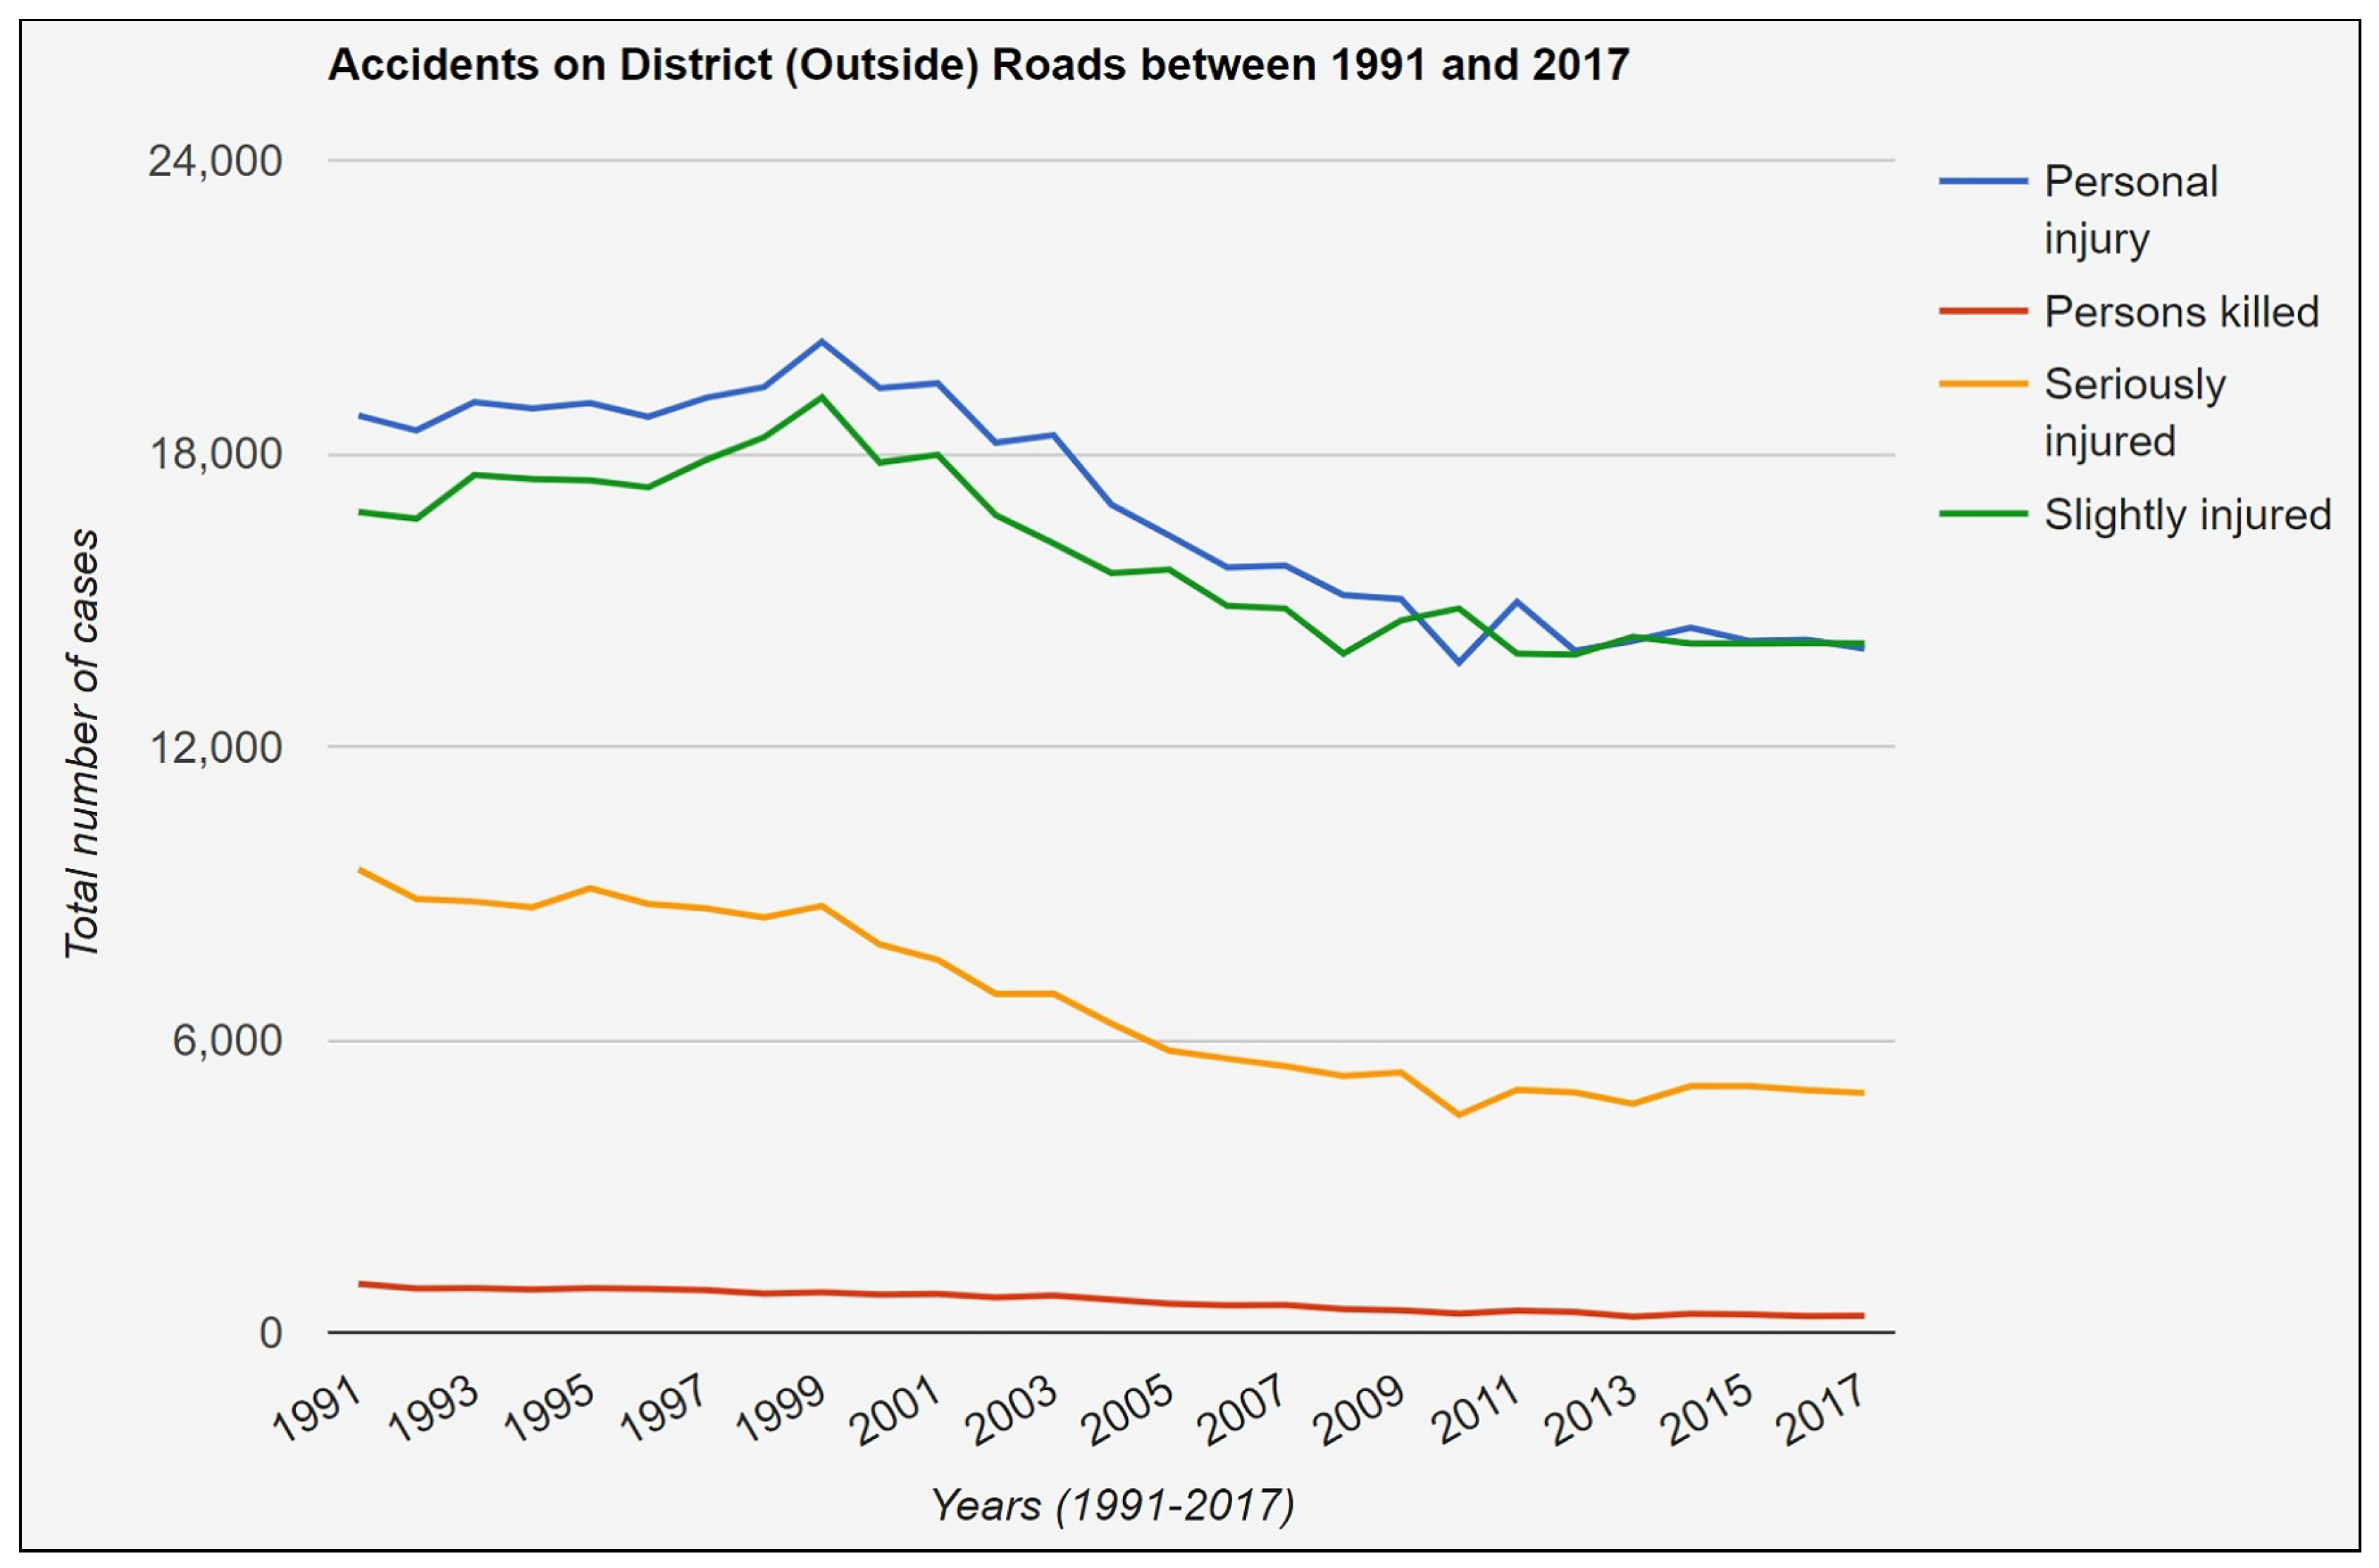
Analysis on District Roads:Figure 20 and
Figure 21 present a similar scenario of road accidents’ recorded data for the years 1991–2017 on the district roads. Although the total number of casualties and injuries on district roads is much less when compared to federal roads, the drop in personal wounds or slight injuries over the last decade is not very satisfying, especially in the case of roads inside the built-up areas. For instance, on the district roads inside the built-up areas, the number of personal injuries was 16,526 in the year 2008 while 15,997 in the year 2017, which is a mere decrease of 529 cases over a decade. Similarly, the number of people who faced mild injuries was 17,788 in 2008 and 17,109 in 2017, which is again a decrease of 679 cases. Although the overall trend is positive, a sharp decrease in these figures referenced is needed, especially at this period of time, when the roads in Germany are considered to be the safest.
The number of people who died as a result of a road accident inside built-up areas on a federal road in the year 1991 is 943, and for the year 2017 is 134, which is a seven-fold decrease. Similarly, the persons who died outside the built-up areas on a federal road in 1991 is 2713, compared to 688 for 2017, which is almost a drop of four times. The same is true for the district roads. Moreover, 325 and 999 people died in road accidents in the year 1991 inside and outside the built-up areas on district roads, respectively. The similar statistics are observed in 2017, hence indicating a decrease of around one-third.
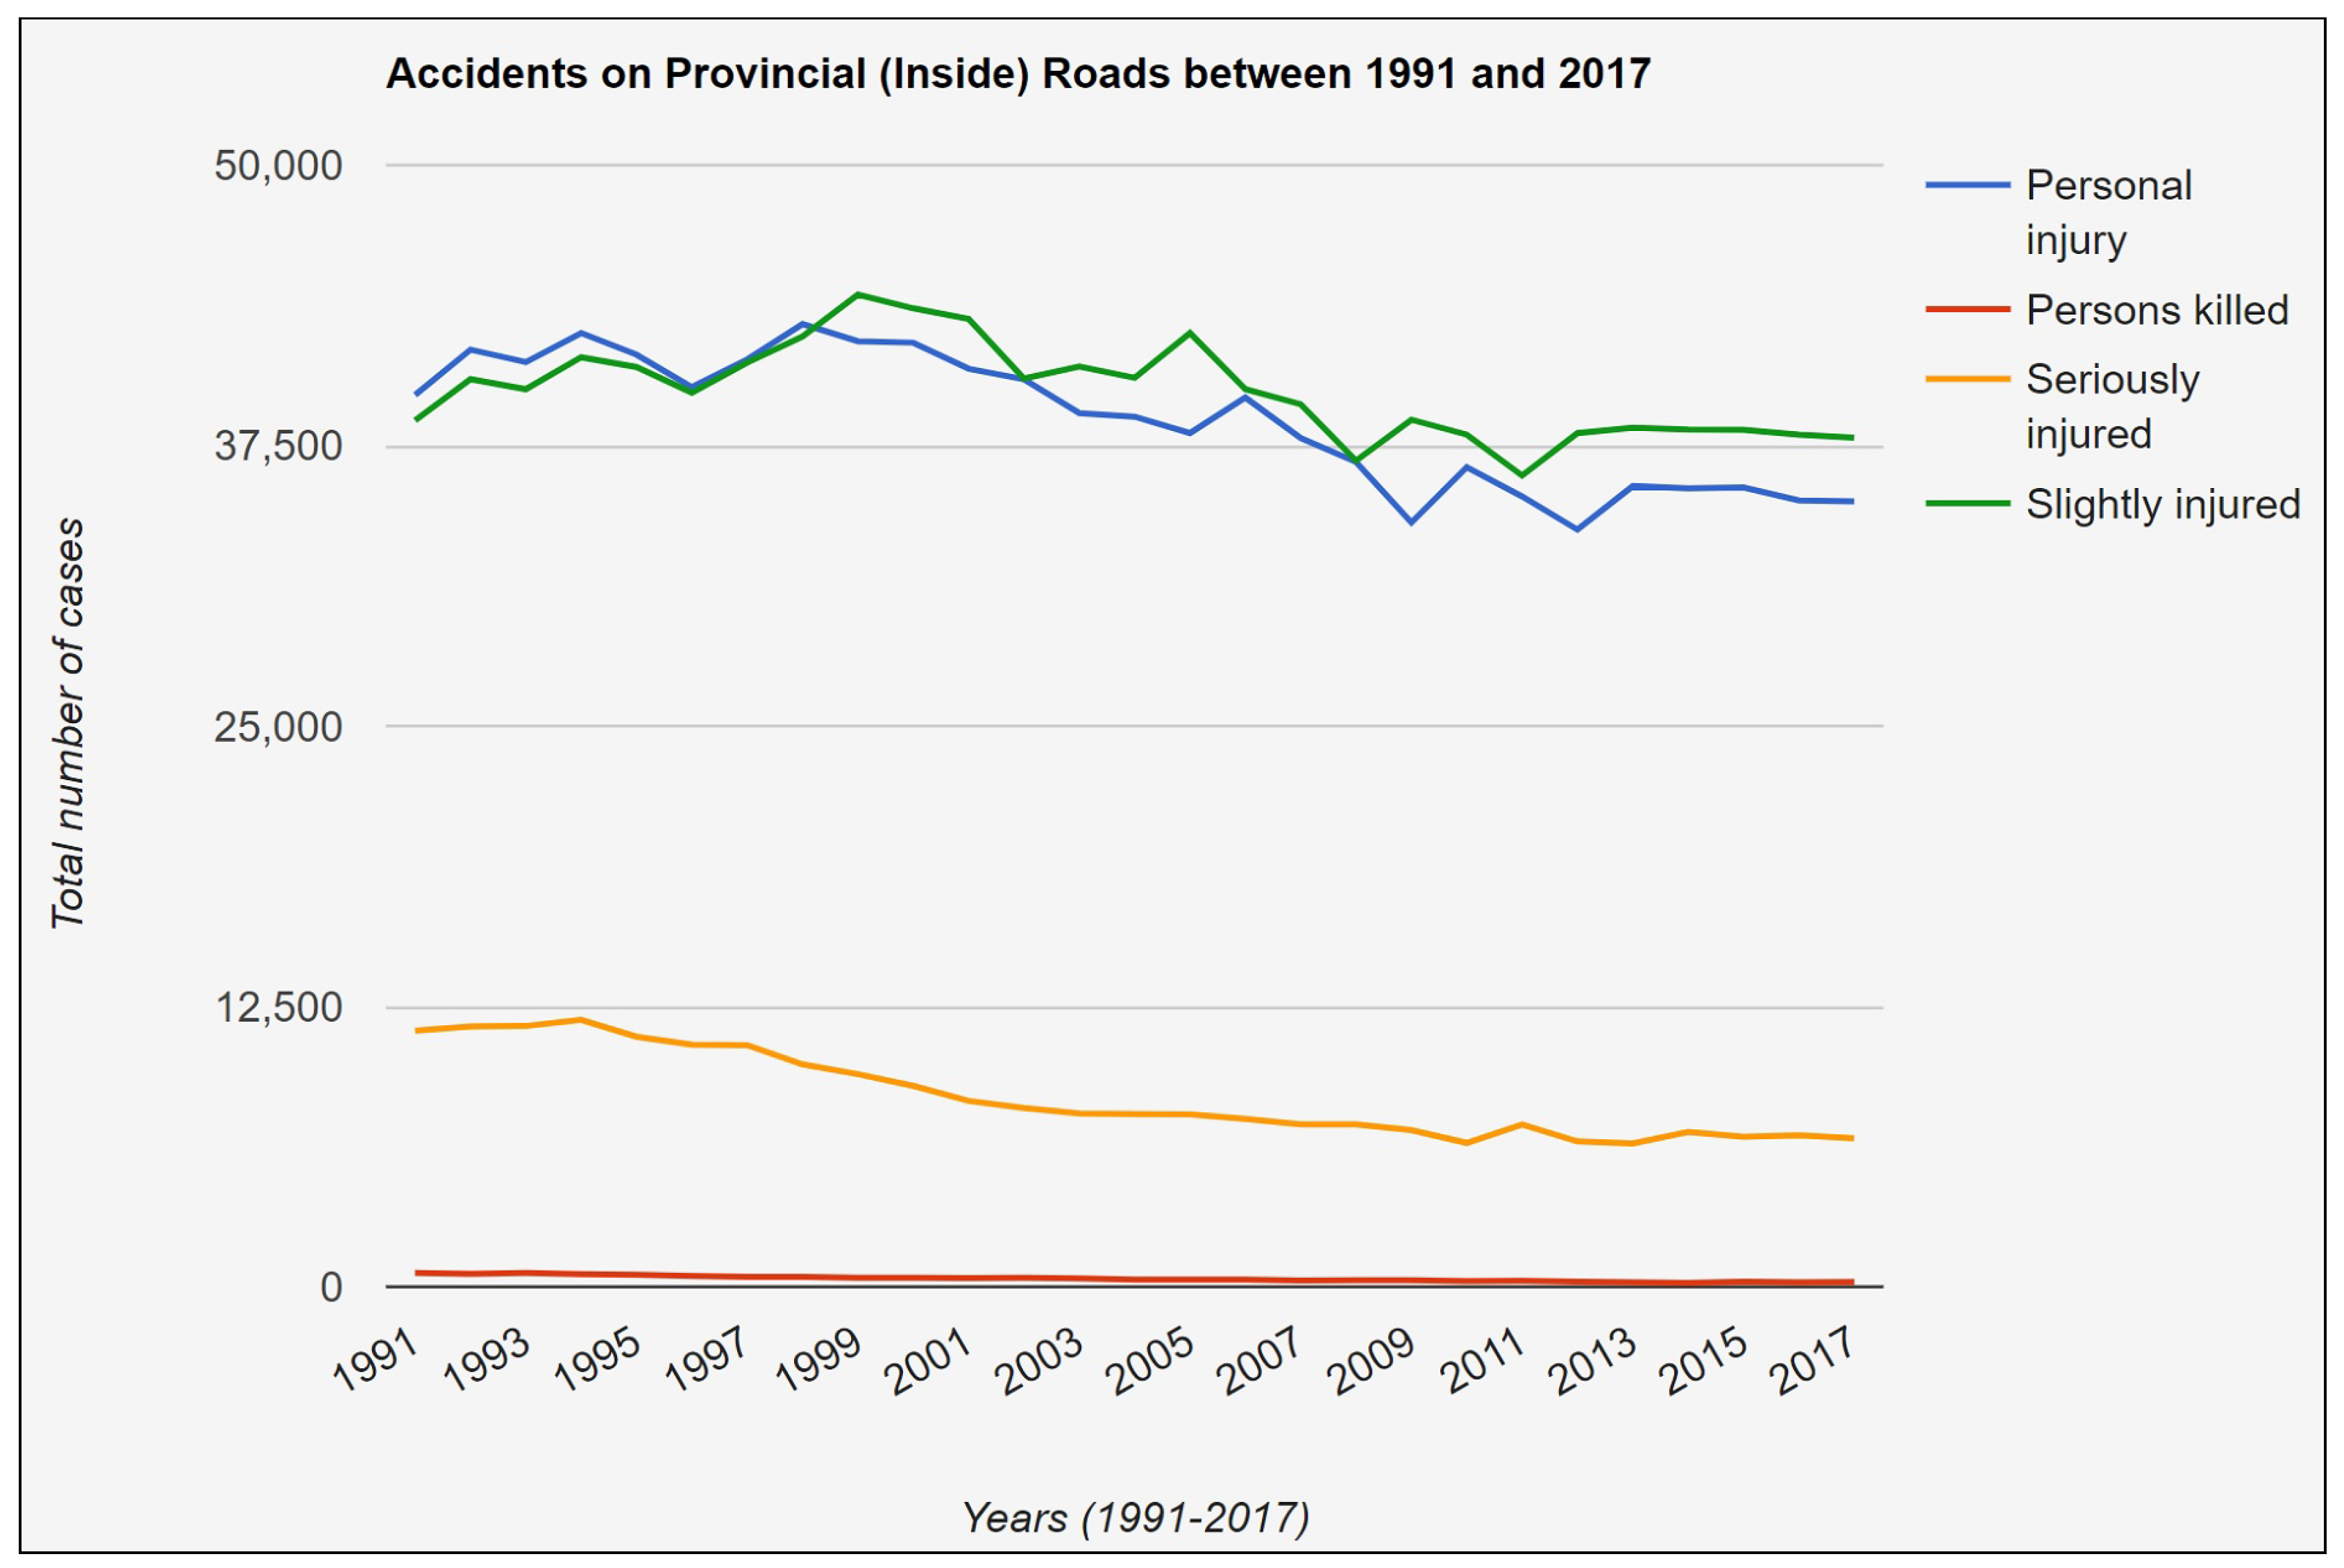
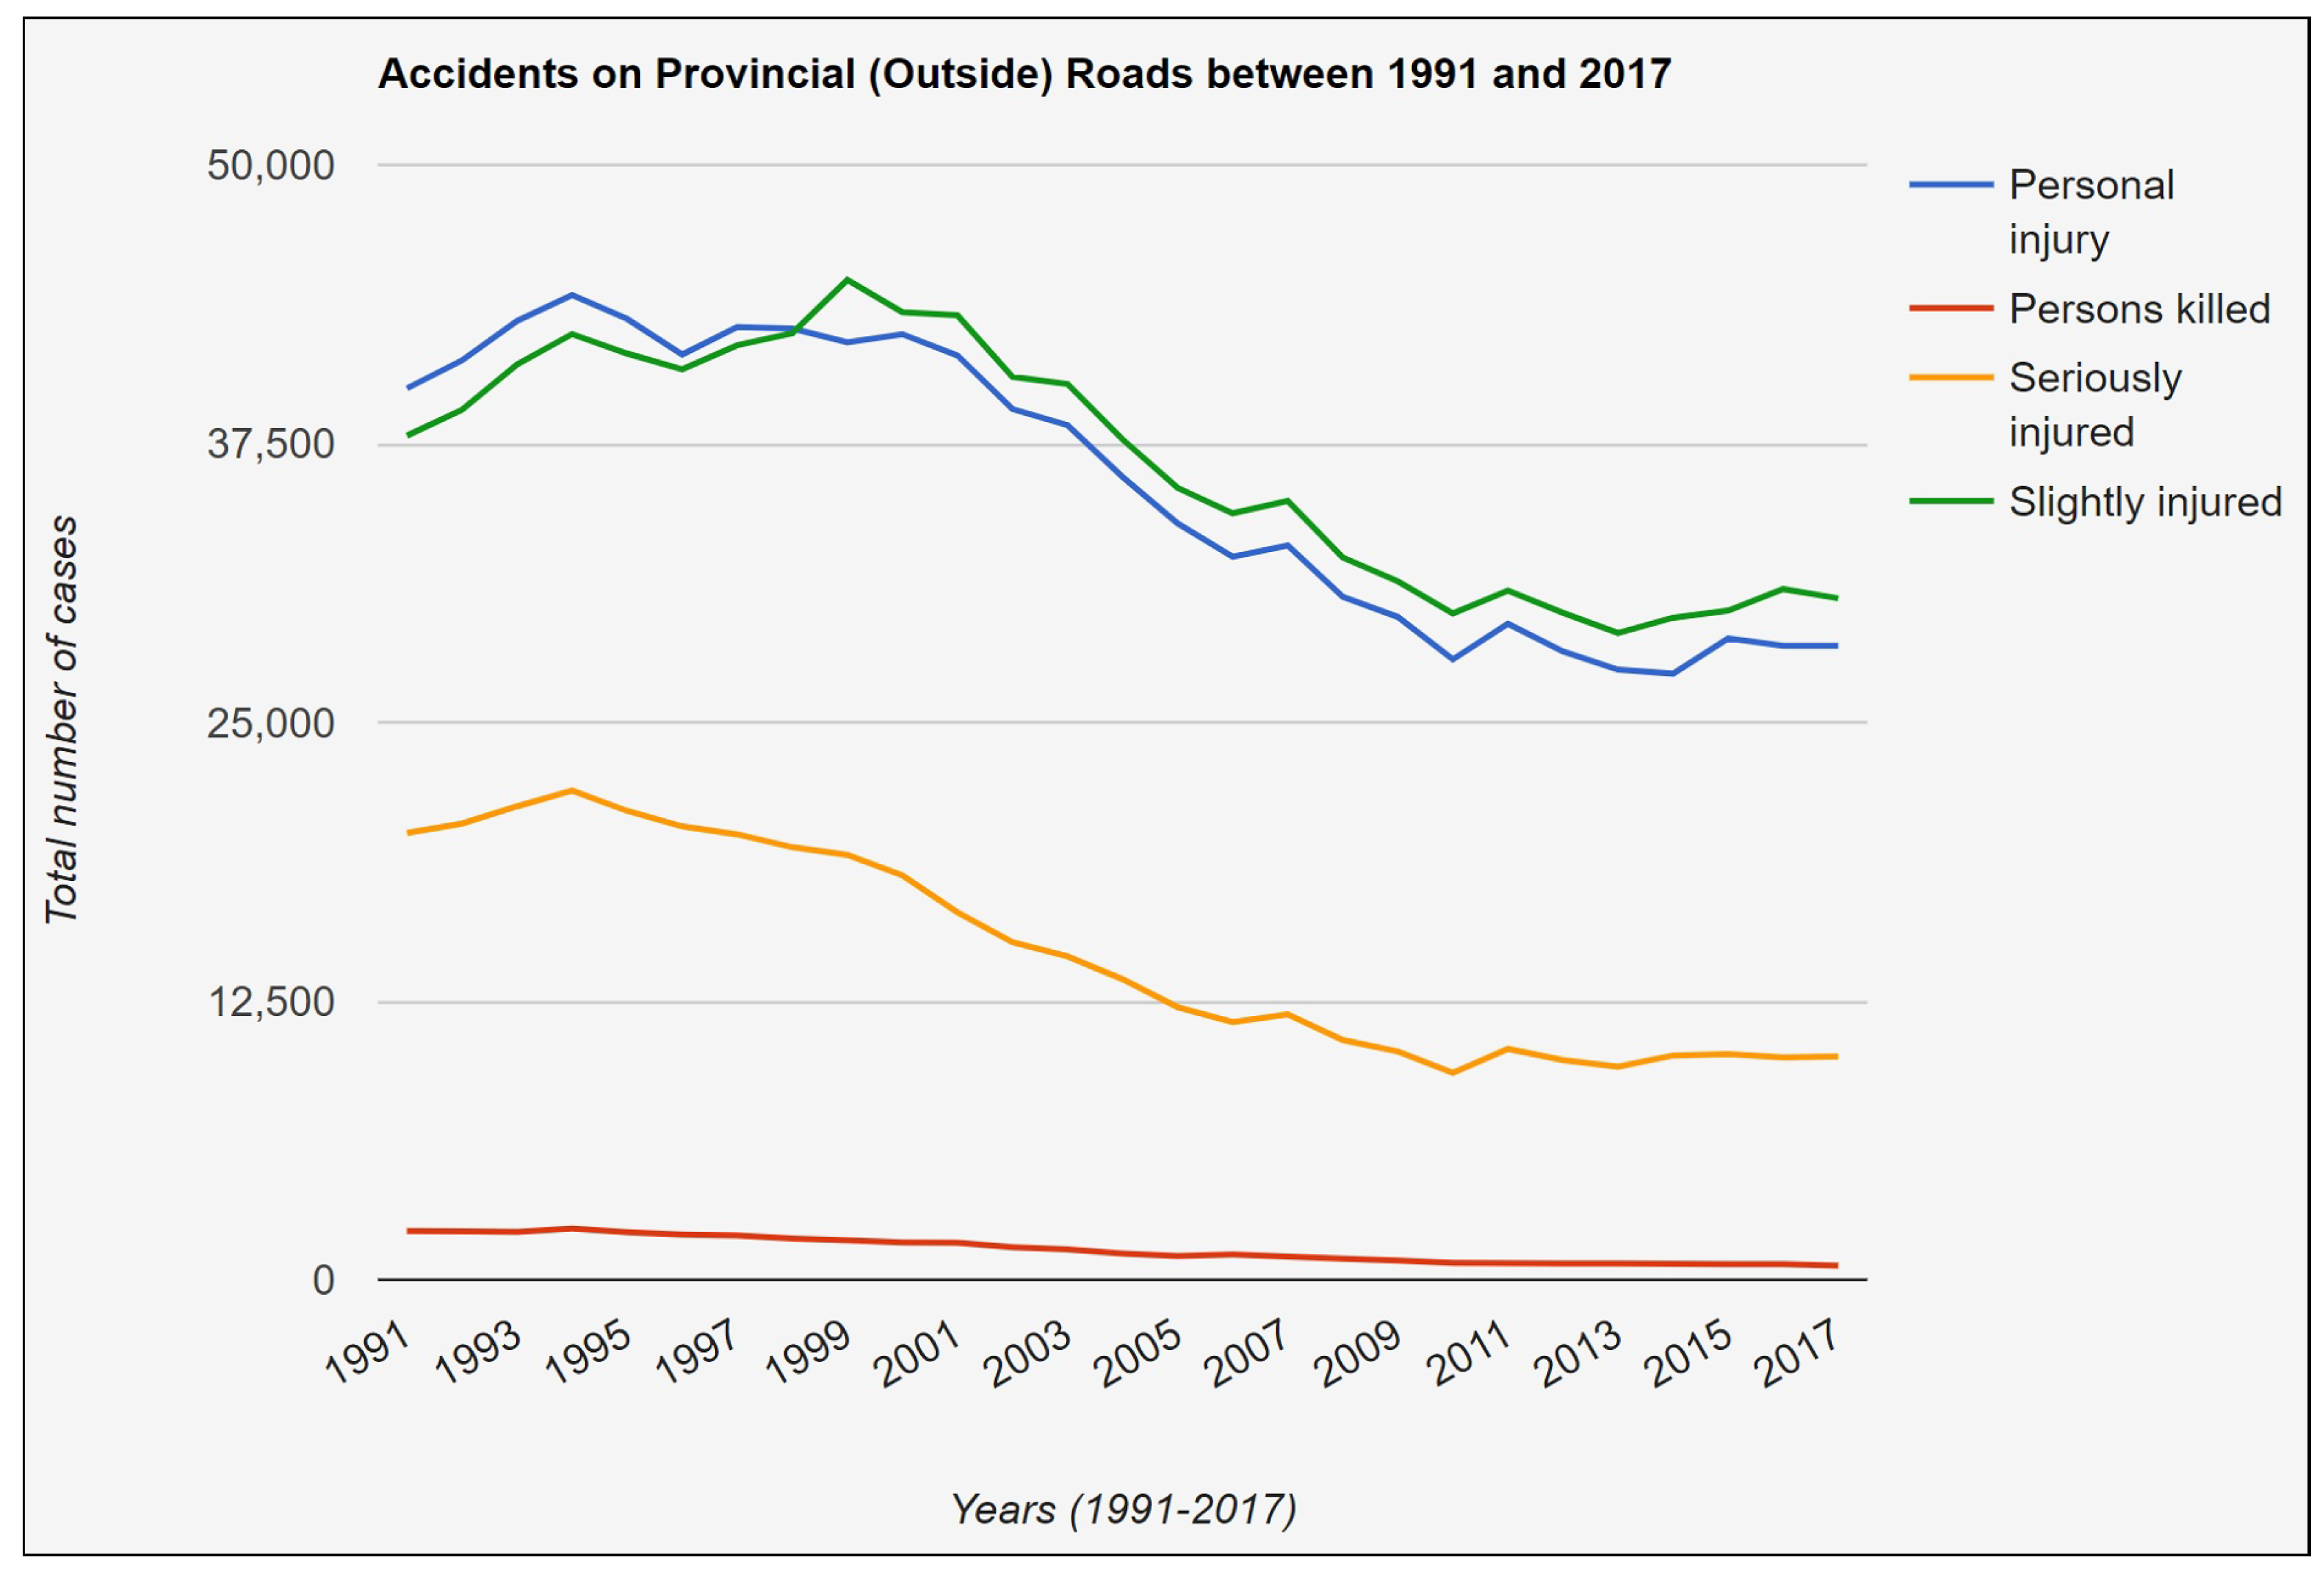
Analysis on Provisional Roads:Figure 22 and
Figure 23 illustrate the number of casualties and injuries that occurred inside and outside the built-up areas on provincial roads, which indicates a greater loss than occurred on district roads, but less than the federal roads. A positive trend of dropping the number of injuries is observed inside and outside of the built-up areas 2015 and 2017. Although the trend in
Figure 22 and
Figure 23 might give a different impression, the total number of personal injuries on both types of these roads is very similar.
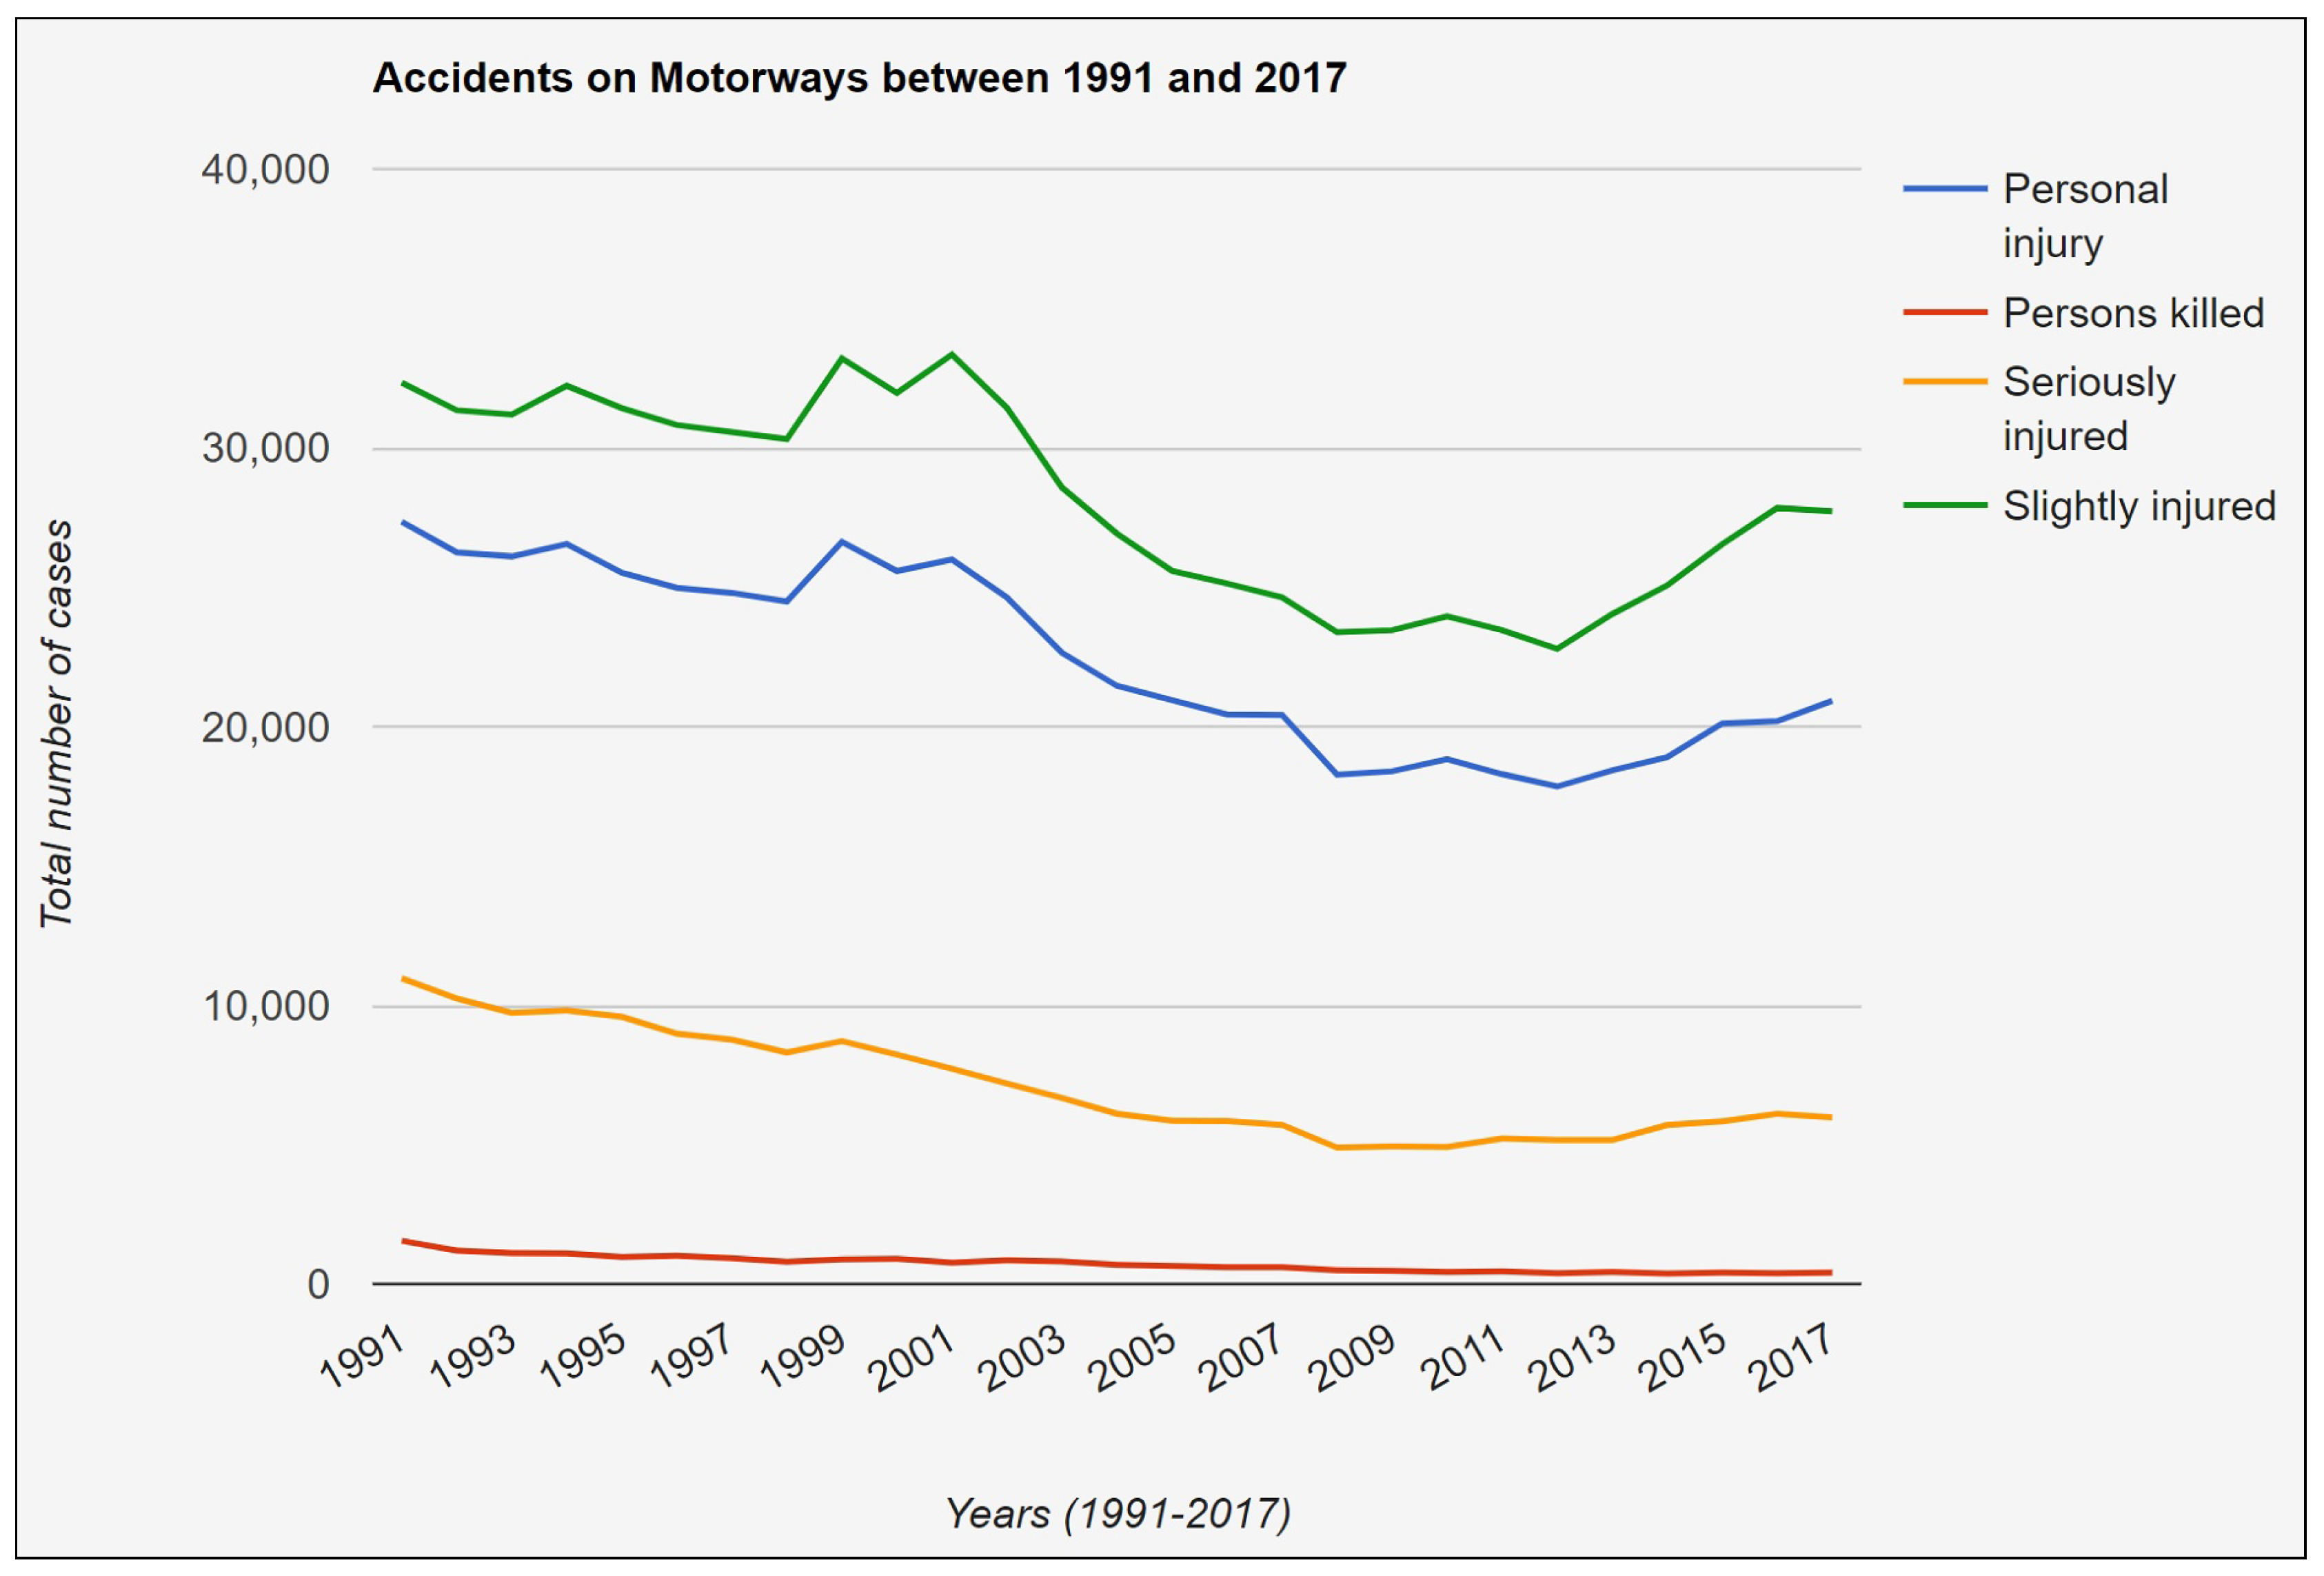
Analysis on the Federal Motorway: The federal motorway (Bundesautobahn) is the federally-controlled-access highway system throughout all of Germany. For some classes of vehicles, this motorway has no speed limit, which makes it unique and popular throughout the world.
Figure 24 presents the recorded data of federal motorways; it is observed that the number of personal injuries was decreasing up until 2012; then, it began to grow; since then, the number of personal injuries was increased in 2017. Similarly, the people who were slightly and severely injured or died in a road accident have also increased in 2017.
The reason might be the increasing economic activity, as Germany is now the world’s fourth largest and Europe’s biggest economy. The most visual proof of its financial activity is the number of large logistics vehicles that carry goods and supplies to-and-fro, on its highways and motorways. In order to postulate a more convincing theory, further analysis of this subject is required.
4.6. Major Causes of Road Accidents Based on Types of Vehicles
When it comes to roads and highways, there are different classes of vehicles that share the road, not just passenger-cars. The traffic on the road also constitutes two-wheel bicycles, public transport buses, and large Goods-transport trucks and lorries. Furthermore, there can be different causes of accidents stemming from a diverse set of situations. Therefore, data analysis is carried out on the raw data to explain the most common causes of road accidents, depending upon the type of vehicle used, which is plotted below.
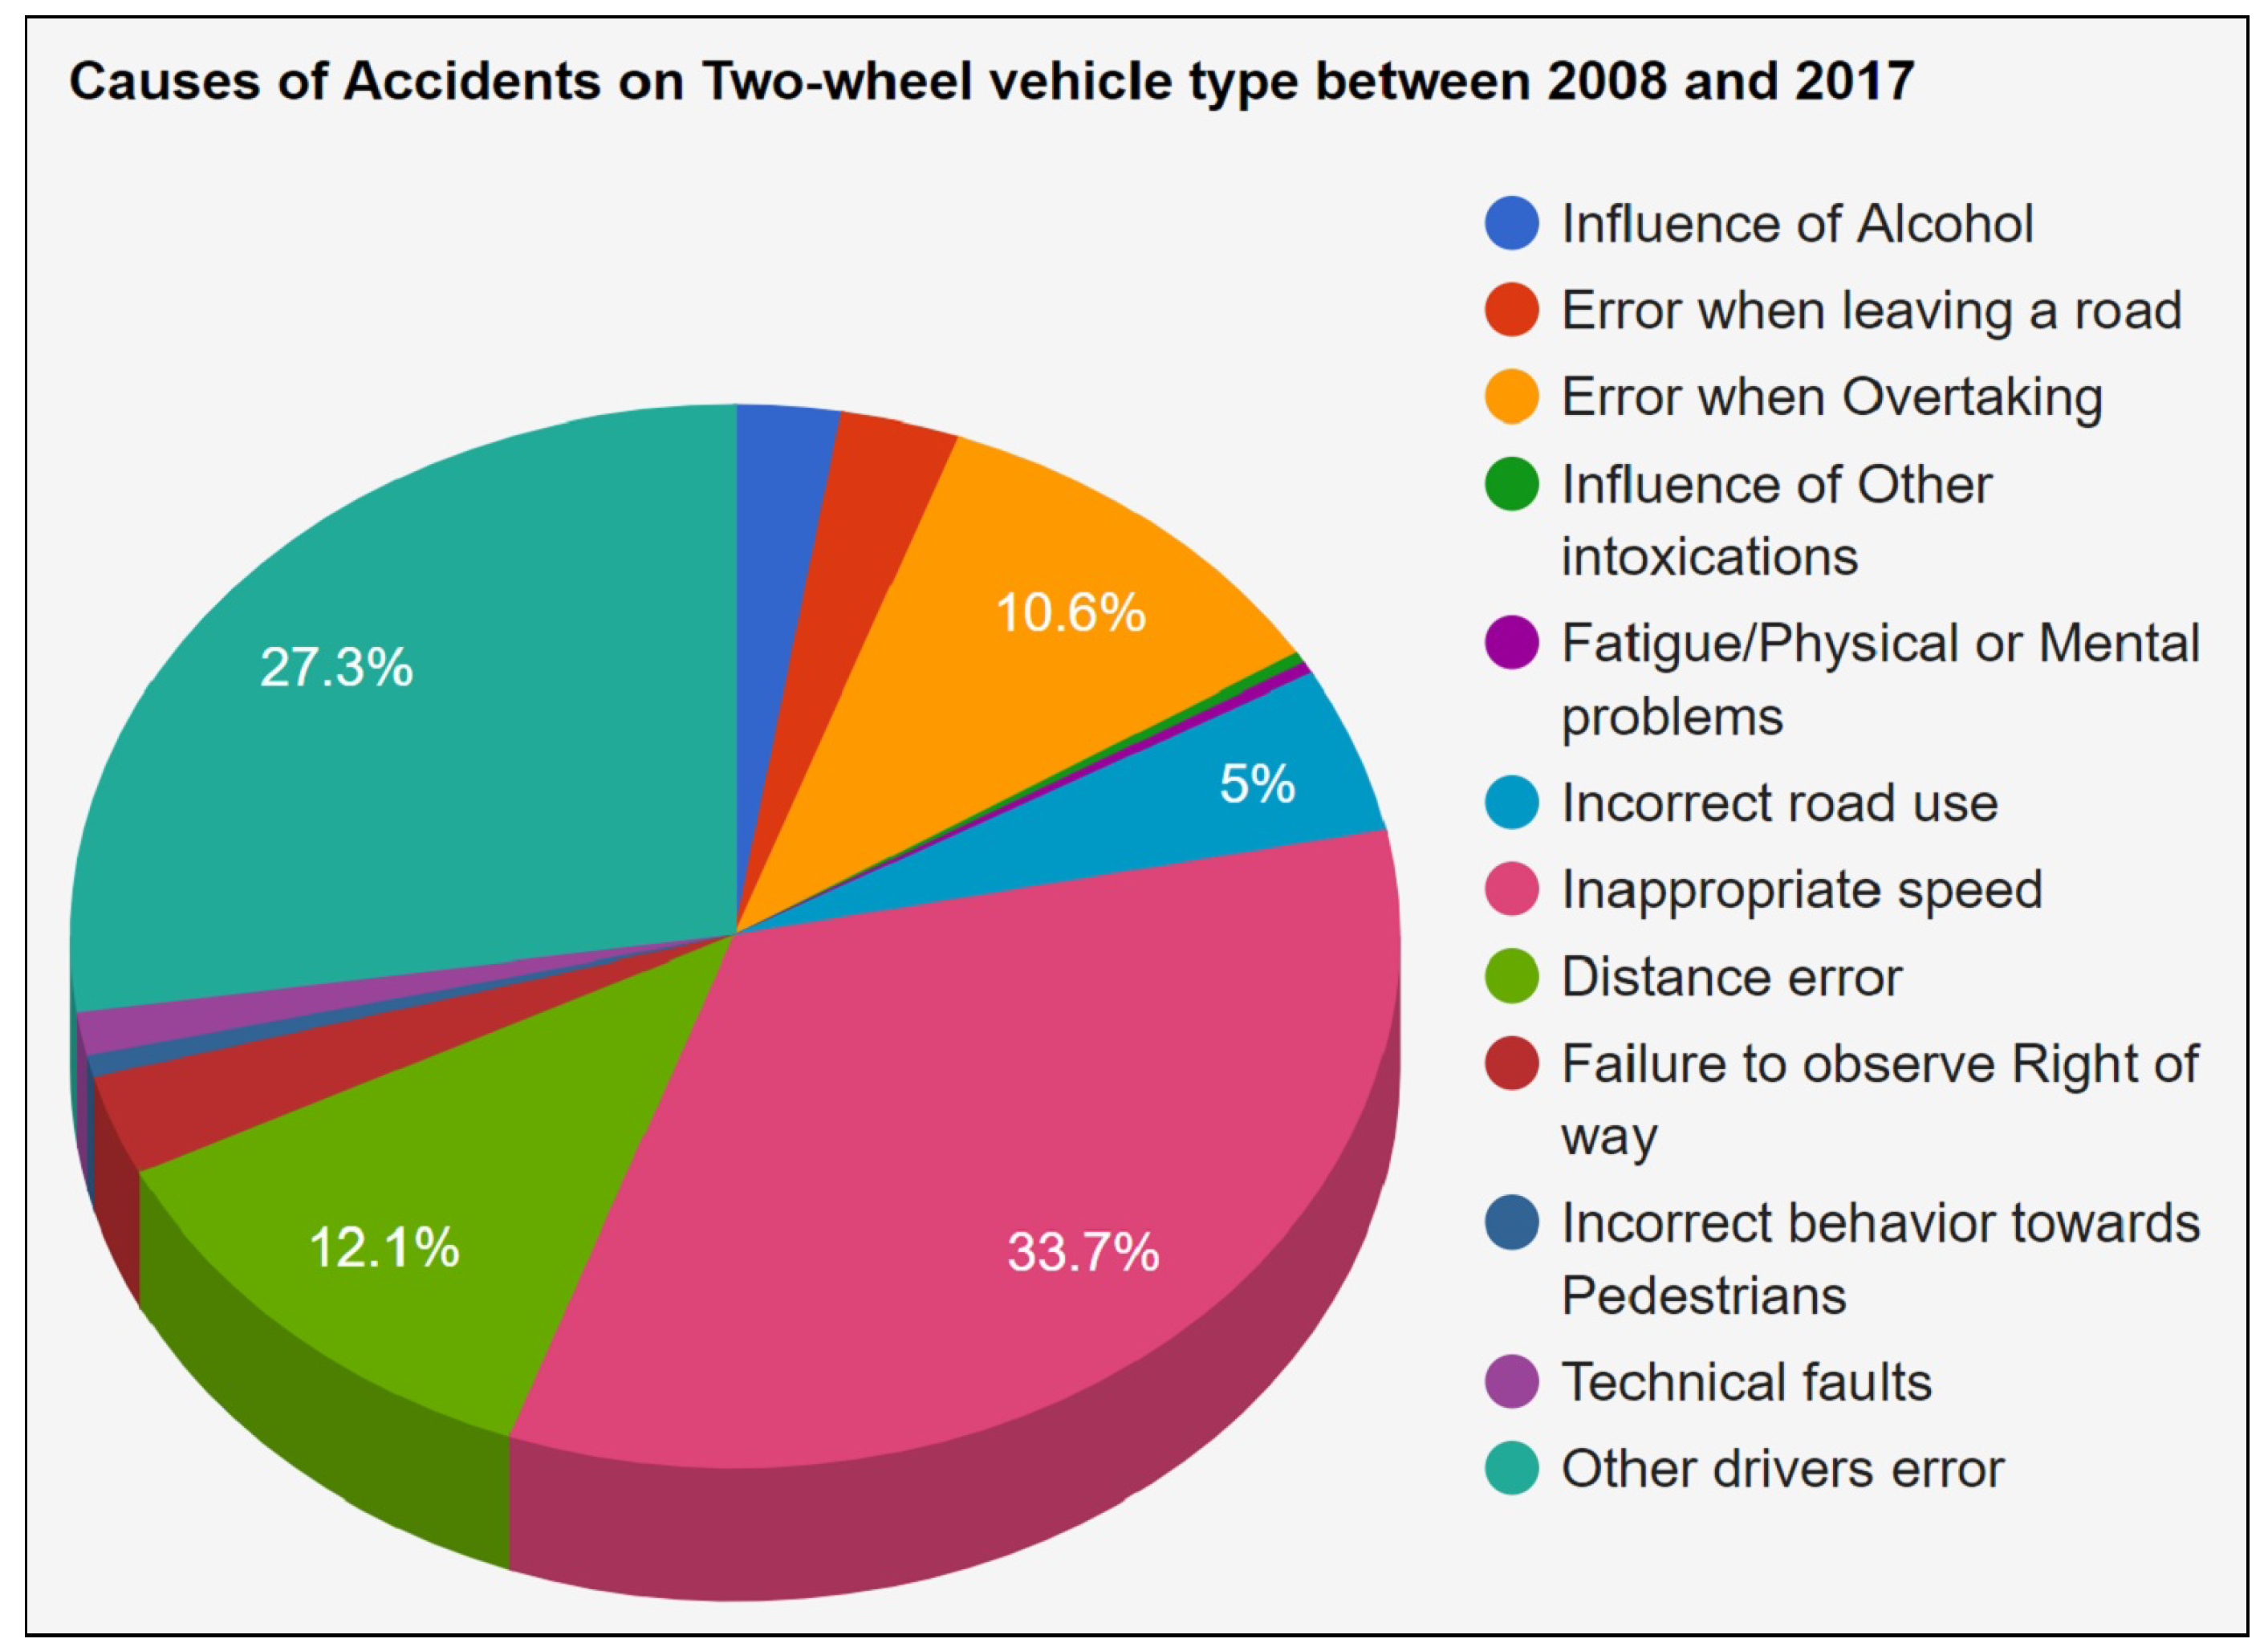
Figure 25 presents the 12 most common reasons for an accident of a two-wheel vehicle on the roads. In Germany, there are many different types of two-wheel motor vehicles, but they all have to comply with these rules: the driver must always wear a helmet, must have insurance, and must have reached the minimum required age for driving [
22]. Despite the effective implementation of these rules, accidents do occur, and, out of the 12 above-mentioned causes, inappropriate speed is the biggest reason, resulting in
of all accidents, which is one-third of all incidents involving two-wheel vehicles in the last 10 years. It has also been analyzed that the accident is not always the fault of a driver him/herself. Many times, it is another driver’s mistake that costs lives. As it is observed in
Figure 25, the second most common reason for a road accident in this category is ‘other driver’s error’, which accounts for
of all such accidents in the last 10 years. In third place is the ‘distance error’, which accounts for
of all such accidents; therefore, it is very important to keep a safe distance from the vehicle in the front. This is followed by an error when overtaking another vehicle, and incorrect use of the road, in fourth and fifth positions, respectively.
According to the Federal Statistical Office of Germany (Destatis), by the end of October 2018, traffic accident fatalities have gone up roughly
year-on-year [
23].
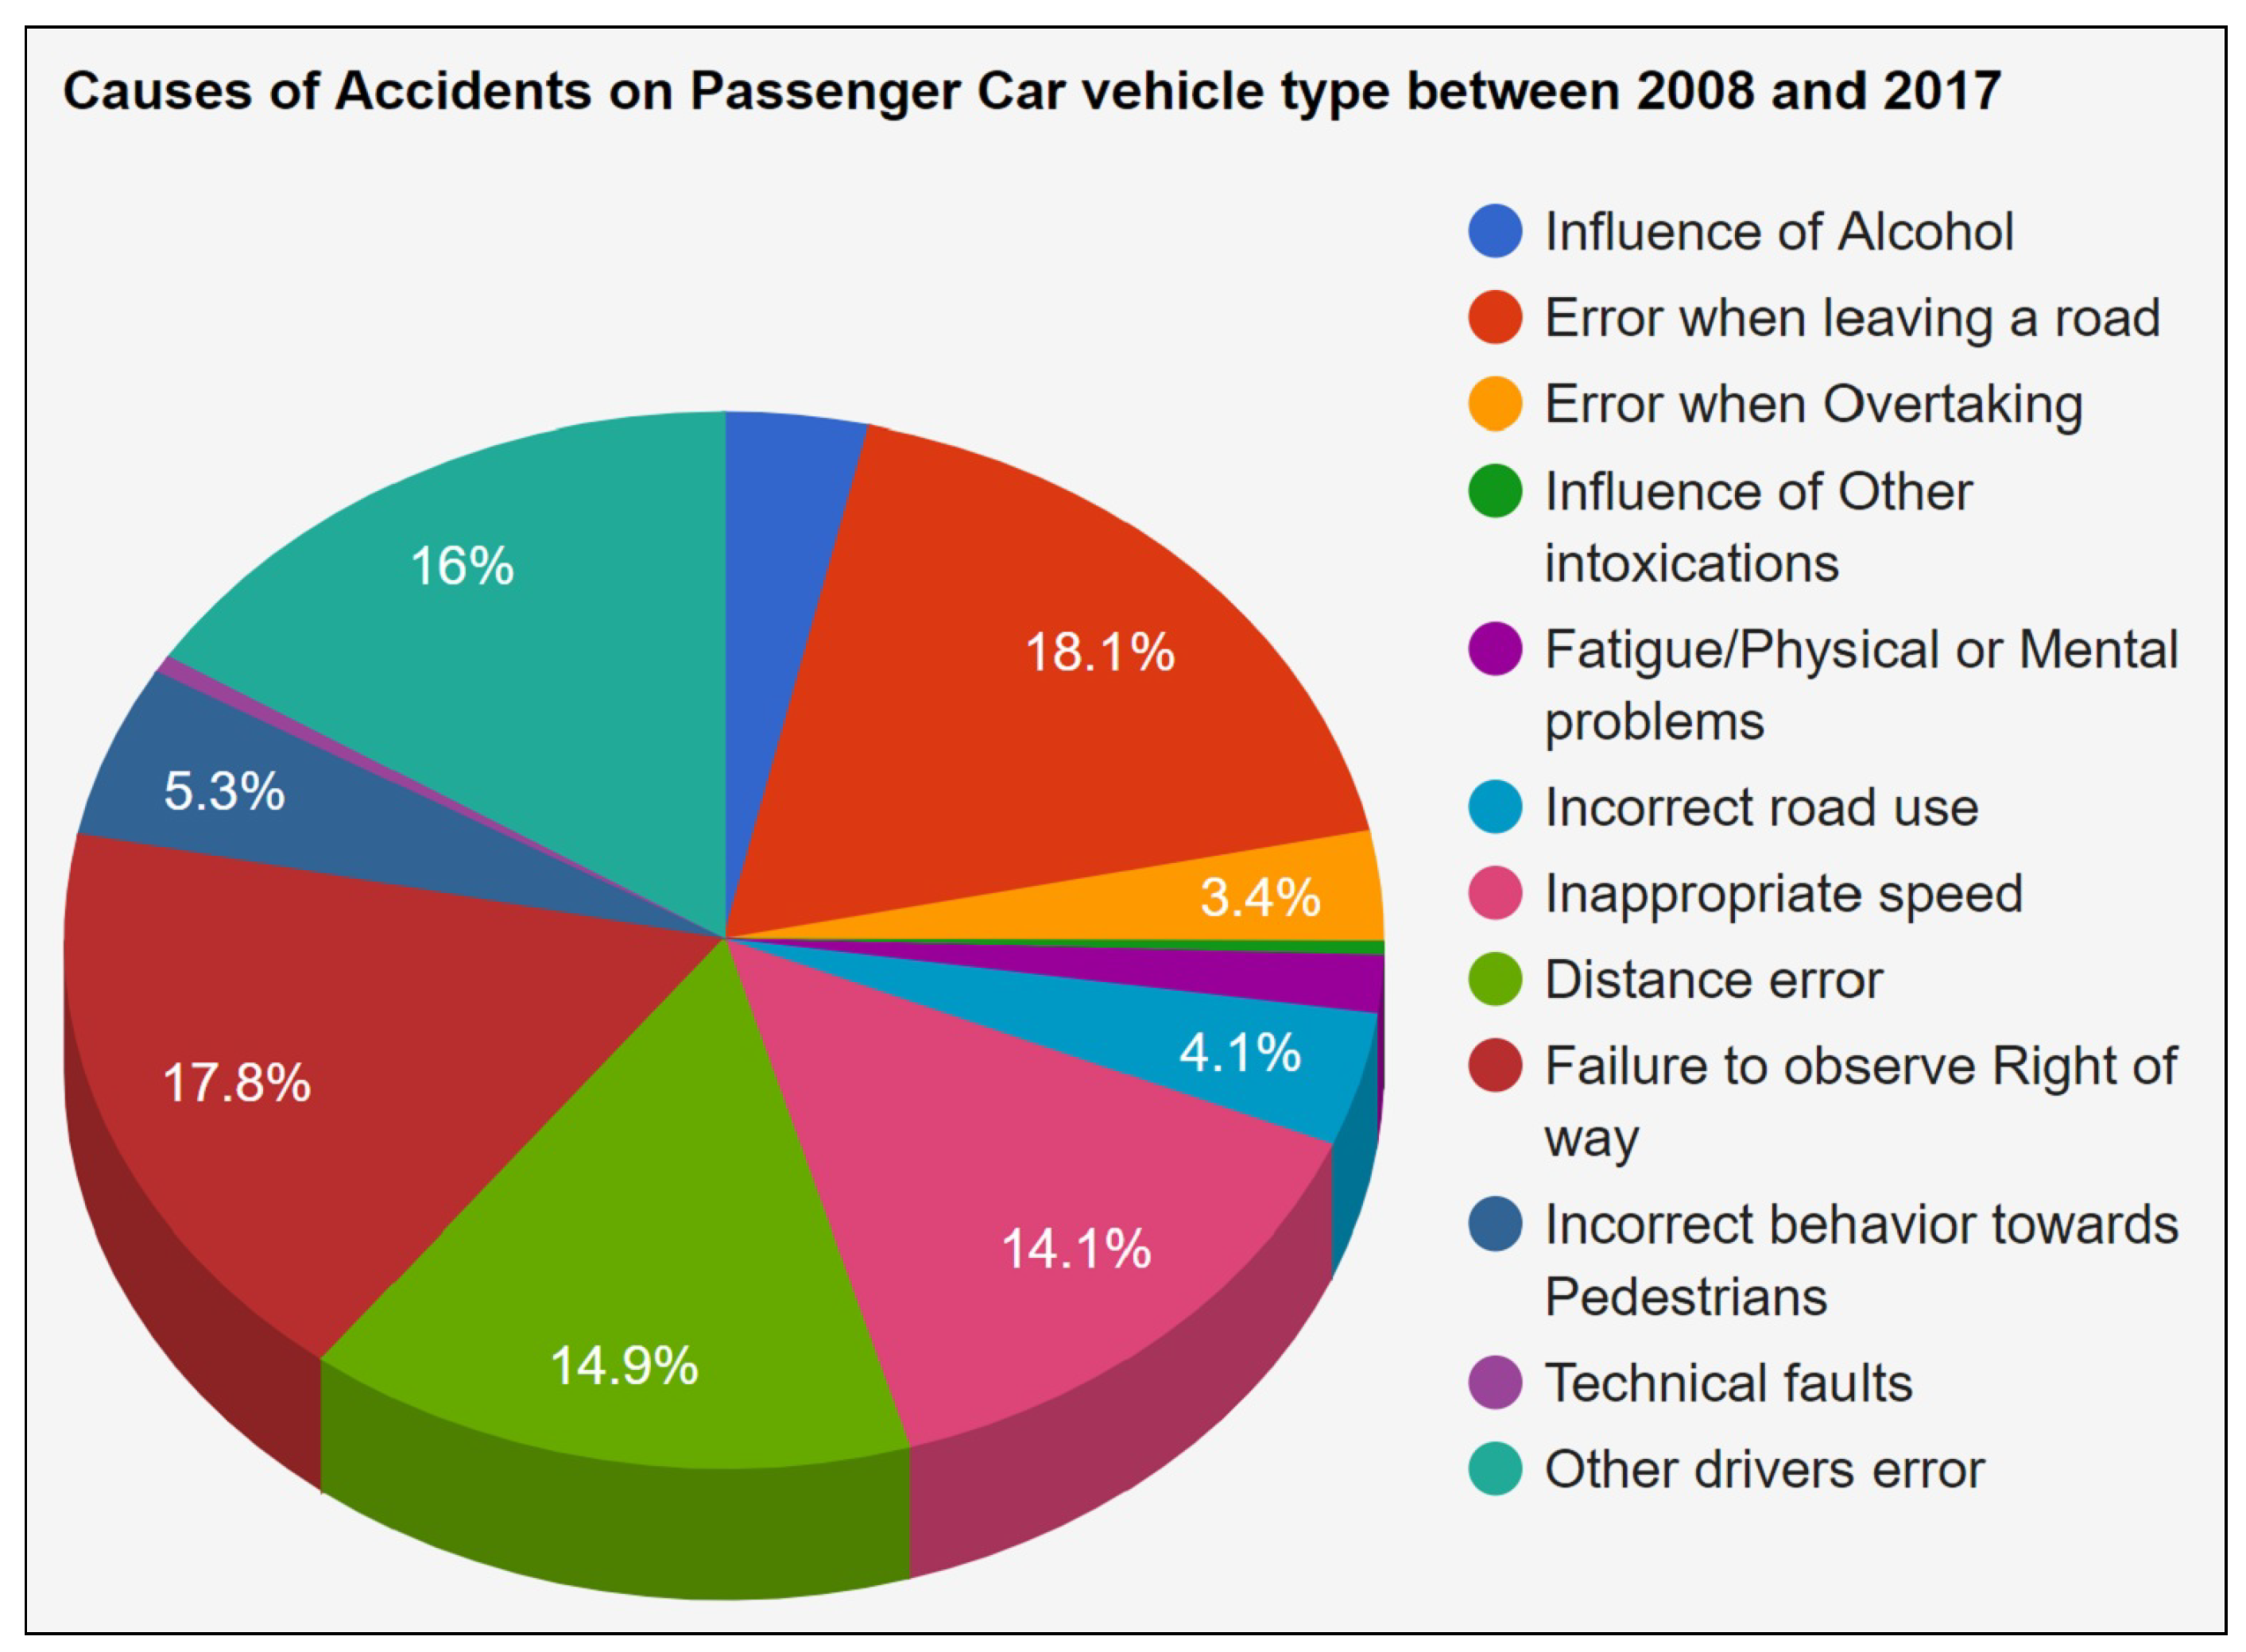
Figure 26 lists the main causes of road accidents involving a Passenger Car. Additionally, there are certain additional rules that need to be followed by the driver and accompanying passengers sitting in a passenger car [
22].
All occupants inside a car must wear seat belts, including those in the back seat.
All children who are 150 cm or less in height must be placed in a child seat.
No phone calls or chat application should be taken/used while driving.
All speed limits on different parts of the road must be respected.
Driving is not allowed while under the influence of alcohol.
The biggest cause of road accidents involving Passenger Cars is ‘the error when leaving the road’. It also includes applying a reverse gear or going backward when leaving the main road to get into a smaller road or alley. It accounted for nearly 440,000 road accidents in the last 10 years, which makes of all such accidents. The second most common reason is ‘the failure to observe the right of way’. Drivers of motor vehicles always have to yield the right-of-way to a close pedestrian, within any marked crosswalk. Not doing so is dangerous and can result in catastrophic accidents. The driver’s fault, distance error, and inappropriate speed are the other causes of road accidents involving 4-wheel automobiles.
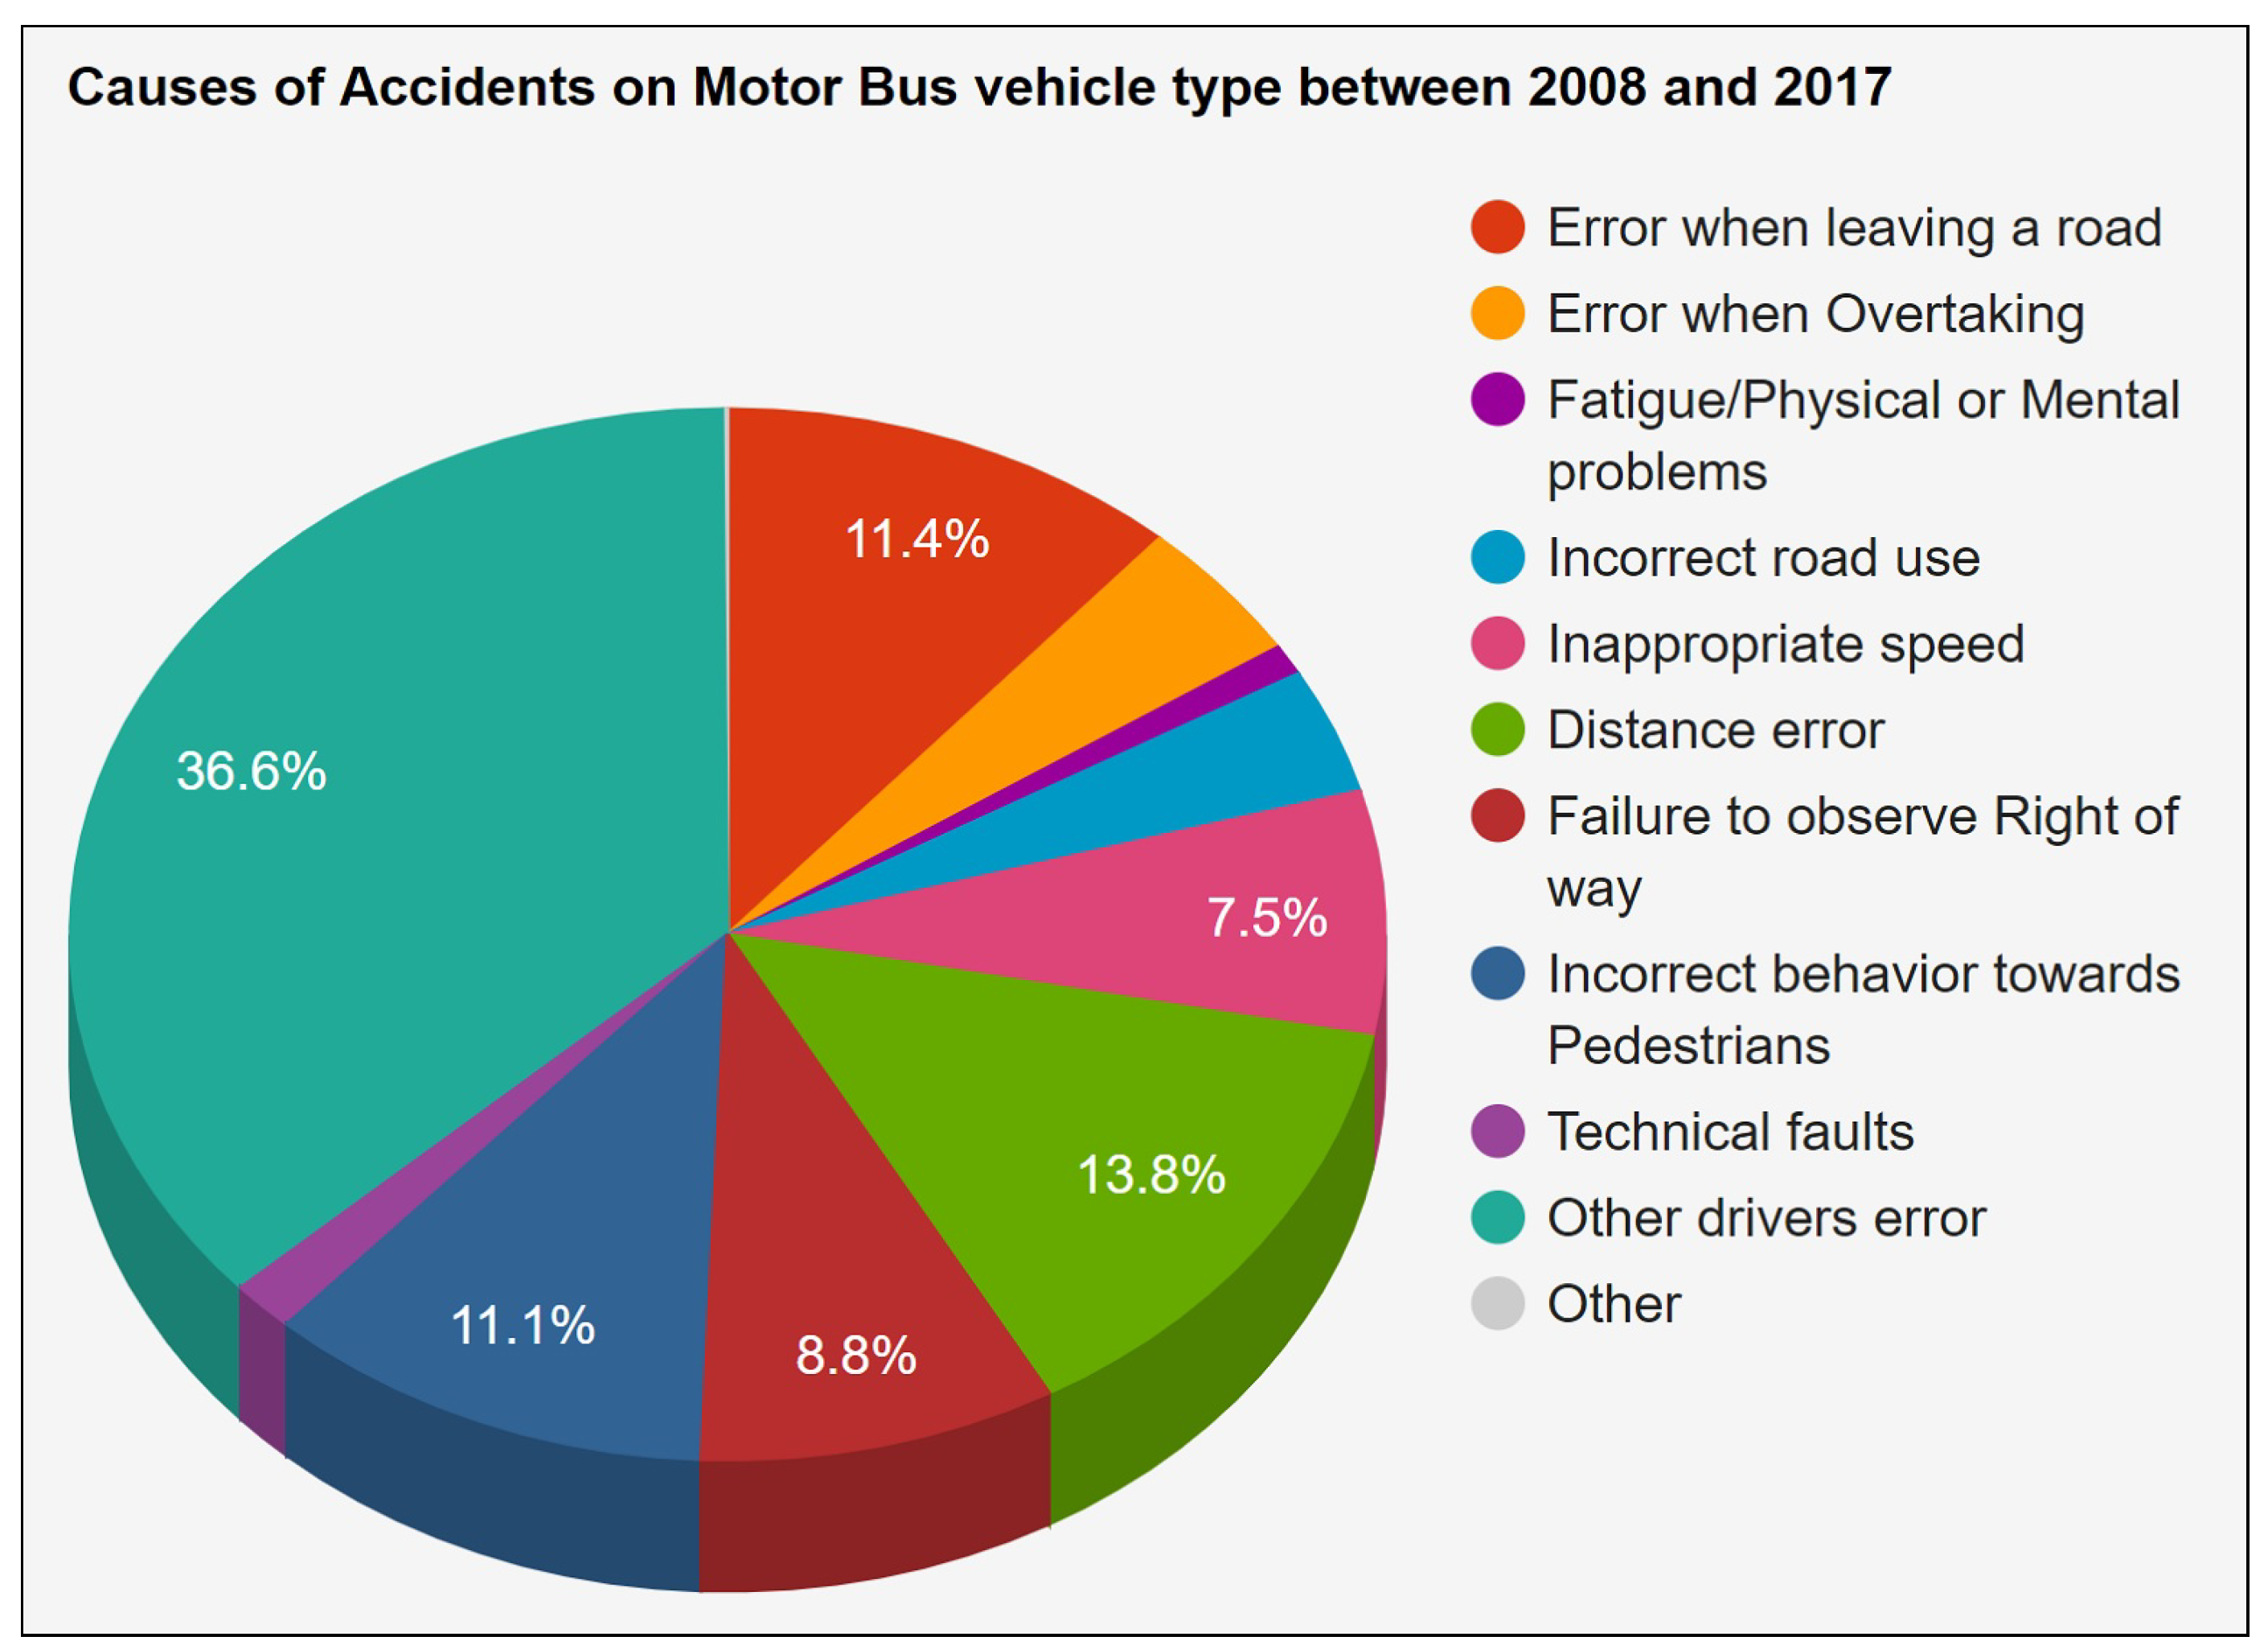
For further analysis, the other two modes of transportation on the road, i.e., public buses and goods transport vehicles, are considered. Mobility is the cornerstone of any modern society and the fuel for a thriving economy. In most European countries, the public at large use motor buses as their daily conveyance. Therefore, it is significant to note the fundamental causes that result in road accidents involving public buses.
Figure 27 presents the fact that
, or more than one-third of all accidents involving motor buses occur due to ‘another driver’s error of judgment’. This is something very ironic—that even one person’s slight mistake while he or she is in the driver’s seat can, knowingly or unknowingly, affect so many other lives. Hence, strict implementation of driving rules and regulations is extremely necessary for any society. The second biggest cause, which appeared the last two times as well, is ‘distance error’, making up
of accidents involving motor buses. The other important reasons include ‘the error when leaving the road’, ‘incorrect behavior towards the pedestrians’ and ‘failure to observe the right of way’.
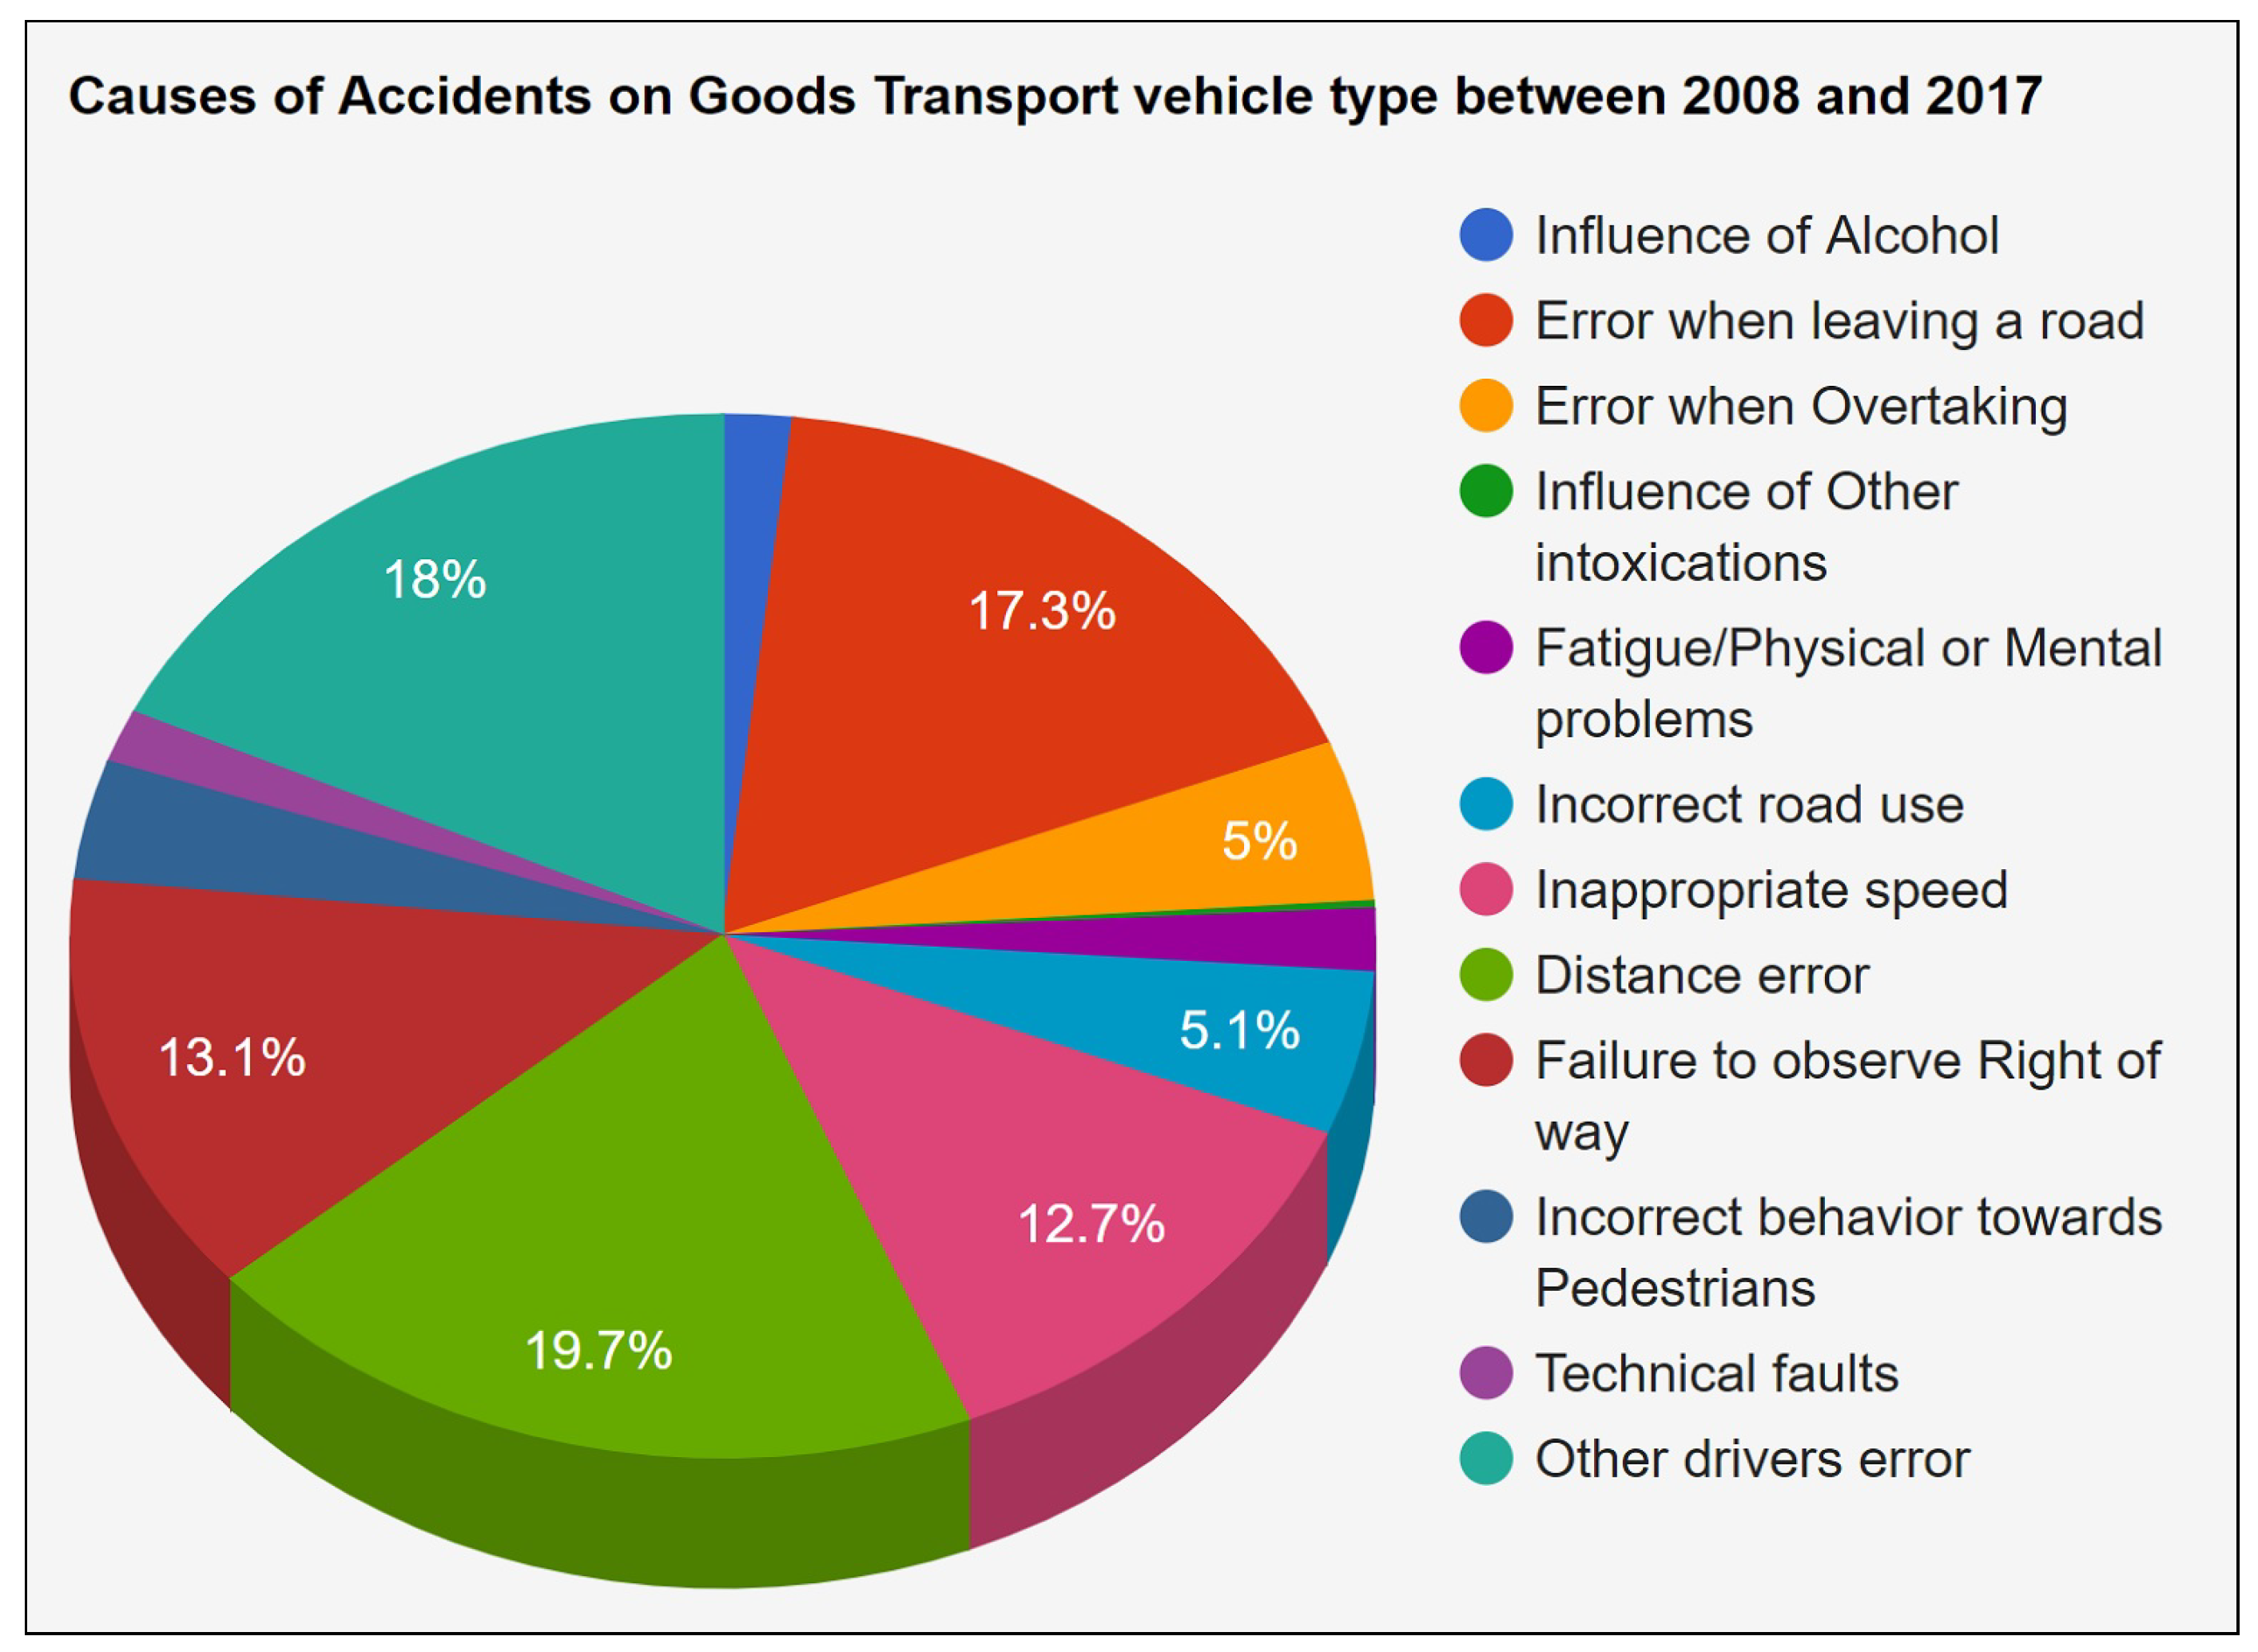
Germany is the world leader in exports and logistics, and bears a great responsibility for maintaining a smooth flow of traffic, comprising of all sorts of vehicles, inside and outside the boundaries of its cities, while, at the same time, keeping a functional road infrastructure for all the vehicles moving inside or outside the country. This is the most important in the case of large automobiles carrying great loads of supplies, logistics and various sorts of goods because, in an event of an accident, not only does the mega vehicles create a huge mess, it also brings about great financial and human losses. The main causes of road accidents involving Goods-Transport vehicles in Germany are shown in
Figure 28.
The most prominent cause of accidents involving trucks and lorries carrying goods, is ‘distance error’ accounting for of all such accidents. This reason has appeared in all of the categories above, indicating how important it is for the vehicles on the road to have a suitable distance amongst themselves. If it could somehow be countered, it can noticeably reduce the death toll caused by road accidents. This critical piece of information is attained after a great amount of data are gathered, properly compiled and efficiently analyzed. It is one prime example of how beneficial it can be to utilize the unlimited possibilities offered by the vast data analytical tools freely available for anyone to utilize.
Large and heavy-duty goods transport vehicles present a major hazard in the form of their vehicle dimensions, which means that large areas are hidden from the view of the driver. This particularly puts pedestrians and cyclists at very high risk. Therefore, whenever goods transport vehicles are involved in accidents causing personal injury, a disproportionate number of these accidents result in fatalities [
24]. The second biggest reason on the chart is ‘another driver’s mistake’ while ‘error when leaving a road’ is in third place. All the potential that today’s advanced data science possesses, and the benefits it offers, can only be effectively utilized if smarter data acquisition systems can be designed and implemented. The testbed system for automatic accident detection and notification, designed and implemented in this work, is one such system that supports this claim, by efficiently making use of technologies like IoT, VANET, Cloud and Edge computing.
5. Conclusions
As the urban population throughout the world is growing, so is the number of road accidents, resulting in a greater count of fatalities and injuries. Quick detection of a crash and adequate action on it can save more human lives. Therefore, an automatic system has been proposed that has detected and provided notifications about accidents in a timely manner. An Internet-of-Things based vehicular Testbed environment has been designed and developed in this work that automatically has detected collision and roll-over, and has immediately reported the relevant organizations.
Cloud and Edge computing are two of the most prominent emerging paradigms in handling massive amounts of IoT-generated data. However, these technologies have their own set of advantages and limitations, but, if utilized concurrently, would be beneficial for the overall system. Therefore, in this work, these technologies have been used together adequately. In the proposed IoT-based vehicular TestBed, Edge technology is used to provide resource-hungry tasks like offloading and preprocessing of data, while Cloud technology is used to facilitate data storage, which can be used for further data analysis. It has dramatically reduced data transmission latency and has optimized the overall communication process. Furthermore, in this research study, an open-source web-server application has been implemented, which received accident alerts from all the vehicles in the system using appropriately configured OBUs. Once the developed system received a warning, it would notify the nearest hospital to dispatch a rescue team. Therefore, it helped in providing immediate medical care to the victims of road accidents. Paramedic staff has also received the current state of the victims through an image appended to the rest of the information. In this regard, once the rescue operation is completed using the proposed system, the cumulative data are sent to the central database for long-term storage. This data can later be fetched from the database, and an insightful analysis can be performed. The stored data at the cloud may allow concerned authorities to make policies and implement effective measures to reduce the number of injuries and fatalities caused due to road accidents.

 ,
, 