Article

Ensemble Bagged Tree Based Classification for Reducing Non-Technical Losses in Multan Electric Power Company of Pakistan

by
Muhammad Salman Saeed
1,2,*,
Mohd Wazir Mustafa
1,
Usman Ullah Sheikh
1,
Touqeer Ahmed Jumani
1,3 and
Nayyar Hussain Mirjat
4
1
School of Electrical Engineering, Universiti Teknologi Malaysia, Johor Bahru 81310, Malaysia
2
Multan Electric Power Company (MEPCO), Multan 60000, Pakistan
3
Department of Electrical Engineering, Mehran University of Engineering and Technology, SZAB Campus, Khairpur Mirs 66020, Pakistan
4
Department of Electrical Engineering, Mehran University of Engineering and Technology, Jamshoro 76020, Pakistan
*
Author to whom correspondence should be addressed.
Electronics 2019, 8(8), 860; https://doi.org/10.3390/electronics8080860
Submission received: 28 May 2019 / Revised: 27 July 2019 / Accepted: 29 July 2019 / Published: 2 August 2019
(This article belongs to the Section Power Electronics)

Abstract

:
Non-technical losses (NTLs) have been a major concern for power distribution companies (PDCs). Billions of dollars are lost each year due to fraud in billing, metering, and illegal consumer activities. Various studies have explored different methodologies for efficiently identifying fraudster consumers. This study proposes a new approach for NTL detection in PDCs by using the ensemble bagged tree (EBT) algorithm. The bagged tree is an ensemble of many decision trees which considerably improves the classification performance of many individual decision trees by combining their predictions to reach a final decision. This approach relies on consumer energy usage data to identify any abnormality in consumption which could be associated with NTL behavior. The key motive of the current study is to provide assistance to the Multan Electric Power Company (MEPCO) in Punjab, Pakistan for its campaign against energy stealers. The model developed in this study generates the list of suspicious consumers with irregularities in consumption data to be further examined on-site. The accuracy of the EBT algorithm for NTL detection is found to be 93.1%, which is considerably higher compared to conventional techniques such as support vector machine (SVM), k-th nearest neighbor (KNN), decision trees (DT), and random forest (RF) algorithm.

1. Introduction

Electrical energy losses in any transmission and distribution system include both technical and non-technical losses. The assessment of technical losses is usually necessary for the valuation of non-technical losses [1]. Technical losses generally take place due to electrical energy dissipation in the various transmission and distribution (T&D) components. The non-technical losses (NTL), however, occur as a result of errors in billing, equipment malfunction, low-quality infrastructure, non-metered supply, or because of illegal behavior of energy consumers [2]. The illegal behavior in electrical energy usage by fraudster consumers is often associated with regularized corruption, theft, and organized crime. Therefore, this kind of loss cannot be precisely calculated [3]. The reduction of NTL is one of the most important concerns for PDCs. It poses huge and weighty issues for PDCs since, in some cases, half of electricity supplies translate into NTLs and thus loss of billions of dollars per year [4]. It is estimated that PDCs worldwide lose around $25 billion worth of electricity each year alone as a result of electricity theft [5]. Although, countries with stable economies are not facing severe concerns related to NTLs, the search for suitable solutions to mitigate these losses are still a concern. For example, in the USA and UK, the revenue loss due to electricity theft aggregates to $6 billion and $173 million Great Britain Pounds (GBP), respectively each year [5,6]. The most damaging effect of NTLs is present in those countries where economies are in an evolutionary phase [7]. For instance, in Pakistan, the T&D losses of 17% and 17.5% were recorded in the electricity system for the years 2016–2017 and 2017–2018, respectively. These losses are considerably higher when compared to other regional countries in Asia. For example, in China T&D losses in the electricity system are only 8% in Korea and around 3.6% in other European countries, these are below 7% [8]. NTL shares a major portion of the T&D losses in the electricity system of Pakistan with estimated shares of 33% in the overall T&D losses of the country [8]. In order to reduce NTL, PDCs generally undertake a random audit of consumer billing profiles and inspection of metering devices for the purpose of detecting NTLs. However, the key shortcoming pertaining to these random audits and inspections is that it does not take into account any knowledge of the behavior of the consumer’s consumption pattern so the detection rate of these inspections is very low. These conventional audit and inspection methods are also inefficient for the reason that distribution feeders in developing countries are generally very long with a large number of consumers hence these traditional methods can be often very costly and time-consuming [9]. In the meantime, smart meters have emerged as one of the most recent and significant remedies for NTL’s detection. However, the design, deployment, and operational cost of these meters require billions of dollars which is not an affordable option for many developing countries like Pakistan [10]. Despite huge losses to the economy caused by NTLs over the years, there is no published evidence available on NTL detection in any PDC of Pakistan.
There are several NTL detection schemes developed and proposed in contemporary literature. Most of these electricity theft detection schemes are based on game theory and classification approach [11,12,13]. The game theory-based approach proposes a game amongst the potential thieves and PDCs [14]. The main disadvantage associated with this method is the formation of different functions of every player, which is a very tedious task. On the other hand, the traditional classification method employs consumers load profiling over a given period using healthy and unhealthy data samples [11]. However, the main problem with these traditional classification-based methods is their low detection rate and high false-positive rate (FPR) which results in increased cost of the audits and inspections. In addition, the data imbalance is one of the fundamental problems in traditional classification algorithms since the consumption data for honest consumers are easily accessible whereas the data for the fraudster consumers is rarely available. Hence, obtaining the data for fraudster consumers is a very difficult and tedious task. Finally, the common factors which are known to pose a threat to the traditional classification-based methods also include seasonal variations, change of residence, change in appliance use, etc. [15].
NTL’s detection has also been studied using artificial neural networks (ANNs) in another study by Costa et al. [3]. This study used the consumers’ information to develop the database and then utilizing the ANN method to classify the consumers as a fraudster or honest. However, the proposed scheme was not very effective due to the uneven datasets and hence low precision was obtained which finally resulted in huge false positives. Muniz et al. [16] also used the ANN-based approach for training the NTLs detection model. In order to further improve the performance of the ANN model, the fuzzy classification was employed, however, that model also suffers from lower accuracy. Angelos et al. [17] utilized fuzzy classification and fuzzy clustering-based approach for classifying the consumption pattern of different consumers. The proposed approach required average consumption data, standard deviation, maximum consumption, the sum of the remarks from inspections, and neighborhood average consumption to create a pattern for every consumer. Gathering such huge data for every consumer was a challenging task and ultimately the developed model resulted in a large detection delay. Spiric’ et al. [18] have applied fuzzy clustering and rough set theory-based approach for identifying scams committed by fraudulent consumers. A list of suspected consumers was generated based on the amount of electricity lost. This work, however, ignored important performance measures like sensitivity, specificity, and Area Under Curve (AUC) for imbalanced datasets. The author in [19] used advanced metering infrastructures (AMI) intrusion detection system (AMIDS) that uses various sensors to identify anomalous behavior in consumer consumption patterns. The major problem associated with this method is that it requires a very high sampling rate which reveals all kinds of appliances being used by consumer and time of use hence destroying the consumer’s privacy. The installation of smart prepaid energy meters was considered and undertaken in [20] for controlling electricity theft. The major drawback of the proposed scheme is that during unauthorized tapings, the sensor will give zero value resulting in no energy measured by a metering device. To reduce uncertainty error, a Support Vector Machine (SVM) anomaly detection algorithm along with consumption pattern-based energy theft detector (CPBETD) was proposed in another study [15]. The main drawback of the proposed scheme was that the companies have to bear additional expenses of installing a transformer meter in addition to smart meters. Nagi et al. [21] developed an SVM-based fraud detection model that utilizes 25-month consumption data and other parameters like the creditworthiness rating (CWR) for identifying fraudulent consumers. Later in [22], the fuzzy inference system (FIS) was introduced along with SVM to further improve the performance of mode. However, the detection rate, as a result of such modification, had merely increased from 60% to 72% which is very still less as compared to the Ensemble Bagged Tree (EBT) model developed in this study.
In order to address the shortcoming and limitations of precedent works, for NTL detection, some redundant classifiers are combined to form ensemble learning systems (ELS’s) that result in increased accuracy, robustness, improved overall performance, and reduced uncertainties [23]. ELS’s are an aspect of machine learning involving aggregation of many classifiers for enhanced performance which has demonstrated great advantages over single classifiers. Ensemble classifiers have been found to improve the classification and prediction algorithms and have been employed recently to solve problems involving class imbalance, intrusion detection systems, and credit scoring, etc. [24,25,26,27,28,29,30]. As ELS’s perform better as compared to conventional classification techniques, hence the same has been adopted in this study.
This research work explores a classification approach based on EBT algorithm and proposes the same to support the PDCs by effectively detecting fraudster consumers. The proposed NTL scheme has achieved the maximum detection rate and minimum false positives (FP) as compared to the conventional methods on Multan Electric Power Company (MEPCO) real-time dataset and can be considered as the first-ever study of electricity fraud detection in Pakistan PDCs. Furthermore, for the very first time in literature, the EBT algorithm has been explored for NTL detection which has attained the higher detection rate than that of its counterpart machine learning algorithms on conventional energy meter’s dataset. The proposed EBT classification scheme utilizes the consumer’s electricity consumption data from MEPCO Multan, Pakistan, to classify the honest and fraudster consumer. Although, as explained earlier, several factors contribute to NTLs, this research work only considers one of the major fraud indicators, which is a sudden deviation from consumers’ normal load profile. The list of potential fraudster consumers generated would be subsequently used for the on-site inspection. It is anticipated that the proposed scheme will significantly improve the NTL detection rate for PDCs and will decrease their operational expenditure by avoiding random on-site inspections.
The remaining paper is structured as follows. Section 2 describes the working principle of the EBT algorithm. Section 3 elaborates the methodology for the NTL detection model of this study. Section 4 provides the results and relevant discussions and finally, Section 5 provides the summary of this study.

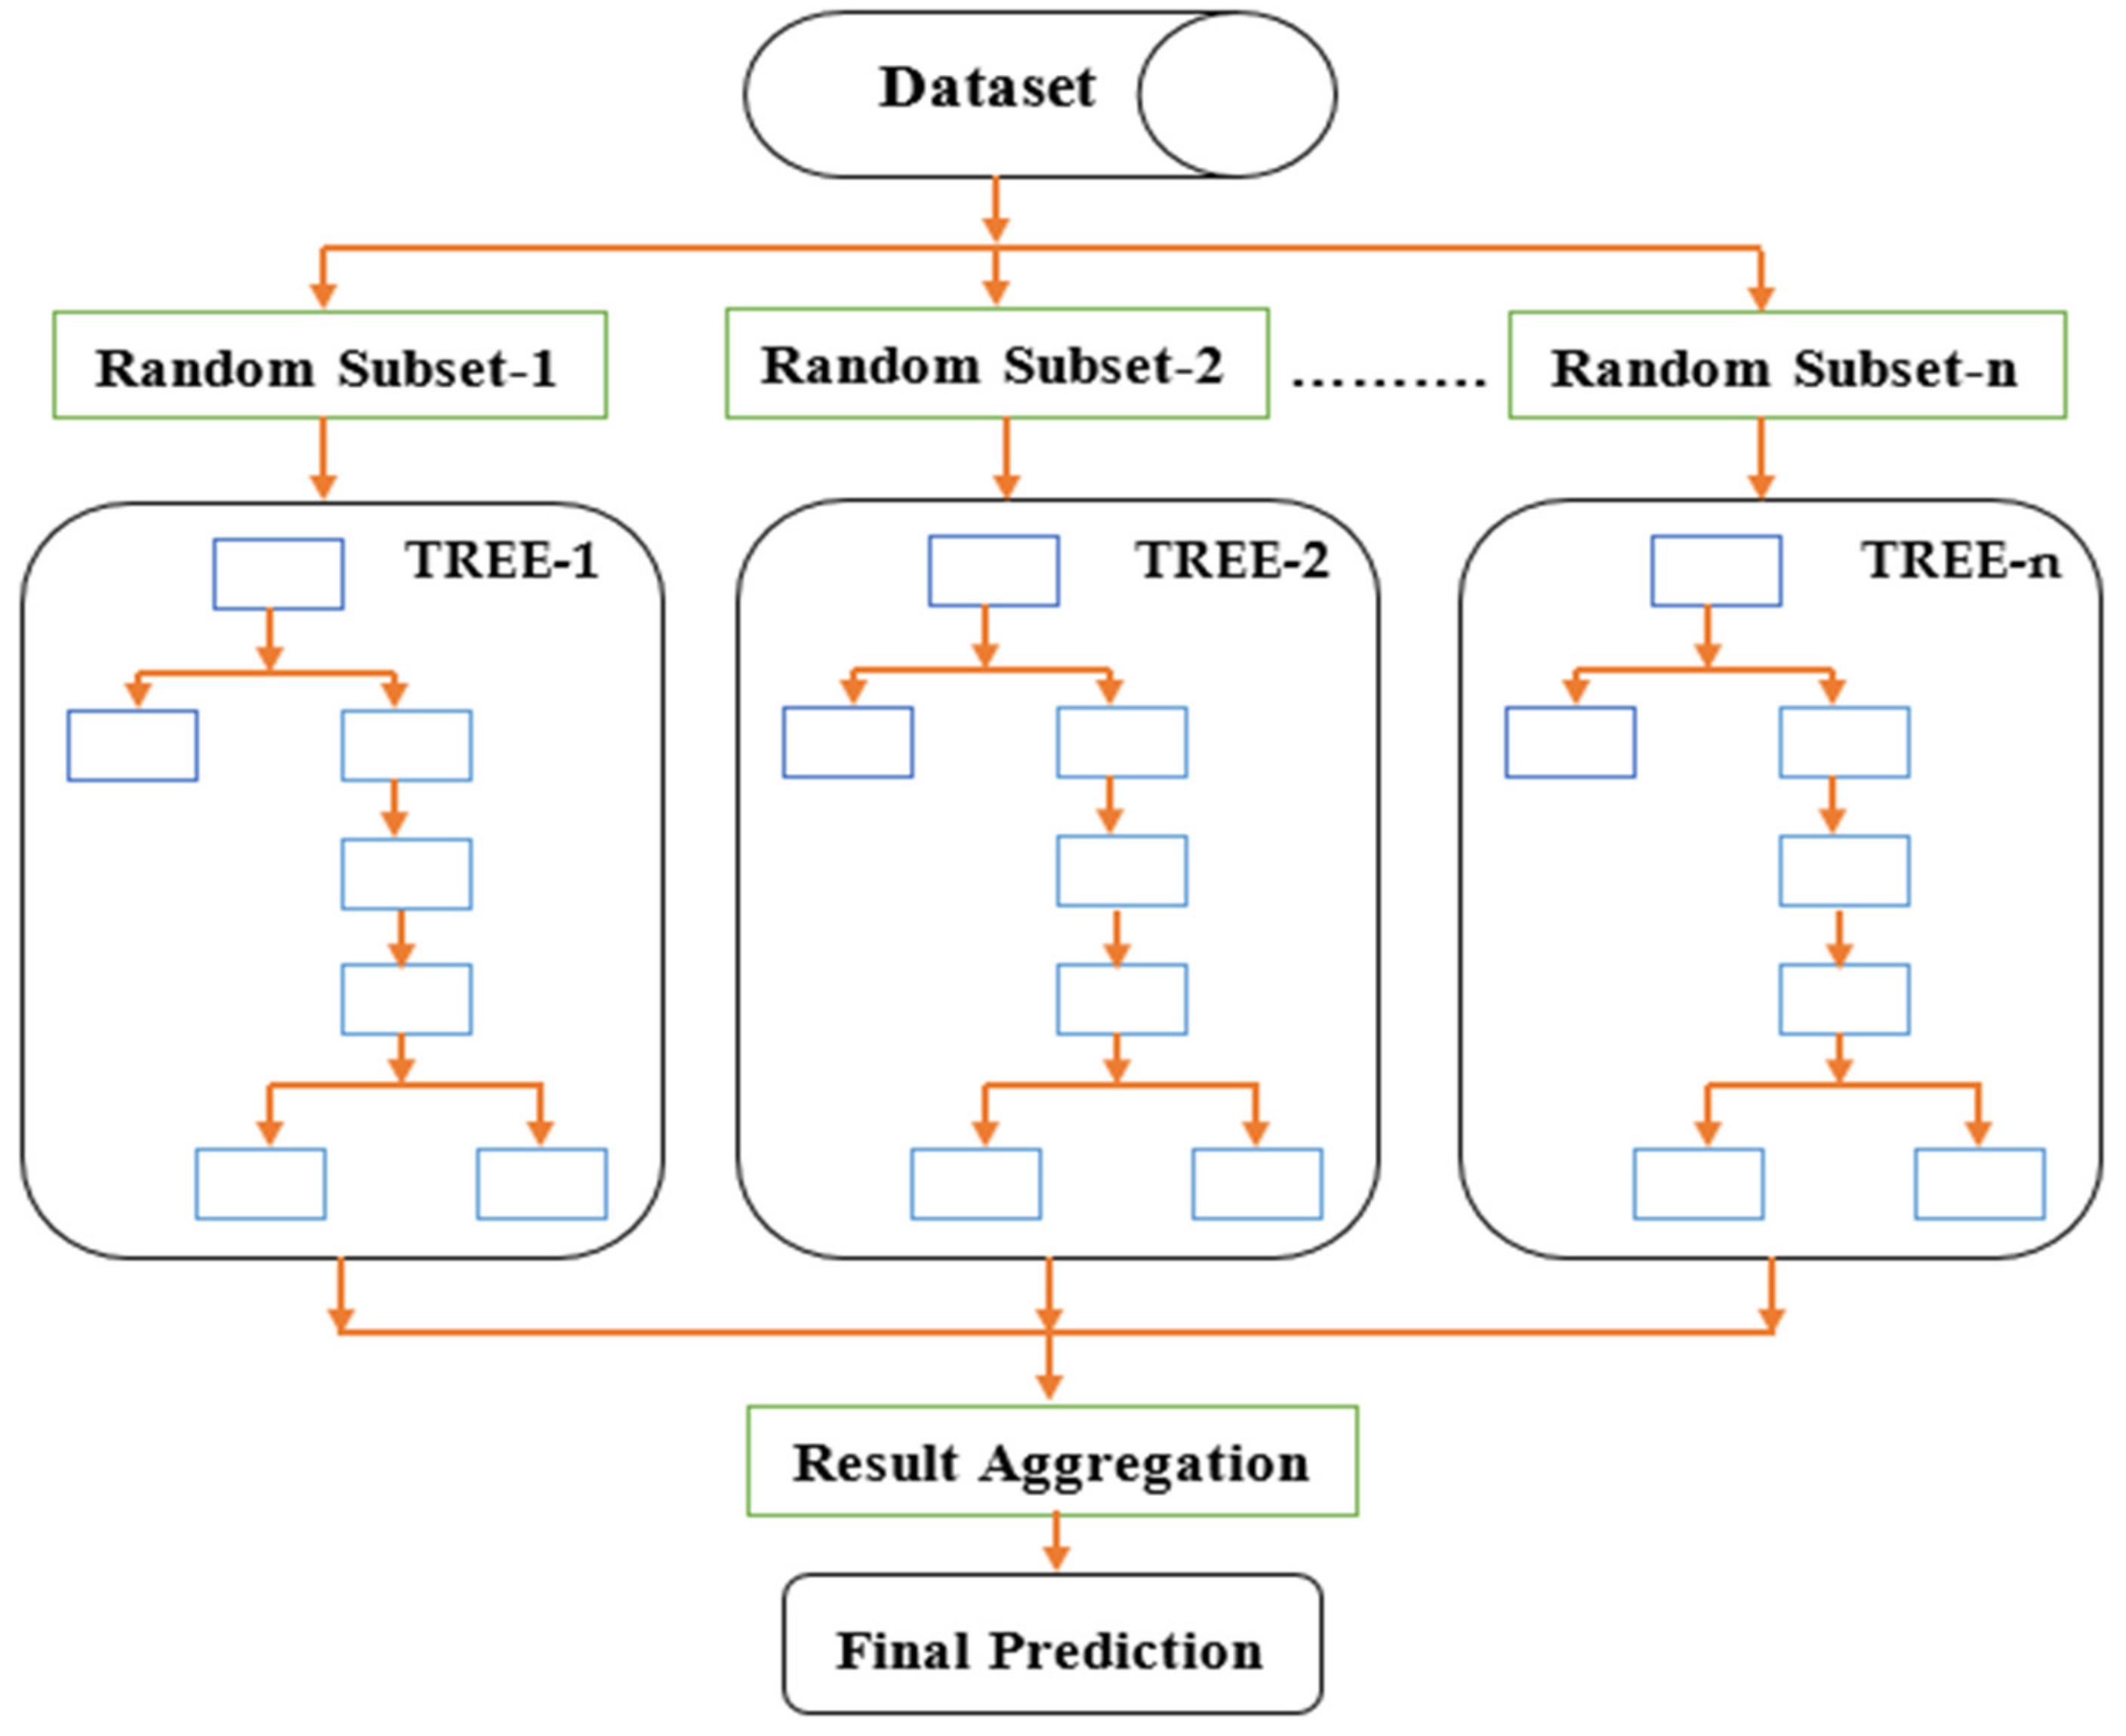
2. Classification Using Ensemble Bagged Tree

Ensemble methods train multiple machine learning algorithms to reach a final decision [31]. ELS’s are inspired by human behavior, which considers that any problem can be easily tackled from seeking and applying the opinion of several experts. The decision is reached based on these diverse opinions. ELSs provides better performance compared with that of using a single classifier. There are various algorithms proposed for achieving ELSs with the most common being bagging, boosting, and random forest [24,31,32,33]. Among these, the bagging is the most efficient and highly accurate ensemble algorithm [34]. The mathematical details for ensemble learning algorithms are given in [32]. In EBT ‘bagging’ stands bootstrap aggregation where training datasets are continuously replaced by drawing random samples. A Decision Tree (DT) belongs to the category of the weak learner as they are sensitive to training pattern and, therefore, an individual decision tree normally results in overfitting to specific training pattern. Bagged DT can be used to improve the performance of decision trees as it aggregates the results of many individual decision trees by taking a majority vote of their decisions, as a result, it solves the overfitting problem and improves the performance of individual decision trees. The bagged tree is not concerned with the individual decision tree. The bagged trees have been applied in many classification problems recently i.e., fault classification scheme for series capacitor [34], classification of mixed pixels [35], and sleep stage classification [36], etc. Figure 1 shows the different stages of a bagging algorithm.
The working mechanism of the bagging algorithm commences by generating a random combination of the original data set into n number of data sets as illustrated in Figure 1. This follows the training of different classifiers on these subsets of the original dataset. A model is finally developed based on the majority votes of the individual models. A prediction is then made based on the decision of the final model. In a given dataset, bootstrapped subsamples are drawn. A DT is established on each bootstrapped sample. The result of each DT is aggregated to yield the strongest and most accurate predictor.

3. Methodology

This section presents the methodology used in this study for data mining and model development. The proposed framework for fraud detection by a consumer with an abnormality in their consumption data is depicted in Figure 2.
The functionality details of the different blocks used in Figure 2 are explained in subsequent sections as under.

3.1. Data Acquisition

The data for this research work has been obtained from MEPCO which is one of the largest power distribution companies in Pakistan with 6 million consumers. MEPCO is further divided into 8 circles with Multan circle as the largest one and hence this study is based on the data obtained for this circle only. The obtained data comprised of data of two consumer classes i.e., honest consumers and fraudster consumers. The dishonest or fraudster consumers were those consumers whose fraud had been verified by the meter and testing (M&T) laboratory. In order to verify the status of the consumers, it is necessary for the M&T laboratory to thoroughly check the meter status and issue the report. All theft cases for the past two years i.e., for the period 2016 and 2017 were gathered from M&T of Multan circle. The total registered theft cases for this period were 1109. The data for honest consumers were obtained from SHAH RUKAN-E-ALAM feeder which has 4124 consumers. Further, to this study, the monthly kWh consumption data of the past 36 months from May 2015 to April 2018 was also obtained from MEPCO. The data gathered also include the meter status, type of theft, meter reading, date of meter reading, connected load, sanctioned load, discrepancies, and date of inspection.

3.2. Consumption Pattern of Fraudulent and Honest Consumers

On a detailed analysis of the data obtained from MEPCO Pakistan, the theft cases were classified as shown in Figure 3.
As can be seen from Figure 3, the reversed metering cases were highest in number while the tilted metering cases were minimum among the registered theft cases. The reverse metering, body tempering, looping in the terminal block, slowing of the meter by installing a dimmer circuit, washing out the display screen, and tilted metering are done by tempering the meter while direct supply, bogus metering, permanently disconnected (PDISC) metering, and phase interchanging are done without tempering the metering device. In reverse metering, the reading of the meter is reversed by physically reversing the current meter reading. Furthermore, slowing down the meter rotation by installing a permanent magnet inside the meter is also one of the major causes of meter tampering. The second mostly found cause of meter tempering is direct supply where the meter is bypassed and hence it is unable to register the consumed electricity. The available data was utilized to differentiate between the consumption pattern of the honest and fraudulent customers as illustrated graphically in Figure 4.
The consumption pattern of honest consumers shows a symmetrical pattern with a clear increase in summer as the temperature in the considered area reaches 50 °C while the same in winter falls to around 20 °C. As can be observed from Figure 4, that unlike the honest consumers, the consumption pattern of the fraudulent consumers undergoes few abrupt changes in consumption pattern which indicates the possibility of fraud.

3.3. Customer Filtering and Selection

The obtained data from MEPCO was initially filtered to remove the consumers with incomplete information in order to have fair training of the model. The following consumers were filtered and removed before training the model.
  • All those consumers whose entire 36 months consumption data was not available or those who were not using electricity due to change of residence or any other reason.
  • All consumers who were registered after May 2015.
  • All healthy consumers who were charged an average i.e., whose metering equipment became defective during the studied time period.
It may be noted that this research work has been purely carried out for the domestic and commercial consumers as they share the major portion of the total electricity consumption. After removing all the outliers and applying the filtration process, the finalized list includes 2774 consumers with 647 fraudster and 2117 honest consumers. Despite the fact that many consumers were eliminated after the filtering procedure, the remaining ones were sufficient for training and testing of the studied model.

3.4. Studied Classification Methods

All the classifiers which are evaluated for the mentioned classification purpose in this study are depicted in Figure 5 and are explained in subsequent subsections.

3.4.1. Decision Trees

A decision tree is a machine learning algorithm and is used for performing classification and regression. Many types of DT’s like Classification And Regression Tree (CART), Quick, Unbiased, Efficient, Statistical Tree (QUEST), and C4.5 have been used in literature for NTL detection purposes just like in [37,38,39]. The construction of DT is done by examining the set of training examples for which class labels are already known. For example, if the DT model is trained on high-quality data it can provide very accurate predictions. The CART algorithm has been used in this research work for classifying between honest and fraudster consumers. It employs the Gini impurity index for calculating the probability of incorrect classification. The Gini impurity index of a group of items with D classes and the likelihood of picking that item with the class p(i) can be computed as:
G = i = 1 D p i 1 p i
The split criterion and the maximum number of splits used by different DT’s model in this study are given in Table 1.

3.4.2. Support Vector Machines (SVM)

A support vector machine is a supervised machine learning algorithm that can be used for performing classification and regression tasks, however, for this research work, it is only used for classification purposes. Generally, a hyperplane or set of hyperplanes are constructed by SVM in a high dimensional space which is used for performing classification for non-separable class. The non-separable class can be separated by transforming them from lower-dimensional space into higher dimensional space through kernel trick. To apply this kernel trick for two classes the dot product of (Xi,Xj) are replaced by functions. Following are the most commonly used kernels:
Linear:  K(Xi,Xj) = Xi·Xj
Polynomial:  K(Xi,Xj) = (γ·Xi·Xj + c)b
Gaussian:  K(Xi,Xj) = exp(−γ‖Xi − Xj2)/δ2
Sigmoid:  K(Xi,Xj) = tanh(γ·Xi·Xj + v)
Here c and v are constant, b is the degree of polynomial and δ is the width of RBF kernel. The parameter γ limits the tradeoff between error owing to variance and bias in the model. The kernel function and kernel scale used by all the SVM’s models in this study are given in Table 2.
There is sufficient literature where SVM has been used a number of times for NTL detection such as in studies referred in [21,40]. However, it is realized from these studies that tuning of SVM parameters increases the time for constructing the model. Hence, the SVM is generally combined with fuzzy logic, DT, genetic algorithm (GA), and social spider optimization to improve the classification performance of the model as studied in [22,41,42,43].

3.4.3. K-Nearest Neighbor

KNN classifier is a non-parametric and lazy learner algorithm used for classification and regression. It is one of the simplest classifying algorithms that saves the existing data and classifies the new data based on a similarity measure. This algorithm is generally used in literature as a standard for comparison with different algorithms as done in [44,45]. Different types of distance metric functions can be used for measuring the distance between two points A and B in a dataset by KNN algorithm. The Euclidean distance metric is most commonly used and is calculated by using Equation (6);
d i s t A , B = i = 1 n A i B i 2
whereas the cosine distance metric is generally used for finding the similarity level and can be computed by using Equation (7);
s i m i l a r i t y A . B = A . B A B
Here numerator is dot product of vectors A and B while the denominator is the product of their Euclidean lengths. Another important distance metric called Minkowski distance metric is used by cubic KNN and can be computed by Equation (8);
M i n k o w s k i A , B = i = 1 m A i B i r 1 / r
All distance metrics and the number of neighbors used by all KNN models in this research study are stated in Table 3.

3.4.4. Ensemble Classification

A detailed discussion of ensemble classification methods has been made in Section 2, hence this subsection only describes the parameters used for evaluated ensemble algorithms. It may be noted that the DT is generally used as a base model in boosted trees, bagged trees, RUSBoosted trees, and RF algorithm where the nearest neighbors are used as a base model for subspace KNN. It is important to note that the number of splits and the number of learners play a key role in all versions of ensemble models. The ensemble models perform better when used with a higher number of splits however, increased number of splits causes overfitting of the model. Similarly, a greater number of learners enhance the accuracy of the model, but the process becomes very time-consuming. Therefore, a trade-off between a maximum number of splits and the number of learners is required to achieve the optimal results. Table 4 depicts all the ensemble methods used for this research study along with their learner type, the maximum number of splits, and the number of learners.

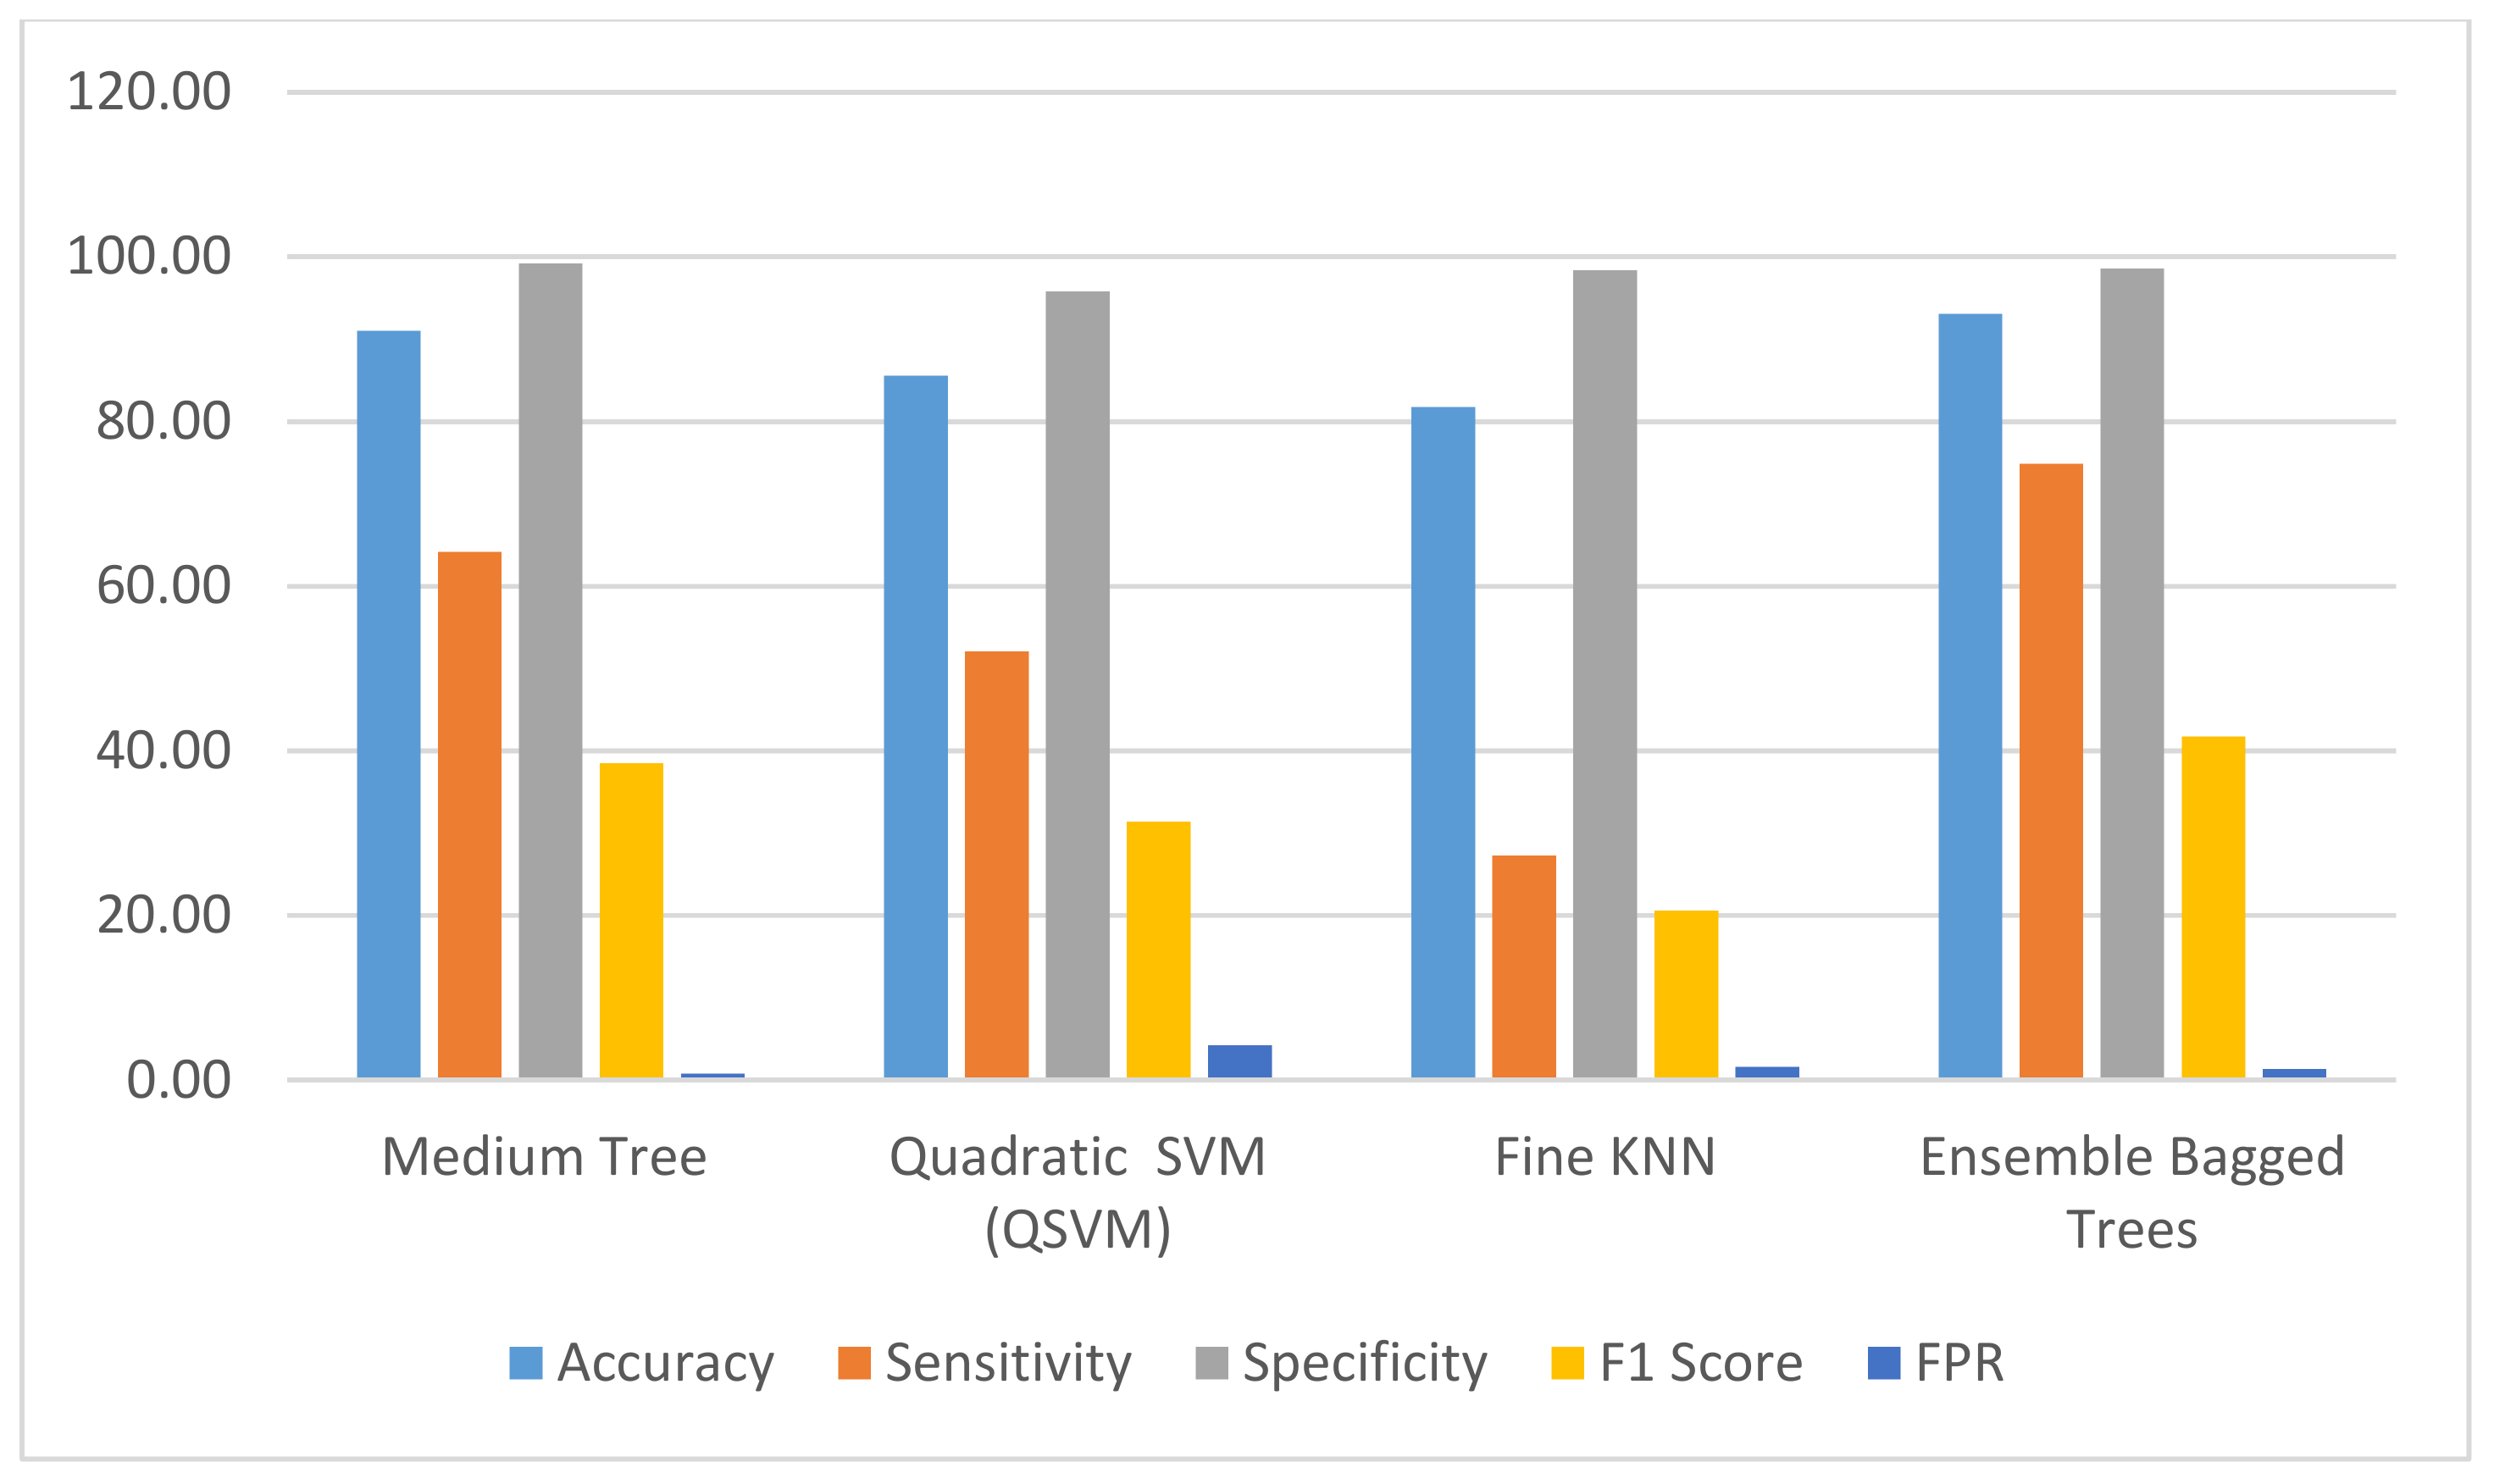
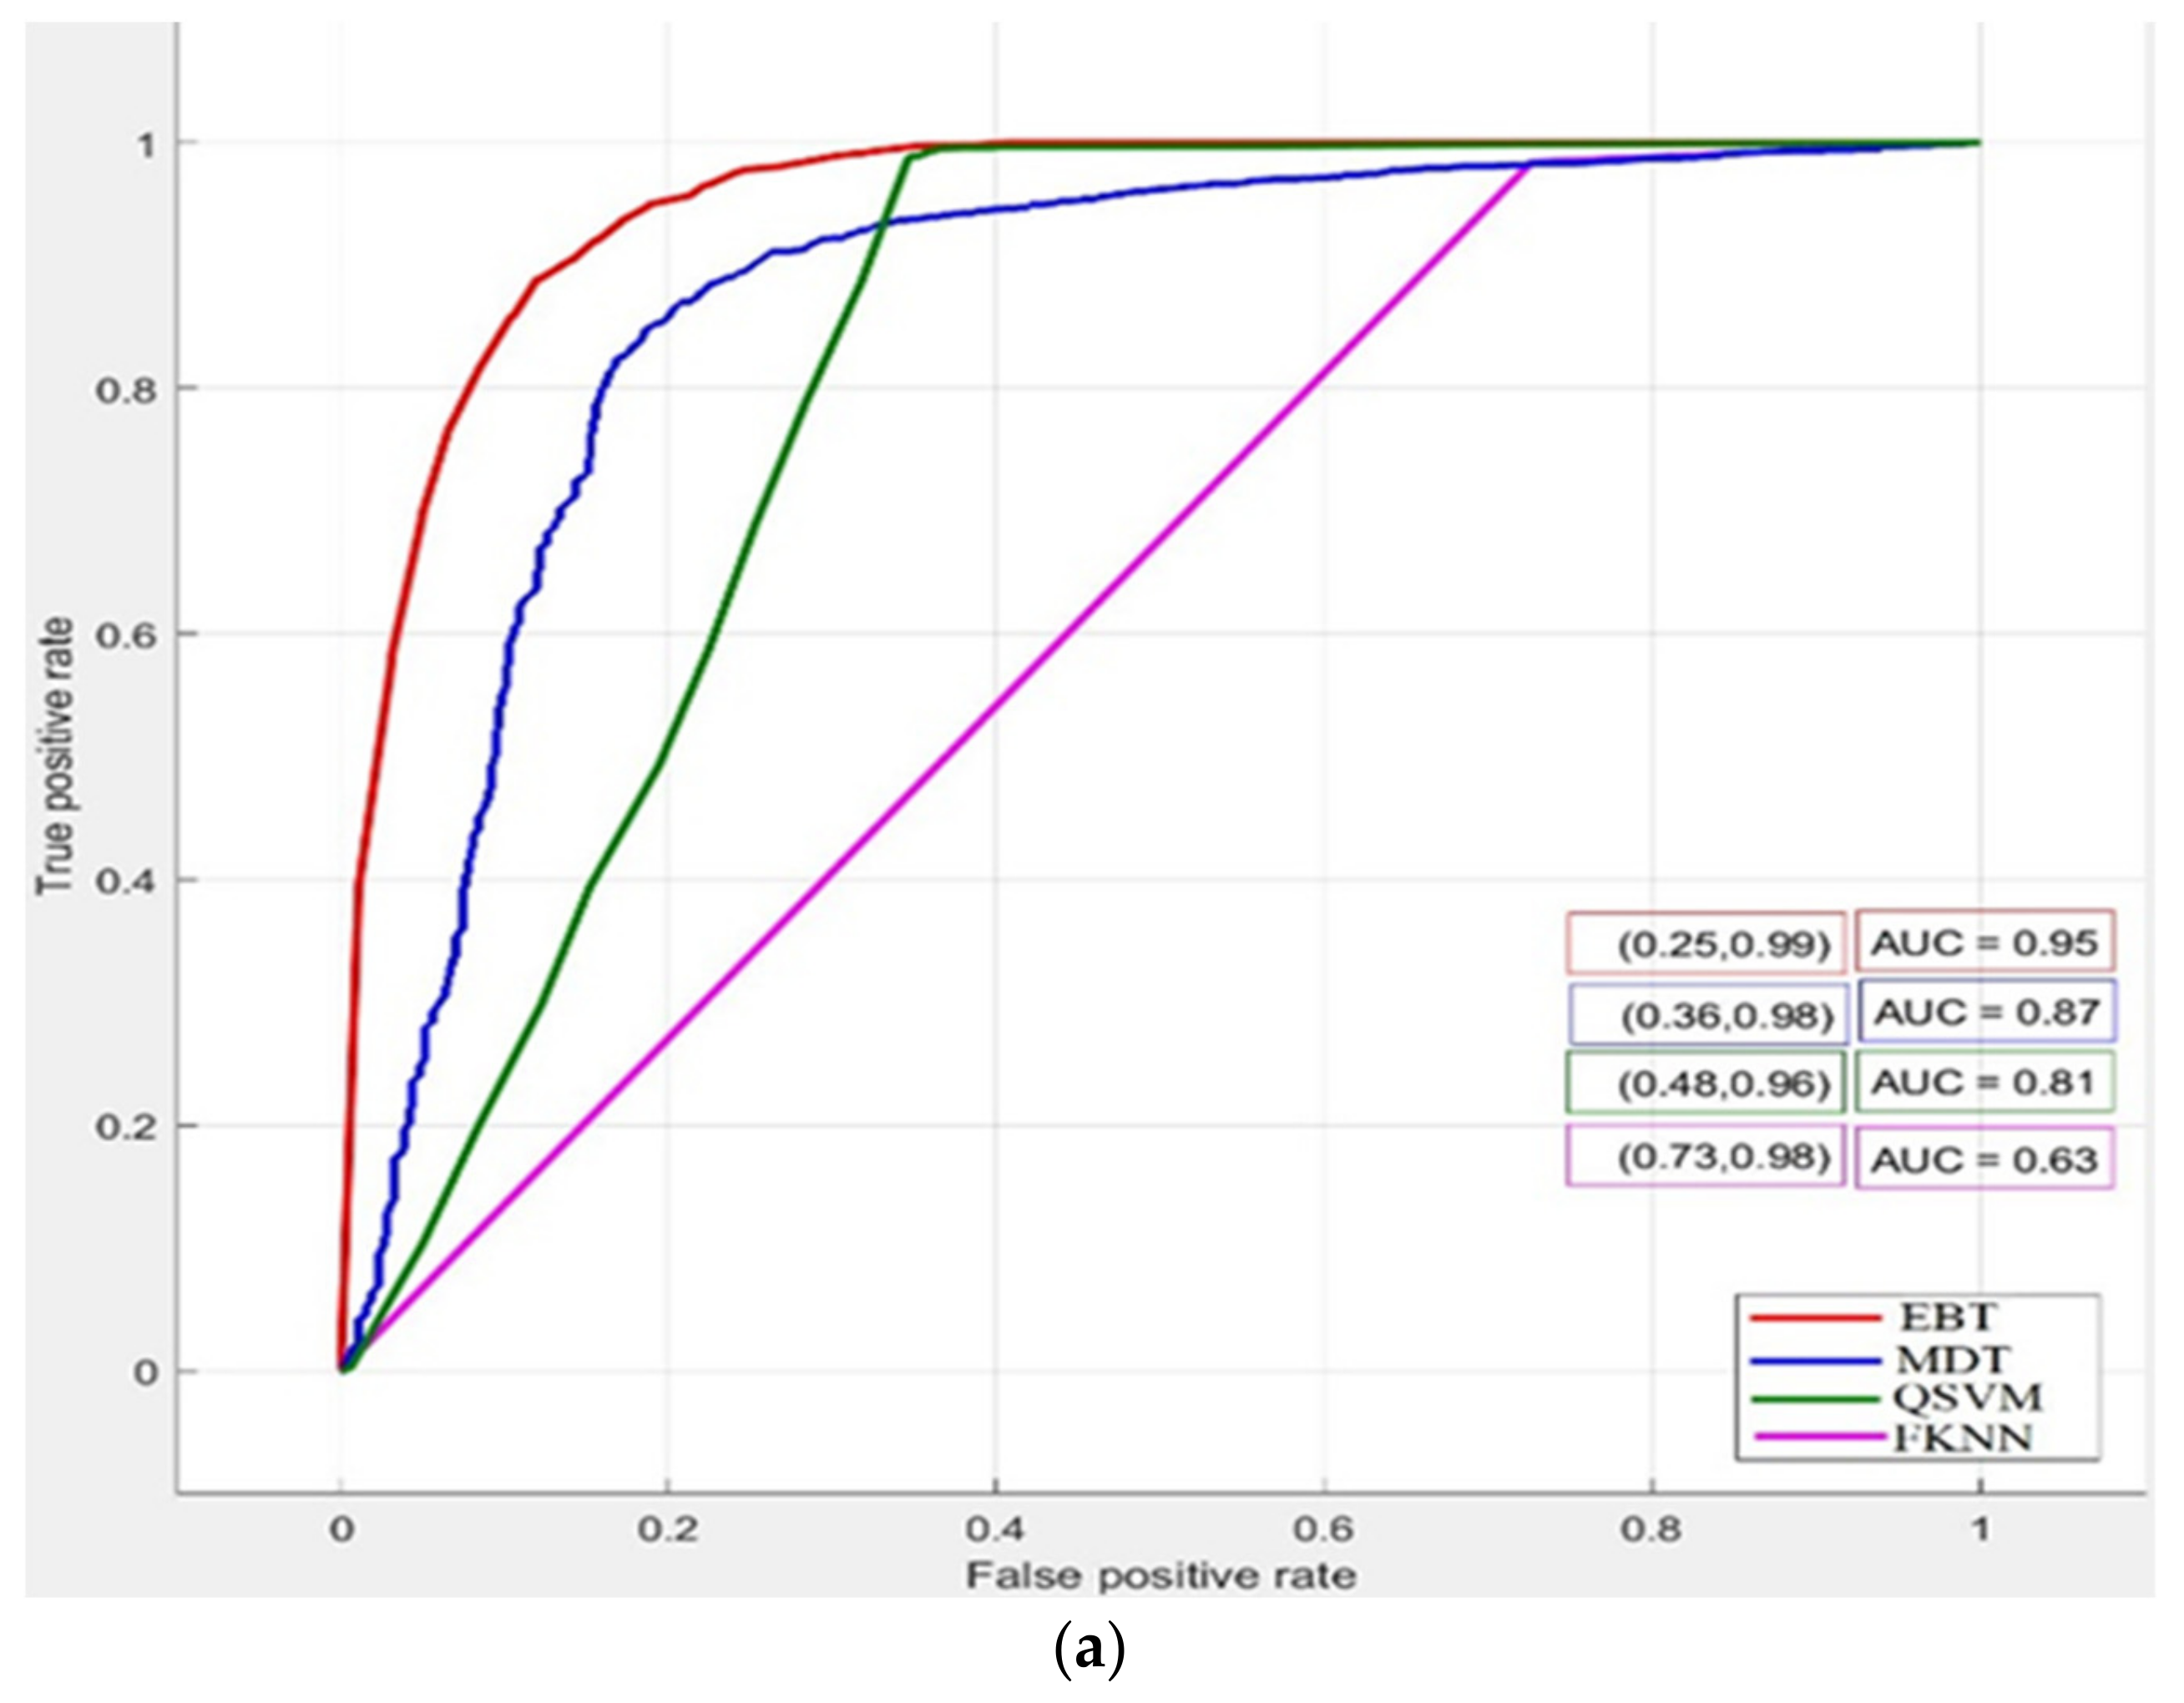
4. Results and Discussion

The performance of the classifier is generally evaluated with the help of a confusion matrix [4]. The matrix provides the information as “True” for the correct classification and “False” for the misclassification. In the confusion matrix, the true positive (TP) represents the fraudster consumers and are correctly classified as fraudster while the false positive (FP) represents the honest consumers who are wrongly predicted as fraudsters. Similarly, true negative (TN) represents the honest consumers which are correctly classified as honest and false negative (FN) represents fraudster consumers which are wrongly classified as honest by the classifier. In order to judge the performance of any classifying algorithm, its accuracy (ACC) needs to be evaluated by using the following relationship:
A C C = T P + T N T P + T N + F P + F N
As the number of samples for honest and fraudster consumers are generally not equal, therefore some additional performance measures like sensitivity and specificity are also required to evaluate the performance of a classifier. For example, an NTL detection system with 1000 consumers, a classifier that correctly classifies 990 honest consumers while misclassifying 10 fraudster consumers will have an accuracy of 99% which is misleading and incomplete information. Unlike the previous research works on NTL detection system [21,22,46], this research work has considered all the key evaluation measures in order to have a fair comparison between different classifiers. Sensitivity recall or true positive rate (TPR) is used for measuring the percentage of true positives (TP) which are correctly classified. The sensitivity of a classifier is defined as in Equation (10):
S e n s i t i v i t y = T P T P + F N
Similarly, specificity or true negative rate (TNR) is used for determining the percentage of true negatives which are correctly classified and can be expressed by Equation (11):
S p e c i f i c i t y = T N T N + F P
In the same way, false positive rate (FPR) is also one of the main concerns for power distribution companies because high FPR results in costly inspections. It is used to calculate the number of honest consumers who are wrongly classified as fraudsters and it can be expressed by Equation (12):
F P R = F P F P + T N
Another important measure which is generally used for accessing the performance of a classifier is the F1 score. It is used to measure the balance between recall and precision and can be found by using Equation (13):
F 1   S c o r e = 2 · P r e c i s i o n . R e c a l l P r e c i s i o n + R e c a l l
In this study, the performance evaluation of the classifiers was carried out by using a 10-fold cross-validation (CV) procedure using MATLAB version 2017b. CV is utilized to test the effectiveness of machine learning classifiers. In 10-fold CV the entire data is split into 10 equal-sized folds. One out of the 10-folds is used for validation and the remaining are used for training the classifier. The process is repeated 10 times with each subsample used for validation individually. Subsequent to various tests with different configurations, the best results were achieved with a tree at depth 5 as shown in Figure 6. The Node-1 contains 137 customers with a total consumption of less than 15.5 kWh with 134 classified as fraudulent while 3 were classified as honest consumers. Similarly, the remaining 1822 customers from Node 1 were further classified in Node-2 on the basis of their electricity consumption. It may be noted that Node-1 classifies the highest number of customers while the number of customers decreases in subsequent nodes due to the filtration process during classification. Furthermore, the performance evaluation of DT and EBT along with other algorithms are given Table 5.
The performance of the different algorithms shown in Table 5 is significant. It is evident that EBT provides best results among all tested algorithms by achieving an accuracy of 93.1%, the sensitivity of 74.9%, the specificity of 98.6%, F1 score of 41.75% and FPR of 1.37, whereas the medium trees, quadratic SVM, and fine KNN perform best among their respective classes. It is also observed from the results of Table 5 that there are some algorithms which perform well in detecting negative class, but their performance is worst while classifying positive class. For example, coarse KNN classifies all consumers belonging to healthy class (honest consumers) while it’s unable to classify the fraudster costumers. Hence, its specificity is maximum i.e., 100% while the sensitivity is minimum i.e., 0%. Figure 7 shows the comparison of the EBT algorithm against the best classifying algorithms among DT, SVM, and KNN.
It is evident from Figure 7 that EBT outclasses the other well-known classifying algorithms on the basis of its combined results of accuracy, sensitivity, specificity, F1 score and low FPR thus validate its performance superiority over other algorithms. Furthermore, the medium tree has been found to be the second-best classifier among the selected classifying algorithms with the specificity of 99.2% and FPR of 0.80, which is slightly better than the specificity of EBT. However, its TPR and ACC are quite inferior to that of the EBT algorithm which makes it an inappropriate choice for NTL detection as compared to EBT. Another performance evaluation indicator of classifying algorithms is the Receiver Operating Characteristic (ROC) curve. It evaluates the performance of the classifiers by plotting the TPR against FPR and is not sensitive to changes in the class distribution. The area under the ROC curve (AUC) is measured between 0 and 1. As such, any classifier with AUC greater than 0.5 achieves better results than that of any random prediction method while the AUC of exactly 0.5 conveys that the model has no class separation capability at all [47]. The closer the AUC value is to 1, the superior will be the performance of the model. The ROC curve of the EBT algorithm along with Medium Decision Tree (MDT), Fine KNN, and Quadratic SVM for honest and fraudulent costumers is shown in Figure 8.
The red line on the plots in Figure 8 shows the performance of the EBT classifier for both negative and positive class, respectively. It shows the values of the TPR and the FPR for EBT classifier. In NTL detection the main objective is to minimize the FPR which is necessary to avoid the excessive inspections while maximizing the TPR. It is evident from Figure 8a that the TPR of 0.99 and FPR of 0.25 have been obtained for the negative class from EBT which indicate that 99% of the honest consumers are classified correctly while 25% of fraudster consumers are incorrectly classified as honest consumers, therefore, EBT has maximum AUC as compared to MDT, QSVM, and FKNN. Furthermore, for the positive class (fraudulent consumers), the TPR of 0.75 and FPR of 0.02 has been achieved respectively as shown in Figure 8, which shows that the 75% of fraudster consumers were classified correctly while 1% of healthy consumers were wrongly classified as a fraudster. In addition, the AUC of 0.95 validates the tremendous performance of the studied EBT classifier.

5. Conclusions

This study has offered a new approach for NTL detection in PDCs using one of the most efficient classifying algorithms called EBT algorithm. The proposed framework for NTL detection has been used on the historical consumption data of consumers obtained from MEPCO which is one of the largest power distribution companies in Pakistan. In order to validate the effectiveness of the proposed EBT classifier, its performance has been compared with that of DT, SVM, KNN, and ensemble classification methods. The results of this study demonstrate that the EBT performs much better than the mentioned artificial intelligence techniques and achieves an accuracy of 93.1%, sensitivity of 74.9%, and specificity of 98.2%; thus, validates its performance superiority. In addition, the value of the AUC of 0.95 indicates the tremendous classification capabilities of the EBT algorithm. The outcomes of this research work will help the MEPCO and other power distribution companies in avoiding trouble due to inefficient and costly random inspections, which on one hand have merely helped in reducing NTL and on the other hand cause a huge revenue loss to the PDC’s on both account of NTL and costly inspections.

Author Contributions

For research articles with several authors, a short paragraph specifying their individual contributions must be provided. The following statements should be used “conceptualization, M.S.S.; methodology, M.S.S.; software, M.S.S.; validation, N.H.M., U.U.S. and T.A.J.; formal analysis, U.U.S.; investigation, M.W.M.; resources, M.W.M.; data curation, M.S.S.; writing—original draft preparation, M.S.S.; writing—review and editing, U.U.S., T.A.J. and N.H.M.; visualization, M.W.M. and N.H.M.; supervision, M.W.M.; project administration; M.W.M.; funding acquisition, All authors have contributed their own share.

Funding

This research received no external funding.

Conflicts of Interest

Author’s declares no conflict of interest.

References

  1. Depuru, S.S.S.R.; Wang, V.; Devabhaktuni, V.; Nelapati, P. A hybrid neural network model and encoding technique for enhanced classification of energy consumption data. In Proceedings of the 2011 IEEE Power and Energy Society General Meeting, San Diego, CA, USA, 24–29 July 2011; pp. 1–8. [Google Scholar]
  2. Costa, B.C.; Alberto, B.L.A.; Portela, A.M.; Maduro, W.; Eler, E.O. Fraud Detection in Electric Power Distribution Networks using an Ann-Based Knowledge-Discovery Process. Int. J. Artif. Intell. Appl. 2013, 4, 17–23. [Google Scholar] [CrossRef]
  3. Regulators, E.E.; Saint-michel, C. CEER Report on Power Losses; Arrondissement judiciaire de Bruxelles: Brussels, Belgium, 2017. [Google Scholar]
  4. Messinis, G.M.; Hatziargyriou, N.D. Review of non-technical loss detection methods. Electr. Power Syst. Res. 2018, 158, 250–266. [Google Scholar] [CrossRef]
  5. Sharma, T.; Pandey, K.K.; Punia, D.K.; Rao, J. Of pilferers and poachers: Combating electricity theft in India. Energy Res. Soc. Sci. 2016, 11, 40–52. [Google Scholar] [CrossRef]
  6. Sahoo, S.; Nikovski, D.; Muso, T.; Tsuru, K. Electricity theft detection using smart meter data. In Proceedings of the 2015 IEEE Power & Energy Society Innovative Smart Grid Technologies Conference ISGT, Washington, DC, USA, 18–20 February 2015; pp. 1–5. [Google Scholar]
  7. Viegas, J.L.; Esteves, P.R.; Melício, R.; Mendes, V.M.F.; Vieira, S.M. Solutions for detection of non-technical losses in the electricity grid: A review. Renew. Sustain. Energy Rev. 2017, 80, 1256–1268. [Google Scholar] [CrossRef] [Green Version]
  8. Kessides, I.N. Chaos in power: Pakistan’s electricity crisis. Energy Policy. 2013, 55, 271–285. [Google Scholar] [CrossRef]
  9. Guerrero, J.I.; Monedero, I.; Biscarri, F.; Biscarri, J.; Millan, R.; Leon, C. Non-Technical Losses Reduction by Improving the Inspections Accuracy in a Power Utility. IEEE Trans. Power Syst. 2018, 33, 1209–1218. [Google Scholar] [CrossRef]
  10. Depuru, S.S.S.R.; Wang, L.; Devabhaktuni, V. Smart meters for power grid: Challenges, issues, advantages and status. Renew. Sustain. Energy Rev. 2011, 15, 2736–2742. [Google Scholar] [CrossRef]
  11. Singh, S.K.; Bose, R.; Joshi, A. Energy Theft Detection in Advanced Metering Infrastructure. In Proceedings of the 2018 IEEE 4th World Forum on Internet of Things (WF-IoT), Singapore, 5–8 February 2018; pp. 529–534. [Google Scholar]
  12. Jiang, R.; Lu, R.; Wang, Y.; Luo, J.; Shen, C.; Shen, X. Energy-theft detection issues for advanced metering infrastructure in smart grid. Tsinghua Sci. Technol. 2014, 19, 105–120. [Google Scholar] [CrossRef]
  13. Jokar, P. Detection of Malicious Activities Against Advanced Metering Infrastructure in Smart Grid. Ph.D. Thesis, University of British Columbia, Vancouver, BC, Canada, December 2015. [Google Scholar]
  14. Cardenas, A.A.; Amin, S.; Schwartz, G.; Dong, R.; Sastry, S. A game theory model for electricity theft detection and privacy-aware control in AMI systems. In Proceedings of the 2012 50th Annual Allerton Conference on Communication, Control, and Computing (Allerton), Monticello, IL, USA, 1–5 October 2012; pp. 1830–1837. [Google Scholar]
  15. Jokar, P.; Arianpoo, N.; Leung, V.C.M. Electricity theft detection in AMI using customers’ consumption patterns. IEEE Trans. Smart Grid 2016, 7, 216–226. [Google Scholar] [CrossRef]
  16. Muniz, C.; Figueiredo, K.; Vellasco, M.; Chavez, G.; Pacheco, M. Irregularity detection on low tension electric installations by neural network ensembles. In Proceedings of the 2009 International Joint Conference on Neural Networks, Atlanta, GA, USA, 14–19 June 2009; pp. 2176–2182. [Google Scholar]
  17. Angelos, E.W.S.D.; Saavedra, O.R.; Cortés, O.A.C.; de Souza, A.N. Detection and identification of abnormalities in customer consumptions in power distribution systems. IEEE Trans. Power Deliv. 2011, 26, 2436–2442. [Google Scholar] [CrossRef]
  18. Spirić, J.V.; Stanković, S.S.; Dočić, M.B.; Popović, T.D. Using the rough set theory to detect fraud committed by electricity customers. Int. J. Electr. Power Energy Syst. 2014, 62, 727–734. [Google Scholar] [CrossRef]
  19. McLaughlin, S.; Holbert, B.; Fawaz, A.; Berthier, R.; Zonouz, S. A multi-sensor energy theft detection framework for advanced metering infrastructures. IEEE J. Sel. Areas Commun. 2013, 31, 1319–1330. [Google Scholar] [CrossRef]
  20. Mohammad, N.; Barua, A.; Arafat, M.A. A smart prepaid energy metering system to control electricity theft. In Proceedings of the 2013 International Conference on Power, Energy and Control (ICPEC), Sri Rangalatchum Dindigul, India, 6–8 February 2013; no. ATmega 32. pp. 562–565. [Google Scholar]
  21. Nagi, J.; Mohammad, A.M.; Yap, K.S.; Tiong, S.K.; Ahmed, S.K. Nontechnical loss detection for metered consumers in power utility using support vector machines. IEEE Trans. Power Deliv. 2010, 25, 1162–1171. [Google Scholar] [CrossRef]
  22. Nagi, J.; Yap, K.S.; Tiong, S.K.; Ahmed, S.K.; Nagi, F. Improving SVM-based nontechnical loss detection in power utility using the fuzzy inference system. IEEE Trans. Power Deliv. 2011, 26, 1284–1285. [Google Scholar] [CrossRef]
  23. Chebrolu, S.; Abraham, A.; Thomas, J.P. Feature deduction and ensemble design of intrusion detection systems. Comput. Secur. 2005, 24, 295–307. [Google Scholar] [CrossRef]
  24. Kim, M.J.; Kang, D.K. Classifiers selection in ensembles using genetic algorithms for bankruptcy prediction. Expert Syst. Appl. 2012, 39, 9308–9314. [Google Scholar] [CrossRef]
  25. Cruz, R.M.O.; Sabourin, R.; Cavalcanti, G.D.C. Dynamic classifier selection: Recent advances and perspectives. Inf. Fusion 2018, 41, 195–216. [Google Scholar] [CrossRef]
  26. Dietterich, T.G. Ensemble Methods in Machine Learning. In Lecture Notes in Computer Science, Proceedings of the International Workshop on Multiple Classifier Systems, Cagliari, Italy, 21–23 June 2000; Springer: Berlin/Heidelberg, Germany, 2000; pp. 1–15. [Google Scholar] [Green Version]
  27. Soares, S.G.; Araújo, R. A dynamic and on-line ensemble regression for changing environments. Expert Syst. Appl. 2015, 42, 2935–2948. [Google Scholar] [CrossRef]
  28. Krawczyk, B.; Minku, L.L.; Gama, J.; Stefanowski, J.; Woźniak, M. Ensemble learning for data stream analysis: A survey. Inf. Fusion 2017, 37, 132–156. [Google Scholar] [CrossRef]
  29. Galar, M.; Fernandez, A.; Barrenechea, E.; Bustince, H.; Herrera, F. A review on ensembles for the class imbalance problem: Bagging-, boosting-, and hybrid-based approaches. IEEE Trans. Syst. Man Cybern. Part C Appl. Rev. 2012, 42, 463–484. [Google Scholar] [CrossRef]
  30. Xiao, H.; Xiao, Z.; Wang, Y. Ensemble classification based on supervised clustering for credit scoring. Appl. Soft Comput. J. 2016, 43, 73–86. [Google Scholar] [CrossRef]
  31. Mousavi, R.; Eftekhari, M. A new ensemble learning methodology based on hybridization of classifier ensemble selection approaches. Appl. Soft Comput. J. 2015, 37, 652–666. [Google Scholar] [CrossRef]
  32. Polikar, R. Ensemble based systems in decision making. IEEE Circuits Syst. Mag. 2006, 6, 21–44. [Google Scholar] [CrossRef]
  33. Muhlbaier, M.; Topalis, A.; Polikar, R. Ensemble Confidence Estimates Posterior Probability. In Lecture Notes in Computer Science, Proceedings of the International Workshop on Multiple Classifier Systems, Seaside, CA, USA, 13–15 June 2005; Springer: Berlin/Heidelberg, Germany, 2005; Volume 3541, pp. 326–335. [Google Scholar]
  34. Mishra, P.K.; Yadav, A.; Pazoki, M. A Novel Fault Classification Scheme for Series Capacitor Compensated Transmission Line Based on Bagged Tree Ensemble Classifier. IEEE Access 2018, 6, 27373–27382. [Google Scholar] [CrossRef]
  35. Choudhury, S.; Chaudhuri, A.; Patra, D. An ensemble approach for the detection and classification of mixed pixels of remotely sensed images. In Proceedings of the 2018 4th International Conference on Recent Advances in Information Technology (RAIT), Dhanbad, India, 15–17 March 2018; pp. 1–5. [Google Scholar]
  36. Zhang, L.; Xiong, J.; Zhao, H.; Hong, H.; Zhu, X.; Li, C. Sleep stages classification by CW Doppler radar using bagged trees algorithm. In Proceedings of the 2017 IEEE Radar Conference (RadarConf), Seattle, WA, USA, 8–12 May 2017; pp. 0788–0791. [Google Scholar]
  37. León, C.; Biscarri, F.; Monedero, I.; Guerrero, J.I.; Biscarri, J.; Millán, R. Variability and trend-based generalized rule induction model to NTL detection in power companies. IEEE Trans. Power Syst. 2011, 26, 1798–1807. [Google Scholar] [CrossRef]
  38. Coma-Puig, B.; Carmona, J.; Gavalda, R.; Alcoverro, S.; Martin, V. Fraud detection in energy consumption: A supervised approach. In Proceedings of the 2016 IEEE International Conference on Data Science and Advanced Analytics (DSAA), Montreal, QC, Canada, 17–19 October 2016; pp. 120–129. [Google Scholar]
  39. Kosut, J.P.; Santomauro, F.; Jorysz, A.; Fernández, A.; Lecumberry, F.; Rodriguez, F. Abnormal consumption analysis for fraud detection: UTE-UDELAR joint efforts. In Proceedings of the 2015 IEEE PES Innovative Smart Grid Technologies Latin America (ISGT LATAM), Montevideo, Uruguay, 5–7 October 2015; pp. 887–892. [Google Scholar]
  40. Shekara, S.; Reddy, S.; Wang, L.; Devabhaktuni, V. Classification for Detection of Electricity Theft. In Proceedings of the 2011 IEEE/PES Power Systems Conference and Exposition, Phoenix, AZ, USA, 20–23 March 2011; pp. 1–8. [Google Scholar]
  41. Jindal, A.; Dua, A.; Kaur, K.; Singh, M.; Kumar, N.; Mishra, S. Decision Tree and SVM-Based Data Analytics for Theft Detection in Smart Grid. IEEE Trans. Ind. Inform. 2016, 12, 1005–1016. [Google Scholar] [CrossRef]
  42. Nagi, J.; Yap, K.S.; Tiong, S.K.; Ahmed, S.K.; Mohammad, A.M. Detection of abnormalities and electricity theft using genetic support vector machines. In Proceedings of the TENCON 2008—2008 IEEE Region 10 Conference, Hyderabad, India, 19–21 November 2008; pp. 1–6. [Google Scholar]
  43. Pereira, D.R.; Pereira, D.R.; Pazoti, M.A.; Pereira, L.A.M.; Rodrigues, D.; Ramos, C.O.; Souza, A.N.; Papa, J.P. Social-Spider Optimization-based Support Vector Machines applied for energy theft detection. Comput. Electr. Eng. 2016, 49, 25–38. [Google Scholar] [CrossRef] [Green Version]
  44. Ramos, C.C.O.; Souza, A.N.; Chiachia, G.; Falcão, A.X.; Papa, J.P. A novel algorithm for feature selection using Harmony Search and its application for non-technical losses detection. Comput. Electr. Eng. 2011, 37, 886–894. [Google Scholar] [CrossRef]
  45. No, J.; Han, S.Y.; Joo, Y.; Shin, J.-H. Conditional abnormality detection based on AMI data mining. IET Gener. Transm. Distrib. 2016, 10, 3010–3016. [Google Scholar]
  46. Ramos, C.C.O.; de Sousa, A.N.; Papa, J.P.; Falcão, A.X. A new approach for nontechnical losses detection based on optimum-path forest. IEEE Trans. Power Syst. 2011, 26, 181–189. [Google Scholar] [CrossRef]
  47. Glauner, P.; Boechat, A.; Dolberg, L.; State, R.; Bettinger, F.; Rangoni, Y. Large-scale detection of non-technical losses in imbalanced data sets. In Proceedings of the 2016 IEEE Power & Energy Society Innovative Smart Grid Technologies Conference (ISGT), Minneapolis, MN, USA, 6–9 September 2016; pp. 1–5. [Google Scholar]
Figure 1. Bagging training procedure.
Electronics 08 00860 g001
Figure 2. Framework for training and validation of the model.
Electronics 08 00860 g002
Figure 3. Different modes of theft registered in Multan circle for the year 2016–2017.
Electronics 08 00860 g003
Figure 4. Consumption pattern of the fraudulent (A) and honest consumer (B).
Electronics 08 00860 g004
Figure 5. Classification algorithms used in this research work.
Electronics 08 00860 g005
Figure 6. Classification and Regression (C&R) decision tree.
Electronics 08 00860 g006
Figure 7. Classification performance of different models.
Electronics 08 00860 g007
Figure 8. Receiver Operating Characteristic (ROC) curve for Ensemble Bagged Tree (EBT) algorithm (a) negative class (honest consumers), (b) positive class (fraudster consumers).
Electronics 08 00860 g008aElectronics 08 00860 g008b
Table 1. Decision Tree (DT) models and parameters.
ModelMaximum Number of SplitsSplit Criterion
Fine Tree100Gini’s diversity index
Medium Tree20Gini’s diversity index
Coarse Tree4Gini’s diversity index
Table 2. Support Vector Machine (SVM) models and parameters.
ModelKernel FunctionKernel Scale
Linear SVMLinear1
Quadratic SVMQuadratic1
Cubic SVMCubic1
Fine Gaussian SVMGaussian1.5
Medium Gaussian SVMGaussian6
Coarse Gaussian SVMGaussian24
Table 3. K-Nearest Neighbor (KNN) models and parameters.
ModelDistance MetricNumber of Neighbors
Fine KNNEuclidean1
Medium KNNEuclidean10
Coarse KNNEuclidean100
Cosine KNNCosine10
Cubic KNNMinkowski10
Weighted KNNEuclidean10
Table 4. Ensemble models and parameters.
Ensemble ModelsEnsemble MethodLearner TypeMax. Number of SplitsNumber of Learners
Boosted TreesAdaBoostDecision tree2030
Bagged TreesBagDecision tree2030
Subspace KNNSubspaceNearest neighbors2030
RUSBoosted TreesRUSBoost BagDecision tree2030
Random ForestRUSBoost BagDecision tree2030
Table 5. Classification results of different algorithms.
ModelAccuracySensitivitySpecificityF1 ScoreFPR
Decision Trees
Fine Tree85.8442.3399.1029.140.90
Medium Tree91.0264.1999.2038.480.80
Coarse Tree86.3543.4199.4329.880.57
Support Vector Machines
Linear SVM (LSVM)79.5416.4398.7713.641.23
Quadratic SVM (QSVM)85.5952.0995.8031.404.20
Cubic SVM (CSVM)52.3258.1450.5418.1449.46
Fine Gaussian SVM85.0163.8891.4533.288.55
Medium Gaussian SVM81.5428.5397.6920.962.31
Coarse Gaussian SVM76.941.8699.811.820.19
K-Nearest Neighbours
Fine KNN81.7927.2998.3920.581.61
Medium KNN79.5813.4999.7211.790.28
Coarse KNN76.650.00100.00 0.00
Cosine KNN78.2020.0095.9415.004.06
Cubic KNN78.9611.0199.679.820.33
Weighted KNN79.3312.4099.7210.940.28
Ensemble Classification
Boosted Trees90.6661.5599.5337.740.47
Bagged Trees93.0874.8898.6341.751.37
Subspace Discriminant77.232.7999.912.710.09
Subspace KNN82.8029.6199.0122.290.99
RUSBoosted Tree89.0366.5195.8936.954.11
Random Forest90.0367.5196.8937.713.11

