Design of an Efficient Maximum Power Point Tracker Based on ANFIS Using an Experimental Photovoltaic System Data


Abstract
:1. Introduction
2. Related Works
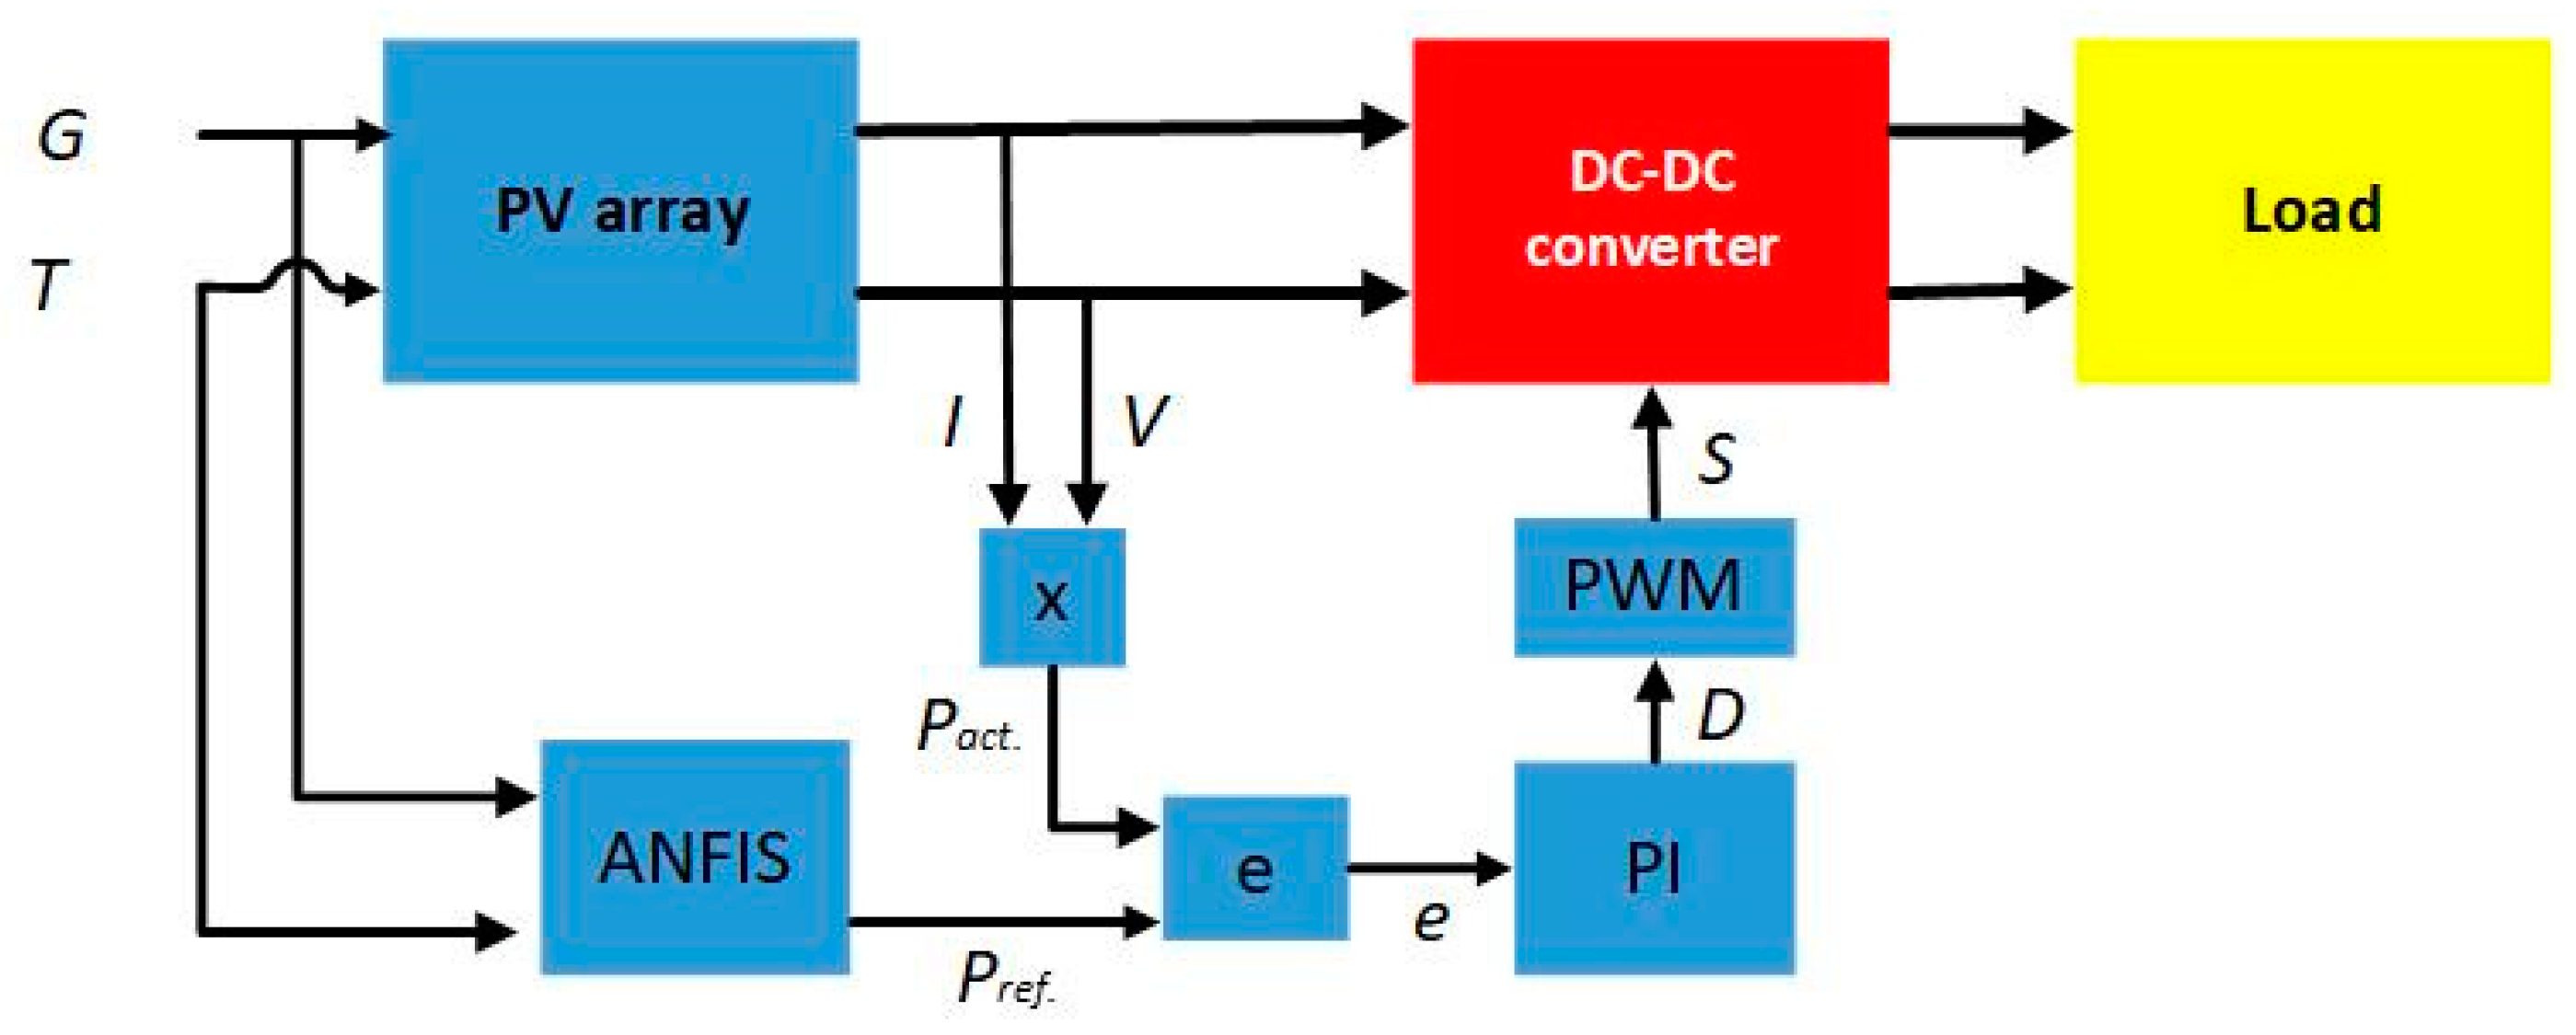
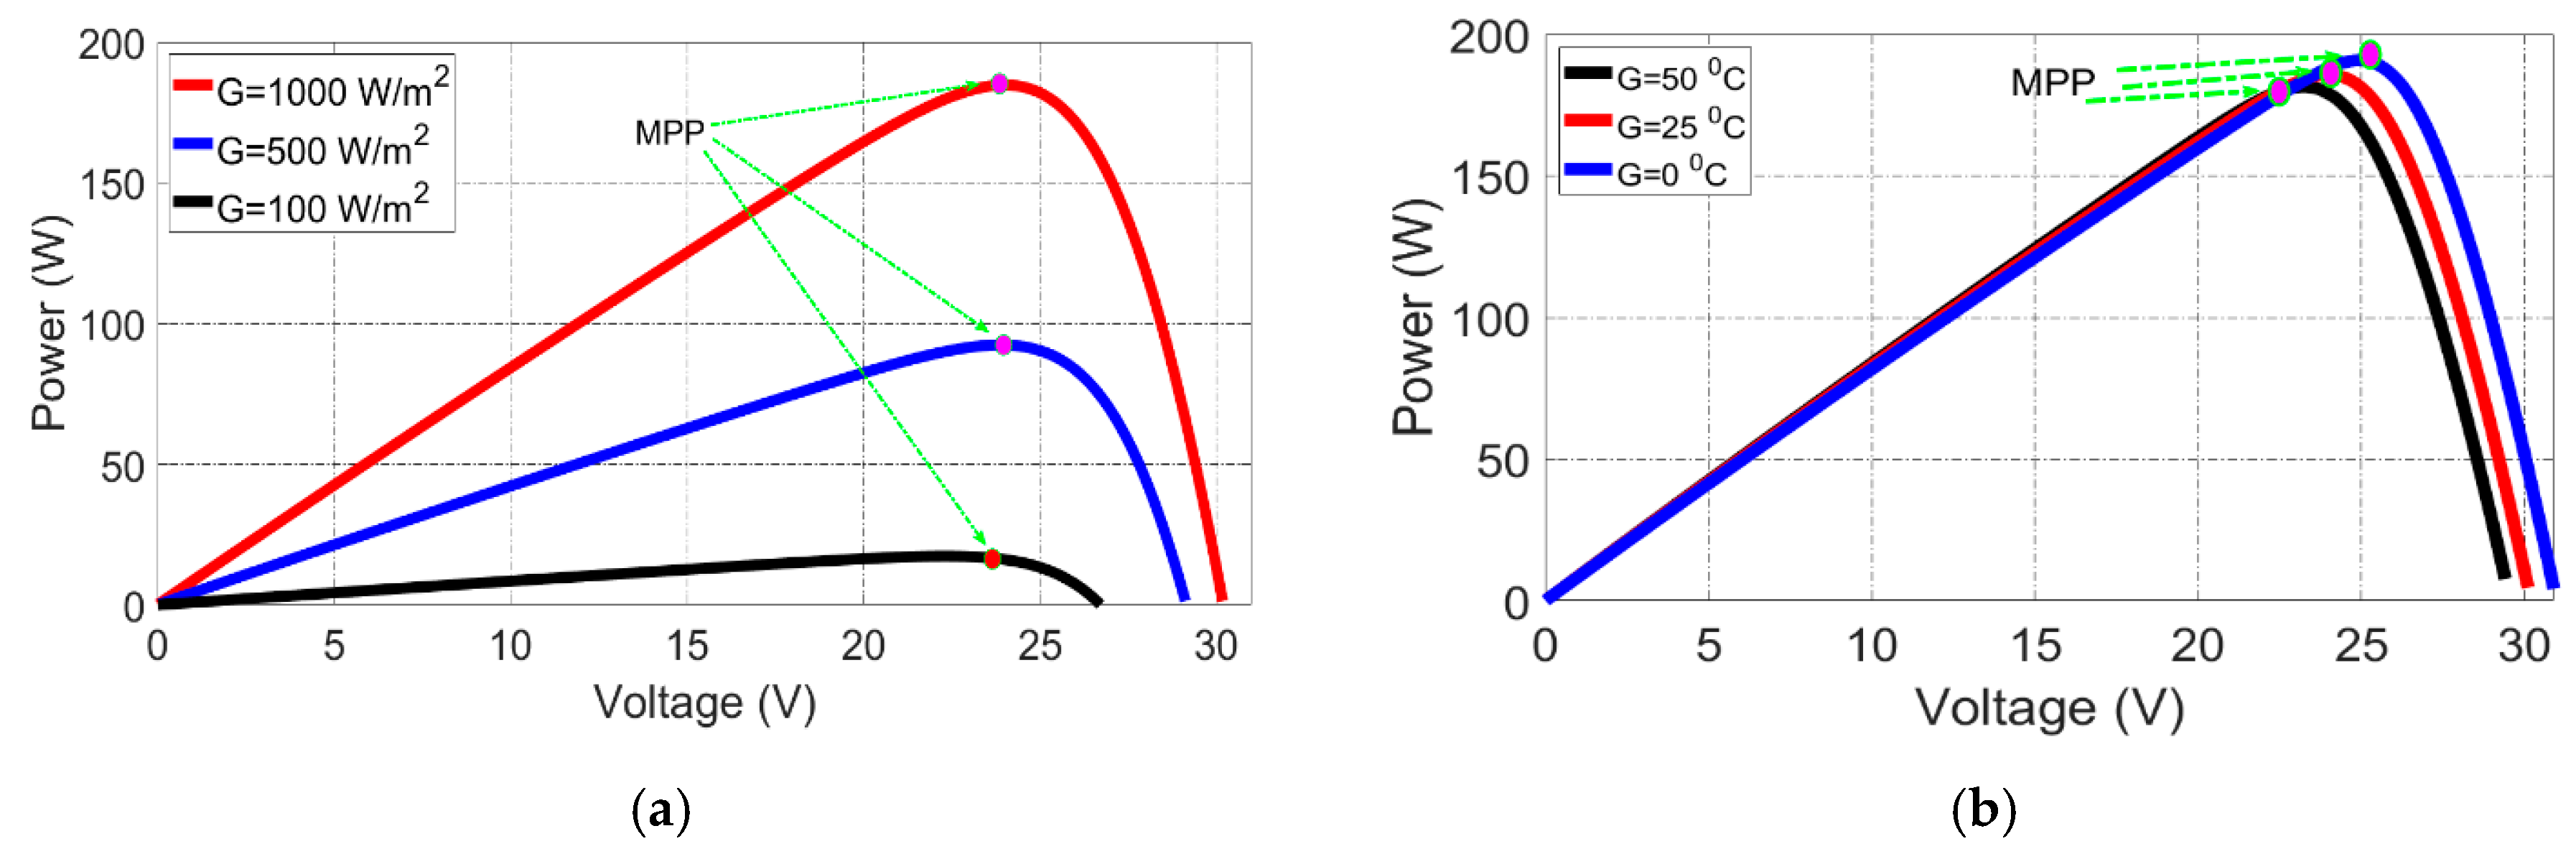
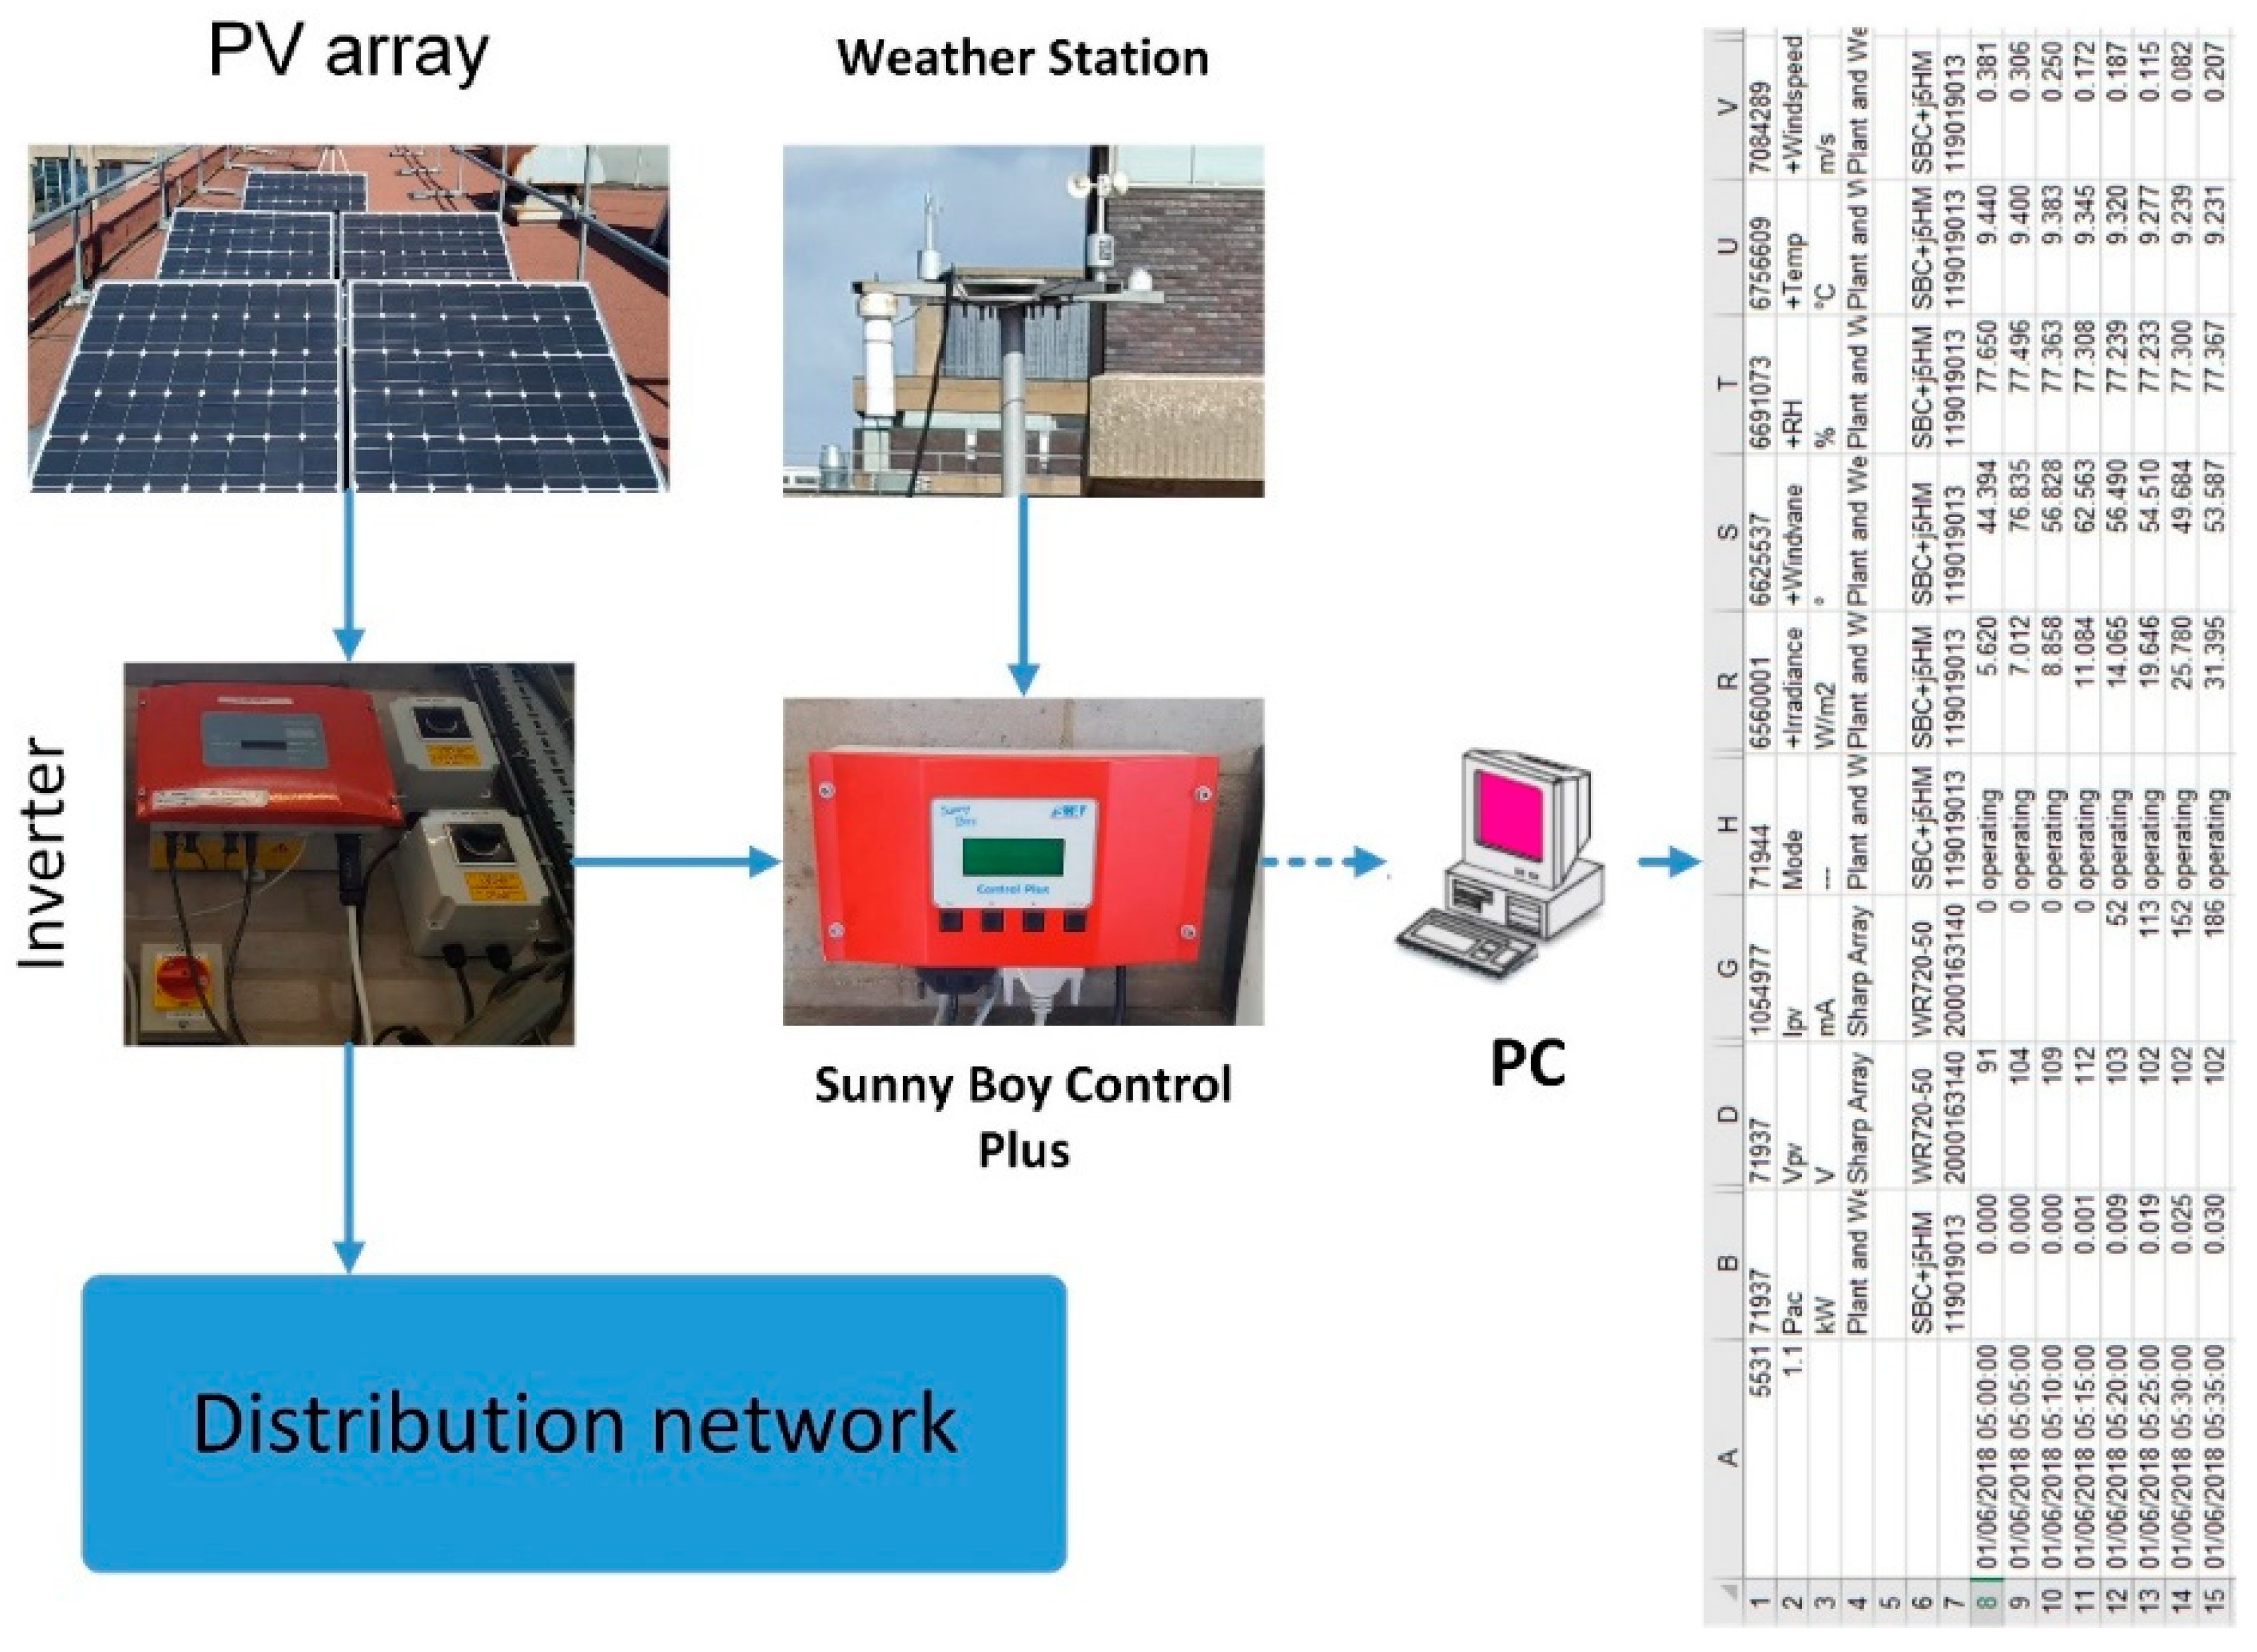
3. Photovoltaic System
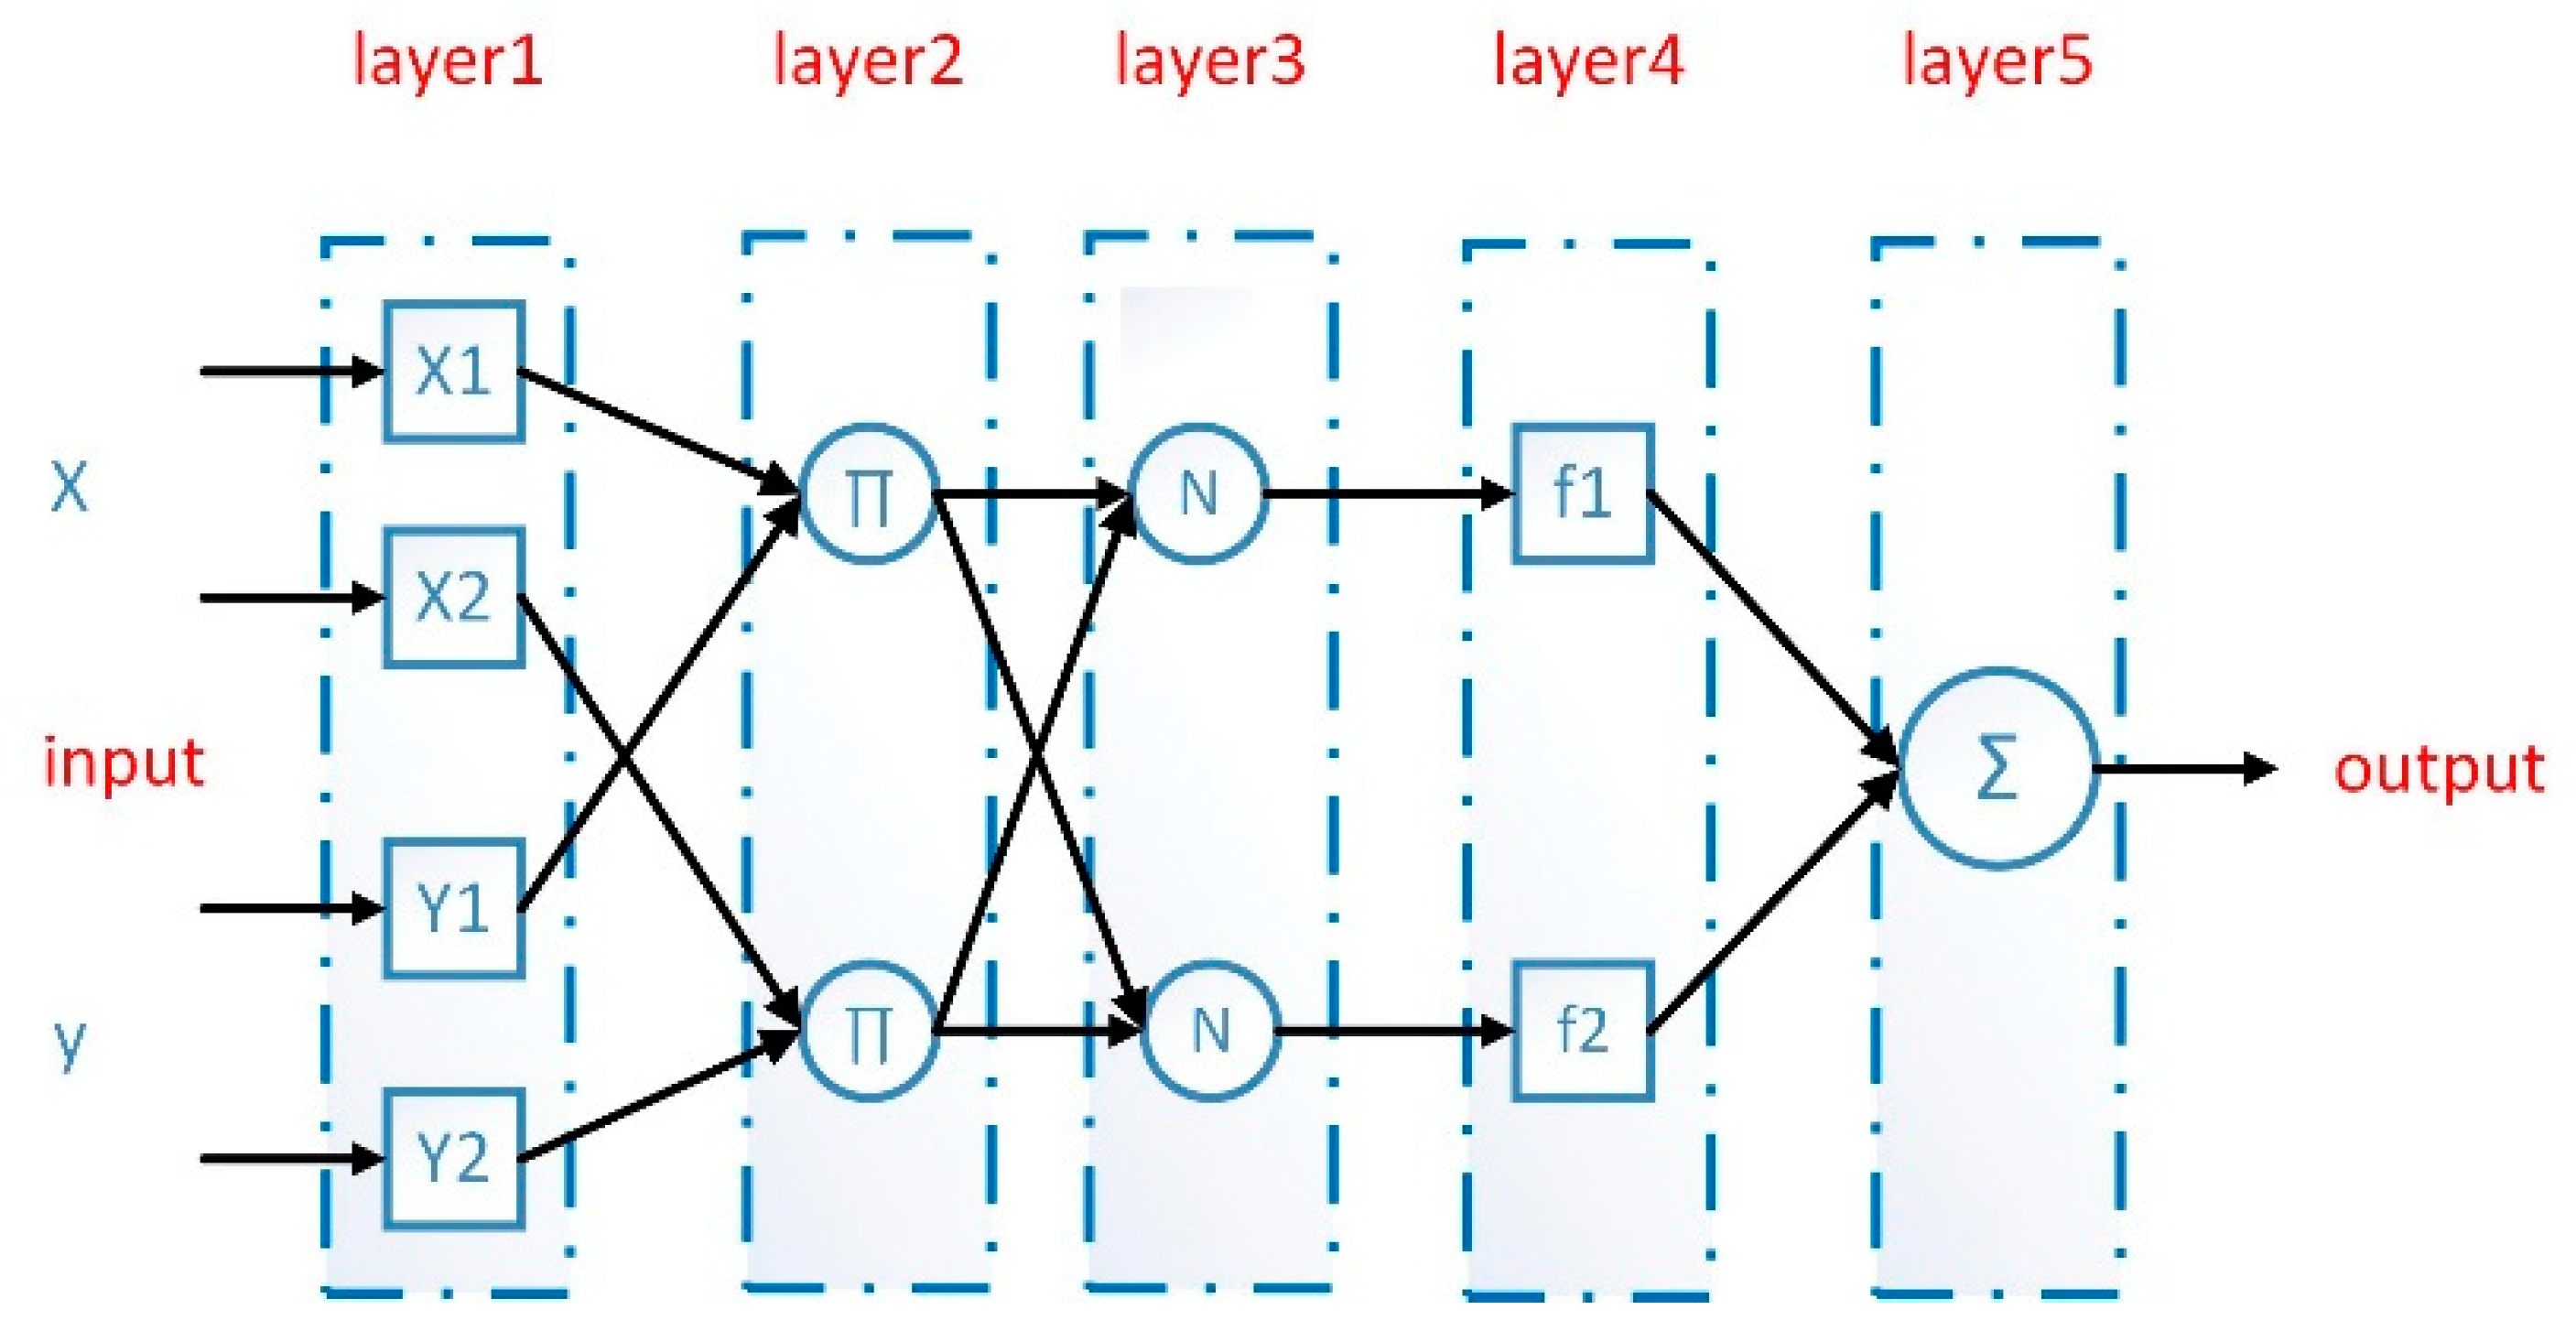
4. ANFIS Technique
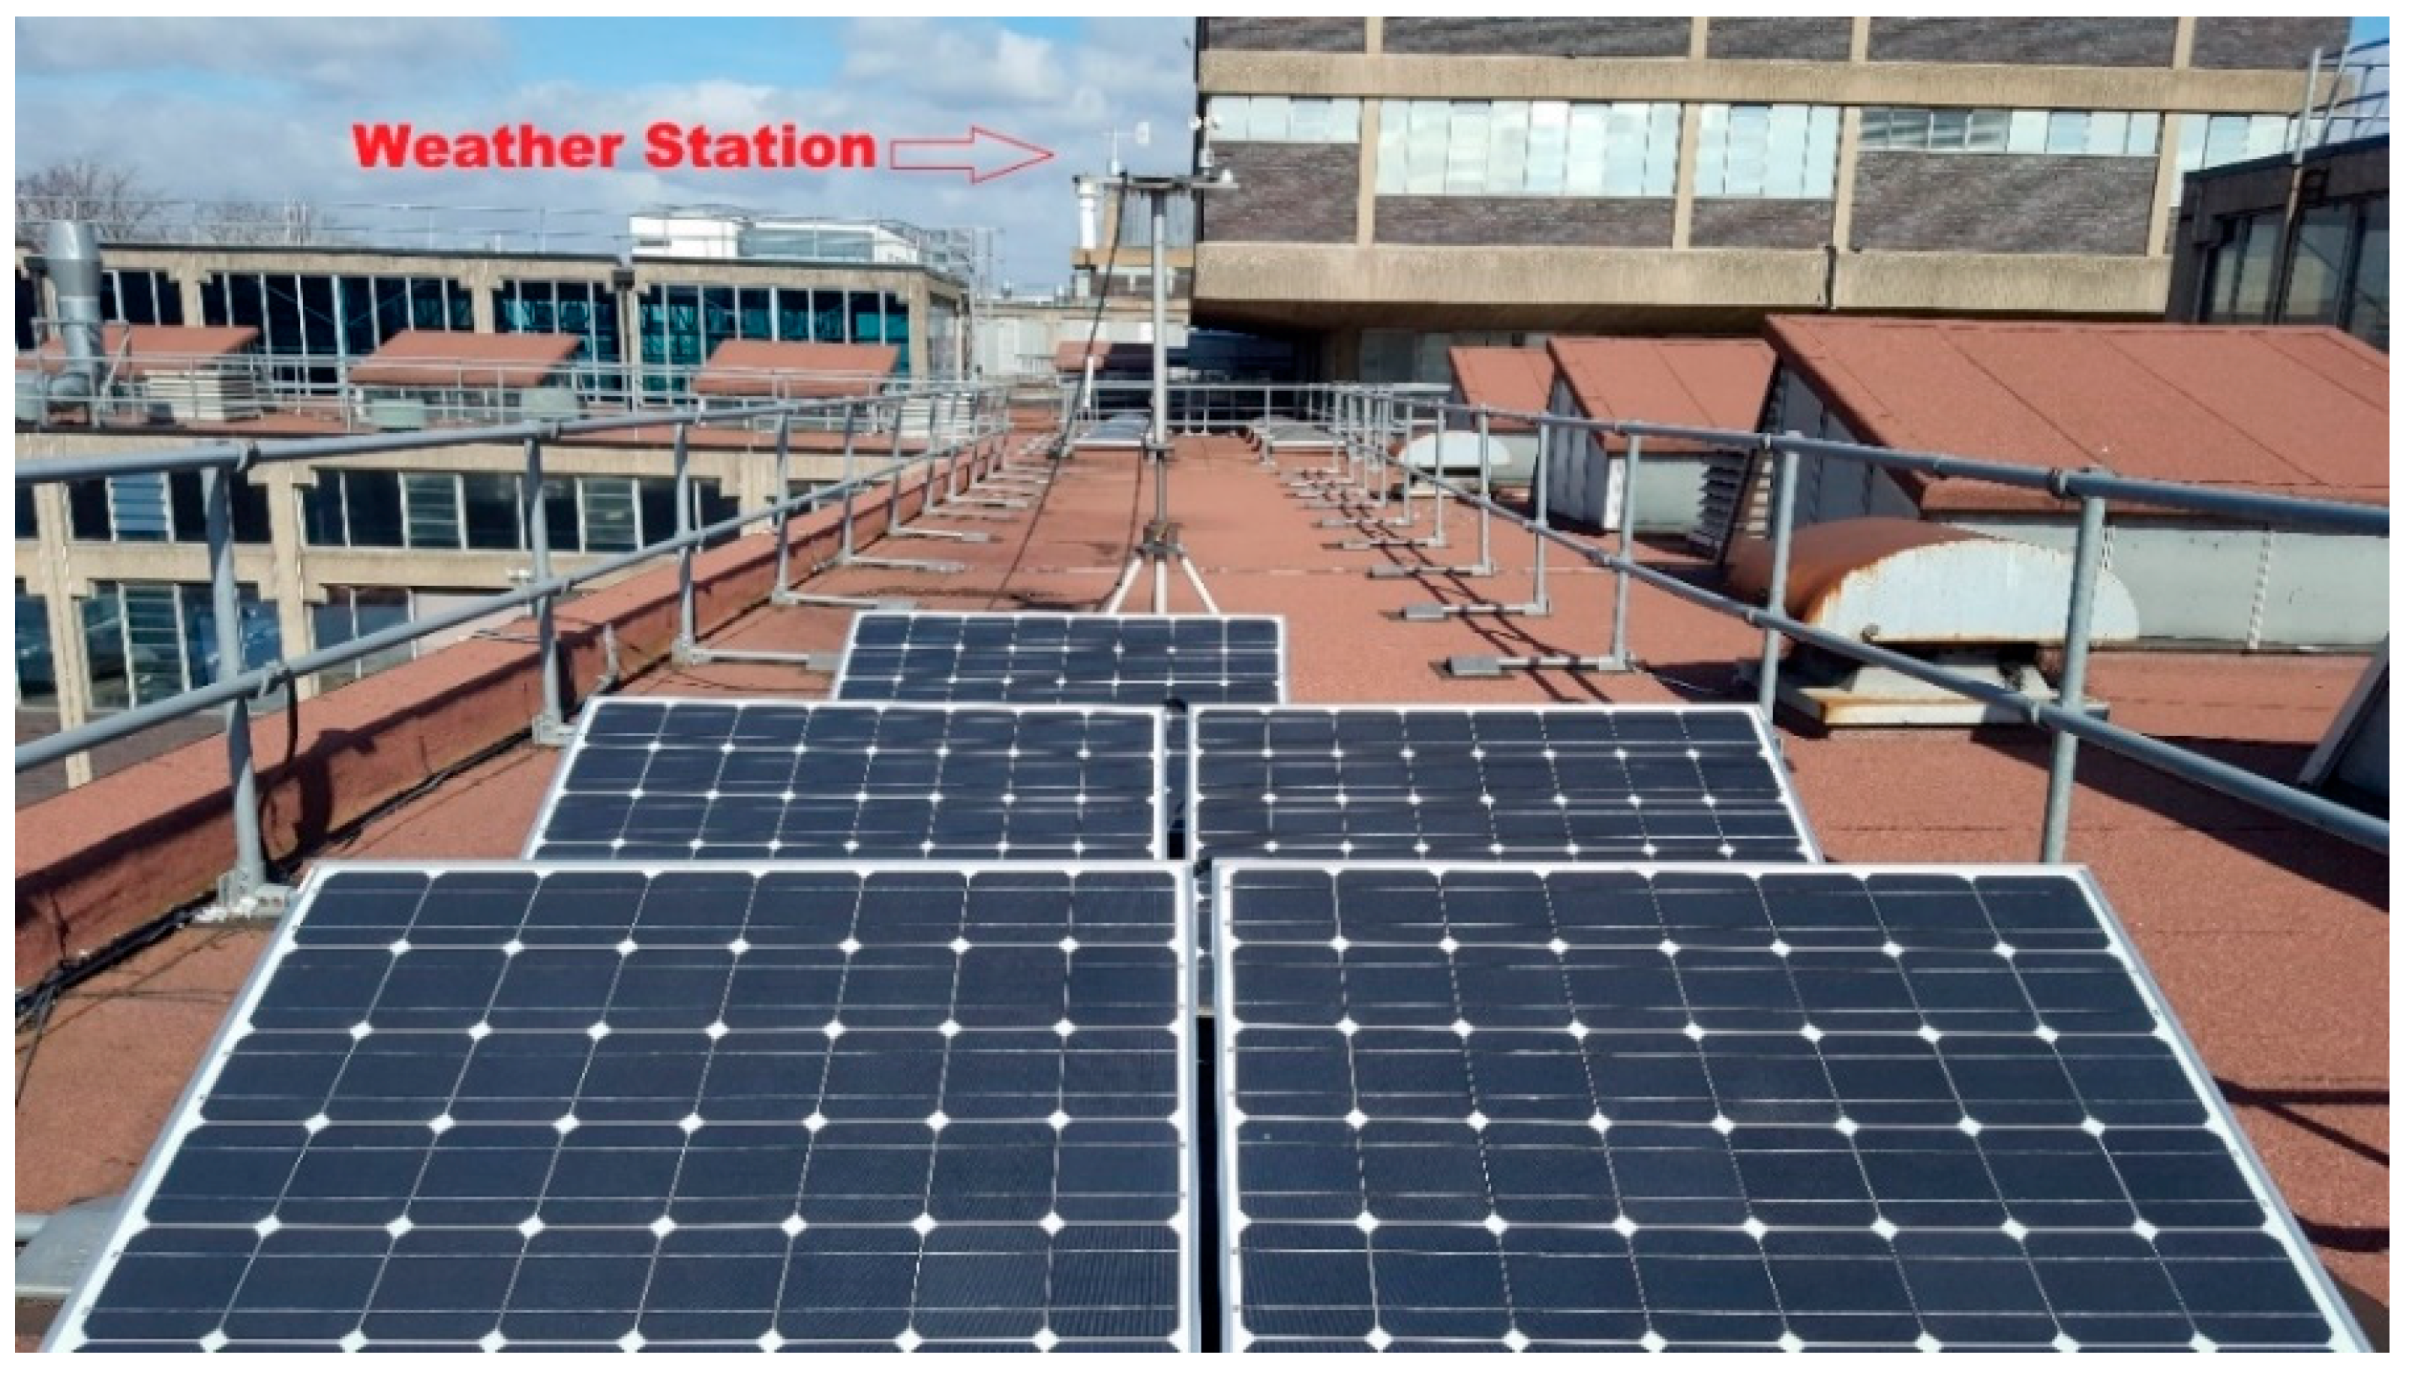
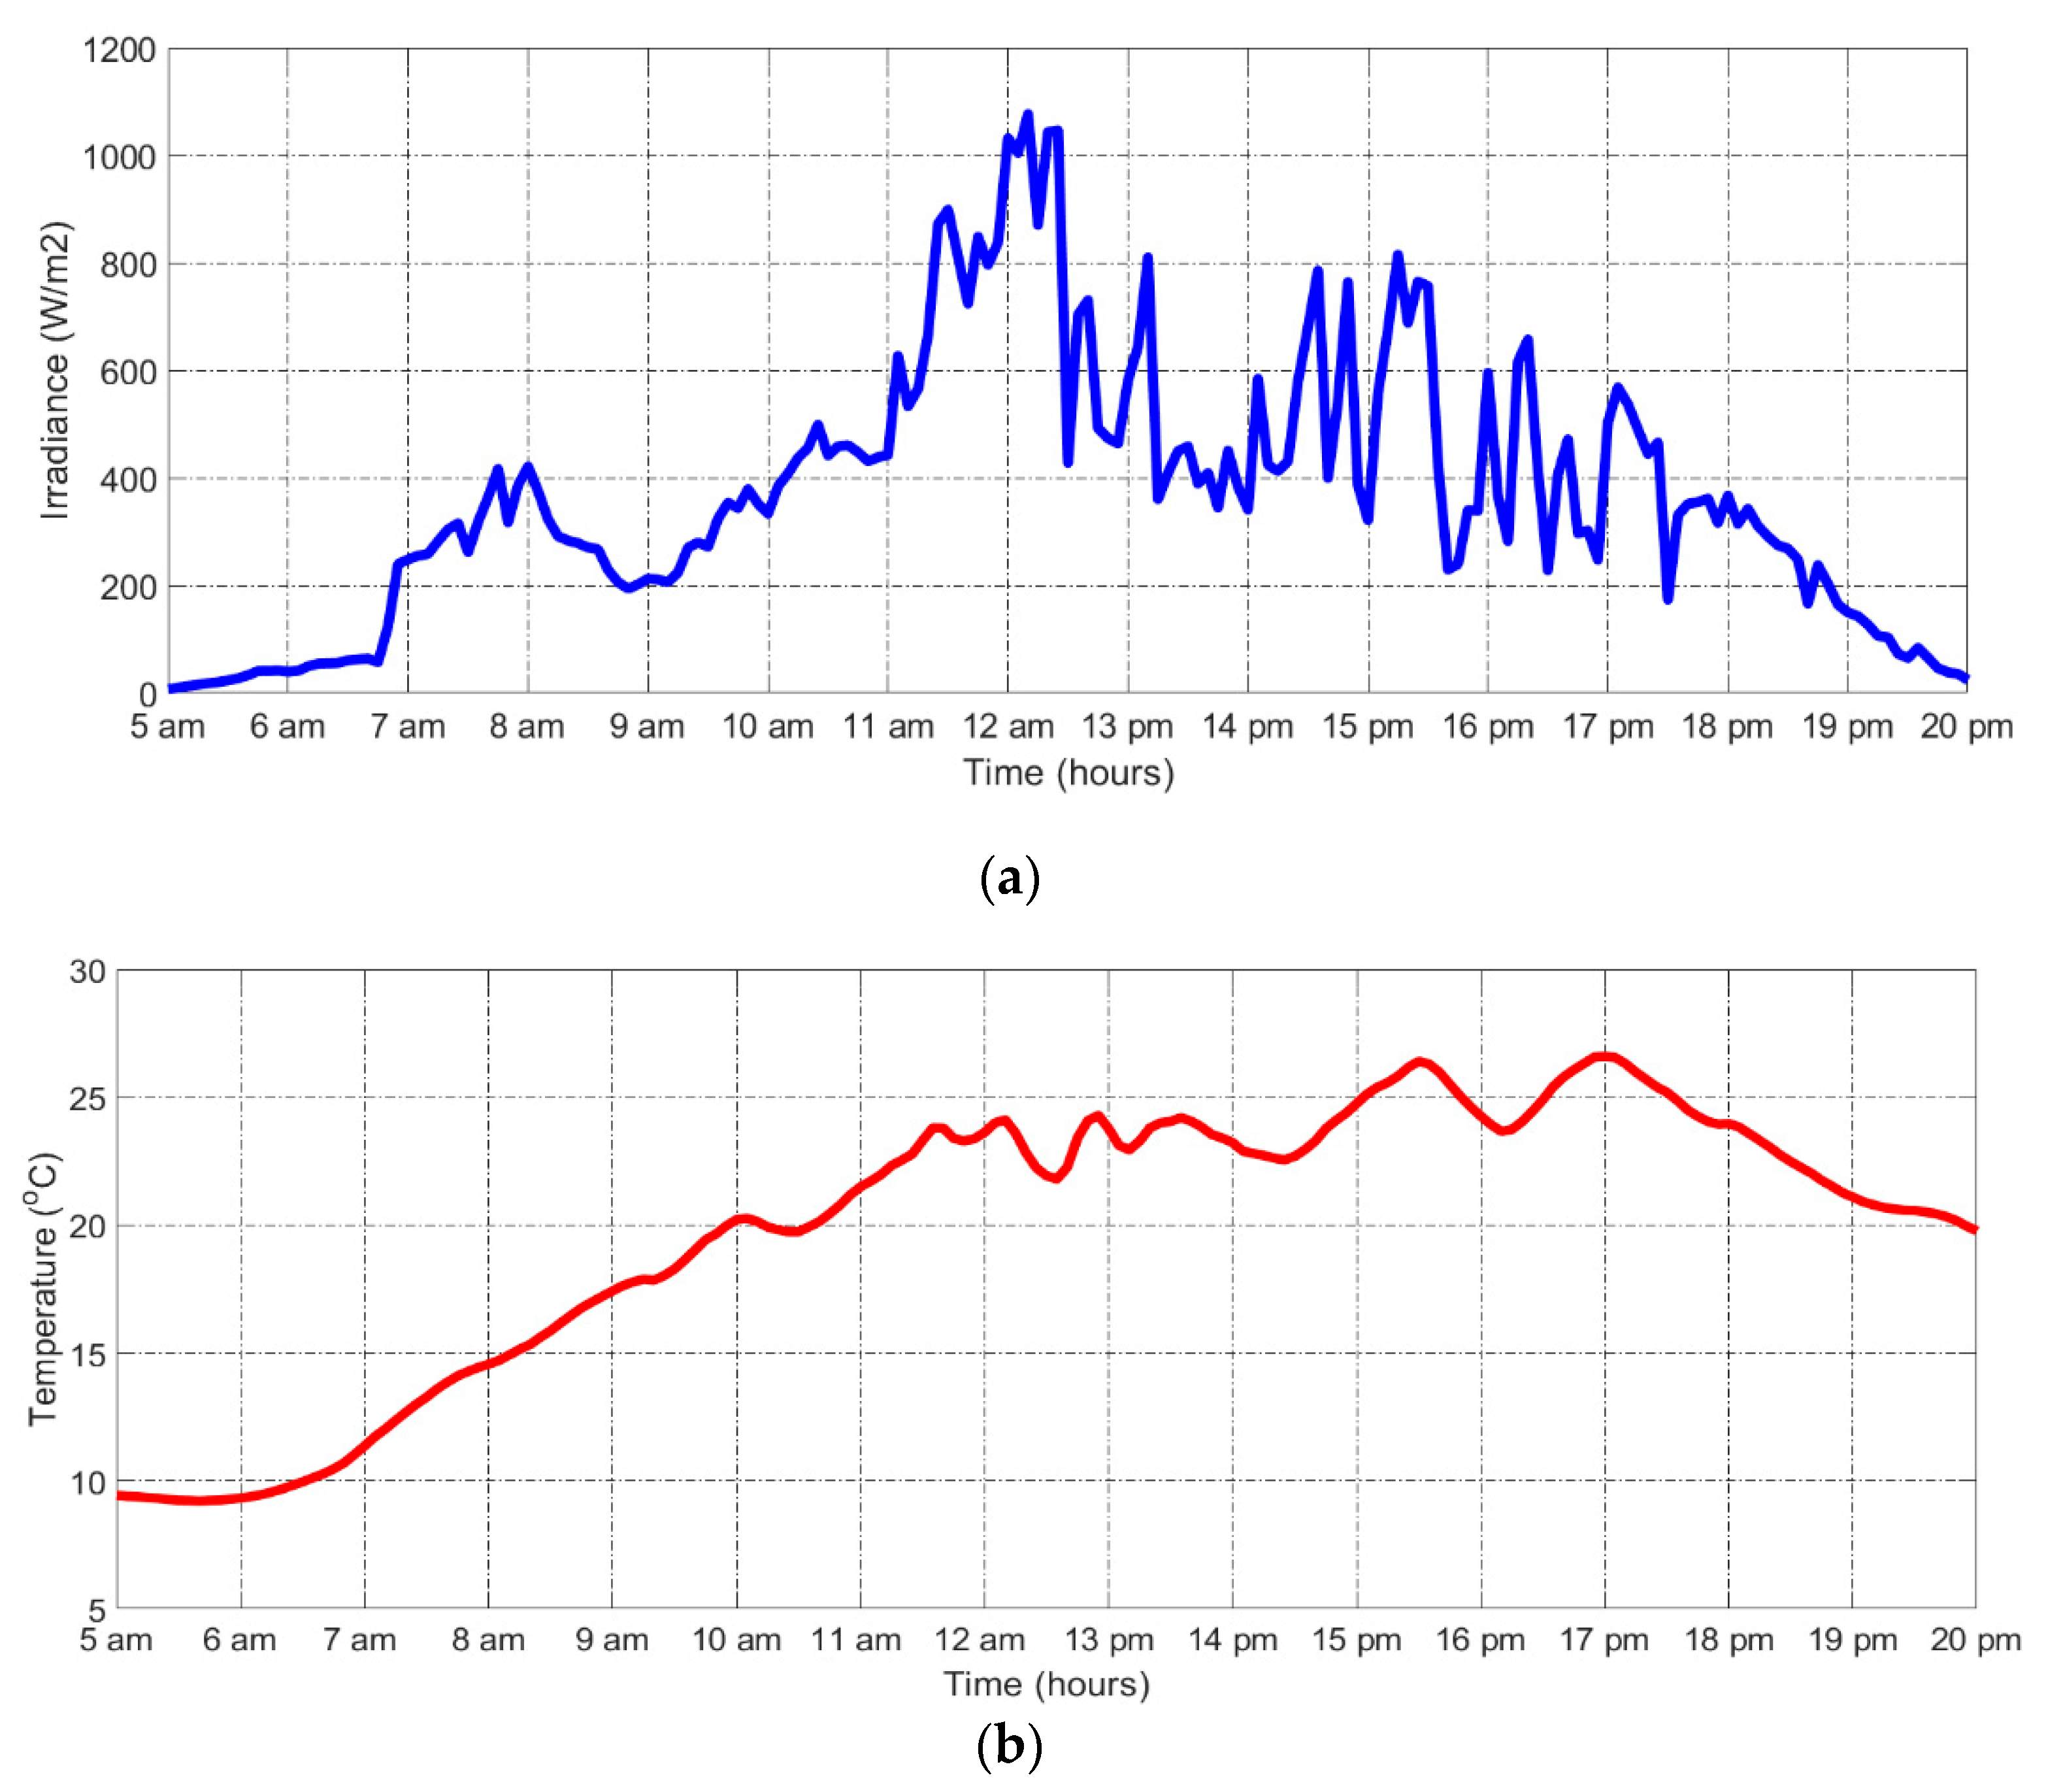
5. Methodology of Collected Data
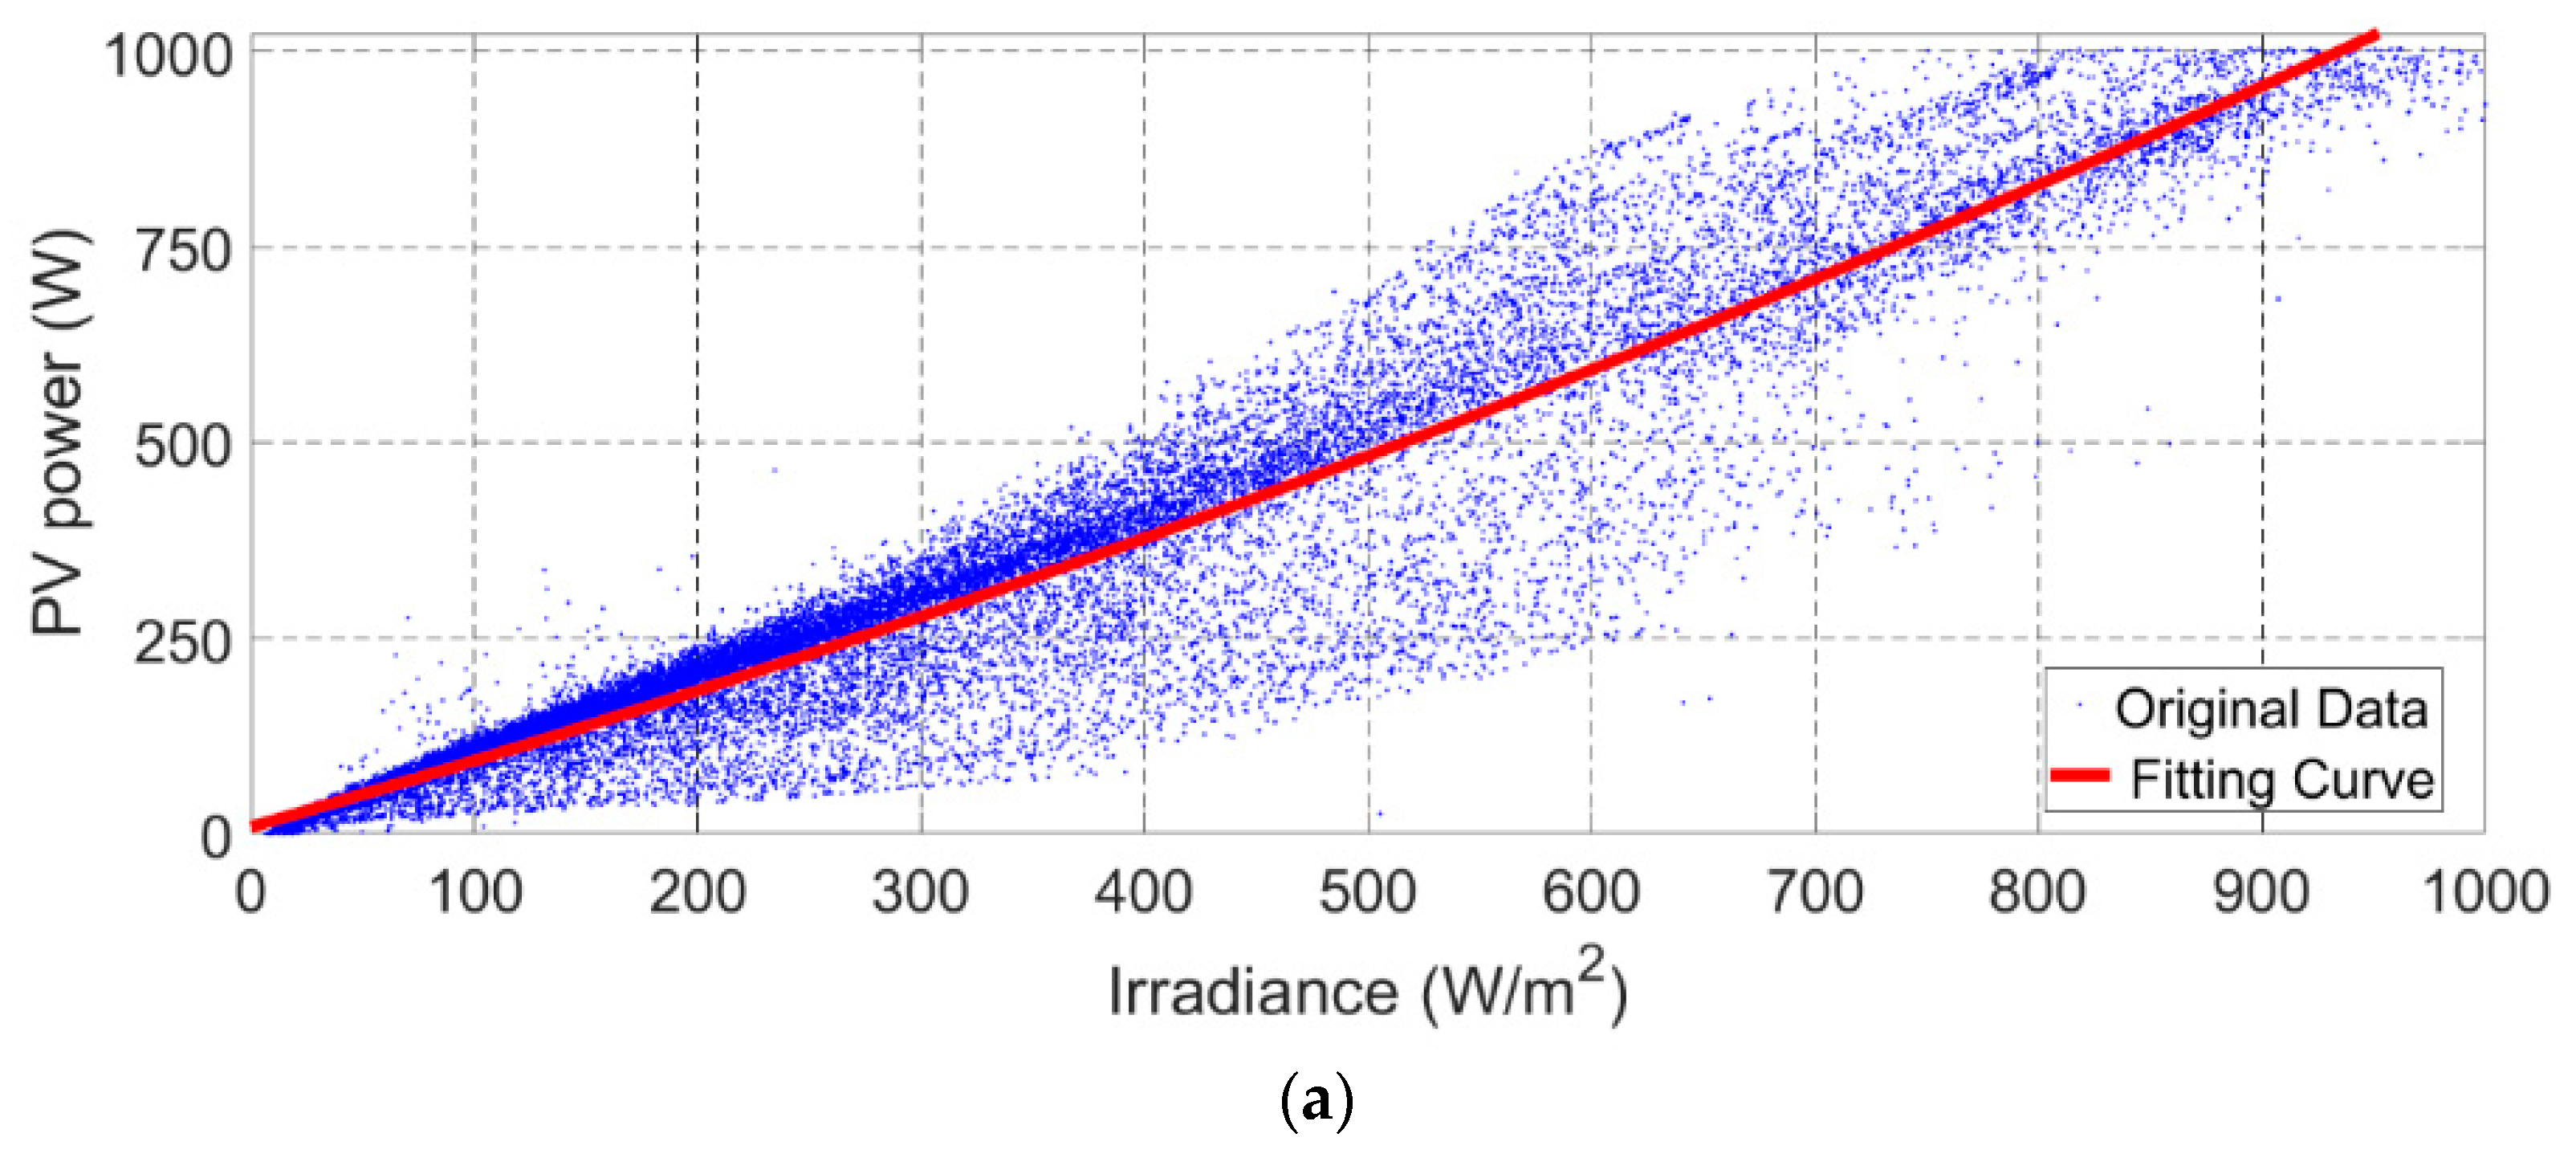
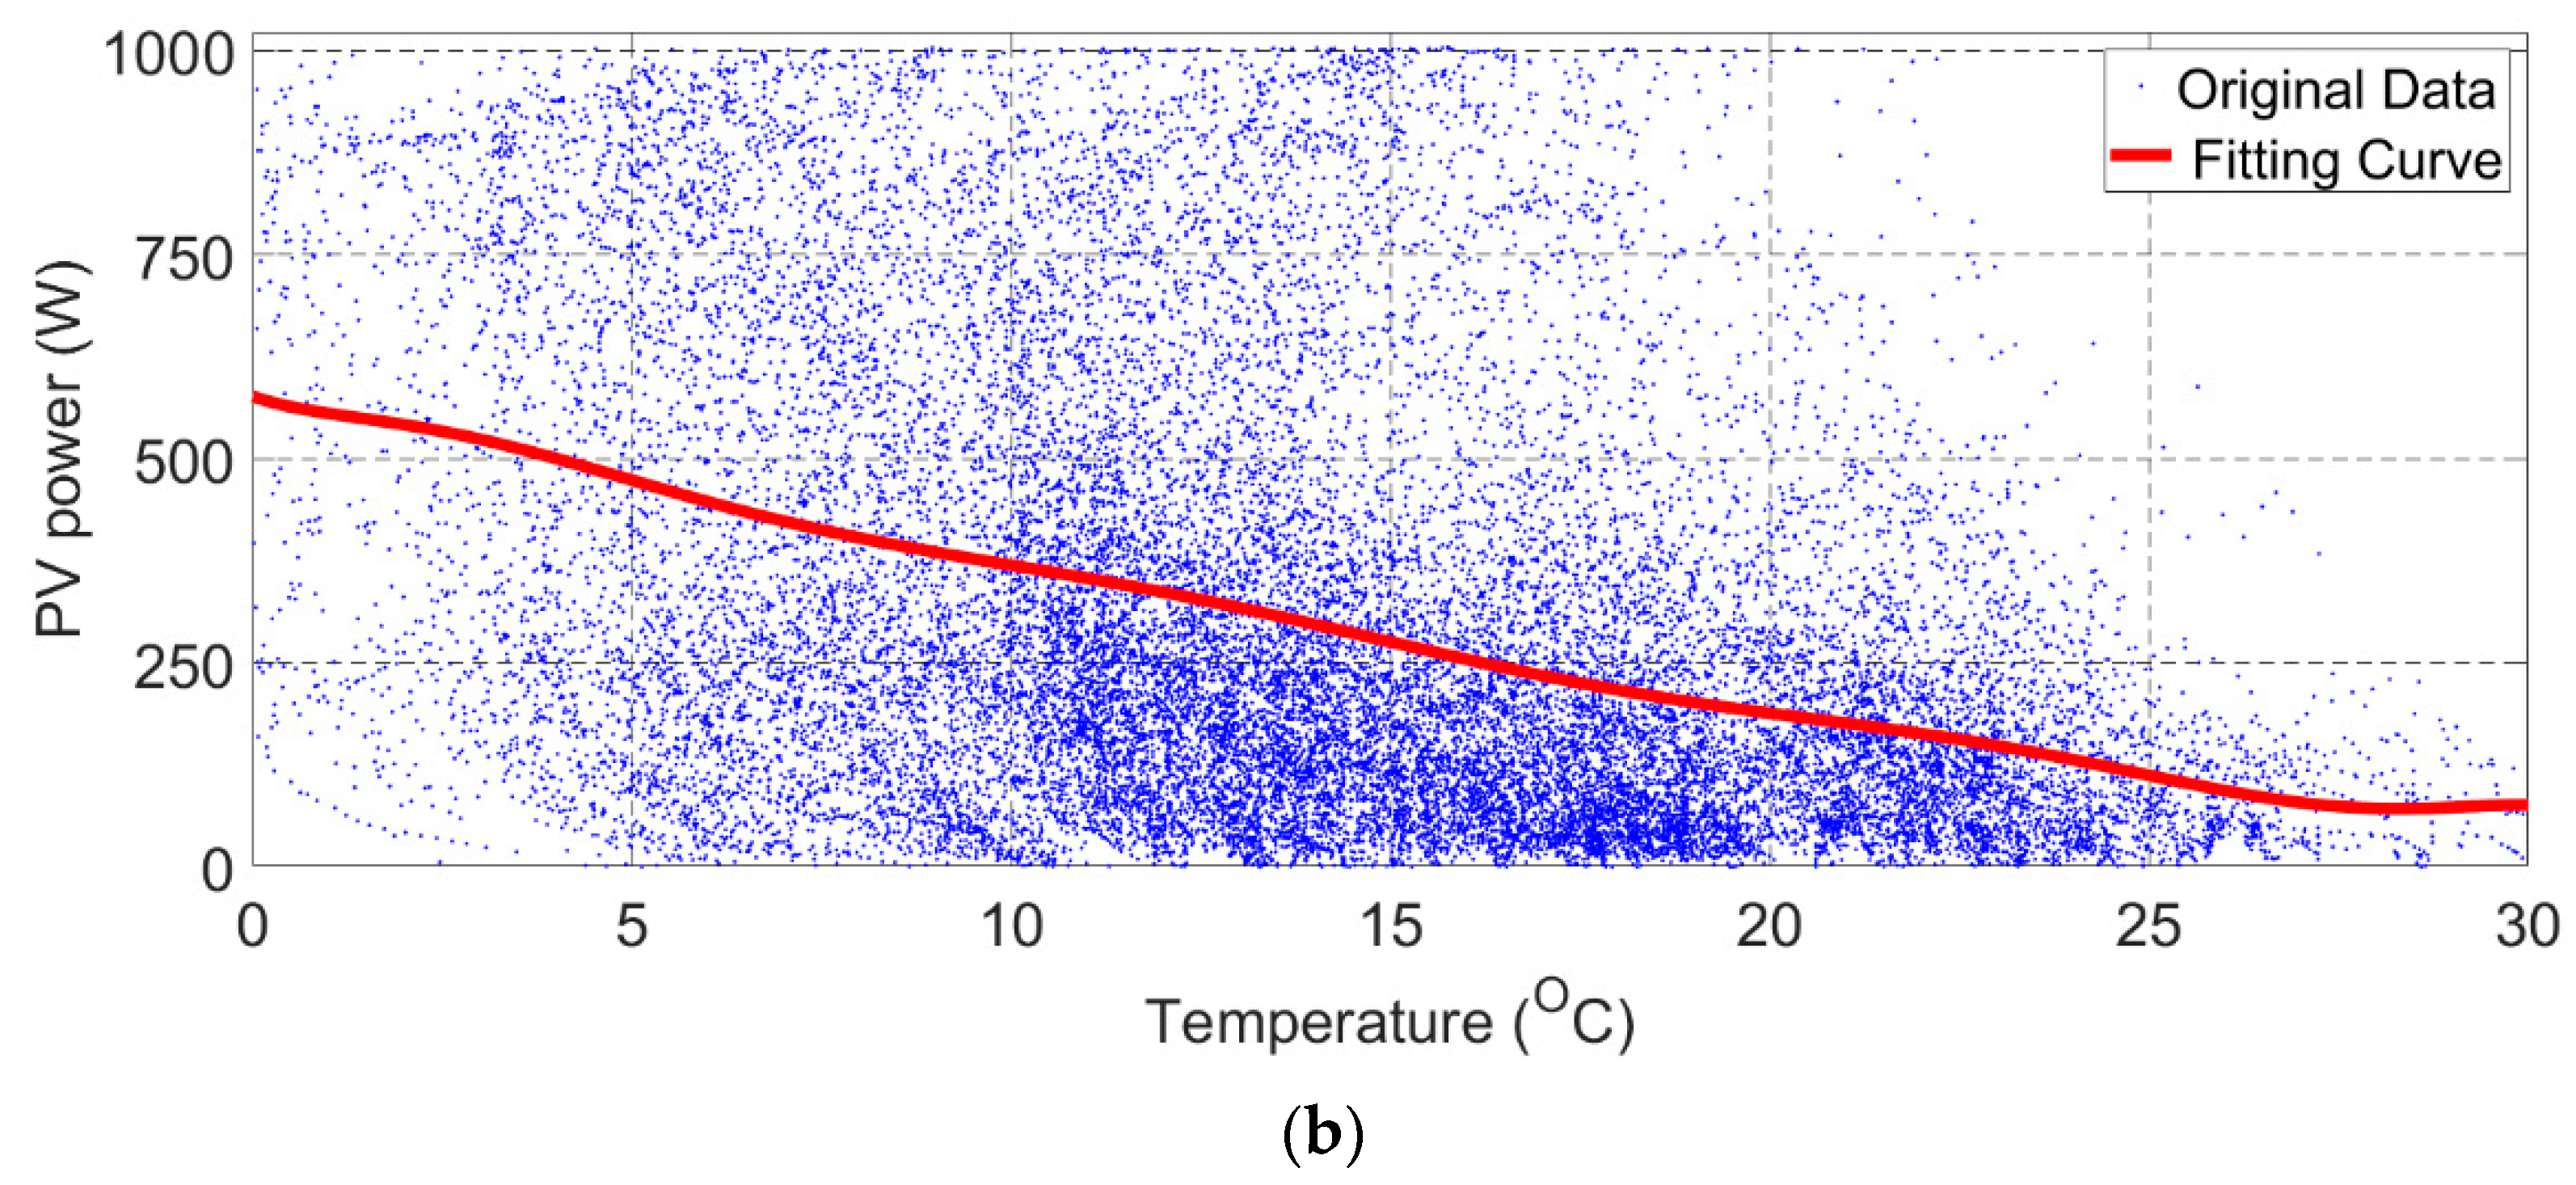
6. Curve Fitting Technique
7. Training of Proposed ANFIS Network
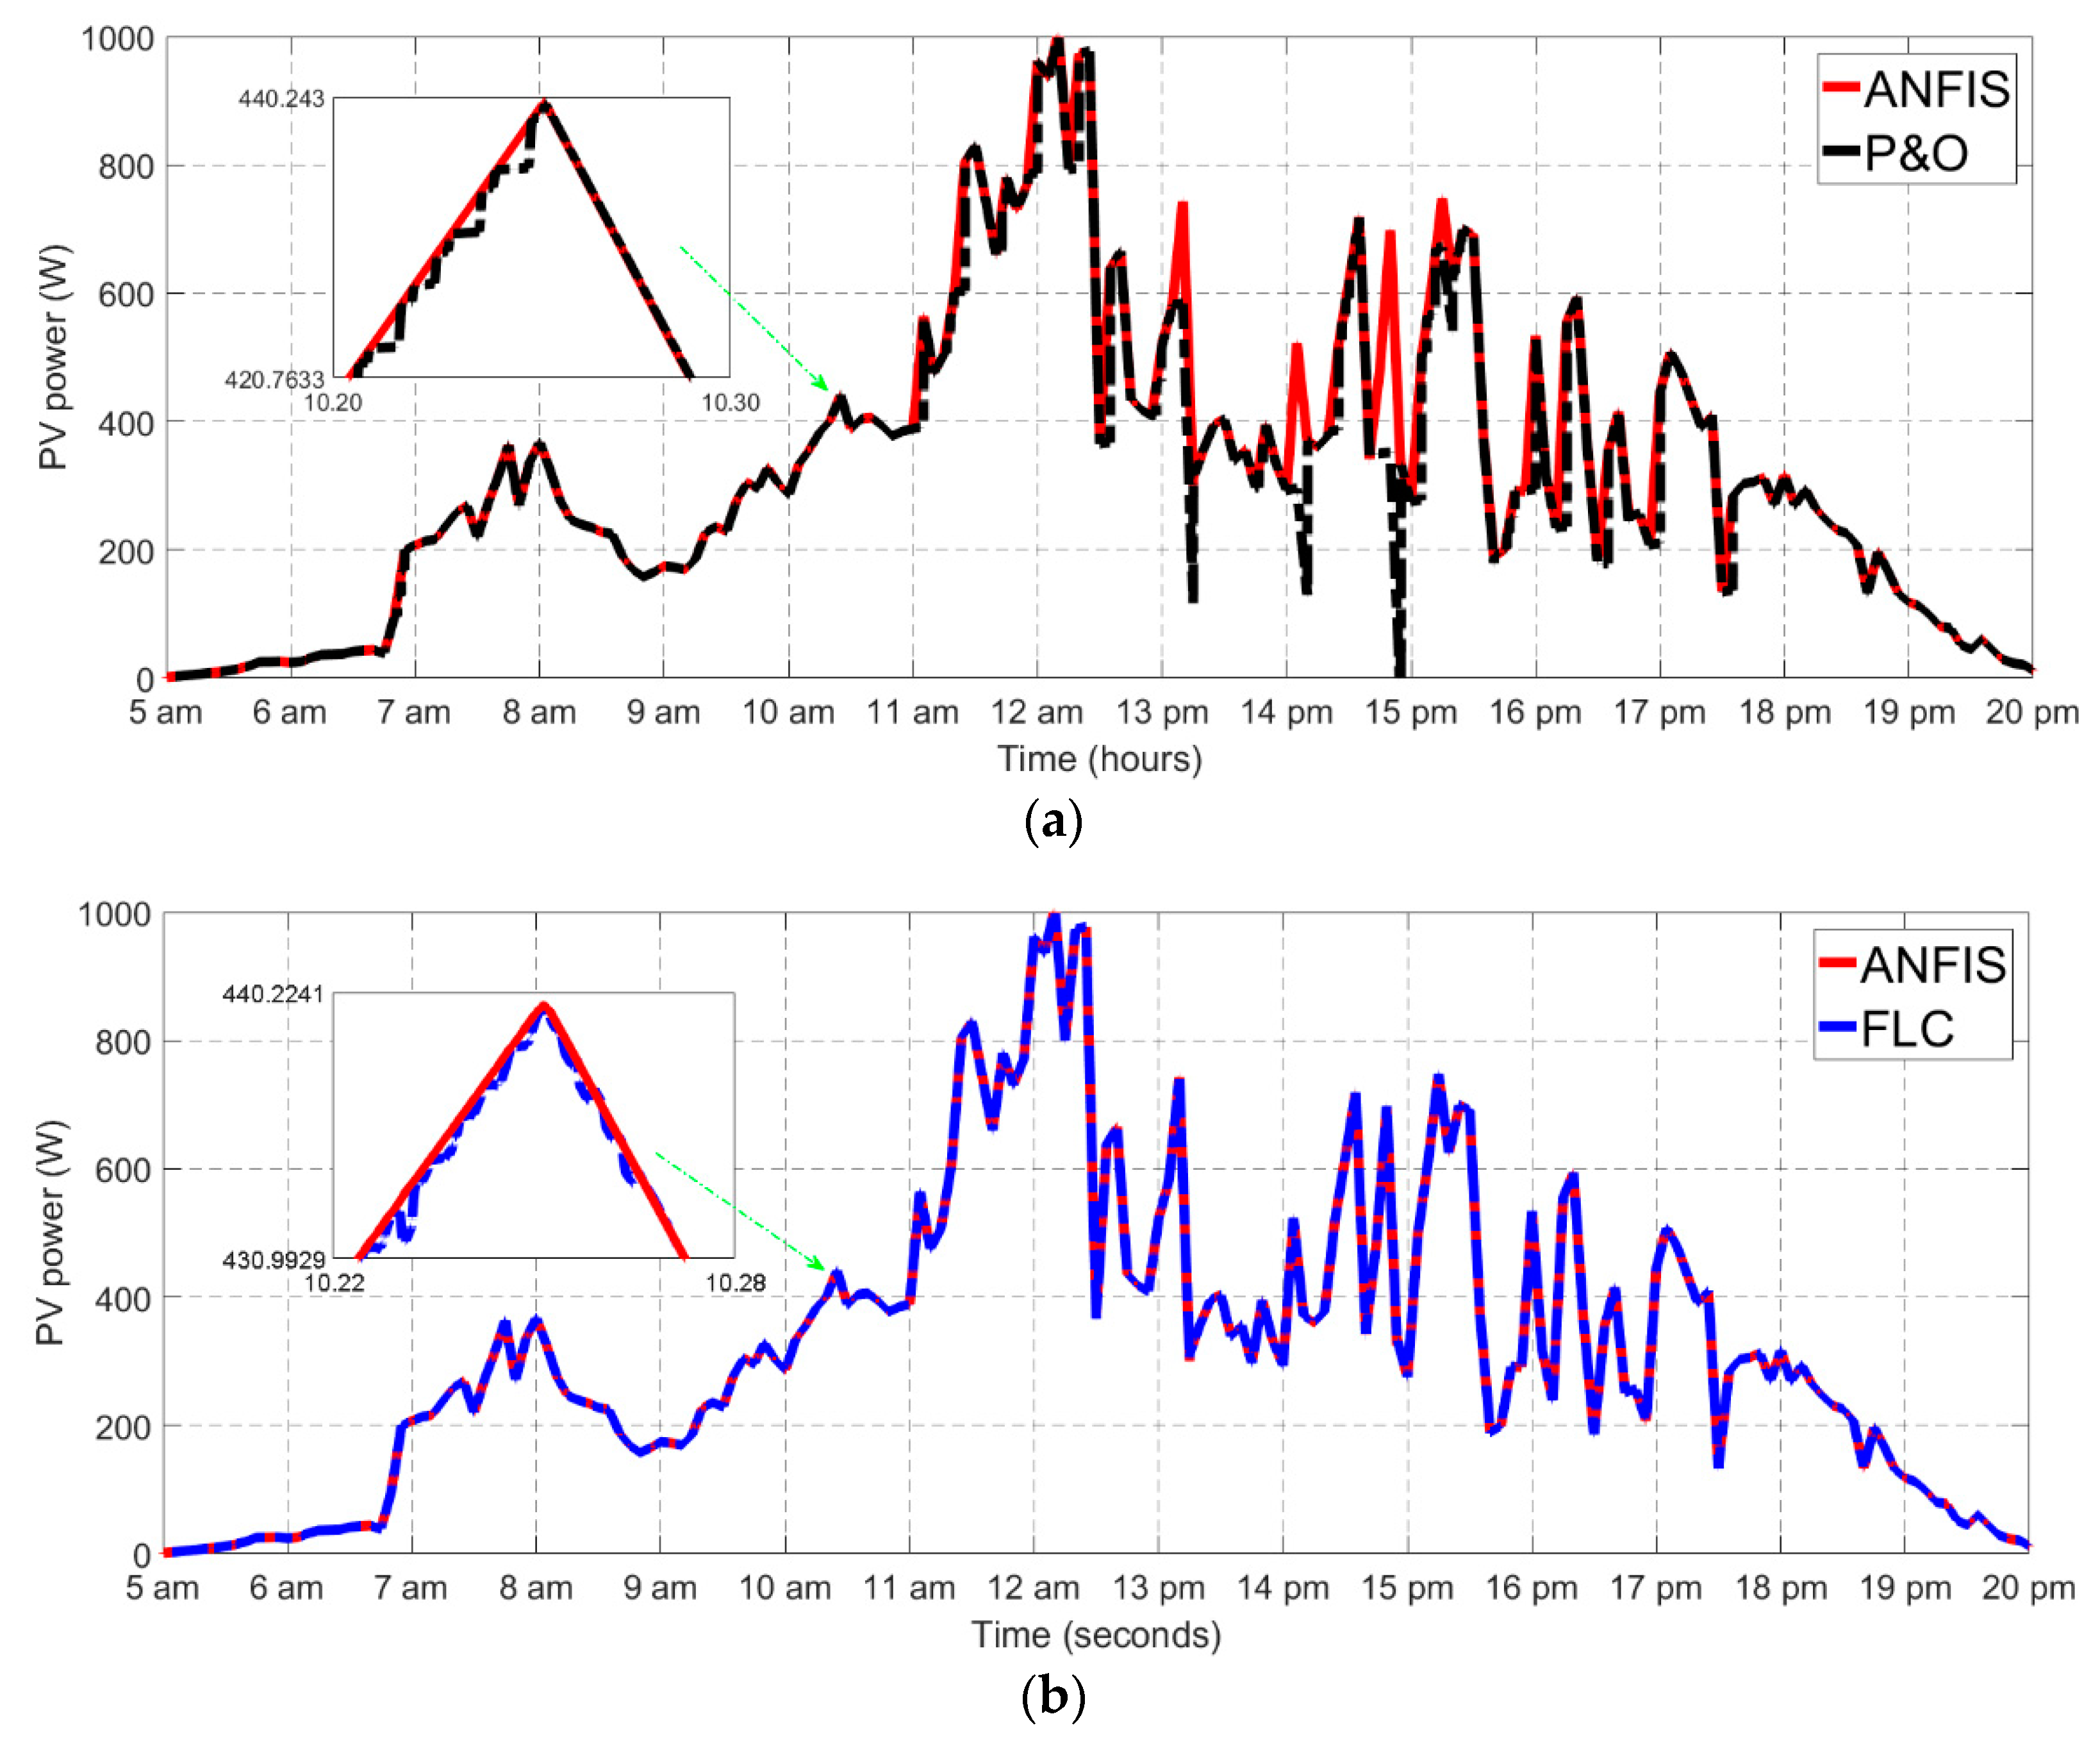
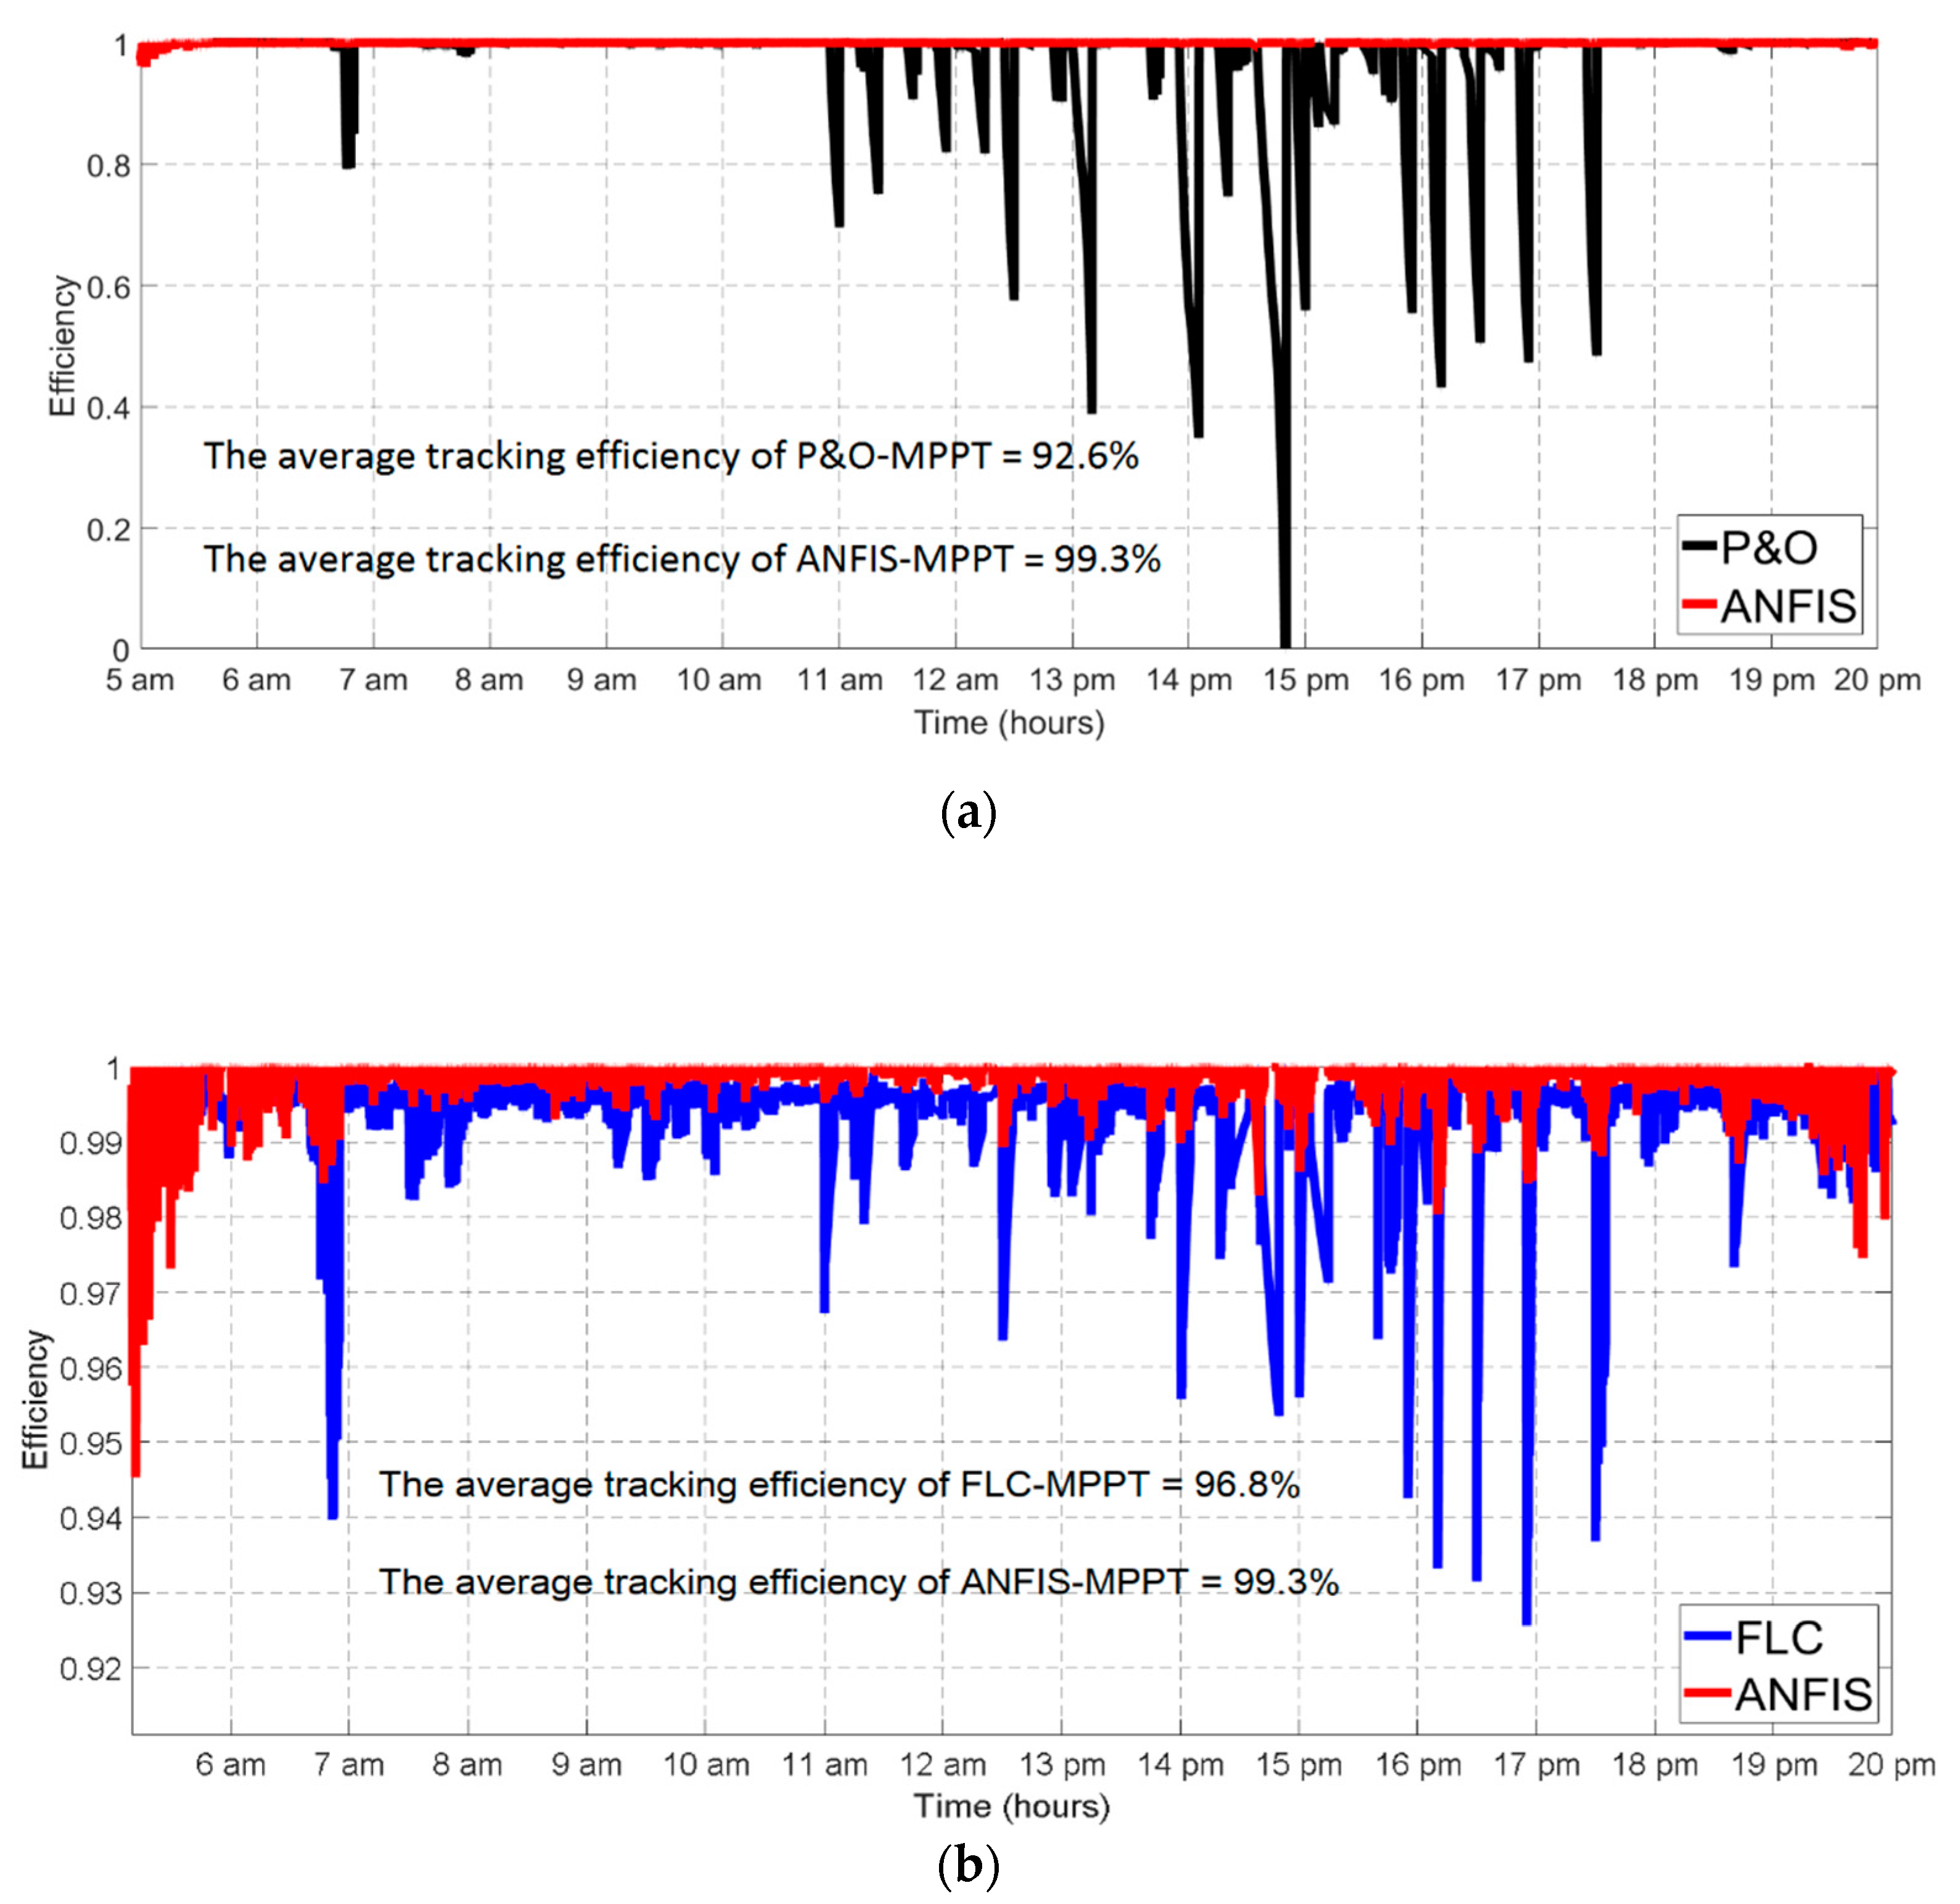
8. Results and Discussion
9. Real Measurement Test
10. Conclusion
Author Contributions
Funding
Acknowledgments
Conflicts of Interest
References
- Singh, G. Solar power generation by PV (photovoltaic) technology: A review. Energy 2013, 53, 1–13. [Google Scholar] [CrossRef]
- Al-Majidi, S.D.; Abbod, M.F.; Al-Raweshidy, H.S. A Modified P&O-MPPT based on Pythagorean Theorem and CV-MPPT for PV Systems. In Proceedings of the 2018 53rd International Universities Power Engineering Conference (UPEC), Glasgow, UK, 4–7 September 2018; pp. 1–6. [Google Scholar]
- Roman, E.; Alonso, R.; Ibañez, P.; Elorduizapatarietxe, S.; Goitia, D. Intelligent PV Module for Grid-Connected PV Systems. IEEE Trans. Ind. Electron. 2006, 53, 1066–1073. [Google Scholar] [CrossRef]
- Salam, Z.; Ahmed, J.; Merugu, B.S. The application of soft computing methods for MPPT of PV system: A technological and status review. Appl. Energy 2013, 107, 135–148. [Google Scholar] [CrossRef]
- Mohammed, S.S.; Devaraj, D.; Ahamed, T.I. A novel hybrid Maximum Power Point Tracking Technique using Perturb & Observe algorithm and Learning Automata for solar PV system. Energy 2016, 112, 1096–1106. [Google Scholar]
- Atkinson, D.J.; Elgendy, M.A.; Zahawi, B. Assessment of the Incremental Conductance Maximum Power Point Tracking Algorithm. IEEE Trans. Sustain. Energy 2013, 4, 108–117. [Google Scholar]
- Al-Majidi, S.D.; Abbod, M.F.; Al-Raweshidy, H.S. A novel maximum power point tracking technique based on fuzzy logic for photovoltaic systems. Int. J. Hydrogen Energy 2018, 43, 14158–14171. [Google Scholar] [CrossRef]
- Algarín, C.R.; Hernández, D.S.; Leal, D.R. A Low-Cost Maximum Power Point Tracking System Based on Neural Network Inverse Model Controller. Electronics 2018, 7, 4. [Google Scholar] [CrossRef]
- Enany, M.A.; Farahat, M.A.; Nasr, A. Modeling and evaluation of main maximum power point tracking algorithms for photovoltaics systems. Renew. Sustain. Energy Rev. 2016, 58, 1578–1586. [Google Scholar] [CrossRef]
- Ali, A.I.M.; Sayed, M.A.; Mohamed, E.E.M. Modified efficient perturb and observe maximum power point tracking technique for grid-tied PV system. Int. J. Electr. Power Energy Syst. 2018, 99, 192–202. [Google Scholar] [CrossRef]
- Wan, Y.; Mao, M.; Zhou, L.; Zhang, Q.; Xi, X.; Zheng, C. A Novel Nature-Inspired Maximum Power Point Tracking (MPPT) Controller Based on SSA-GWO Algorithm for Partially Shaded Photovoltaic Systems. Electronics 2019, 8, 680. [Google Scholar] [CrossRef]
- Ramos-Hernanz, J.; Lopez-Guede, J.M.; Barambones, O.; Zulueta, E.; Fernandez-Gamiz, U. Novel control algorithm for MPPT with Boost converters in photovoltaic systems. Int. J. Hydrogen Energy 2017, 42, 17831–17855. [Google Scholar] [CrossRef]
- Xiao, W.; Dunford, W.G. A modified adaptive hill climbing MPPT method for photovoltaic power systems. In Proceedings of the 2004 IEEE 35th Annual Power Electronics Specialists Conference (IEEE Cat. No.04CH37551), Aachen, Germany, 20–25 June 2004; pp. 1957–1963. [Google Scholar]
- Loukriz, A.; Haddadi, M.; Messalti, S. Simulation and experimental design of a new advanced variable step size Incremental Conductance MPPT algorithm for PV systems. ISA Trans. 2016, 62, 30–38. [Google Scholar] [CrossRef] [PubMed]
- Sivakumar, P.; Kader, A.A.; Kaliavaradhan, Y.; Arutchelvi, M. Analysis and enhancement of PV efficiency with incremental conductance MPPT technique under non-linear loading conditions. Renew. Energy 2015, 81, 543–550. [Google Scholar] [CrossRef]
- Ben Salah, C.; Ouali, M. Comparison of fuzzy logic and neural network in maximum power point tracker for PV systems. Electr. Power Syst. Res. 2011, 81, 43–50. [Google Scholar] [CrossRef]
- Wang, Y.; Yang, Y.; Fang, G.; Zhang, B.; Wen, H.; Tang, H.; Fu, L.; Chen, X. An Advanced Maximum Power Point Tracking Method for Photovoltaic Systems by Using Variable. Electronics 2018, 7, 355. [Google Scholar] [CrossRef]
- Soufi, Y.; Bechouat, M.; Kahla, S. Fuzzy-PSO controller design for maximum power point tracking in photovoltaic system. Int. J. Hydrogen Energy 2016, 42, 8680–8688. [Google Scholar] [CrossRef]
- Guenounou, O.; Dahhou, B.; Chabour, F. Adaptive fuzzy controller based MPPT for photovoltaic systems. Energy Convers. Manag. 2014, 78, 843–850. [Google Scholar] [CrossRef]
- Li, X.; Wen, H.; Hu, Y.; Jiang, L. A novel beta parameter based fuzzy-logic controller for photovoltaic MPPT application. Renew. Energy 2019, 130, 416–427. [Google Scholar] [CrossRef]
- Jiang, L.L.; Nayanasiri, D.; Maskell, D.L.; Vilathgamuwa, D.M. A hybrid maximum power point tracking for partially shaded photovoltaic systems in the tropics. Renew. Energy 2015, 76, 53–65. [Google Scholar] [CrossRef]
- Lasheen, M.; Abdel-salam, M. A novel hybrid Maximum Power Point Tracking Technique using Hill Climbing and ANFIS Techniques for PV Applications. Energy Convers. Manag. 2017, 171, 1–31. [Google Scholar]
- Farzaneh, J.; Keypour, R.; Karsaz, A. A novel fast maximum power point tracking for a PV system using hybrid PSO-ANFIS algorithm under partial shading conditions. Int. J. Ind. Electron. Control Optim. 2019, 2, 47–58. [Google Scholar]
- Muthuramalingam, M.; Manoharan, P. Comparative analysis of distributed MPPT controllers for partially shaded stand alone photovoltaic systems. Energy Convers. Manag. 2014, 86, 286–299. [Google Scholar] [CrossRef]
- Abido, M.A.; Khalid, M.S.; Worku, M.Y. An Efficient ANFIS-Based PI Controller for Maximum Power Point Tracking of PV Systems. Arab. J. Sci. Eng. 2015, 40, 2641–2651. [Google Scholar] [CrossRef]
- Kharb, R.K.; Shimi, S.; Chatterji, S.; Ansari, M.F. Modeling of solar PV module and maximum power point tracking using ANFIS. Renew. Sustain. Energy Rev. 2014, 33, 602–612. [Google Scholar] [CrossRef]
- Abu-Rub, H.; Iqbal, A.; Ahmed, S.M. Adaptive neuro-fuzzy inference system-based maximum power point tracking of solar PV modules for fast varying solar radiations. Int. J. Sustain. Energy 2012, 31, 383–398. [Google Scholar] [CrossRef]
- Abu-Rub, H.; Iqbal, A.; Ahmed, S.M.; Peng, F.Z.; Li, Y.; Baoming, G. Quasi-Z-Source Inverter-Based Photovoltaic Generation System with Maximum Power Tracking Control Using ANFIS. IEEE Trans. Sustain. Energy 2013, 4, 11–20. [Google Scholar] [CrossRef]
- Bin-halabi, A.; Abdennour, A.; Mashaly, H. An Accurate ANFIS-based MPPT for Solar PV System. Int. J. Adv. Comput. Res. 2014, 4, 588–595. [Google Scholar]
- Murdianto, F.D.; Penangsang, O.; Priyadi, A.; Dwi, M.F. Modeling and simulation of MPPT-bidirectional using adaptive neuro fuzzy inference system (ANFIS) in distributed energy generation system. In Proceedings of the 2015 International Seminar on Intelligent Technology and Its Applications (ISITIA), Surabaya, Indonesia, 20–21 May 2015; pp. 207–212. [Google Scholar]
- Aldair, A.A.; Obed, A.A.; Halihal, A.F. Design and implementation of ANFIS-reference model controller based MPPT using FPGA for photovoltaic system. Renew. Sustain. Energy Rev. 2017, 82, 2202–2217. [Google Scholar] [CrossRef]
- Mayssa, F.; Sbita, L. Advanced ANFIS-MPPT control algorithm for sunshine photovoltaic pumping systems. In Proceedings of the 2012 First International Conference on Renewable Energies and Vehicular Technology, Hammamet, Tunisia, 26–28 March 2012; pp. 167–172. [Google Scholar]
- Tarek, B.; Said, D.; Benbouzid, M. Maximum Power Point Tracking Control for Photovoltaic System Using Adaptive Neuro-Fuzzy “ANFIS”. In Proceedings of the 2013 Eighth International Conference and Exhibition on Ecological Vehicles and Renewable Energies (EVER), Monte Carlo, Monaco, 27–30 March 2013; pp. 1–7. [Google Scholar]
- Ounnas, D.; Ramdani, M.; Chenikher, S.; Bouktir, T. An Efficient Maximum Power Point Tracking Controller for Photovoltaic Systems Using Takagi–Sugeno Fuzzy Models. Arab. J. Sci. Eng. 2017, 62, 4971–4982. [Google Scholar] [CrossRef]
- Khosrojerdi, F.; Taheri, S.; Crétu, A.-M. An adaptive neuro-fuzzy inference system-based MPPT controller for photovoltaic arrays. In Proceedings of the 2016 IEEE Electrical Power and Energy Conference (EPEC), Ottawa, ON, Canada, 12–14 October 2016. [Google Scholar]
- Chaouachi, A.; Kamel, R.M.; Nagasaka, K. A novel multi-model neuro-fuzzy-based MPPT for three-phase grid-connected photovoltaic system. Sol. Energy 2010, 84, 2219–2229. [Google Scholar] [CrossRef]
- Kadri, R.; Andrei, H.; Gaubert, J.-P.; Ivanovici, T.; Champenois, G.; Andrei, P. Modeling of the photovoltaic cell circuit parameters for optimum connection model and real-time emulator with partial shadow conditions. Energy 2012, 42, 57–67. [Google Scholar] [CrossRef]
- Hiyama, T.; Kitabayashi, K. Neural Network Based Estimation of Maximum Power Generation from PV Module Using Environmental Information Takashi Hiyama. IEEE Trans. Energy Convers. 1997, 12, 241–247. [Google Scholar] [CrossRef]
- Ahmed, J.; Salam, Z. A Modified P&O Maximum Power Point Tracking Method with Reduced Steady State Oscillation and Improved Tracking Efficiency. IEEE Trans. Sustain. Energy 2016, 7, 1. [Google Scholar]


| Parameters | Value |
|---|---|
| Cell number | 48 |
| Dimensions | 1.318 × 994 × 46 mm |
| Nominal power | 185 W |
| Open circuit voltage | 30.2 V |
| Maximum power voltage | 24 V |
| short circuit current | 8.54 A |
| Maximum power current | 7.71 A |
| Temperature Coefficient (Pmax) | −0.485%/°C |
| Temperature Coefficient (Isc) | +0.053%/°C |
| Temperature Coefficient (Voc) | −104 mV/°C |
| Model | Training Time | Number of Epochs | Error (%) |
|---|---|---|---|
| Optimized data | Very short | 50 | 8 |
| Total data | Too long | 980 | 14 |
| Purpose | Function | Error |
|---|---|---|
| Triangular mf. | trimf | 0.0708 |
| Trapezoidal mf. | trapmf | 0.1085 |
| Generalized bell curve mf. | gbellmf | 0.0787 |
| Gaussian curve mf. | gaussmf | 0.0766 |
| Two-sided Gaussian curve mf. | gauss2mf | 0.0894 |
| PI-shaped curve mf. | pimf | 0.1215 |
| Difference of two sigmoid mf. | dsigmf | 0.0808 |
| Product of two sigmoid mf. | psigmf | 0.0819 |
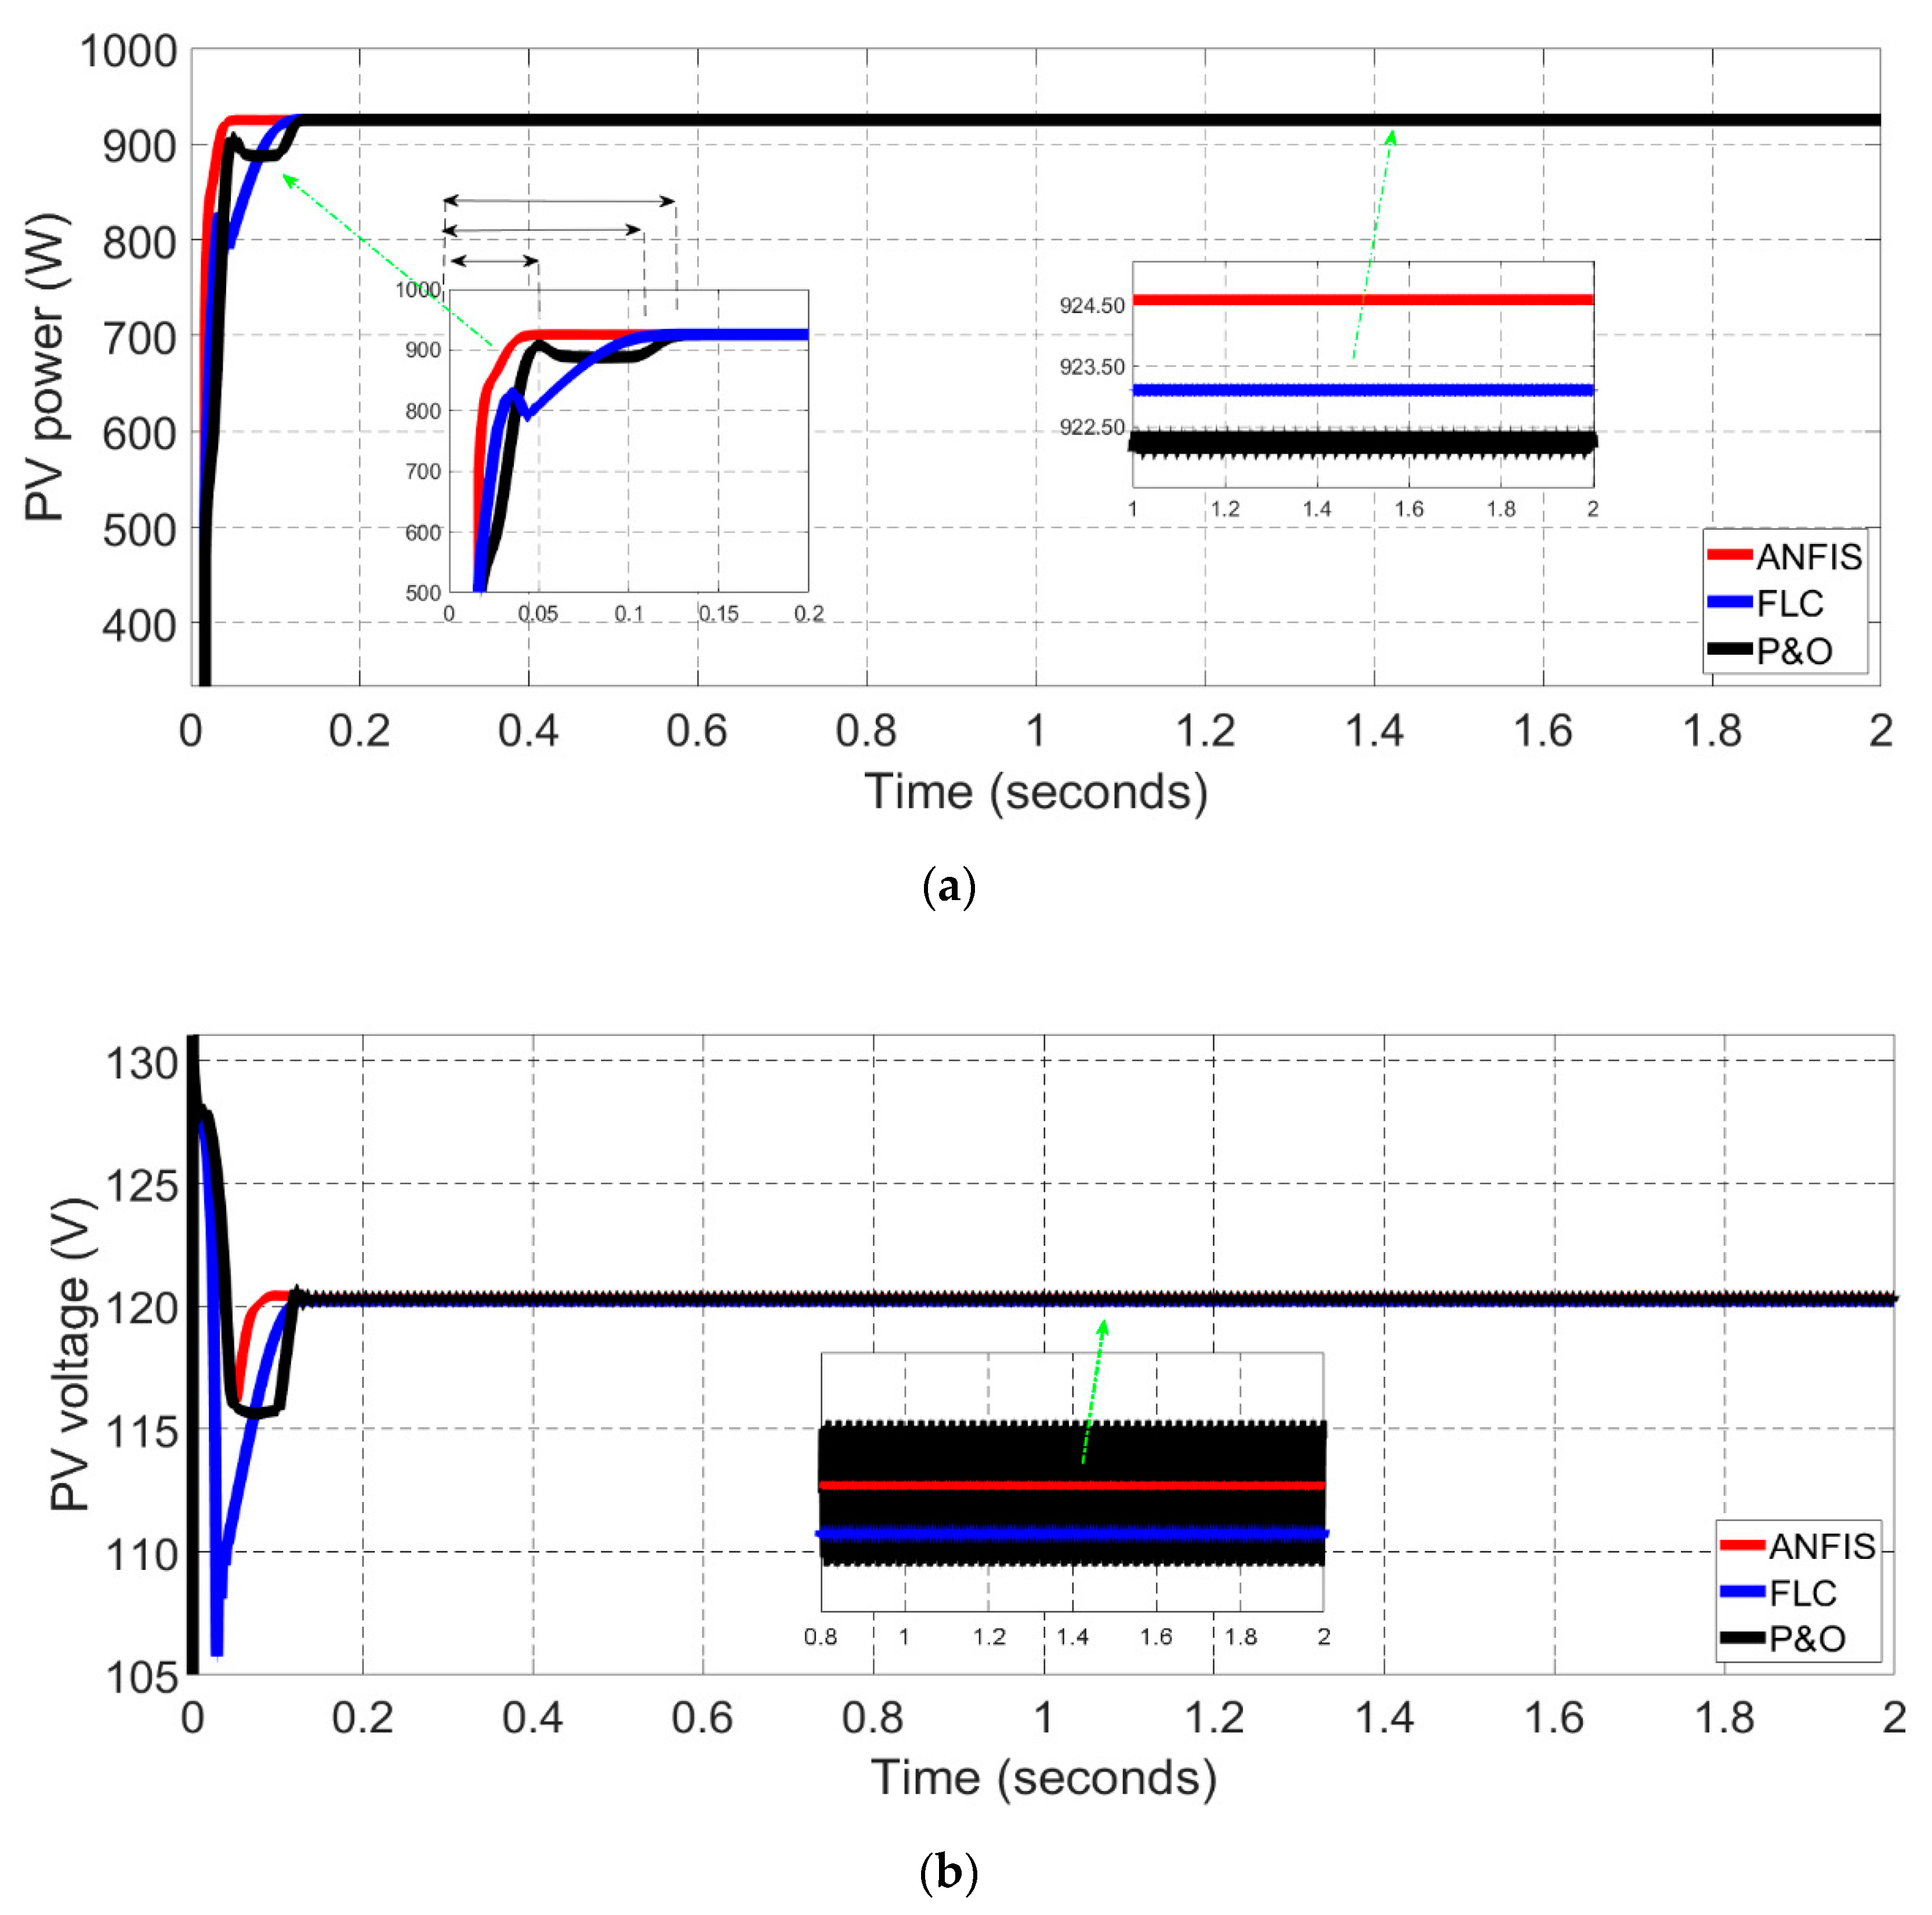
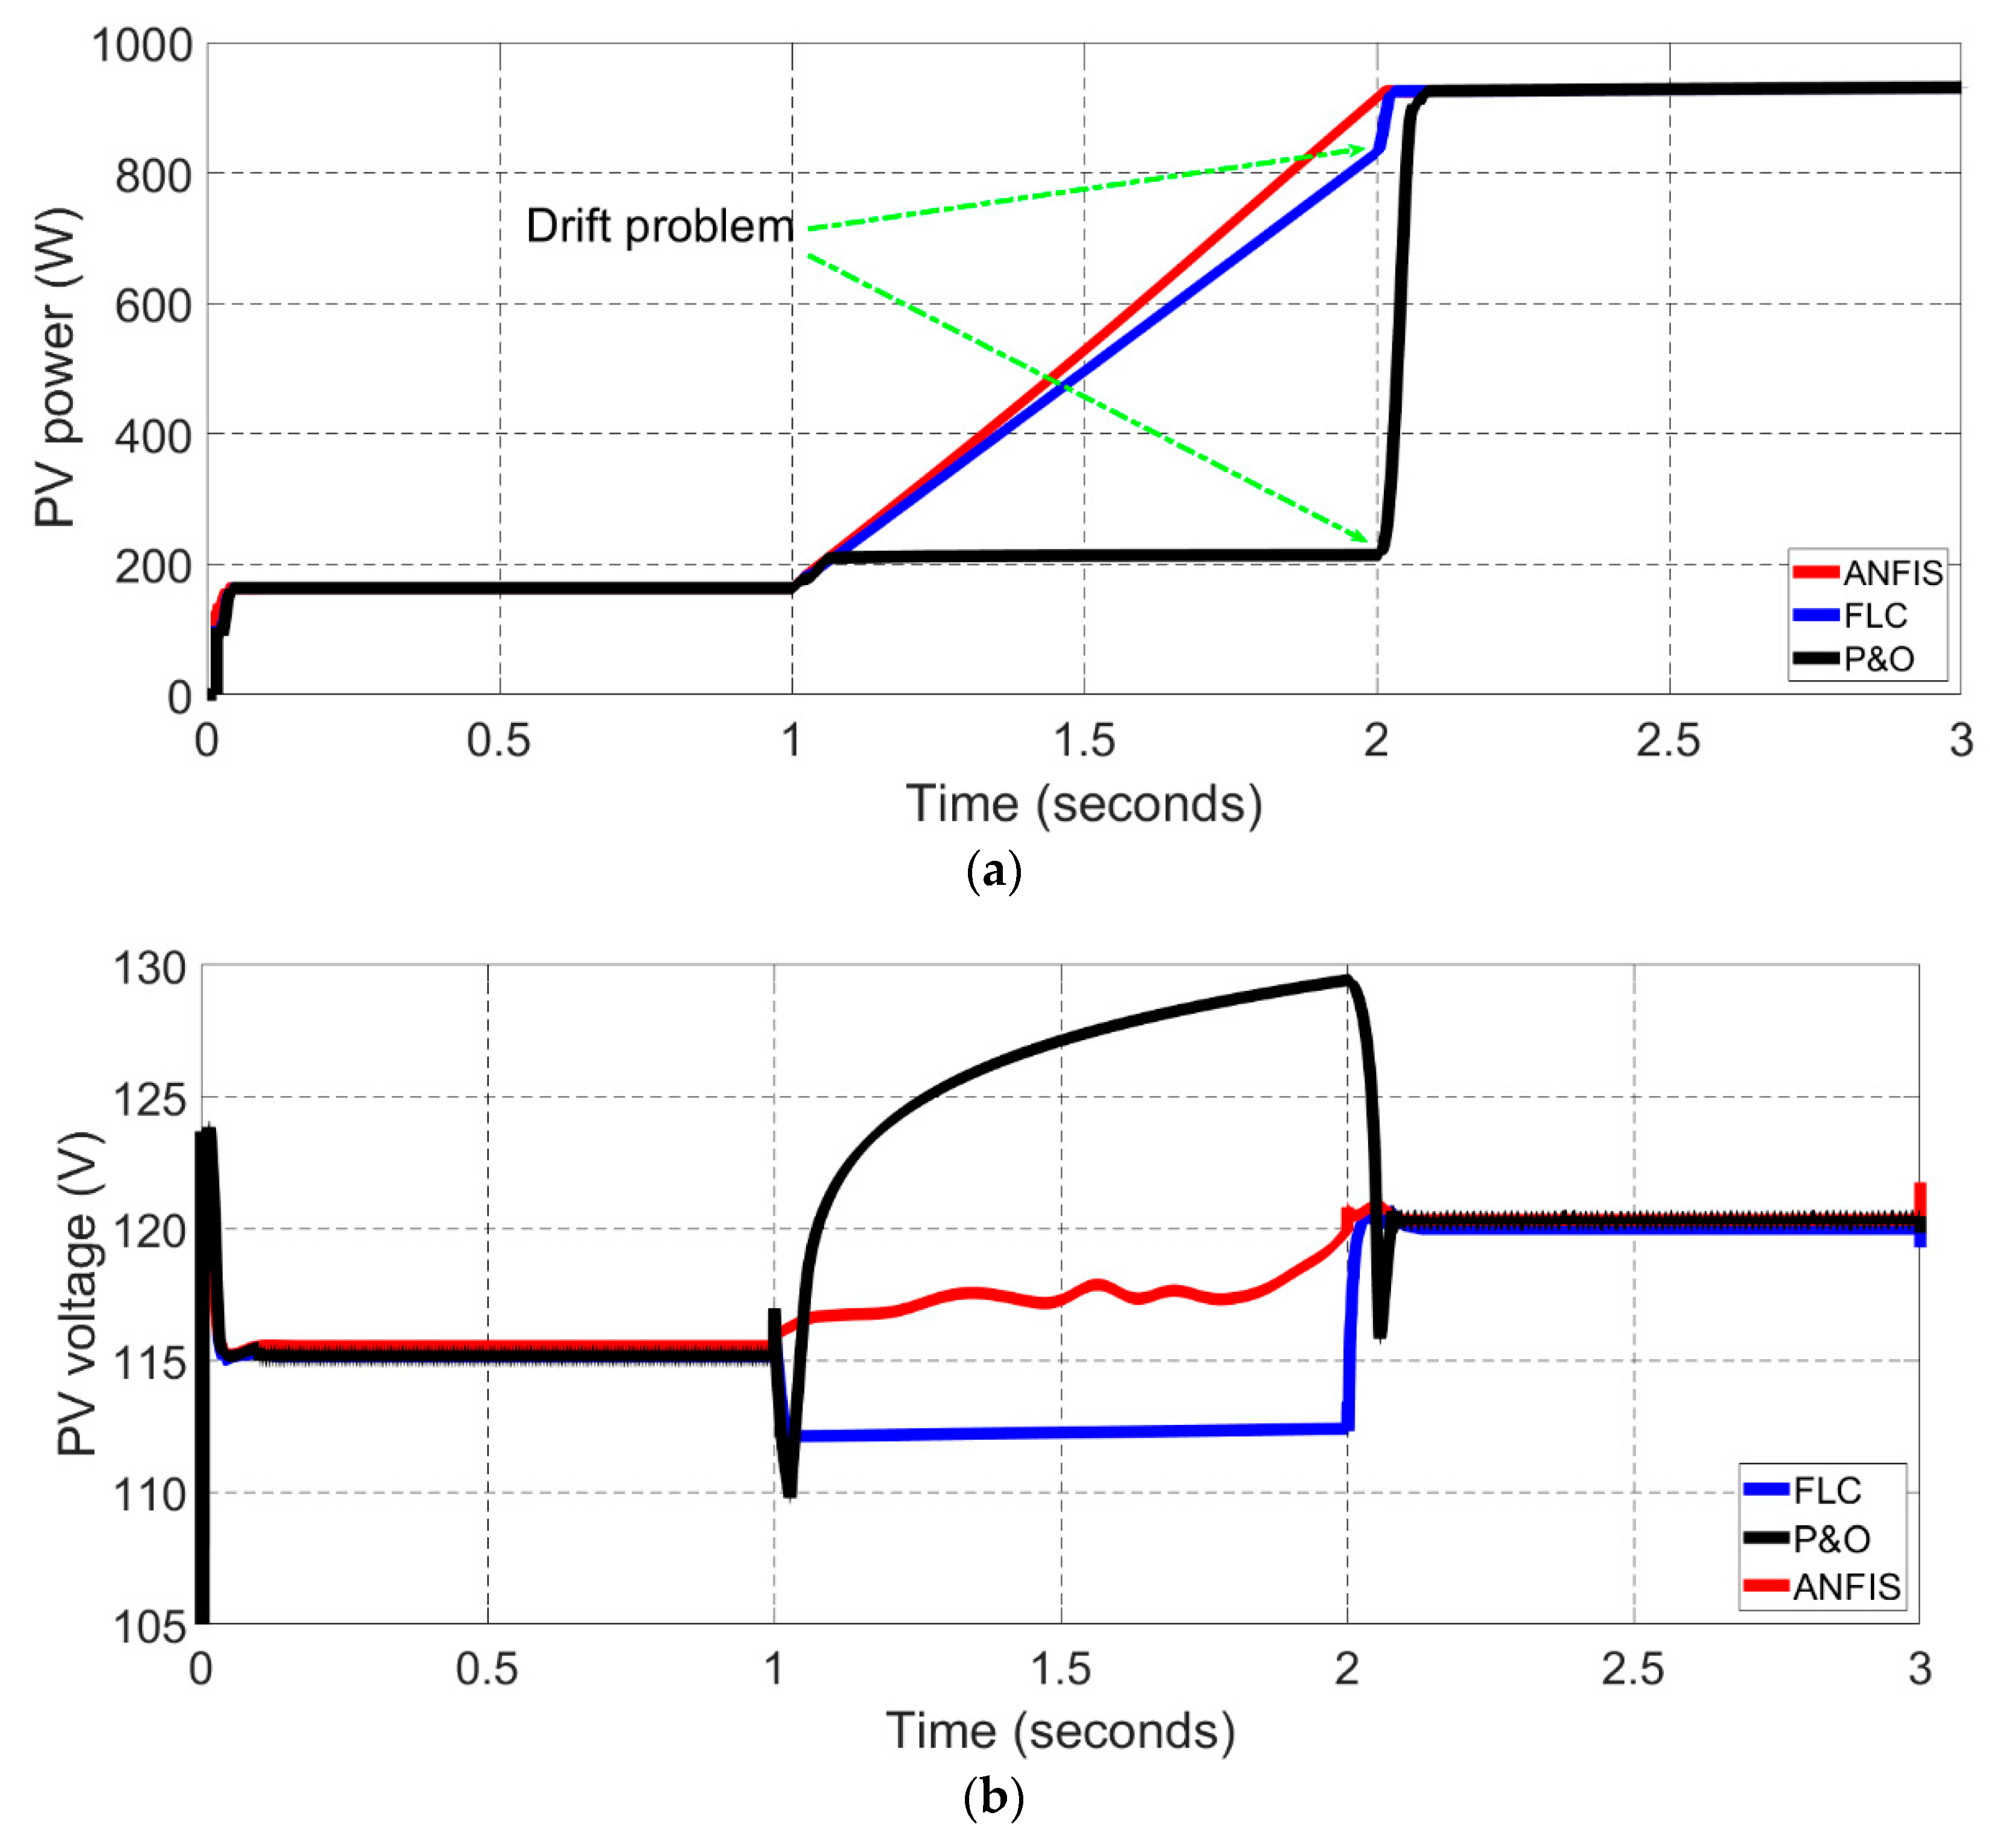
| MPPT | Converging Time (s) | Oscillation | Drift Problem | Output Power (W) |
|---|---|---|---|---|
| ANFIS-MPPT | 0.07 | low | avoidance | 924.50 |
| FLC-MPPT | 0.11 | medium | suffering | 923.25 |
| P&O-MPPT | 0.13 | High | suffering | 922.50 |
© 2019 by the authors. Licensee MDPI, Basel, Switzerland. This article is an open access article distributed under the terms and conditions of the Creative Commons Attribution (CC BY) license (http://creativecommons.org/licenses/by/4.0/).
Share and Cite
Al-Majidi, S.D.; Abbod, M.F.; Al-Raweshidy, H.S. Design of an Efficient Maximum Power Point Tracker Based on ANFIS Using an Experimental Photovoltaic System Data. Electronics 2019, 8, 858. https://doi.org/10.3390/electronics8080858
Al-Majidi SD, Abbod MF, Al-Raweshidy HS. Design of an Efficient Maximum Power Point Tracker Based on ANFIS Using an Experimental Photovoltaic System Data. Electronics. 2019; 8(8):858. https://doi.org/10.3390/electronics8080858
Chicago/Turabian StyleAl-Majidi, Sadeq D., Maysam F. Abbod, and Hamed S. Al-Raweshidy. 2019. "Design of an Efficient Maximum Power Point Tracker Based on ANFIS Using an Experimental Photovoltaic System Data" Electronics 8, no. 8: 858. https://doi.org/10.3390/electronics8080858
APA StyleAl-Majidi, S. D., Abbod, M. F., & Al-Raweshidy, H. S. (2019). Design of an Efficient Maximum Power Point Tracker Based on ANFIS Using an Experimental Photovoltaic System Data. Electronics, 8(8), 858. https://doi.org/10.3390/electronics8080858