Abstract
This letter analyzes the meta-distribution of the transmission success probability (TSP) for vehicular networks based on a one-dimensional Poisson point process (PPP). We also propose a method to maximize the throughput across the vehicular network. Compared to the conventional spatial average performance assessment, the meta-distribution reveals the fraction of vehicles that operate at a target success rate of transmission across the highway. To this end, we propose a per-vehicle rate selection scheme to keep a target quality of service (QoS) level for all vehicles. The results reveal that operating at the spatially-averaged maximum throughput may lead to excessive variation in the performance of individual vehicles. However, with the proposed meta-distribution-aware rate selection scheme, the throughput variation among the vehicles can be significantly reduced (e.g., up to a reduction).
1. Introduction
Vehicular communication is among the main issues for the imminent era of intelligent transportation systems (e.g., autonomous vehicles). Vehicular communications allow the exchange of real-time information between vehicles, which can improve road safety, reduce traffic congestion, and enable autonomous or cooperative driving. For instance, vehicular communications can be utilized to mitigate/eliminate human errors that are responsible for over of road accidents leading to million fatalities worldwide [1,2]. In particular, safety information can be utilized either to mitigate human errors via drive-assist applications (this may include left turn assist (LTA), lane change warning (LCW), intersection management assist (IMA), etc. [3]) or to eliminate human errors via autonomous driving. According to the Society of Automotive Engineers (SAE) standard, onboard safety applications mostly rely on the broadcast of two message types: periodic and event-driven messages [4]. First, the periodic messages are utilized to carry information about the vehicle (e.g., speed, heading, acceleration, brake level, and position). SAE defines such periodic messages as basic safety messages (BSMs), which should be exchanged among vehicles at a regular pace. Second, the event-triggered messages are occasionally generated based on safety conditions, mechanical issues, or road hazards. For both message categories, it is crucial to maintain a high level of communication reliability across the vehicular network.
The current vehicular communication standard (i.e., IEEE802.11p) coordinates the wireless channel access via the well-known carrier sense multiple access (CSMA) protocol. CSMA, however, has certain limitations such as it cannot support highly-dense networks where the channel interference is very high. In addition, CSMA does not provide reliable broadcast services. These issues motivate the research community to propose alternative channel access protocols. Some of these proposals utilize the time division multiple access (TDMA) via allocating different time slots to neighboring vehicles and, hence, reducing collision possibilities [5,6]. Other research work aimed at enhancing the performance of IEEE802.11p by reducing the channel interference through controlling some transmission parameters (e.g., transmission interval, transmission power, and transmission rate) [7,8,9]. For instance, the European Telecommunication Standards Institute (ETSI) standardized the decentralized congestion control (DCC) mechanism that adapts such transmission parameters based on the estimated channel congestion level [9].
Another example is the linear message rate congestion control (LIMERIC) algorithm, which is designed to control the channel congestion via changing the transmission rate of safety messages [10].
Based on IEEE802.11p, this paper aims at selecting the optimal transmission rate that reduces the aggregated interference and, hence, maximizes the throughput across the entire network. In particular, we first analyze the transmission success probability (TSP) and its distribution across the network. We then formulate the average throughput using the obtained TSP. We finally solve an optimization problem to maximize the throughput by choosing the optimal transmission rate.
The remainder of this paper is organized as follows. Section 2 discusses related work, while Section 3 explains the system model along with the assumptions. TSP analysis and throughput optimization are presented in Section 4. In Section 5, the numerical and simulation results are discussed, while the conclusion and future work are given in Section 6.
2. Related Work
Due to the scarcity of the radio resources, utilizing spatial frequency reuse is essential to provide wireless access to every vehicle in the network. However, spatial frequency reuse induces mutual interference between vehicles, which may deteriorate communication reliability. In this context, a mathematical framework based on stochastic geometry is often adopted to assess the link performance of large-scale communication networks that are subject to mutual interference imposed by surrounding nodes [11,12]. Recently, such frameworks have been applied to vehicular networks. For instance, the authors in [13] studied the packet decoding rate and success rate of transmissions for vehicle-to-vehicle (V2V) networks based on the ALOHA Poisson point process (PPP). The author in [14] derived the reception probability and the mean throughput for ALOHA-based linear vehicular networks. It was shown that the average throughput could be maximized by optimizing the transmission range. The authors in [15] analyzed how the power control and packet routing strategies affect the interference distribution in wireless ad hoc networks. In [16], the authors analyzed the performance of multi-hop transmissions in a multi-lane highway vehicular network in terms of the aggregate packet progress. The work of [17] characterized the probability of successful packet transmissions in the intersection of two perpendicular roads. The authors considered the effect of the interference caused by the dense cluster of vehicles at the intersection. In [18], the authors utilized queuing theory and stochastic geometry to characterize the performance of the IEEE802.11p protocol, which is widely adopted by commercial vehicular communication systems. The authors in [19] derived the uplink and downlink connectivity probabilities between vehicles and base stations (BSs) through multi-hop paths. The authors utilized the Poisson distribution to analyze the impact of the number of hops, transmission power, and BS densities on performance. Modeling the randomness of the roads beside the locations of vehicles was addressed in [20]. Based on a doubly-stochastic PPP, the authors derived an exact expression for the coverage probability. In [21], the authors proposed two benchmark resource allocation algorithms for LTE-V2V networks. The authors analyzed the packet reception probability for the proposed algorithms over a highway scenario modeled as a one-dimensional PPP. The authors in [22] proposed a framework that models cellular networks in addition to vehicles on the roads using two independent Poisson processes. The authors provided the coverage probability of all possible transmissions (e.g., vehicle-to-vehicle, vehicle-to-BS, and BS-to-vehicle). In [23], the authors analyzed the successful transmission probability of periodic and nonperiodic messages for LTE-V2V networks. The authors employed a geolocation-based access technique where they modeled the location of vehicles using a Matern hard core point process (HCPP). The authors in [24] characterized the coverage probability of urban mmWave vehicular networks where the urban streets were modeled by the Manhattan Poisson line process. However, the models in [13,14,15,16,17,18,19,20,21,22,23,24] focused on the spatially-averaged performance, which may hide significant discrepancies among vehicles’ performance. To guarantee a network-wide performance for vehicles, a meta-distribution-based approach is required to capture the percentile-based performance (e.g., success probability) across the network [25]. In this paper, we study the meta-distribution of the transmission success probability (TSP) for vehicular networks and show how some network parameters like transmission activity affect the TSP percentiles. We also solve an optimization problem to maximize the throughput across the network and show how the adaptation of the transmission rate can decrease discrepancies among vehicles’ throughput. The simulation results show that operating at the maximum value of spatially-averaged throughput may lead to significant discrepancies in throughput across the network. Interestingly, a slight deviation (as little as ) from the maximum value of spatially-averaged throughput offers a substantial reduction of up to in the throughput variance among the vehicles across the network.
3. System Model
We considered a multi-lane highway scenario in which the locations of vehicles on traffic lane l were modeled as an independent PPP with intensity vehicles/km. Since the transmission range was much larger than the road width, we could safely approximate the multi-lane environment as a single-line abstraction (SLA) model [26], where all lanes are merged together into a single line (see Figure 1). Hence, we modeled the network as a 1D homogeneous PPP with the aggregate traffic intensity vehicles/km. The complete set of vehicles was independently split into transmitting and receiving nodes with probabilities and , respectively. While V2V communications followed the IEEE802.11p standard, it was shown that the CSMA protocol of IEEE802.11p exhibited operations like ALOHA in the high-density scenarios [13,18]. For the sake of simplicity of analysis, therefore, we assumed that ALOHA was the underlying MAC protocol for V2V communications. In this paper, the analysis was focused on V2V topology, the most widely-adopted type among vehicular network typologies. In other words, we assumed that each transmitting vehicle independently broadcast a safety message with probability p (hereafter, the term “transmission activity” is used to refer to p) and transmission power . It is required that each receiving vehicle correctly decodes the safety message declared by its nearest transmitting vehicle. We employed the standard power-law as the path-loss propagation model that is expressed by Frii’s formula where x is the distance between the transmitter and receiver, y is the signal wavelength, and is the path-loss exponent. The channel fading was assumed to follow a Rayleigh distribution with a unit mean power gain. Channel gains were assumed to be independent and identically distributed (IID) random variables. An interference-limited scenario was assumed, and hence, thermal noise was neglected. We also ignored the mobility effects since the transmission rate was much higher than the speed of the vehicles [27]. Furthermore, on highways, the relative velocity is quite small, and hence, we assumed a fixed topology for a sufficiently long time period.
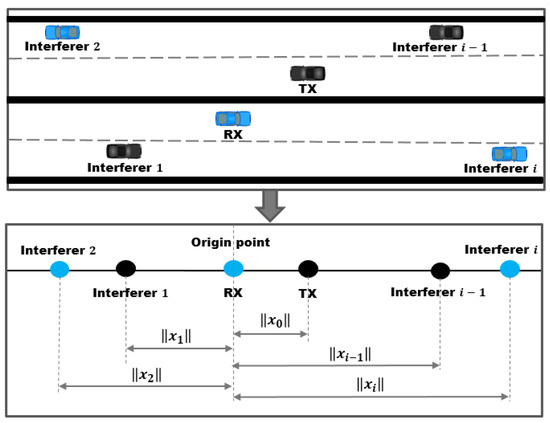
Figure 1.
A representation of the one-dimensional PPP vehicular network.
4. Analysis
In this section, by conditioning on an arbitrary realization of , we characterize the meta-distribution for the TSP across the vehicles in via the moments of the TSP . Without loss of generality, consider a test receiver located at the origin point ∘. The distance from the receiver to the nearest transmitter is represented by such that denotes the Euclidean norm. Then, the conditional TSP of a test link can be expressed by (1).
Here, SIR is the signal-to-interference-ratio at the intended receiver, whereas and , respectively, represent the power fading gains over the intended channel and the interfering channel, while denotes the interfering vehicle activity, and is the set of distances from interfering vehicles to the origin. Figure 1 shows an example of a highway vehicular network represented as a one-dimensional PPP and provides a graphical representation of our system model.
Similar to ([25] Appendix A), in (1) was obtained by averaging over fading and transmission activity only. Although the realization was fixed, varied from one link to another across the highway. To analyze the distribution of such variation, the meta-distribution for TSP was introduced in [25], which is given by (2).
Theorem 1.
The moment of the conditional TSP for PPP vehicular networks is:
Proof.
From defined in (1), the moment can be expressed as follows:
where is obtained by conditioning on , then applying the probability generating functional of the PPP. We obtained by de-conditioning on R using the 1D nearest neighbor distribution, which is given by , . The expression in (3) was then obtained by a change of variables , followed by some mathematical manipulations. □
Since the expression in (3) tended to one solvable integral, the moments could be obtained in a closed form. Following ([25] Corollary 3), the exact meta-distribution could be expressed via the imaginary moments and Gil-Pelaez theorem [28], which is given by (4).
Here, denotes the imaginary part of a complex number; was obtained by replacing in (3); and j denotes the imaginary unit.
To alleviate the complexity of the integral in (4), the meta-distribution could be approximated via the beta distribution [25], which is expressed by (5).
Here, is the regularized incomplete beta function.
Throughput Optimization
Assuming a fixed transmission rate of , a packet can only be decoded at the intended receiver if . Hence, the throughput was expressed as . In this section, we analyze the impact of the parameter on the spatially-averaged throughput and its variation across all the links. The optimal that maximized the mean throughput was first derived. Then, the variance of throughput could be obtained via Theorem 1.
The optimization problem for determining the maximum spatially-averaged throughput could be formulated as in (6).
Here, is the first moment of the TSP, which was obtained by substituting in (3). The optimal value of that maximized was obtained by solving (7).
Substituting the objective function of (6) in (7), the optimal that maximized was obtained through (8). From (8), it was clear that the optimal was a function of the transmission activity p and the path-loss coefficient , while was independent of .
To measure the variance of T across the network, we used the optimal in the expression given by (9).
Here, is the second moment of the throughput.
5. Numerical Results
We first validated the developed model via independent Monte Carlo simulations for PPP realizations of vehicles along a two-lane 10-km highway scenario. For each realization, while the locations of vehicles were kept fixed, their channel fading and transmission activity were randomly varied with time. During the simulation, 10,000 SIR samples were collected for each vehicle to calculate the TSP per vehicle, then the meta-distribution of TSP was evaluated across all vehicles in the network. The intensity of transmitting vehicles was 40 vehicle/km.
Figure 2 shows the meta-distribution of TSP versus the vehicles’ percentile for different network parameters. The close matching between the analytic model and the simulation results validated our mathematical framework. Figure 2a illustrates the simulation results for a different number of lanes (2, 4, 6, and 8 lanes), and the obtained results validated that the one-dimensional PPP representation of the vehicles was acceptable for the highway scenario. Figure 2b shows that lower transmission activity p increased the percentile of vehicles that achieved a target TSP. For example, at , about of vehicles achieved a TSP of , while at , more than of vehicles can achieved the same TSP. This result was due to the fact that decreasing the transmission activity p led to lower interference power, as well as lower interference correlation across time. This in turn (i) improved the mean TSP and (ii) reduced the variance of the TSP.
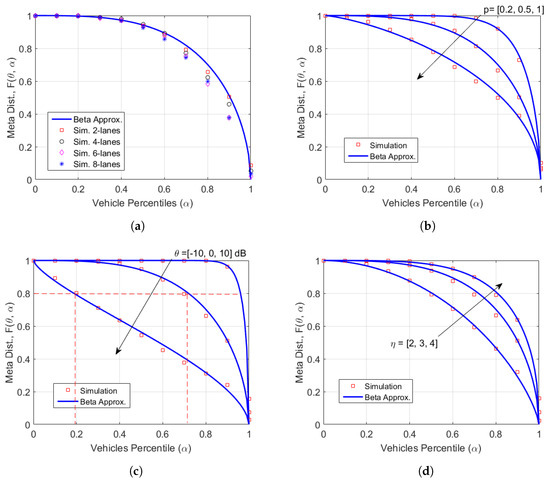
Figure 2.
The meta-distribution of transmission success probability (TSP) at different values of , and p. (a) dB, and ; (b) dB and ; (c) ; and ; (d) dB and .
Figure 2c illustrates that decreasing while keeping p and constant enhanced overall performance, so more vehicles could achieve the target success probability. Figure 2d illustrates that with constant and p, variation in path-loss coefficient also exhibited a noticeable impact on the meta-distribution. In other words, when increased, the aggregated interference on the received power decreased, and hence, the percentile of vehicles that could exceed a target success probability increased.
Based on the meta-distribution curves shown in Figure 2, we could determine a set of data rates (e.g., via adaptive modulation and coding schemes) to be selected by vehicles in order to maintain a target TSP. Each vehicle should operate at the highest transmission rate that keeps its TSP above the target threshold. Otherwise, the vehicle decremented its transmission rate to achieve the target TSP. (As shown in Section 3, the transmission rate could be directly determined by .) Such rate adaptation can act as a congestion control mechanism. Figure 2c shows that for a target TSP of and dB, approximately , , and of the vehicles would select , , and dB, respectively.
Figure 3a,b emphasizes the fact that decreasing transmission activity p, or increasing the path-loss exponent , monotonically increased the mean and decreased the variance of the TSP. For instance, in Figure 3a, for dB, , and , the mean and variances were and , respectively; while at , the mean became , and the variance decreased by . On the other hand, Figure 3b reports that as increased, the mean success probability increased, while the variance decreased.
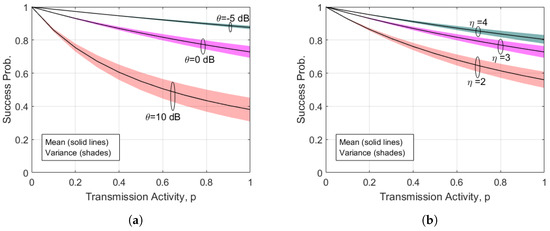
Figure 3.
Mean and variance of the TSP. (a) dB; (b) dB, .
Throughput Evaluation
In this section, using the formula defined in (8), we numerically found the optimal that maximized . Figure 4 shows the behavior of the optimal and its corresponding maximum with the variation in p. Figure 4a–c demonstrates the throughput performance with a constant and increasing . It was observed that the optimal that gave the maximum decreased as p increased. Figure 5 also reflects the same observations where the optimal changed with both path-loss coefficient and transmission activity p. For a given , increasing p led to a lower transmission rate (i.e., less and less ) due to the higher interference. On the other hand, at a fixed p, increasing led to a higher transmission rate due to lower aggregate interference (i.e., due to higher path-loss).
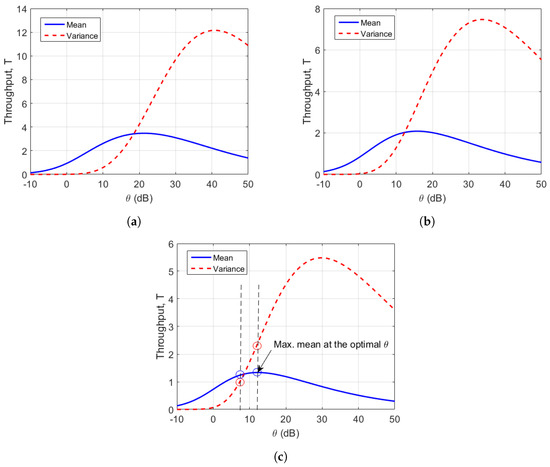
Figure 4.
Mean and variance of the throughput, T. (a) , p = 0.2; (b) , p = 0.5; (c) , p = 1.
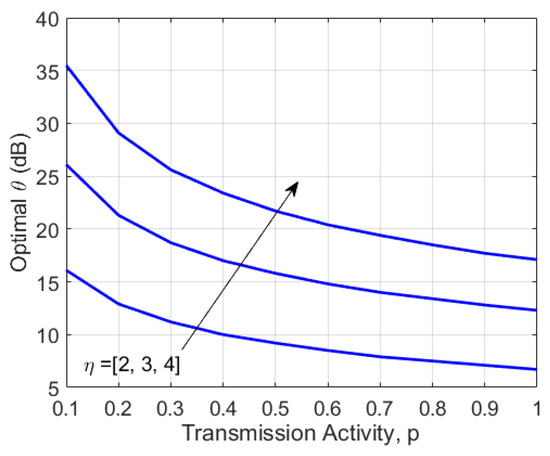
Figure 5.
Optimal versus transmission activity, p.
Figure 4 highlights the important observation that we can significantly reduce the variance by carefully choosing to be slightly lower than the optimal value. While such values can incur a small loss in , it can reduce the unintended performance variations across the highway. For instance, Figure 4c shows that selecting dB instead of the optimal value, dB, reduced by at a sacrifice of in , but also reduced by . In other words, the index of dispersion (IoD), i.e., the ratio between variance and mean, was reduced by around . Therefore, by selecting with a minimal dispersion as described above, we can provide near maximum throughput with highly-uniform performance across most of the vehicles on the highway.
6. Conclusions and Future Work
This letter analyzed the meta-distribution of TSP for vehicular networks. We obtained the moments in integral forms. Then, moment matching was utilized to approximate the meta-distribution with a beta distribution, where the accuracy of the approximation was validated via simulations. The results demonstrated that the transmission activity (p), SIR threshold (), and path-loss coefficient () imposed a significant impact on the TSP percentiles. For example, decreasing the transmission activity p increased the percentile of vehicles that achieved a target TSP. Based on this observation, an optimization problem was formulated and solved to maximize the throughput across the highway. The results for the throughput optimization showed that operating at the maximum mean rate may incur significant discrepancies among the vehicles’ throughput. However, by employing the meta-distribution-aware rate selection, such discrepancies can be significantly reduced (up to ) with a slight deviation from the maximum rate (e.g., ).
In the future, we plan to analyze the meta-distribution for urban environments where the communication links can be non-line of sight. We also plan to consider the vehicle-to-infrastructure connectivity in our model.
Author Contributions
Conceptualization and methodology contributed by M.A.A.E.-G., H.E. and A.H.S.; software and validation done by M.A.A.E.-G., H.E.; writing, review and editing, M.A.A.E.-G., H.E., A.H.S. and H.K.; supervision H.E. and H.K.; project administration, H.K.; funding acquisition, H.K.
Funding
This work was financially supported by the Center for Integrated Smart Sensors funded by the Ministry of Science, ICT & Future Planning as the Global Frontier Project, Korea (CISS-2019). It was also funded and conducted under the Competency Development Program for Industry Specialists, of the Korean Ministry of Trade, Industry and Energy (MOTIE), operated by Korea Institute for Advancement of Technology (KIAT) (No. N0001883, HRD program for Intelligent Semiconductor Industry). In addition, it was supported by the Korea Institute for Advancement of Technology (KIAT) grant funded by the Korea Government (MSS: Ministry of SMEs and Startups) (No. S2755555).
Conflicts of Interest
The authors declare no conflict of interest.
References
- The World Health Report 2015—Reducing Risks, Promoting Healthy Life. Available online: http://www.who.int/whr/2002/chapter4/en/index7.html (accessed on 30 June 2017).
- Review of NHTSA Proposal to Mandate V2V Communication for Safety. Available online: https://www.cargroup.org/publication/review-nhtsa-proposal-mandate-v2v-communication-safety/ (accessed on 5 February 2017).
- Kenney, J.B. Dedicated Short-Range Communications (DSRC) Standards in the United States. Proc. IEEE 2011, 99, 1162–1182. [Google Scholar] [CrossRef]
- Dedicated Short Range Communications (DSRC) Message Set Dictionary. Available online: http://standards.sae.org/j2735_201603/ (accessed on 20 October 2018).
- Hadded, M.; Muhlethaler, P.; Laouiti, A.; Zagrouba, R.; Saidane, L.A. TDMA-Based MAC Protocols for Vehicular Ad Hoc Networks: A Survey, Qualitative Analysis, and Open Research Issues. IEEE Commun. Surv. Tutor. 2015, 17, 2461–2492. [Google Scholar] [CrossRef]
- Abd El-Gawad, M.A.; Elsharief, M.; Kim, H. A cooperative V2X MAC protocol for vehicular networks. EURASIP J. Wirel. Commun. Netw. 2019, 2019, 65. [Google Scholar] [CrossRef]
- Luong, H.P.; Panda, M.; Vu, H.L.; Vo, B.Q. Beacon Rate Optimization for Vehicular Safety Applications in Highway Scenarios. IEEE Trans. Veh. Technol. 2018, 67, 524–536. [Google Scholar] [CrossRef]
- Sommer, C.; Joerer, S.; Segata, M.; Tonguz, O.K.; Cigno, R.L.; Dressler, F. How Shadowing Hurts Vehicular Communications and How Dynamic Beaconing Can Help. IEEE Trans. Mob. Comput. 2015, 14, 1411–1421. [Google Scholar] [CrossRef]
- Lyamin, N.; Vinel, A.; Smely, D.; Bellalta, B. ETSI DCC: Decentralized Congestion Control in C-ITS. IEEE Commun. Mag. 2018, 56, 112–118. [Google Scholar] [CrossRef]
- Bansal, G.; Kenney, J.B.; Rohrs, C.E. LIMERIC: A Linear Adaptive Message Rate Algorithm for DSRC Congestion Control. IEEE Trans. Veh. Technol. 2013, 62, 4182–4197. [Google Scholar] [CrossRef]
- ElSawy, H.; Sultan-Salem, A.; Alouini, M.S.; Win, M.Z. Modeling and analysis of cellular networks using stochastic geometry: A tutorial. IEEE Commun. Surv. Tutor. 2017, 19, 167–203. [Google Scholar] [CrossRef]
- ElSawy, H.; Hossain, E.; Haenggi, M. Stochastic Geometry for Modeling, Analysis, and Design of Multi-Tier and Cognitive Cellular Wireless Networks: A Survey. IEEE Commun. Surv. Tutor. 2013, 15, 996–1019. [Google Scholar] [CrossRef]
- Nguyen, T.V.; Baccelli, F.; Zhu, K.; Subramanian, S.; Wu, X. A performance analysis of CSMA based broadcast protocol in VANETs. In Proceedings of the 2013 Proceedings IEEE INFOCOM, Turin, Italy, 14–19 April 2013; pp. 2805–2813. [Google Scholar] [CrossRef]
- Blaszczyszyn, B.; Mühlethaler, P.; Toor, Y. Maximizing throughput of linear vehicular Ad-hoc NETworks (VANETs)—A stochastic approach. In Proceedings of the 2009 European Wireless Conference, Aalborg, Denmark, 17–20 May 2009; pp. 32–36. [Google Scholar] [CrossRef]
- Zanella, A.; Bazzi, A.; Pasolini, G.; Masini, B.M. On the Impact of Routing Strategies on the Interference of Ad Hoc Wireless Networks. IEEE Trans. Commun. 2013, 61, 4322–4333. [Google Scholar] [CrossRef]
- Farooq, M.J.; ElSawy, H.; Alouini, M.S. A Stochastic Geometry Model for Multi-Hop Highway Vehicular Communication. IEEE Trans. Wirel. Commun. 2016, 15, 2276–2291. [Google Scholar] [CrossRef]
- Steinmetz, E.; Wildemeersch, M.; Quek, T.Q.; Wymeersch, H. A Stochastic Geometry Model for Vehicular Communication near Intersections. In Proceedings of the 2015 IEEE Globecom Workshops (GC Wkshps), San Diego, CA, USA, 6–10 December 2015; pp. 1–6. [Google Scholar] [CrossRef]
- Tong, Z.; Lu, H.; Haenggi, M.; Poellabauer, C. A Stochastic Geometry Approach to the Modeling of DSRC for Vehicular Safety Communication. IEEE Trans. Intell. Transp. Syst. 2016, 17, 1448–1458. [Google Scholar] [CrossRef]
- Zhang, W.; Chen, Y.; Yang, Y.; Wang, X.; Zhang, Y.; Hong, X.; Mao, G. Multi-Hop Connectivity Probability in Infrastructure-Based Vehicular Networks. IEEE J. Sel. Areas Commun. 2012, 30, 740–747. [Google Scholar] [CrossRef]
- Chetlur, V.V.; Dhillon, H.S. Coverage Analysis of a Vehicular Network Modeled as Cox Process Driven by Poisson Line Process. IEEE Trans. Wirel. Commun. 2018, 17, 4401–4416. [Google Scholar] [CrossRef]
- Bazzi, A.; Zanella, A.; Cecchini, G.; Masini, B.M. Analytical Investigation of Two Benchmark Resource Allocation Algorithms for LTE-V2V. IEEE Trans. Veh. Technol. 2019, 68, 5904–5916. [Google Scholar] [CrossRef]
- Choi, C.; Baccelli, F. An Analytical Framework for Coverage in Cellular Networks Leveraging Vehicles. IEEE Trans. Commun. 2018, 66, 4950–4964. [Google Scholar] [CrossRef]
- Martín-Vega, F.J.; Soret, B.; Aguayo-Torres, M.C.; Kovács, I.Z.; Gómez, G. Geolocation-Based Access for Vehicular Communications: Analysis and Optimization via Stochastic Geometry. IEEE Trans. Veh. Technol. 2018, 67, 3069–3084. [Google Scholar] [CrossRef]
- Wang, Y.; Venugopal, K.; Molisch, A.F.; Heath, R.W. MmWave Vehicle-to-Infrastructure Communication: Analysis of Urban Microcellular Networks. IEEE Trans. Veh. Technol. 2018, 67, 7086–7100. [Google Scholar] [CrossRef]
- Haenggi, M. The meta-distribution of the SIR in Poisson bipolar and cellular networks. IEEE Trans. Wirel. Commun. 2016, 15, 2577–2589. [Google Scholar] [CrossRef]
- Giang, A.T.; Busson, A.; Di Renzo, M. Modeling and optimization of CSMA/CA in VANET. Ann. Oper. Res. 2016, 239, 553–568. [Google Scholar] [CrossRef][Green Version]
- Eichler, S. Performance Evaluation of the IEEE 802.11p WAVE Communication Standard. In Proceedings of the 2007 IEEE 66th Vehicular Technology Conference, Baltimore, MD, USA, 30 September–3 October 2007; pp. 2199–2203. [Google Scholar] [CrossRef]
- Gil-Pelaez, J. Note on the inversion theorem. Biometrika 1951, 38, 481–482. [Google Scholar] [CrossRef]


© 2019 by the authors. Licensee MDPI, Basel, Switzerland. This article is an open access article distributed under the terms and conditions of the Creative Commons Attribution (CC BY) license (http://creativecommons.org/licenses/by/4.0/).