Article

A Compound Control System for FR4-Based Electromagnetic Scanning Micrograting

1
Microsystem Research Center, College of Optoelectronic Engineering, Chongqing University, Chongqing 400044, China
2
Key Laboratory of Fundamental Science of Micro/Nano-Device and System Technology, Chongqing University, Chongqing 400044, China
3
Department MDI, Fraunhofer Institute for Electronic Nano Systems (ENAS), 09131 Chemnitz, Germany
*
Authors to whom correspondence should be addressed.
Electronics 2019, 8(7), 770; https://doi.org/10.3390/electronics8070770
Submission received: 29 May 2019 / Revised: 4 July 2019 / Accepted: 8 July 2019 / Published: 10 July 2019
(This article belongs to the Special Issue Progress in MEMS/NEMS Devices)

Abstract

:
This paper presents a compound control system for precise control of the flame-retardant 4 (FR4)-based electromagnetic scanning micrograting. It mainly consists of a frequency controller and an angle controller. A dual closed-loop structure consisting of a current loop and an angle loop was designed in the angle controller. In addition, the incremental proportional–integral–derivative (PID) control algorithm was designed in the current loop, and the fuzzy-PID control algorithm was employed in the angle loop. From the experimental results, the frequency controller can effectively track the real-time resonant frequency of the scanning micrograting with a tracking accuracy of 0.1 Hz. The overshoot of the scanning micrograting is eliminated. Compared to an open-loop control system, the control system presented in this work reduces the steady-state error of the scanning micrograting from 1.122% to 0.243%. The control accuracy of the compound control system is 0.02°. The anti-interference recovery time of the scanning micrograting was reduced from 550 ms to 181 ms, and the long-term stability was increased from 2.94% to 0.12%. In the compound control system presented in this paper, the crucial parameters of the FR4-based electromagnetic scanning micrograting, including motion accuracy, anti-interference ability, and long-term stability, were effectively improved.

1. Introduction

A near infrared (NIR) spectrometer has been widely used in environmental monitoring [1], agriculture [2,3], food safety [4,5,6], oil production [7], and other fields for its ability to detect the composition and content of substances quickly and nondestructively. Most of the conventional NIR spectrometers have a common structure of using a fixed diffraction grating and an InGaAs detector array. With the development of the microelectromechanical system (MEMS) and micro-optical electromechanical system (MOEMS) technology, researchers have proposed the use of a combination of a scanning micrograting and a single tube detector to replace the conventional optical structure, which can reduce the size and cost of the instrument [8].
In recent years, most of the scanning micrograting has been developed and fabricated using MEMS technology. The actuation mechanisms can be mainly divided into four categories: electrostatic [9], electrothermal [10,11], electromagnetic [12,13,14,15], and piezoelectric [16]. The electromagnetic actuation mechanism is widely used for its large driving torque, linear mechanical properties, and low driving voltage. Electromagnetic coils are more suitable for integration into the flame-retardant 4 (FR4)-based electromagnetic scanning micrograting, due to its excellent process compatibility with printed circuit boards (PCBs). Because of the shortcomings of the silicon MEMS scanning micrograting, such as high manufacturing cost, fragility, and poor shock and vibration [17], we developed the FR4-based electromagnetic scanning micrograting [13,14,15].
In the scanning grating-based micro-NIR spectrometers, the wavelength stability is mainly determined by the stability of the scanning angle [1,8]. Therefore, it is necessary to control the scanning micrograting accurately and stably. In the past few years, researchers from Ewha Womans University [18], South China University of Technology [19,20], and other institutions have reported various control system for the electromagnetic scanning micromirror. However, an external position-sensitive detector (PSD) was used to detect the scanning angle of the scanning micromirror because of the lack of an integrated angle sensor on the scanning micromirror, which would enlarge and complicate the entire control system.
In our previous works, we demonstrated the feasibility of a closed-loop control system using an integrated electromagnetic angle sensor with an analog proportional–integral–derivative (PID) control system [1] and a simple analog difference closed-loop control system [14]. The controlled objects of the two control systems are the MOEMS scanning micrograting and the FR4-based electromagnetic scanning micromirror with the structure of the straight beams, respectively. The simple analog difference closed-loop control system proposed in [14] is just a control system operating based on the error between the set angle and the actual angle. The control output of this system is the angular error multiplied by a multiple. Therefore, this closed-loop control system is extremely unstable. The control accuracy, overshoot, and oscillation times of the control system are all not satisfactory. The analog PID control system proposed in [1] is a control system composed of analog circuits. The control parameters are determined by the fixed resistors and capacitors. Therefore, the control parameters of the control system are solidified and cannot be adaptively changed according to the motion condition of the controlled object and environment. Although the steady-state error and stability of the analog PID control system are less than 1%, its ability to adapt to environmental changes is insufficient because the control parameter cannot be adjusted. At the same time, since the analog PID control system proposed in [1] does not have the function of tracking the real-time resonant frequency, the control system can easily reach the maximum output during the operation (due to the drift of the resonance frequency of the scanning micrograting) and limit the improvement of long-term stability.
In this paper, a compound control system for the FR4-based electromagnetic scanning micrograting which we developed is proposed to accurately control the scanning micrograting and improve its stability. An integrated angle sensor was employed in this compound control system. In addition, specific control system circuits such as the angle sensor signal acquisition, phase detector, and current detection were designed and manufactured. The control algorithms for the resonant frequency tracking and the angle control were designed and analyzed. The aim of resonant frequency tracking is to track the real-time resonant frequency of the scanning micrograting when the angle controller output reaches its maximum and the scanning angle of the scanning micrograting has still not reached the set value. In the angle controller, we proposed a dual closed-loop structure of the angle loop and the current loop. The fuzzy-PID control algorithm was used in the angle loop, and the incremental PID control algorithm was used in the current loop. The compound control system can adaptively adjust the control parameters according to the real-time motion state of the scanning micrograting with the help of the fuzzy controller, so that the control system always works at the optimal state.
The rest of the paper is organized as follows. Section 2 provides a brief overview of the FR4-based electromagnetic scanning micrograting we developed. The design and manufacture of the hardware and control algorithm of the control system are introduced in Section 3. After this, the tests of the control system, comparison between different control algorithms, and analysis of test results are described in Section 4. Finally, a brief conclusion is given in Section 5.

2. Overview of the FR4-Based Electromagnetic Scanning Micrograting

The compound control system is based on the FR4-based electromagnetic scanning micrograting we previously developed [15]. The photograph of the scanning micrograting is shown in Figure 1a. The FR4-based electromagnetic scanning micrograting includes a movable MEMS blazed grating, a pair of serpentine beams, driving coil and angle sensing coils, electrode pads, coverplate and baseplate, and a pair of NdFeB permanent magnets. The 7 × 7 mm MEMS blazed grating is bonded to the FR4 platform. The 12 × 12 mm platform with integrated driving coil and angle sensing coils is suspended by a pair of serpentine beams. Two NdFeB permanent magnets are assembled in parallel so that a nearly uniform magnetic field is formed near the FR4 platform [14]. Figure 1b,c shows the schematic of the top and bottom layouts of the scanning micrograting. The driving coil and differential angle sensing coils are connected to pads on the FR4 substrate by leads. Thus, the micrograting will be actuated to scan around the serpentine beams by the Lorentz force when the current flows through the driving coil. At the same time, the electromotive force related to the scanning angle is induced in the angle sensing coils.
The motion of the scanning micrograting can be approximated as a forced oscillating system. Thus, the motion (mechanical half angle, θ ) can be expressed by the following dynamical equation:
J m θ ¨ + C m θ ˙ + K m θ = T E M ,
where J m , C m , K m , and T E M represent the moment of inertia of the system, the damping coefficient, the torsional stiffness of the system, and the total electromagnetic driving torque, respectively. The mechanical scanning half angle of the scanning micrograting in the resonant state can be expressed as follows:
θ = T E M K m Q m ,
where Q m = 1 / ( 2 ξ m ) is the quality factor and ξ represents the damping ratio. The moment of inertia of the system is mainly composed of the rotational inertia of the FR4 center platform, the integrated double-layer coil, and the silicon grating. Thus, the moment of inertia of the system can be expressed by the following equation:
J m = J F + J C o i l + J S i ,
where J F , J C o i l , and J S i represent the rotational inertia of the FR4 center platform, the integrated double-layer coil, and the silicon grating, respectively.
The torsional stiffness of the system can be calculated by the following equation:
K m = 2 K s θ ,
where K s θ represents the torsional stiffness of a single serpentine beam. The calculation of K s θ can be expressed as:
K s θ = ( 2 E I y o ( l o w s ) + 1 G J p ( 4 l p + 2 w s ) ) 1 ,
where E , G , I y o , J p , l o , l p , and w s represent the Young's modulus of FR4 substrate, the shear modulus of FR4 substrate, the moment of inertia of the section of the serpentine beam to the y-axis, the torsion factor of the section, the length and width of the serpentine beam, and the cross-sectional width of the serpentine beam, respectively.
The force that drives the scanning micrograting to scan is primarily provided by the Lorentz force experienced by the energized coil in the magnetic field. The total driving torque generated after the driving coil is energized is mainly composed of the torque generated by the top driving coil and the bottom driving coil. The total driving torque generated can be recorded as:
T E M = T t + T b ,
where T t and T b represent the driving torque generated by the top driving coil and the bottom driving coil.
The driving torque generated by the top driving coil can be expressed by the following equation:
T t = n = 1 N d 1 I d × B ( x n d t ) × 2 Δ y n d t × x n d t ,
where I d , B ( x d ) , Δ y d , x d , N d , d t , and n represent the driving current, the magnetic flux density at a distance x d from the coil to the torsion axis, the length of the coil, the distance from the coil to the torsion axis, the total number of turns of the driving coil, the top driving coil, and the driving coil number from inside to outside, respectively.
Similarly, the driving torque generated by the bottom driving coil can be written as:
T b = n = 1 N d I d × B ( x n d b ) × ( 2 Δ y n d b a b ) × x n d b ,
where a , b , and d b represent the width of the driving coil, the distance between adjacent coils, and the bottom driving coil.
When a sinusoidal driving voltage signal with the angular frequency of ω is applied in the driving coil, the scanning micrograting performs a sinusoidal torsional motion. The total electromotive force generated by the differential-angle-sensing coil can be expressed as:
U s u m = U s A U s B = 2 U s A ,
where U s A and U s B represent the electromotive force generated by sensing coil A and the electromotive force generated by sensing coil B. Evidently, the electromotive forces generated by the differential sensing coils are opposite in phase. The design of the differential angle sensor can effectively eliminate common mode interference and improve the signal-to-noise ratio (SNR) of the sensing signal.
The total electromotive force generated by sensing coil A is composed of the electromotive force generated by the top and bottom coil, which can be expressed by the following equation:
U s A = U s A t + U s A b ,
where U s A t and U s A b represent the electromotive force generated by the top and bottom sensing coil.
In our previous work [14], when the scanning micrograting works in resonance, the phase difference between the driving voltage and the sensor output voltage is close to 0°. In addition, the coupling voltage in the sensing coil coupled from the driving signal is so small that it can be ignored. The major structural parameters of the FR4-based electromagnetic scanning micrograting are listed in Table 1.
Figure 2a shows the frequency response characteristics of the FR4-based electromagnetic scanning micrograting when the mechanical half angle is 4.1°. In addition, the phase–frequency curve in Figure 2a shows that the phase difference between the driving voltage and the sensor output voltage will change if the scanning micrograting oscillates outside the resonance. Figure 2b shows the resolution of the integrated angle sensor after going through a differential amplifier with a magnification of 500 and a sixth-order band-pass filter. From the test results, the integrated angle sensor has an effective resolution of 0.01°. According to Figure 2c, we can see a clear linear relationship between the integrated sensor output voltage and the mechanical half angle of the scanning micrograting. The correlation coefficient r can reach 0.99997. The sensitivity of the integrated sensor can be determined as 0.94769 V p /°. In the working process, the amplitude of the swing of the FR4-based electromagnetic scanning micrograting will change because of the thermal effects and other environmental influences. Thus, the closed-loop control system must be added to ensure the amplitude of the swing of the scanning micrograting constantly. The good resolution and linearity of the integrated sensor provide advantages for a closed-loop control system.

3. Design of the Compound Control System

3.1. Hardware Design of the System

The hardware of the compound control system consists of a digital signal processor (DSP, TMS320F28335, Texas Instruments, Dallas, TX, USA) as the master chip and the corresponding peripheral circuits. The hardware block diagram of the compound control system is given in Figure 3a. As the block diagram illustrates, the output signal of the integrated angle sensor is sampled and converted to a digital signal related to the scanning angle after going through the differential amplifier, the band-pass filter, and the analog-to-digital converter (ADC, AD7606, Analog Devices, Norwood, MA, USA). In parallel, the amplified output signal of the integrated angle sensor goes through the phase shifting circuit and enters the phase detector simultaneously with the driving signal of the scanning micrograting. The real-time driving current value is obtained after the driving signal goes through the current detection circuit. After receiving the angle sensor signal, the phase difference signal, and the driving current signal, the control values are processed by DSP and transmitted to the direct digital synthesizer (DDS, AD9833, Analog Devices, Norwood, MA, USA) and the digital-to-analog converter (DAC, DAC8563, Texas Instruments, Dallas, TX, USA). The output signals of the DDS and DAC are combined by a four-quadrant multiplier. Then, the composite signal is applied to the scanning micrograting after going through the power amplifier to form a complete closed loop.
Based on the construction and characteristics of the integrated angle sensor described in Section 2, a dedicated acquisition module for the angle sensor output signal was designed. As shown in Figure 4, the acquisition module consists of a differential instrumentation amplifier (AD8429, Analog Devices, Norwood, MA, USA), a sixth-order Butterworth band-pass filter, and an output buffer. The magnification of the differential instrumentation amplifier can be calculated as:
G = 1 + 6 k Ω R G ,
where R G represents the resistance of the resistor connected to the R G pin of the differential instrumentation amplifier. The magnification of the instrumentation amplifier is set to 500 times in this module.
Figure 5 shows the structure of the phase detector circuit and the current detection circuit. According to Figure 5a, the angle sensor signal amplified by the differential instrumentation amplifier shown in Figure 4 first goes through the 90° phase shifter and then enters the phase detector (AD8302, Analog Devices, Norwood, MA, USA) with the driving signal of the scanning micrograting. An active low-pass filter is used in the last stage of the circuit in order to eliminate the alternating current (AC) component in the output signal of the phase detector. The accuracy of the phase detector (AD8302) is 1°. In the current detection circuit shown in Figure 5b, the driving current signal of the scanning micrograting is converted into a voltage signal by a power metal film resistor with a resistance of 0.01 Ω . Then, the weak voltage signal is amplified to a detectable value by the differential instrumentation amplifier with a magnification of 1000. An active low pass filter is used in order to eliminate high-frequency interference in the amplified signal.
Figure 3b shows the photograph of the control circuit board. The power module on the circuit board consisting of the direct-current to direct-current (DC–DC) converter chips and the low dropout regulator (LDO) chips is designed to meet the power requirements of different chips on the control circuit board. The DSP runs the control algorithm to determine the frequency transmitted to the DDS and the amplitude value transmitted to the DAC after the signal of the integrated angle sensor, the signal of the driving current, and the signal of the phase difference are acquired by the ADC.

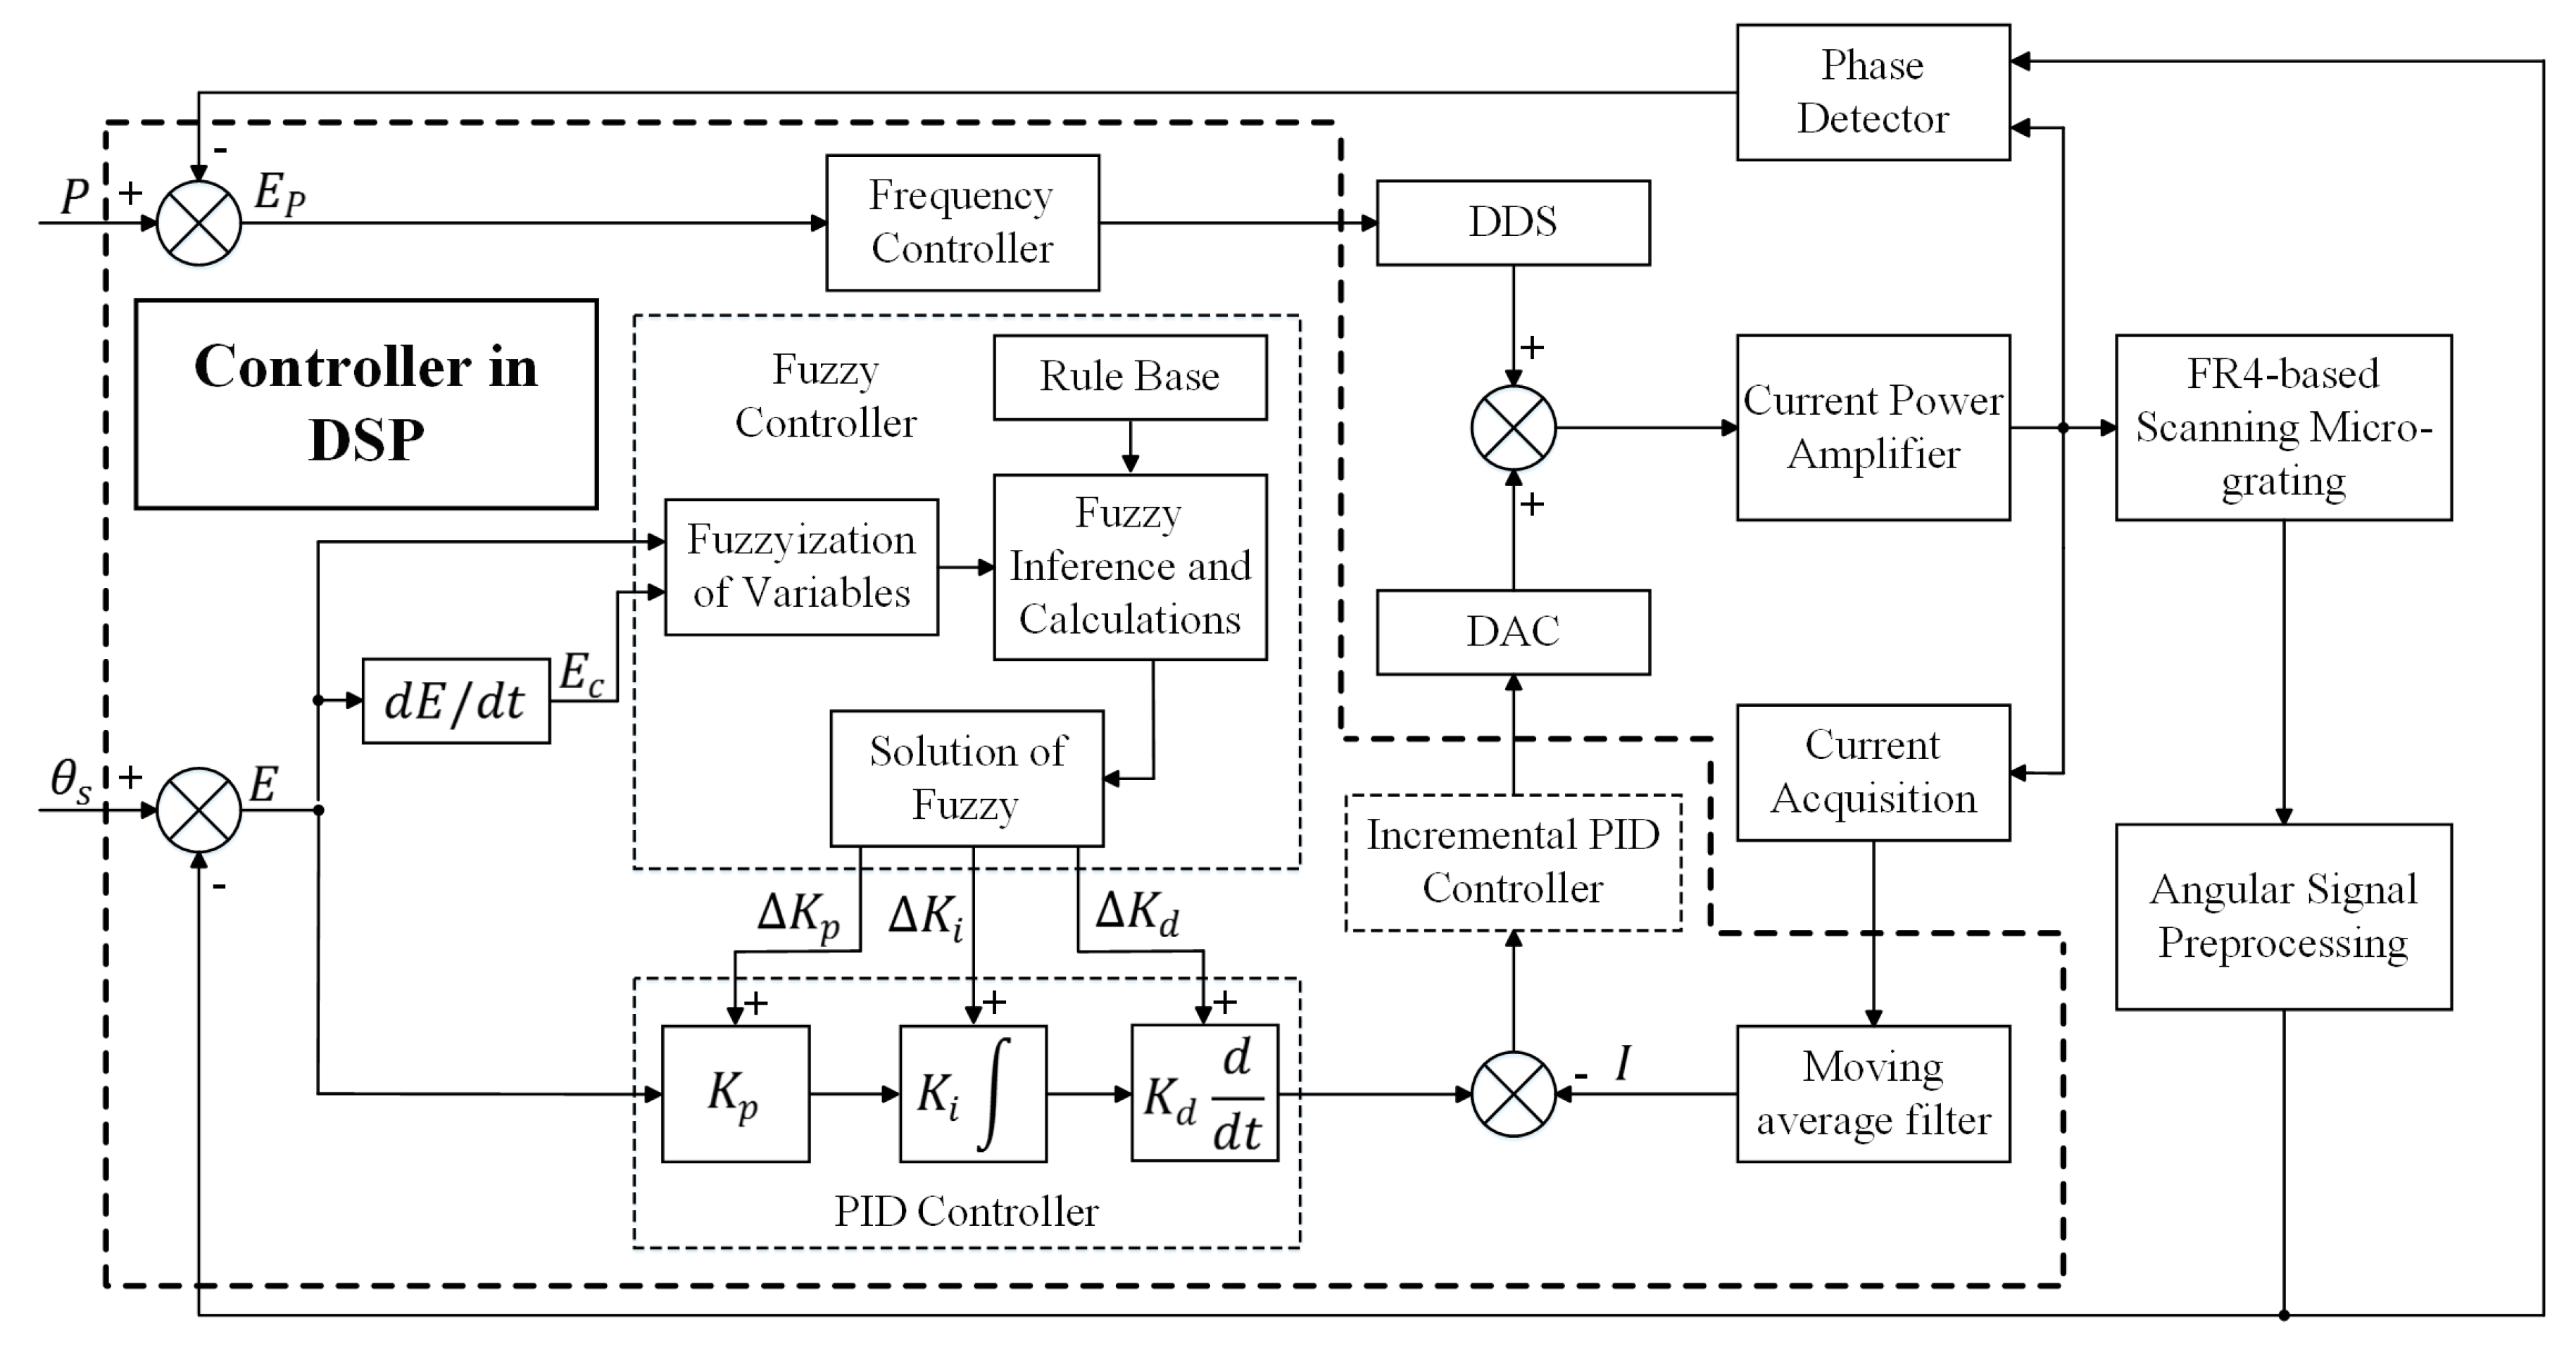
3.2. Control Algorithm Design of the System

The compound control algorithm of the system consists of the frequency modulation algorithm and the amplitude modulation algorithm. The purpose of the frequency modulation algorithm is to track the resonant frequency of the scanning micrograting after the amplitude control fails. Thus, the long-term stability of the system is improved by adding the frequency modulation algorithm. The steady-state error of the scanning angle is controlled within a controllable range through the precise control of the scanning micrograting by the amplitude modulation algorithm.
The block diagram of the compound control algorithm is shown in Figure 6. From Figure 6, the driving frequency of the scanning grating is controlled by the frequency controller, and the amplitude of the driving signal is controlled by the amplitude controller. The frequency controller determines whether the scanning micrograting is in the resonance state by comparing the set phase difference ( P ) with the actual phase difference output from the phase detector, as shown in Figure 5a. The amplified angle sensor signal is phase shifted by 90° before entering the phase detector, so that the scanning micrograting can be considered to be in resonance when the phase difference between the driving signal and the angle sensor signal is 90°. From Figure 2a, the scanning micrograting can be considered to be in resonance when the phase difference between the angle sensor signal and the driving signal is within the range of ±5°. Thus, when the error ( E p ) between the output of the phase detector and the set 90° phase difference ( P ) is within the range of ±5°, the frequency controller maintains the original output frequency. The frequency controller considers that the scanning micrograting is far from the resonant state and starts to work when the error value exceeds ±5° and the amplitude controller fails. The frequency controller first increases the output frequency in steps of 0.1 Hz and then determines whether the error E p has decreased after the frequency increases. If the error E p is not decreased, it means that the direction of adjustment is wrong, in which case, the frequency controller reduces the output frequency in steps of 0.1 Hz until the error returns to the range of ±5°. The number of adjustments is grouped five times. At the third time, the controller will judge whether the adjustment direction is correct by judging whether the error E p is decreased. The frequency controller will adjust in the opposite direction immediately if the adjustment direction is wrong.
A dual closed-loop structure was designed in the amplitude controller to enhance the stability of the compound control system. The inner loop of the amplitude controller is the current loop. The running of the current loop was based on the error between the actual driving current obtained by the circuit shown in Figure 5b and the control value of the outer loop. In this way, the inner loop is enhanced in response to the control input from the outer loop. In addition, the current loop also monitors the driving current in real time to prevent the driving current from being too strong and damaging the scanning micrograting. The outer loop is the angle loop, which is the main channel for the angle feedback control of the scanning micrograting. Overshoot should not occur in the inner and outer loop in order to improve the stability and smoothness of the compound control system.
From Figure 6, the driving current signal is sampled by the ADC after going through the current detection circuit, and then obtained by going through the moving average filter. The incremental proportional–integral–derivative (PID) control algorithm was designed in the current loop. The PID is a linear controller that runs based on the error e between the output of the angle loop and the actual driving current. The output of the continuous PID control algorithm can be expressed by the following equation:
u ( t ) = K P I [ e ( t ) + 1 T I 0 t e ( t ) dt + T D d e ( t ) d t ] ,
where K P I , e ( t ) , T I , and T D represent the proportion coefficient, the error, the integration time constant, and the differential time constant, respectively.
In the compound control system, the input and output of the DSP are both digital signals. The discretization of the algorithm can be expressed as:
{ t k T , k = 0 , 1 , 2 , 0 t e ( t ) dt T j = 0 k e ( j T ) = T j = 0 k e ( j ) d e ( T ) d t e ( k T ) e [ ( k 1 ) T ] T = e ( k ) e ( k 1 ) T ,
where T , k , e ( k ) , and e ( k 1 ) represent the sampling period, the sampling number, the current error at the time instant k , and the current error at the at the previous time instant k , respectively. If e ( k T ) is simplified and represented as e ( k ) , the digital PID control algorithm can be expressed as:
u ( k ) = K P I [ e ( k ) + T T I j = 0 k e ( j ) + T D e ( k ) e ( k 1 ) T ] = K P I e ( k ) + K I I j = 0 k e ( j ) + K D I [ e ( k ) e ( k 1 ) ] ,
where K I I = K P I T T I and K D I = K P I T D T represent the integration coefficient and the differential coefficient of the digital PID control algorithm in the current loop, respectively. Equation (14) is the positional PID control algorithm. The incremental PID control algorithm is used in the current loop to solve the problem of integral saturation, large adjustment jitter, and large memory usage of the positional PID control algorithm. The output of the positional PID control algorithm at the moment before can be calculated from Equation (14):
u ( k 1 ) = K P I e ( k 1 ) + K I I j = 0 k 1 e ( j ) + K D I [ e ( k 1 ) e ( k 2 ) ] .
Then, the incremental PID control algorithm can be expressed as:
Δ u ( k ) = K P I [ e ( k ) e ( k 1 ) ] + K I I e ( k ) + K D I [ e ( k ) 2 e ( k 1 ) + e ( k 2 ) ] .
The motion of the scanning micrograting is nonlinear due to environmental changes and external disturbances. Thus, the fuzzy-PID control algorithm is used in the angle loop in order to improve the anti-interference ability, robustness, and long-term stability of the compound control system. From Figure 6, the inputs of the fuzzy controller are the error E between the set scanning angle and the actual scanning angle and the variation of the error E c . The outputs of the fuzzy controller are the correction quantities ( Δ K p , Δ K i , Δ K d ) of the incremental PID control algorithm in the angle loop. Thus, the coefficients of the incremental PID control algorithm are determined by the following equation:
{ K P = K P 0 + Δ K p K I = K I 0 + Δ K i K D = K D 0 + Δ K d ,
where K P , K I , K D , K P 0 , K I 0 , and K D 0 represent the coefficients of the incremental PID control algorithm used in the angle loop and the initial coefficients obtained by the experiments.
Thus, a two-input and three-output fuzzy controller is used in the angle loop. The actual variation range of the error E and the variation of the error E c is [−0.05°, 0.5°] and [−0.05°, 0.05°], and the basic domain of the control value is [−3, 3] in the designed fuzzy controller. The fuzzy subset language values for the input variables and the output variables are both {NB, NM, NS, ZO, PS, PM, PB}, which are negative big, negative medium, negative small, zero, positive small, positive medium, and positive big. Therefore, the domain transformation can be expressed as:
ε ˜ = n b a ( ε a + b 2 ) ,
where ε ˜ , ε , n , a , and b represent the fuzzy variable, the input variable, the length of the basic domain, and the minimum and maximum values of the actual range, respectively. The triangular membership function is designed in the fuzzy controller because of its high computational accuracy, simple form, and high computational efficiency. The triangular membership function can be expressed as:
μ C = { 0 ε ˜ m ε ˜ m n m m ε ˜ n p ε ˜ p n n ε ˜ p 0 ε ˜ p ,
where m , n , and p represent the distribution parameters of the triangular membership function. The weighted average method was used in the defuzzification of the fuzzy controller due to its wide adaptability, smooth and stable output, and high flexibility. The weighted average method can be expressed by the following equation:
y o = i = 1 n μ C i ( y i ) y i i = 1 n μ C i ( y i ) ,
where y i and μ C i ( y i ) represent the centroid of the membership function and the output value of the membership function.
The rules of the fuzzy controller obtained from the actual motion of the scanning micrograting are listed in Table 2. The fuzzy controller will adjust the coefficients ( K P , K I , and K D ) of the incremental PID control algorithm in real time during the operation of the compound control system. Thus, the adaptive ability of the control system is enhanced.

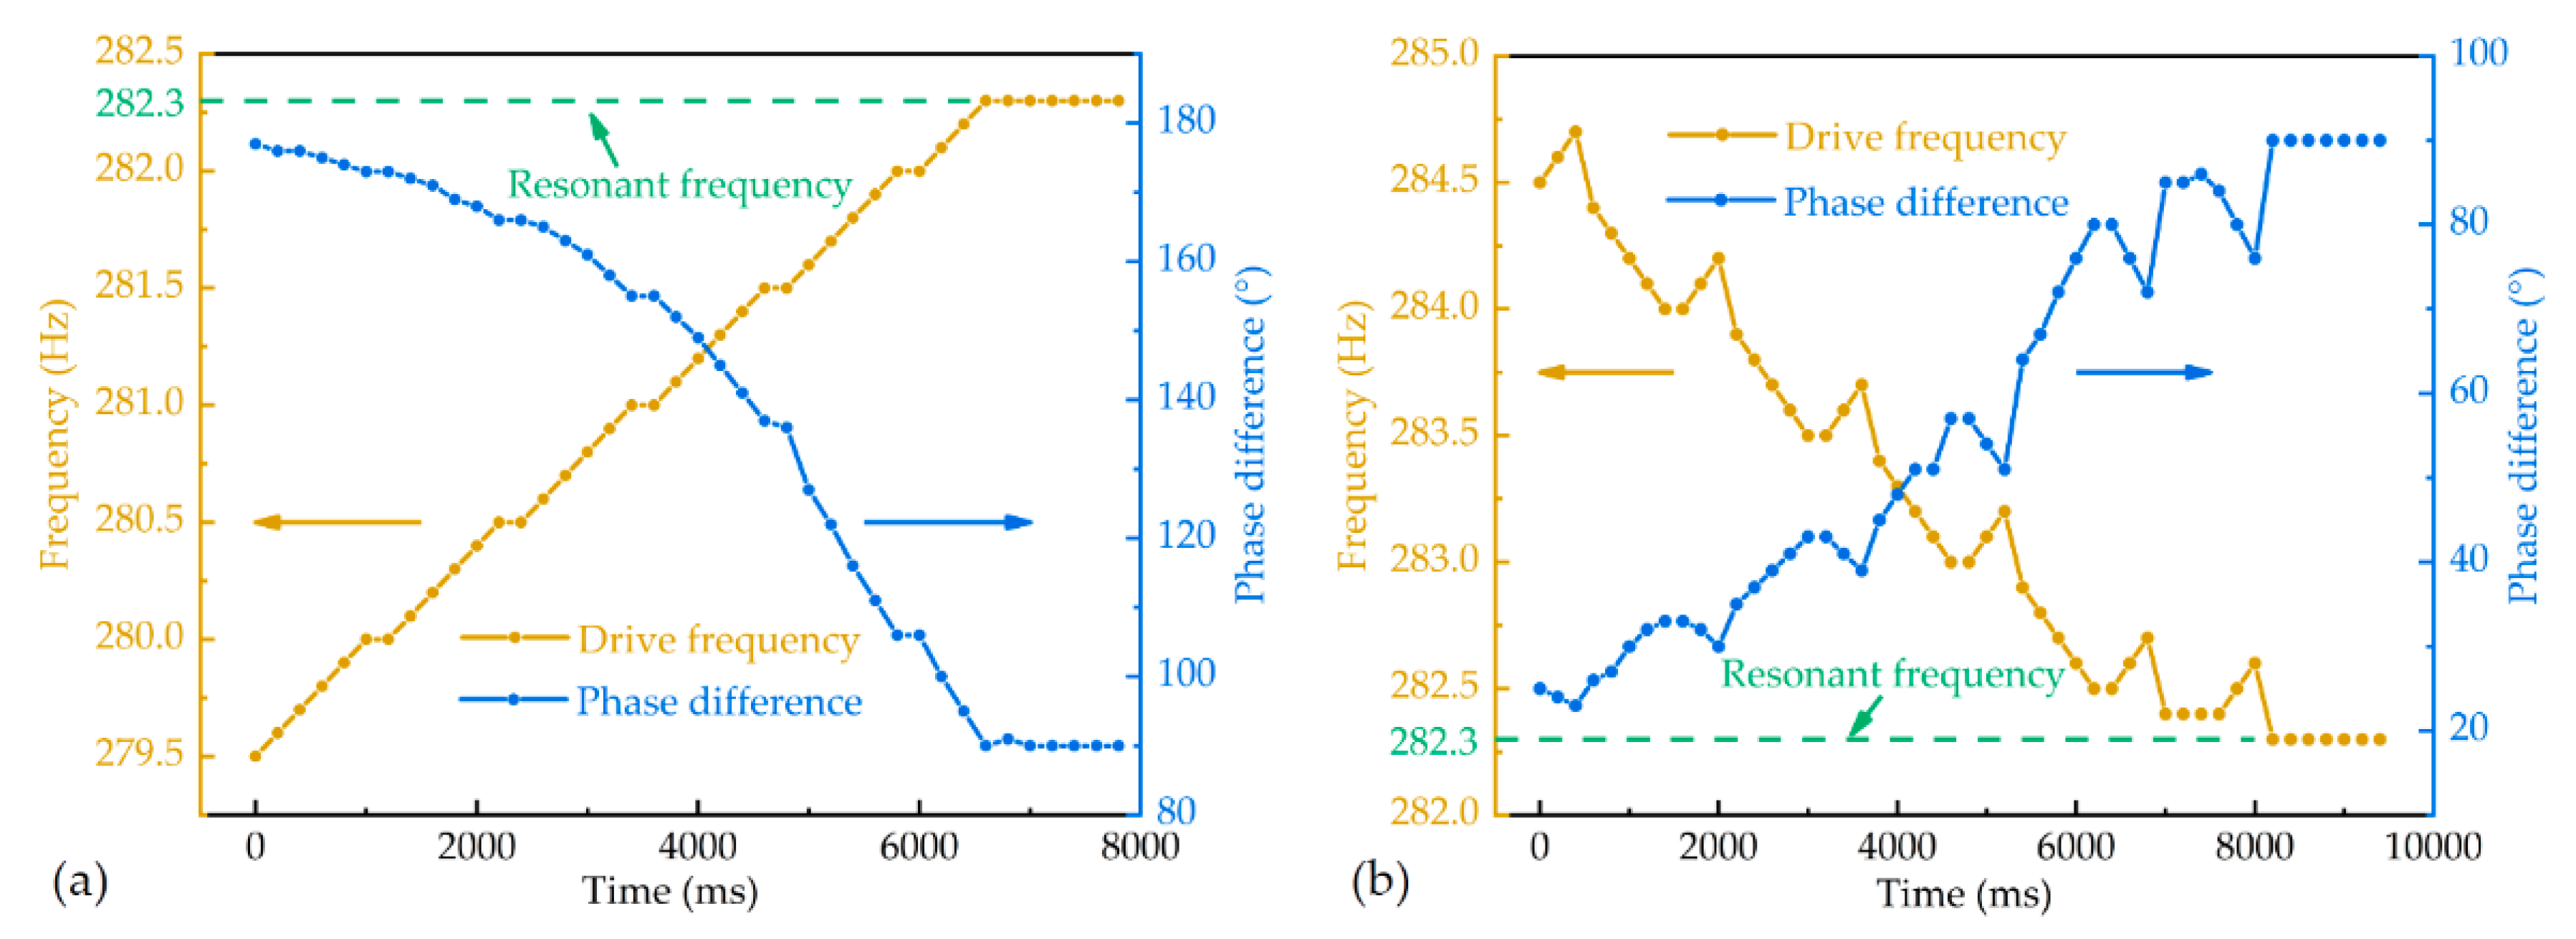
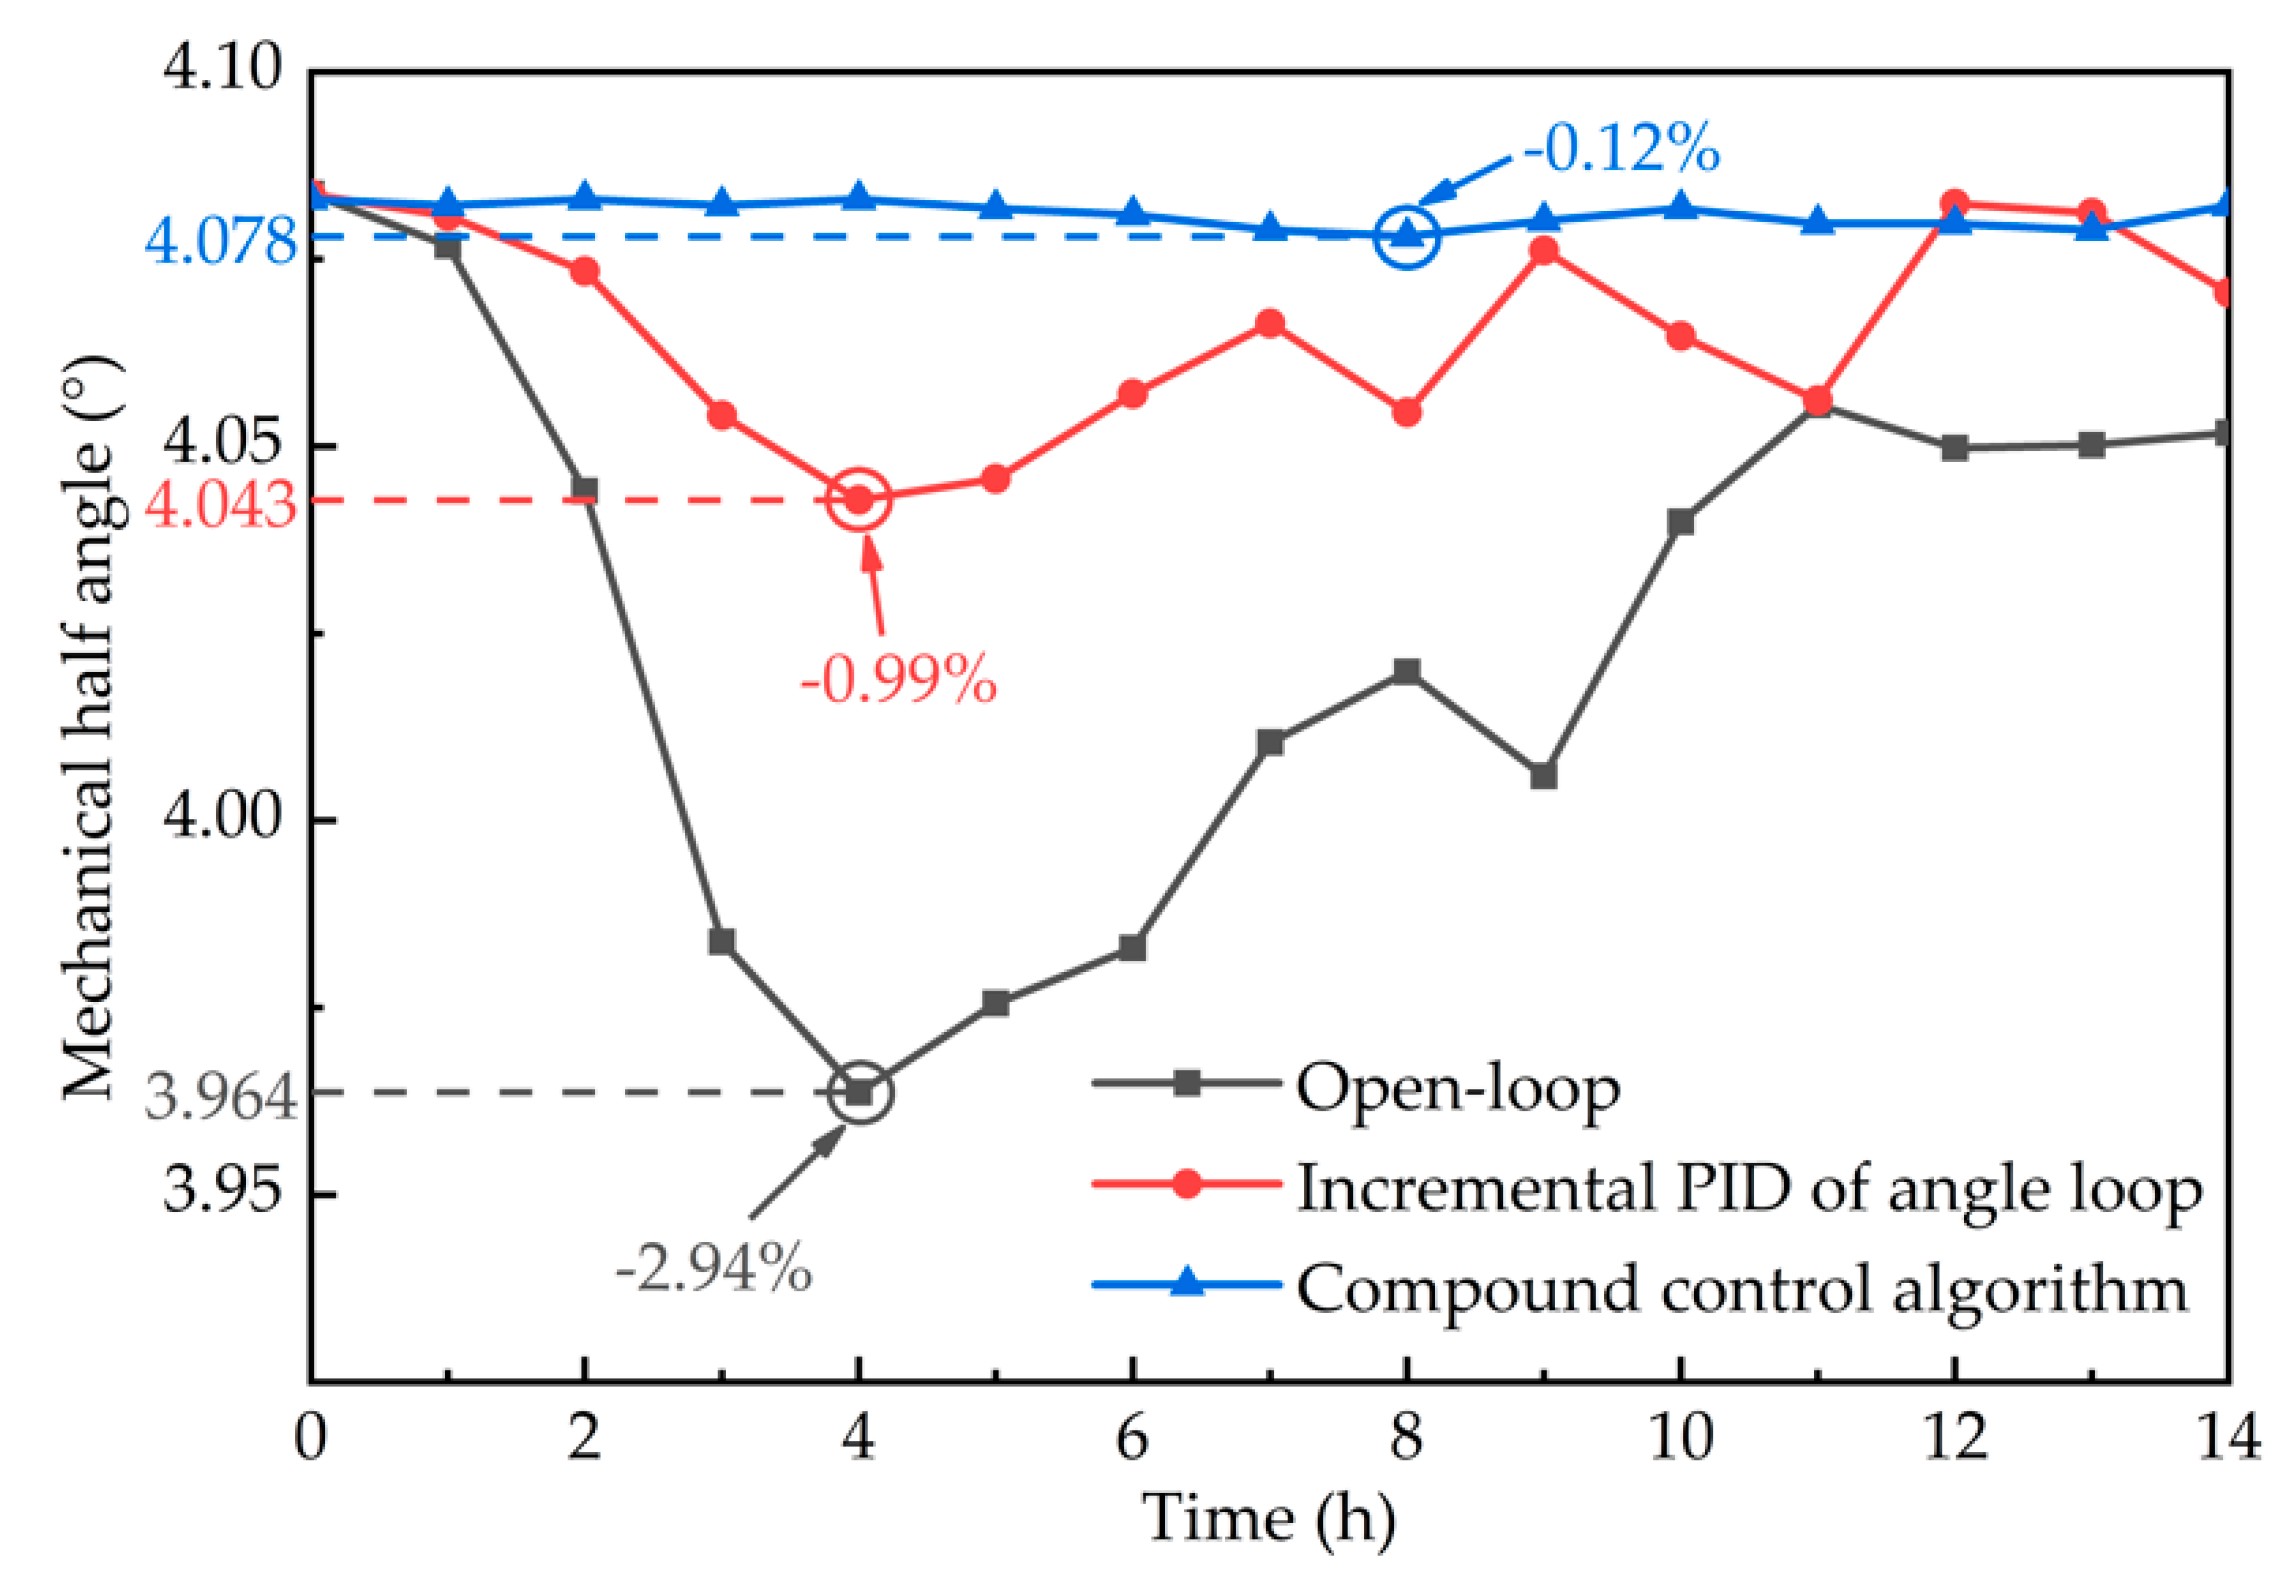
4. Experimental Results and Discussions

Figure 7a shows the schematic drawing of the measurement setup of the compound control system. The scan angle is controlled by the control circuit and can be calculated according to the length of the laser scan line and the distance between the optical screen and the scanning micrograting. The length of the laser scan line can be measured accurately using a position-sensitive detector (PSD). The digital multimeter is used to accurately measure the driving current. The signal generator is used for the open-loop test of the scanning micrograting and generating the interference signal. The photograph of the measurement setup is shown in Figure 7b.
Figure 8 shows the test results of the acquisition module for the angle sensor output signal. In order to simulate the use of the scanning micrograting in the micro-NIR spectrometer [8], the mechanical half angle of the scanning micrograting is set to 4.1°, and the driving frequency is set at the resonant frequency (282.3 Hz). From Figure 8a, the phase difference between the driving signal and the output signal of the integrated angle sensor amplified 500 times is 2.5°, and the amplitude of the amplified sensor signal reaches an intensity that can be detected by the oscilloscope and the ADC. The SNR of the sensor signal after going through the module is shown in Figure 8b. The SNR of the sensor signal is 77.69 dB, which is strong for the compound control system.
Figure 9 shows the results of the step response test in an open-loop state, where the compound control system is removed in order to simulate the open-loop state condition. The driving signal is generated by the signal generator. From Figure 9, when the mechanical half angle is set to 4.1°, the 90% rise time of the scanning micrograting is 192 ms, and the steady-state error is 1.122%; however, there is an overshoot of 2.23%.
The test results of the frequency modulation algorithm are shown in Figure 10. During the test process, the amplitude of the drive signal is kept constant. Figure 10a shows the adjustment process of the frequency modulation algorithm when the initial driving frequency is lower than the resonant frequency of the scanning micrograting. From Figure 10a, the frequency is increased in steps of 0.1 Hz until the phase difference between the driving signal and the phase-shifted sensor signal is in the range of [85°, 95°]. Figure 10b shows the adjustment process of the frequency modulation algorithm when the initial driving frequency is higher than the resonant frequency. The control system initially increases the driving frequency. At the third time, the system determines that the adjustment direction is incorrect, so the system reduces the driving frequency until the phase difference returns to the correct range. As the test results show in Figure 10, the frequency modulation algorithm can effectively track the actual resonant frequency of the scanning micrograting with a tracking accuracy of 0.1 Hz. Therefore, the amplitude controller can work effectively and improve the long-term stability of the compound control system.
Figure 11 shows the variation of the output correction quantities Δ K p , Δ K i , and Δ K d of the fuzzy controller during the operation of the compound control system. According to the design in Section 3.2, the fuzzy controller starts to work when the error E and the variation of the error E c enter the design range. Therefore, the correction quantities are always 0 before E and E c entering the range. From Figure 11, the correction quantities are constantly changing while the compound control system is in operation. The range of variation of Δ K p is [−0.0039, 0.0041], the range of Δ K i is [−0.00095, 0.00067], and the range of Δ K d is [−0.0098, 0.0066]. The trend in the variation of the correction quantities is the same as the design, which indicates that the fuzzy controller can adjust the correction quantities in real time according to the motion of the scanning micrograting.
The step response test results of the compound control system when the target mechanical half angle is set to 2.1°, 3.1°, and 4.1° are shown in Figure 12a correspondingly. From the test results, the 90% rise time of the compound control system is less than 781 ms. The steady-state error of the compound control system is better than 0.243% when the mechanical half angle is 4.1°. Figure 12b shows the step response of the scanning micrograting under different conditions. From Figure 12b, the compound control system eliminates the overshoot of the scanning micrograting. When the target mechanical half angle is set to 4.1°, the steady-state error of the compound control system is significantly lower than that of the open loop, and the control system only uses an incremental PID control algorithm in the angle loop. The single loop control system uses the same PID coefficients ( K P = 0.015, K I = 0.0095, K D = 0.025) as the angle loop in the compound control system. The scanning stability of the scanning micrograting has been significantly improved, and the steady-state error has been reduced from 1.122% to 0.243% compared to the open-loop system.
Figure 13 shows the result of the control accuracy test of the compound control system. The mechanical half angle of the scanning micrograting is increased in steps of 0.02° by the compound control system, and the actual mechanical half angle is obtained by the PSD. The mechanical half angle resolution of the test system shown in Figure 7b is 0.001°. From Figure 13, the control accuracy of the compound control system can effectively reach 0.02°.
In order to test the anti-interference ability of the compound control system, a reverse pulse generated by the signal generator was applied to the control system. Figure 14 shows the comparison of the recovery time with different systems after an equal amplitude pulse interference. From Figure 14, the recovery time of the scanning micrograting is reduced from 550 ms without closed-loop control to 181 ms with the compound control system, and the overshoot is reduced by 11.68% compared to the single-loop incremental PID control.
Finally, long-term stability tests were operated continuously for 14 h. The experiment was repeated using different control systems, including an open-loop condition. Figure 15 shows the test results. The maximum variations of the mechanical half angle were 0.12%, 0.99%, and 2.94%, respectively. Based on the results given in Figure 15, the long-term stability of the scanning micrograting was significantly enhanced due to the addition of closed-loop control systems. The fuzzy controller in the amplitude modulation algorithm can adaptively adjust the correction quantities according to the environment, and this together with the double closed-loop structure used in the amplitude modulation algorithm and the addition of the frequency modulation algorithm all significantly enhance the long-term stability of the scanning micrograting.

5. Conclusions

In this work, a compound control system was proposed to realize the precise control of the FR4-based electromagnetic scanning micrograting. The hardware circuit and control algorithm of the compound control system were designed and discussed. The compound control system consists of a frequency controller and an angle controller. A frequency controller that can track the real-time resonant frequency of the FR4-based electromagnetic scanning micrograting is proposed. A dual closed-loop structure consisting of a current loop and an angle loop was designed in the angle controller. The experimental results showed that the compound control system can effectively track the real-time resonant frequency of the scanning micrograting. By using the compound control system presented, the overshoot of the scanning micrograting is eliminated. The steady-state error is reduced from 1.122% to 0.243% when the mechanical half angle is set to 4.1°. In addition, the control accuracy of the compound control system is also tested. The control accuracy of the compound control system can reach 0.02°. The anti-interference recovery time is reduced from 550 ms to 181 ms. The long-term stability is also increased from 2.94% to 0.12% with the help of the presented compound control system. According to the experimental results, the compound control system has significantly improved the motion accuracy, long-term stability, and anti-interference ability of the FR4-based electromagnetic scanning micrograting, which greatly increases its potential for use as an alternative for a silicon-based MEMS scanning micrograting.

Author Contributions

F.Y., Q.W., and Z.W. designed the hardware and control algorithms of the compound control system. H.L. studied the motion mechanism of the scanning micrograting and the characteristics of the integrated angle sensor. Z.W. provided advice on the design of the compound control system. F.Y., H.L. and L.H. tested the system and analyzed the test data. F.Y. and Q.W. wrote and revised the paper respectively.

Funding

This research was funded by the National Key R&D Program of China (Grant No. 2018YFF01011200), the Fundamental Research Funds for the Central Universities (Grant No. 2019CDCG0007), the Special Funds of the National Natural Science Foundation of China (Grant No. 61327002), and the Chongqing Basic Science and Frontier Technology Research Project (Grant No. cstc2017jcyjAX0237).

Acknowledgments

The authors want to thank Dr. Shan Lu for his advice on the design of the hardware circuit.

Conflicts of Interest

The authors declare no conflict of interest.

References

  1. Liu, H.; Wen, Z.; Li, D.; Huang, J.; Zhou, Y.; Guo, P. A Control and Detecting System of Micro-Near-Infrared Spectrometer Based on a MOEMS Scanning Grating Mirror. Micromachines 2018, 9, 152. [Google Scholar] [CrossRef] [PubMed]
  2. Nicolaï, B.M.; Beullens, K.; Bobelyn, E.; Peirs, A.; Saeys, W.; Theron, K.I.; Lammertyn, J. Nondestructive measurement of fruit and vegetable quality by means of NIR spectroscopy: A review. Postharvest Boil. Technol. 2007, 46, 99–118. [Google Scholar] [CrossRef]
  3. Giovenzana, V.; Beghi, R.; Parisi, S.; Brancadoro, L.; Guidetti, R. Potential effectiveness of visible and near infrared spectroscopy coupled with wavelength selection for real time grapevine leaf water status measurement. J. Sci. Food Agric. 2017, 98, 1935–1943. [Google Scholar] [CrossRef] [PubMed]
  4. Porep, J.U.; Kammerer, D.R.; Carle, R. On-line application of near infrared (NIR) spectroscopy in food production. Trends Food Sci. Technol. 2015, 46, 211–230. [Google Scholar] [CrossRef]
  5. Balage, J.M.; Silva, S.D.L.E.; Gomide, C.A.; Bonin, M.D.N.; Figueira, A.C.; Bonin, M.D.N.; Figueira, A.C. Predicting pork quality using Vis/NIR spectroscopy. Meat Sci. 2015, 108, 37–43. [Google Scholar] [CrossRef]
  6. Sánchez, N.N.; Martínez-Marín, A.; Polvillo, O.; Fernández-Cabanás, V.M.; Carrizosa, J.; Urrutia, B.; Serradilla, J. Near Infrared Spectroscopy (NIRS) for the determination of the milk fat fatty acid profile of goats. Food Chem. 2016, 190, 244–252. [Google Scholar] [CrossRef]
  7. De Lima, S.M.; Silva, B.F.A.; Pontes, D.V.; Pereira, C.F.; Stragevitch, L.; Pimentel, M.F. In-line monitoring of the transesterification reactions for biodiesel production using NIR spectroscopy. Fuel 2014, 115, 46–53. [Google Scholar] [CrossRef] [Green Version]
  8. Huang, J.; Wen, Q.; Nie, Q.; Chang, F.; Zhou, Y.; Wen, Z. Miniaturized NIR Spectrometer Based on Novel MOEMS Scanning Tilted Grating. Micromachines 2018, 9, 478. [Google Scholar] [CrossRef]
  9. Moon, S.; Lee, J.; Yun, J.; Lim, J.; Gwak, M.-J.; Kim, K.-S. Two-axis Electrostatic Gimbaled Mirror Scanner with Self-aligned Tilted Stationary Combs. IEEE Photon Technol. Lett. 2016, 28, 557–560. [Google Scholar] [CrossRef]
  10. Han, F.; Wang, W.; Zhang, X.; Xie, H. Modeling and Control of a Large-Stroke Electrothermal MEMS Mirror for Fourier Transform Microspectrometers. J. Microelectromech. Syst. 2016, 25, 1–11. [Google Scholar] [CrossRef]
  11. Han, F.; Xie, H.; Wang, W.; Zhang, X. Miniature Fourier transform spectrometer with a dual closed-loop controlled electrothermal micromirror. Opt. Express 2016, 24, 22650–22660. [Google Scholar] [CrossRef] [PubMed]
  12. Zhou, Y.; Wen, Q.; Huang, J.; Chang, F. An electromagnetic scanning mirror integrated with blazed grating and angle sensor for a near infrared micro spectrometer. J. Micromech. Microeng. 2017, 27. [Google Scholar] [CrossRef]
  13. Lei, H.; Wen, Q.; Yu, F.; Zhou, Y.; Wen, Z. FR4-Based Electromagnetic Scanning Micromirror Integrated with Angle Sensor. Micromachines 2018, 9, 214. [Google Scholar] [CrossRef] [PubMed]
  14. Wen, Q.; Lei, H.; Yu, F.; Li, D.; She, Y.; Huang, J.; Huang, L.; Wen, Z. Investigation of Electromagnetic Angle Sensor Integrated in FR4-Based Scanning Micromirror. Appl. Sci. 2018, 8, 2412. [Google Scholar] [CrossRef]
  15. Wen, Q.; Lei, H.; Huang, J.; Yu, F.; Huang, L.; Zhang, J.; Li, D.; Peng, Y.; Wen, Z. FR4-based electromagnetic scanning micro-grating integrated with angle sensor for a low-cost NIR micro-spectrometer. Appl. Opt. 2019, 58, 4642–4646. [Google Scholar] [CrossRef] [PubMed]
  16. Lei, H.; Wen, Q.; Yu, F.; Li, D.; Shang, Z.; Huang, J.; Wen, Z. AlN film based piezoelectric large-aperture MEMS scanning micromirror integrated with angle sensors. J. Micromech. Microeng. 2018, 28. [Google Scholar] [CrossRef]
  17. Ataman, C.; Urey, H. Compact Fourier transform spectrometers using FR4 platform. Sens. Actuators Phys. 2009, 151, 9–16. [Google Scholar] [CrossRef]
  18. Han, A.; Cho, A.R.; Ju, S.; Ahn, S.-H.; Bu, J.-U.; Ji, C.-H. Electromagnetic biaxial vector scanner using radial magnetic field. Opt. Express 2016, 24, 15813–15821. [Google Scholar] [CrossRef] [PubMed]
  19. Tan, J.; Sun, W.; Yeow, J.T.W. An Enhanced Robust Control Algorithm Based on CNF and ISM for the MEMS Micromirror against Input Saturation and Disturbance. Micromachines 2017, 8, 326. [Google Scholar] [CrossRef] [PubMed]
  20. Tan, J.; Sun, W.; Yeow, J.T.W. Internal Model-Based Robust Tracking Control Design for the MEMS Electromagnetic Micromirror. Sensors 2017, 17, 1215. [Google Scholar] [CrossRef] [PubMed]
Figure 1. (a) Photograph of the flame-retardant 4 (FR4)-based electromagnetic scanning micrograting. (b) Top layer and (c) bottom layer layouts of the FR4 platform integrated with a driving coil and differential angle sensing coils. The coils at the top and bottom layers are connected with vias.
Electronics 08 00770 g001
Figure 2. Characteristic test results of the FR4-based electromagnetic scanning micrograting. (a) Frequency response characteristics of the scanning micrograting; (b) resolution of the integrated angle sensor; (c) relationship between the integrated angle sensor output voltage and the mechanical half angle of scanning micrograting. Note: All the voltages are measured as peak values.
Electronics 08 00770 g002
Figure 3. (a) Hardware block diagram of the control system; (b) photograph of the control circuit board.
Electronics 08 00770 g003
Figure 4. Acquisition module for the angle sensor output signal.
Electronics 08 00770 g004
Figure 5. (a) Circuit of the phase detector; (b) circuit for current detection.
Electronics 08 00770 g005
Figure 6. Block diagram of the compound control algorithm.
Electronics 08 00770 g006
Figure 7. (a) Schematic drawing and (b) photograph of the measurement setup.
Electronics 08 00770 g007
Figure 8. Test results of the acquisition module for the angle sensor output signal. (a) Relationship between the driving signal and the sensor signal amplified 500 times in the time domain when the drive frequency is 282.3 Hz and the mechanical half angle of the scanning micrograting is 4.1°; (b) frequency spectrum of the sensor signal after going through the module.
Electronics 08 00770 g008
Figure 9. Step response test for the scanning micrograting in the open-loop state. The target of the mechanical half angle is set to 4.1°.
Electronics 08 00770 g009
Figure 10. Test results of the frequency modulation algorithm. (a) Initial frequency is lower than the resonant frequency; (b) initial frequency is higher than the resonant frequency.
Electronics 08 00770 g010
Figure 11. Variation of the output correction quantities Δ K p , Δ K i , and Δ K d of the fuzzy controller. (a) Variation of the correction quantity Δ K p ; (b) variation of the correction quantity Δ K i ; (c) variation of the correction quantity Δ K d .
Electronics 08 00770 g011
Figure 12. (a) Step response of the compound control system at different set mechanical half angles; (b) comparison of step responses in different situations. The target mechanical half angle is set to 4.1°.
Electronics 08 00770 g012
Figure 13. Test result of the compound control system control accuracy. Mechanical half angle of the scanning micrograting is increased by the compound control system with a step of 0.02°.
Electronics 08 00770 g013
Figure 14. Anti-interference test of scanning micrograting under different conditions.
Electronics 08 00770 g014
Figure 15. Comparison of long-term stabilities for the scanning micrograting operated with different control systems.
Electronics 08 00770 g015
Table 1. Major structural parameters of the flame retardant 4 (FR4)-based electromagnetic scanning micrograting.
Structural ParametersSymbolValueUnit
The area of silicon grating l S i × w S i 11.5 × 10 mm 2
The thickness of silicon grating t S i 0.5 mm
The grating constant d 4 μ m
The blaze angle of the grating γ 8.6°
The area of the FR4 platform l × w 12 × 12 mm 2
The thickness of the FR4 platform t 0.4 mm
The parameters of the folded bar l o / l p / w s 12/0.7/1.2 mm
The number of turns of the driving coil N d 16-
The number of turns of the sensing coil N s 4-
The width of the coil and the spacing between the coils a / b 4/4 mil
The strength of the magnetic field B 100 mT
Table 2. The control rules of the fuzzy controller.
E / E c Δ K p / Δ K i / Δ K d
NBNMNSZOPSPMPB
NBPB/NB/PSPB/NB/NSPM/NM/NBPM/NM/NBPS/NS/NBZO/ZO/NMZO/ZO/PS
NMPB/NB/PSPB/NB/NSPM/NM/NBPS/NS/NMPS/NS/NMZO/ZO/NSNS/ZO/ZO
NSPM/NB/ZOPM/NM/NSPM/NS/NMPS/NS/NMZO/ZO/NSNS/PS/NSNS/PS/ZO
ZOPM/NM/ZOPM/NM/NSPS/NS/NSZO/ZO/NSNS/PS/NSNM/PM/NSNM/PM/ZO
PSPS/NM/ZOPS/NS/ZOZO/ZO/ZONS/PS/ZONS/PS/ZONM/PM/ZONM/PB/ZO
PMPS/ZO/PBZO/ZO/NSNS/PS/PSNM/PS/PSNM/PM/PSNM/PB/PSNB/PB/PB
PBZO/ZO/PBZO/ZO/PMNM/PS/PMNM/PM/PMNM/PM/PSNB/PB/PSNB/PB/PB

