Calculation and Interpretation of Ground Penetrating Radar for Temperature and Relative Water Content of Seasonal Permafrost in Qinghai-Tibet Platea


Abstract
:1. Introduction
2. Data Acquisition
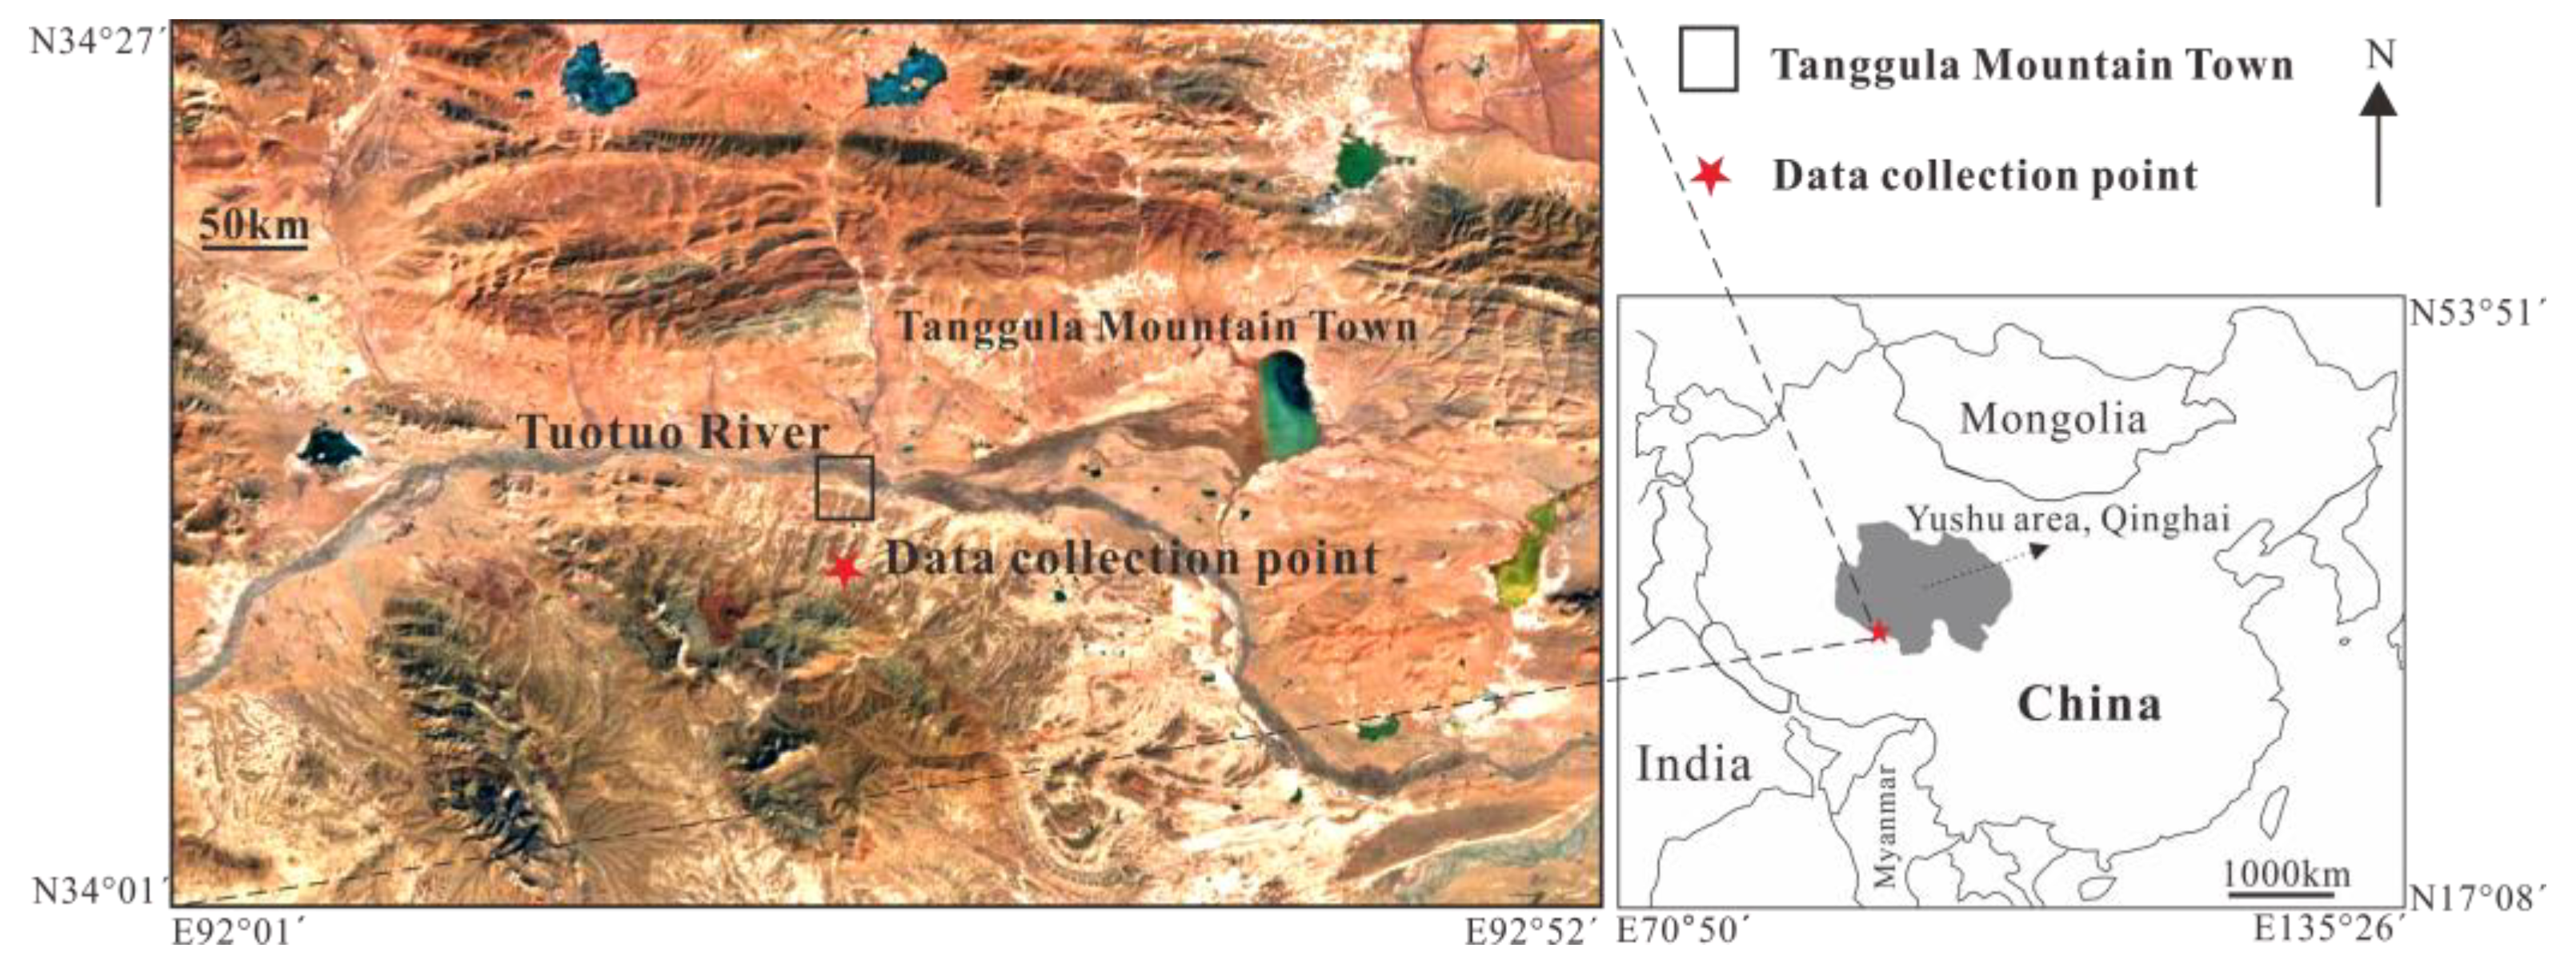
2.1. Test Site
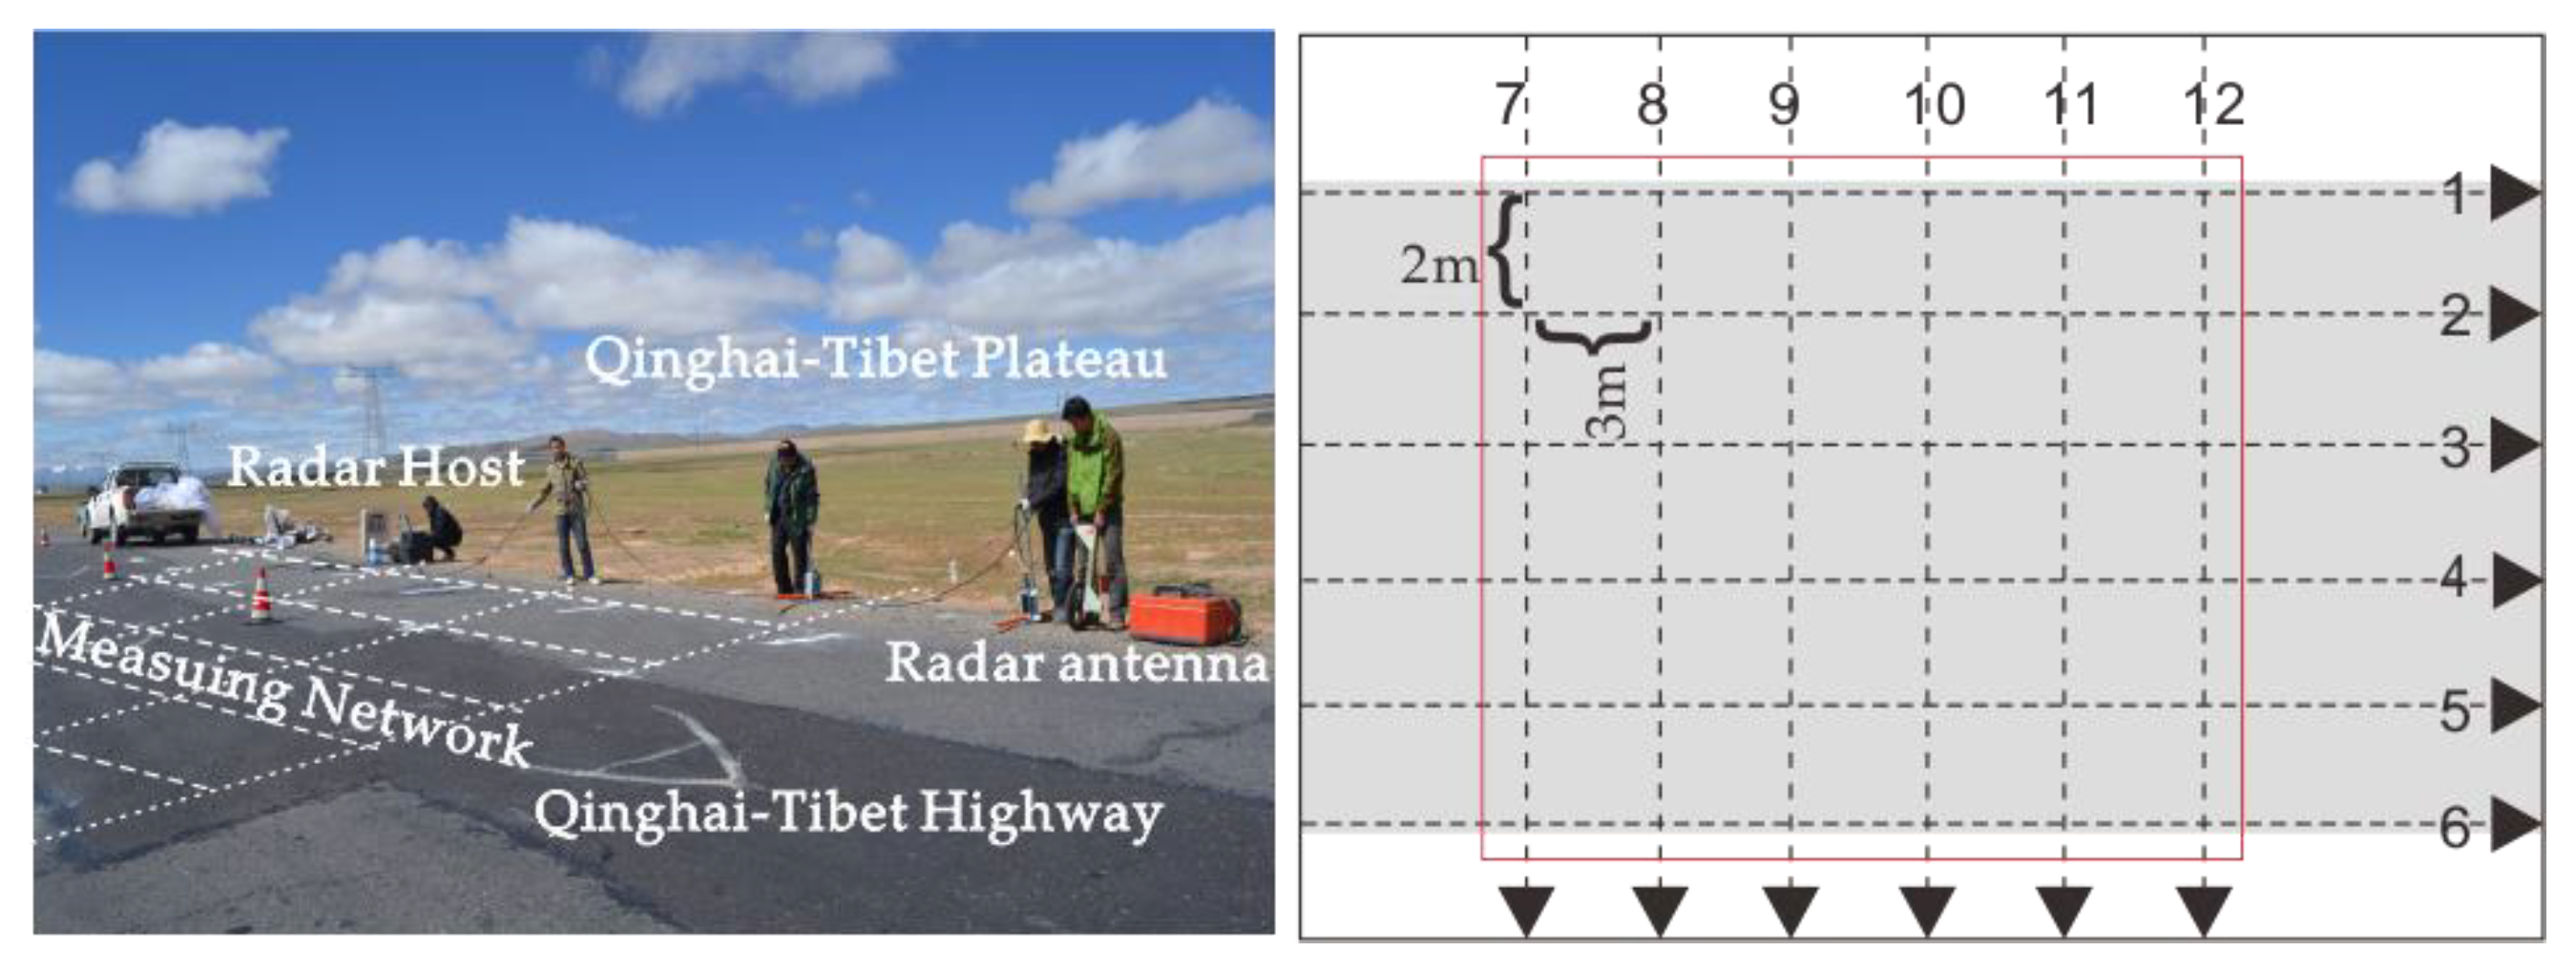
2.2. Test Experiment and Data Acquisition
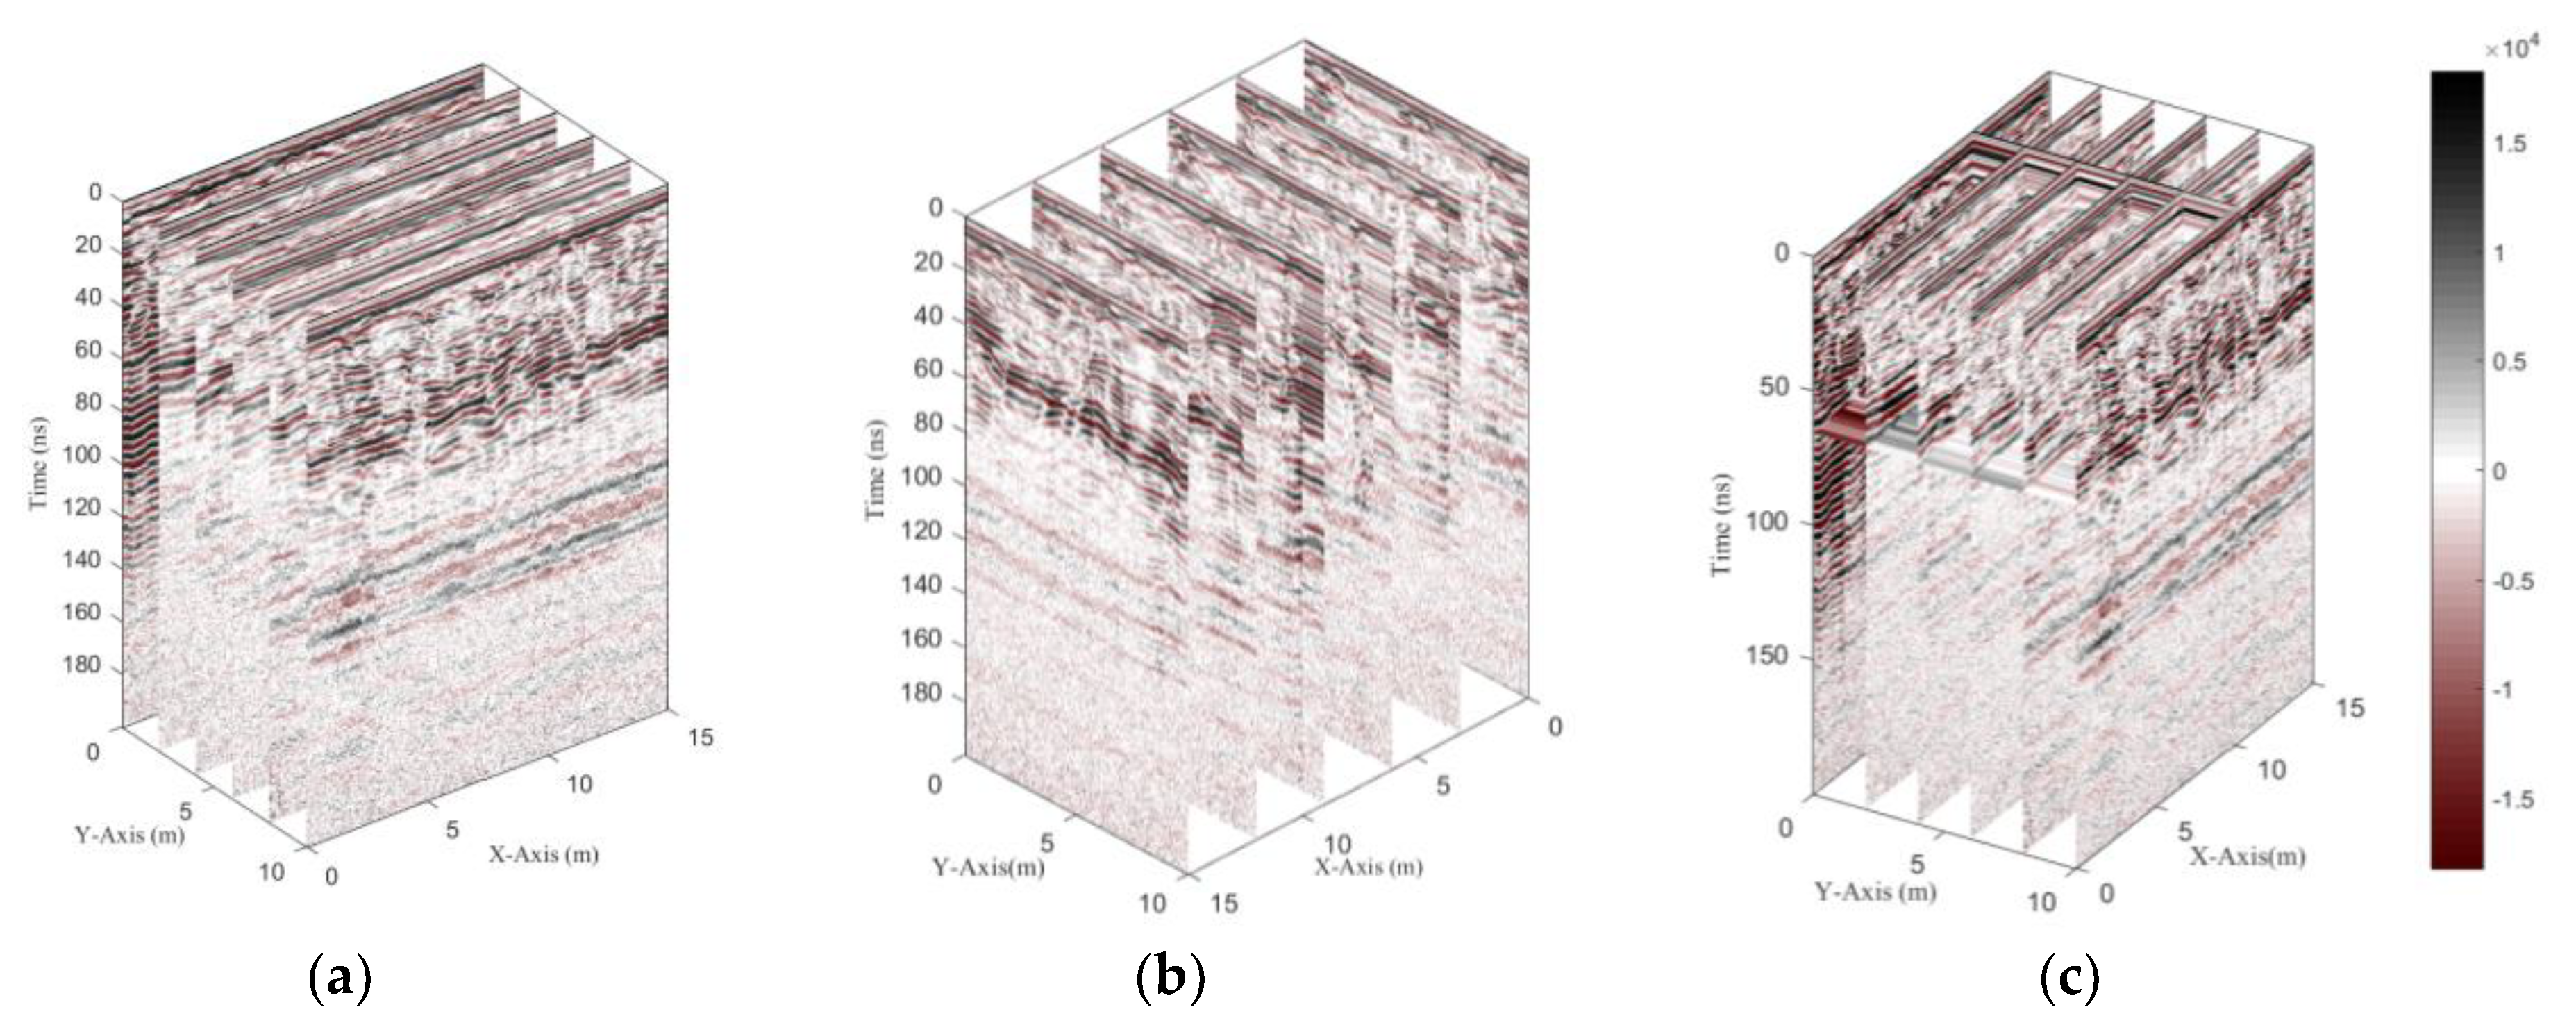
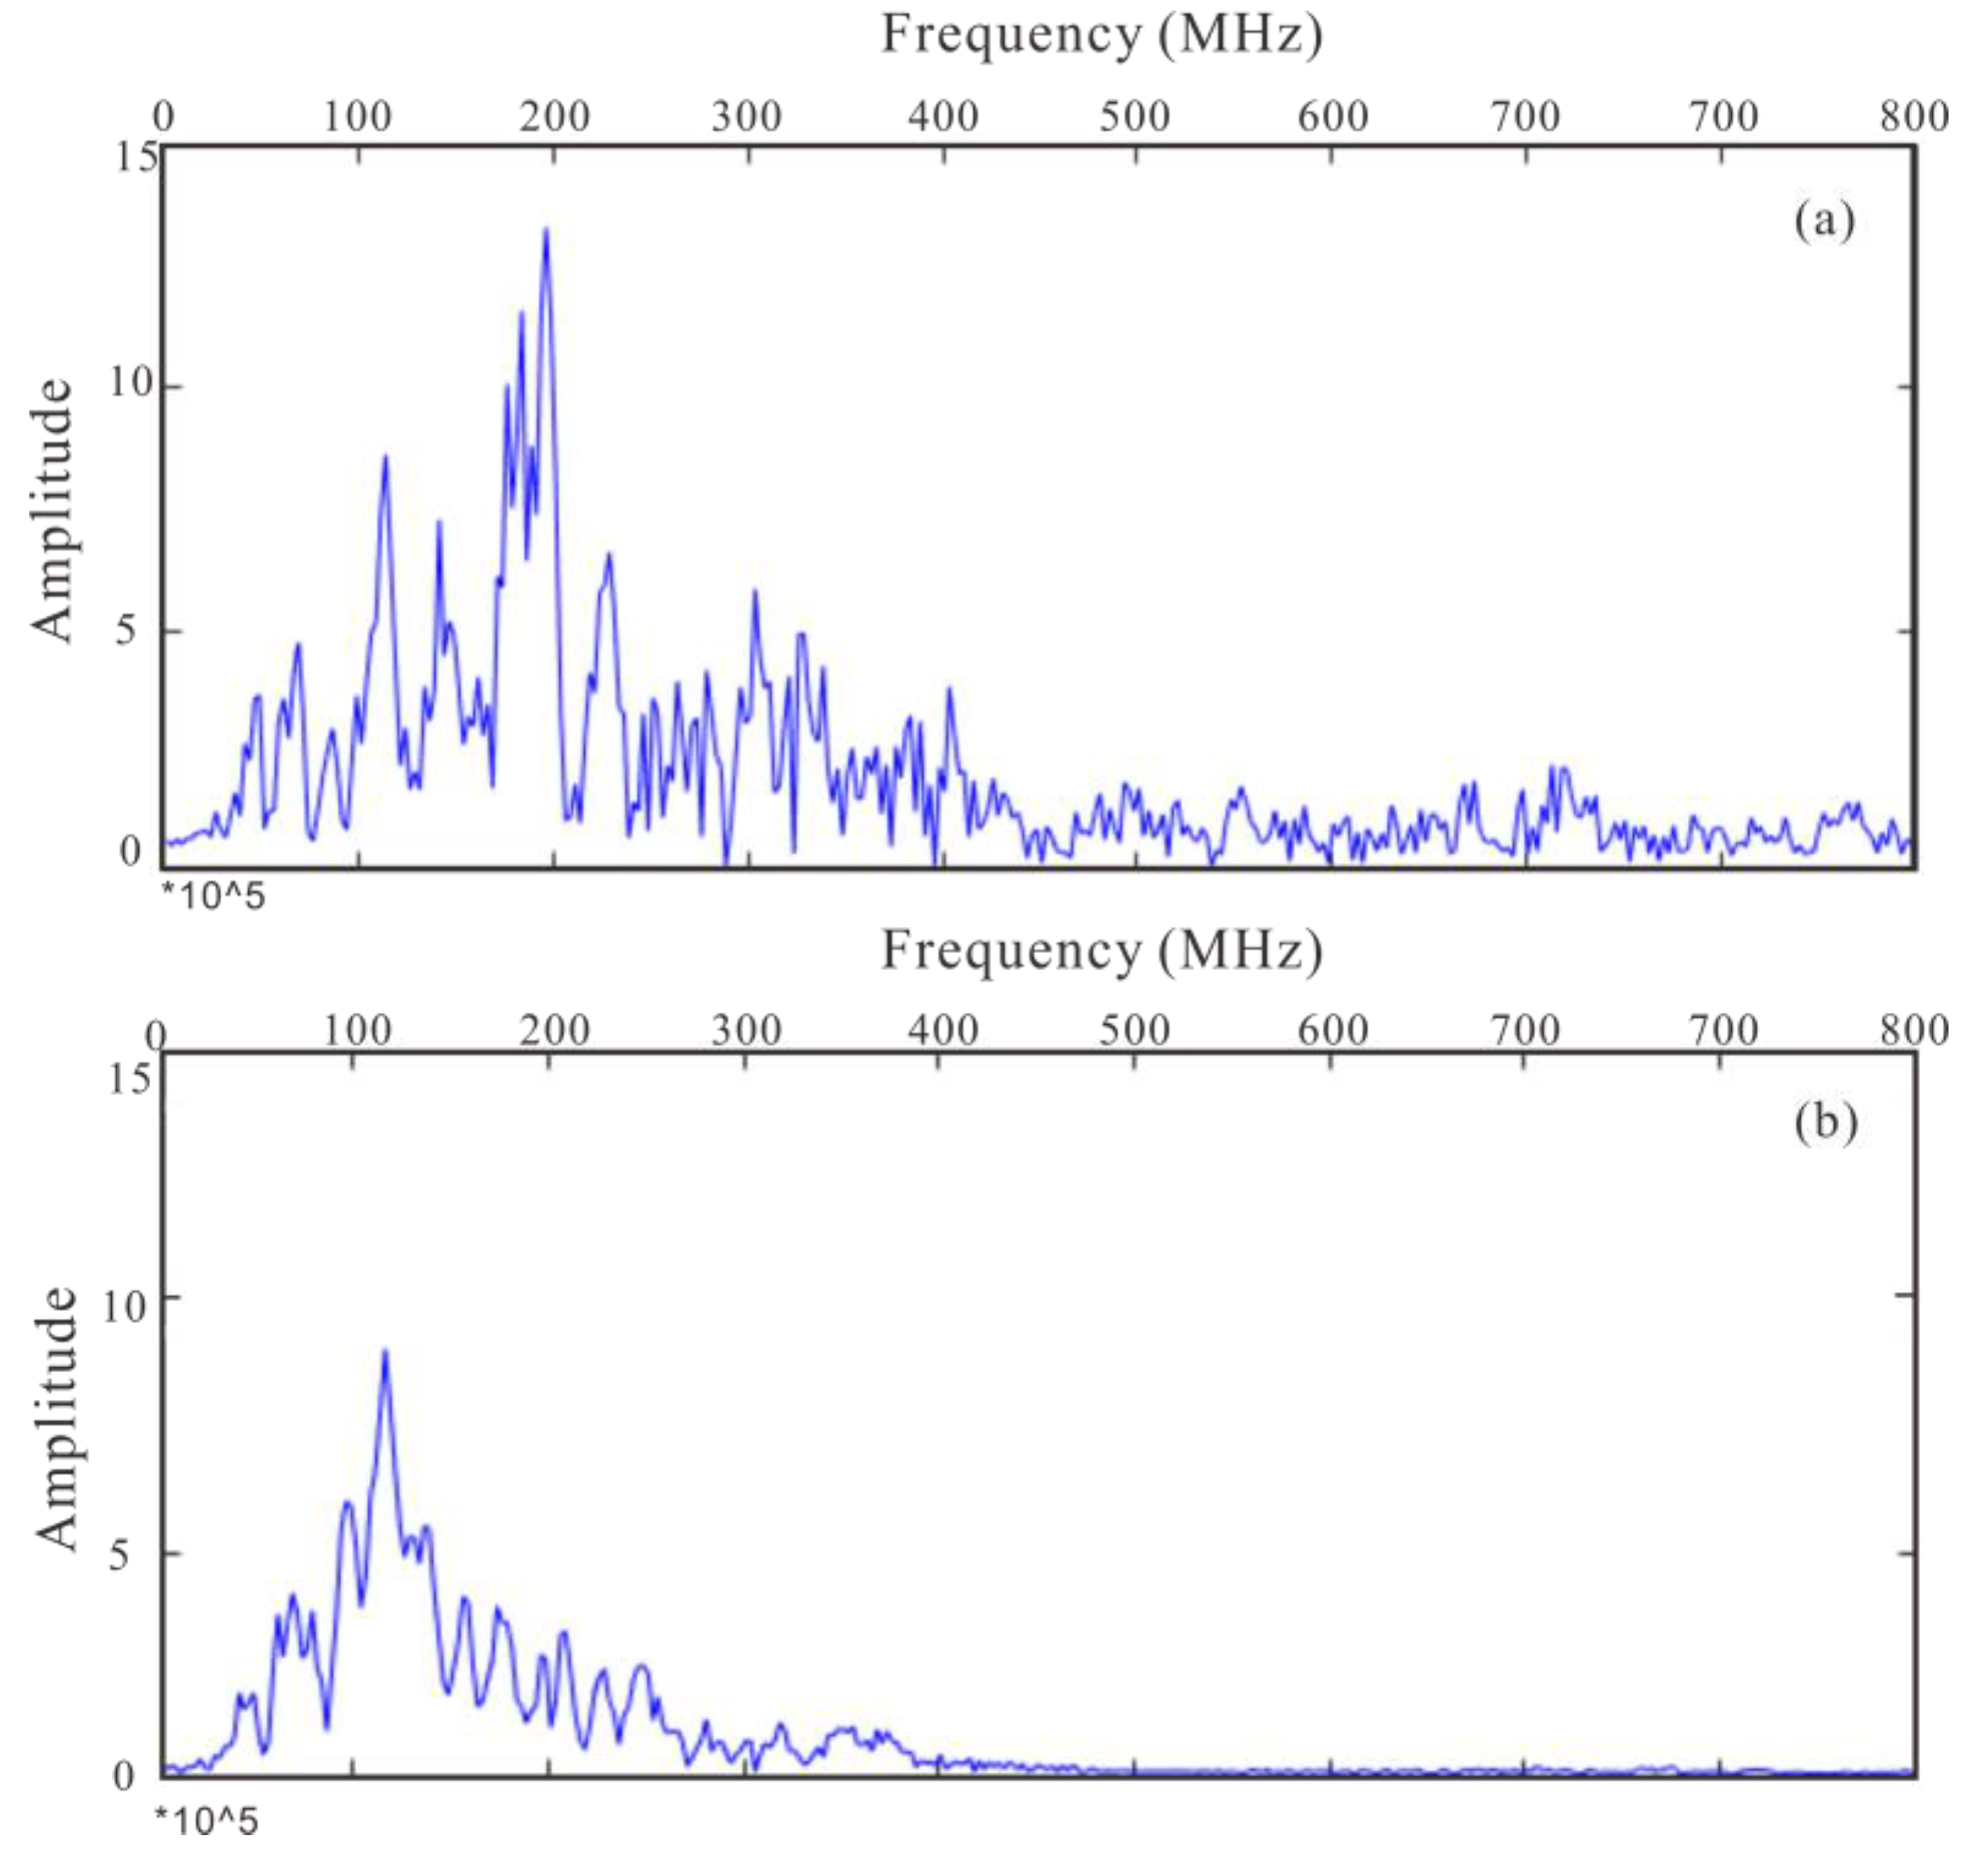
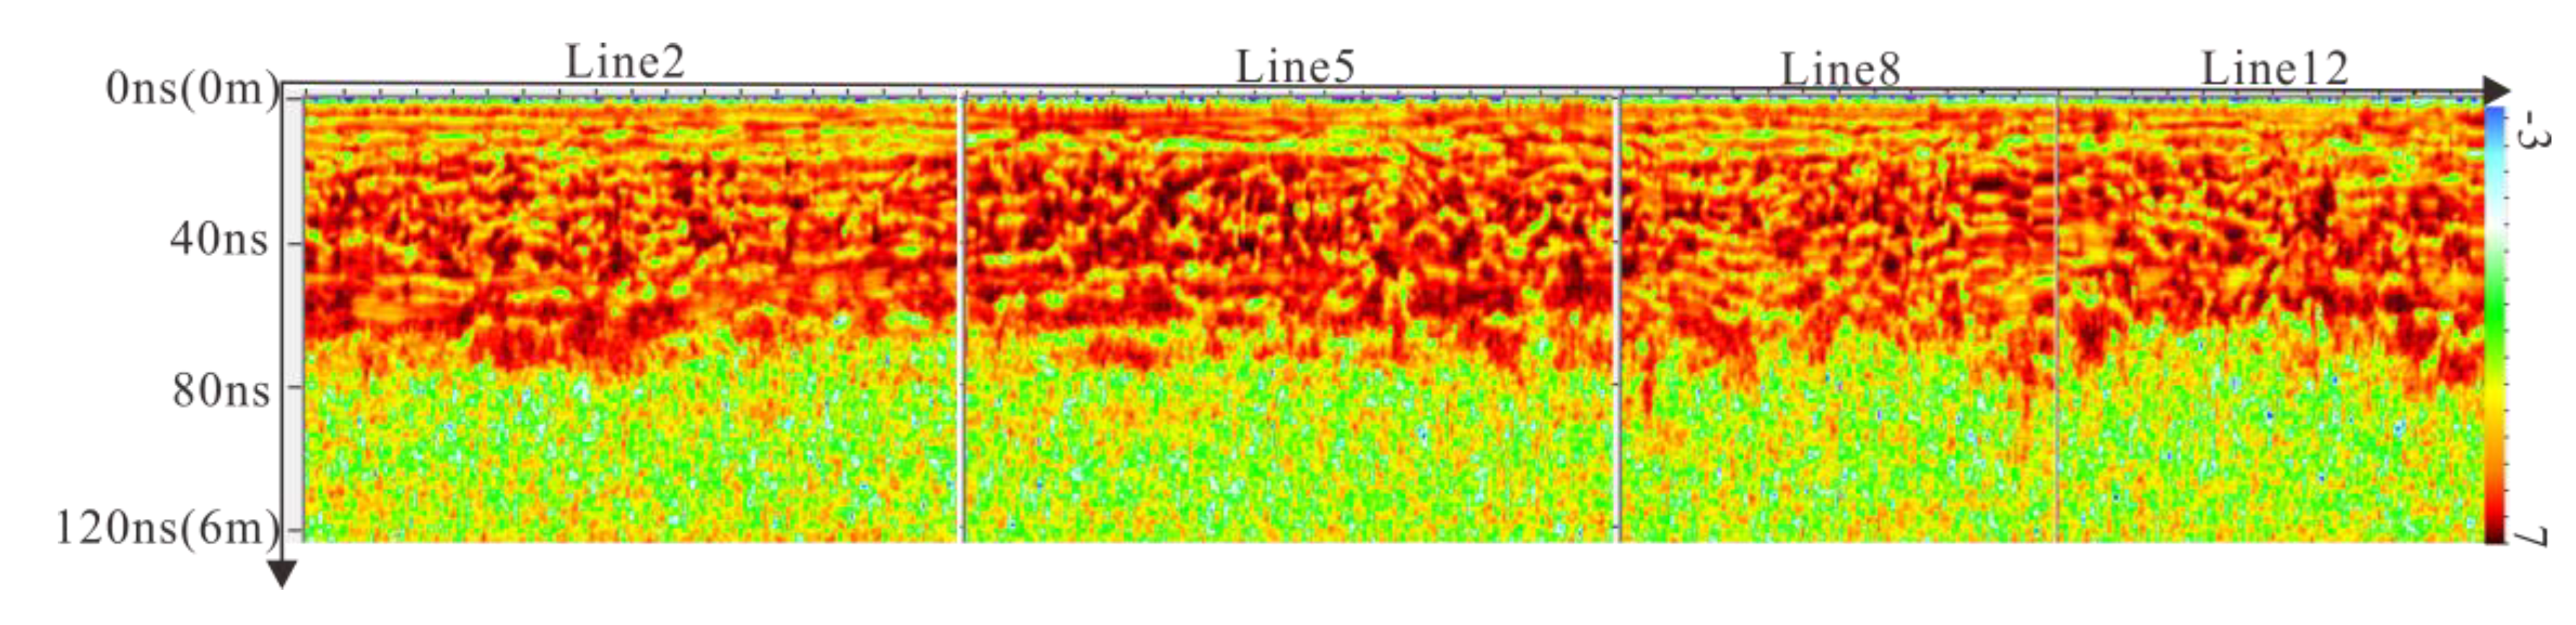
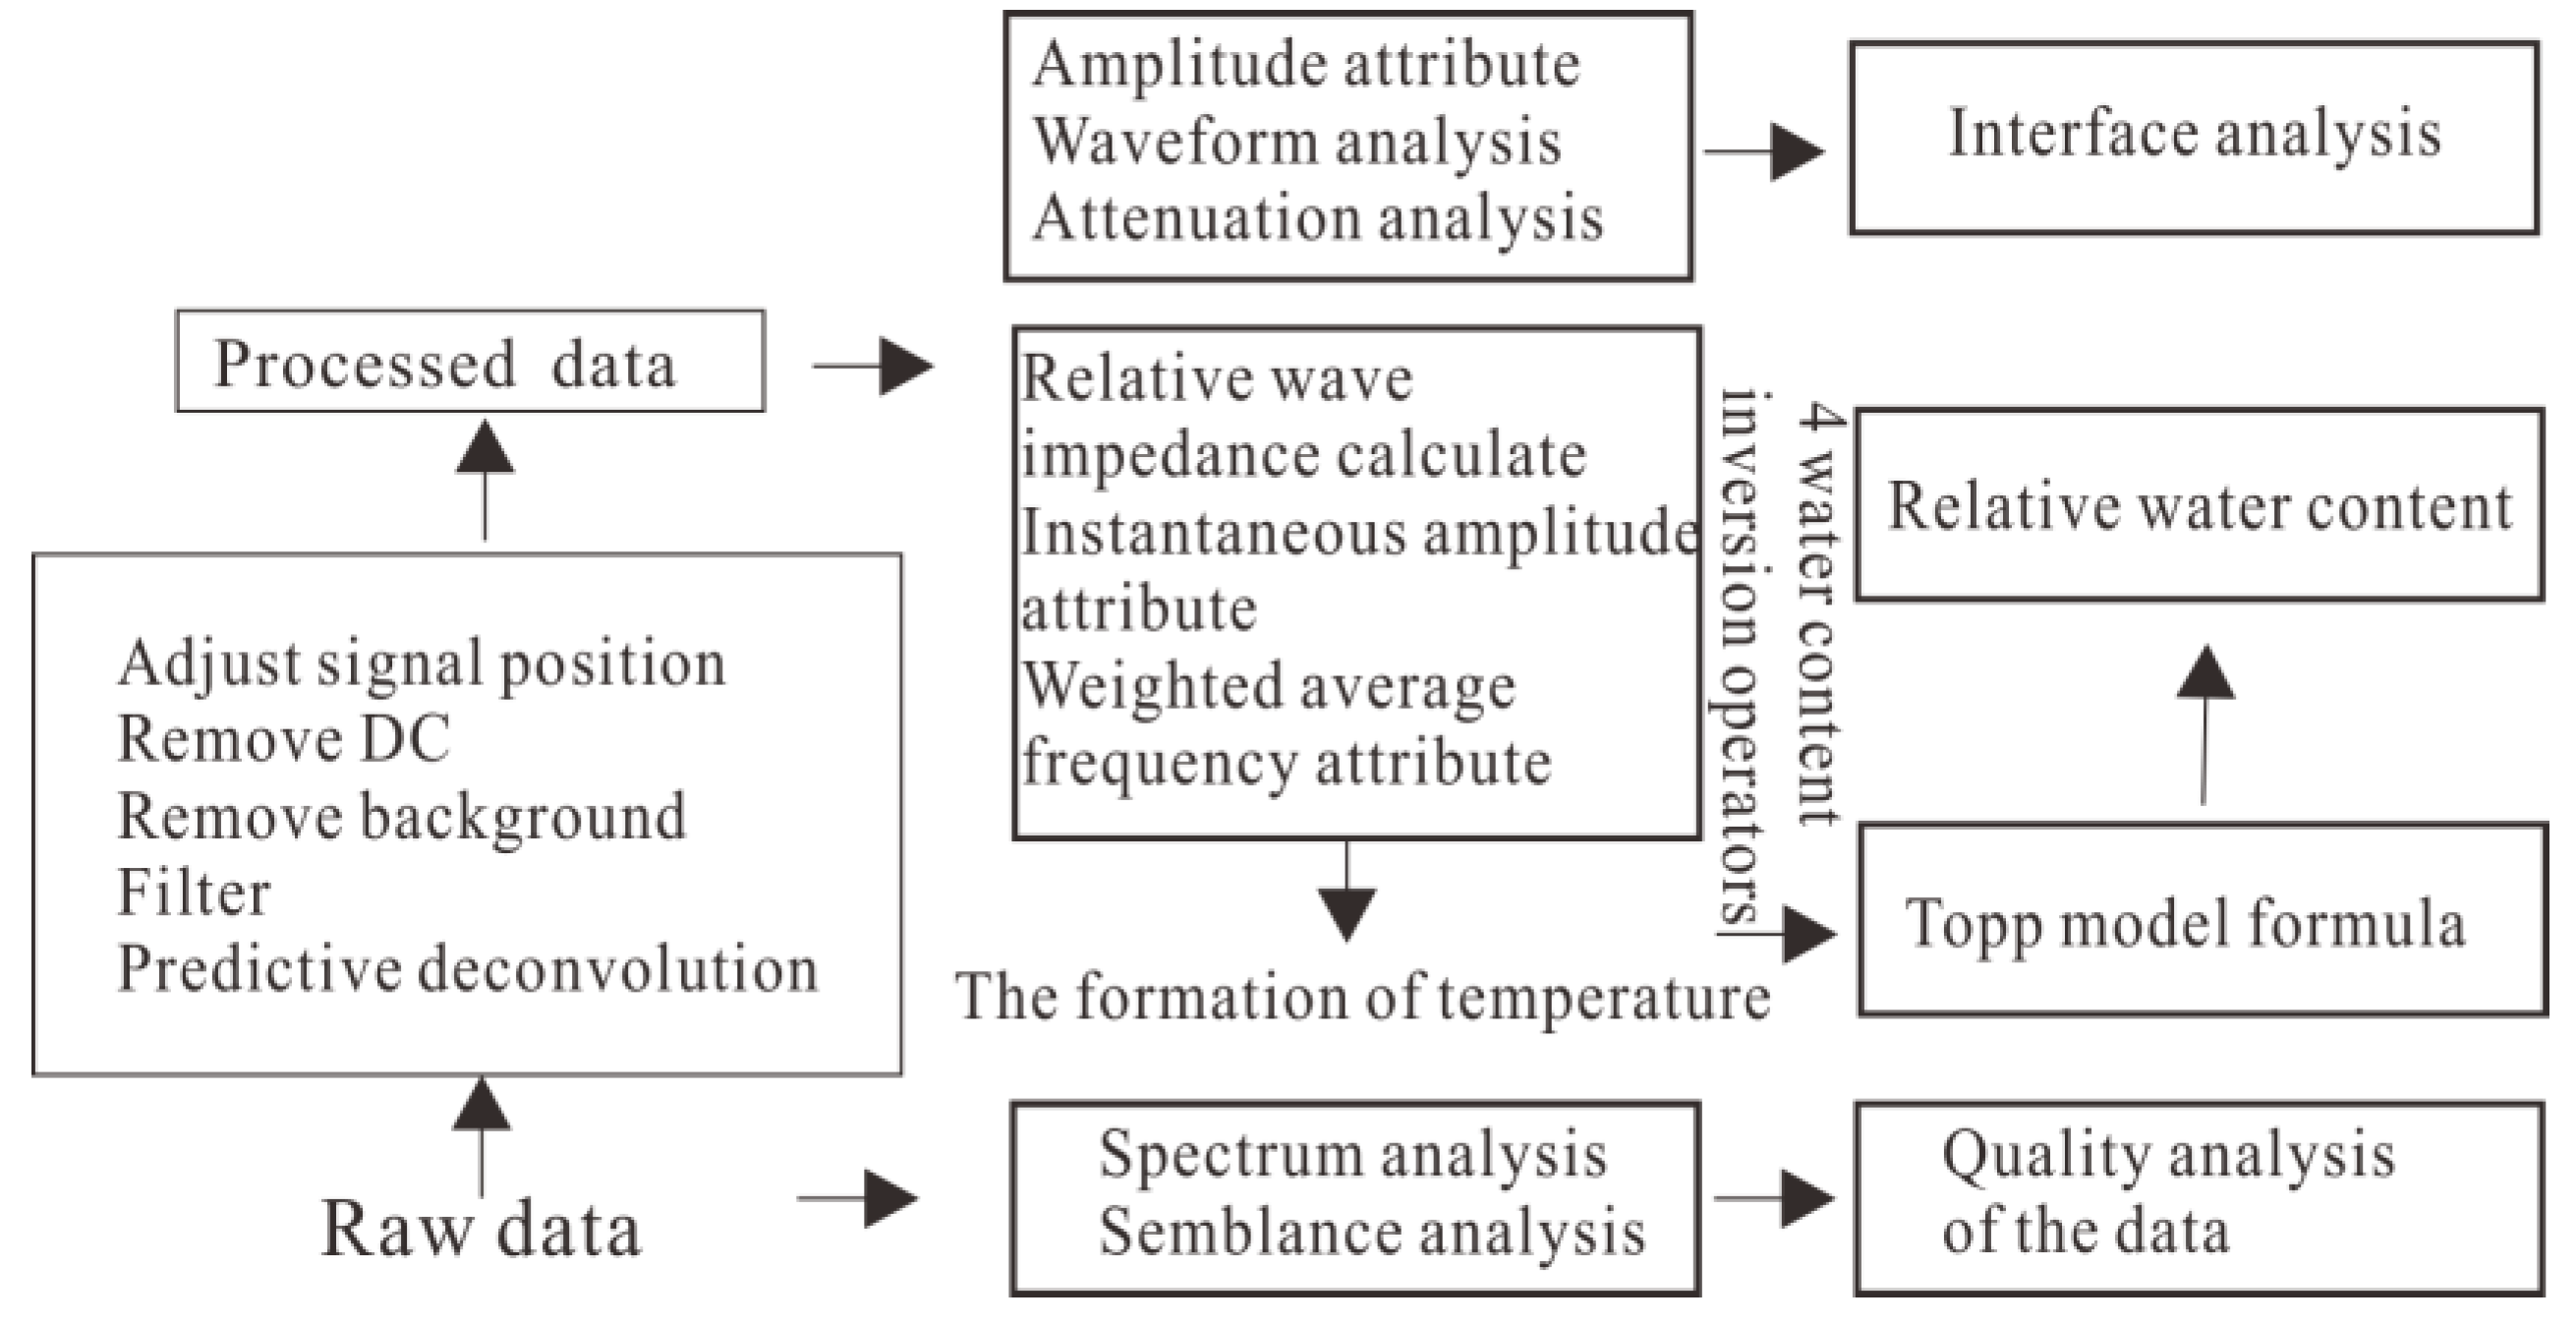
2.3. Experimental Data Processing
3. Data Analysis and Discussion
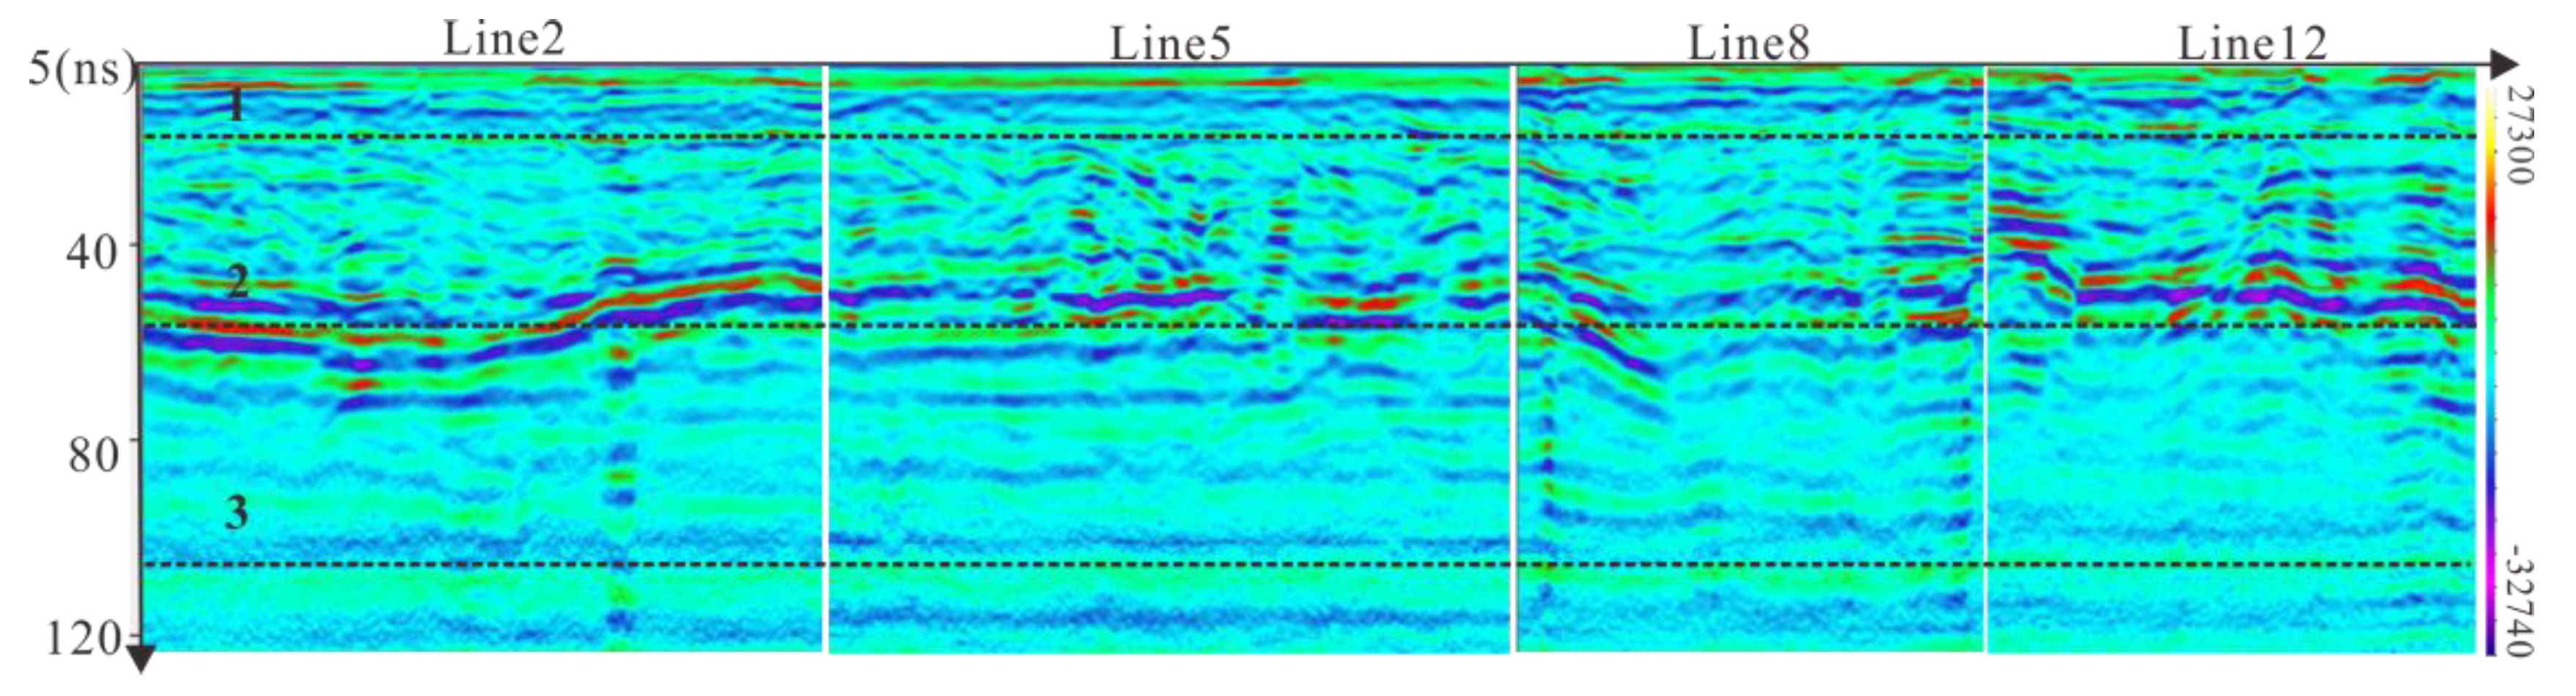
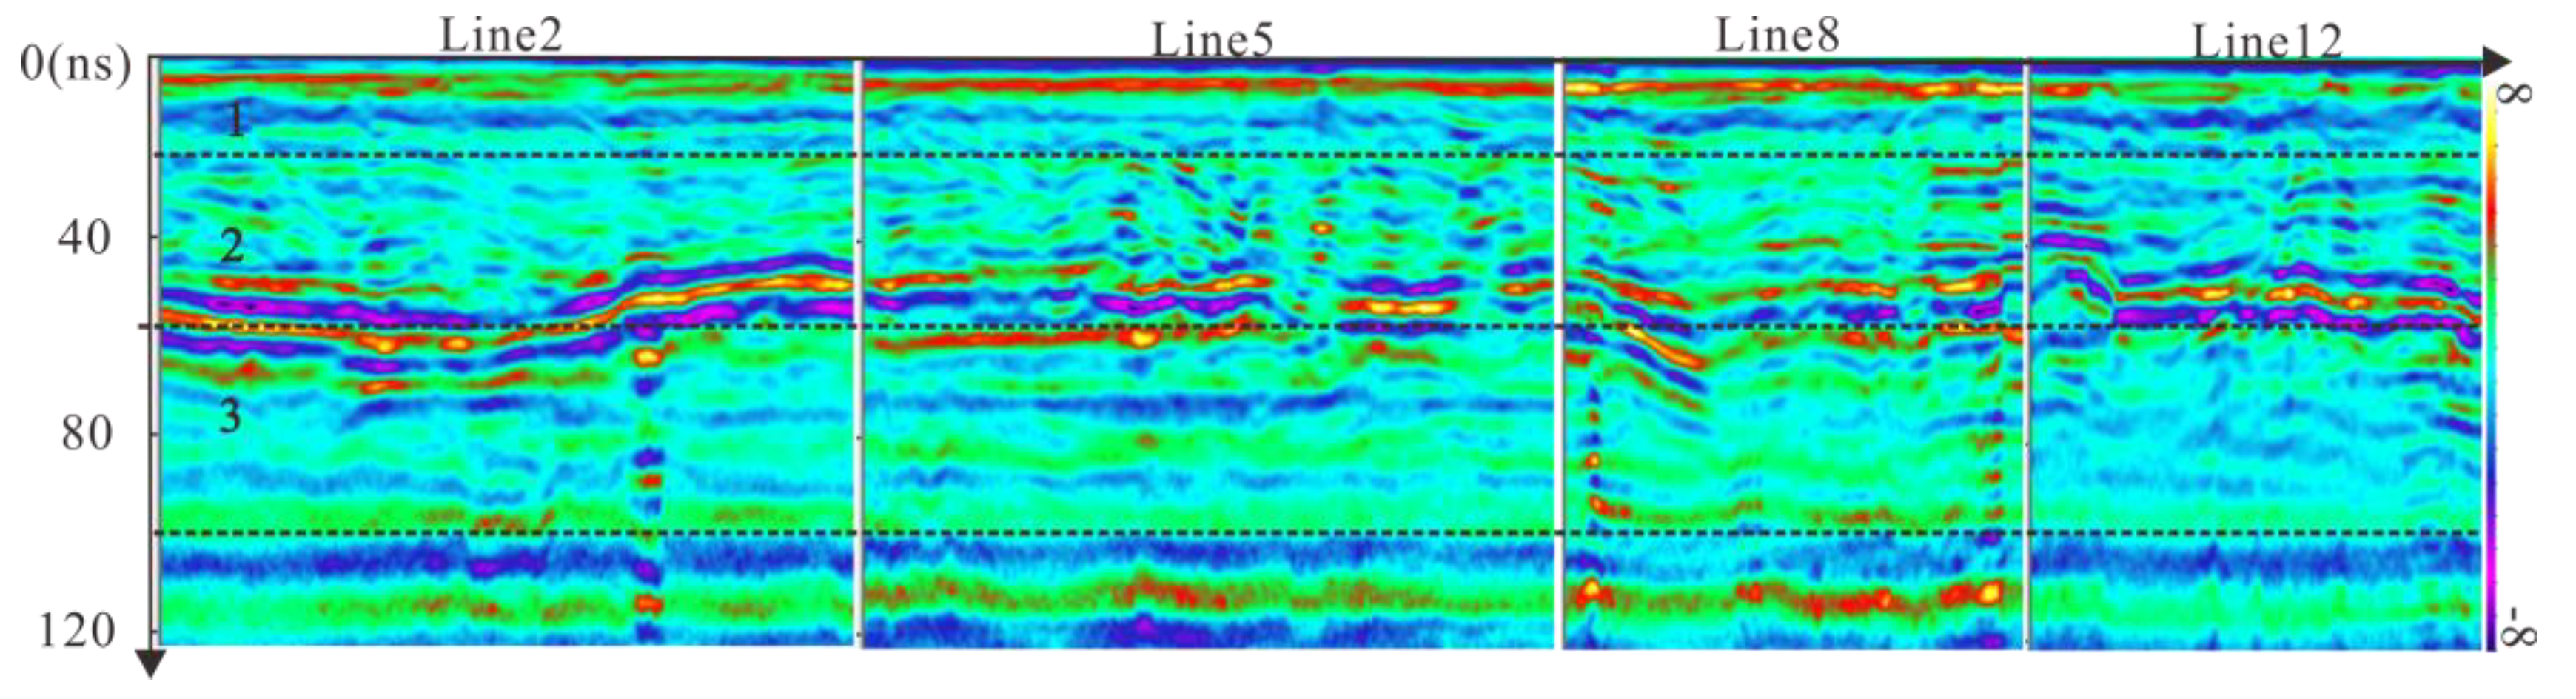
3.1. Frozen Soil Layered Description
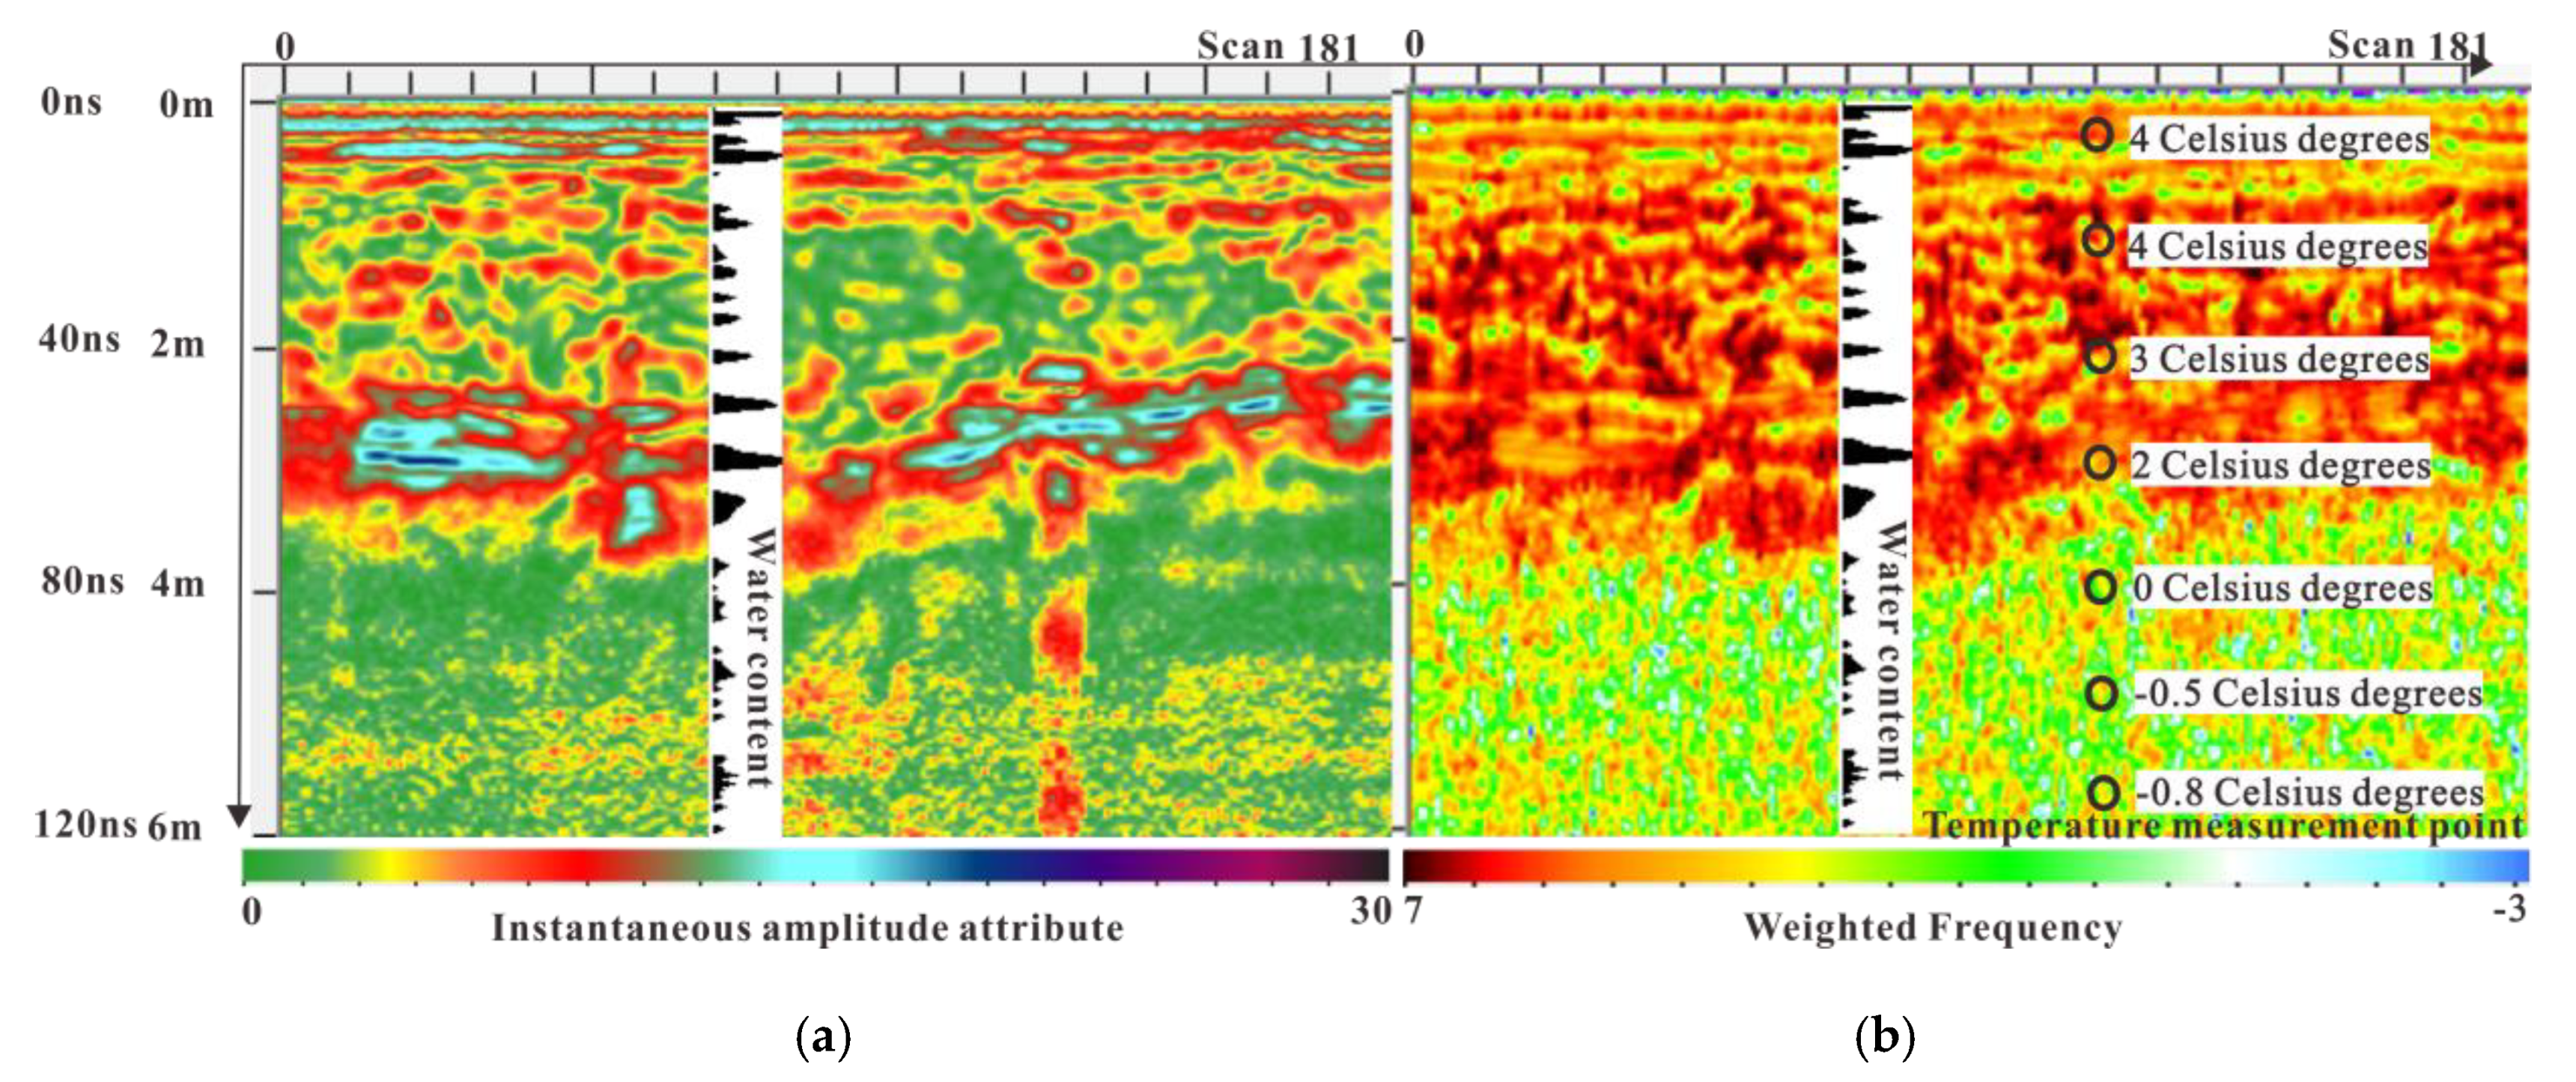
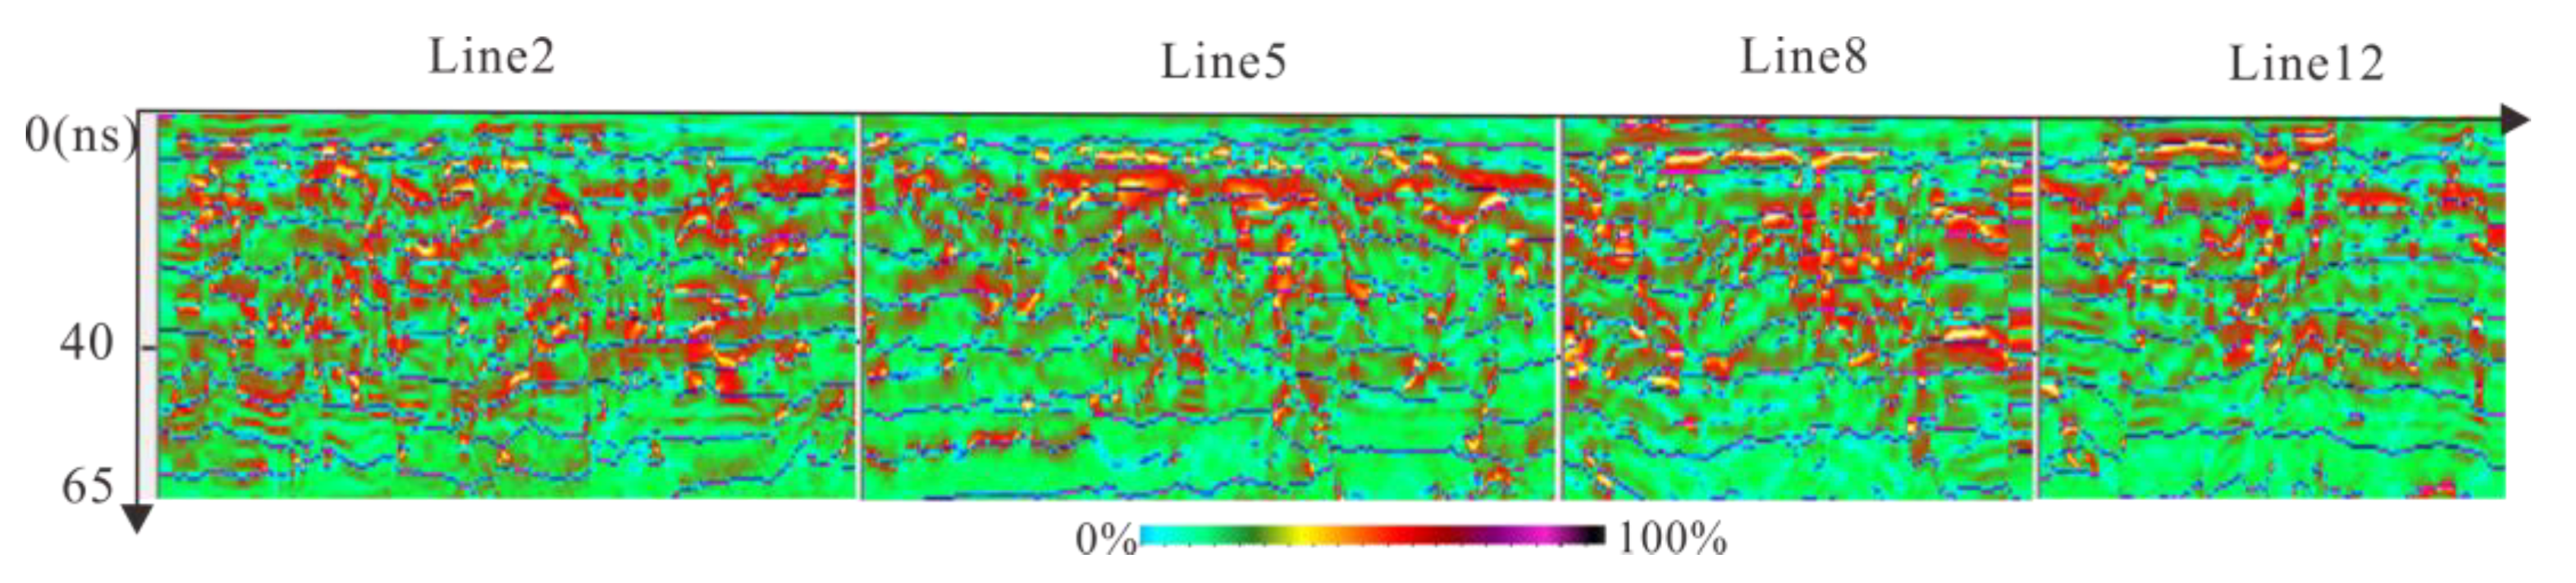
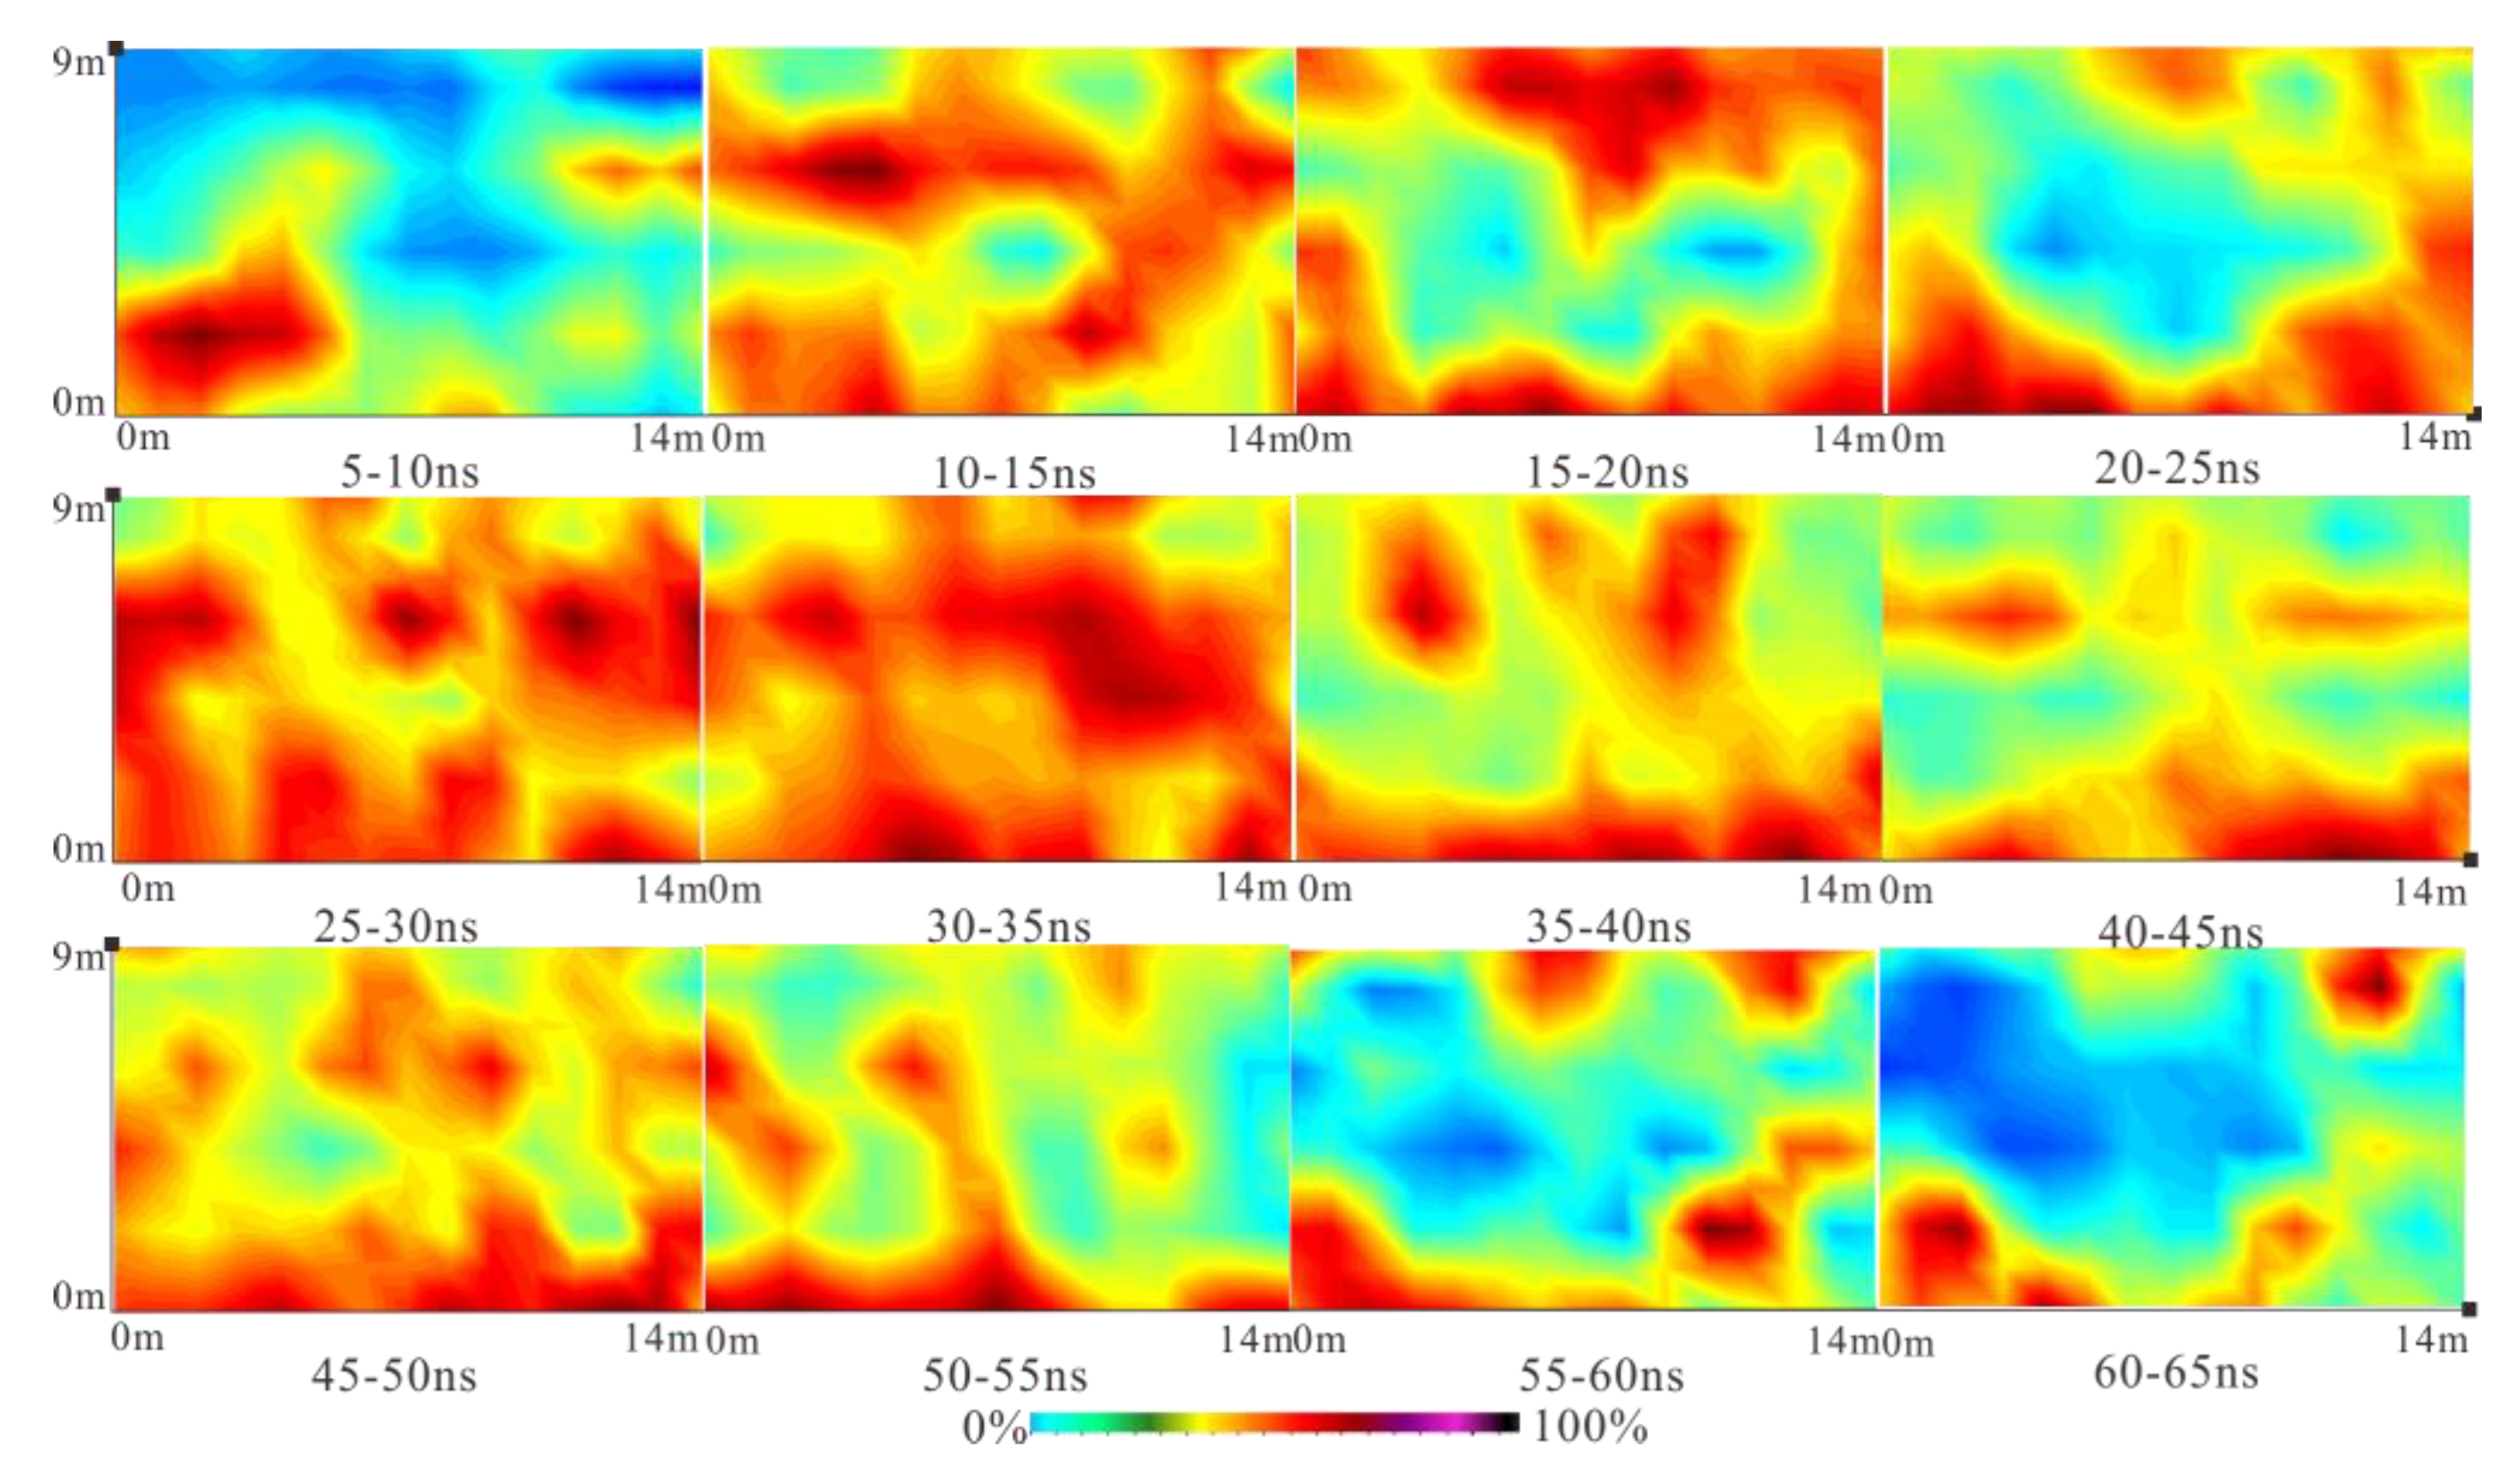
3.2. Relative Water Content and Temperature Calculation
4. Conclusions
Author Contributions
Funding
Acknowledgments
Conflicts of Interest
References
- Zhou, Y.W.; Guo, D.X.; Qiu, G.Q. Geocryology in China; Beijing Science Press: Beijing, China, 2000; pp. 5–35. [Google Scholar]
- Niu, F.J.; Lin, Z.H.; Liu, H.; Xu, Z.Y. Characteristics of Roadbed Settlement in Embankment-Bridge Transition Section along the Qinghai–Tibet Railway in Permafrost Regions. Cold Reg. Sci. Technol. 2001, 65, 437–445. [Google Scholar] [CrossRef]
- Wang, S.L. Discussion on the Degradation of Frozen Soil and the Problem of Frozen Soil Environment in the Qinghai-Tibet Plateau. In Proceedings of the Fifth National Glacier and Frozen Soil Conference, Lanzhou, China; 1996; pp. 11–17. [Google Scholar]
- Wu, Q.B.; Dong, X.F.; Liu, Y.Z. Response Analysis of Permafrost along the Qinghai-Tibet Highway to Climate Change and Engineering Impact. Glacier 2005, 27, 50–54. [Google Scholar]
- Jin, H.J.; Zhao, L.; Wang, S.L.; Jin, R. Characteristics and Degradation Modes of Frozen Soil Along the Qinghai-Tibet Highway. Chin. Sci. Bull. D Earth Sci. 2006, 11, 1009–1019. [Google Scholar]
- Davis, J.L.; Annan, A.P. Ground Penetrating Radar for High Resolution Mapping of Soil and Rock Stratigraphy. Geophys. Prospect. 1989, 37, 531–551. [Google Scholar] [CrossRef]
- Luo, J. Study on instability and susceptibility evaluation of frozen soil slope in Qinghai-Tibet Engineering Corrido. PhD Thesis, Chinese Academy of Sciences, Lanzhou, China, 2015. [Google Scholar]
- Arcone, S.A.; Lawson, D.E.; Delaney, A.J. Ground-Penetrating Radar Reflection Profiling of Groundwater and Bedrock in An Area of Discontinuous Permafrost. Geophysics 1998, 63, 1573–1584. [Google Scholar] [CrossRef]
- Arcone, S.A.; Prentice, M.L.; Delaney, A.J. Stratigraphic Profiling with Ground-Penetrating Radar in Permafrost: A Review of Possible Analogs for Mars. J. Geophys. Res. 2002, 107, 1–14. [Google Scholar] [CrossRef]
- Xiao, J.; Liu, L. Signal Fusion Using Extrapolation with Deterministic Deconvolution on Multi-Frequency Qinghai-Tibet Railway GPR Data for Permafrost Subgrade Detection. In Proceedings of the 15th International Conference On Ground Penetrating, Radar, Brussels, Belgium, 30 June—4 July 2014; pp. 586–589. [Google Scholar]
- Robert, C. Time—Domain Reflectometry Method and Its Application for Measuring Moisture Content in Po Rous. Mater. Meas. 2009, 42, 329–336. [Google Scholar]
- Weiler, K.W.; Teenhuis, T.S.; Kung, K.S. Comparison of Ground Penetrating Radar and Time Domain Reflectometry as Soil Water Sensors. Soil Sci. 1998, 62, 1237–1239. [Google Scholar] [CrossRef]
- Grote, K.H.; Ubbard, S.; Rubin, Y. Field -Scale Estimation of Volumetric Water Content Using Ground Penetrating Radar Ground Wave Techniques. Water Resour. Res. 2003, 39, 1–13. [Google Scholar] [CrossRef]
- Huisman, J.A.; Sperl, C.; Bouten, W. Soil Water Content Measurements at Different Scales: Accuracy of Time Domain Reflectometry and Ground Penetrating Radar. J. Hydrol. 2001, 245, 48–58. [Google Scholar] [CrossRef]
- Shen, Y.P.; Zuo, R.; Liu, J.K. Characterization and Evaluation of Permafrost Thawing Using GPR Attributes in The Qinghai-Tibet Plateau. Cold Reg. Sci. Technol. 2018, 151, 302–313. [Google Scholar] [CrossRef]
- Zhao, L.; Cheng, G.; Li, S. Thawing and Freezing Processes of Active Layer in Wudaoliang Region of Tibetan Plateau. Chin. Sci. Bull. 2000, 45, 2181–2186. [Google Scholar] [CrossRef]
- Zhao, W.K.; Forte, E.; Pipan, M.; Tian, G. Ground Penetrating Radar (GPR) Attribute Analysis for Archaeological Prospection. J. Appl. Geophys. 2014, 97, 107–117. [Google Scholar] [CrossRef]
- Hinkel, K.M.; Doolittle, J.A.; Bockheim, J.G.; Nelson, F.E.; Paetzold, R.; Kimble, J.M.; Travis, R. Detection of Subsurface Permafrost Features with Ground-Penetrating Radar, Barrow, Alaska. Permafr. Periglac. Process. 2001, 12, 179–190. [Google Scholar] [CrossRef]
- Liu, L.B.; Qian, R.Y. Ground Penetrating Radar: A Critical Tool in Near-Surface Geophysics. Chin. J. Geophys. 2015, 58, 2606–2617. [Google Scholar]
- Tzanis, A. matGPR Release 2: A Freeware MATLAB Package for The Analysis & Interpretation of Common and Single Offset GPR Data. Fast Times 2010, 15, 17–43. [Google Scholar]
- Rahmani, A.; Belmokhtar, A.; Murineddu, A.; Khazanehdari, J.; English, J.; Roumane, H.; Godfrey, B. The Art of Seismic Conversion-An Example from Erg Chouiref Algeria. SEG Tech. Program Expand. Abstr. 2006, 25, 264–268. [Google Scholar]
- Maser, K.R. Ground Penetrating Radar Surveys to Characterize Pavement Layer Thickness Variations at GPS Sites; Report; Strategic Highway Research Program National Research Council: Washington, DC, USA, 1994; p. 397. [Google Scholar]
- Loughlin, P.J. Comments on the interpretation of instantaneous frequency. IEEE Signal Process Lett. 1997, 4, 123–125. [Google Scholar] [CrossRef]
- Topp, G.C.; Davis, J.L.; Annan, A.P. Electromagnetic Determination of Soil Water Content: Measurements in Coaxial Transmission Lines. Water Resour. Res. 1980, 16, 574–582. [Google Scholar] [CrossRef]


© 2019 by the authors. Licensee MDPI, Basel, Switzerland. This article is an open access article distributed under the terms and conditions of the Creative Commons Attribution (CC BY) license (http://creativecommons.org/licenses/by/4.0/).
Share and Cite
Wang, Q.; Shen, Y. Calculation and Interpretation of Ground Penetrating Radar for Temperature and Relative Water Content of Seasonal Permafrost in Qinghai-Tibet Platea. Electronics 2019, 8, 731. https://doi.org/10.3390/electronics8070731
Wang Q, Shen Y. Calculation and Interpretation of Ground Penetrating Radar for Temperature and Relative Water Content of Seasonal Permafrost in Qinghai-Tibet Platea. Electronics. 2019; 8(7):731. https://doi.org/10.3390/electronics8070731
Chicago/Turabian StyleWang, Qing, and Yupeng Shen. 2019. "Calculation and Interpretation of Ground Penetrating Radar for Temperature and Relative Water Content of Seasonal Permafrost in Qinghai-Tibet Platea" Electronics 8, no. 7: 731. https://doi.org/10.3390/electronics8070731
APA StyleWang, Q., & Shen, Y. (2019). Calculation and Interpretation of Ground Penetrating Radar for Temperature and Relative Water Content of Seasonal Permafrost in Qinghai-Tibet Platea. Electronics, 8(7), 731. https://doi.org/10.3390/electronics8070731