Intermittent Renewable Energy Sources: The Role of Energy Storage in the European Power System of 2040


Abstract
1. Introduction
1.1. Changes in the Spread of Photovoltaic and Wind Energy Technologies in the World
1.2. Energy Challenges with the Spread of Variable Renewable Energy Sources
1.3. The Importance of Energy Storage Systems and their Future Role
1.4. European Electricity Consumption and Energy Storage Aspects
2. Material and Methods
2.1. Description of the ENTSO-E Scenarios
2.2. European Energy Storage Case Studies for VRE Integration
3. Results
3.1. Determination of the European Storage Fractions
3.2. Determination of the European Storage Power Capacity
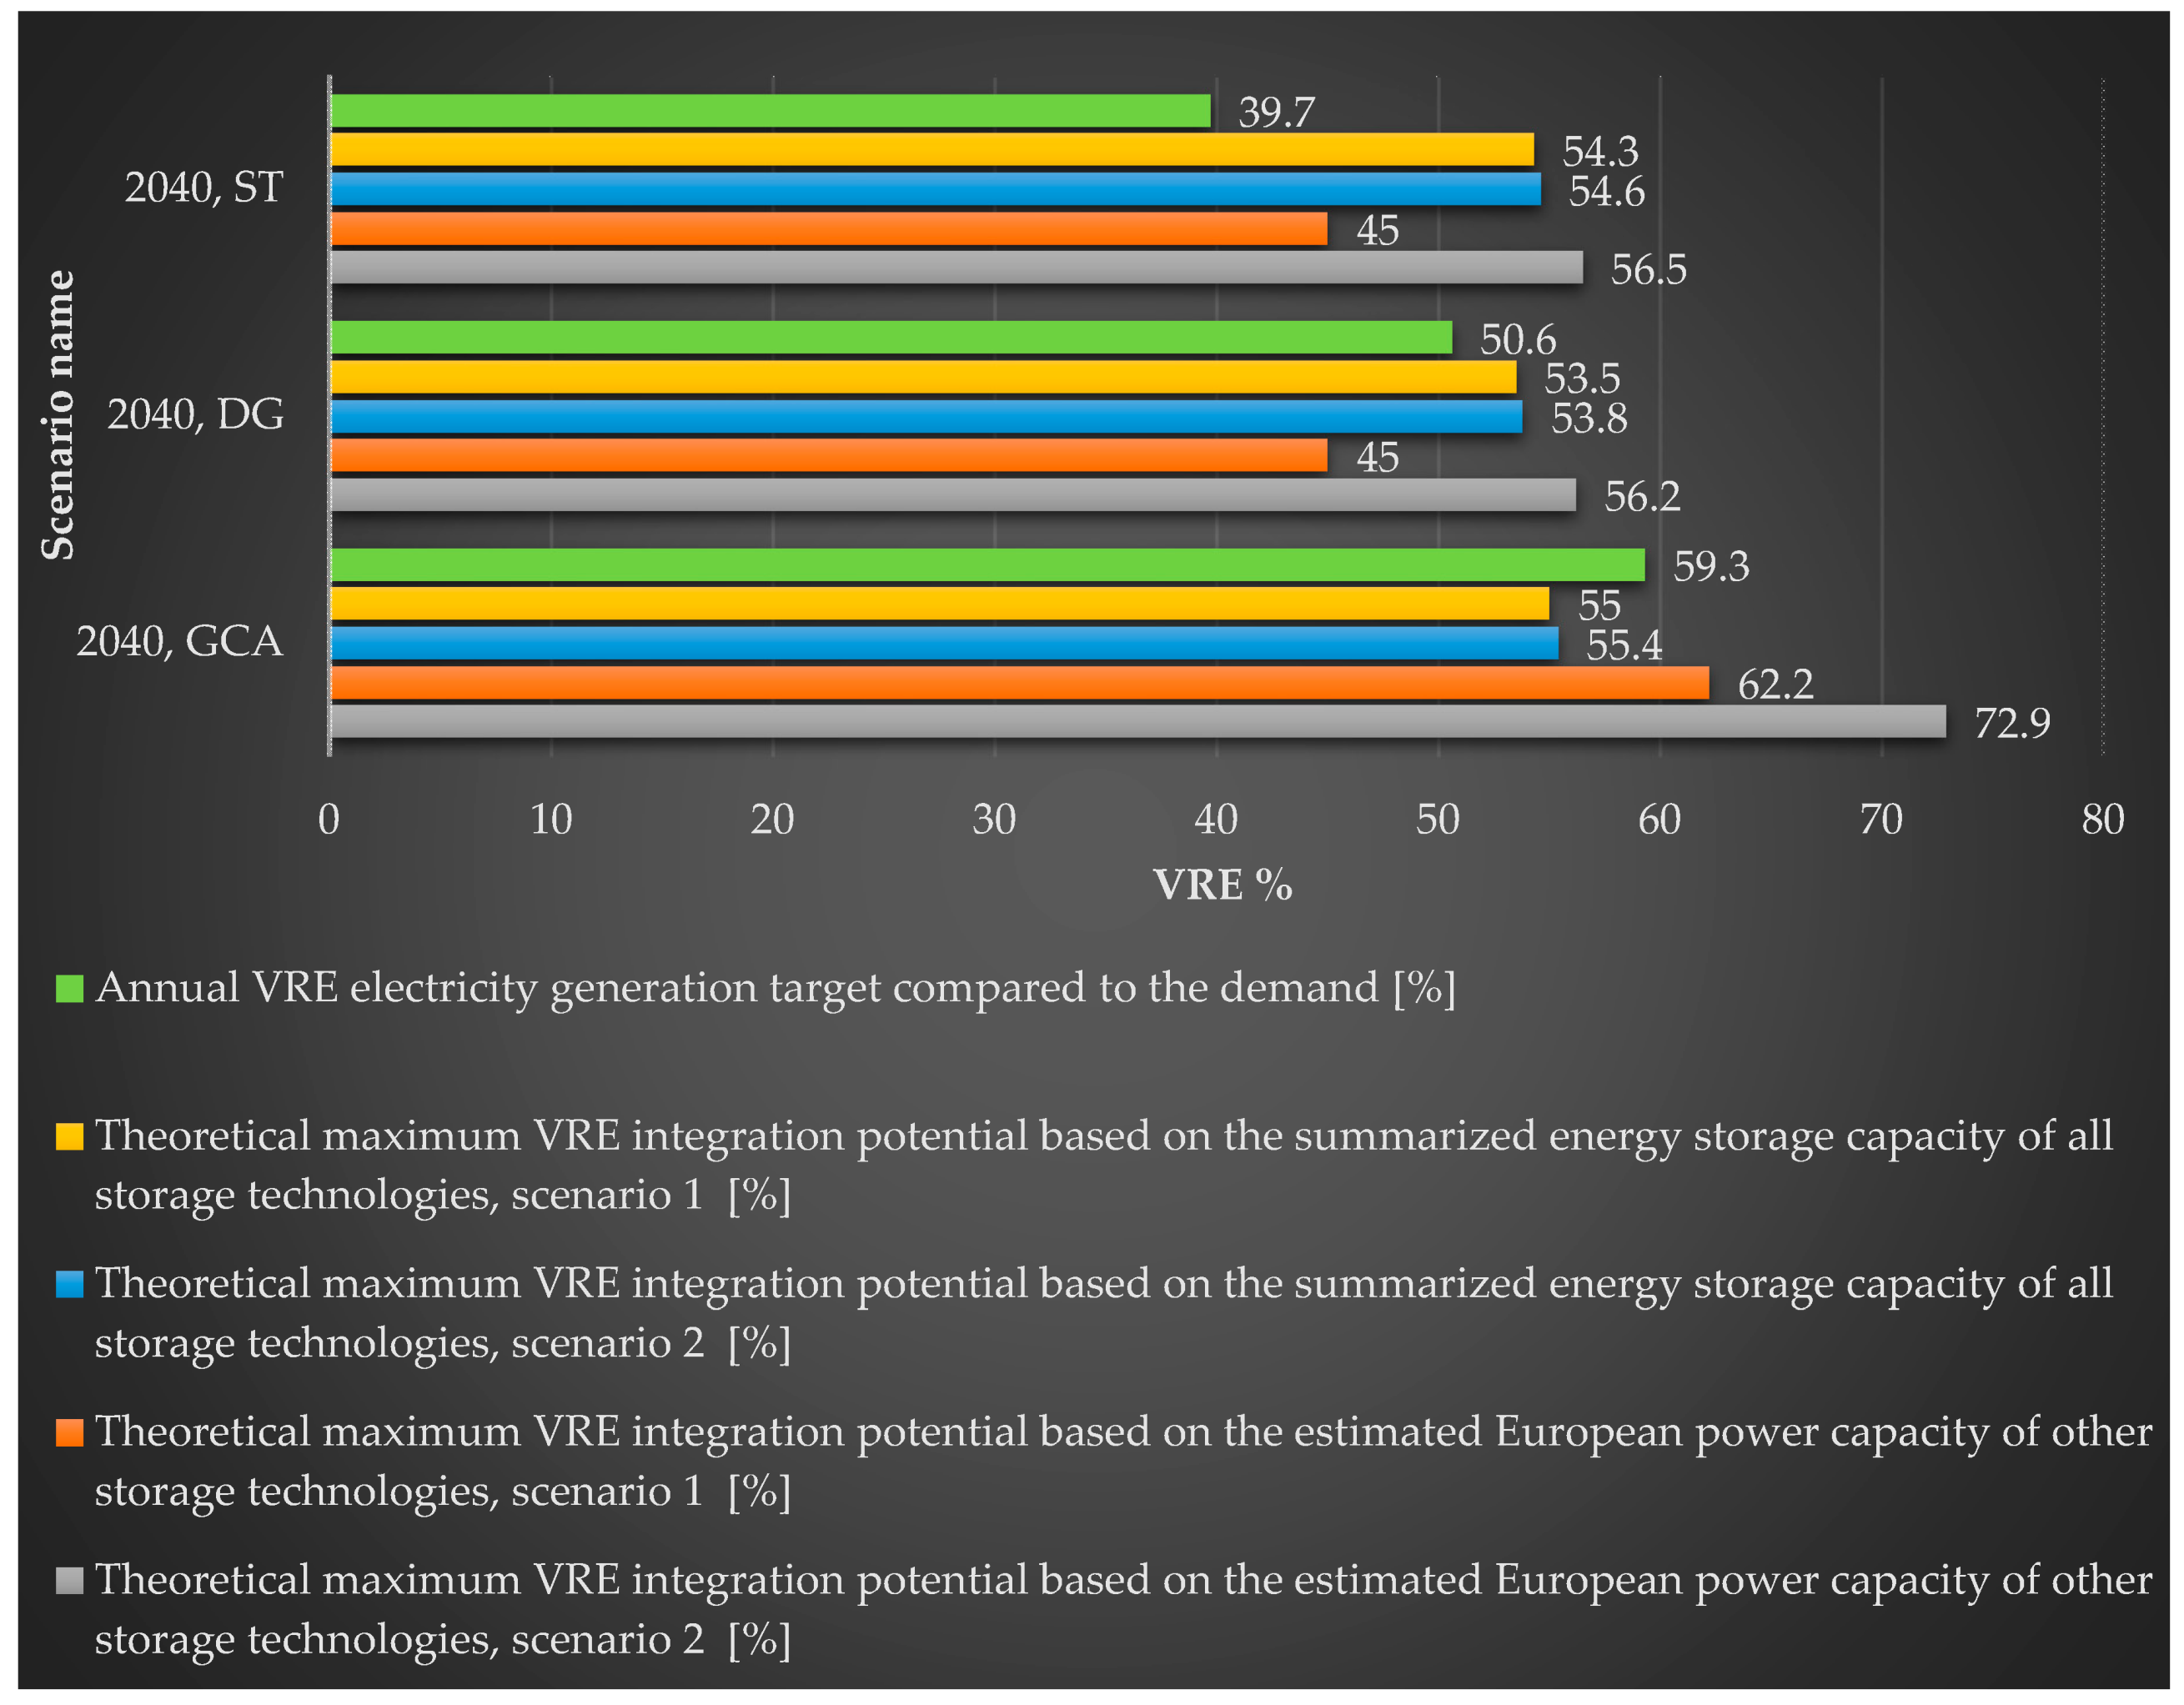
3.3. European Variable Renewable Energy Integration Possibilities
4. Conclusions
Author Contributions
Acknowledgments
Conflicts of Interest
Abbreviations
| CAES | Compressed air energy storage (-) |
| CF | Capacity Factor (%) |
| DG | Distributed Generation (-) |
| EU | European Union (-) |
| FES | Flywheel energy storage (-) |
| JRC-IDEES | Integrated Database of the European Energy Sector (-) |
| GCA | Global Climate Action (-) |
| GHG | Greenhouse gas (-) |
| NGC | Net generating capacity (-) |
| PHS | Pumped hydro storage (-) |
| PV | Photovoltaic (-) |
| RES | Renewable energy sources (-) |
| ST | Sustainable Transition (-) |
| SMES | Superconducting magnetic energy storage (-) |
| T&D | Transmission and distribution (-) |
| TES | Thermal energy storage (-) |
| RES | Renewable electricity sources (-) |
| UPS | Uninterruptable power supply |
| VRE | Variable renewable energy (-) |
References
- Zafar, R.; Mahmood, A.; Razzaq, S.; Ali, W.; Naeem, U.; Shehzad, K. Prosumer based energy management and sharing in smart grid. Renew. Sustain. Energy Rev. 2018, 82, 1675–1684. [Google Scholar] [CrossRef]
- Zame, K.K.; Brehm, C.A.; Nitica, A.T.; Richard, C.L.; Schweitzer, G.D., III. Smart grid and energy storage: Policy recommendations. Renew. Sustain. Energy Rev. 2018, 82, 1646–1654. [Google Scholar] [CrossRef]
- Kordmahaleh, A.A.; Naghashzadegan, M.; Javaherdeh, K.; Khoshgoftar, M. Design of a 25 MWe Solar Thermal Power Plant in Iran with Using Parabolic Trough Collectors and a Two-Tank Molten Salt Storage System. Int. J. Photoenergy 2017, 2017, 4210184. [Google Scholar] [CrossRef]
- Noman, A.M.; Addoweesh, K.E.; Alolah, A.I. Simulation and Practical Implementation of ANFIS-Based MPPT Method for PV Applications Using Isolated Ćuk Converter. Int. J. Photoenergy 2017, 2017, 3106734. [Google Scholar] [CrossRef]
- Daliento, S.; Chouder, A.; Guerriero, P.; Pavan, A.M.; Mellit, A.; Moeini, R.; Tricoli, P. Monitoring, Diagnosis, and Power Forecasting for Photovoltaic Fields: A Review. Int. J. Photoenergy 2017, 2017, 1356851. [Google Scholar] [CrossRef]
- Cucchiella, F.; D’Adamo, I. A Multicriteria Analysis of Photovoltaic Systems: Energetic, Environmental, and Economic Assessments. Int. J. Photoenergy 2015, 2015, 627454. [Google Scholar] [CrossRef]
- D’Adamo, I.; Miliacca, M.; Rosa, P. Economic Feasibility for Recycling of Waste Crystalline Silicon Photovoltaic Modules. Int. J. Photoenergy 2017, 2017, 4184676. [Google Scholar] [CrossRef]
- Fathima, A.H.; Palanisamy, K. Energy Storage Systems for Energy Management of Renewables in Distributed Generation Systems. In Energy Management of Distributed Generation Systems; InTech: London, UK, 2016. [Google Scholar]
- Sandia National Laboratories. DOE Global Energy Storage Database. Available online: https://www.energystorageexchange.org/projects/data_visualization (accessed on 2 March 2019).
- International Renewable Energy Agency. Electricity Storage and Renewables: Costs and Markets to 2030; International Renewable Energy Agency: Abu Dhabi, UAE, 2017. [Google Scholar]
- Gimeno-Gutiérrez, M.; Lacal-Arántegui, R. Assessment of the European potential for pumped hydropower energy storage based on two existing reservoirs. Renew. Energy 2015, 75, 856–868. [Google Scholar] [CrossRef]
- The Conversation Trust (UK) Limited. As Nuclear Power Plants Close, States Need to Bet Big on Energy Storage. Available online: https://theconversation.com/as-nuclear-power-plants-close-states-need-to-bet-big-on-energy-storage-62032 (accessed on 26 September 2018).
- Schill, W.-P. Residual load, renewable surplus generation and storage requirements in Germany. Energy Policy 2014, 73, 65–79. [Google Scholar] [CrossRef]
- Luo, X.; Wang, J.; Dooner, M.; Clarke, J. Overview of current development in electrical energy storage technologies and the application potential in power system operation. Appl. Energy 2015. [Google Scholar] [CrossRef]
- Fraunhofer Institute for Solar Energy Systems ISE. Annual Report 2016/2017; Fraunhofer institute for solar energy systems ISE: Freiburg, Germany, 2017; pp. 1–88. [Google Scholar]
- Zsiborács, H.; Pályi, B.; Pintér, G.; Popp, J.; Balogh, P.; Gabnai, Z.; Pető, K.; Farkas, I.; Baranyai, N.H.; Bai, A. Technical-economic study of cooled crystalline solar modules. Sol. Energy 2016, 140. [Google Scholar] [CrossRef]
- Renewables 2018 Global Status Report—REN21; REN21: Paris, France, 2018.
- Enjavi-Arsanjani, M.; Hirbodi, K.; Yaghoubi, M. Solar Energy Potential and Performance Assessment of CSP Plants in Different Areas of Iran. Energy Procedia 2015, 69, 2039–2048. [Google Scholar] [CrossRef]
- Statista, I. Cumulative Solar Photovoltaic Capacity Globally as of 2017, by Select Country (in Gigawatts). Available online: https://www.statista.com/statistics/264629/existing-solar-pv-capacity-worldwide/ (accessed on 12 September 2018).
- European Commission. Energy Storage—The Role of Electricity; European Commission: Brussels, Belgium, 2017.
- Rodríguez, R.A.; Becker, S.; Andresen, G.B.; Heide, D.; Greiner, M. Transmission needs across a fully renewable European power system. Renew. Energy 2014, 63, 467–476. [Google Scholar] [CrossRef]
- Bertsch, J.; Growitsch, C.; Lorenczik, S.; Nagl, S. Flexibility in Europe’s power sector—An additional requirement or an automatic complement? Energy Econ. 2016, 53, 118–131. [Google Scholar] [CrossRef]
- Cho, A. Energy’s tricky tradeoffs. Science 2010, 329, 786–787. [Google Scholar] [CrossRef] [PubMed]
- Jacobson, M.Z.; Delucchi, M.A. Providing all global energy with wind, water, and solar power, Part I: Technologies, energy resources, quantities and areas of infrastructure, and materials. Energy Policy 2011, 39, 1154–1169. [Google Scholar] [CrossRef]
- Delucchi, M.A.; Jacobson, M.Z. Providing all global energy with wind, water, and solar power, Part II: Reliability, system and transmission costs, and policies. Energy Policy 2011, 39, 1170–1190. [Google Scholar] [CrossRef]
- Czisch, G. Szenarien zur Zukünftigen Stromversorgung, Kostenoptimierte Variationen zur Versorgung Europas und Seiner Nachbarn mit Strom aus Erneuerbaren Energien. Ph.D. Thesis, Universitat Kassel, Kassel, Germany, 2005. [Google Scholar]
- ENTSO-E. TYNDP 2018—Scenario Report. Available online: https://tyndp.entsoe.eu/tyndp2018/scenario-report/ (accessed on 12 April 2019).
- Czisch, G.; Giebel, G. Realisable Scenarios for a Future Electricity Supply Based 100% on Renewable Energies in: Energy Solutions for Sustainable Development : Proceedings of the Risø International Energy Conference 2007; [...took place 22–24 May 2007]; Risø National Laboratory: Roskilde, Denmark, 2007; ISBN 9788755036031. [Google Scholar]
- Kempton, W.; Pimenta, F.M.; Veron, D.E.; Colle, B.A. Electric power from offshore wind via synoptic-scale interconnection. Proc. Natl. Acad. Sci. USA 2010, 107, 7240–7245. [Google Scholar] [CrossRef]
- Schaber, K.; Steinke, F.; Hamacher, T. Transmission grid extensions for the integration of variable renewable energies in Europe: Who benefits where? Energy Policy 2012, 43, 123–135. [Google Scholar] [CrossRef]
- Schaber, K.; Steinke, F.; Mühlich, P.; Hamacher, T. Parametric study of variable renewable energy integration in Europe: Advantages and costs of transmission grid extensions. Energy Policy 2012, 42, 498–508. [Google Scholar] [CrossRef]
- Widen, J. Correlations Between Large-Scale Solar and Wind Power in a Future Scenario for Sweden. IEEE Trans. Sustain. Energy 2011, 2, 177–184. [Google Scholar] [CrossRef]
- Aboumahboub, T.; Schaber, K.; Tzscheutschler, P.; Hamacher, T. Optimal Configuration of a Renewable-based Electricity Supply Sector. WSEAS Trans. POWER Syst. 2010, 5, 120–129. [Google Scholar]
- Yao, R.; Steemers, K. A method of formulating energy load profile for domestic buildings in the UK. Energy Build. 2005, 37, 663–671. [Google Scholar] [CrossRef]
- Heide, D.; von Bremen, L.; Greiner, M.; Hoffmann, C.; Speckmann, M.; Bofinger, S. Seasonal optimal mix of wind and solar power in a future, highly renewable Europe. Renew. Energy 2010, 35, 2483–2489. [Google Scholar] [CrossRef]
- Heide, D.; Greiner, M.; von Bremen, L.; Hoffmann, C. Reduced storage and balancing needs in a fully renewable European power system with excess wind and solar power generation. Renew. Energy 2011, 36, 2515–2523. [Google Scholar] [CrossRef]
- Rasmussen, M.G.; Andresen, G.B.; Greiner, M. Storage and balancing synergies in a fully or highly renewable pan-European power system. Energy Policy 2012, 51, 642–651. [Google Scholar] [CrossRef]
- Hedegaard, K.; Meibom, P. Wind power impacts and electricity storage—A time scale perspective. Renew. Energy 2012, 37, 318–324. [Google Scholar] [CrossRef]
- Argyrou, M.C.; Christodoulides, P.; Kalogirou, S.A. Energy storage for electricity generation and related processes: Technologies appraisal and grid scale applications. Renew. Sustain. Energy Rev. 2018, 94, 804–821. [Google Scholar] [CrossRef]
- PANNON Pro Innovations Ltd. Practical Experiences of PV and Storage Systems. Available online: https://klimainnovacio.hu/en/pannon-pro-innovations (accessed on 2 February 2018).
- Entso-E. Statistics and Data—Electricity in Europe. Available online: https://www.entsoe.eu/publications/statistics-and-data/ (accessed on 11 April 2019).
- Union of the Electricity Industry–EURELECTRIC. Hydro in Europe: Powering Renewables Full Report; EURELECTRIC: Brussels, Belgium, 2011. [Google Scholar]
- Mantzos, L.; Matei, N.A.; Mulholland, E.; Rózsai, M.; Tamba, M.; Wiesenthal, T. Joint Research Centre Data Catalogue, JRC-IDEES 2015. Available online: http://data.jrc.ec.europa.eu/dataset/jrc-10110-10001 (accessed on 11 March 2019).
- International Hydropower Association. Pumped Storage Tracking Tool. Available online: https://www.hydropower.org/hydropower-pumped-storage-tool (accessed on 19 December 2018).
- International Hydropower Association. Hydropower Status Report, 2018; International Hydropower Association: London, UK, 2018. [Google Scholar]
- European Academies Science Advisory Council. ea sac Science Advice for the Benefit of Europe Valuing Dedicated Storage in Electricity Grids; European Academies Science Advisory Council: Halle (Saale), Germany, 2017. [Google Scholar]
- Blanco, H.; Faaij, A. A review at the role of storage in energy systems with a focus on Power to Gas and long-term storage. Renew. Sustain. Energy Rev. 2018, 81, 1049–1086. [Google Scholar] [CrossRef]
- ENTSO-E. Europe Power System 2040: Completing the Map & Assessing the Cost of Non-Grid. Available online: https://tyndp.entsoe.eu/tyndp2018/power-system-2040/ (accessed on 12 April 2019).
- Cebulla, F.; Haas, J.; Eichman, J.; Nowak, W.; Mancarella, P. How much electrical energy storage do we need? A synthesis for the U.S., Europe, and Germany. J. Clean. Prod. 2018, 181, 449–459. [Google Scholar] [CrossRef]
- European Commission. Roadmap 2050: A practical Guide to a Prosperous, Low- Carbon Europe; European Climate Foundation (ECF): AM Den Haag, The Netherlands, 2010.
- Kondziella, H.; Bruckner, T. Flexibility requirements of renewable energy based electricity systems—A review of research results and methodologies. Renew. Sustain. Energy Rev. 2016, 53, 10–22. [Google Scholar] [CrossRef]
- Agora Energiewende. Stromspeicher in der Energiewende; Agora Energiewende: Berlin, Germany, 2014. [Google Scholar]
- Fraunhofer Institute for Solar Energy Systems. Roadmap Speicher—Speicherbedarf für Erneuerbare Energien Speicheralternativen—Speicheranreiz—Überwindung rechtlicher Hemmnisse; Endbericht: Freiburg, Germany, 2014. [Google Scholar]
- D5.2—SPAIN, Overview of Current Status and Future Development Scenarios of the Electricity System, and Assessment of the Energy Storage Needs; stoRE: Munich, Germany, 2013.
- de Boer, H.S.; Grond, L.; Moll, H.; Benders, R. The application of power-to-gas, pumped hydro storage and compressed air energy storage in an electricity system at different wind power penetration levels. Energy 2014, 72, 360–370. [Google Scholar] [CrossRef]
- Inage, S. Prospects for Large-Scale Energy Storage in Decarbonised Power Grids; International Energy Agency: Paris, France, 2009. [Google Scholar]
- Strbac, G.; Aunedi, M.; Pudjianto, D.; Djapic, P.; Teng, F.; Sturt, A.; Jackravut, D.; Sansom, R.; Yufit, V.; Brandon, N. Strategic Assessment of the Role and Value of Energy Storage Systems in the UK Low Carbon Energy Future; Imperial College London: London, UK, 2012. [Google Scholar]
- Power System Overview and RES Integration, Ireland; stoRE: Munich, Germany, 2013.
- Overview of the Electricity Supply System and an Estimation of Future Energy Storage Needs, Germany; stoRE: Munich, Germany, 2013.
- Ludig, S.; Haller, M.; Schmid, E.; Bauer, N. Fluctuating renewables in a long-term climate change mitigation strategy. Energy 2011, 36, 6674–6685. [Google Scholar] [CrossRef]
- D5.1—GREECE, Overview of the Electricity System Status and its Future Development Scenarios—Assessment of the Energy Storage Infrastructure Needs; stoRE: Munich, Germany, 2013.
- Assessment of the Future Energy Storage Needs of Austria for Integration of Variable RES-E Generation, Deliverable 5.1—Austria; stoRE: Munich, Germany, 2013.
- Pfenninger, S.; Keirstead, J. Renewables, nuclear, or fossil fuels? Scenarios for Great Britain’s power system considering costs, emissions and energy security. Appl. Energy 2015, 152, 83–93. [Google Scholar] [CrossRef]
- Belderbos, A.; Delarue, E.; D’haeseleer, W. Possible role of power-to-gas in future energy systems. In Proceedings of the 2015 12th International Conference on the European Energy Market (EEM), Lisbon, Portugal, 19–22 May 2015; pp. 1–5. [Google Scholar]
- Overview of Current Status and Future Development Scenarios of the Electricity System in Denmark—Allowing Integration of Large Quantities of Wind Power; stoRE: Munich, Germany, 2013.
- Doetsch, C.; Droste-Franke, B.; Perrin, M. Electric Energy Storage, Future Energy Storage Demand; International Energy Agency: Paris, France, 2015. [Google Scholar]
- Bertuccioli, L.; Chan, A.; Hart, D.; Lehner, F.; Madden, B.; Standen, E. Development of Water Electrolysis in the European Union, Final Report; Fuel cells and hydrogen Joint Undertaking: Lausann, Switzerland; Cambridge, UK, 2014. [Google Scholar]
- Moeller, C.; Meiss, J.; Mueller, B.; Hlusiak, M.; Breyer, C.; Kastner, M.; Twele, J. Transforming the electricity generation of the Berlin–Brandenburg region, Germany. Renew. Energy 2014, 72, 39–50. [Google Scholar] [CrossRef]
- Connolly, D.; Lund, H.; Mathiesen, B.V.; Leahy, M. The first step towards a 100% renewable energy-system for Ireland. Appl. Energy 2011, 88, 502–507. [Google Scholar] [CrossRef]
- Aboumahboub, T.; Schaber, K.; Tzscheutschler, P.; Hamacher, T. Optimization of the utilization of renewable energy sources in the electricity sector. In Proceedings of the EE’10 Proceedings of the 5th IASME/WSEAS International Conference on Energy & Environment, Cambridge, UK, 23–25 February 2010; pp. 196–204. [Google Scholar]
- Krakowski, V.; Assoumou, E.; Mazauric, V.; Maïzi, N. Feasible path toward 40–100% renewable energy shares for power supply in France by 2050: A prospective analysis. Appl. Energy 2016, 171, 501–522. [Google Scholar] [CrossRef]
- Weitemeyer, S.; Kleinhans, D.; Vogt, T.; Agert, C. Integration of Renewable Energy Sources in future power systems: The role of storage. Renew. Energy 2015, 75, 14–20. [Google Scholar] [CrossRef]
- Centre for Alternative Technology. Zero Carbon: Rethinking the Future—Centre for Alternative Technology. Available online: https://www.cat.org.uk/info-resources/zero-carbon-britain/research-reports/zero-carbon-rethinking-the-future/ (accessed on 12 April 2019).
- Anagnostopoulos, J.S.; Papantonis, D.E. Study of pumped storage schemes to support high RES penetration in the electric power system of Greece. Energy 2012, 45, 416–423. [Google Scholar] [CrossRef]
- Sauer, D.U.; Moser, A.; Leuthold, M.; Cai, Z.; Chen, H.; Alvarez, R.; Moos, M.; Thien, T. Storage Demand in a 100%-RES-Power System for Europe with Different PV-Installation Levels. In 28th European Photovoltaic Solar Energy Conference and Exhibition; WIP: Paris, France, 2013; pp. 4261–4265. [Google Scholar]
- Steinke, F.; Wolfrum, P.; Hoffmann, C. Grid vs. storage in a 100% renewable Europe. Renew. Energy 2013, 50, 826–832. [Google Scholar] [CrossRef]
- European Climate Foundation. Roadmap 2050—Technical & Economic Analysis—Full Report. Available online: http://www.roadmap2050.eu/project/roadmap-2050 (accessed on 27 September 2018).
- ENTSO-E. TYNDP 2018 Storage Project Sheets. Available online: https://tyndp.entsoe.eu/tyndp2018/projects/storage_projects (accessed on 1 May 2019).
- International Renewable Energy Agency (IRENA). Renewable Energy Capacity Statistics 2017; IRENA: Abu Dhabi, UAE, 2017. [Google Scholar]


| Year | 2013 | 2014 | 2015 | 2016 | 2017 |
|---|---|---|---|---|---|
| Electricity consumption [tWh] | 3293 | 3241 | 3301 | 3322 | 3329 |
| Maximum peak load [GW] | 516 | 511 | 520 | 546 | 542 |
| Country | Change of Electricity Consumption between 2016 and 2017 in Europe [%] |
|---|---|
| United Kingdom | −3.0 |
| Germany | −1.8 |
| Austria | −1.2 |
| Denmark | −1.1 |
| Latvia | −0.6 |
| France | −0.3 |
| Luxembourg | 0.0 |
| Norway | 0.2 |
| Sweden | 0.2 |
| Netherlands | 0.4 |
| Switzerland | 0.4 |
| Finland | 0.6 |
| Portugal | 0.7 |
| Belgium | 0.8 |
| Ireland | 1.0 |
| Macedonia | 1.1 |
| Greece | 1.2 |
| Spain | 1.2 |
| Estonia | 1.4 |
| Cyprus | 1.6 |
| Bulgaria | 1.9 |
| Serbia | 2.1 |
| Bosnia and Herzegovina | 2.2 |
| Czech Republic | 2.5 |
| Romania | 2.5 |
| Hungary | 2.6 |
| Lithuania | 2.6 |
| Poland | 2.6 |
| Slovenia | 2.8 |
| Croatia | 3.2 |
| Iceland | 3.2 |
| Slovakia | 3.2 |
| Italy | 3.9 |
| Montenegro | 5.6 |
| Albania | no information |
| Turkey | no information |
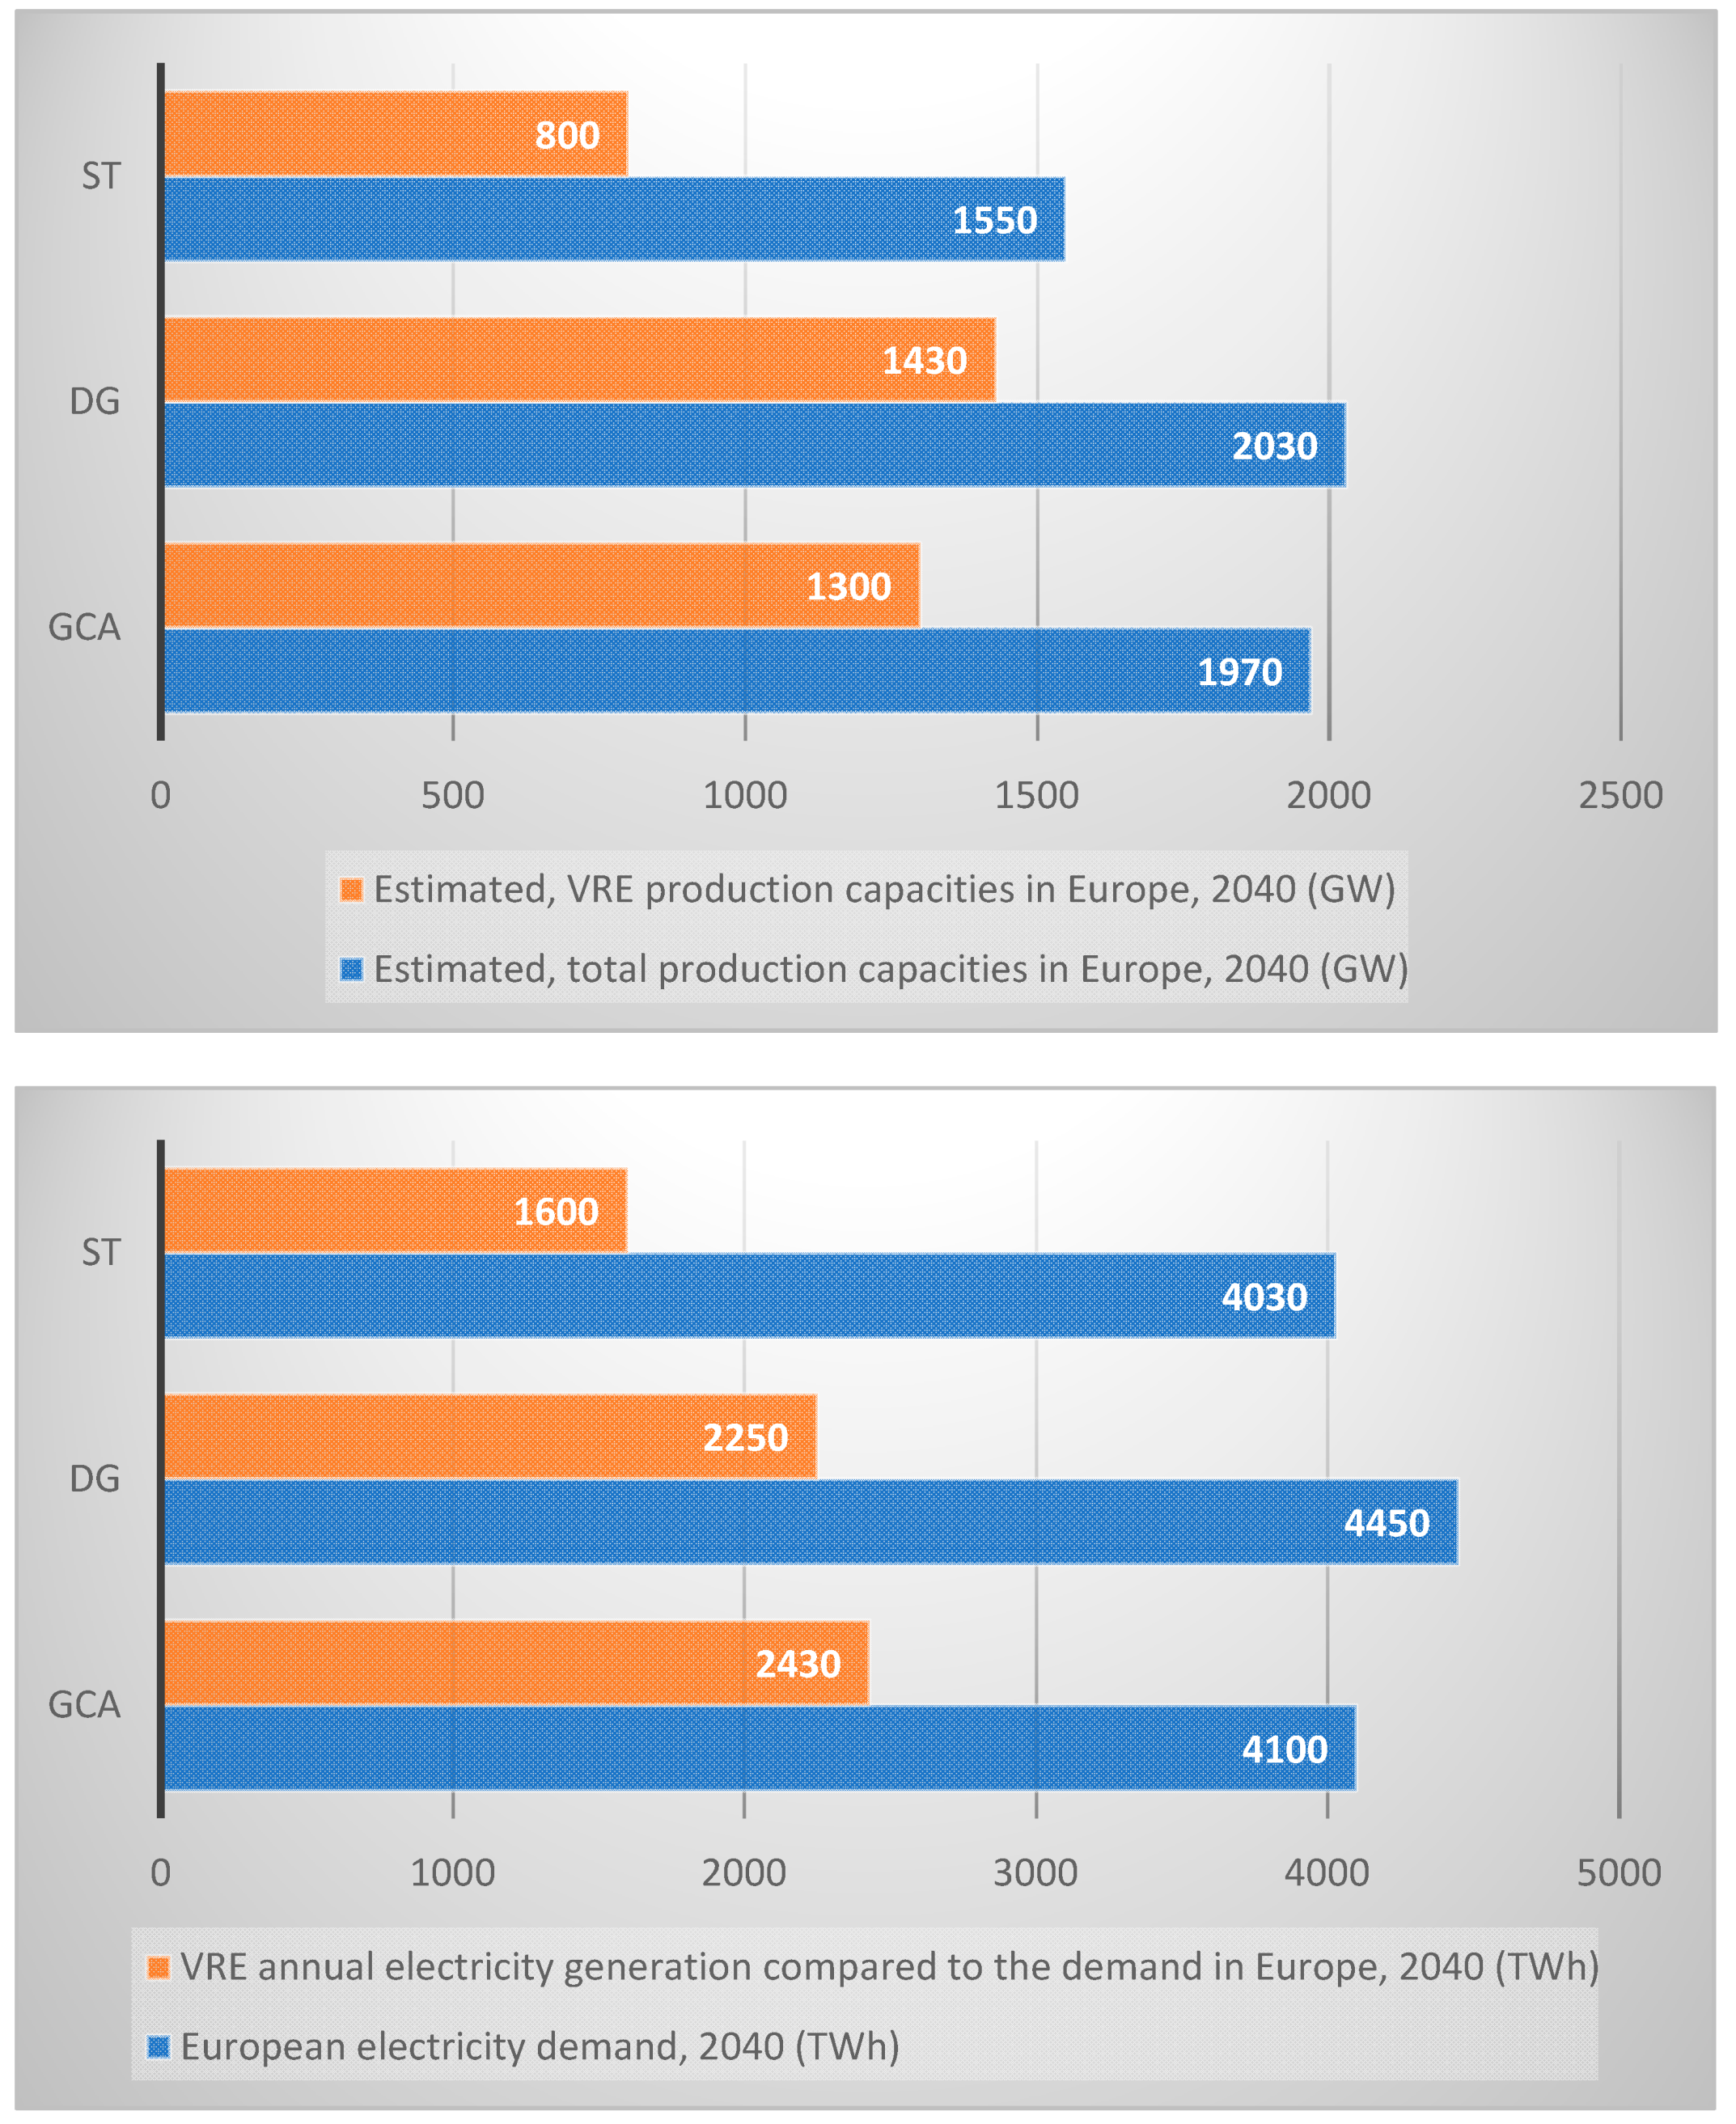
| Year | 2040, ST | 2040, DG | 2040, GCA |
|---|---|---|---|
| Electricity demand [TWh] | 4030 | 4450 | 4100 |
| Maximum peak load [GW] | 650 | 730 | 690 |
| VRE annual electricity generation compared to the demand [TWh] | 1600 | 2250 | 2430 |
| VRE annual electricity generation target compared to the demand [%] | 39.7 | 50.6 | 59.3 |
| Country | Annual Demand [TWh] | VRE Penetration [%] | Energy Storage Capacity [TWh] | Energy Storage Fraction [%] | Ref. |
|---|---|---|---|---|---|
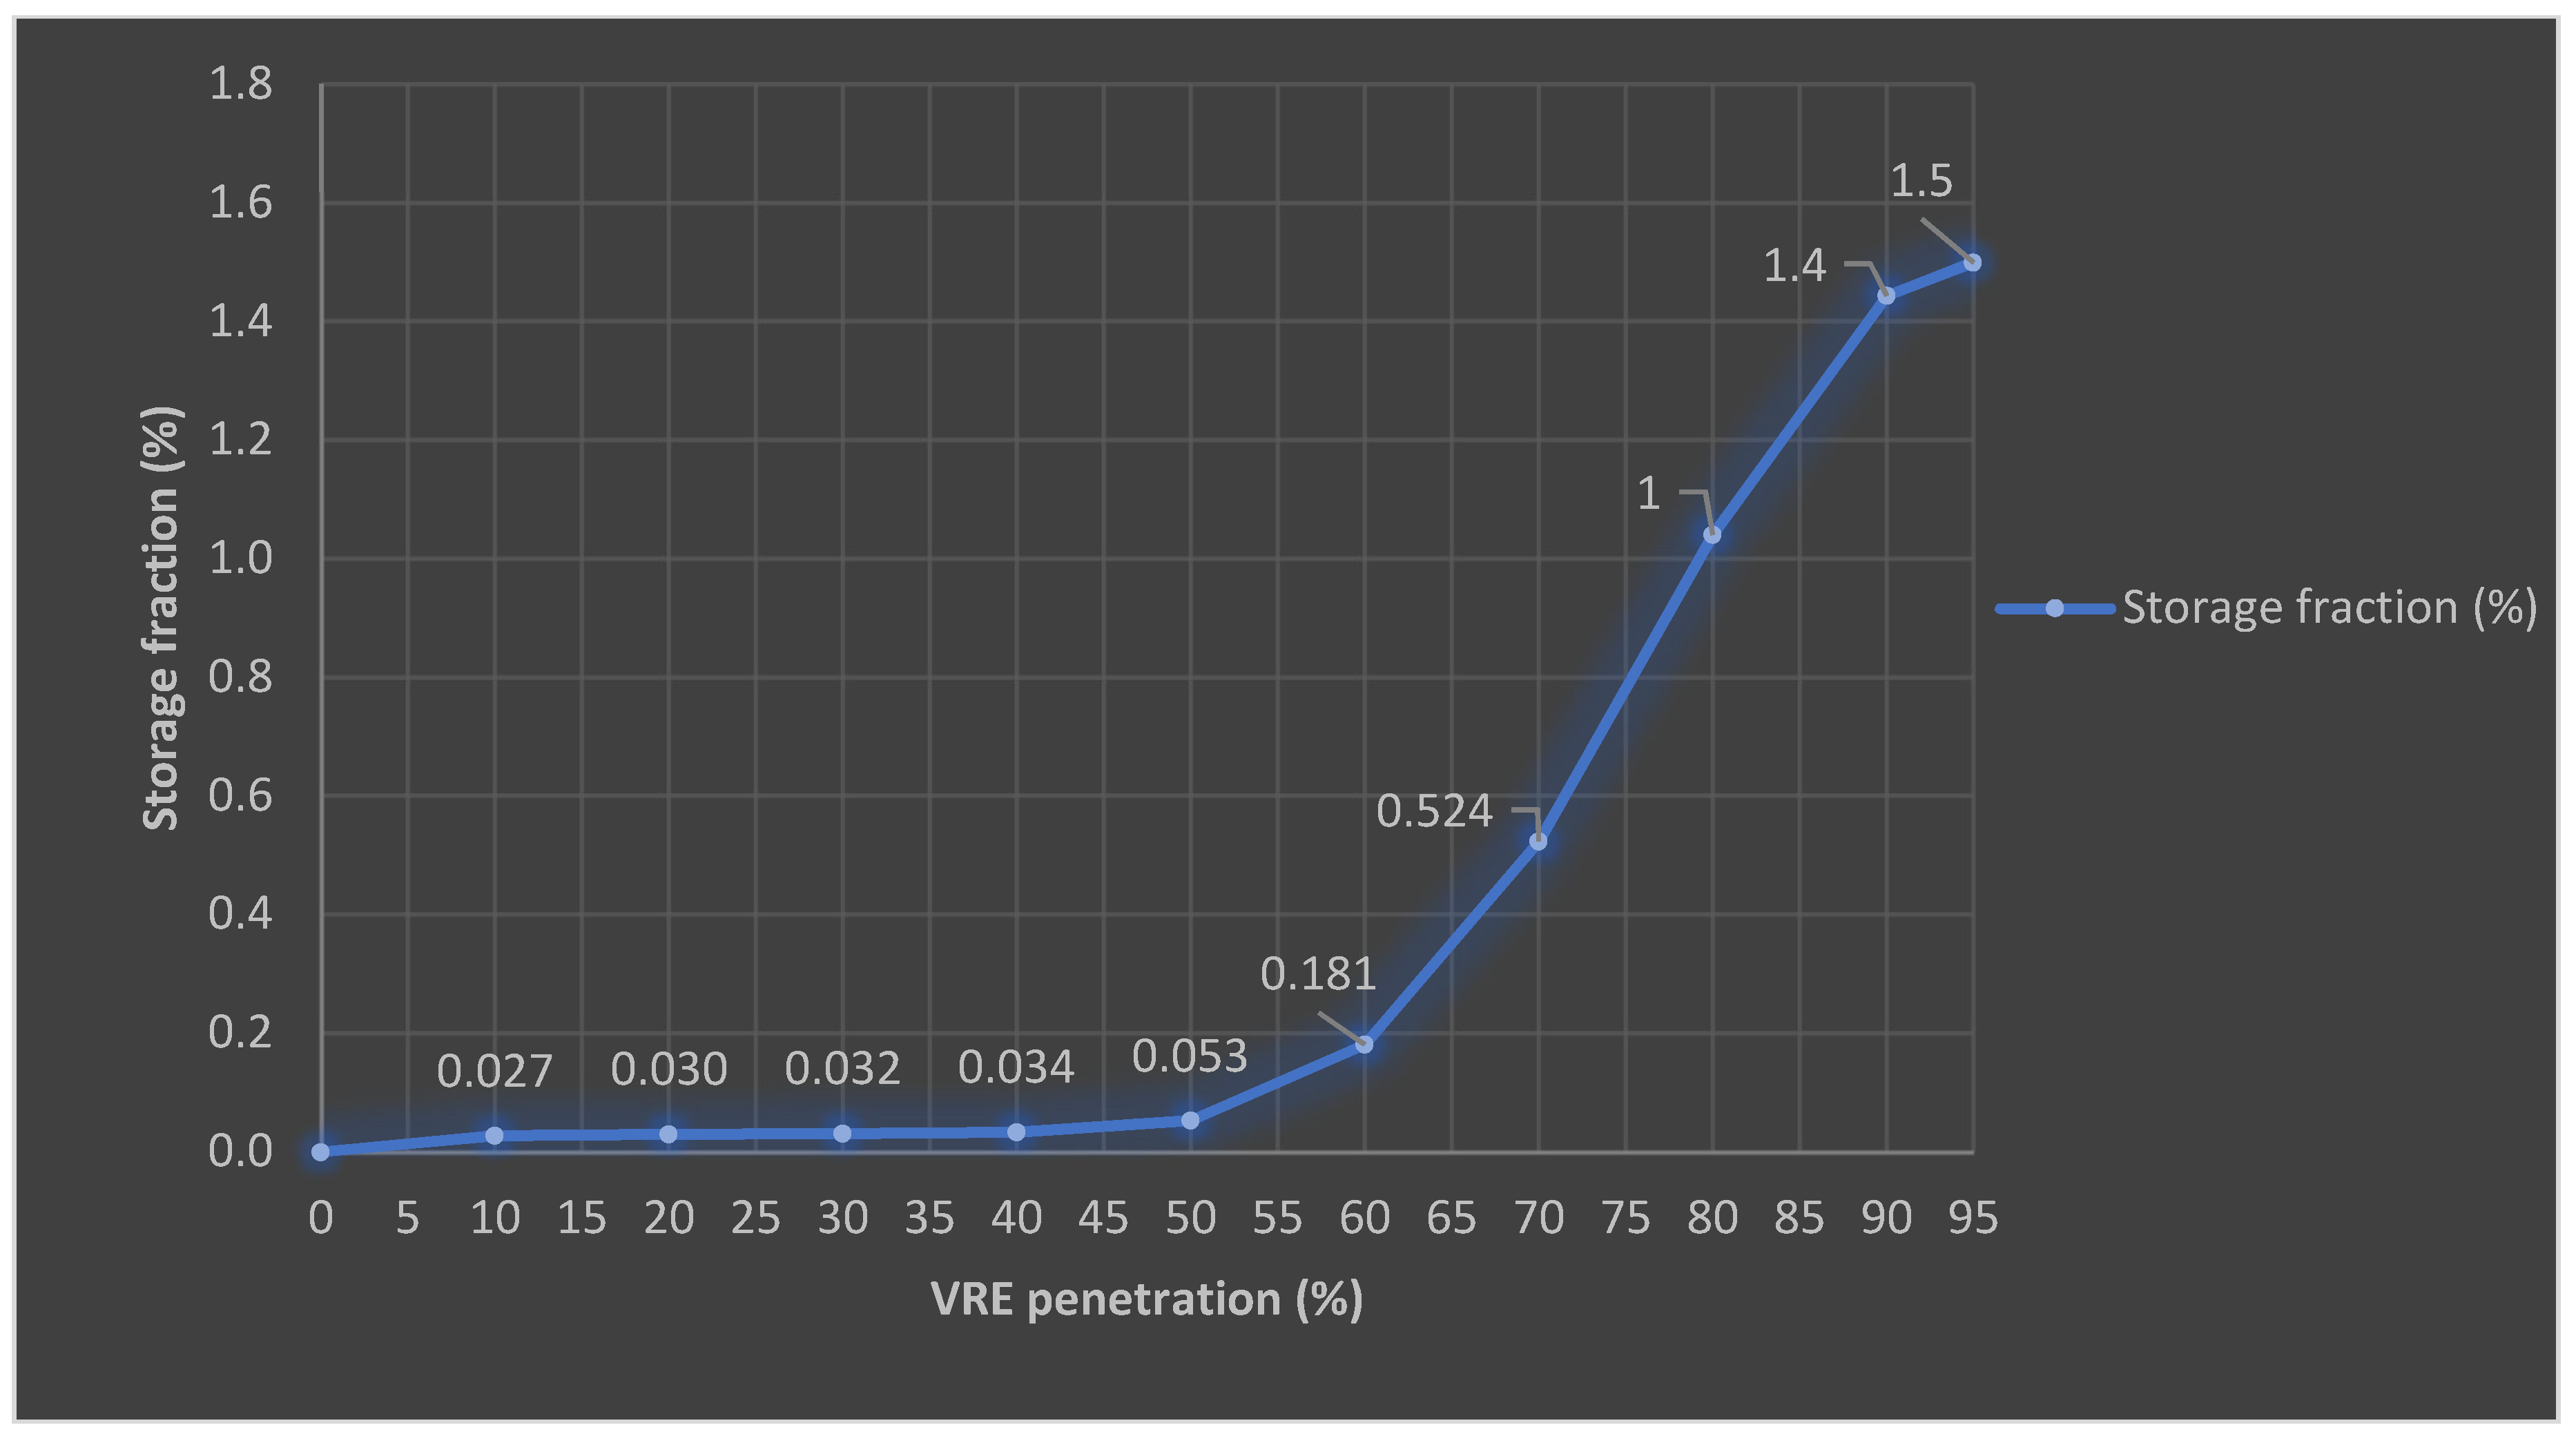
| Europe | 3746 | 16 | 1.15 | 0.0308 | [22,47] |
| Spain | 375 | 25 | 0.66 | 0.18 | [54] |
| Netherlands | 123 | 28.3 | 0.05 | 0.04 | [55] |
| West Europe | 4647 | 30 | 2.4 | 0.05 | [56] |
| UK | ~700 | 30 | 0.06 | 0.01 | [57] |
| Ireland | 32.7 | 34.5 | 0.07 | 0.21 | [58] |
| Germany | 478 | 38.6 | 0.06 | 0.01 | [59] |
| Europe | 4670 | 48 | 2.08 | 0.0445 | [22,47] |
| Germany | 562 | 50 | 3.5 | 0.62 | [13] |
| Germany (Region) | 53 | 20–50 | 0.15 | 0.28 | [60] |
| Greece | 88.3 | 50 | 0.4–1.4 | 1.02 | [61] |
| Austria | 83 | 55 | 0.2 | 0.24 | [62] |
| UK | 300 | 60 | 0.1 | 0.03 | [63] |
| Spain | 420 | 60 | 0.6–2.2 | 0.33 | [54] |
| Germany | 2030 | 66 | 18 | 0.89 | [31] |
| Belgium | 268 | 80 | 1.3 | 0.32 | [64] |
| Denmark | 41 | 80 | 0.66 | 1.61 | [65] |
| Germany | 413 | 80 | 0.9–1.3 | 0.27 | [59] |
| Germany | ~600 | 80 | 7–8 | 1.25 | [66] |
| Germany | 586 | 80 | 0.5 | 0.09 | [67] |
| Germany (Region) | 22.7 | 80 | 0.184 | 0.81 | [68] |
| Ireland | 45 | 80 | 2.8 | 6.00 | [58] |
| Europe | 4900 | 80 | 50 | 1.02 | [50] |
| General, global conclusion | - | 90–95 | - | 1.5 | [47] |
| Region | Year | Annual Demand [TWh] | Wind/Solar [%] | Energy Storage Capacity [TWh] | Energy Storage, Power Capacity [GW] | Energy Storage Fraction [%] | Ref. |
|---|---|---|---|---|---|---|---|
| Ireland | 2050 | 125 | 13/2 | 0.24 | 10 | 0.19 | [69] |
| Europe | 2050 | 4200 | 73/21 | 13.5 | – | 0.32 | [70] |
| France | 2050 | 425 | 40/17 | 3 | 3 | 0.71 | [71] |
| Europe | – | 3240 | 55/45 | 25 | 360 | 0.77 | [37] |
| Germany | 2050 | 475 | 60/40 | 9.1 | – | 1.92 | [72] |
| Germany (Region) | 2030 | 19.9 | 55/40 | 0.53 | 1.5 | 2.66 | [68] |
| UK | 2030 | 900 | 55/6 | 27 | 35 | 3.00 | [73] |
| Greece | 2050 | 55.7 | 100/0 | 2 | 0.2–0.3 | 3.59 | [74] |
| Europe | – | 3400 | 55/45 | 216 | 65 | 6.35 | [75] |
| Europe | 2007 | 3240 | 55/45 | 400–480 | 400 | 13.58 | [35] |
| Europe | - | - | - | - | - | 20–40 | [76] |
| Description | Equation |
|---|---|
| Equation (1), storage fraction [%] | |
| pi parameter values |
| Year | 2040 ST | 2040, DG | 2040, GCA |
|---|---|---|---|
| Power capacity of PHS [GW] | 58 | 76 | |
| Estimated energy storage capacity, PHS [GWh] | 3500 | 3900 | |
| Estimated European power capacity of other storage technologies, scenario 1 [GW] | 2.9 | 3.8 | |
| Estimated energy storage capacity, other storage technologies, scenario 1 [GWh] | 23,2 | 30.4 | |
| Summarized European power capacity of all storage technologies, scenario 1 [GW] | 60.9 | 79.8 | |
| Summarized energy storage capacity of all storage technologies, scenario 1 [GWh] | 3523.2 | 3930.4 | |
| Year | 2040 ST | 2040, DG | 2040, GCA |
|---|---|---|---|
| Power capacity of PHS [GW] | 58 | 76 | |
| Estimated energy storage capacity, PHS [GWh] | 3500 | 3900 | |
| Estimated European power capacity of other storage technologies, scenario 2 [GW] | 14.5 | 19 | |
| Estimated energy storage capacity, other storage technologies, scenario 2 [GWh] | 174 | 228 | |
| Summarized European power capacity of all storage technologies, scenario 2 [GW] | 72.5 | 95 | |
| Summarized energy storage capacity of all storage technologies, scenario 2 [GWh] | 3674 | 4128 | |
| Year | 2040, ST | 2040, DG | 2040, GCA |
|---|---|---|---|
| Electricity demand [TWh] | 4030 | 4450 | 4100 |
| ENTSO-E, maximum peak load [GW] | 650 | 730 | 690 |
| Annual VRE gross electricity generation compared to the demand [%] | 39.7 | 50.6 | 59.3 |
| Required storage fraction for the scenarios, based on equation 1 [%] | 0.033 | 0.057 | 0.166 |
| Required energy storage capacity for the scenarios, based on equation 1 [GWh] | 1348 | 2518 | 6819 |
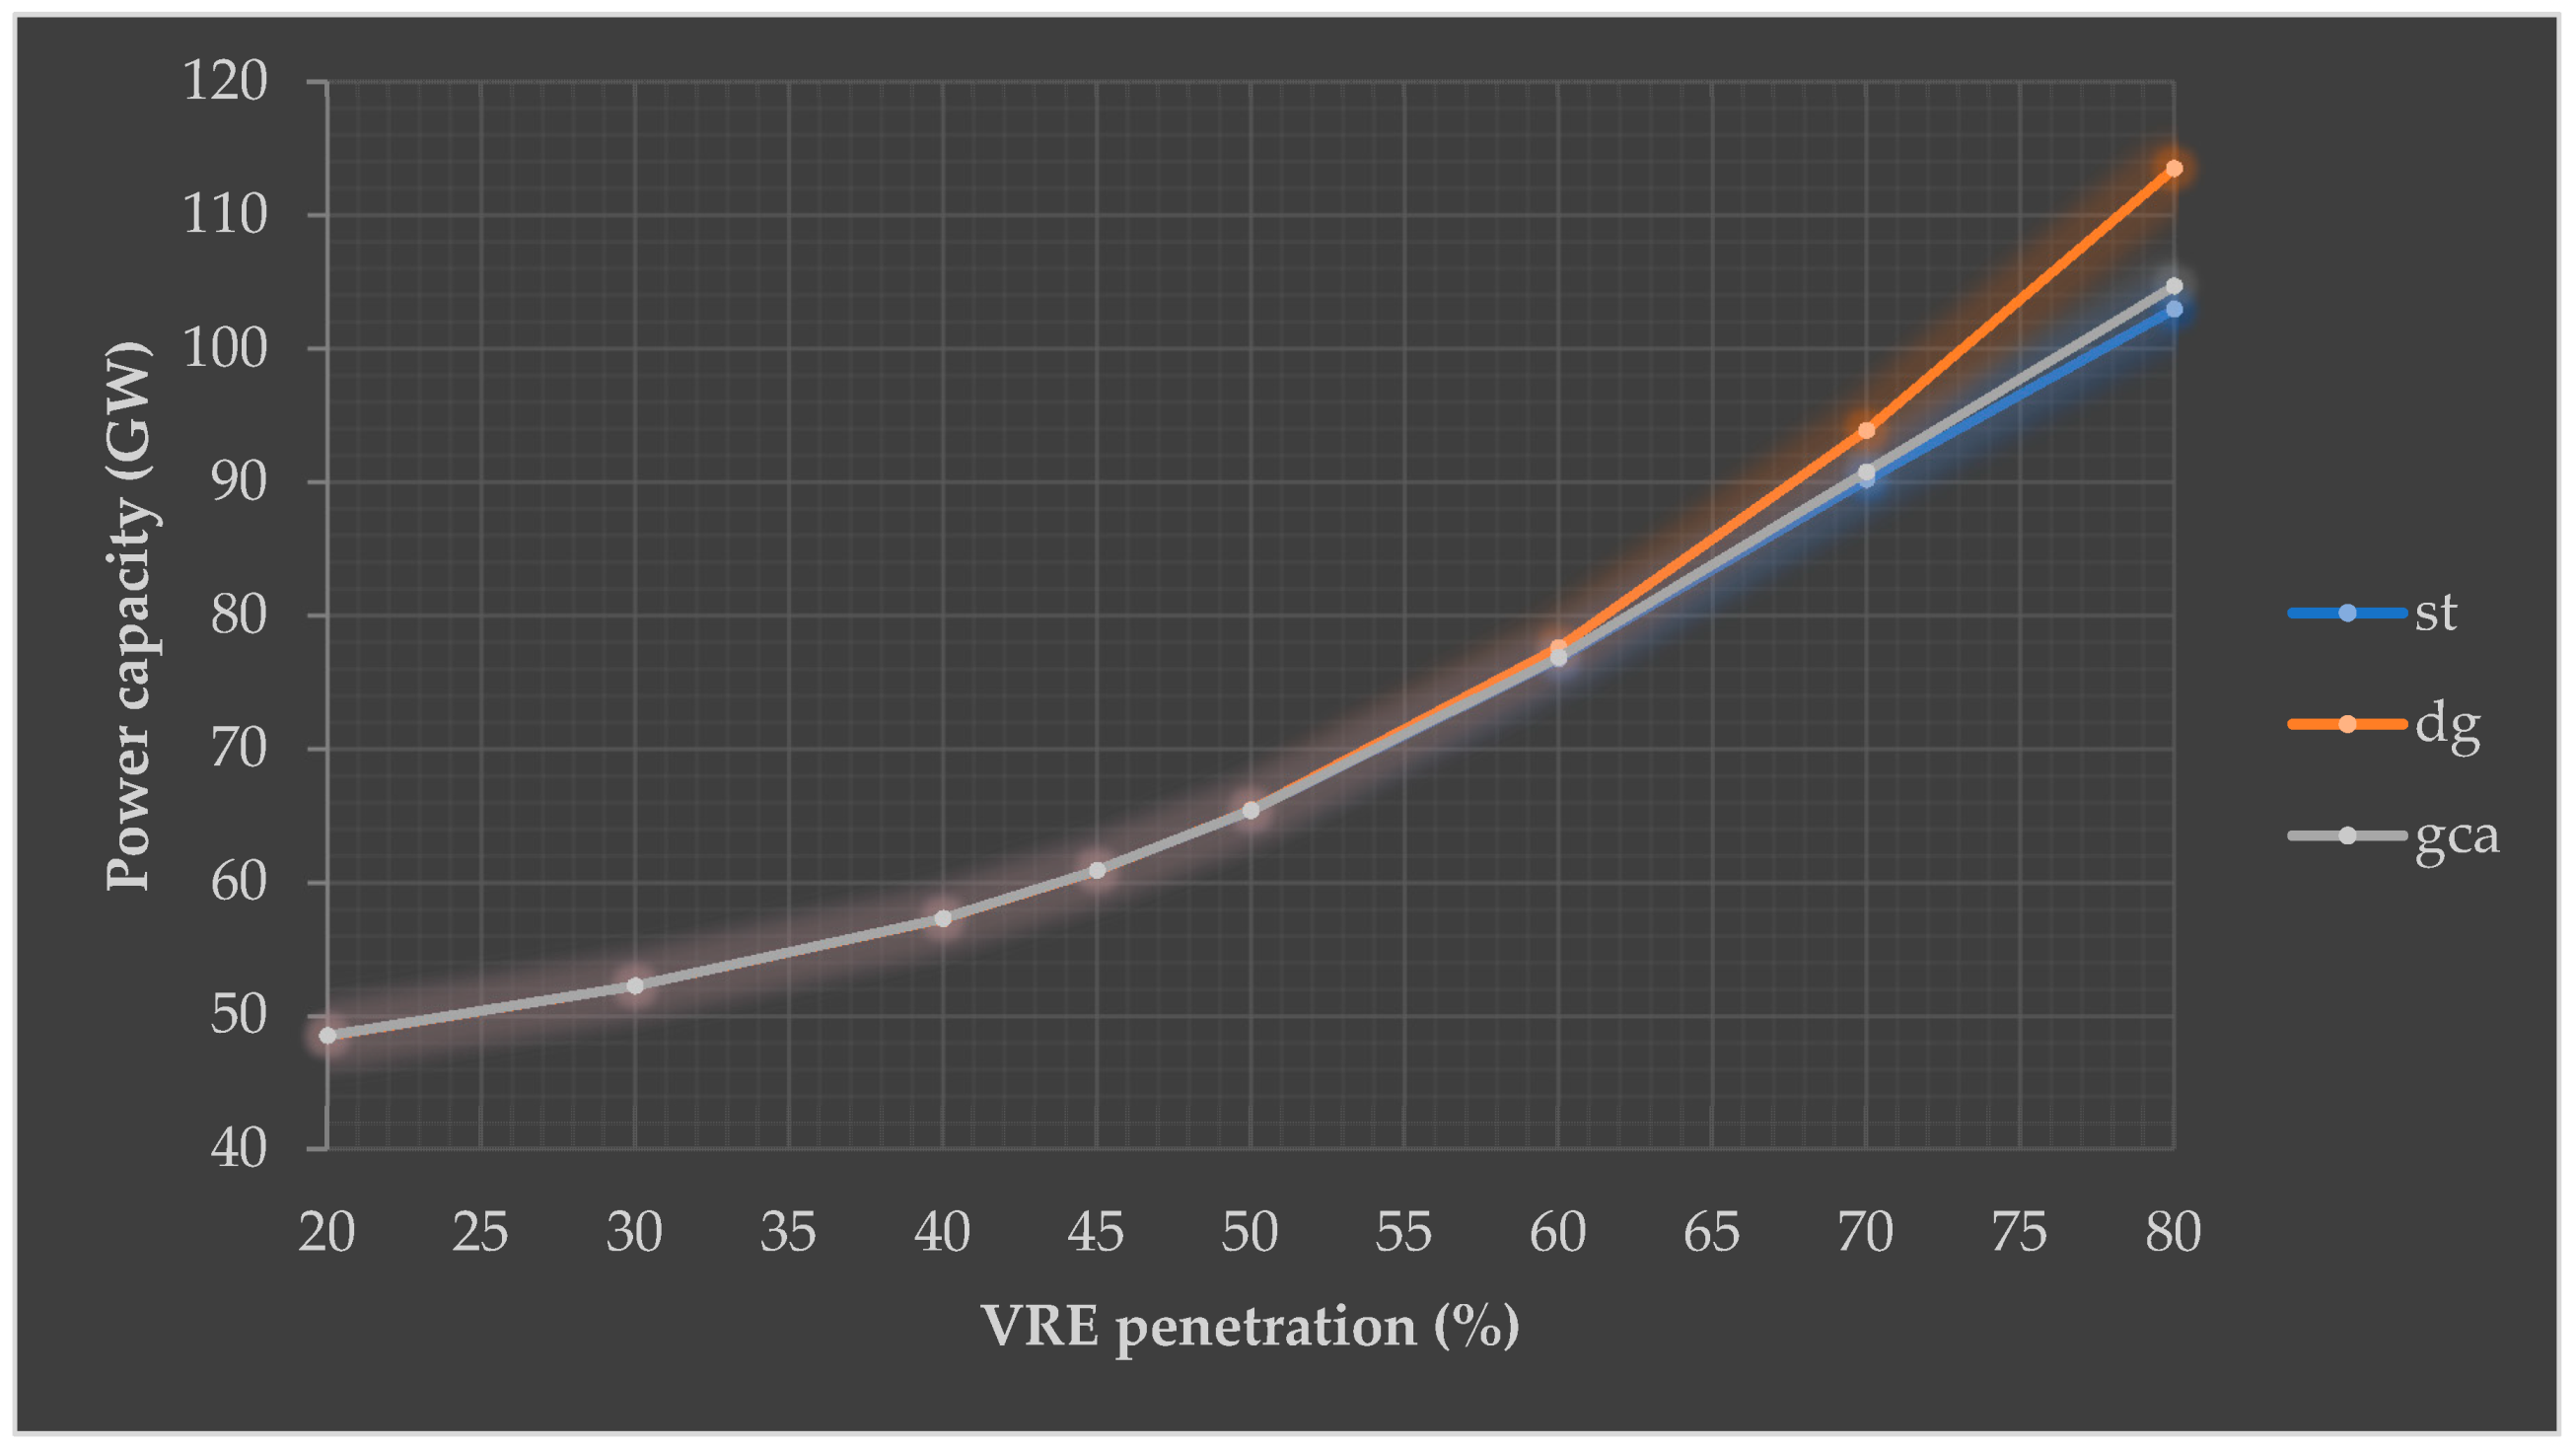
| Required storage power capacity to the scenarios, based on the logic of Figure 8 [GW] | 57 | 66 | 76 |
© 2019 by the authors. Licensee MDPI, Basel, Switzerland. This article is an open access article distributed under the terms and conditions of the Creative Commons Attribution (CC BY) license (http://creativecommons.org/licenses/by/4.0/).
Share and Cite
Zsiborács, H.; Baranyai, N.H.; Vincze, A.; Zentkó, L.; Birkner, Z.; Máté, K.; Pintér, G. Intermittent Renewable Energy Sources: The Role of Energy Storage in the European Power System of 2040. Electronics 2019, 8, 729. https://doi.org/10.3390/electronics8070729
Zsiborács H, Baranyai NH, Vincze A, Zentkó L, Birkner Z, Máté K, Pintér G. Intermittent Renewable Energy Sources: The Role of Energy Storage in the European Power System of 2040. Electronics. 2019; 8(7):729. https://doi.org/10.3390/electronics8070729
Chicago/Turabian StyleZsiborács, Henrik, Nóra Hegedűsné Baranyai, András Vincze, László Zentkó, Zoltán Birkner, Kinga Máté, and Gábor Pintér. 2019. "Intermittent Renewable Energy Sources: The Role of Energy Storage in the European Power System of 2040" Electronics 8, no. 7: 729. https://doi.org/10.3390/electronics8070729
APA StyleZsiborács, H., Baranyai, N. H., Vincze, A., Zentkó, L., Birkner, Z., Máté, K., & Pintér, G. (2019). Intermittent Renewable Energy Sources: The Role of Energy Storage in the European Power System of 2040. Electronics, 8(7), 729. https://doi.org/10.3390/electronics8070729