Article

A Novel Electrocardiogram Biometric Identification Method Based on Temporal-Frequency Autoencoding

1
College of Communication Engineering, Jilin University, Changchun 130012, China
2
School of Electronic and Information Engineering (SEIE), Zhuhai College, Jilin University, Zhuhai 519041, China
3
College of Instrument Science and Electrical Engineering, Jilin University, Changchun 130061, China
*
Author to whom correspondence should be addressed.
Electronics 2019, 8(6), 667; https://doi.org/10.3390/electronics8060667
Submission received: 25 April 2019 / Revised: 5 June 2019 / Accepted: 10 June 2019 / Published: 12 June 2019
(This article belongs to the Special Issue Recent Advances in Biometrics and its Applications)

Abstract

:
For good performance, most existing electrocardiogram (ECG) identification methods still need to adopt a denoising process to remove noise interference beforehand. This specific signal preprocessing technique requires great efforts for algorithm engineering and is usually complicated and time-consuming. To more conveniently remove the influence of noise interference and realize accurate identification, a novel temporal-frequency autoencoding based method is proposed. In particular, the raw data is firstly transformed into the wavelet domain, where multi-level time-frequency representation is achieved. Then, a prior knowledge-based feature selection is proposed and applied to the transformed data to discard noise components and retain identity-related information simultaneously. Afterward, the stacked sparse autoencoder is introduced to learn intrinsic discriminative features from the selected data, and Softmax classifier is used to perform the identification task. The effectiveness of the proposed method is evaluated on two public databases, namely, ECG-ID and Massachusetts Institute of Technology-Biotechnology arrhythmia (MIT-BIH-AHA) databases. Experimental results show that our method can achieve high multiple-heartbeat identification accuracies of 98.87%, 92.3%, and 96.82% on raw ECG signals which are from the ECG-ID (Two-recording), ECG-ID (All-recording), and MIT-BIH-AHA database, respectively, indicating that our method can provide an efficient way for ECG biometric identification.

1. Introduction

In past decades, identification technology has been widely applied in different fields of our society to satisfy the requirements for safety and privacy information protection. However, traditional techniques, including documents, keys, passwords, and radio frequency identification (RFID) all have concerns regarding their possibility of being lost or forgotten. As a promising alternative, biometric identification attracts great attention from researchers all over the world [1]. Typical biometrics include fingerprint, iris, and face, etc. In recent years, it is also found that an electrocardiogram (ECG) signal can provide various significant properties to advocate its use as a biometric, such as uniqueness, permanence, and ease of collection. In addition, compared with conventional biometrics, the ECG can serve as a more reliable and safer way for identification, because it is an electrical signal inside the body and thus, is hard to be stolen or fabricated. Due to these characteristics, the use of ECG signals for biometric identification has recently received much attention [2].
Generally, visually distinguishing the ECG differences among subjects is very challenging because of the subtle changes in amplitude and duration. To overcome this limitation, pattern recognition methods are usually adopted for quick, objective, and reliable identification. A typical ECG biometric identification process can be divided into three parts: preprocessing, feature extraction, and classification. Among the above three, feature extraction is especially important because it determines the information transferred to classifiers and has a great influence on the final identification performance. According to the feature extraction manner, existing ECG identification methods can be typically divided into two categories which are the fiducial and the non-fiducial [3]: (i) The fiducial [4,5,6,7] refers to methods that extract ECG features based on fiducial points, e.g., P, Q, R, S, and T. Fiducial features are amplitudes of P, Q, R, S, and T waves, the temporal interval between wave boundaries, the area of waves, and the slope information [8]; (ii) for the non-fiducial [9,10], no peak detection is required during feature extraction. The most prevalent non-fiducial features include frequency domain features which are coefficients or parameters obtained by certain specific transformations, such as wavelet transform and statistical features, which are converted from ECG waveforms by statistical methods, such as principal component analysis (PCA).
Among previously reported applications, Biel et al. [4] proposed to select 360 fiducial features including QRS wave duration, amplitude from 12-lead ECG recordings to classify 20 subjects in 2001, and this work is one of the earliest researches which apply ECG for human identification. In 2005, Nemirko et al. [5] demonstrated that it was possible to identify a specific person using one-lead ECG signals. The proposed system utilized PQRST-fragment as features, and identification accuracy of 96% was achieved using linear discriminant analysis (LDA). Later, principal component analysis (PCA) was adopted by Irvine et al. [6].to remove common cyclic pattern and retain information that described the individual’s uniqueness. In 2013, Khairul et al. [7] reported that enhanced by piecewise cubic Hermite interpolation (PCHIP) and piecewise cubic spline interpolation (SPLINE), QRS complex could offer excellent discrimination among different subjects from ECG databases with low sampling frequency. In recent years, with the development of neural network technology, researchers more and more prefer automatic feature learning to manual extraction. Zhang et al. [9] proposed a 1-D-convolutional neural network (1-D-CNN) to learn the intrinsic features from wavelet domain data, obtaining high accuracy on both health and arrhythmic databases. In 2018, generalized S-transformation and convolutional neural network (CNN) were combined together in [10] to avoid tedious feature extraction. By converting the one-dimensional signal to a two-dimensional image, this method could take full advantage of the feature extraction ability of CNN, and thus, learn the potential discrimination among different subjects.
The above studies have reported promising performances on various issues and applications. However, some problems still exist. As we all know, there are multiple factors influencing the quality of the ECG signal [11]. The interference will display in the form of noise and distort the waveform of ECG signals, leading to a decrease of ECG identification performance [12]. To address the interference, nearly all of the existing ECG based biometric identification methods have to design or adopt a denoising method in the preprocessing step. However, due to the diverse collection environments and multiple noise types in practice, there is still not a denoising algorithm that proves to be able to perform well in a variety of situations. That means great effort should be made to adjust the denoising method to obtain good denoising performance, which is time-consuming and complicated. What is worse, improper design or improvement may further distort the ECG signal and make the following identification even harder. If the denoising process can be simpler, great time and work will be saved. Hence, a feature extraction scheme, which can more conveniently remove noise interference and learn potential discrimination among subjects, needs to be investigated.
This study aims to propose a novel feature extraction method which does not require a specific denoising process beforehand and can still remove noise interference. Our work can be divided into two parts.
(1) On the basis of prior knowledge, we propose a QRST-targeting selection method for feature initiation. The method aims to remove most noise interference by only preserving identity-related information. Here, the identity-related information refers to QRST characteristics, which have proven to be efficient in ECG biometric identification and been widely used according to the literature review.
To extract identity-related information, discrete wavelet transform (DWT) is adopted for multiresolution analysis. The major advantage of DWT is its ability of multiresolution decomposition, by which a good description of the original signals on time and frequency domain can be provided. In prior work [13], DWT has proven to be able to describe ECG discrepancies among subjects. In this paper, DWT is used to decompose ECG signals into different scales, each of which represents a particular coarseness of the signal, and provide an initial feature set for the following feature selection. Then by selecting the scales corresponding to QRST, the identity-related information can be preserved, while interference can be removed as much as possible.
(2) For further feature extraction, autoencoder (AE), a classical neural network, is adopted as the tool to discover discriminative data structure from the initial features selected by DWT. AE has long been applied to fault diagnosis of machinery [14] and image classification [15]. Recently, it also proves its effectiveness in medical research, such as health informatics and biological signal analysis [16,17,18,19], e.g., Eduardo et al. [19] conducted a deep autoencoder structure to learn lower dimensional representation of heartbeats. In this paper, by additionally adding a sparse constraint, the stacked sparse autoencoder network is expected to fit complex function and learn abstract representation of the input. Here, since the learned DWT feature contains temporal and frequency information of original data, the process of feature learning on it by AE is called temporal-frequency autoencoding.
The rest of this paper is organized as follows: Section 2 illustrates the used databases for evaluation; Section 3 performs the proposed methodology; experimental setup and results are presented in Section 4; the results of our approach are discussed in Section 5, and Section 6 concludes the paper.

2. Database

In our work, two public databases available on the PhysioNet, namely the ECG-ID [5] and the MIT-BIH-AHA [20], are used for the evaluation of our proposed method.
The ECG-ID contains recordings gathered from 90 subjects (44 males and 46 females) using a one-lead chest ECG sensor. Each recording is digitized at 500 Hz, over a duration of 20 s. The ECG-ID database is challenging for biometric identification because of its various emotional and physical acquisition conditions and has been widely used for evaluation in prior works. During the experiments, for convenient comparison with existing literature, two schemes were adopted. The detail is as below:
Two-recording: in this scheme, since only a small subset of the subjects have more than two recordings, we adopted the first two recordings of each subject for the experiments.
All-recording: all the recordings in the database were used during the experiments.
In both of the schemes, the 74th subject was excluded because of its single signal number.
The MIT-BIH-AHA consists of two-channel ECG signals with a sample rate of 360 Hz. These ECG signals are obtained from 47 subjects (25 males and 22 females) and have a duration of about 30 min. During the experiments, only the first channel of each subject was adopted, because its QRS complexes are usually prominent. For better evaluation, each ECG was divided into 20 s short-term ECGs using the moving window analysis technique. As a result, the segmented ECGs have the same length as those in ECG-ID, and the number of signals from each subject increases. With the MIT-BIH-AHA database, the proposed method can be evaluated on the level of the patient.

3. Proposed Methodology

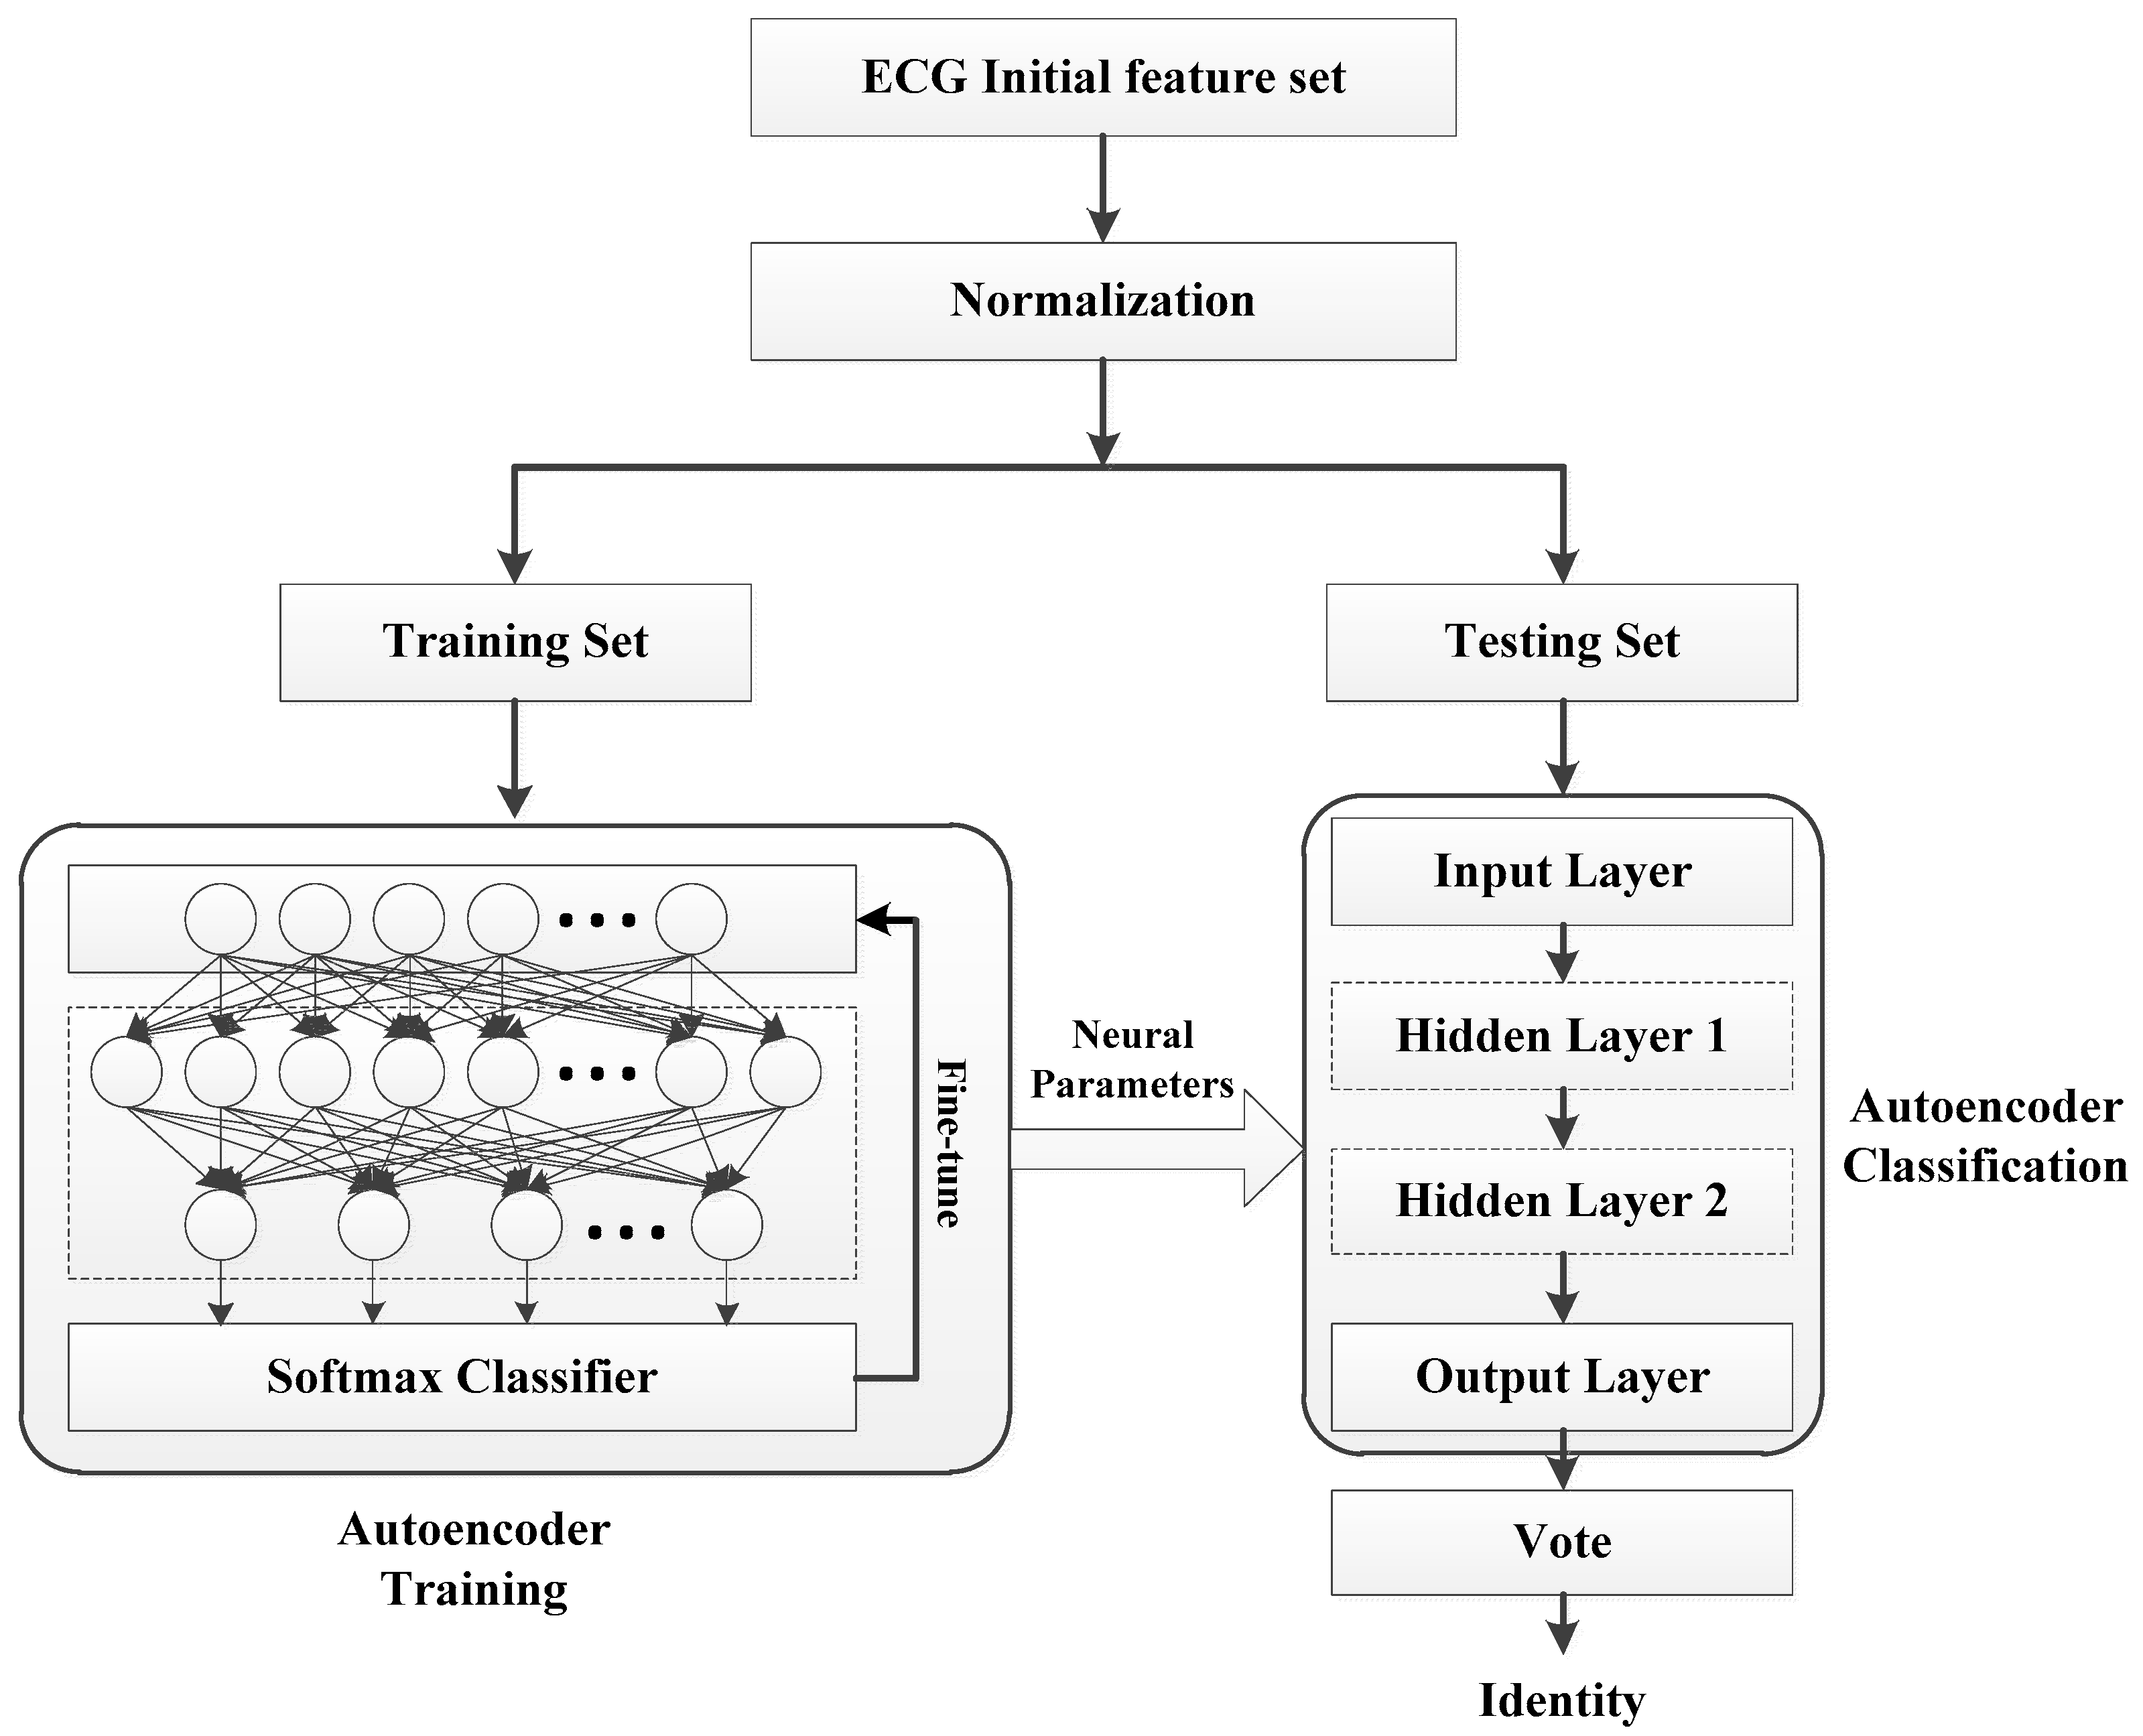
The whole proposed identification process is mainly composed of five parts: (1) preprocessing, (2) feature selection, (3) feature learning, (4) single-heartbeat identification, (5) multiple-heartbeat identification. The specific process is shown in Figure 1. Parts in the red block represent the proposed method in this paper. Here, since the signal label is obtained based on the voting of its contained multiple heartbeats, we call the signal identification process Multiple-heartbeat identification in this paper.

3.1. Preprocessing

3.1.1. Denoising

For comparing the performances of the proposed method on noisy and clean signals, raw signals should be firstly denoised to construct Set A (denoised dataset). In practice, raw ECG signals contain three major noises, which are baseline wander, power-line interference, and muscle artifact, respectively. Generally, baseline wander results from people inhaling and has a low frequency of less than 0.5 Hz [21]. Power-line interference generates due to the influence of the used power, whose frequency is either 50 Hz or 60 Hz [22]. Muscle artifact, which results from the contraction of other muscles apart from the heart, is a random noise that spreads over the entire frequency domain [23].
In our work, the noises of ECG signals, which come from the MIT-BIH-AHA database, was removed by a wavelet transform based denoising algorithm [24,25,26] to obtain the denoised dataset. The denoising process is as follows: 9-level lift wavelet decomposition is firstly carried out on raw ECG signals to get wavelet coefficients; then obtained wavelet coefficients of different levels are thresholded by the shrinkage (soft) strategy; at last, the thresholded wavelet detail coefficients are reconstructed back to the original sequence form, leading to the obtaining of clean signal. Here the shrinkage (soft) strategy thresholds the coefficients according to the universal ‘VisuShrink’ threshold given by [27]:
T h r i = σ i 2 log ( N i ) ,
where N i and σ i , respectively, represent the data point number and the estimated noise level of the i -th level. σ i is obtained according to [28]:
σ i = m e d i a n ( | ω i | ) 0.6745 ,
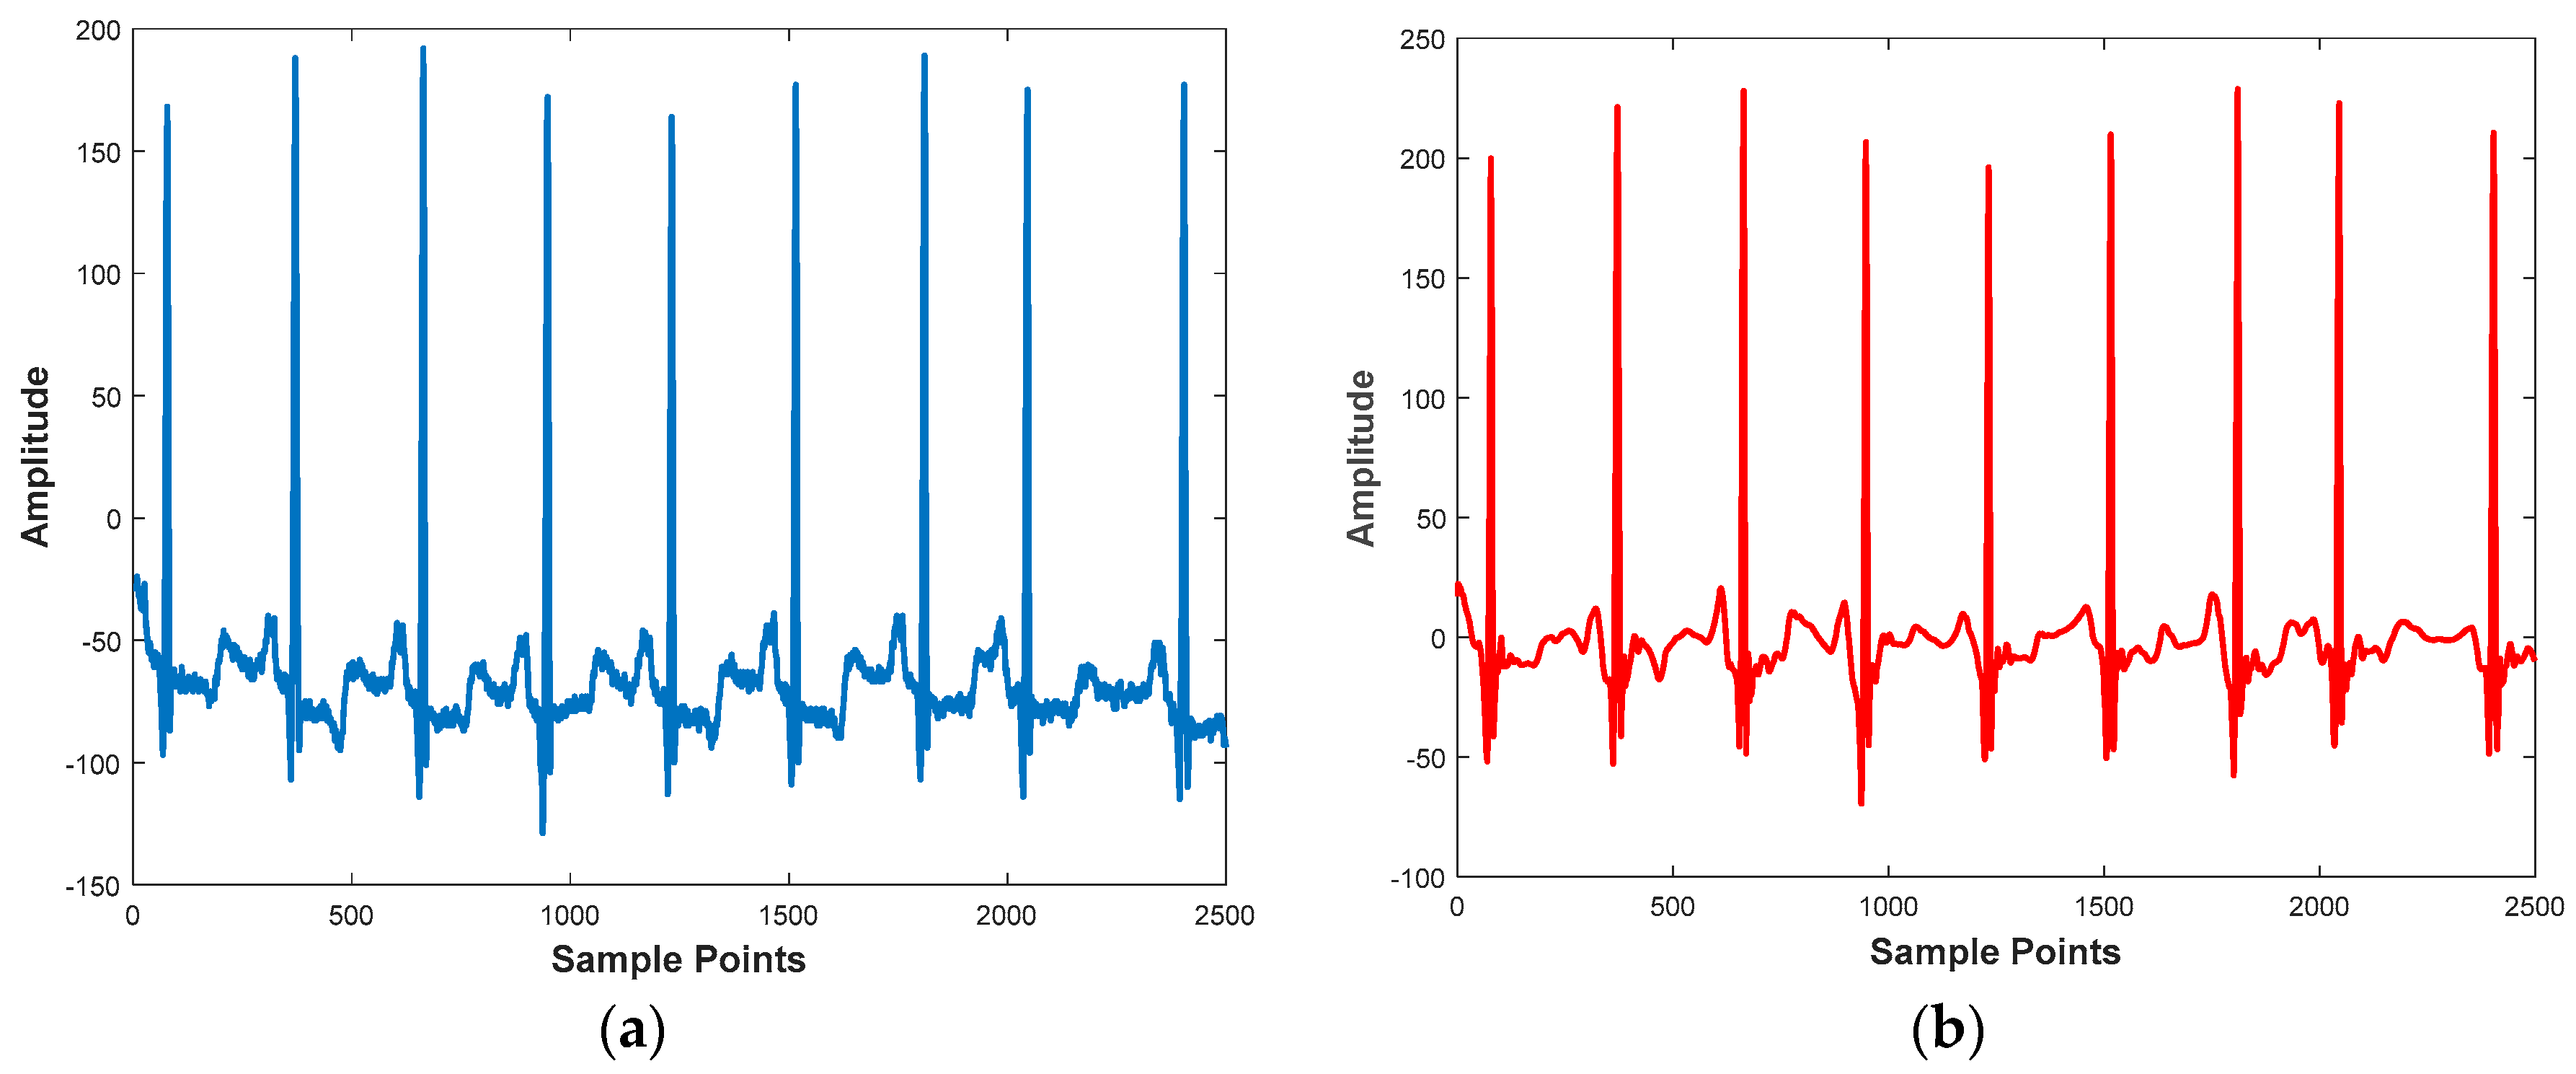
where ω i is the wavelet detail coefficients of the i -th level, and m e d i a n ( x ) is a function which can output the median value of input sequence x . Wavelet decomposition, coefficient thresholding, and signal reconstruction can be implemented by functions lwt, wthresh, and ilwt in MATLAB, respectively. Figure 2 depicts the comparison between a raw ECG signal from the MIT-BIH-AHA and its denoised signal.
For the ECG-ID database, all signals of each subject contain two channels. Among them, one is the raw signal, and the other one is the denoised signal, which has been preprocessed by the data contributor. In this work, we directly adopted the filtered signal of each subject to construct Set A of ECG-ID database.

3.1.2. R-Peak Detection and Heartbeat Segmentation

This stage aims to segment a long ECG signal into multiple heartbeats. Since R peak points were taken as the dividing references during segmentation, it is crucial to detect R peak locations from noisy ECG signals. In this work, the Pan–Tompkins (PT) algorithm [29] was adopted for R point detection because of its good performance on noisy ECG signals. The PT algorithm is comprised of several steps: cascaded low-pass and high-pass filters, differentiation, a squaring function, and moving-window integration. The cascaded low-pass and high-pass filters firstly remove interference and maximize QRS energy. Then differentiation and squaring, respectively, provide the slope information and emphasize the higher frequencies. Afterward, moving-window integration is used to obtain waveform information, and its rising edge corresponds to the QRS complex. By searching the peak point in the temporal duration corresponding to the rising edge, the R point can be identified. Even though an extra denoising process exits in PT algorithm, the step here has much lower requirements for denoising algorithms compared with those cases where denoised signals are further used for identification. After the PT algorithm, only the detected R point locations are adopted for raw signal segmentation, and there is no need to worry about signal quality decrease caused by improper denoising. MATLAB code for the PT algorithm was downloaded from [30].
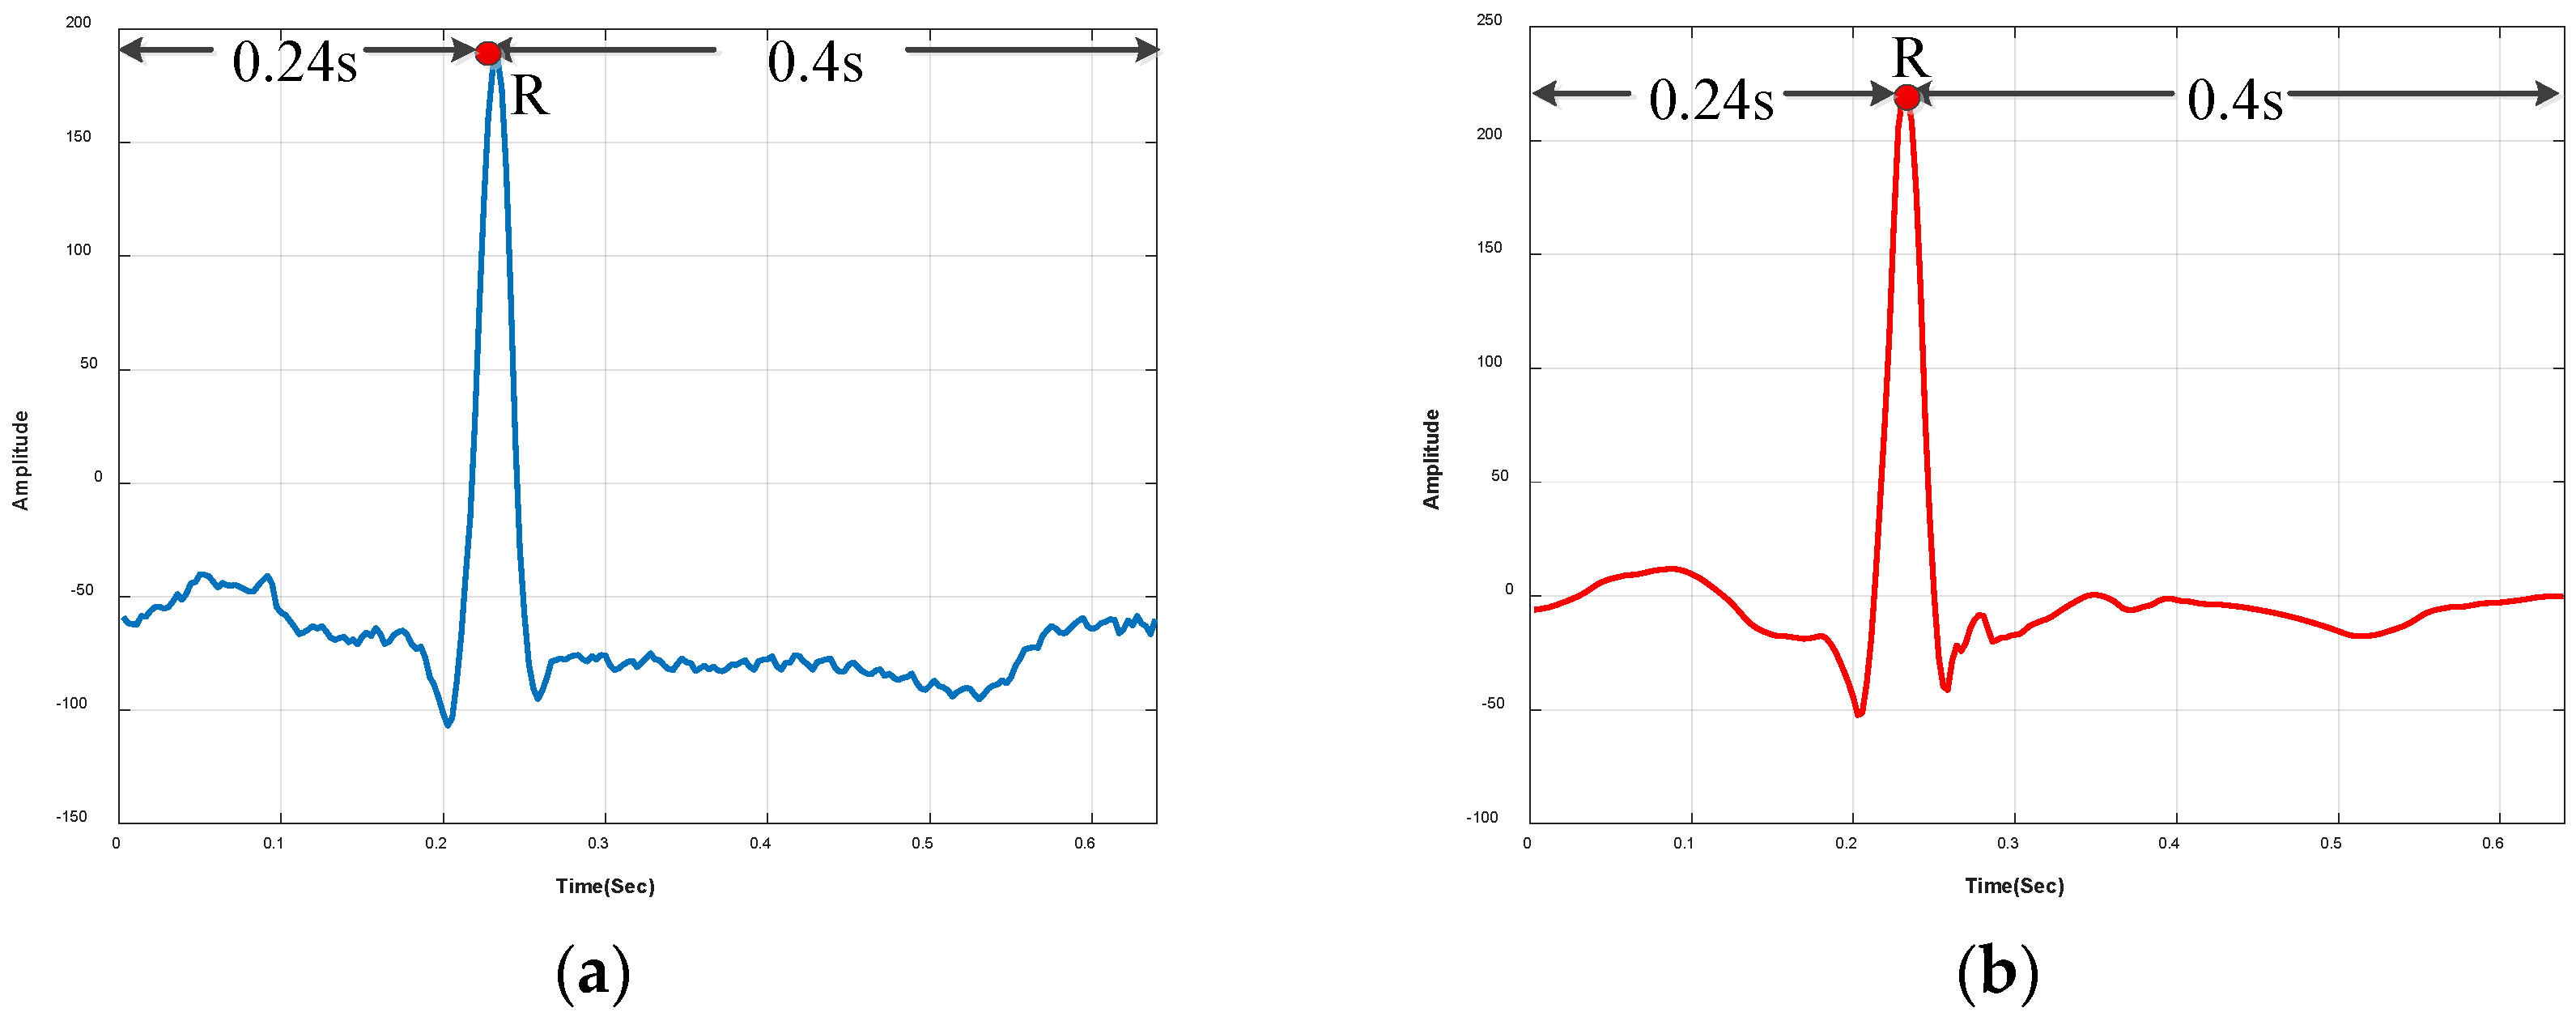
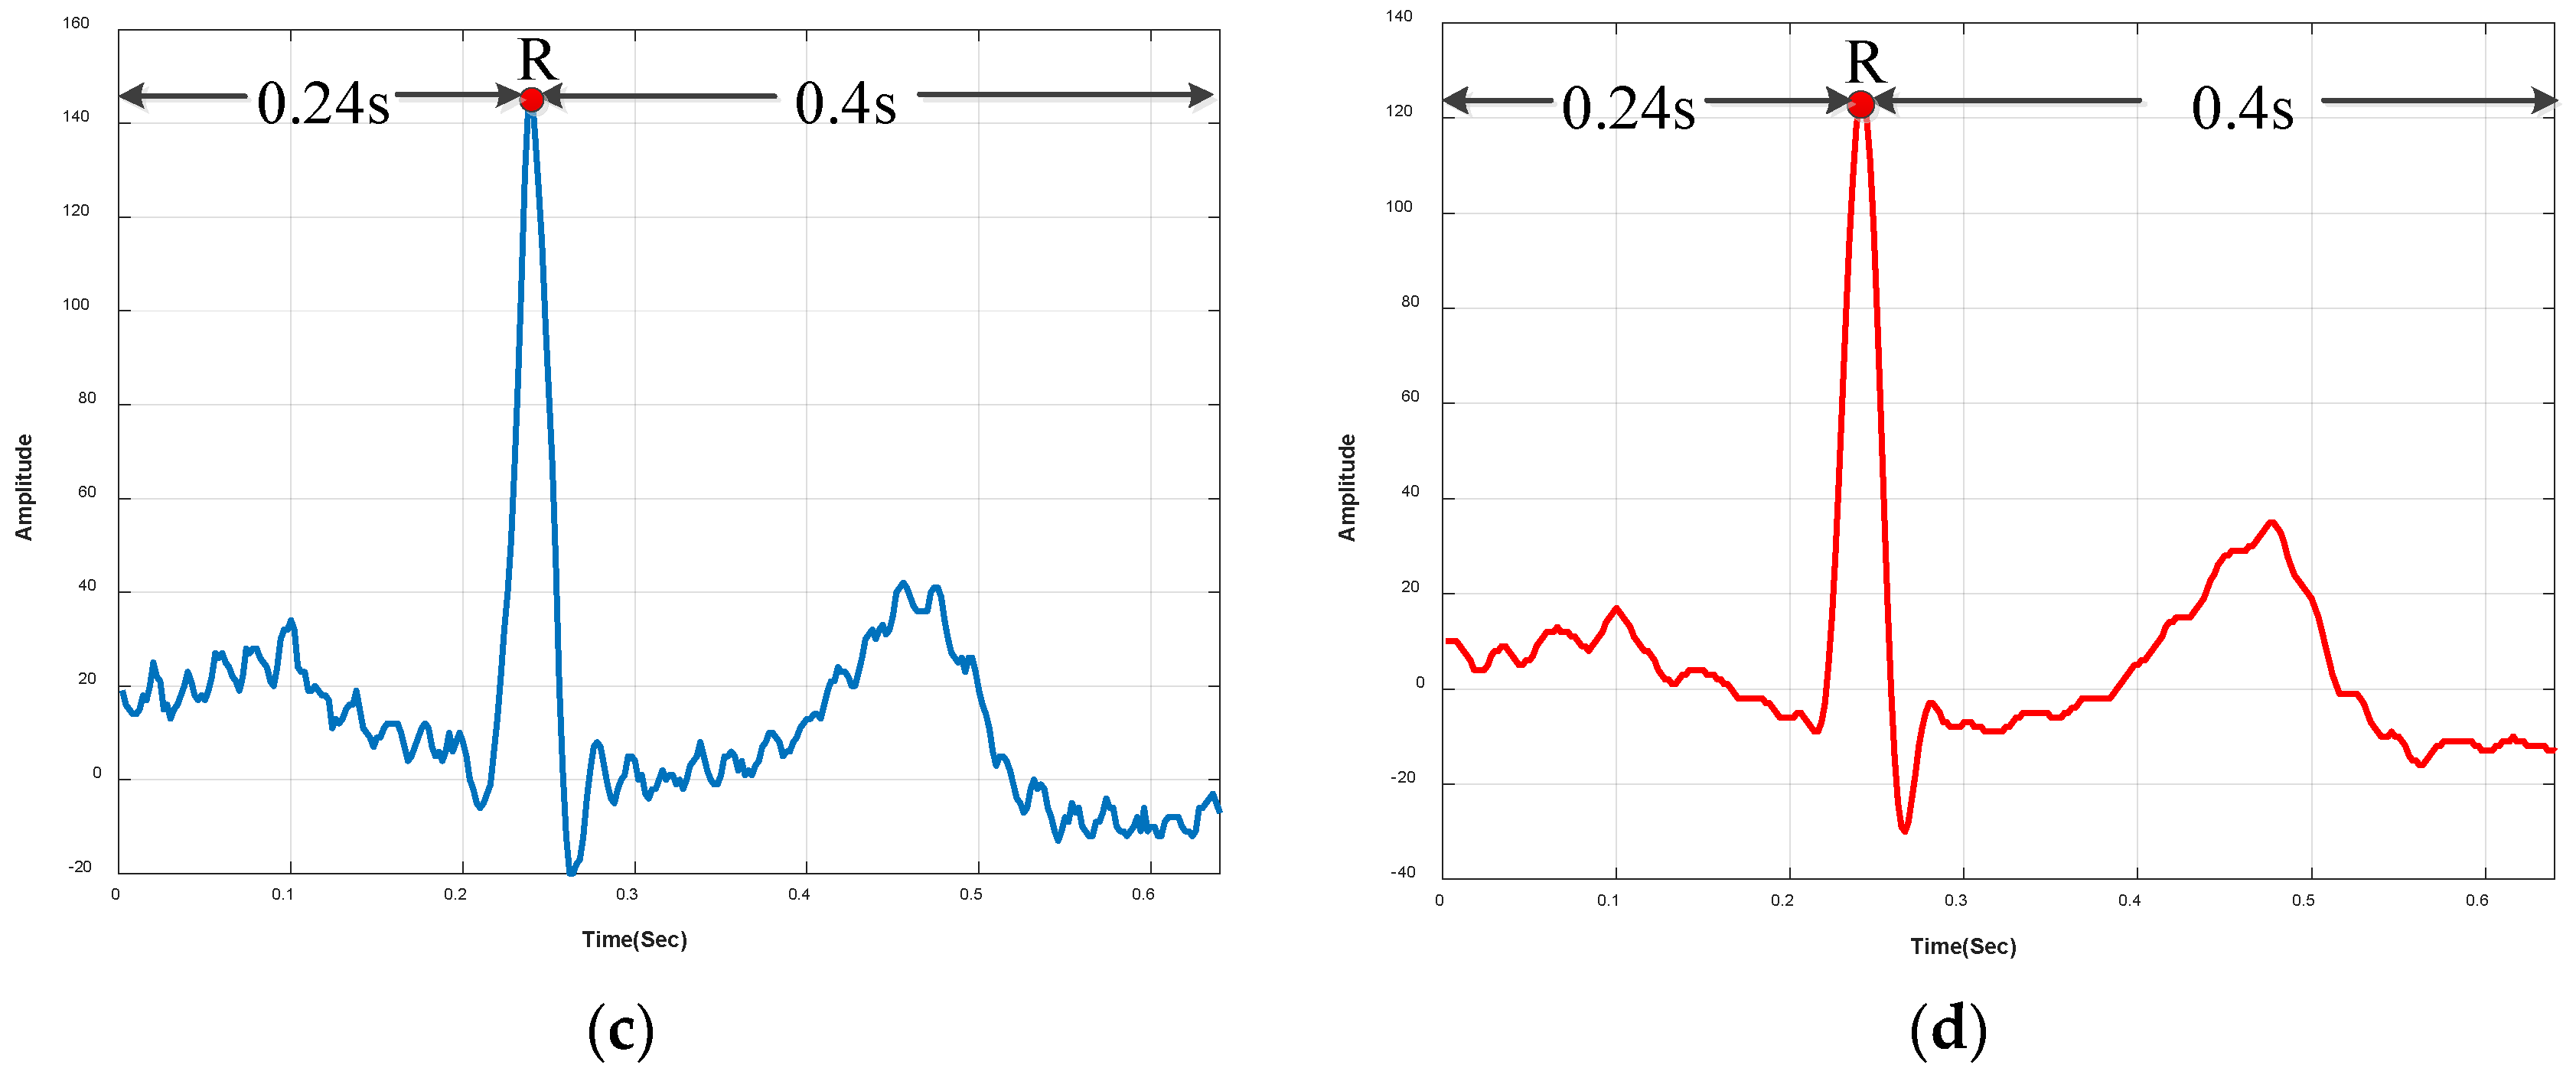
Before and after the detected R peaks, 0.24 s and 0.4 s length waveform are extracted, respectively, to cover the cardiac cycle length. Figure 3 shows two heartbeats, respectively, from Set A (denoised dataset) and Set B (noisy dataset) of ECG-ID and MIT-BIH-AHA databases.

3.2. Feature Selection

As mentioned above, a long ECG signal can be segmented into a series of heartbeats which are comprise such successive characteristic waveforms as P, Q, R, S, and T. These waveforms appear in time order, and have different contributions to ECG biometric identification. In prior literature, Nemirko et al. [5] firstly pointed out that QRS complex did not change significantly with the heart rate varying, and was able to perform as a stable characteristic. Later, Tuerxunwaili et al. [31] found that using only three QRS based features was sufficient to identify a subject, which further highlighted the importance of QRS complex. Actually, to our knowledge, nearly all the existing ECG based biometric identification methods have taken QRS complex or its related form as features. Furthermore, QRS, T wave was also reported by Francesco Gargiulo to be necessary to improve the performance of ECG identification [32]. Even though the research of Simova [33] reported that QRS and T-wave amplitude would attenuate with age increasing, there is still no evidence that the slope and area information of QRS and T will change at the same time. Actually, Mikhail Matveev [34] demonstrated that QRS complexes of ECG recordings which were acquired 5 years apart, still had a strong correlation. Based on the above, we can reasonably conclude the feature information of QRS and T wave contributes the most to ECG biometric identification.
To extract QRS and T wave information from noisy ECG signals, our idea is to decompose raw ECG signals into multiple levels, and each decomposed level represents different frequencies. By selecting appropriate levels corresponding to QRS and T, the unwanted interference will be removed. Based on this idea, a QRST-targeting feature selection method, which consists of two parts: decomposition and selection, is proposed.

3.2.1. Decomposition

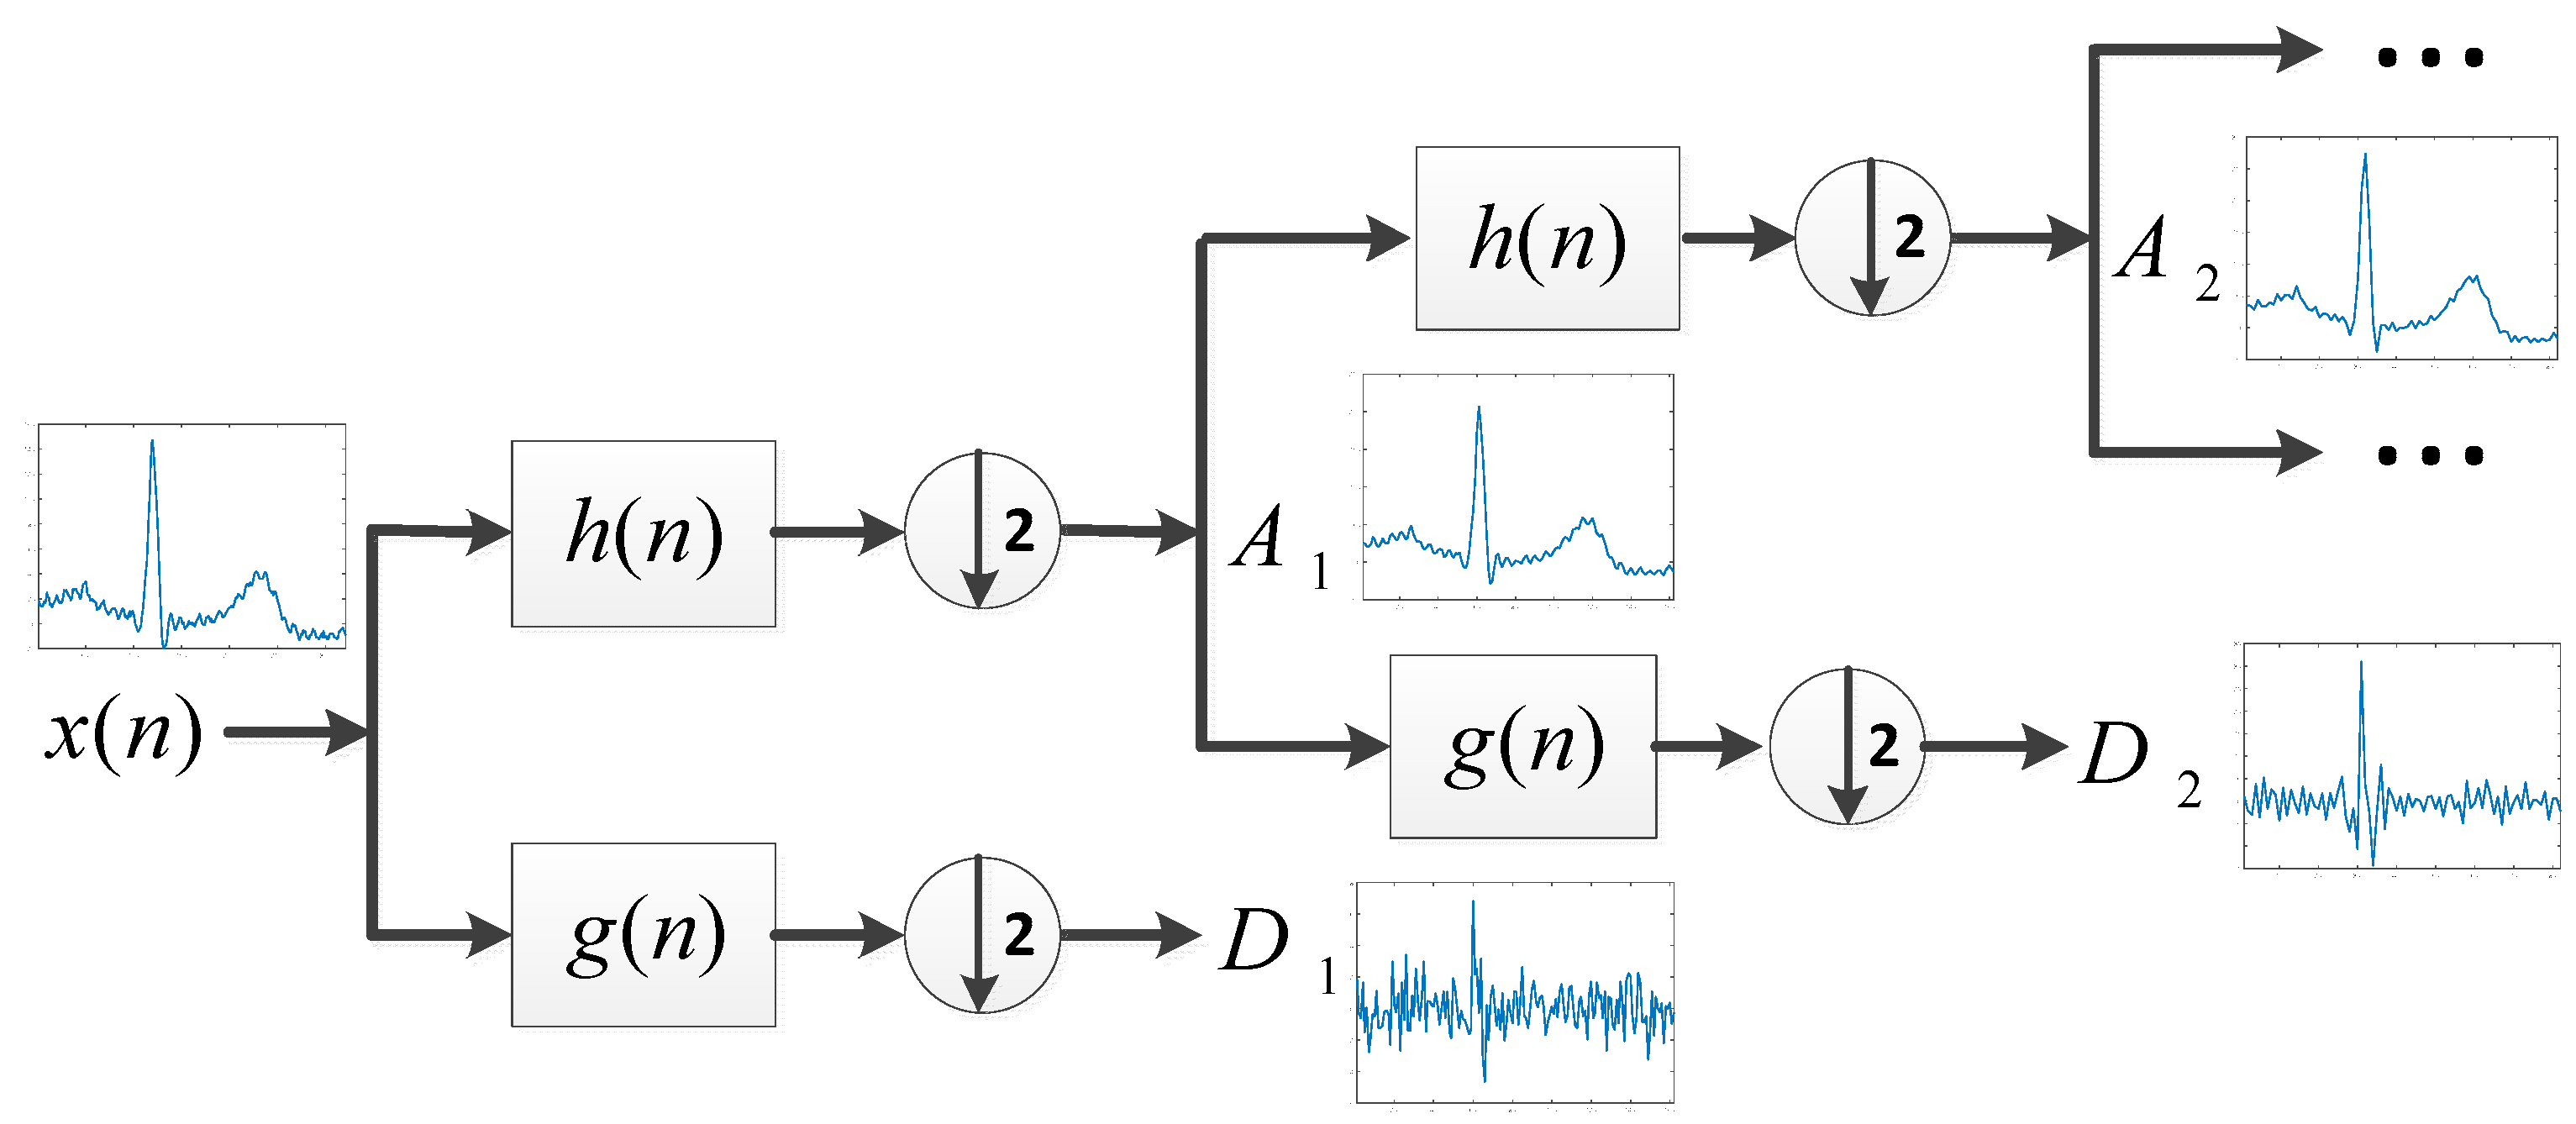
For signal decomposition, discrete wavelet transform is adopted in this work because of its capability to analyze complex non-stationary signals in both frequency and time domain. Generally, the Mallat algorithm [35] can provide an efficient way to realize DWT. The procedure of multiresolution decomposition of a given heartbeat x ( n ) is shown in Figure 4. At the first level, the heartbeat is firstly filtered by two filters, respectively, which are a high-pass filter g ( ) and a low-pass filter h ( ) both associated with the chosen mother wavelet. Then the two obtained filtered signals are downsampled to get the decomposed signals. Here, the symbol 2 represents downsampling the filtered signals by two. The D 1 and A 1 refer to the detail and approximation coefficients of the first level decomposition, respectively. After that, by repeating the procedure of the first level, the approximation A 1 can be further decomposed at the second level using the same filters. As the process continues, the input heartbeat is decomposed into multiple detailed and approximation coefficients, which provide ECG information in the localized time and frequency domain. In our work, the decomposition level was set to 9, and Daubechies order 2 (db2) was selected as the mother wavelet due to its excellent performance in ECG analysis [36]. Here, the function wavedec in MATLAB is employed to realize discrete wavelet decomposition. For each heartbeat, the detailed coefficients of each level and the approximation coefficients of the last level were kept for further use.

3.2.2. Selection

To select QRST information and remove interference, frequencies of coefficients from different levels should be identified. According to the Nyquist sampling theorem, the maximum frequency contained in the signal is half the sampling frequency. Thus, for the ECG-ID and MIT-BIH-AHA databases, which have a sampling frequency of 500 Hz and 360 Hz, respectively, the highest frequency of contained signals can reach 250 Hz and 180 Hz.
During DWT, the filtering process of each level will halve the frequency band of the input [37]. As a result, the frequency band of the outputted detail and approximate coefficients, respectively, span half of the previous frequency band. For example, when the input signal frequency is 250 Hz, the approximation coefficients output by the low-pass filter covers the frequency span of 0 to 125 Hz and the detail coefficients output by the high-pass filter covers the frequency span of 125 to 250 Hz. In this paper, applying 9-level DWT to the signal gives nine detailed levels and one approximation level. Distribution of frequencies versus different levels is shown in Table 1:
According to the frequencies of QRS (0–37 Hz (±5 Hz)), T (0–8 Hz (±2 Hz))) and baseline wander (less than 0.5 Hz), wavelet coefficients ranging from 0.488 Hz to 62.5 Hz (0.351 Hz to 45 Hz) are selected as the initial feature for ECG-ID (MIT-BIH-AHA) database. In Table 1, the frequencies of the wavelet coefficients which are used for further feature learning are highlighted in bold. In this way, temporal-frequency information of QRST is extracted, and an identity-irrelevant component can be removed as much as possible.

3.3. Feature Learning

Even though the proposed feature selection method can retain identity information in both the time and frequency domains, the obtained feature can hardly be used for direct classification. The aim of this section is too prominent discrepancy among different subjects and extract a discriminative feature. In our work, by stacking multiple layers, autoencoder could learn complex functions, and represent the original data more effectively and compactly. The automatic feature extraction process performed by the autoencoder is called feature learning.

3.3.1. Sparse Autoencoder (S-AE)

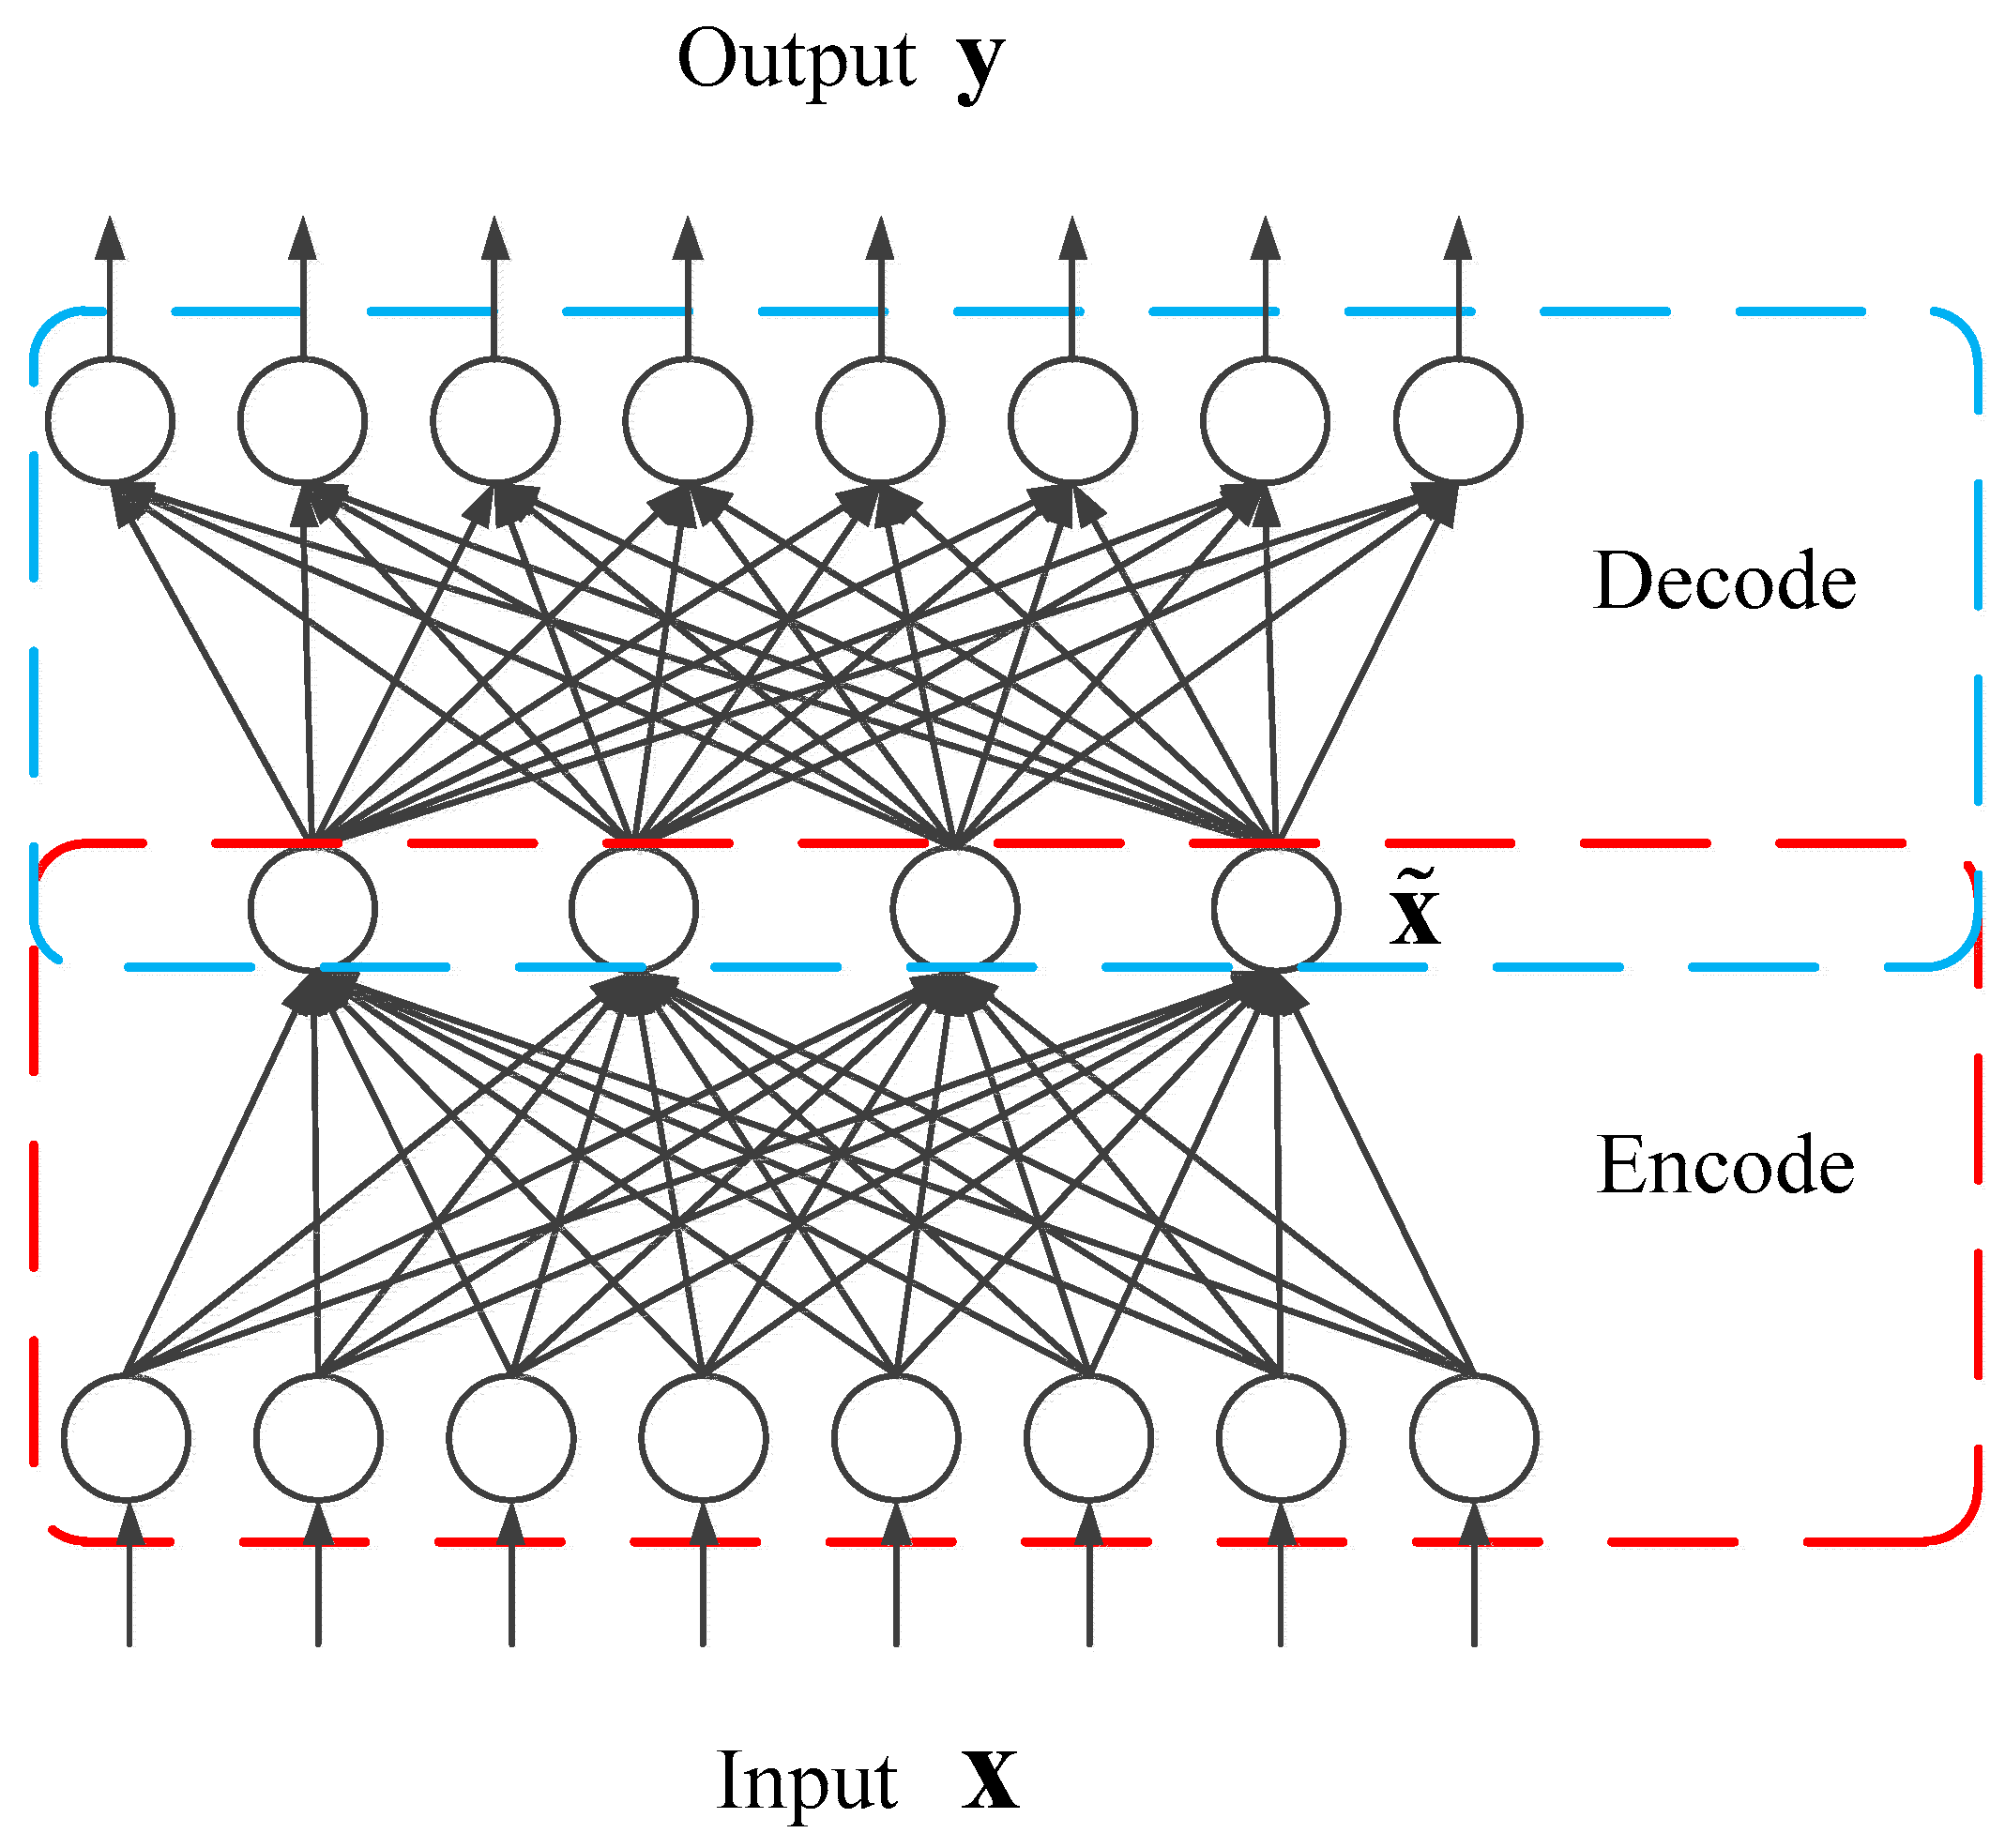
A basic autoencoder is designed as a three-layer network, including the input layer, the hidden layer, and the output layer. By nonlinear mapping, this network tries to approximate an ideal function, so as to minimize the error between the input and the output. In this way, the abstract representation at the hidden layer is considered to contain important information of the original input and can be taken as a high-level feature. Generally, the whole process of an autoencoder, whose architecture is shown in Figure 5, can be divided into two stages: encoding and decoding. Both the encoding and the decoding are forward propagation processes, which conduct nonlinear transformation by using an activation function. Specifically, the encoding transforms the original input into the abstract representation, and the decoding recovers the representation with the purpose of reconstruction error minimization.
Formally, an example x R n is firstly transformed into a middle version x ˜ by a function x ˜ ~ h ( x ˜ | x ) in the encoding stage. This function can be implemented by Equation (3).
x ˜ = h ( x ) = f ( j = 1 m W 1 · x + b 1 ) ,
f ( z ) = 1 / ( 1 + exp ( z ) ) ,
where f ( ) is a non-linear activation function, typically a sigmoid function, W 1 R n × m is a weight matrix connecting the input and the hidden layer and b 1 R m is a bias vector. The size of input data and the number of the hidden unit both determine the topology structure of the autoencoder.
Then the decoding maps the middle representation to the reconstruction y R n . The reconstruction can be implemented by Equation (5):
y = f ( W 2 · x ˜ + b 2 ) ,
where W 2 R m × n is a weight matrix connecting the hidden layer and the output layer, and b 2 R n is a bias vector. When a set of samples X = ( x ( 1 ) , x ( 2 ) , , x ( m ) ) are given, the autoencoder training process aims to find parameters W 1 , W 2 , b 1 , b 2 to minimize the reconstruction error. Assume W = { W 1 , W 2 } , b = { b 1 , b 2 } , the cost function of the autoencoder network can be expressed as below:
J ( W , b ) = 1 m i = 1 m ( 1 2 h W , b ( x ( i ) ) x ( i ) 2 ) + λ 2 i = 1 2 j W i j 2 ,
where h W , b ( z ) represents the reconstruction result of an example z after passing through the whole transformation process of the autoencoder. The second term λ 2 i = 1 2 j W i j 2 is called the regularization term, which represents the square sum of all weights with a hyper-parameter λ and helps to avoid overfitting.
Furthermore, to avoid simply repeating the input and capture important information, sparsity constraint is further imposed on the autoencoder network. As a result, an additional penalty term is added:
P p e n a l t y = j = 1 S 2 K L ( ρ ρ j ) ,
where S 2 is the neuron number of the hidden layer, and ρ j represents the average activation of the j -th hidden unit. Suppose that a j ( x ) denotes the activation of j -th the hidden unit, ρ j can be depicted as Equation (8). Here K L ( ) is the Kullback–Leibler (KL) divergence, which is expressed in Equation (9).
ρ j = 1 m i = 1 m a j ( x ( i ) ) ,
K L ( ρ ρ j ) = ρ log ρ ρ j + ( 1 ρ ) log 1 ρ 1 ρ j ,
where ρ is a sparsity parameter. The penalty function possesses the property that K L ( ρ j ρ ) = 0 if ρ j = ρ . Otherwise, KL-divergence would approach infinity when ρ j is close to 0 or 1. With the sparse penalty term added, the cost function is modified as:
J s p a r s e ( W , b ) = J ( W , b ) + β P p e n a l t y ,
where β is the weight of the sparsity penalty. This cost function aims to make the reconstruction equal to the input as much as possible. Its parameters ( W , b ) can be updated with methods such as stochastic gradient descent approach and Limited-memory BFGS (L-BFGS) algorithm.

3.3.2. Softmax Classifier

For a multi-class classification problem, Softmax classifier is usually conjunct with the neural network to classify the learned features. Softmax classifier is the multi-classifier extension of logistic regression, and can output k values representing the probabilities. Especially, for a feature vector x ( i ) classified by the Softmax classifier, the k values can be depicted as Equation (11).
h θ ( x ( i ) ) = [ p ( y ( i ) = 1 | x ( i ) , θ ) p ( y ( i ) = 2 | x ( i ) , θ ) p ( y ( i ) = k | x ( i ) , θ ) ] = 1 j = 1 k e θ j T x ( i ) [ e θ 1 T x ( i ) e θ 2 T x ( i ) e θ k T x ( i ) ] ,
where θ 1 , θ 2 , , θ k depict the parameters of the Softmax. The class of the input feature vector corresponds to the one with the maximum value in all categories. For the realization of the process of feature learning and classification, MATLAB toolkit DeepLearnToolbox was utilized, and its MATLAB code can be downloaded from [38].

3.3.3. Stacked Sparse Autoencoder

In application, single S-AE (Sparse Autoencoder) may not be able to provide a sufficient way to model data structure. Thus multiple S-AEs are usually stacked together to form deeper architecture and learn high-level abstract features. In this research, the parameter settings of the used S-AEs are shown in Table 2.
Figure 6 shows the overall framework of feature learning and classification, which includes the following steps:
(1) Normalization: Given a heartbeat sample x ( i ) processed by QRST-targeting selection method, it should be firstly normalized and rescaled into the range [0, 1]. In this work, min–max normalization is adopted to realize the process, which can be seen in Equation (12)
x ( i ) = x ( i ) x min ( i ) x max ( i ) x min ( i ) ,
where x min ( i ) and x max ( i ) , respectively, represent the maximum and minimum value in feature vector x ( i ) . The function mapminmax in MATLAB was adopted to realize normalization in this work.
(2) Initialization: The original data set is divided into two parts: the training set and the testing set. Meanwhile, the network parameters W and b are initialized randomly, and related hyper parameters, such as maximum epochs, are set to proper values.
(3) S-AE training: After related parameters are initialized, L-BFGS is used for performing back-propagation, which continuously adjusts the weights and biases to minimize the reconstruction error. Specially, we trained the S-AEs using a layer-wise way, in which each S-AE is trained individually, and the hidden layer output of the previous layer is taken as the input of the subsequent layer. After training, with the output layer removed, the obtained S-AEs are stacked together.
(4) Fine-tuning: A Softmax classifier is added to the end of the stacked S-AEs. By taking advantage of the label knowledge of the trained data, this Softmax classifier fine-tunes the whole network to learn the potential discrepancy among subjects. The process of fine-tuning is also back-propagation, which can be realized by such algorithms as L-BFGS.
(5) Testing: By now, the whole network has been well trained. When a test sample is input, the network will obtain its abstract representation and output its identification result at the Softmax layer.

3.4. Multiple-Heartbeat Identification

With a heartbeat sample as input, the network will assign it a label at the last layer. To get the final decision of a whole signal, we make heartbeats which come from the same signal vote. Based on the results, the class ranking the first in voting number is considered as the label of the estimated signal. As shown in Figure 1, three heartbeats from the same signal are firstly classified as “Label A”, ”Label A” and “Label B” by the Softmax during the single-heartbeat identification process. Then in the multiple-heartbeat identification, three heartbeats vote to decide the signal label. As a result, “Label A” gets 2 votes and “Label B” gets 1 vote. Since “Label A” ranks the first in voting number, the label of the signal is considered as “Label A”.

4. Experiments

4.1. Experimental Setup

For the training of the sparse autoencoder, the toolkit minFunc which implements L-BFGS was employed to optimize network parameters. In this work, the epoch numbers of training and fine-tuning were both set to 400. After each epoch, the proposed method validates the S-AEs model. Out of the whole training ECG heartbeats, 7/10 was used for training and the rest 3/10 for validation.
To convincingly evaluate the proposed method, in the Two-recording scheme, two recordings of each subject from the ECG-ID were alternately taken as the training set, and the rest one was used as the testing set. When it comes to the All-recording scheme, the difference is that when one subject has over 5 recordings, its number of recordings used for training became two. All the recordings of each subject take turns to serve as the training data, and the rest of the recordings were used for testing. Here all the recordings of the ECG-ID which are taken into experiments are 20 s-length. For the MIT-BIH-AHA database, we separated the signal of each subject equally into 10 segments in time order. Heartbeats of 1 segment (3 min-length) are used in the training of S-AE while those heartbeats of 9 segments are used for testing. The approach is iterated 10 times by shifting the training data. For both of the two databases, performances, such as single-heartbeat identification accuracy and multiple-heartbeat (signal) identification accuracy, are evaluated during each iteration. At last, the performances of all iterations are averaged to obtain an overall performance of the proposed method.
Experiments were all made in MATLAB 2017a (MATLAB, 2017a, MathWorks, Natick, MA, USA).

4.2. Results

4.2.1. Performance Evaluation with the Training and Validation Data

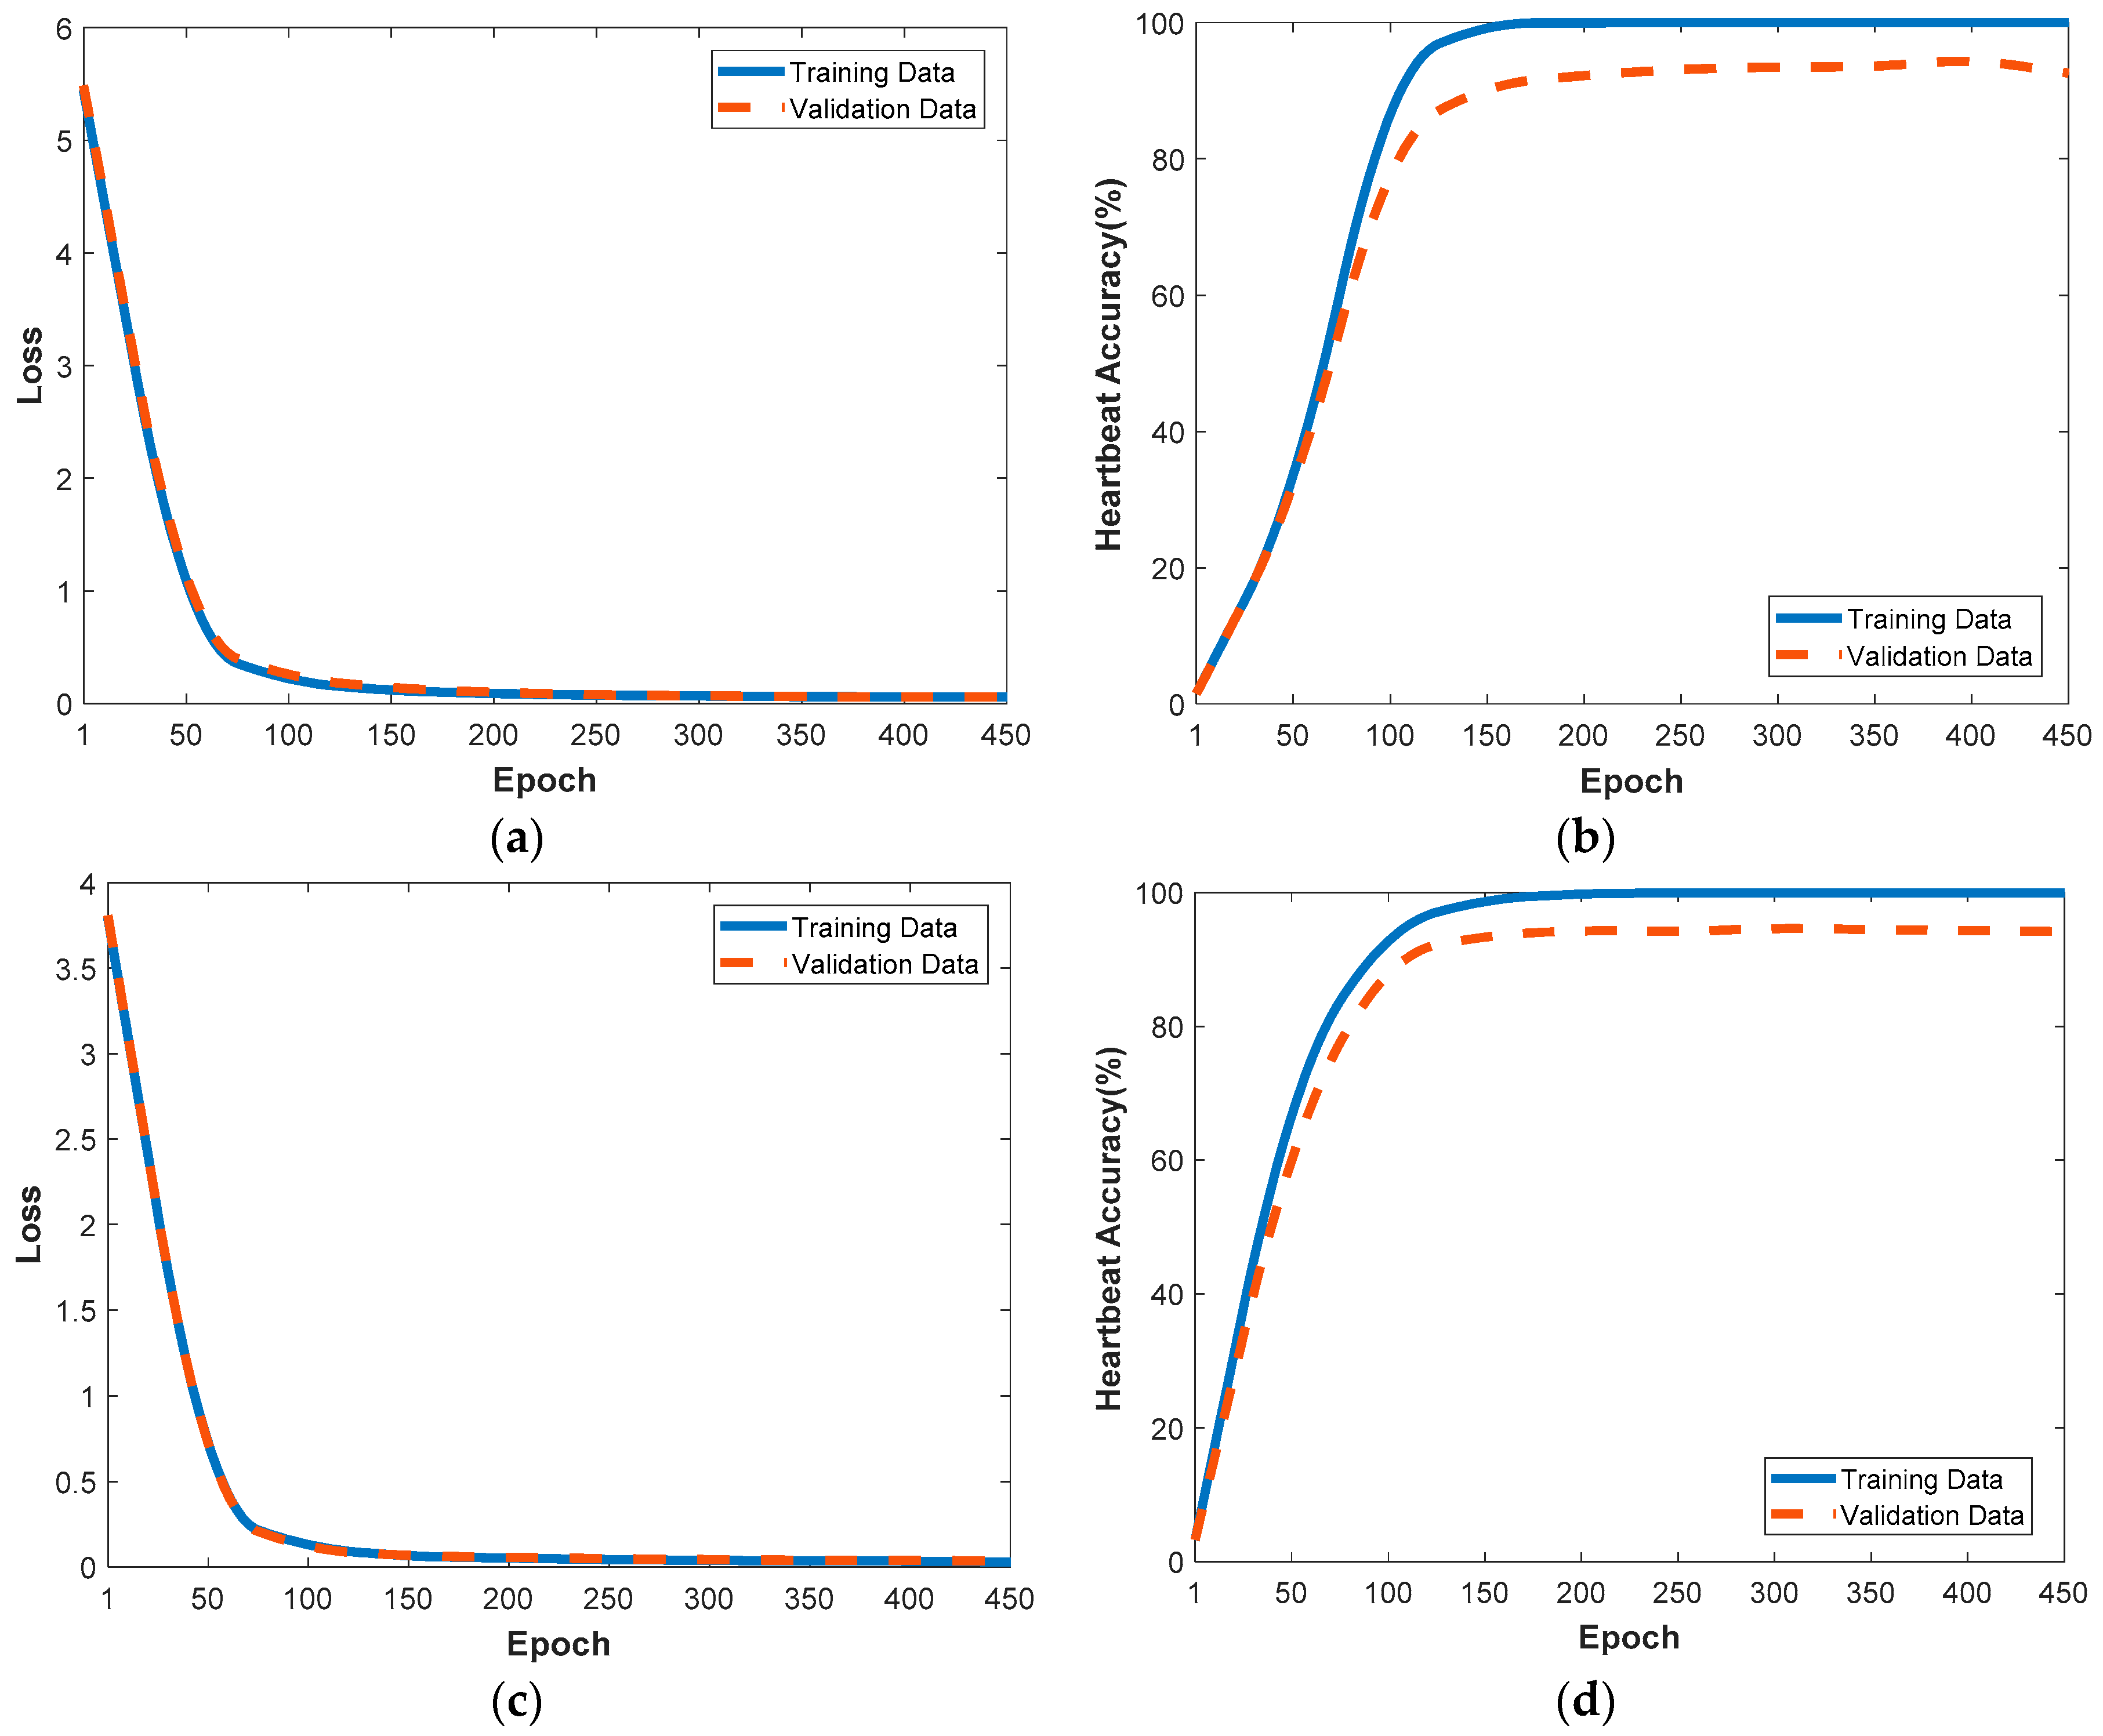
During training, the mean square error (MSE) function was adopted as the loss function, and the parameter optimization problem was solved by the L-BFGS algorithm, which is realized by the minFunc toolkit [39]. The training and validation processes of S-AEs on two databases are exhibited in Figure 7. Here the S-AEs are trained on the training data with true identity labels and then tested on both of the training and validation data. According to Figure 7, the training and validation curves show similar convergence forms on both the loss and the accuracy. With the epoch number growing, the loss becomes much smaller, and the accuracies on the training and validation data both increase significantly. When the epoch is 400, the constructed model can achieve 100% single-heartbeat identification accuracy on the training data, and over 95% single-heartbeat identification accuracy on the validation data. At the same time, train losses on the training and validation data are close to 0. The above indicates that the constructed network model can effectively learn most of the discriminative patterns in ECG data, and does not have the over-fitting problem.

4.2.2. Reconstruction of Temporal-Frequency Curves with S-AEs

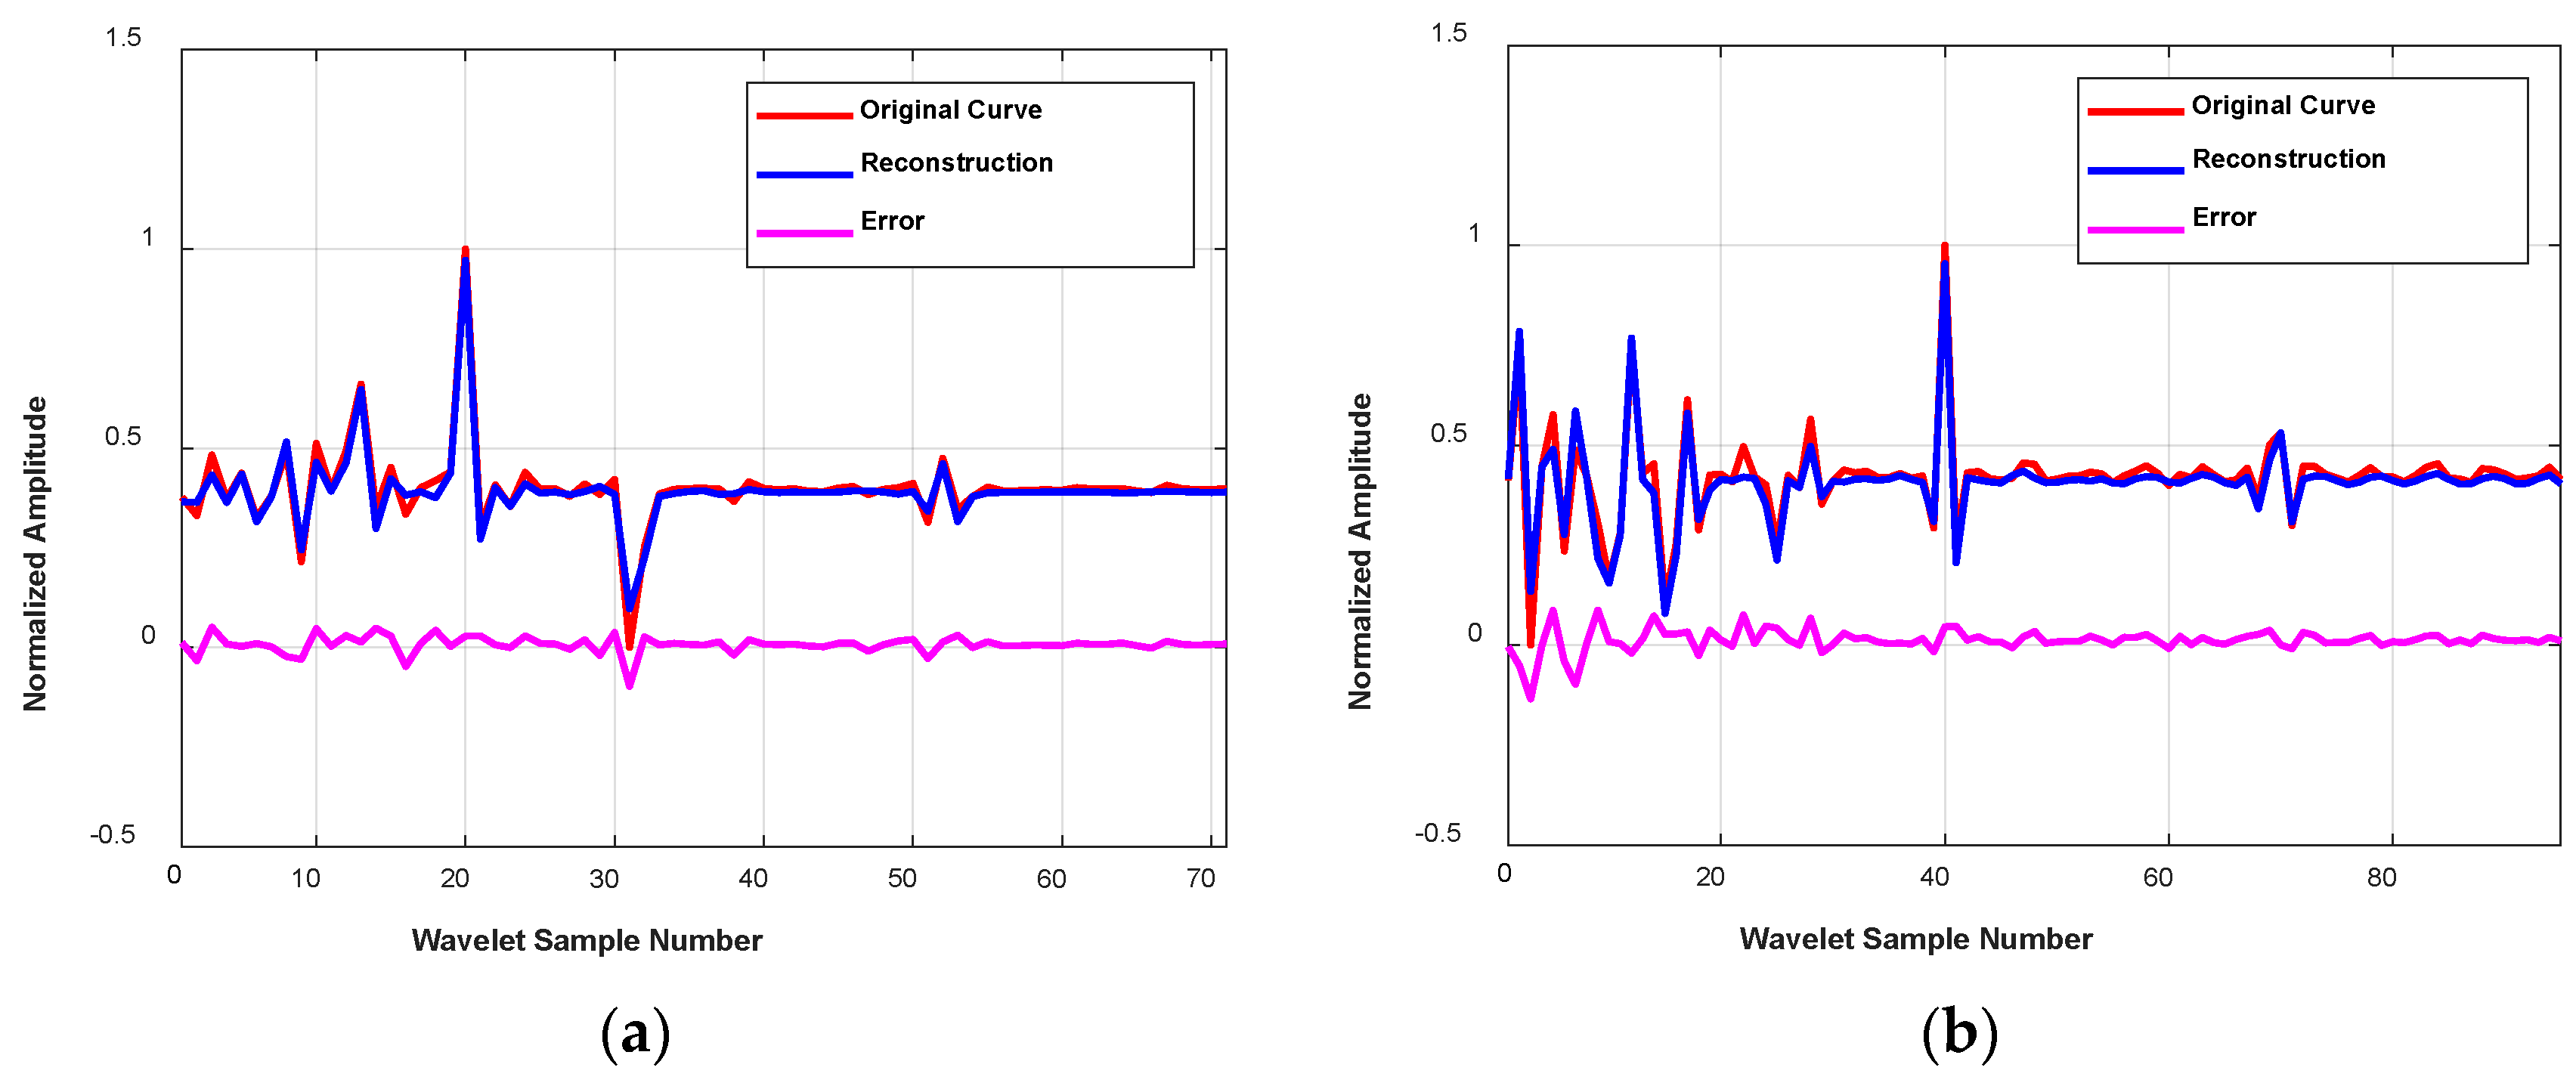
For the neural network based classification system, the quality of learned features directly determines the final classification performance. When it comes to an autoencoder, one important indicator to evaluate its feature learning ability is how well it can reconstruct the original curve based on the information provided by its hidden layer. Generally, good reconstruction means the hidden layer contains enough and necessary information about the input data. Figure 8 shows the reconstructions operated by the proposed S-AEs on examples from the ECG-ID and MIT-BIH-AHA databases. It can be observed that when comparing the curves of the original and the reconstruction, little error exists. On both figures, the reconstruction and the original have the same trend from the overall perspective, and similar amplitude at each point. Furthermore, average mean square errors of 0.13 and 0.08 were obtained, respectively, for all heartbeats of the ECG-ID and MIT-BIH-AHA, both of which were at a small error level. Based on the above, the proposed S-AEs can be thought of as an effective feature learning method for ECG data.

4.2.3. Noisy vs. Denoised

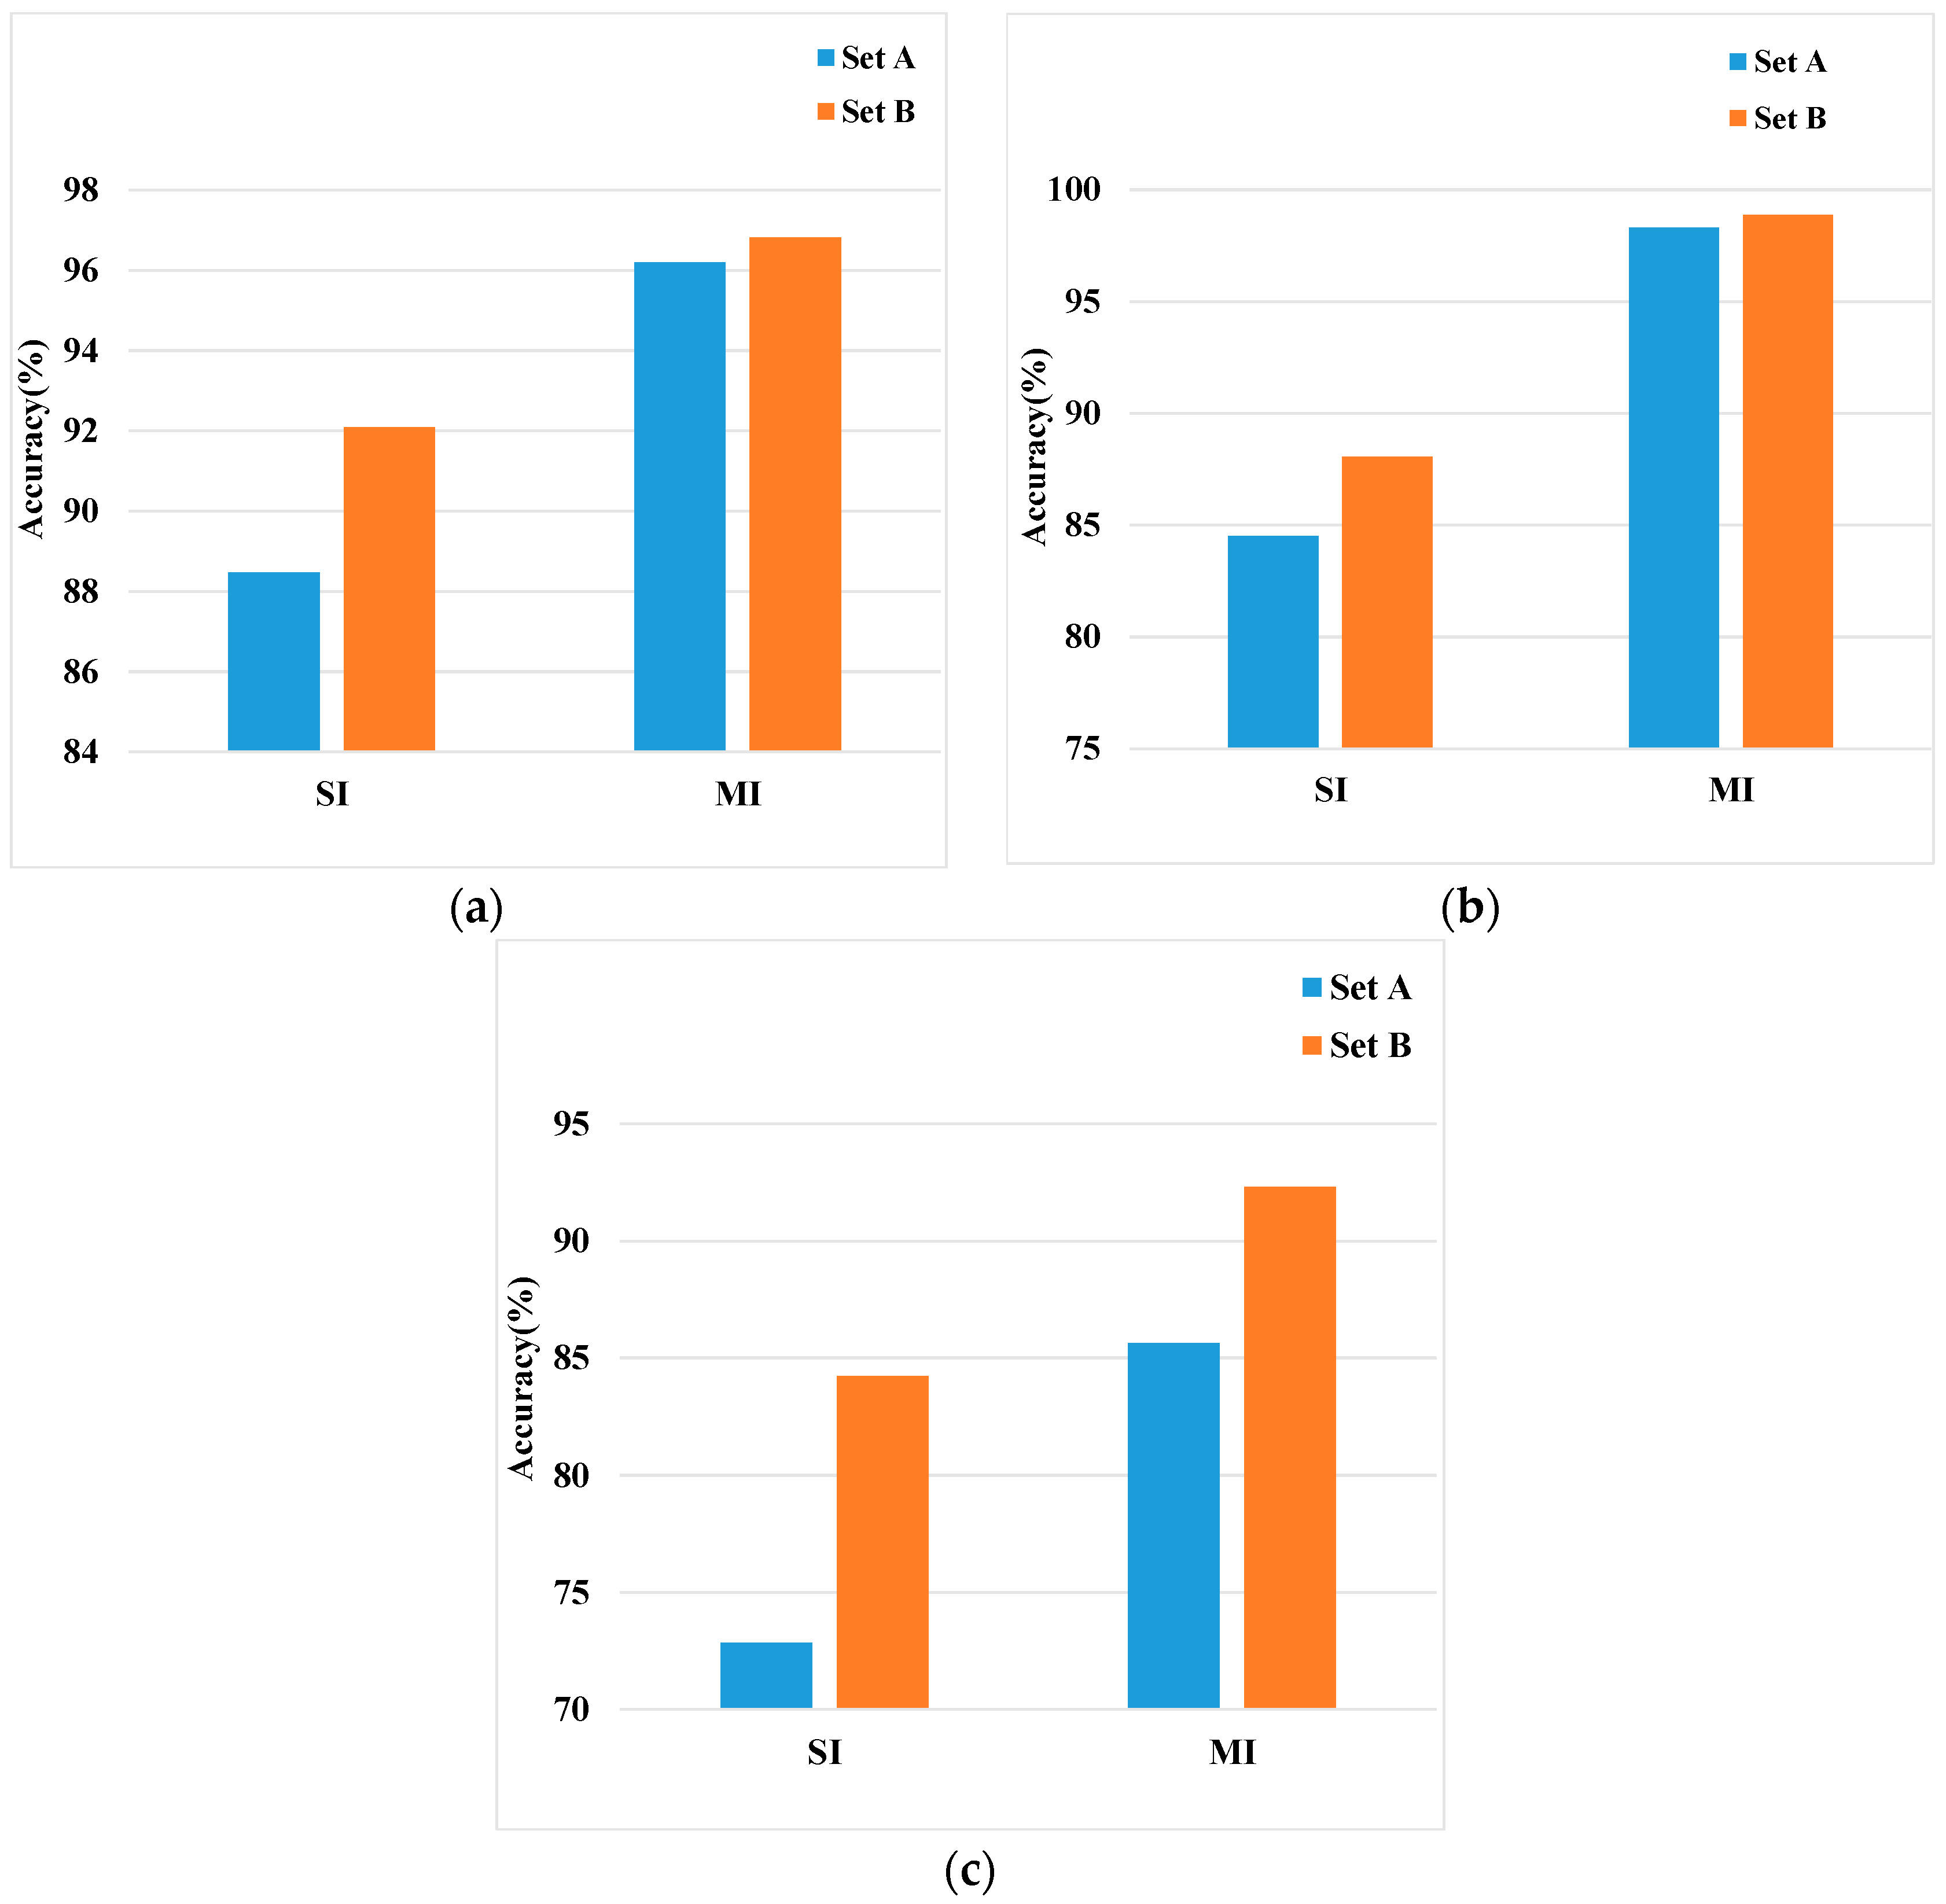
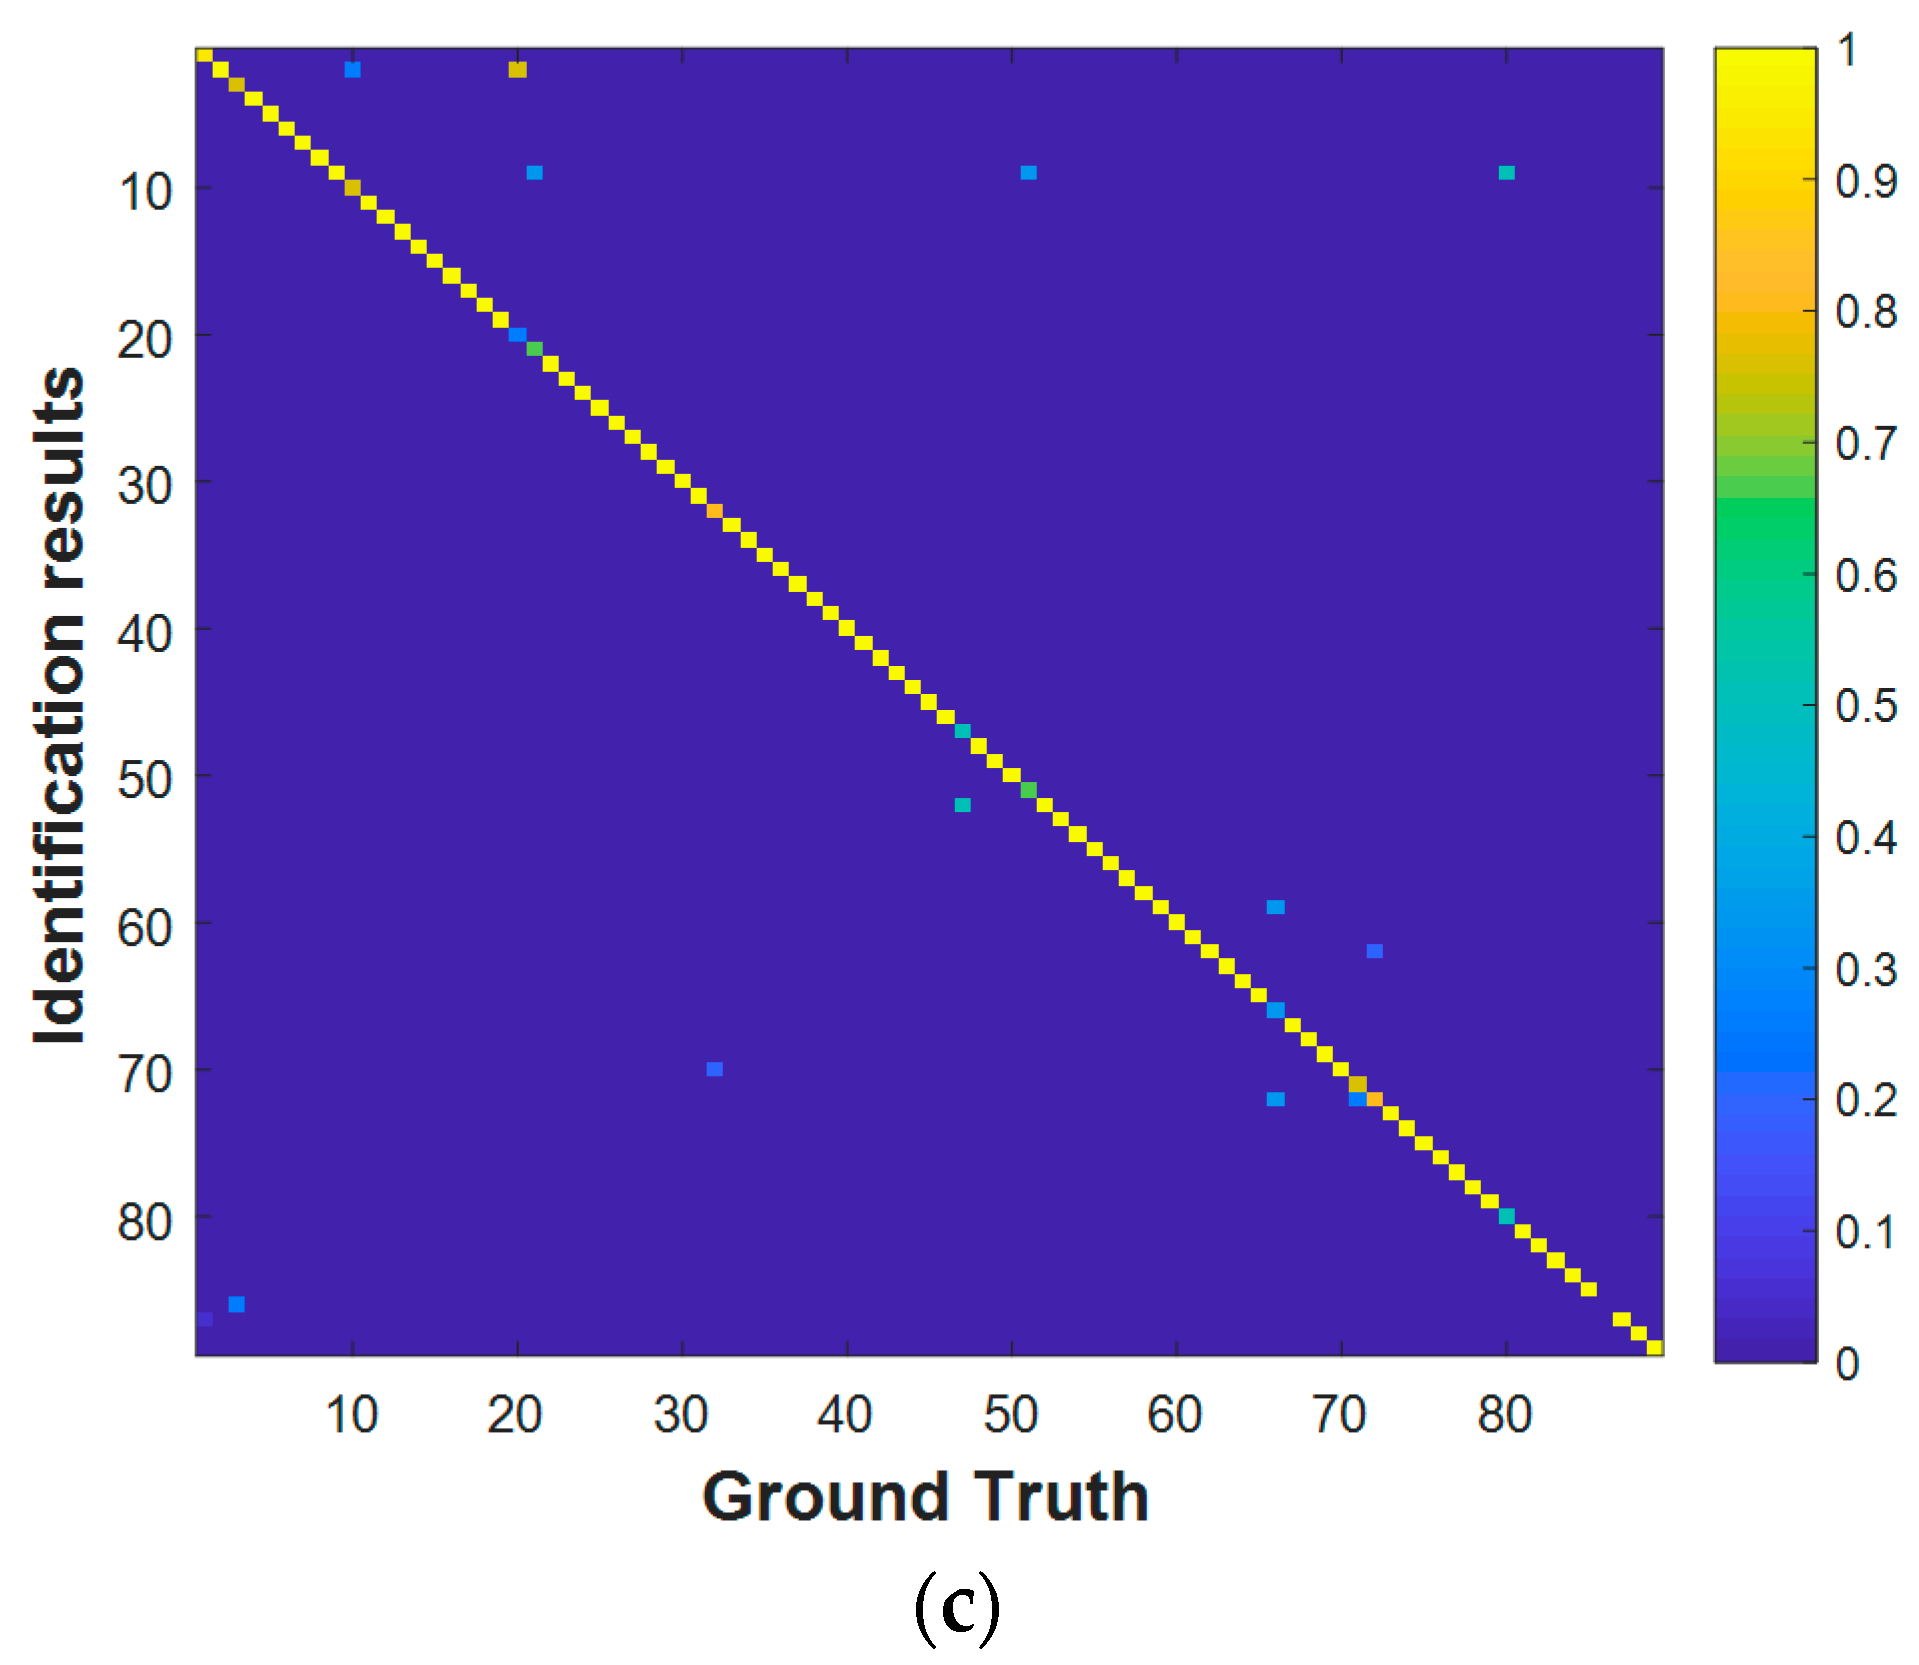
To validate the effectiveness of the proposed method for noisy ECG signals, both single-heartbeat and multiple-heartbeat identification accuracy were compared on Set A (denoised data) and Set B (noisy data). Figure 9 shows the obtained experimental consequences. According to Figure 9, it can be observed that with Set A (denoised data), the proposed method acquired 84.52%/88.47%/72.86% single-heartbeat identification (SI) accuracy and 98.31%/96.20%/85.64% multiple-heartbeat identification (MI) accuracy on the ECG-ID (Two-recording)/MIT-BIH-AHA/ECG-ID (All-recording). Relative to the results of previous methods, the accuracies are at a high level. When it comes to Set B (noisy data), average SI and MI accuracy of 88.04%/84.22% and 98.87%/92.3% were achieved on the ECG-ID (Two-recording)/ECG-ID (All-recording), and those of 92.09% and 96.82% were obtained on the MIT-BIH-AHA. Compared with the results of Set A, the proposed method achieved competitive or even higher performance using noisy data in all cases. That may be because, without denoising, some potential information useful for identification is well retained. Figure 10 presents the confusion matrices of the proposed method evaluated on Set B of two databases. It can be seen that nearly all the signals from both of the two databases are well identified, which indicates that the proposed method can provide an efficient way for feature extraction from noisy ECG data. In our subsequent experiments, Set B of the two databases is taken as the dataset to evaluate the proposed method under noisy condition.

4.2.4. Comparison of Different Features

To verify the effectiveness of DWT feature selection, with the feature learning process (S-AE) and classifier (Softmax) fixed, results of features which contain various temporal-frequency information were compared. The compared features can be seen below:
  • Time domain feature: after ECG signal segmentation, we directly used the obtained waveform of a cardiac cycle as features. It describes amplitude, slope, and angle of the original signal in the time domain, but contains no frequency information. Thus, we call it time domain feature.
  • FFT (Fast Fourier Transformation) feature: FFT has been widely used in signal processing. Compared with DWT, the FFT feature, which is obtained based on sines and cosines, describes the original signal from a global perspective, ignoring information in localized time and frequency domains.
  • DWT Feature-Selected: according to the knowledge provided by prior literature, we selected wavelet coefficients corresponding to the frequency of QRST as features. Here, the selected feature refers to detail coefficients whose frequency ranges from 0.488 Hz to 62.5 Hz (0.351 Hz to 45 Hz) for ECG-ID (MIT-BIH-AHA).
  • DWT Feature-Low: in addition to the DWT Feature-Selected, this feature further contains the approximation coefficients, which corresponds to frequency 0 to 0.488 Hz (0–0.351 Hz).
  • DWT Feature-High: this feature refers to detail coefficients whose frequency ranges from 0.488 Hz (0.351 Hz) to 125 Hz (90 Hz) for ECG-ID (MIT-BIH-AHA).
Table 3 shows the comparison of different features, and the highest accuracies under all cases are highlighted in bold. As illustrated in Table 3, the FFT Feature yielded the worst performance and proves ineffective for identifying ECG signals. That is maybe because ECG signals are transient in nature (amplitude and frequency information varies over time), and global frequency description can hardly capture localized discrepancies among subjects. Compared with FFT Feature and Time domain Feature, DWT based features achieved better performance in most of the cases by taking localized temporal-frequency information into consideration. In particular, DWT Feature-Selected yielded average SI accuracy and MI accuracy of 88.04%/84.22% and 98.87%/92.3% on the ECG-ID (Two-recording)/ECG-ID (All-recording), respectively, and those of 92.09% and 96.82% on the MIT-BIH-AHA, respectively, which suggests the effectiveness of DWT.
When DWT Feature-Selected is compared with DWT Feature-High, it is noted that even though DWT Feature-High contains more temporal-frequency information, its accuracies do not increase significantly. When it comes to DWT Feature-Low, extra detail coefficients conversely leads to a significant accuracy decrease. The above results suggest that DWT Feature-Selected may have already contained sufficient components for biometric identification, and the additional feature does little help improvement. Furthermore, noise interference may be introduced and worsen the recognition.

4.2.5. Classification with Different Classifiers

To further verify the effectiveness of the features extracted by the proposed method, five widely used classifiers, namely, k-nearest neighbor (KNN), back propagation neural network (BP), random forest (RF), support vector machine with radial basis function kernel (RBF-SVM) and Softmax were adopted and compared. Table 4 depicts key parameter settings of different classifiers which are optimized and obtained based on the validation set.
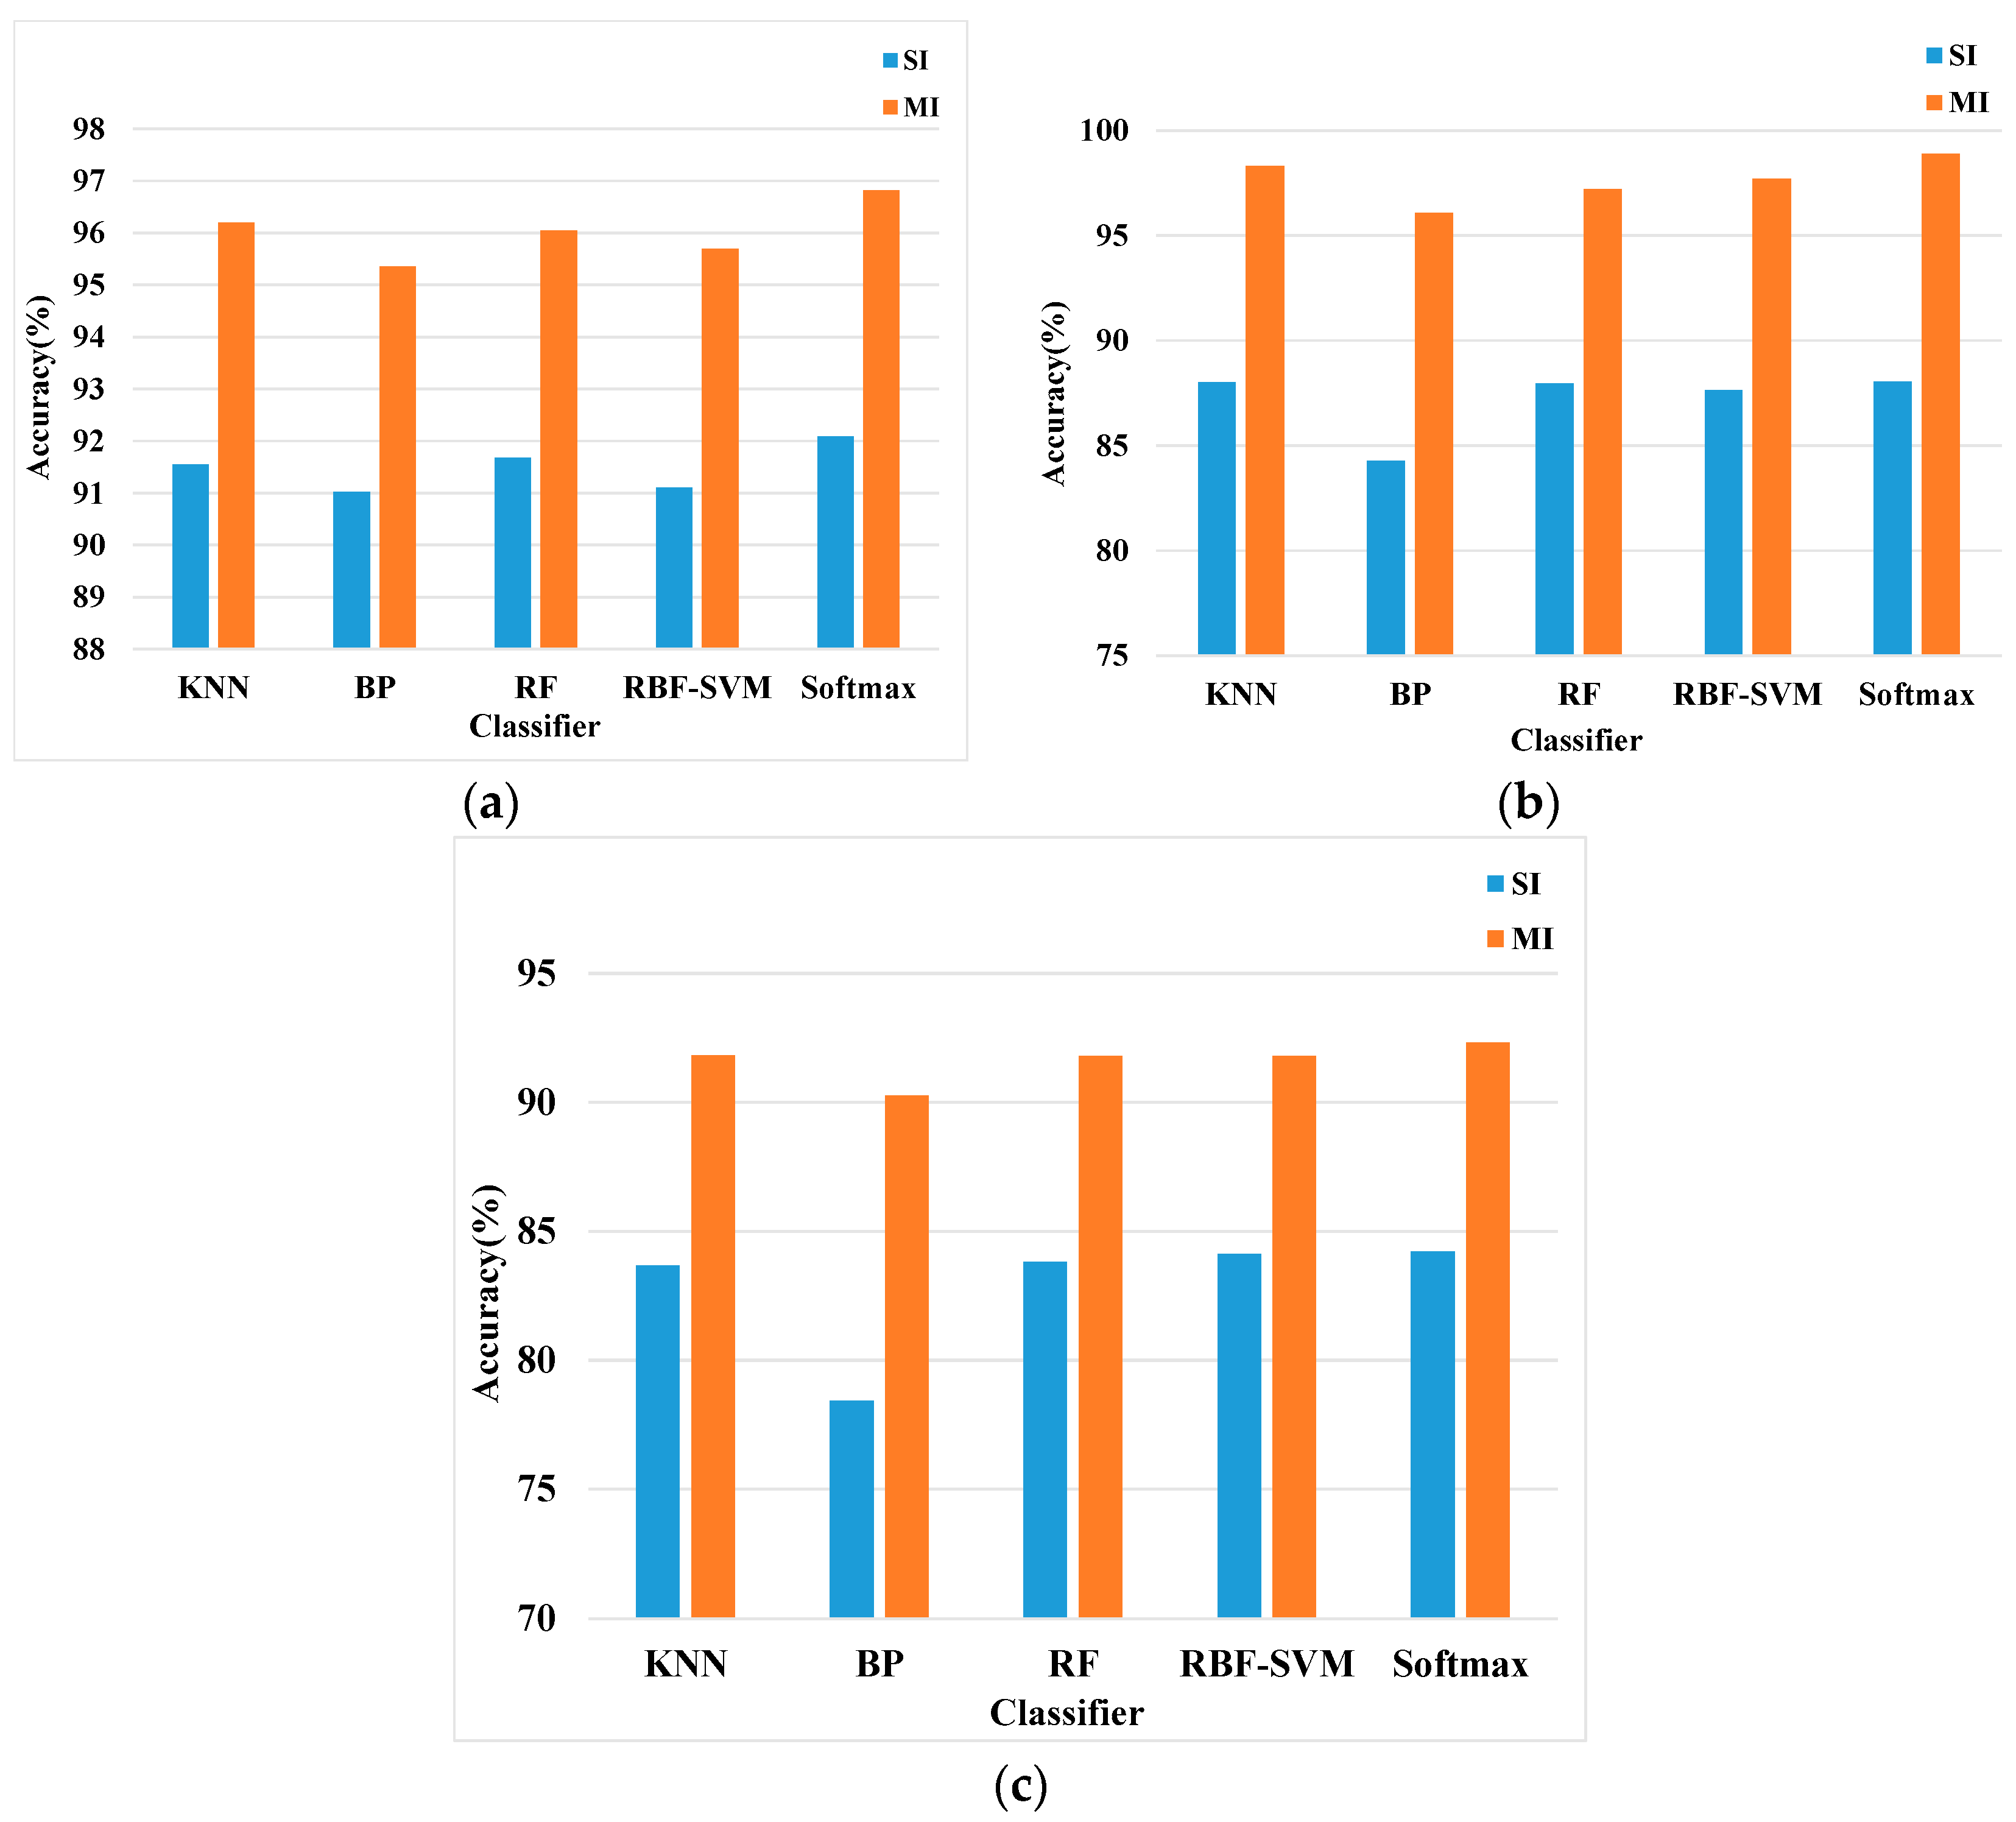
Figure 11 gives the results of the extracted features classified by different classifiers. According to Figure 11, it is observed that using the features extracted by the proposed QRS-targeting selection strategy and S-AEs, all the classifiers could produce Single-heartbeat identification (SI) accuracy over 75% and Multiple-heartbeat identification (MI) accuracy over 90% on both of the databases. The obtained results demonstrate that features extracted by the proposed method can well describe the discrepancies among different subjects, and are effective for ECG identification.

4.2.6. Sparsity vs. Dense

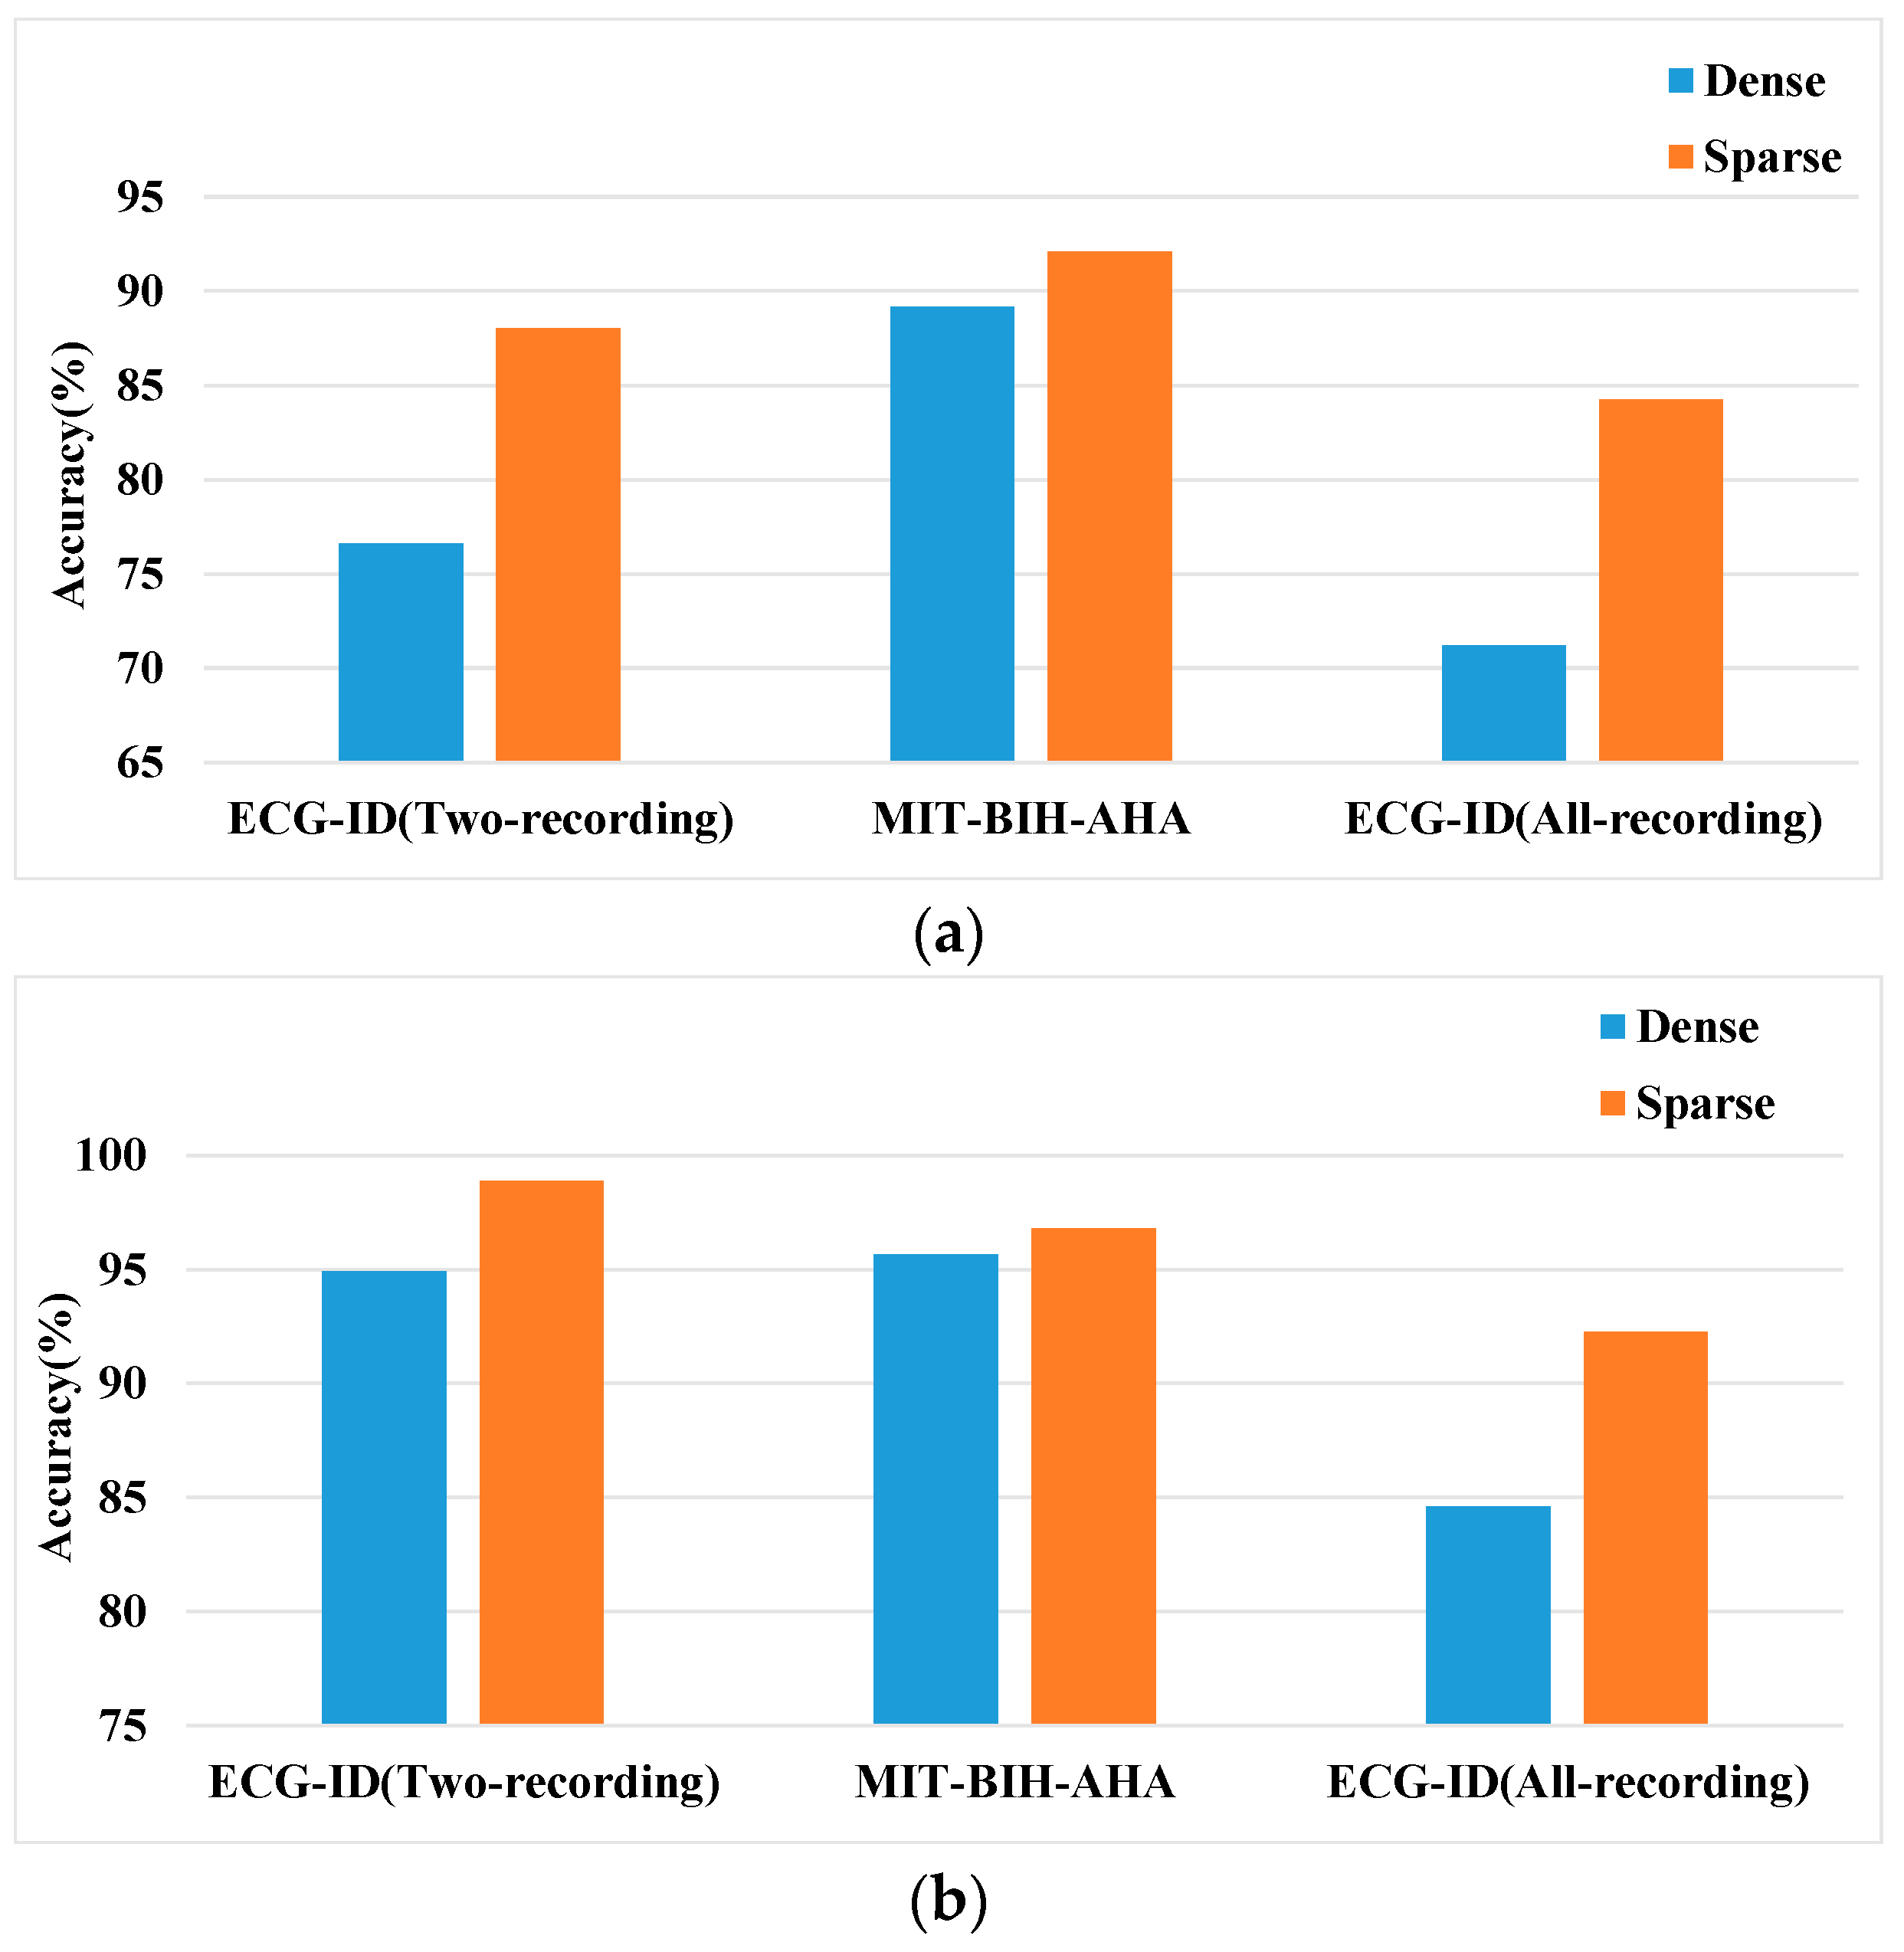
To further validate the effectiveness of the sparsity constraint, we compared the used S-AEs with Dense Autoencoders (Dense-AEs). Here Dense-AEs represents stacked autoencoders without sparsity constraint, whose sparsity penalty weight β is set to 0 during training and testing. Except for the above, Dense-AEs has the same architecture and parameters as S-AEs. The comparison results of the identification performances on different databases are shown in Figure 12.
According to Figure 12, the Dense-AEs achieved average SI and MI accuracy of 76.61%/71.19% and 94.94%/84.61% on the ECG-ID (Two-recording)/ECG-ID (All-recording), respectively. Meanwhile, 89.17% SI accuracy and 95.66% MI accuracy were obtained on the MIT-BIH-AHA. Compared with the results of S-AEs, Dense-AEs shows lower accuracies on both of the databases. Furthermore, it is noted that when it comes to the ECG-ID with more subjects, the improvement caused by sparsity constraint seems to be even more significant. That may be because by constraining the activation of hidden units, the relevance among extracted features is reduced. Thus more identity-related structure can be highlighted, leading to better identification performance.

4.2.7. Comparison with Existing Literature

In this section, the proposed method is compared with some state-of-the-art work, and the comparison results can be seen in Table 5, Table 6 and Table 7.
According to Table 5, Table 6 and Table 7, for signals from different databases, the proposed method achieved high-level multiple-heartbeat identification accuracies compared with the existing literature. Even though Ronald et al. [40] reported 100% accuracies on two of the evaluated databases, the proposed LSTM network was impractical for real-life applications in the case where quick identification is required. In general, with the same input layer size n 1 and hidden layer size n 2 , a single-layer LSTM contains 4 × ( ( n 1 + n 2 ) × n 2 + n 2 ) parameters, while a single-layer S-AE only has ( 2 n 1 n 2 + n 1 + n 2 ) parameters. As the networks grow deeper, the training and testing process of LSTM will take much more time and space than those of S-AEs because of its complex architecture. Compared with LSTM, the architecture of S-AEs is much simpler, which makes it able to realize fast identification.
It is also noted that nearly all of the existing literature adopt a traditional denoising algorithm, which requires great effort for improvement or parameter optimization, before feature extraction. Compared with them, the proposed method can more directly and conveniently remove the influence of noisy interference. Since the only purpose of the proposed method is to select the DWT coefficients corresponding to QRST, it does not require extra adjustment except for decomposing the input into proper levels. Once the target temporal-frequency bands are determined, direct selection can well discard most of the noise, and preserve identity-related information at the same time. According to Table 5, Table 6 and Table 7, with raw signals, the proposed method can achieve competitive or even better identification performances than methods which used clean signals. The above suggests that our method can remove the influence of noise in a more convenient way.
Furthermore, the proposed method only needs R points detected during identification. To our knowledge, even though the existing R wave detection techniques have started to provide acceptable results, detecting P, Q, and S is challenging. That means the use of some fiducial methods, e.g., Tan et al. [44] will be greatly limited in application despite their great performance. By taking the easily detected R points as fiducial points, the proposed method can be potentially applied in more cases.
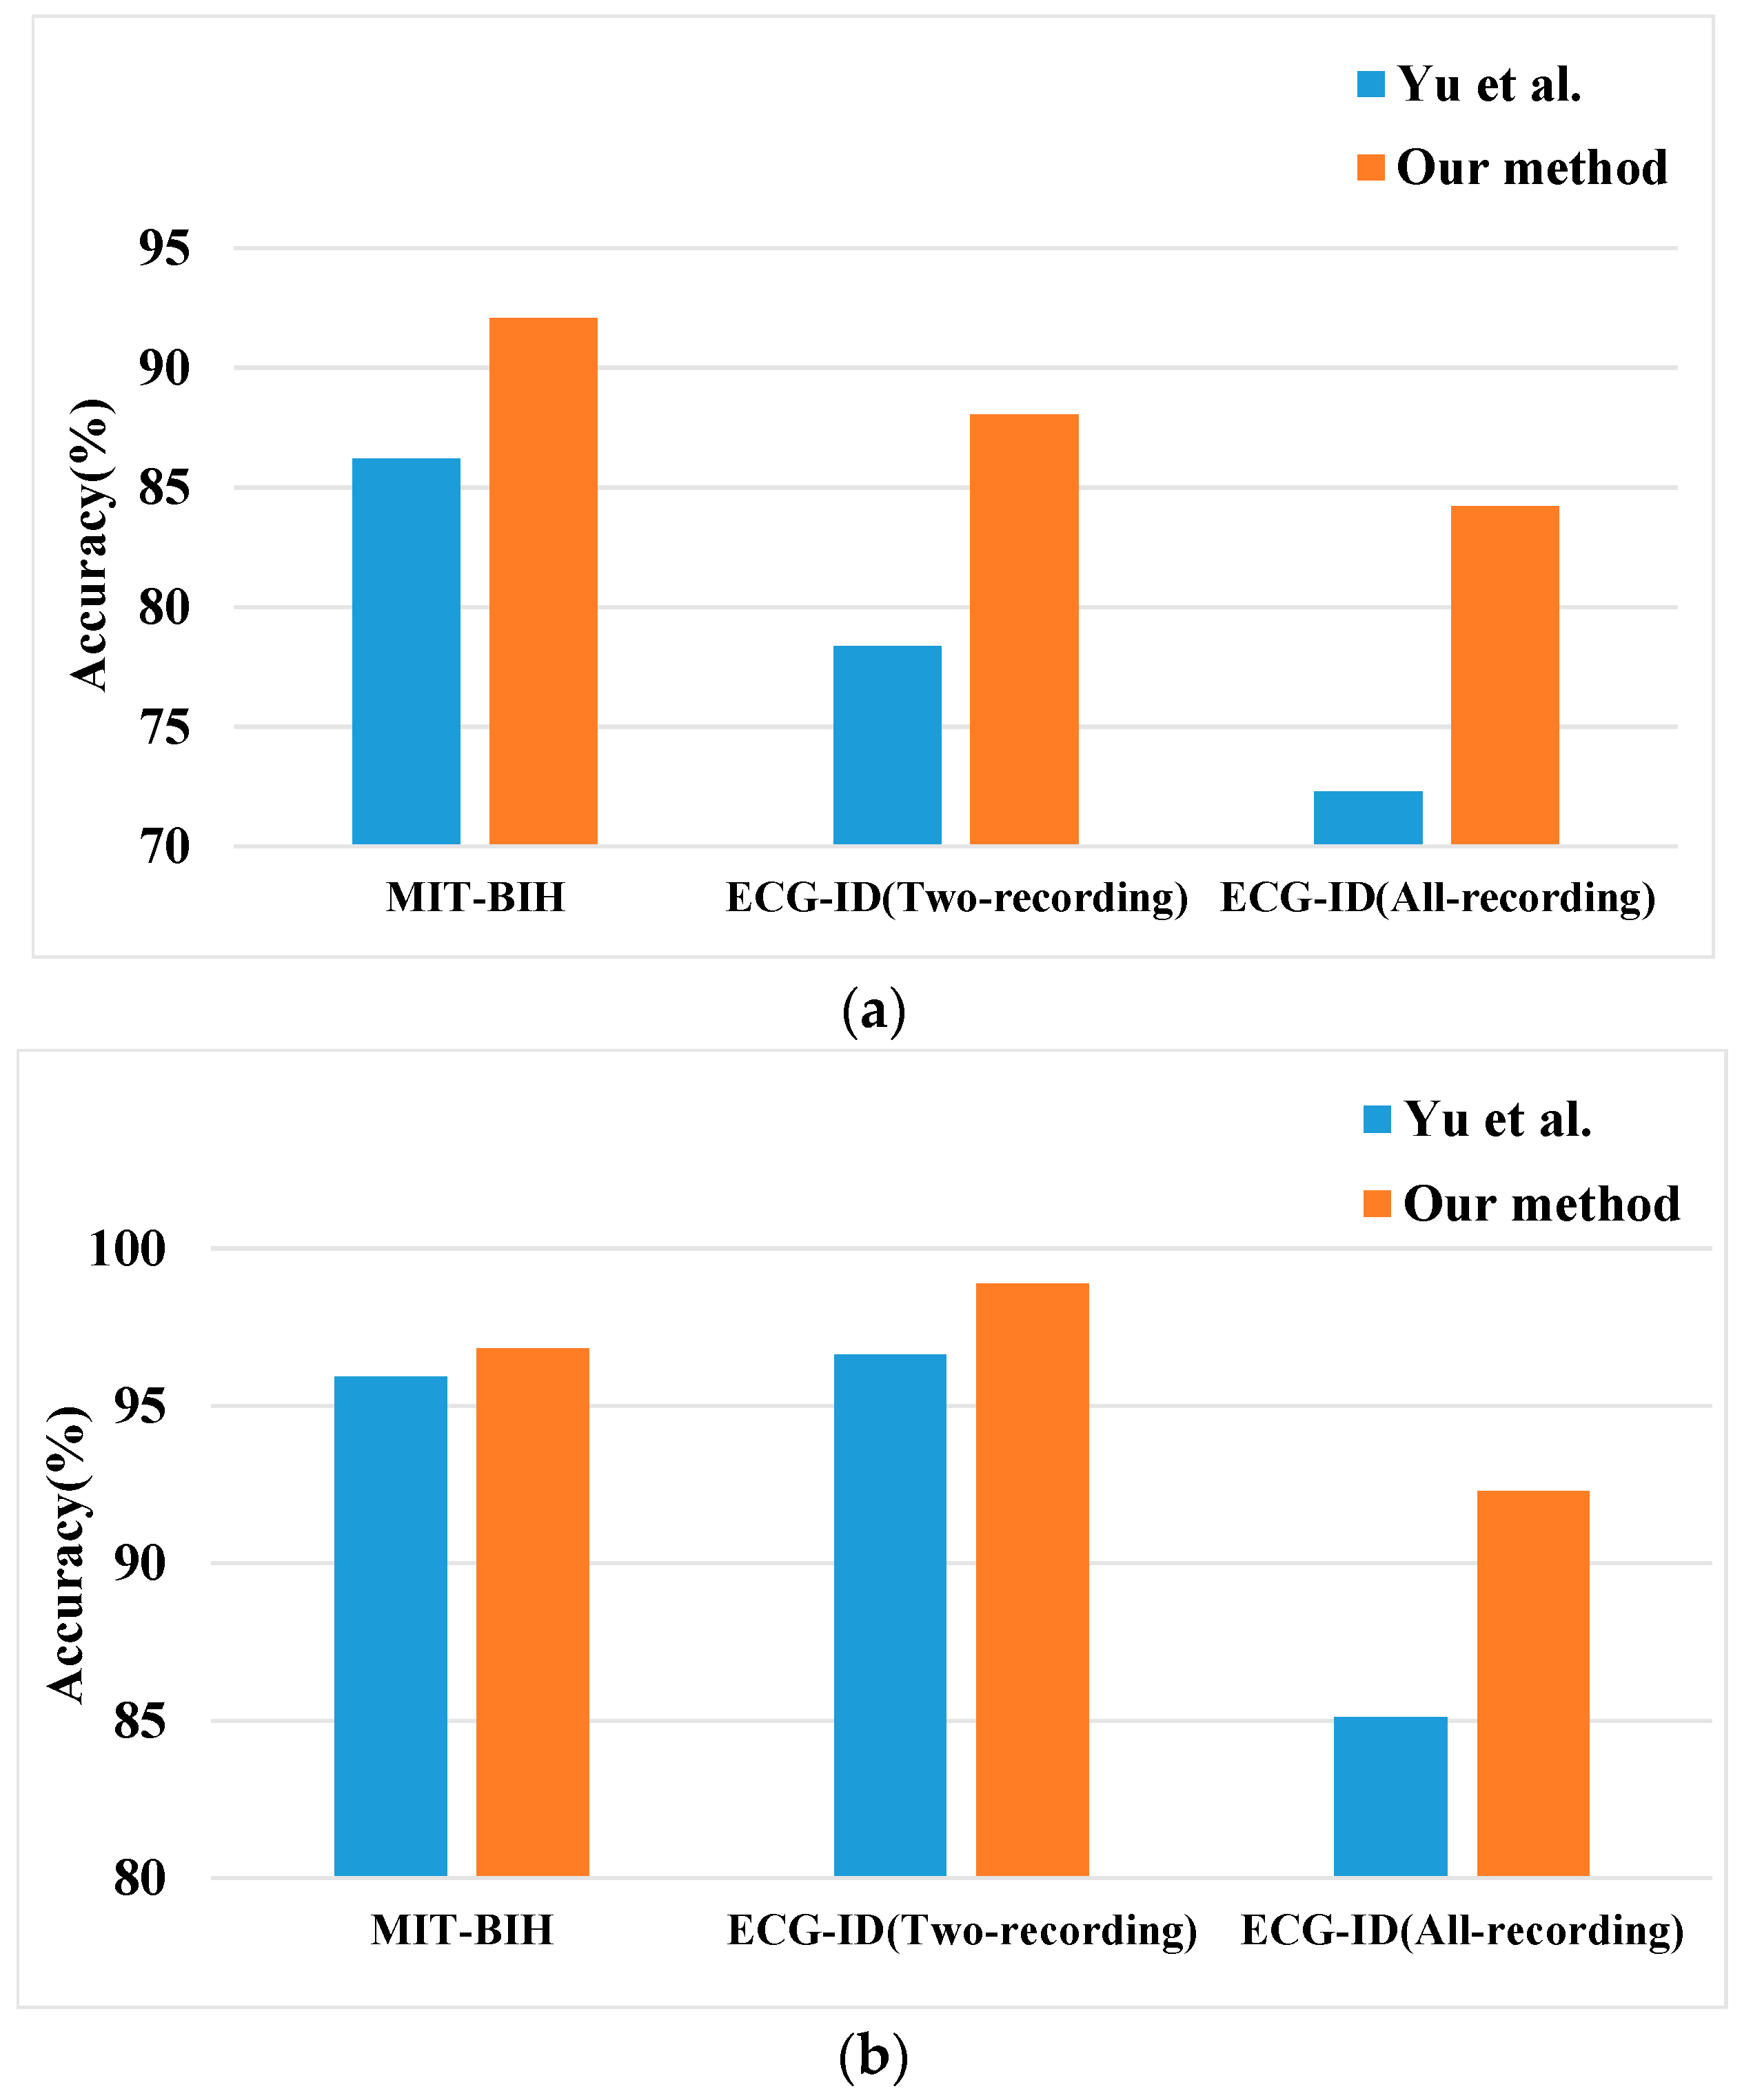
To further evaluate the proposed method, we also realized the approach proposed by Yu et al. [43] and compared its results with ours under the same conditions. The comparison results of the two methods can be seen in Figure 13.
Figure 13 shows that under the same subject number conditions, our method achieved better performances that the reference method on all the databases. Furthermore, when it comes to single-heartbeat identification accuracy, the improvement is even more significant. On the MIT-BIH-AHA, ECG-ID (Two-recording), and ECG-ID (All-recording) database, the proposed obtained 5.89%, 9.68%, and 11.93% higher for single-heartbeat identification accuracy than the reference method, which further proves the effectiveness of the proposed method. Based on the above, the main advantages of the proposed method are high-level identification accuracy, convenient noise removal, and only R point detection required.

5. Discussion

In this work, a novel ECG based biometric identification method suitable for noisy signals was developed. Given a raw ECG signal, its R points were firstly detected using the PT algorithm. Later, the whole signal was segmented into multiple heartbeats centered on the detected R points, and each heartbeat roughly covered a cardiac cycle length. Then obtained heartbeats were processed by the proposed QRST-targeting feature selection strategy and represented by wavelet coefficients corresponding to QRS and T. In this way, most noise interference is removed, and only identity-related information is preserved for the subsequent steps. According to the experimental results, competitive or even higher identification accuracy than time domain, FFT, and other DWT features were achieved using the selected feature, which proves that it is sufficient for ECG biometric identification.
After that, S-AEs was implemented to learn discrimination among subjects based on obtained DWT features. Here, the training process of S-AEs aims to preserve the necessary information for good reconstruction of the original input, and the fine-tuning process optimizes parameters of networks to emphasize the discrepancies among different subjects. To directly show the effectiveness of learned discriminative representations, a technique “t-SNE” [46] is adopted to visualize high dimensional data. Taking several subjects of the ECG-ID as an example, the comparison result of the original temporal-frequency features and the learned S-AE features can be seen in Figure 14. It is observed that the t-SNE fails to separate the selected subjects using raw data. In this case, data points of subjects completely mix together, which increases the difficulty of classification. For S-AE features, it can be seen that data points are relatively better clustered with less overlap and all subject classes are separated clearly. Based on the above, it indicates the S-AEs is an effective approach for ECG biometric feature learning.
Compared with other methods in the literature, our method has two main advantages. Firstly, its noise removal process is more convenient compared with a traditional denoising algorithm. In this method, noise can be removed by selecting proper temporal-frequency bands. Thus complex algorithm engineering is avoided compared with most existing methods. Secondly, even though the proposed method is also fiducial, it only requires R point detection during identification. Compared with other fiducial methods, it has no need for accurate detection of Q, S, and T point. In addition to that, our work also produces high single-heartbeat identification accuracy on both healthy and patient databases and thus, is potentially suitable for wearable devices which use few heartbeats for fast identification.
Even though the proposed method achieved good performances on biometric identification, it still has some limitations. According to the experiments, it is noted that here we have only evaluated our method on the on-the-person databases, which have better signal quality than the off-the person database. However, when tested on the off-the-person databases, e.g., CYBHi database, the proposed method cannot perform as well as on the on-the-person database. That is because the signals of the off-the-person databases, which are collected from the finger or palm, contain much more noise content than the signals collected from the chest. Under such high-level noise conditions, the proposed method can hardly detect the accurate locations of R-peaks. Thus in the future, we will further improve the proposed algorithm, and explore methods to make it work well even on the off-the-person databases.

6. Conclusions

In this work, we proposed a novel method based on DWT and S-AE for ECG signal identification. Compared with other previous studies, we obtained promising average multiple-heartbeat identification accuracies of 98.87%, 92.3%, and 96.82% on the ECG-ID (Two-recording), ECG-ID (All-recording), and MIT-BIH-AHA databases, respectively, by using the raw ECG signals. In comparison with the experiments using denoised signals, the results based on raw signals were 0.56%, 6.66%, and 0.8% higher, respectively. When it comes to single-heartbeat identification accuracy, the improvements are even more significant and can reach 3.52%, 11.36%, and 3.62%, respectively. Furthermore, this proposed QRST-target feature selection method does not contain various parameters that need to be optimized and can remove noise interference more conveniently compared with traditional denoising algorithm. Moreover, our method only requires R peak detection, which makes it suitable for more application cases than traditional fiducial methods. Moreover, because of its high identification and simple architecture, the proposed method also has the potential to be applied on wearable devices which use ECG signals for fast recognition. In all, our method can serve as an efficient way for an ECG biometric and is expected to contribute to information security.

Author Contributions

Conceptualization—D.W., Y.S., Data curation—W.Y., G.Z., Formal analysis—J.L., Writing—Original Draft D.W., Y.S., Writing—Edit and Review, D.W., W.Y.

Funding

This work was supported by the Science and Technology Development Plan Project of Jilin Province under Grant Nos. 20170414017GH and 20190302035GX; the Natural Science Foundation of Guangdong Province under Grant No. 2016A030313658; the Innovation and Strengthening School Project (provincial key platform and major scientific research project) supported by Guangdong Government under Grant No. 2015KTSCX175; the Premier-Discipline Enhancement Scheme Supported by Zhuhai Government under Grant No. 2015YXXK02-2; the Premier Key-Discipline Enhancement Scheme Supported by Guangdong Government Funds under Grant No. 2016GDYSZDXK036.

Conflicts of Interest

The authors declare no conflict of interest.

References

  1. Karimian, N.; Guo, Z.; Tehranipoor, M.; Forte, D. Highly Reliable Key Generation from Electrocardiogram (ECG). IEEE Trans. Biomed. Eng. 2017, 64, 1400–1411. [Google Scholar] [CrossRef] [PubMed]
  2. Pinto, J.R.; Cardoso, J.S.; Lourenco, A. Evolution, Current Challenges, and Future Possibilities in ECG Biometrics. IEEE Access 2018, 6, 34746–34776. [Google Scholar] [CrossRef]
  3. Fratini, A.; Sansone, M.; Bifulco, P.; Cesarelli, M. Individual identification via electrocardiogram analysis. Biomed. Eng. Online 2015, 14, 1–23. [Google Scholar] [CrossRef] [PubMed] [Green Version]
  4. Biel, L.; Pettersson, O.; Philipson, L.; Wide, P. ECG analysis: A new approach in human identification. IEEE Trans. Instrum. Meas. 2001, 50, 808–812. [Google Scholar] [CrossRef]
  5. Nemirko, A.; Lugovaya, T. Biometric human identification based on electrocardiogram. In Proceedings of the XIIIth Russian Conference on Mathematical Methods of Pattern Recognition, Moscow, Russia, 20–26 June 2005; pp. 387–390. [Google Scholar] [CrossRef]
  6. Irvine, J.M.; Israel, S.A.; Scruggs, W.T.; Worek, W.J. eigenPulse: Robust human identification from cardiovascular function. Pattern Recognit. 2008, 41, 3427–3435. [Google Scholar] [CrossRef]
  7. Sidek, K.A.; Khalil, I. Enhancement of low sampling frequency recordings for ECG biometric matching using interpolation. Comput. Methods Programs Biomed. 2013, 109, 13–25. [Google Scholar] [CrossRef] [PubMed]
  8. Odinaka, I.; Lai, P.H.; Kaplan, A.D.; O’Sullivan, J.A.; Sirevaag, E.J.; Rohrbaugh, J.W. ECG Biometric Recognition: A Comparative Analysis. IEEE Trans. Inf. Forensics Secur. 2012, 7, 1812–1824. [Google Scholar] [CrossRef]
  9. Zhang, Q.; Zhou, D.; Zeng, X. HeartID: A Multiresolution Convolutional Neural Network for ECG-Based Biometric Human Identification in Smart Health Applications. IEEE Access 2017, 5, 11805–11816. [Google Scholar] [CrossRef]
  10. Zhao, Z.; Zhang, Y.; Deng, Y.; Zhang, X. ECG authentication system design incorporating a convolutional neural network and generalized S-Transformation. Comput. Biol. Med. 2018, 102, 168–179. [Google Scholar] [CrossRef]
  11. Blanco-Velasco, M.; Weng, B.; Barner, K.E. ECG signal denoising and baseline wander correction based on the empirical mode decomposition. Comput. Biol. Med. 2008, 38, 1–13. [Google Scholar] [CrossRef]
  12. Wang, D.; Si, Y.; Yang, W.; Zhang, G.; Liu, T. A Novel Heart Rate Robust Method for Short-Term Electrocardiogram Biometric Identification. Appl. Sci. 2019, 9, 201. [Google Scholar] [CrossRef]
  13. Dar, M.N.; Akram, M.U.; Shaukat, A.; Khan, M.A. ECG Based Biometric Identification for Population with Normal and Cardiac Anomalies Using Hybrid HRV and DWT Features. In Proceedings of the 2015 5th International Conference on IT Convergence and Security (ICITCS), Kuala Lumpur, Malaysia, 24–27 August 2015; pp. 1–5. [Google Scholar] [CrossRef]
  14. Chen, Z.; Li, W. Multisensor Feature Fusion for Bearing Fault Diagnosis Using Sparse Autoencoder and Deep Belief Network. IEEE Trans. Instrum. Meas. 2017, 66, 1693–1702. [Google Scholar] [CrossRef]
  15. Zhang, Y.; Zhang, E.; Chen, W. Deep neural network for halftone image classification based on sparse auto-encoder. Eng. Appl. Artif. Intell. 2016, 50, 245–255. [Google Scholar] [CrossRef]
  16. Chen, L.L.; He, Y. Identification of Atrial Fibrillation from Electrocardiogram Signals Based on Deep Neural Network. J. Med. Imaging Health Inform. 2019, 9, 838–846. [Google Scholar] [CrossRef]
  17. Oh, S.L.; Ng, E.Y.K.; Ta, R.S.; Acharya, U.R. Automated beat-wise arrhythmia diagnosis using modified U-net on extended electrocardiographic recordings with heterogeneous arrhythmia types. Comput. Biol. Med. 2019, 105, 92–101. [Google Scholar] [CrossRef]
  18. Gogna, A.; Majumdar, A.; Ward, R. Semi-supervised Stacked Label Consistent Autoencoder for Reconstruction and Analysis of Biomedical Signals. IEEE Trans. Biomed. Eng. 2017, 64, 2196–2205. [Google Scholar] [CrossRef] [PubMed]
  19. Eduardo, A.; Aidos, H.; Fred, A. ECG-based Biometrics using a Deep Autoencoder for Feature Learning An Empirical Study on Transferability. In Proceedings of the 6th International Conference on Pattern Recognition Applications and Methods (ICPRAM 2017), Porto, Portugal, 24–26 February 2017; pp. 463–470. [Google Scholar] [CrossRef]
  20. Goldberger, A.L.; Amaral, L.A.N.; Glass, L.; Hausdorff, J.M.; Ivanov, P.C.; Mark, R.G.; Mietus, J.E.; Moody, G.B.; Peng, C.K.; Stanley, H.E. PhysioBank, PhysioToolkit, and PhysioNet—Components of a new research resource for complex physiologic signals. Circulation 2000, 101, E215–E220. [Google Scholar] [CrossRef]
  21. Jané, R.; Laguna, P.; Thakor, N.V.; Caminal, P. Adaptive baseline wander removal in the ECG: Comparative analysis with cubic spline technique. In Proceedings of the Proceedings Computers in Cardiology, Durham, NC, USA, 11–14 October 1992; pp. 143–146. [Google Scholar] [CrossRef]
  22. Date, A.A.; Ghongade, R.B. Performance of Wavelet Energy Gradient Method for QRS Detection. In Proceedings of the 4th International Conference on Intelligent and Advanced Systems (ICIAS2012), Kuala Lumpur, Malaysia, 12–14 June 2012; pp. 876–881. [Google Scholar] [CrossRef]
  23. Rakshit, M.; Das, S. An efficient ECG denoising methodology using empirical mode decomposition and adaptive switching mean filter. Biomed. Signal Process. Control 2018, 40, 140–148. [Google Scholar] [CrossRef]
  24. Agante, P.M.; Marques de Sa, J.P. ECG noise filtering using wavelets with soft-thresholding methods. In Proceedings of the 26th Annual Meeting on Computers in Cardiology (AMCC 1999), Hannover, Germany, 26–29 September 1999; pp. 535–538. [Google Scholar] [CrossRef]
  25. Kabir, M.A.; Shahnaz, C. Denoising of ECG signals based on noise reduction algorithms in EMD and wavelet domains. Biomed. Signal Process. Control 2012, 7, 481–489. [Google Scholar] [CrossRef]
  26. Donoho, D.L.; Johnstone, I.M. Adapting to unknown smoothness via wavelet shrinkage. J. Am. Stat. Assoc. 1995, 90, 1200–1224. [Google Scholar] [CrossRef]
  27. Donoho, D.L.; Johnstone, J.M. Ideal spatial adaptation by wavelet shrinkage. Biometrika 1994, 81, 425–455. [Google Scholar] [CrossRef]
  28. Yao, C.; Si, Y. ECG P, T wave complex detection algorithm based on lifting wavelet. J. Jilin Univ. Technol. Ed. 2013, 43, 177–182. [Google Scholar] [CrossRef]
  29. Pan, J.; Tompkins, W.J. A real-time QRS detection algorithm. IEEE Trans. Biomed. Eng. 1985, 32, 230–236. [Google Scholar] [CrossRef]
  30. Complete Pan Tompkins Implementation ECG QRS Detector. Available online: https://www.mathworks.com/matlabcentral/fileexchange/45840-complete-pan-tompkins-implementation-ecg-qrs-detector/content/pantompkin.m (accessed on 23 April 2019).
  31. Tuerxunwaili; Nor, R.M.; Rahman, A.W.B.A.; Sidek, K.A.; Ibrahim, A.A. Electrocardiogram Identification: Use a Simple Set of Features in QRS Complex to Identify Individuals. In Proceedings of the 12th International Conference on Computing and Information Technology (IC2IT), Khon Kaen, Thailand, 7–8 July 2016; pp. 139–148. [Google Scholar] [CrossRef]
  32. Gargiulo, F.; Fratini, A.; Sansone, M.; Sansone, C. Subject identification via ECG fiducial-based systems: Influence of the type of QT interval correction. Comput. Methods Programs Biomed. 2015, 121, 127–136. [Google Scholar] [CrossRef]
  33. Simova, I.; Bortolan, G.; Christov, I. ECG attenuation phenomenon with advancing age. J. Electrocardiol. 2018, 51, 1029–1034. [Google Scholar] [CrossRef] [PubMed]
  34. Matveev, M.; Christov, I.; Krasteva, V.; Bortolan, G.; Simov, D.; Mudrov, N.; Jekova, I. Assessment of the stability of morphological ECG features and their potential for person verification/identification. In Proceedings of the 21st International Conference on Circuits, Systems, Communications and Computers (CSCC 2017), Crete Island, Greece, 14–17 July 2017; pp. 1–4. [Google Scholar] [CrossRef]
  35. Mallat, S.G. A theory for multiresolution signal decomposition: The wavelet representation. IEEE Trans. Pattern Anal. Mach. Intell. 1989, 674–693. [Google Scholar] [CrossRef]
  36. Guler, I.; Ubeyli, E.D. ECG beat classifier designed by combined neural network model. Pattern Recognit. 2005, 38, 199–208. [Google Scholar] [CrossRef]
  37. Polikar, R.; Udpa, L.; Udpa, S.S.; Taylor, T. Frequency invariant classification of ultrasonic weld inspection signals. IEEE Trans. Ultrason. Ferroelectr. Freq. Control 1998, 45, 614–625. [Google Scholar] [CrossRef] [PubMed]
  38. Deeplearntoolbox for MATLAB. Available online: https://github.com/rasmusbergpalm/DeepLearnToolbox (accessed on 18 May 2019).
  39. MATLAB Code of minFunc Toolkit. Available online: https://github.com/ganguli-lab/minFunc (accessed on 18 May 2019).
  40. Salloum, R.; Kuo, C.C.J. ECG-based biometrics using recurrent neural networks. In Proceedings of the IEEE International Conference on Acoustics, Speech and Signal Processing (ICASSP), New Orleans, LA, USA, 5–9 March 2017; pp. 2062–2066. [Google Scholar] [CrossRef]
  41. Sarkar, A.; Abbott, A.L.; Doerzaph, Z. ECG Biometric Authentication Using a Dynamical Model. In Proceedings of the 7th International Conference on Biometric Theory, Applications and Systems (BTAS), Arlington, VA, USA, 8–11 September 2015; pp. 1–6. [Google Scholar] [CrossRef]
  42. Altan, G.; Kutlu, Y.; Yeniad, M. ECG based human identification using Second Order Difference Plots. Comput. Methods Programs Biomed. 2019, 170, 81–93. [Google Scholar] [CrossRef]
  43. Yu, J.; Si, Y.; Liu, X.; Wen, D.; Luo, T.; Lang, L. ECG identification based on PCA-RPROP. In Proceedings of the International Conference on Digital Human Modeling and Applications in Health, Safety, Ergonomics and Risk Management, Vancounver, BC, Canada, 9–14 July 2017; pp. 419–432. [Google Scholar] [CrossRef]
  44. Tan, R.; Perkowski, M. ECG Biometric Identification Using Wavelet Analysis Coupled with Probabilistic Random Forest. In Proceedings of the 2016 15th IEEE International Conference on Machine Learning and Applications (ICMLA), Anaheim, CA, USA, 18–20 December 2016; pp. 182–187. [Google Scholar] [CrossRef]
  45. Dar, M.N.; Akram, M.U.; Usman, A.; Khan, S.A. ECG Biometric Identification for General Population Using Multiresolution Analysis of DWT Based Features. In Proceedings of the 2015 2nd International Conference on Information Security and Cyber Forensics (InfoSec 2015), Cape Town, South Africa, 15–17 November 2015; pp. 5–10. [Google Scholar] [CrossRef]
  46. Maaten, L.v.d.; Hinton, G. Visualizing data using t-SNE. J. Mach. Learn. Res. 2008, 9, 2579–2605. [Google Scholar]
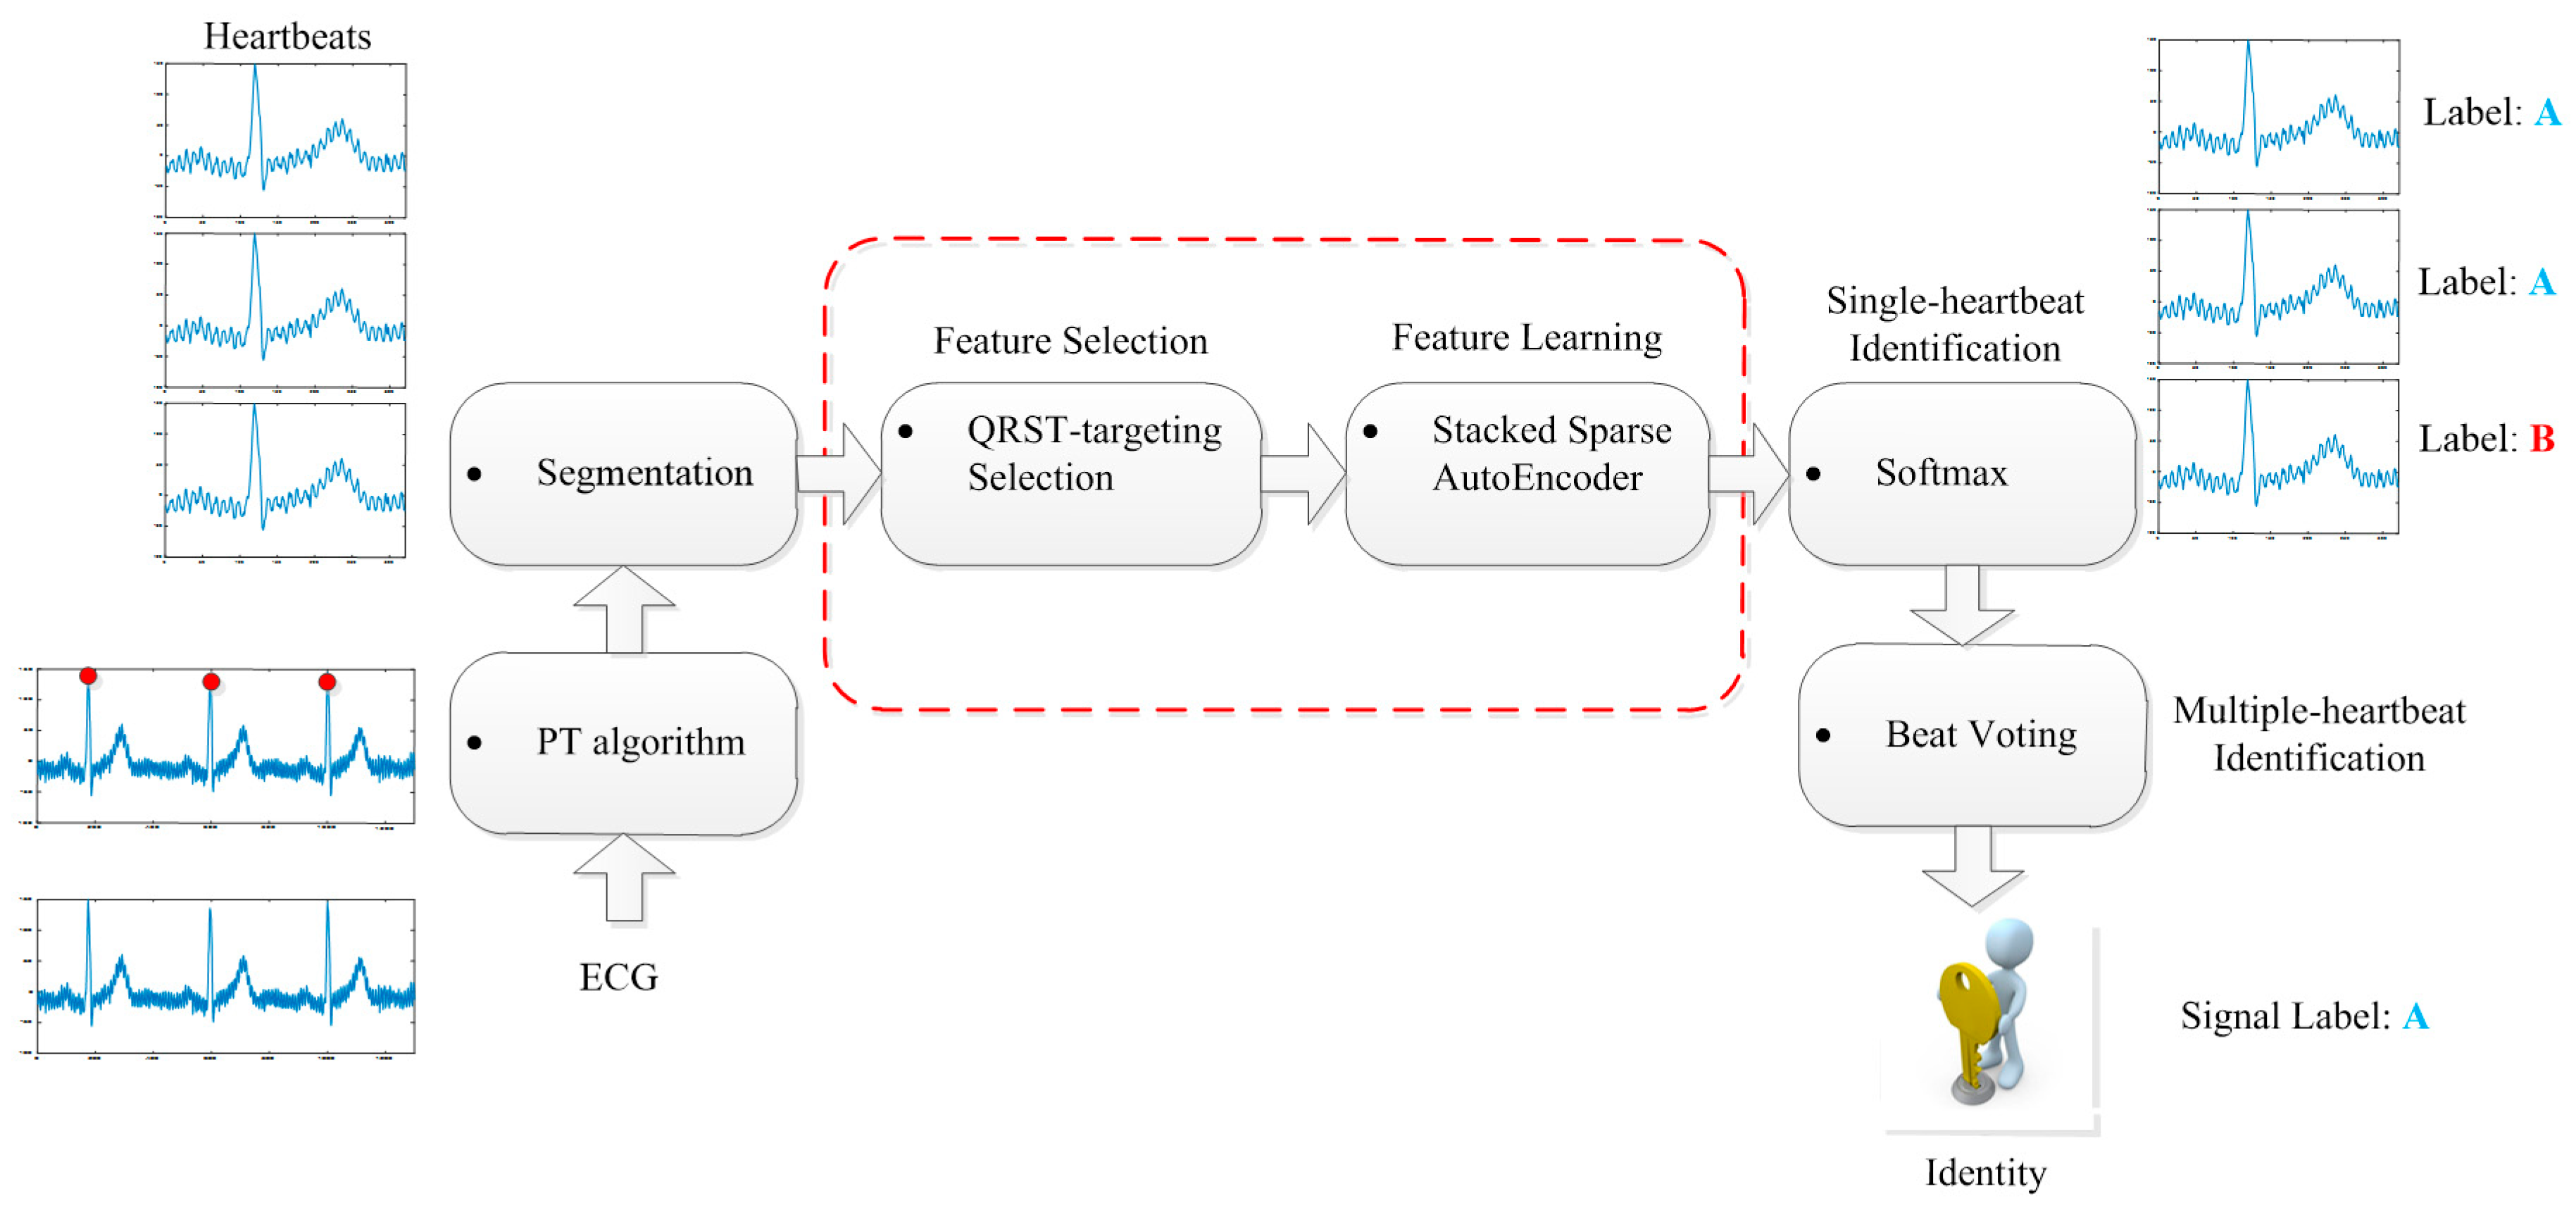
Figure 1. Diagram of the electrocardiogram (ECG) identification methodology proposed.
Electronics 08 00667 g001
Figure 2. Comparison between the original signal and the denoised signal of Record-100 from MIT-BIH-AHA database. (a) the original signal; (b) the denoised signal.
Electronics 08 00667 g002
Figure 3. Segmented heartbeats with and without noise. (a) a noisy heartbeat from the MIT-BIH-AHA; (b) a denoised heartbeat from the MIT-BIH-AHA; (c) a noisy heartbeat from the ECG-ID; (d) a denoised heartbeat from the ECG-ID.
Electronics 08 00667 g003aElectronics 08 00667 g003b
Figure 4. Heartbeat decomposition with discrete wavelet transform.
Electronics 08 00667 g004
Figure 5. An autoencoder architecture.
Electronics 08 00667 g005
Figure 6. The overall framework of the proposed method for ECG biometric identification.
Electronics 08 00667 g006
Figure 7. Training and validation process of the S-AEs. (a) Train loss of the ECG-ID (Two-recording); (b) Train accuracy of the ECG-ID (Two-recording); (c) Train loss of the MIT-BIH-AHA; (d) Train accuracy of the MIT-BIH-AHA.
Electronics 08 00667 g007
Figure 8. Reconstructions operated by S-AEs on Samples from Set B of the ECG-ID and the MIT-BIH-AHA. (a) Comparison between original and reconstructed curves of wavelet feature of Beat 1 from the MIT-BIH-AHA database, Record-100; (b) Comparison between original and reconstructed curves of wavelet feature of Beat 1 from the ECG-ID database, Record-1.
Electronics 08 00667 g008
Figure 9. The accuracy comparison of the proposed method on Set A (Denoised) and Set B (Noisy). (a) Comparison on the MIT-BIH-AHA; (b) Comparison on the ECG-ID (Two-recording); (c) Comparison on the ECG-ID (All-recording). (SI—Single-heartbeat Identification; MI—Multiple-heartbeat Identification).
Electronics 08 00667 g009
Figure 10. Confusion matrices for signal identification. (a) MIT-BIH database; (b) ECG-ID database (Two-recording); (c) ECG-ID database (All-recording).
Electronics 08 00667 g010aElectronics 08 00667 g010b
Figure 11. Comparison of different classifiers using the proposed method. (a) Classification results of different classifiers on the MIT-BIH-AHA database; (b) Classification results of different classifiers on the ECG-ID database (Two-recording); (c) Classification results of different classifiers on the ECG-ID database (All-recording).
Electronics 08 00667 g011
Figure 12. Comparison of the sparse and dense AEs. (a) Single-heartbeat identification accuracy; (b) Multiple-heartbeat identification accuracy.
Electronics 08 00667 g012
Figure 13. Performance comparison of the proposed method with the approach in reference (a) Single-heartbeat identification accuracy comparison; (b) Multiple-heartbeat identification accuracy comparison.
Electronics 08 00667 g013
Figure 14. Features visualization by t-SNE. (a) Original temporal-frequency features; (b) Learned features by S-AEs.
Electronics 08 00667 g014
Table 1. Estimated frequency of coefficients from different levels.
DatabaseECG-IDMIT-BIH-AHA
LevelApproximation (Hz)Detail (Hz)Approximation (Hz)Detail (Hz)
10–125125–2500–9090–180
20–62.562.5–1250–4545–90
30–31.2531.25–62.50–22.522.5–45
40–15.62515.625–31.250–11.2511.25–22.5
50–7.8127.812–15.6250–5.6255.625–11.25
60–3.9063.906–7.8120–2.8122.812–5.625
70–1.9531.953–3.9060–1.4061.406–2.812
80–0.9760.976–1.9530–0.7030.703–1.406
90–0.4880.488–0.9760–0.3510.351–0.703
Table 2. Parameter setting of the proposed S-AEs.
ParametersValue
Number of hidden layers2
Node per layerMIT-BIH-AHA: 71-200-50-47
ECG-ID: 95-200-50-89
Sparsity parameter ρ 0.1
Weight decay λ 3 × 10⁻⁵
Sparsity penalty weight β 3
Maximum epoch400
Activation functionsigmoid
Table 3. Performance comparison of different features. (SI-Single-heartbeat Identification, MI-Multiple-heartbeat Identification).
DatabaseECG-ID
(Two-Recording)
MIT-BIH-AHAECG-ID
(All-Recording)
Feature SI (%)MI (%)SI (%)MI (%)SI (%)MI (%)
Time domain Feature83.7896.6291.0896.4881.6688.71
FFT Feature57.5175.2884.4894.3457.1771.79.
DWT Feature-Low62.9976.9687.8495.6760.5677.43
DWT Feature-High89.4498.3191.6496.8079.8989.74
DWT Feature-Selected88.0498.8792.0996.8284.2292.3
Table 4. Key parameter settings of five classifiers.
Classifier TypeParameter Setting
KNNNearest Neighbor Number K : 3
BPNetwork Layer: 3
Hidden Unit Number: 50
RFDecision Tree Number: 500
RBF-SVMError Penalty Factor C : 1
Kernel Parameter g : 0.1
SoftmaxInput layer unit number: 50
Output layer unit number: 89 for the ECG-ID
47 for the MIT-BIH-AHA
Table 5. Comparison with existing literature on ECG biometric identification using the MIT-BIH-AHA.
Related WorksTraditional Denoising Algorithm Required?IndividualsFeatures Extraction MethodClassifierMI Accuracy
Zhang et al. [9]Yes47DWT + 1-CNNSoftmax91.1%
Sarker et al. [41]Yes45Fiducial featuresLDA + KNN95%
Dar et al. [13]Yes47Haar Transform and HRV/GBFSRF95.85%
Ronald et al. [40]Yes47RNN
GRU
LSTM
Softmax93.6%
96.8%
100%
Alhan et al. [42]Yes47LGA on SODPSFFS KNN95.12%
Our ApproachNo47DWT + S-AEsSoftmax96.82%
Table 6. Comparison with existing literature on ECG biometric identification using the ECG-ID (Two-recording).
Related WorksTraditional Denoising Algorithm Required?IndividualsFeatures Extraction MethodClassifierMI Accuracy
Ronald et al. [40]Yes89RNN
GRU
LSTM
Softmax91.7%
94.4%
100%
Yu et al. [43]Yes88PCARPROP96.60%
Tan et al. [44]Yes89Temporal, amplitude, and angle + DWT coefficientsRandom Forests + WDIST KNN100%
Our ApproachNo89DWT + S-AEsSoftmax98.87%
Table 7. Comparison with existing literature on ECG biometric identification using the ECG-ID (All-recording).
Related WorksTraditional Denoising Algorithm Required?IndividualsFeatures Extraction MethodClassifierMI Accuracy
Dar et al. [45]Yes90Haar Transform/GBFSKNN83.2%
Dar et al. [13]Yes90Haar Transform and HRV/GBFSRF83.9%
Alhan et al. [42]Yes90LGA on SODPSFFS KNN91.26%
Our ApproachNo89DWT + S-AEsSoftmax92.3%