Article

A Data-Driven Based Voltage Control Strategy for DC-DC Converters: Application to DC Microgrid

1
Departamento de Ingeniería de Sistemas y Automática, Universidad de Sevilla, 41092 Sevilla, Spain
2
Department of Electrical Engineering, University of Tehran, Tehran 1417466191, Iran
3
Department of Electrical Sustainable Energy, Delft University of Technology, Mekelweg 4, 2628 CD Delft, The Netherlands
4
Faculty of Engineering and IT, University of Technology Sydney, Sydney, NSW 2007, Australia
5
Department of Electrical Engineering and Automation, Aalto University, 02150 Espoo, Finland
*
Author to whom correspondence should be addressed.
Electronics 2019, 8(5), 493; https://doi.org/10.3390/electronics8050493
Submission received: 27 March 2019 / Revised: 18 April 2019 / Accepted: 22 April 2019 / Published: 30 April 2019
(This article belongs to the Special Issue Industrial Applications of Power Electronics)

Abstract

:
This paper develops a data-driven strategy for identification and voltage control for DC-DC power converters. The proposed strategy does not require a pre-defined standard model of the power converters and only relies on power converter measurement data, including sampled output voltage and the duty ratio to identify a valid dynamic model for them over their operating regime. To derive the power converter model from the measurements, a local model network (LMN) is used, which is able to describe converter dynamics through some locally active linear sub-models, individually responsible for representing a particular operating regime of the power converters. Later, a local linear controller is established considering the identified LMN to generate the control signal (i.e., duty ratio) for the power converters. Simulation results for a stand-alone boost converter as well as a bidirectional converter in a test DC microgrid demonstrate merit and satisfactory performance of the proposed data-driven identification and control strategy. Moreover, comparisons to a conventional proportional-integral (PI) controllers demonstrate the merits of the proposed approach.

1. Introduction

DC-DC power converters have been extensively used in the infrastructure such as PV power converters, DC motor drives, and wind farm power converters [1,2,3]. The DC-DC converters are increasingly being used to integrate sustainable resources such as photovoltaic (PV) with high variability in their outputs to DC microgrids [4,5,6,7]. Due to the wide-ranging applications of these converters, proper modeling and control techniques are required for their voltage regulation.
Control of the power converters poses challenges to the researchers due to their nonlinear characteristics. Specifically, such difficulties stem from the following phenomena and requirements:
  • DC-DC power converters are characterized by three different modes of operation, namely rising inductor current, falling inductor current and zero inductor current (which happens in discontinuous conduction operation), where each mode features linear continuous-time dynamics. Such complexities may even lead to chaotic behavior of the DC-DC converters [8].
  • Converter topology requires the control input of the converter (i.e., duty cycle) to be bounded between zero and one.
  • The inductor current of power converter must be non-negative when it is operating in the discontinuous conduction mode (DCM) [9].
Apart from the above-mentioned issues, for an efficient controller design of a DC-DC converter, expert designer should address wide input and output changes to guarantee the stability of the converter in any working state with a reasonable transient response [10]. In addition, general stability analysis is introduced in [11]. It is worth noting that the input voltage and output load variations change the operating point of the power converter. These issues further contribute to the complication of the DC-DC converter control problem.
Various techniques have been presented for DC-DC converters voltage control, from conventional PI and PID controllers [11,12] to fuzzy and Artificial Neural Networks (ANNs) controllers [13,14,15] and sliding model control [16]. Conventional PI and PID controllers present several valuable properties, for example, easily designed and being inexpensive. However, they are designed based on a locally linearized model of the system and hence their performance reduces while the operating point of the converter changes.
On the other hand, fuzzy logic controllers seem to provide satisfactory control actions, but, when there are large numbers of fuzzy rules and for high switching frequencies (small switching cycles), evaluation of all rules may turn into a problem. Moreover, proper tuning of the positions of the membership functions is a time-consuming procedure, which requires great expert knowledge.
Artificial Neural Network-based controllers are data-driven approaches that use input–output measurement of the converter to develop a valid converter model and then employ the developed model to design controller for the converters. There are also difficulties associated with the ANN-based controllers such as initialization of the ANN’s parameters.
To eliminate the above-mentioned limitations, this paper proposes a data-driven strategy (DDS) that does not experience the problem associated with the conventional ANN-based control strategies, for identification and voltage control of DC-DC converters. The proposed DDS includes two stages as stated below:
  • Stage 1: Identification of the power converter dynamics directly from measured data.
  • Stage 2: Design of the voltage regulator based on the identified converter model.
In the first stage, the proposed DDS employs a local model network (LMN) for identification of a DC-DC converter. The LMN is made up of local linear models (LLM) and each LLM is responsible for modeling the dynamics of the converter along a specific operating regime, decided by its validity function. The LMN structure is determined directly from the input–output measurement using learning algorithm of hierarchical binary tree (HBT). Next, in the second stage, the identified LMN is used for the local linear control (LLC) considering the inverse error dynamics controller design.
In this paper, the identification and control stages are first explained for a standalone DC-DC boost converter. Then, the approach is applied on a bidirectional converter, connected to a DC microgrid with photovoltaic and storage. In both cases, the results of the proposed LLC strategy are compared to PI controllers.
Section 2 describes the framework for power converter identification. The structure of the LMN is presented in Section 3. The LLC design is described in Section 4. Simulation results and comparisons for the standalone converter are discussed in Section 5. Then, the proposed method is applied to a bidirectional converter in a DC microgrid in Section 6. Finally, the paper is concluded in Section 7.

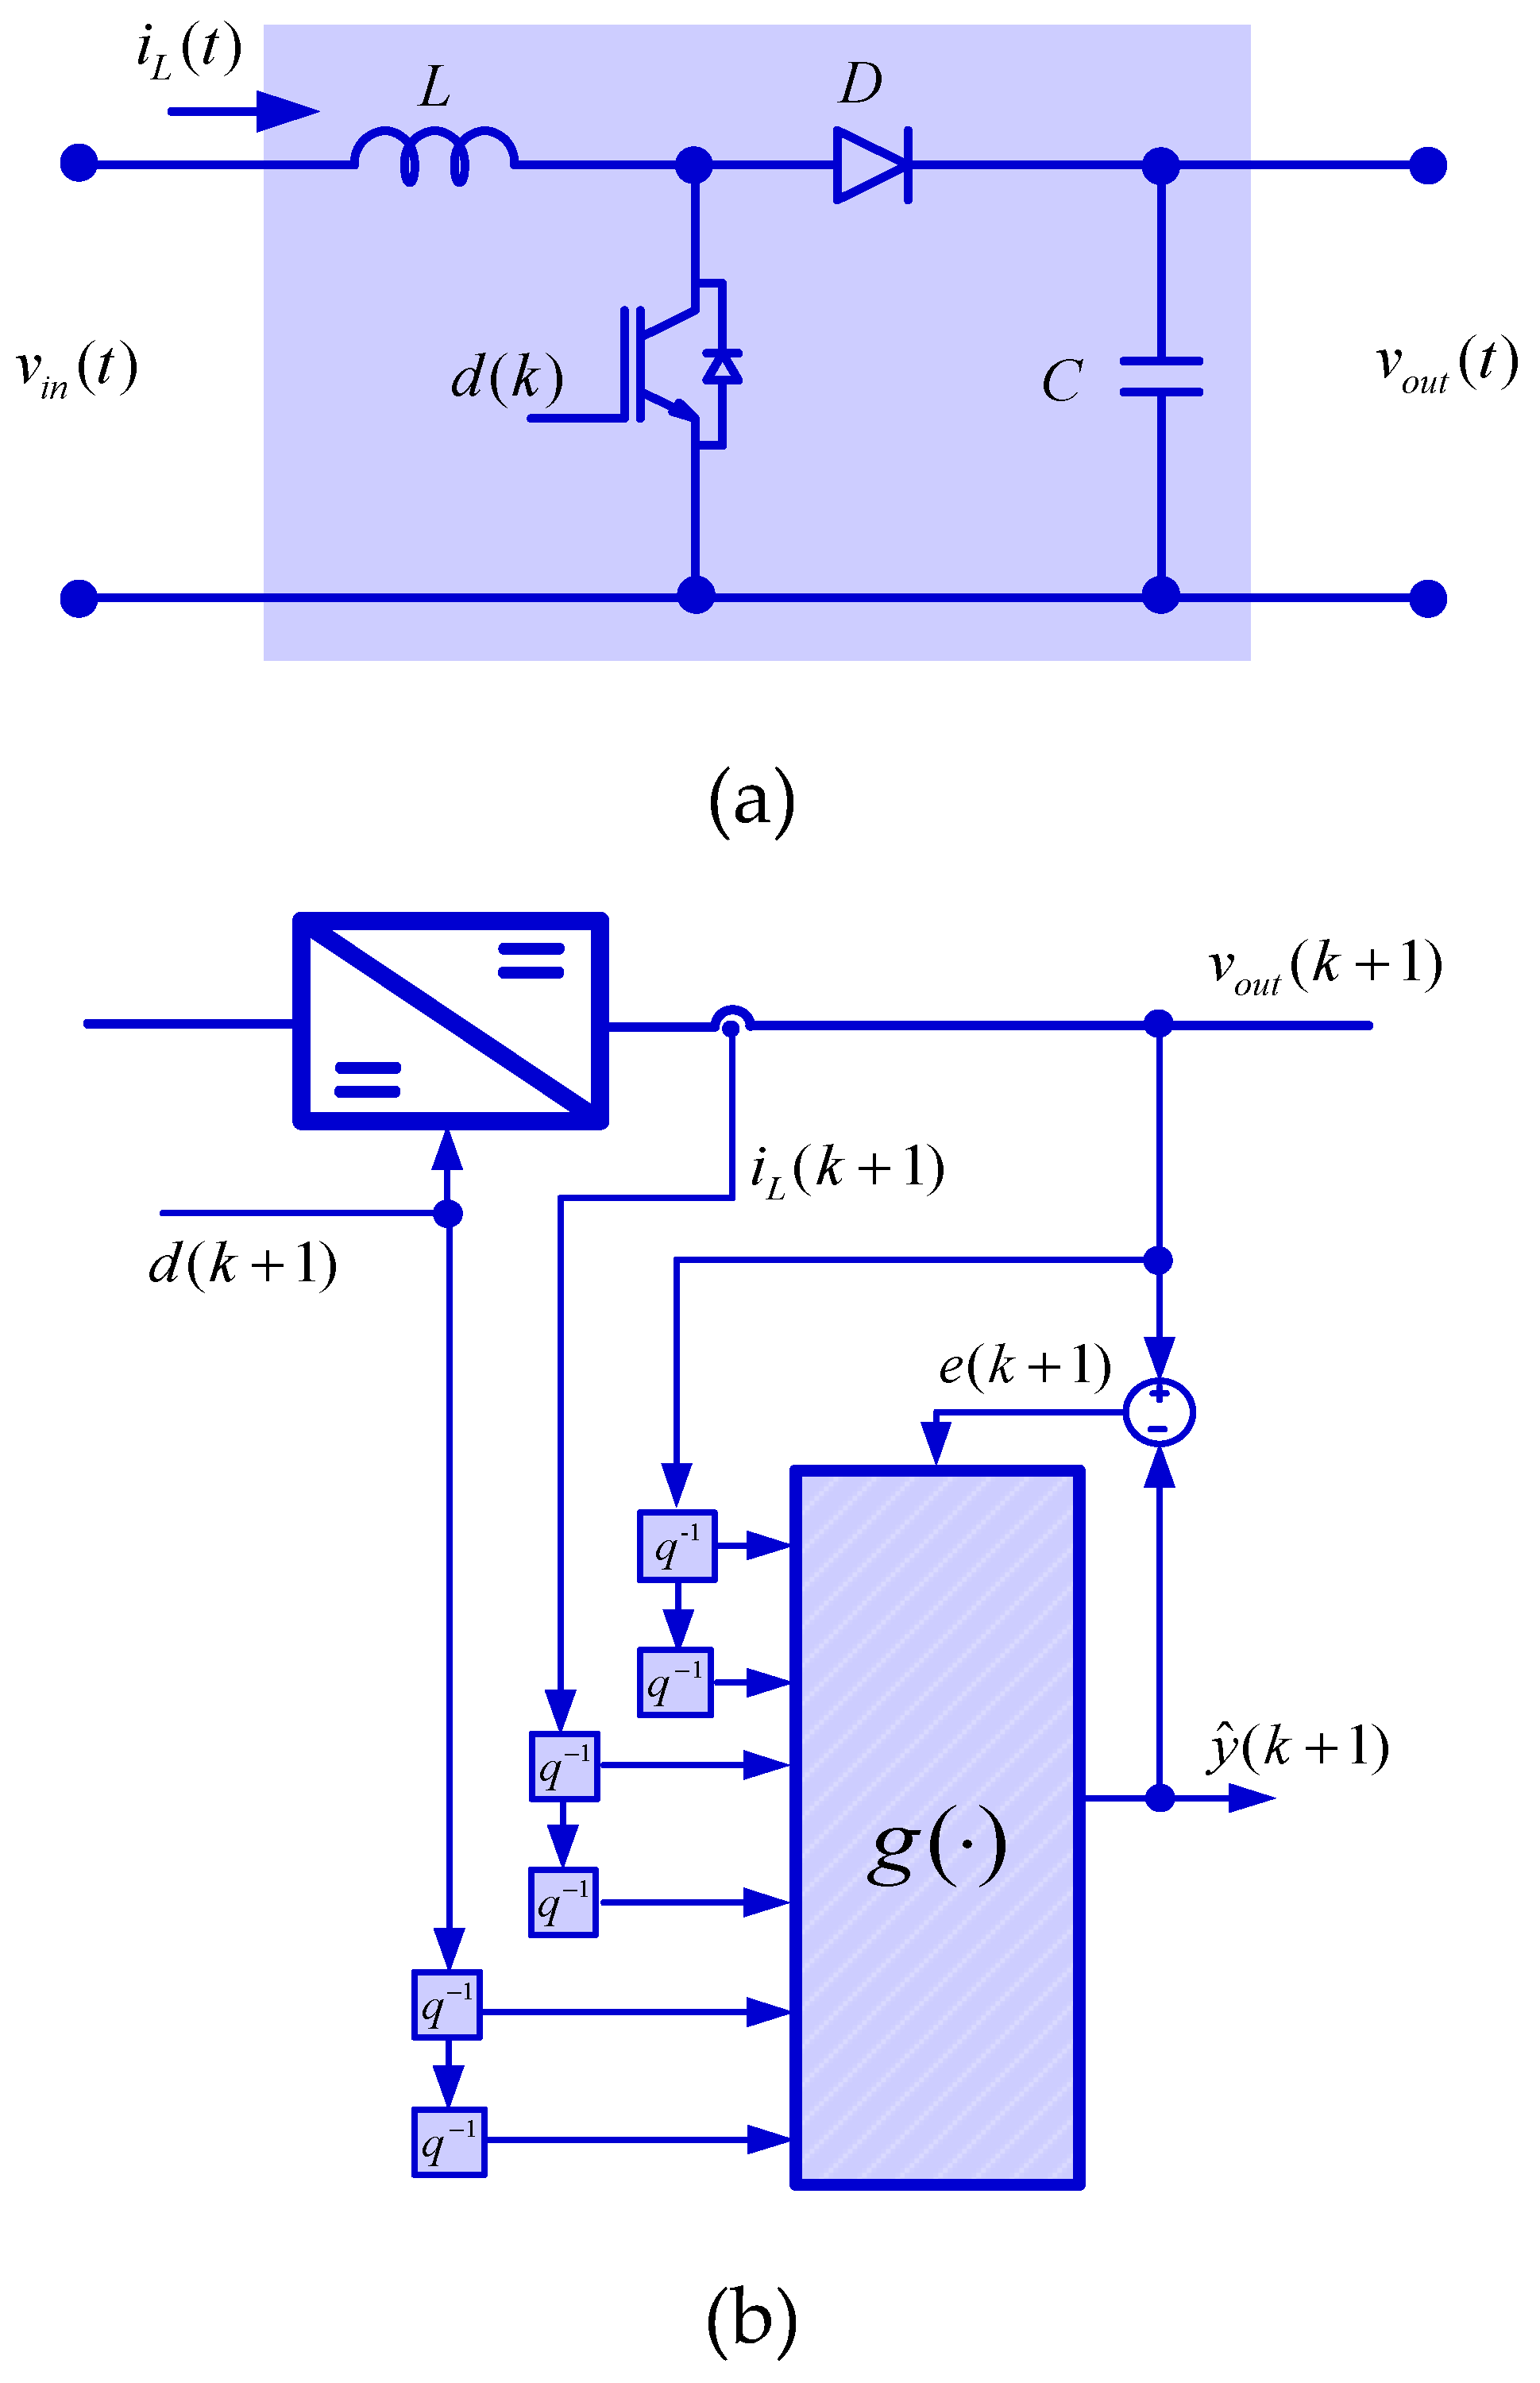
2. Identification Methodology

As shown in Figure 1, DC-DC converter can be found in applications such as delivering the harvested energy from the PV panels to the main DC microgrid. Voltage regulation in DC microgrid is one of the critical issues for effective power delivery.
In this paper, initially, a simple standalone DC-DC boost converter, as shown in Figure 2, is identified and controlled using the proposed DDS. Then, application of the DDS to a DC microgrid is investigated.
For the boost converter in Figure 2a, the input–output relationship is as follows:
v o u t ( k + 1 ) = g ( v o u t ( k 1 ) , v o u t ( k ) , i L ( k 1 ) , i L ( k ) , d ( k 1 ) , d ( k ) )
where g is a nonlinear function mapping the inputs to the output of the DC-DC boost power converter, v o u t ( k ) is the converter’s output voltage at time kTs (with Ts as sampling time), and i L and d are inductor’s current and duty ratio of the power converter, respectively.
The identification framework of the boost converter, based on Equation (1), is depicted in Figure 2b. In this series-parallel identification framework, symbol q−1 realizes unit delay.
To estimate a model that is dynamically valid from measured data, a dataset that contains rich enough information about the converter behavior should be generated. This is fulfilled by designing an appropriate excitation signal, which is the duty cycle of the system (d) in this case. To generate precise datasets, an amplitude-modulated pseudo-random binary signal (APRBS) with 59 different duty cycle levels is planned to form the excitation signal. The APRBS signals are proper choices for identification of nonlinear plants as they can extract information about the different operating modes of the nonlinear system [16,17]. The minimum hold time for this excitation signal, illustrated in Figure 3a, is 0.7 ms, which was obtained based on the step response of the boost converter.
Then, the designed excitation signal is employed as the input of the boost converter to generate data for the inductor’s current and the converter’s output voltage, while the simulation sampling time is Ts = 1 μs. In this period, 7000 input–output data samples are produced, the first 4000 samples are used to build the system model by the LMN and the remaining 3000 data are considered to validate the identified model. Figure 3b, c shows the output voltage and inductor’s current waveforms, respectively, achieved by applying the excitation signal.
Local model network (LMN) is utilized for modeling, identification and prediction of numerous nonlinear systems [18,19,20]. They are appropriate for identification and modeling of complex systems that feature several operating regimes, such as DC-DC converters, as each operating regime can be described by an LLM.

3. Framework

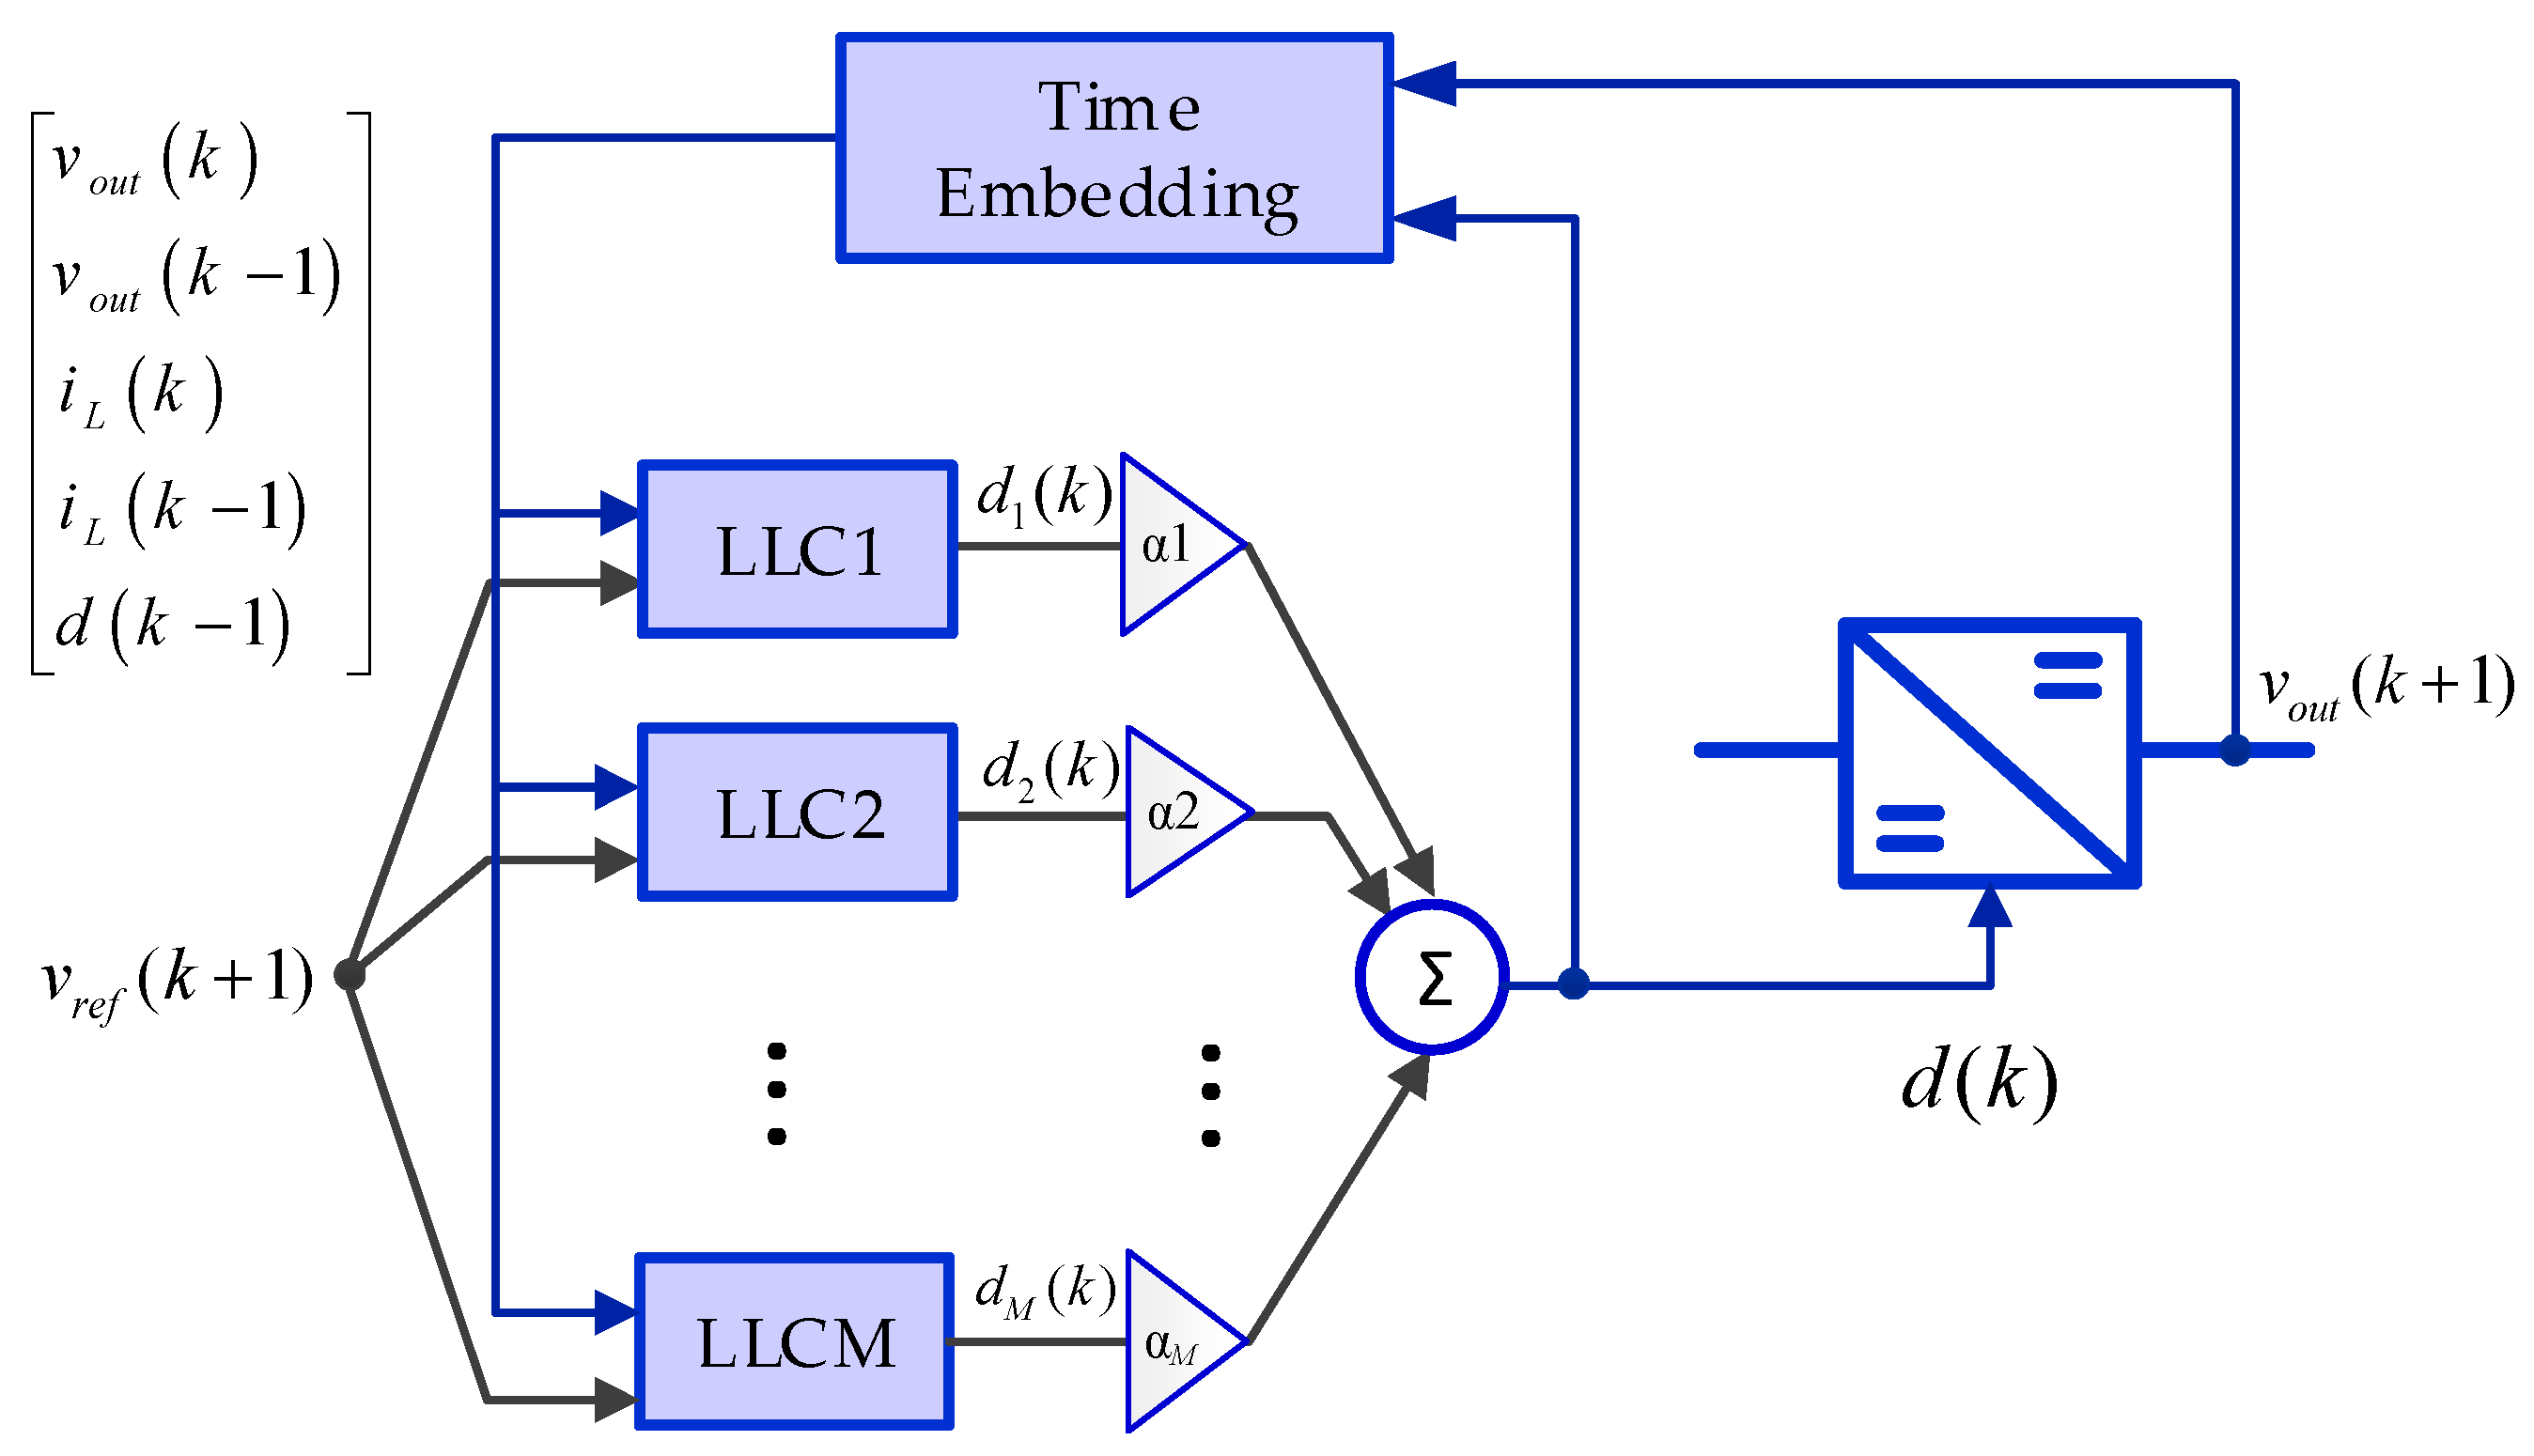
3.1. Network Structure

The LMN output of u = [u1 u2 … up]T and M local linear models can be expressed as,
y ^ = i = 1 M h i ( u _ ) . Φ i ( u _ )
h i ( u _ ) = θ i , 0 + θ i , 1 u 1 + + θ i , p u p
where hi (∙) describes ith local linear model (LLMi), θi = [θi,0 θi,1 … θi,p] is the vector parameter of the LLMi, Φi denotes the corresponding validity function of the LLMi and ŷ presents the LMN’s output. The LMN in Equation (2) can be interpreted as a Takagi–Sugeno (TS) [21] fuzzy inference system with M rules, and Φi(u) and hi (u) represent the rule premises and associated rule consequents, respectively [22].
The validity functions (premises) should form a partition of unity to have a rational interpretation of local models,
i = 1 M Φ i ( u _ ) = 1
In the structure of the LMN, two sets of parameters must be estimated from the measured data. The parameters of the consequent functions, θi, are estimated using a weighted least squares (WLS) algorithm [23]. On the other hand, the structure of the validity functions is determined by HBT.

3.2. Estimation of LLMs’ Parameters

Application of the WLS algorithm for estimation of the parameters of the LLMs from N measured samples leads to the following solution,
θ _ i = ( R _ i T . D _ i . R _ i ) 1 . R _ i T . D _ i . y _
where y = [y(1), …, y(N)]T is a vector that contains N target outputs and Ri and Di are regression and diagonal weighting matrices associated with the ith LLM, respectively, which are expressed as follows:
R _ i = [ 1 u 1 ( 1 ) u 2 ( 1 ) u p ( 1 ) . . . . 1 u 1 ( N ) u 2 ( N ) u p ( N ) ] N × p
D _ i = [ Φ i ( u _ ( 2 ) ) 0 0 0 Φ i ( u _ ( 2 ) ) 0 0 0 Φ i ( u _ ( N ) ) ] N × N
The solution in Equation (5) is obtained by local error minimization of each LLM over the N training samples [20].

3.3. Learning Algorithm

The hierarchical binary tree-learning algorithm is used to identify the parameters of the validity functions. The HBT algorithm starts by an LMN with a single LLM and then adds more LLMs and their validity functions in every iteration to refine LMN and improve its performance. This refinement is realized by partitioning of the input space into hyper-rectangles through axis-orthogonal splits [21,22]. In each iteration of HBT heuristic search, the validity region of the worst LLM is divided into two new regions. The division is tried in all dimensions and the best division associated with the highest improvement in LMN’s performance is considered. Then, two new validity functions are constructed for these regions and parameters of their LLMs are estimated by Equation (5).
In each iteration of the HBT algorithm, the validity functions are constructed by proper multiplication of sigmoid splitting functions, ψi,
ψ i = 1 1 + e σ i ( w i , 0 + w i , 1 u 1 + + w i , p u p )
where direction vector wi = [wi,1 … wi,px]T sets division direction, position parameter wi,0 determines the position of the split and the smoothness parameter σi determines the smoothness of the split. A detailed description of the HBT algorithm can be found in [22,23].

4. Design of Local Linear Control

While the DC-DC system model identification is developed/ derived, the LLC is designed to meet the requirements of the power converter. The inverse error dynamics control pursued in this paper includes precise tracking control.
In the exact tracking controller, the error equation is solved to define the control input which is essential for the next error value, i.e.,
v r e f ( k + 1 ) v o u t ( k + 1 ) = 0
Considering Equations (1) and (2), the estimated converter output voltage is as follows,
v ^ o u t ( k + 1 ) = i = 1 M Φ i × ( θ i , 0 + θ i , 1 v o u t ( k 1 ) + θ i , 2 v o u t ( k ) + θ i , 3 i L ( k 1 ) + θ i , 4 i L ( k ) ) +
+ i = 1 M Φ i ( θ i , 5 d ( k 1 ) ) + i = 1 M Φ i ( θ i , 6 d ( k ) )
If we set,
θ _ i = [ θ i , 0 θ i , 1 θ i , 5 ] ,
x _ ( k ) = [ 1   v o u t ( k 1 )   v o u t ( k ) i L ( k 1 ) i L ( k ) d ( k 1 ) ] T
c i = θ i , 6
Then, Equation (10) becomes,
v ^ o u t ( k + 1 ) = i = 1 M Φ i × ( θ _ i × x _ ( k ) ) + i = 1 M Φ i × ( c i × d ( k ) )
By replacing Equation (12) into Equation (9),
d ( k ) = v r e f ( k + 1 ) i = 1 M Φ i × ( θ _ i × x _ ( k ) ) i = 1 M Φ i c i
Note that, by defining,
d i ( k ) = v r e f ( k + 1 ) θ _ i × x _ ( k ) c i
The control input recommended by the ith local linear model, the control input of Equation (12), is as follows,
d ( k ) = i = 1 M Φ i c i d i ( k ) i = 1 M Φ i c i
Or
d ( k ) = i = 1 M α i d i ( k )
where α i = Φ i c i i = 1 M Φ i c i and i = 1 M α i = 1 .
Therefore, based on Equation (15), the control input in Equation (13) is the same as the weighted average of the control inputs of all local linear models, stated in Equation (14). Therefore, a local linear controller is obtained. The schematic diagram of the LLC is illustrated in Figure 4.

5. Simulation Results for a Standalone Boost Converter

This section reports the identification and voltage regulation results for the boost converter of Figure 2.

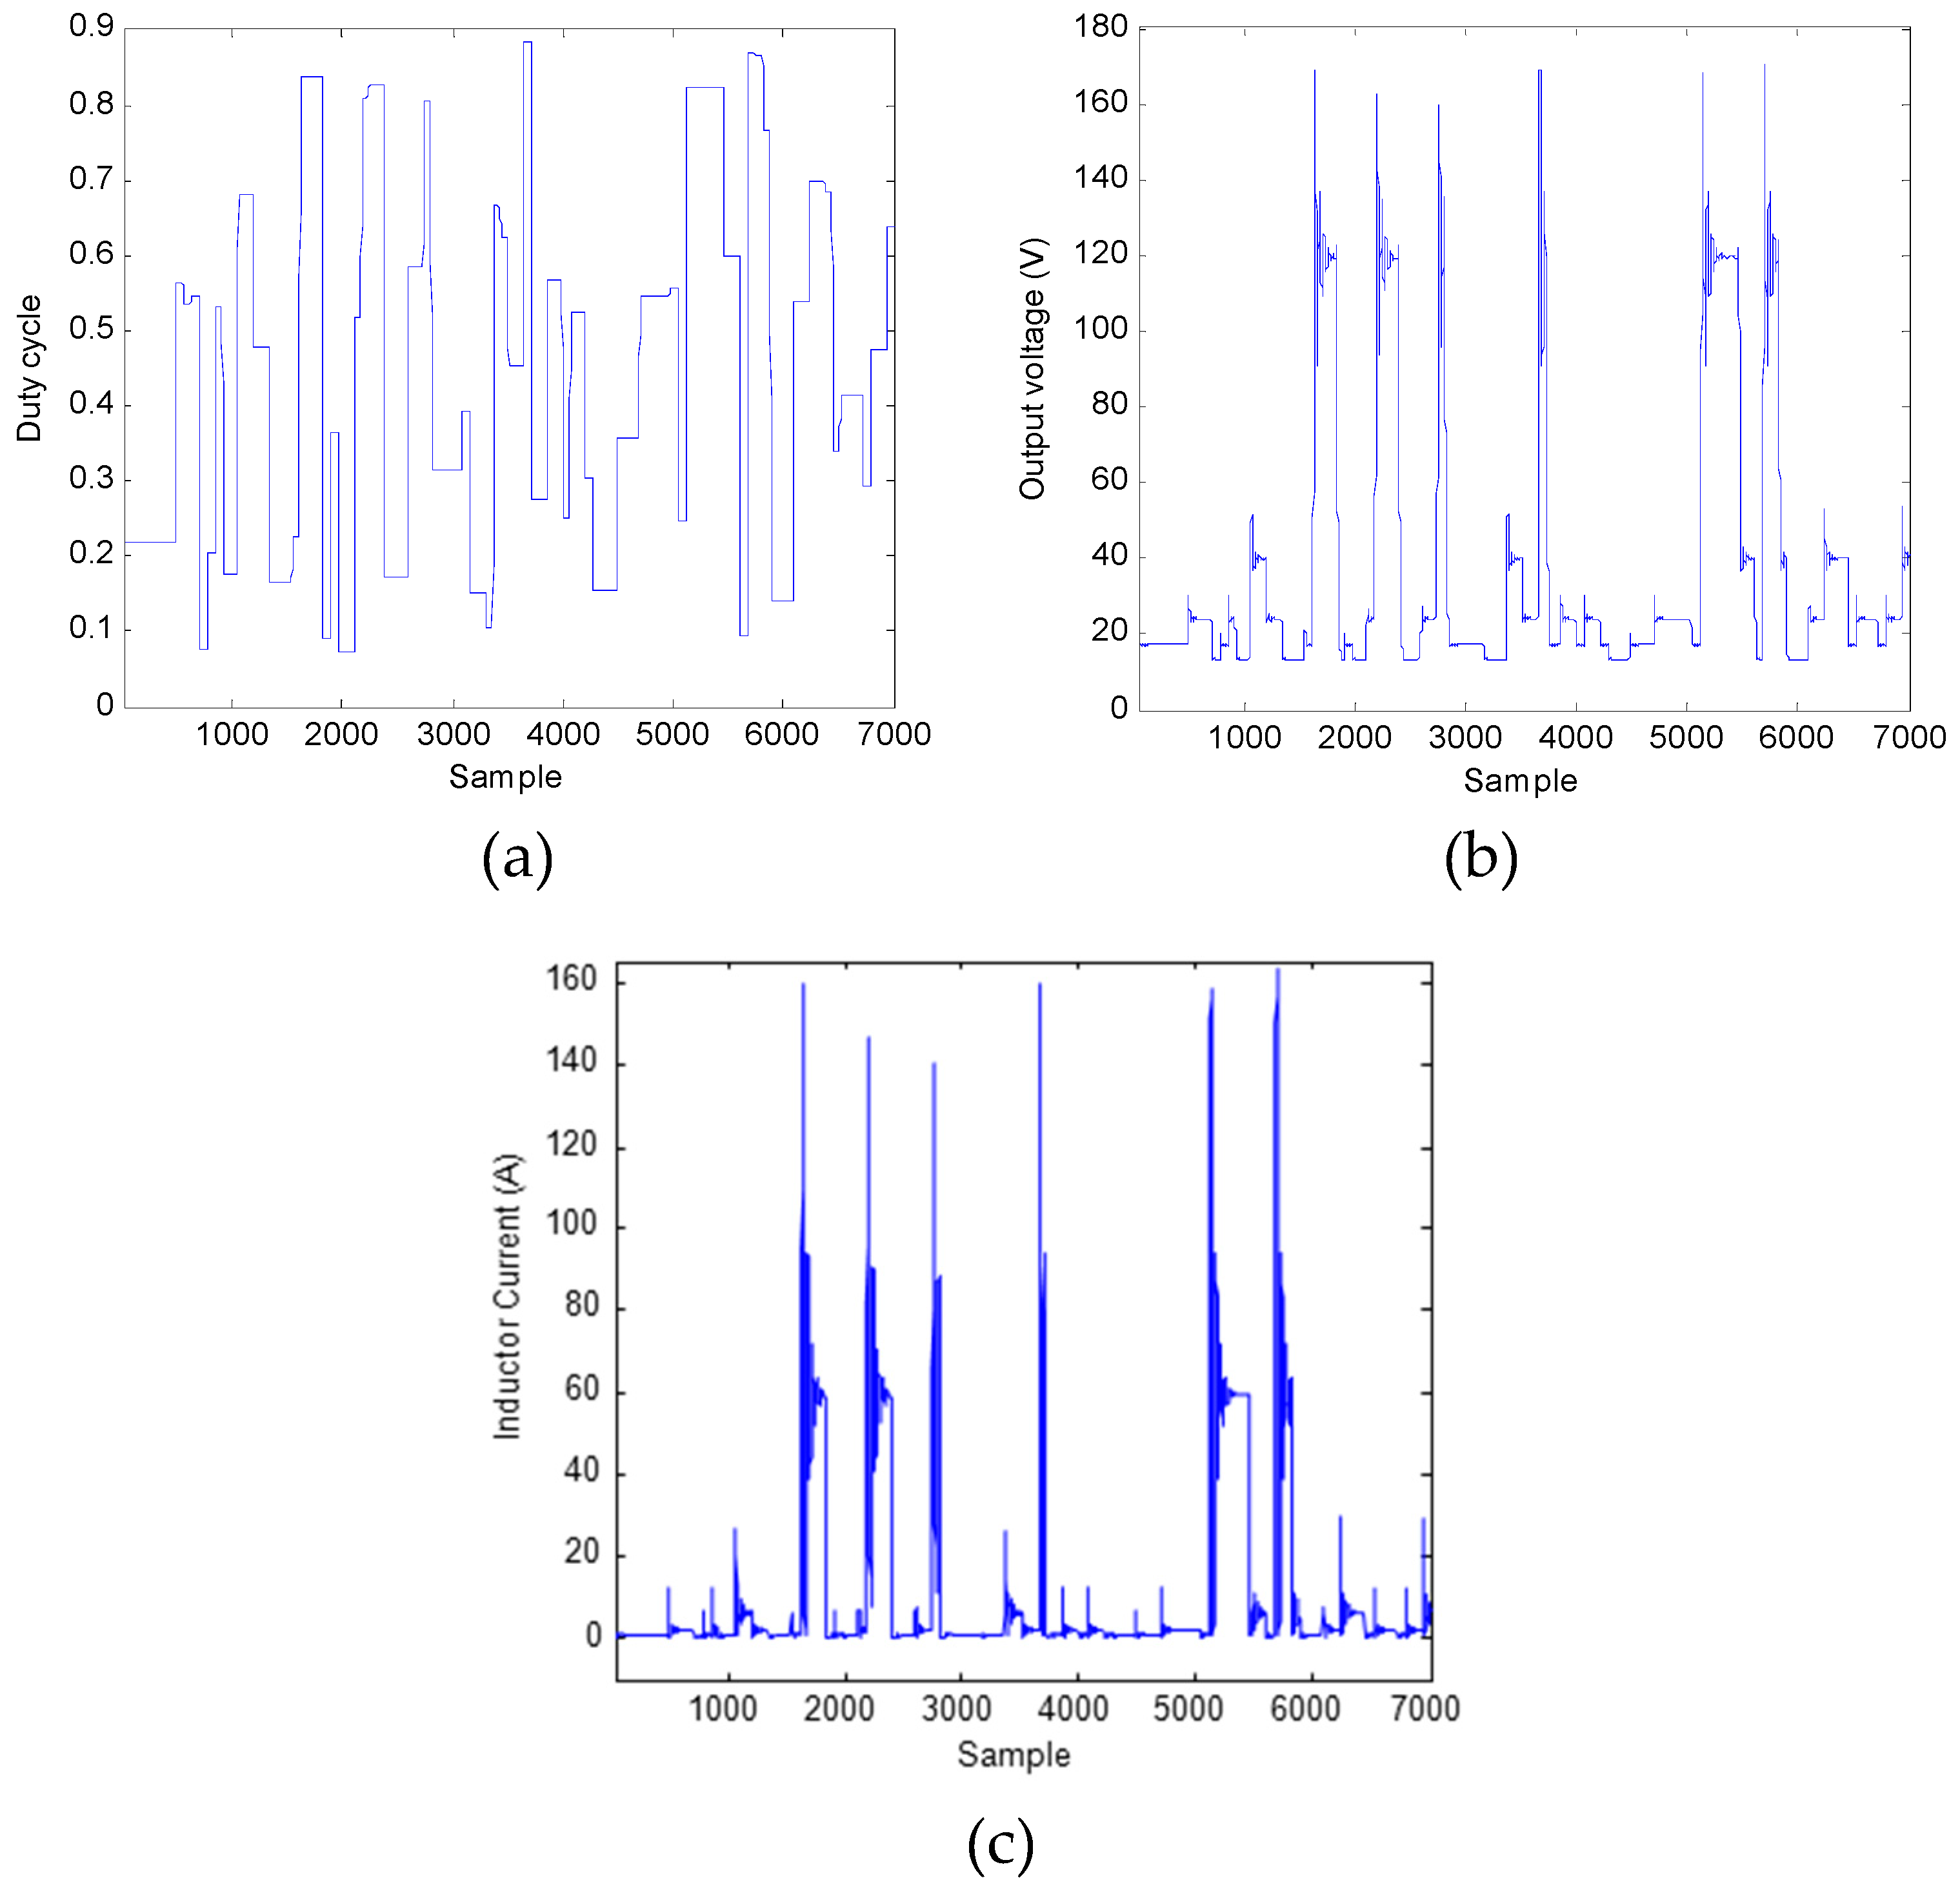
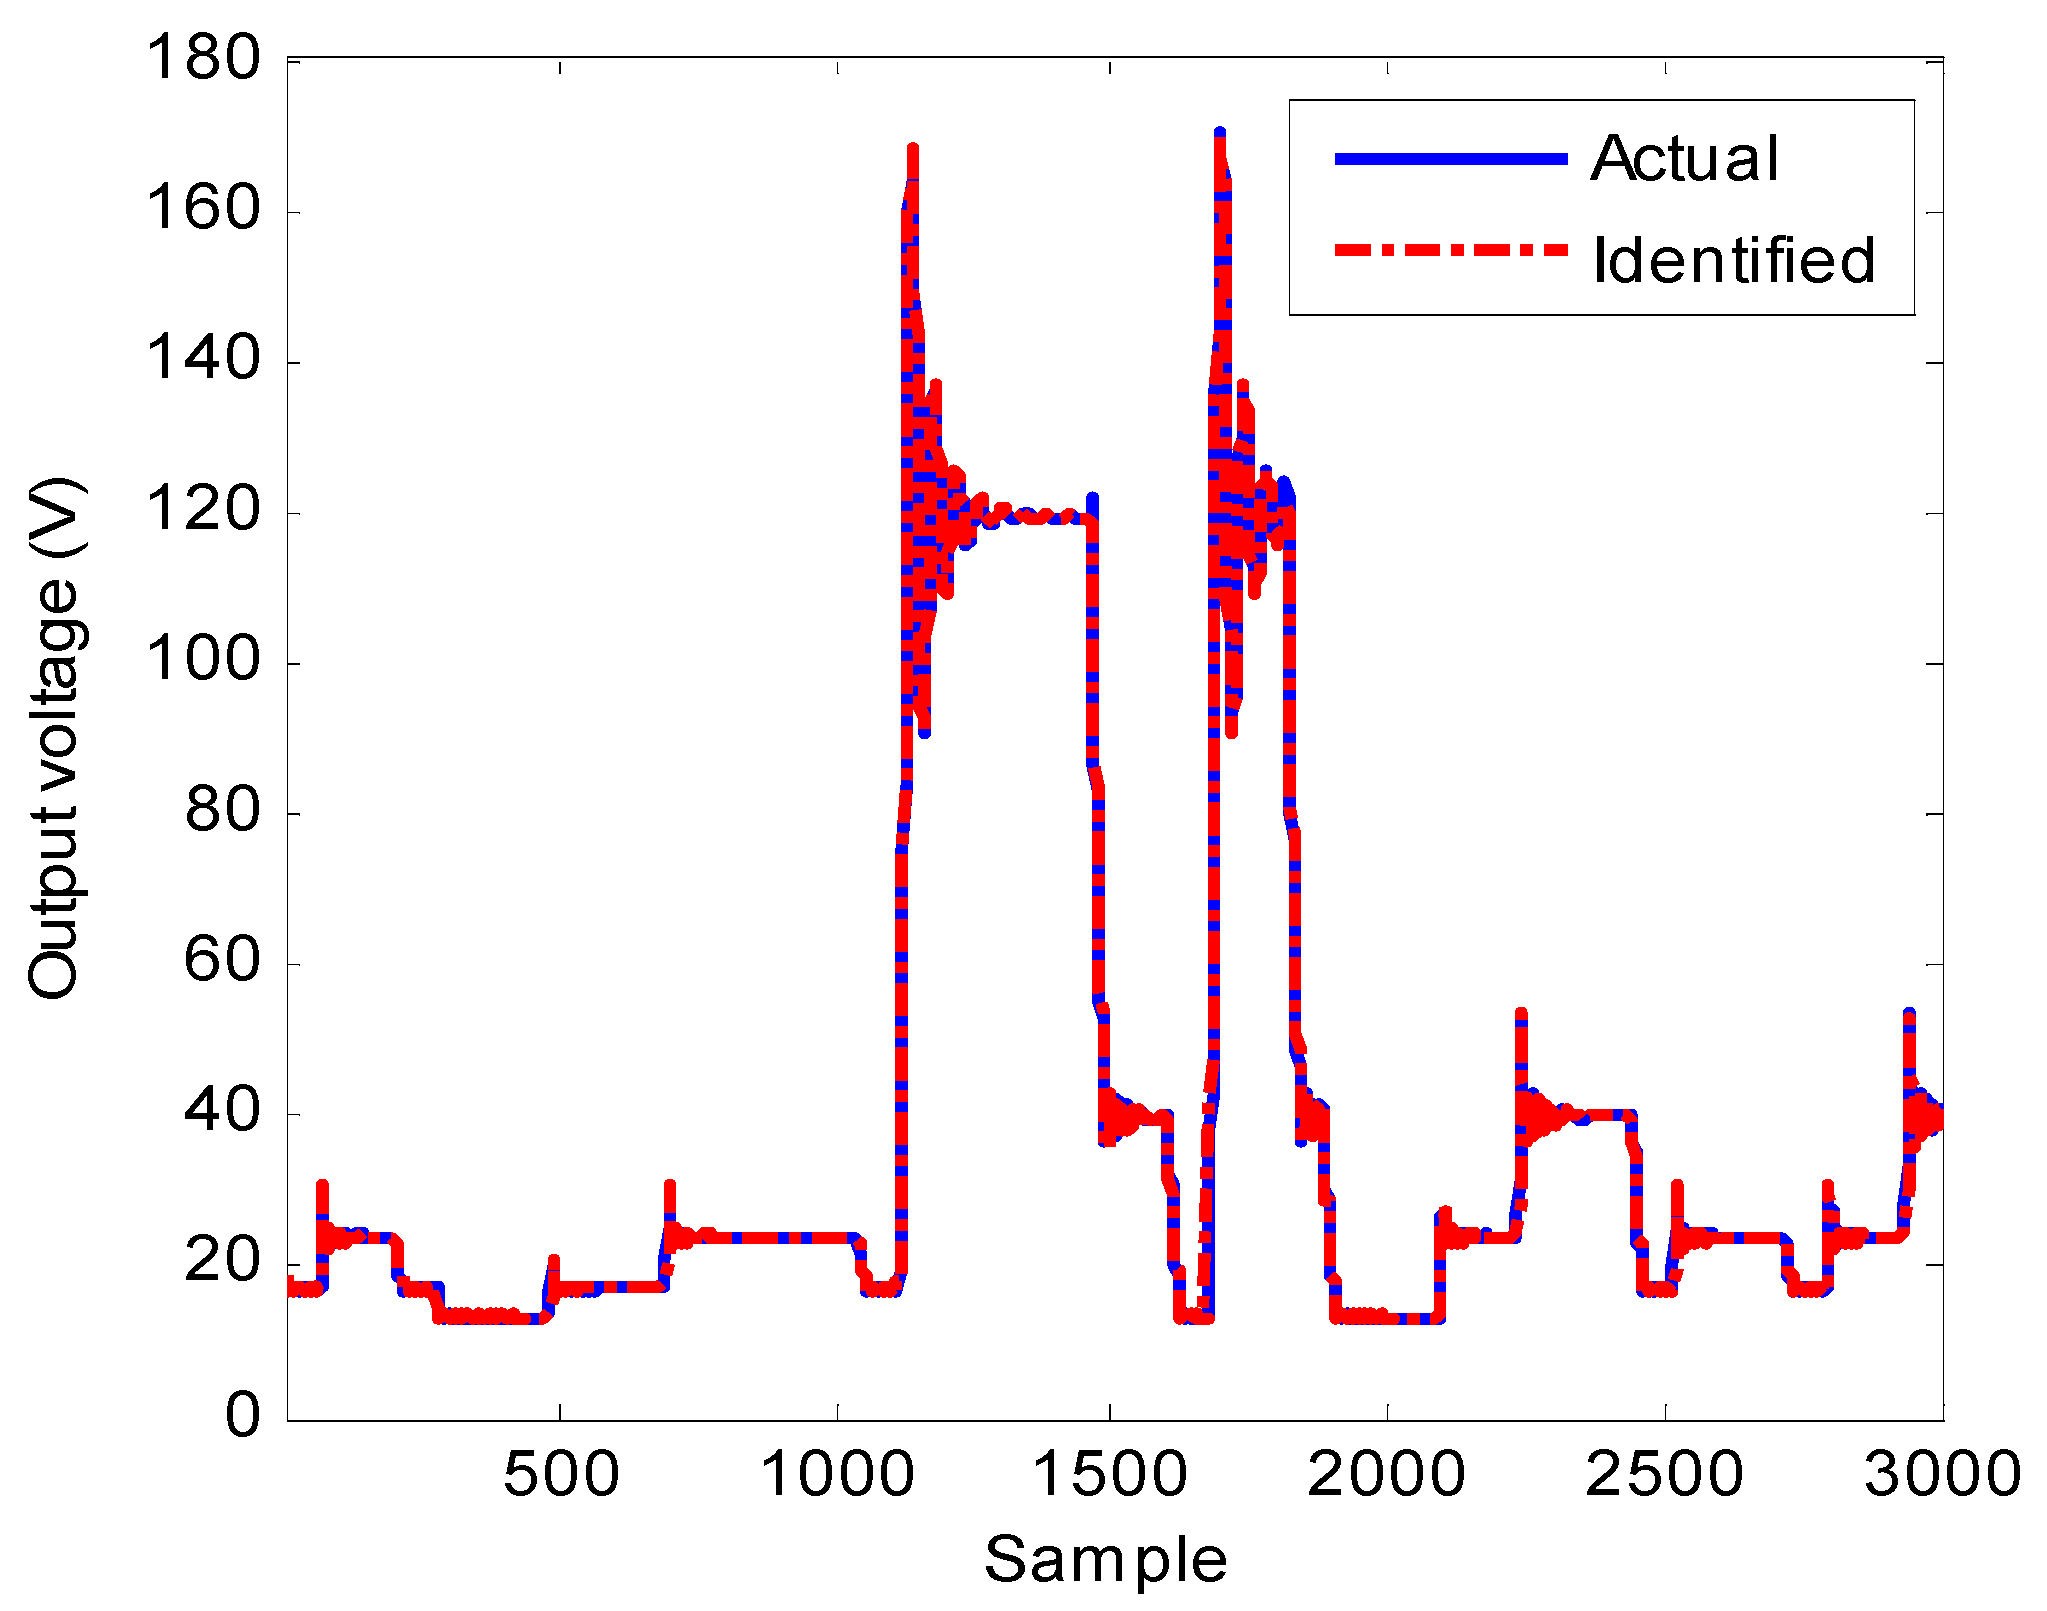
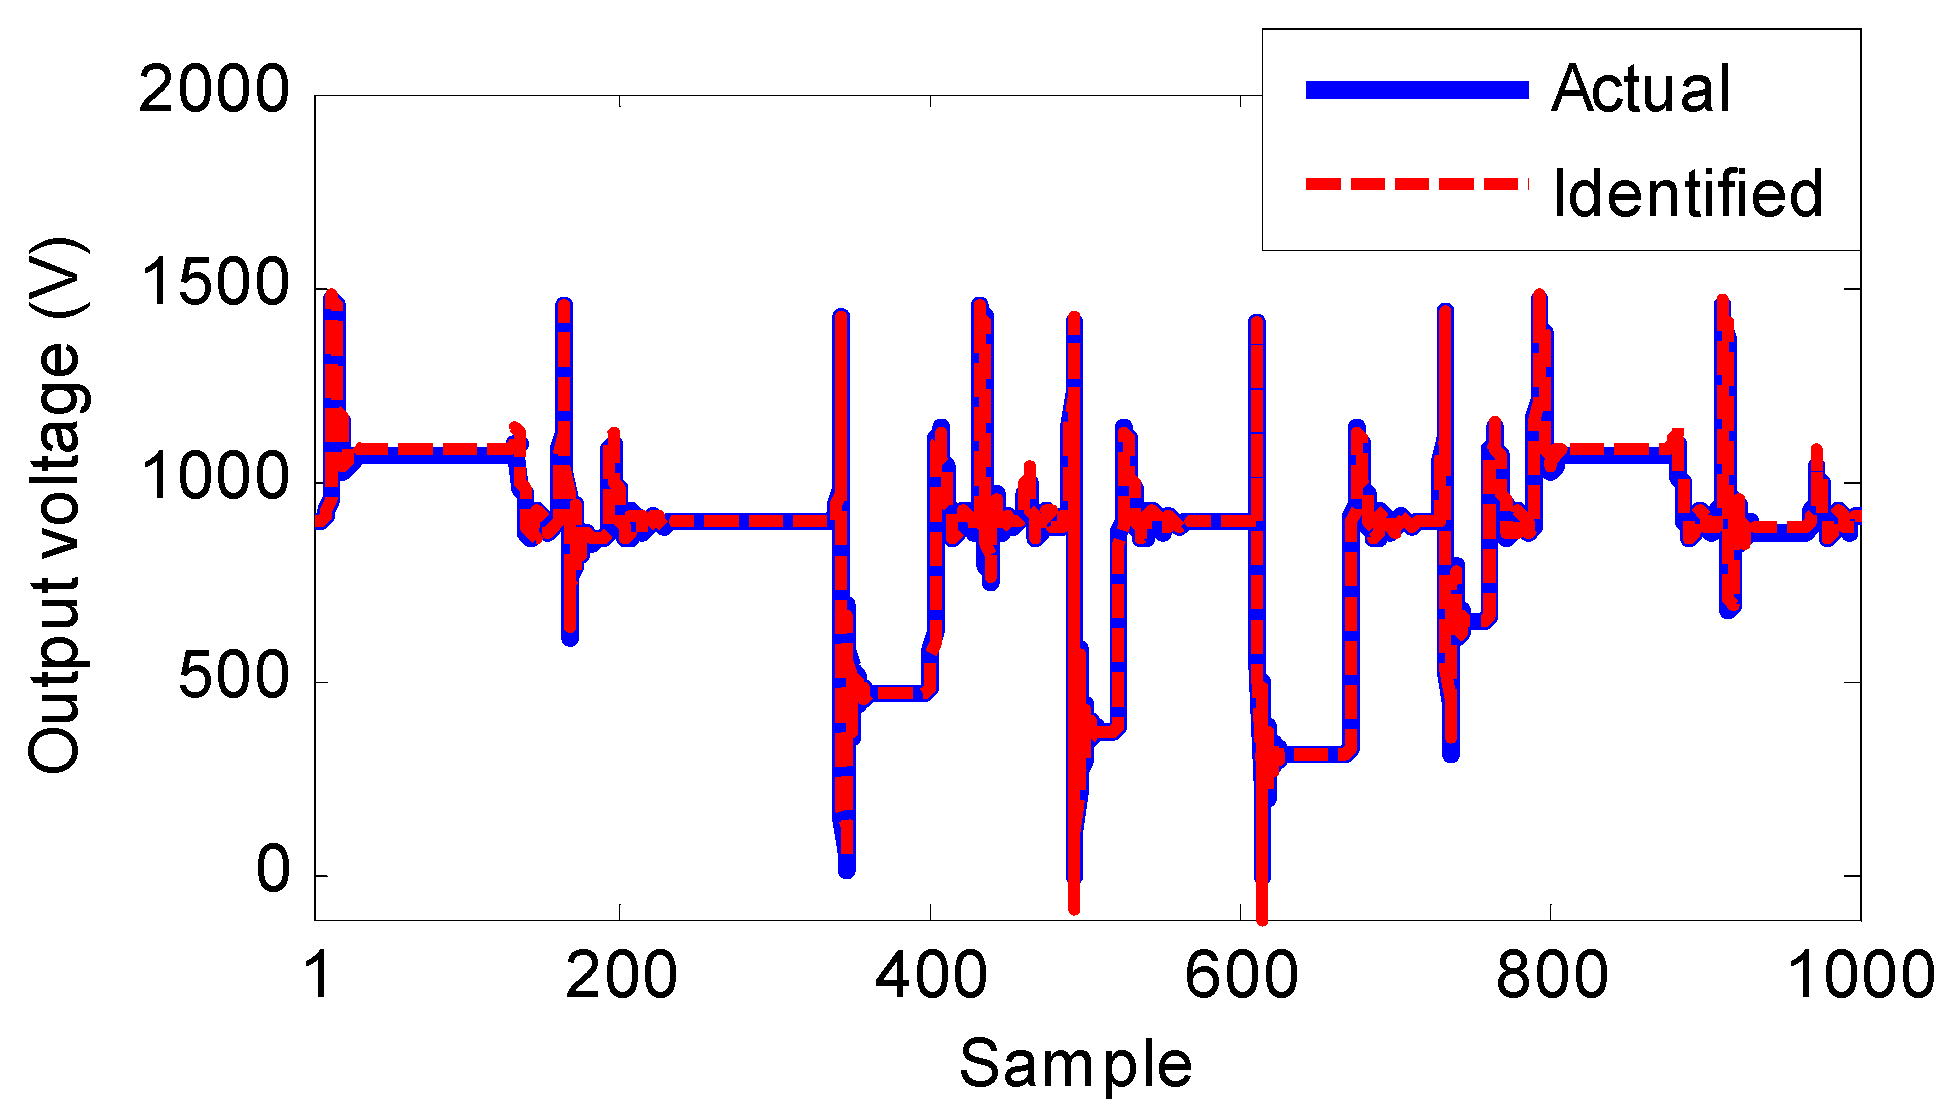
5.1. Results of Converter Identification

To assess performance of the LMN in the identification of boost converter dynamic behavior, two error criteria, namely root mean square error (RMSE) and mean absolute percentage error (MAPE), were used
R M S E = 1 T k = 1 T ( v o u t ( k ) v ^ o u t ( k ) ) 2
M A P E = ( 1 T ) . k = 1 T { | v o u t ( k ) v ^ o u t ( k ) | v o u t ( k ) }
where T is the number of test samples.
Figure 5 presents the actual and estimated converter output voltage for the test samples. Clearly, the LMN successfully captured the converter dynamic behaviors since the estimated voltages flawlessly matched the actual values. The RMSE and MAPE for estimation of test data are listed in Table 1. The identified system’s robustness against measurement noise is also shown in Table 1.

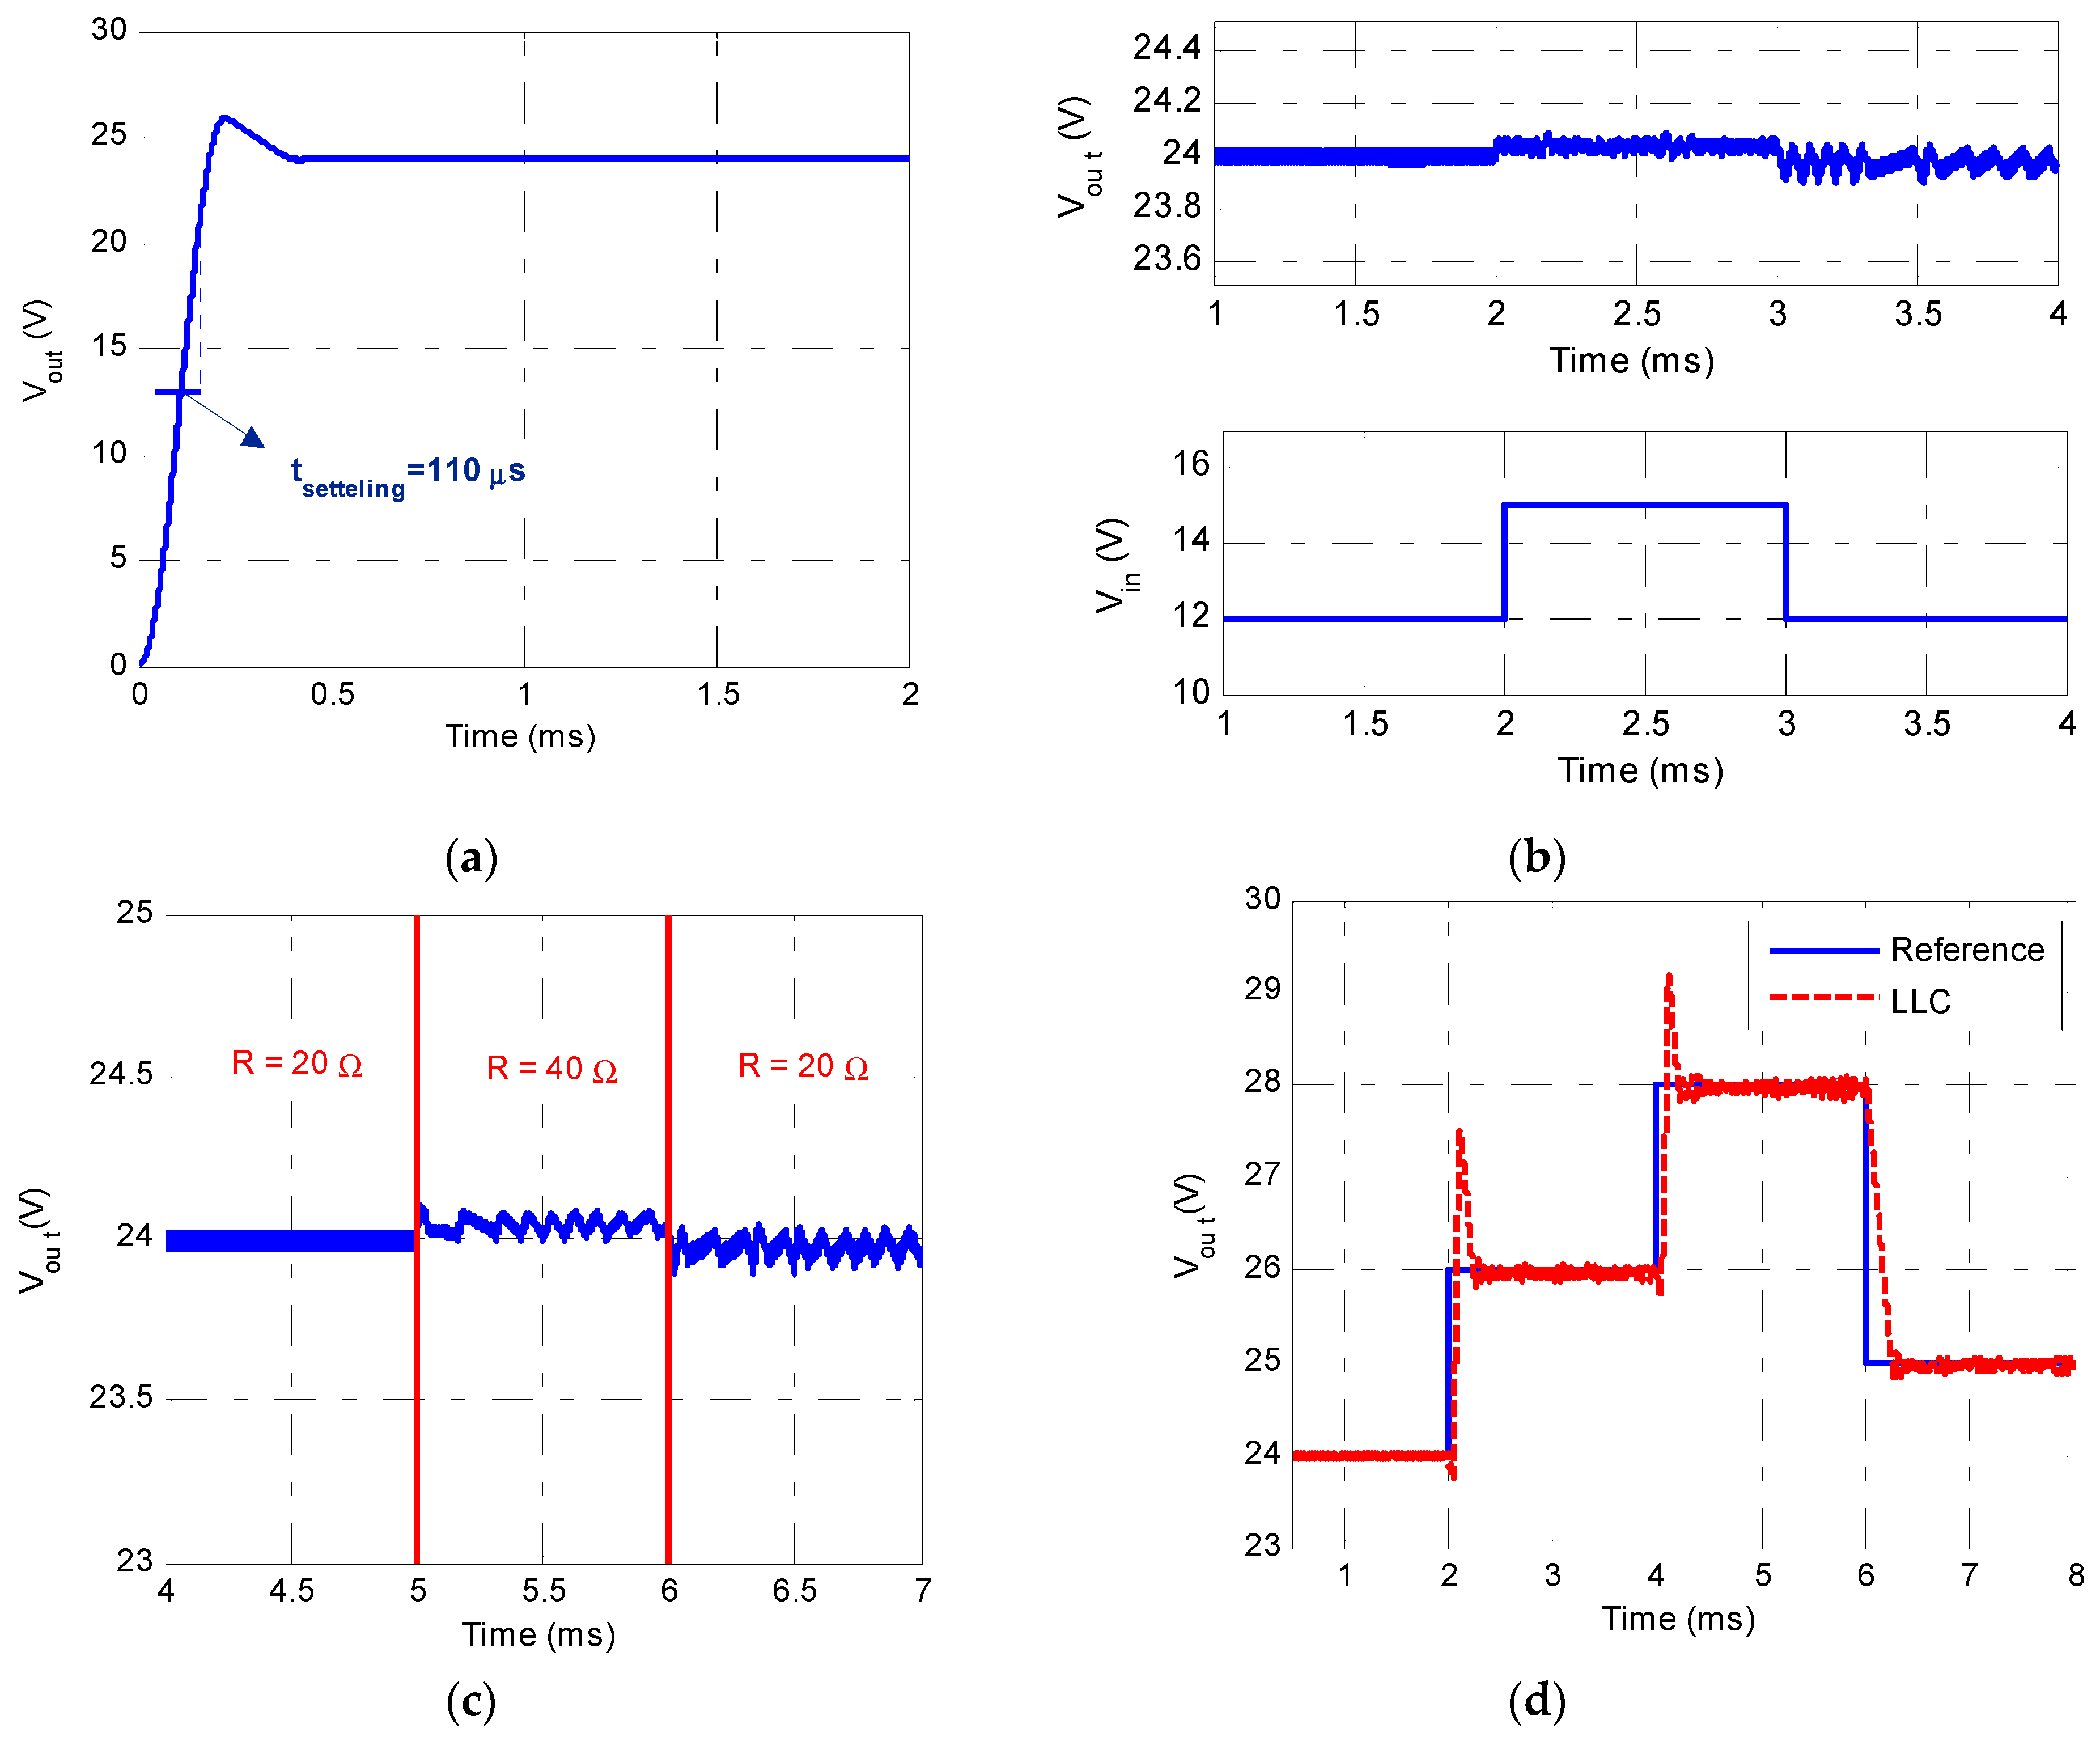
5.2. Voltage Regulation

The switching frequency of 100 kHz was adopted for converter control. Using the LLC scheme, the step response of the converter was evaluated for the input voltage of 12 V and the reference voltage of 24 V. The converter step response is illustrated in Figure 6a and the numerical evaluations of the step response are presented in Table 2.
To evaluate the controller performance against the source voltage variations, two-step changes from 12 to 15 V and from 15 to 12 V were applied to the input at time instants 1 ms, 2 ms and 3 ms, respectively. Robustness of the proposed controller against fast variations in the source voltage is noticeable in Figure 6b.
Simulations were performed to evaluate robustness of the controller with respect to load changes. The load changed from 20 Ω to 40 Ω at time instant 5 ms and back again to 20 Ω at 6 ms. The erformance of the proposed controller is depicted in Figure 6c. As can be seen, the LLC almost kept the output voltage unchanged during the load variations.
For more investigation of the proposed LLC, its performance in reference to output voltage tracking was analyzed. Figure 6d shows the LLC performance is tracking various reference voltages including 24 V, 26 V, 28 V and 25 V. Interestingly, the proposed control approach quickly followed variations in reference voltage.
Apart from the proposed control performance of the approach against variations in the source voltage, load resistance or reference voltage, its robustness against variations in converter’s parameters is also of importance. To assess this capability, converter’s parameters (the value of inductance and capacitance in Figure 2a) were varied between −10% to +10% with 5% steps. Then, in each case, the step response was simulated and the integral of time multiplied by the absolute error (ITAE), which is defined by Equation (18), was computed,
I T A E = 0 0.002 t . | v o u t ( t ) v ^ o u t ( t ) | d t
Table 3 compares the values obtained for ITAE in each simulation case. It is clear that ITAEs for all simulations were of the same order. Therefore, it can be concluded that the proposed control approach exhibited great robustness against variations in converter parameters.

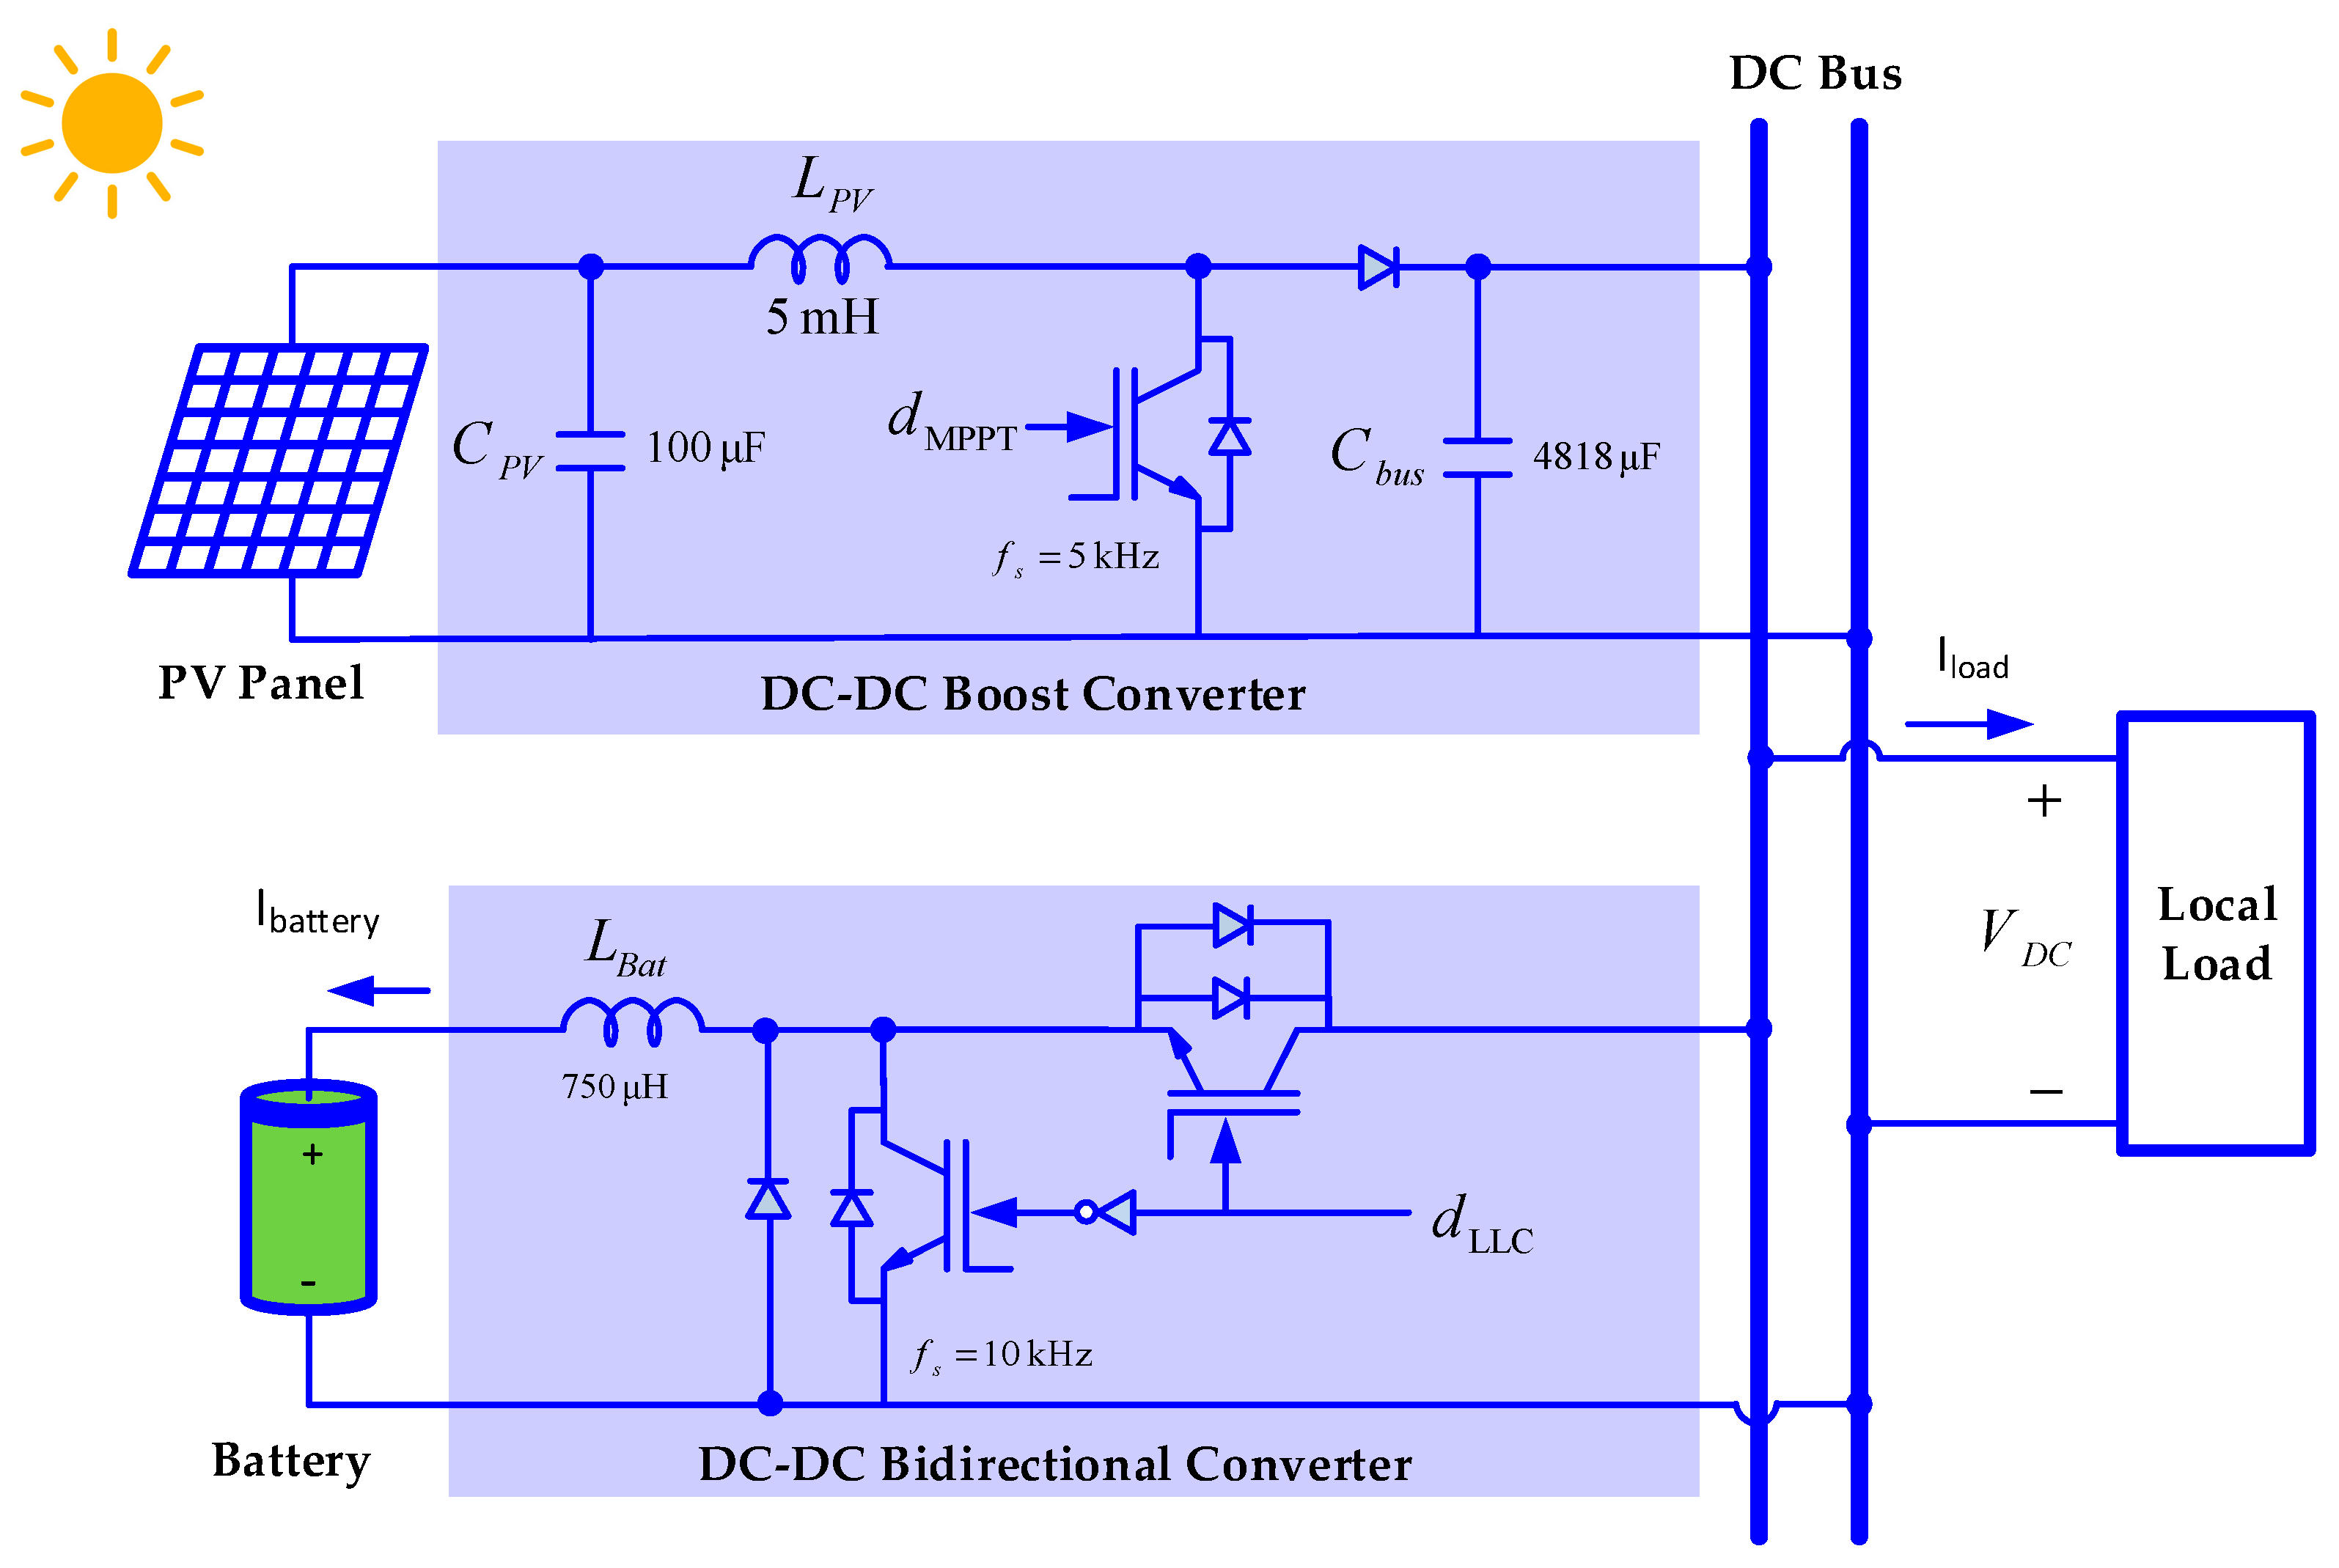
6. Application to a test DC Microgrid

To better investigate the effectiveness of the proposed approach, a DC microgrid was considered. The DC microgrid featured a photovoltaic (PV) panel as well as battery storage and resistive load, as illustrated in Figure 7. The network voltage was 685 V. A DC-DC boost converter interfaced the PV panel to the microgrid. The duty ratio of this converter (dMPPT) was tuned by the incremental conductance algorithm [24] for the maximum power point tracking (MPPT). On the other hand, energy storage was connected to the DC microgrid via a bidirectional DC-DC converter. The bidirectional converter regulated the grid’s voltage based on the DDS, inside the microgrid. The DC microgrid specifications are provided in Table 4.

6.1. Identification of Bidirectional Converter Dynamics

Similar to the previous simulation study, the dynamic model of the bidirectional converter was derived from the measurement data. Hence, an APRBS considering 55 duty cycle levels was utilized to produce measurement data. The sampling time was considered 5 μs. Totally, 3000 input–output data sample were produced, 2000 of them served as the training data and the rest were used to validate the identified model.
For modeling of the bidirectional converter, 5-LMN was generated as the best-performing model. The actual and estimated output voltage of the bidirectional converter are shown in Figure 8. Next, the LLC for the bidirectional converter was designed based on the derived LMN.

6.2. LLC of the Bidirectional Converter

The design of the local linear controller was carried on based on Equation (15). In this study, three case studies, namely step response, load resistance variation and solar irradiance variation, were applied. Furthermore, PI-based control scheme was designed for comparison. The PI controller comprised the voltage control loop (VCL) and current control loop (CCL), as proposed in [23,24,25,26]:
T F V C L = 4.26 S + 400 S
T F C C L = 0.0026 S + 0.4938 S + 1

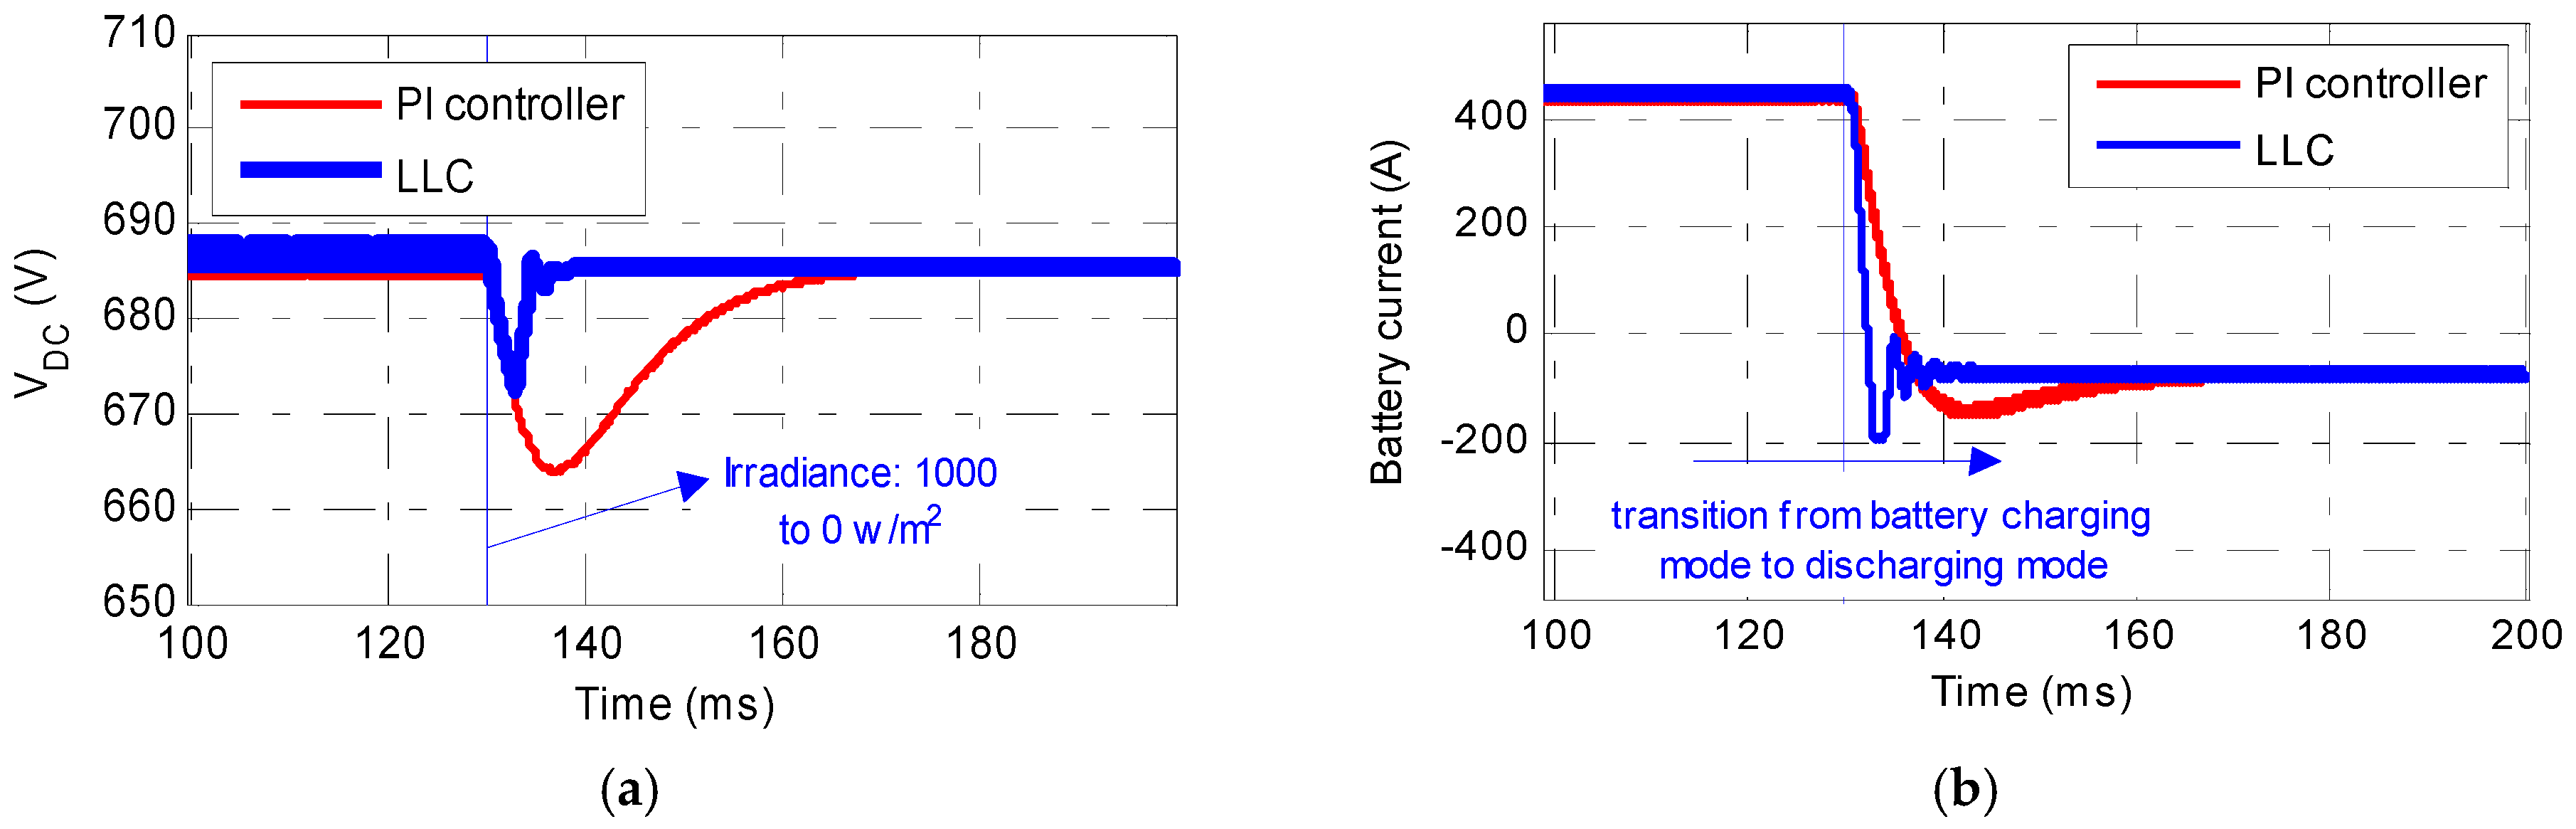
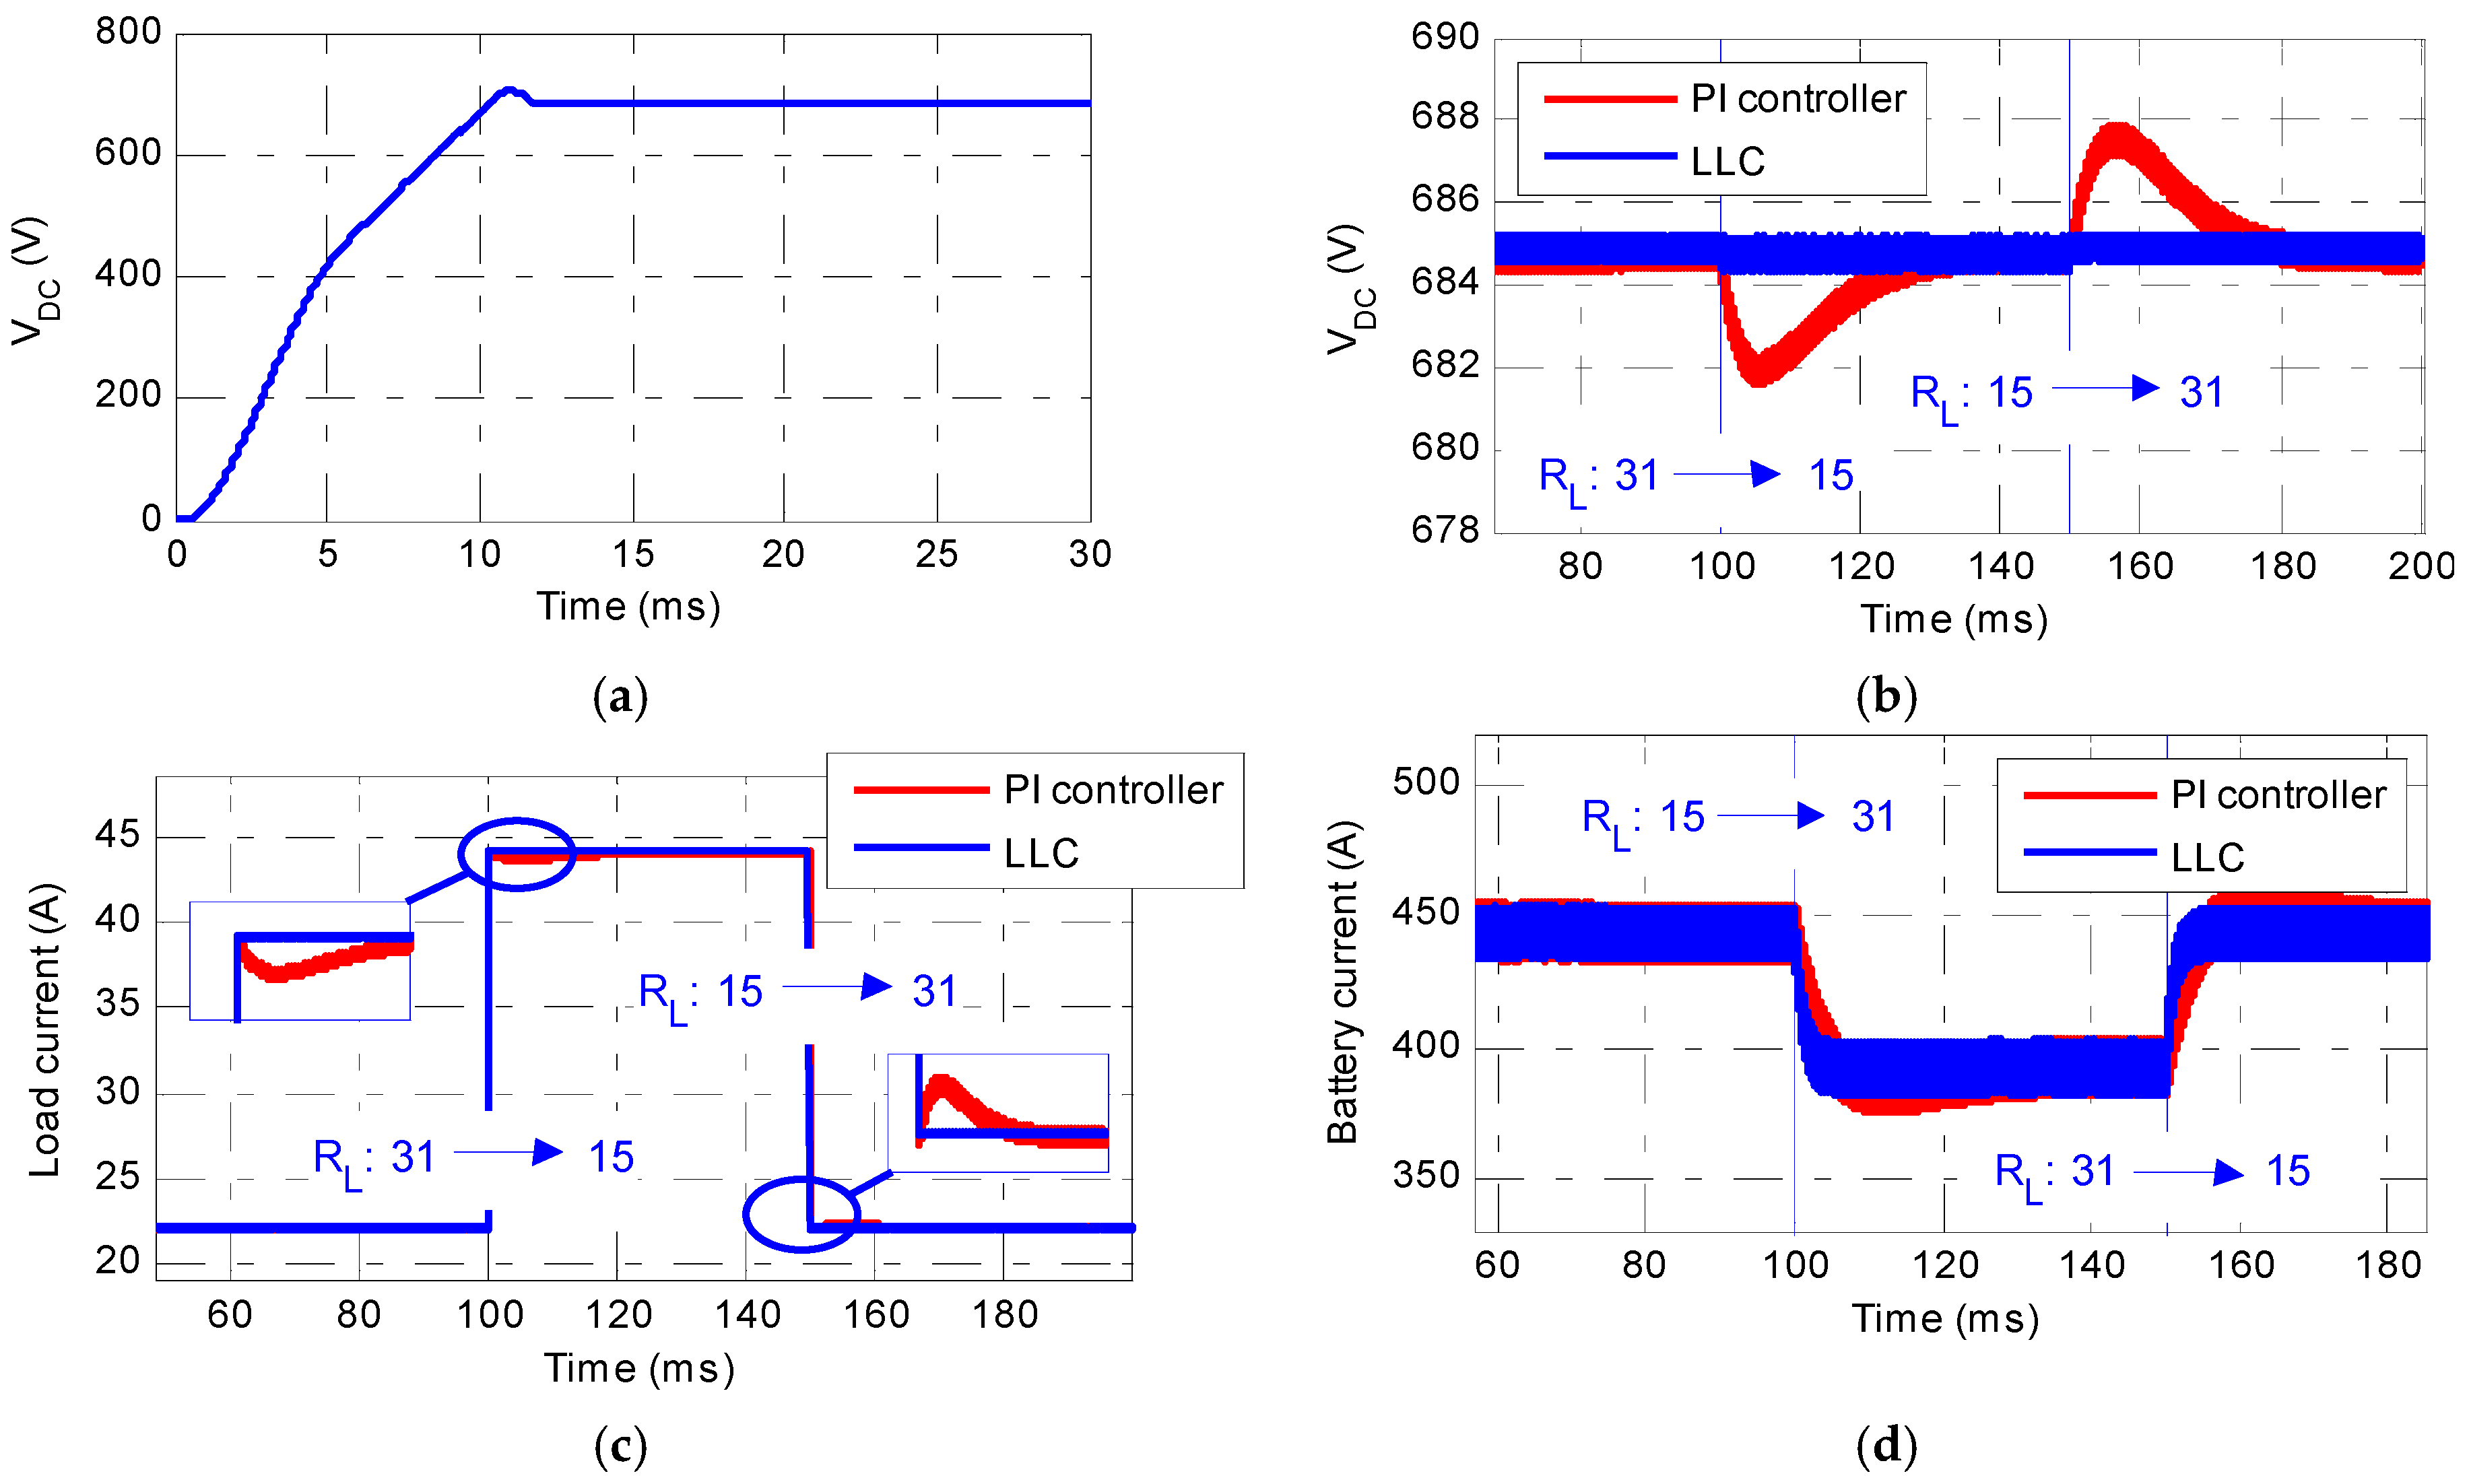
6.2.1. Response to Step Change

The response to step change for the LLC is shown in Figure 9a. The achieved response featured speed with negligible overshoot. Table 5 presents the comparison between LLC and PI step responses. Evidently, the proposed LLC provided lower rise time and settling time as well as less overshoot compared to PI.

6.2.2. Load variations

The load variation scenario included load changing from 31 Ω to 15 Ω and back again. The performance of the PI controller and LLC against the load variation is depicted in Figure 9b. As can be seen, the LLC showed outstanding performance.
To present a more detailed comparison, the load and battery currents achieved by both controllers are demonstrated in Figure 9c,d.

6.2.3. Variations in Solar Irradiance

The last study on the DC microgrid was dedicated to the irradiance variations. Based on the control system action, it is expected that the load side voltage is maintained at the reference value during variations in irradiance. The solar irradiation was changed from 1000 to 0 W/m2 at 130 ms.
Based on the results illustrated in Figure 10a, it is evident that the LLC demonstrated more satisfactory robustness against the variations in the solar irradiance, compared to the PI controller.
The PI controller yielded around 3% of pre-specified voltage with slowly-damped undershoot, while the LLC restored the voltage back to the pre-specified value rapidly with around 1.5% undershoot.
The profile of the battery current in Figure 10b shows the charge to discharge mode transition, due to the absence of PV generation. It is clear that the achieved results by the LLC reached the steady-state more quickly than the PI controller.

7. Conclusions

This paper develops a data-driven identification strategy by use of LMNs for DC-DC converters identification and voltage control. The proposed LMNs employ input–output measurement data to identify converter dynamics at the first step. Then, the identified model was used to derive the control law for the voltage regulation of the converter. The proposed approach was used for identification and voltage regulation of converters in both standalone mode as well as grid-connected operation.
For the standalone converter, step response as well as response to load and source variations confirmed the pleasing performance of the LLC. Furthermore, for the DC-DC converters in a DC microgrid, simulations were performed under various scenarios indicating satisfactory performance with the proposed control technique. In both test scenarios, comparisons to conventionally tuned PI control demonstrated the superiority of the proposed approach.

Author Contributions

All authors have contributed equally to this work and all authors have read and approved the final manuscript.

Funding

This research received no external funding.

Conflicts of Interest

The authors declare no conflict of interest.

References

  1. Rouzbehi, K.; Candela, J.I.; Luna, A.; Gharehpetian, G.B.; Rodriguez, P. Flexible Control of Power Flow in Multiterminal DC Grids using DC–DC Converter. IEEE J. Emerg. Sel. Top. Power Electron. 2016, 4, 1135–1144. [Google Scholar] [CrossRef]
  2. Rouzbehi, K.; Yazdi, S.S.H.; Moghadam, N.S. Power Flow Control in Multi-Terminal HVDC Grids using a Serial-Parallel DC Power Flow Controller. IEEE Access. 2018, 6, 56934–56944. [Google Scholar] [CrossRef]
  3. Yazdi, S.S.H.; Milimonfared, J.; Fathi, S.H.; Rouzbehi, K. Optimal Placement and Control Variable Setting of Power Flow Controllers in Multi-terminal HVDC Grids for Enhancing Static Security. Int. J. Electr. Power Energy Syst. 2018, 102, 272–286. [Google Scholar] [CrossRef]
  4. Rouzbehi, K.; Gharehpetian, G.B.; Candela, J.; Luna, A.; Harnefors, L.; Rodriguez, P. Multi-terminal DC grids: Operating analogies to ac power systems. Renew. Sustain. Energy Rev. 2017, 70, 886–895. [Google Scholar] [CrossRef]
  5. Rodriguez, P.; Rouzbehi, K. Multi-Terminal DC grids: Challenges and Prospects. Mod. Power Syst. Clean Energy 2017, 5, 515–523. [Google Scholar] [CrossRef]
  6. Rouzbehi, K.; Miranian, A.; Luna, A.; Rodriguez, P. Towards fully controllable multi-terminal DC grids using flexible DC transmission systems. Energy Convers. Congr. Expo. (ECCE) 2014, 5312–5316. [Google Scholar] [CrossRef]
  7. Rouzbehi, K.; Miranian, A.; Candela, J.I.; Luna, A.; Rodriguez, P. A hybrid power flow controller for flexible operation of multi-terminal DC grids. In Proceedings of the International Conference on Renewable Energy Research and Application (ICRERA), Milwaukee, WI, USA, 19−22 October 2014; pp. 550–555. [Google Scholar] [CrossRef]
  8. Rouzbehi, K.; Miranian, A.; Candela, J.I.; Luna, A.; Rodriguez, P. Proposals for flexible operation of multi-terminal dc grids: Introducing flexible dc transmission system (FDCTS). In Proceedings of the International Conference on Renewable Energy Research and Application (ICRERA), Milwaukee, WI, USA, 19−22 October 2014; pp. 180–184. [Google Scholar]
  9. De Medeiros, R.L.P.; Barra, W.; De Bessa, I.V.; Filho, J.E.C.; Ayres, F.A.D.C.; Das Neves, C.C. Robust Decentralized Controller for Minimizing Coupling Effect in Single Inductor Multiple Output DC-DC Converter Operating in Continuous Conduction. Mode. ISA Trans. 2018, 73, 112–129. [Google Scholar] [CrossRef] [PubMed]
  10. Restrepo, C.; Calvente, J.; Romero, A.; Vidal-Idiarte, E.; Giral, R. Current-Mode Control of A Coupled-Inductor Buck–Boost DC–DC Switching Converter. IEEE Trans. Power Electron. 2012, 27, 2536–2549. [Google Scholar] [CrossRef]
  11. Shen, L.; Li, C.; Lu, D.D.C. Adaptive Sliding Mode Control Method for DC–DC Converters. IET Power Electron. 2015, 8, 1723–1732. [Google Scholar] [CrossRef]
  12. Elshaer, M.; Mohamed, A.; Mohammed, O. Smart Optimal Control of DC-DC Boost Converter in PV Systems. In Proceedings of the Transmission and Distribution Conference and Exposition, Sao Paulo, Brazil, 8–10 November 2010. [Google Scholar]
  13. Cheng, K.H.; Hsu, C.F.; Lin, C.M.; Lee, T.T.; Li, C. Fuzzy–Neural Sliding-Mode Control for DC-DC Converters Using Asymmetric Gaussian Membership Functions. IEEE Trans. Ind. Electron. 2007, 54, 1528–1536. [Google Scholar] [CrossRef]
  14. Rouzbehi, K.; Miranian, A.; Citro, C.; Luna, A.; Rodriguez, P. Enhanced Average Current-Mode Control for DC-DC Converters Based on An Optimized Fuzzy Logic Controller. In Proceedings of the IECON 2012—38th Annual Conference of IEEE Industrial Electronics Society, Montreal, QC, Canada, 25–28 October 2012; pp. 382–387. [Google Scholar]
  15. Bastos, R.F.; Aguiar, C.R.; Gonçalves, A.F.Q.; Machado, R.Q. An Intelligent Control System Used to Improve Energy Production From Alternative Sources With DC/DC Integration. IEEE Trans. Smart Grid. 2014, 5, 2486–2495. [Google Scholar] [CrossRef]
  16. Naik, B.; Mehta, A. Sliding mode controller with modified sliding function for DC-DC Buck Converter. ISA Trans. 2017, 70, 279–287. [Google Scholar] [CrossRef]
  17. Nelles, O. Nonlinear System Identification: From Classical Approaches to Neural Networks and Fuzzy Models; Springer-Verlag: Berlin, Germany, 2001. [Google Scholar]
  18. Hametner, C.; Jakubek, S. Nonlinear Identification with Local Model Networks using GTLS Techniques and Equality Constraints. IEEE Trans. Neural Networks 2011, 22, 1406–1418. [Google Scholar] [CrossRef] [PubMed]
  19. Kazemi, R.; Abdollahzade, M. Introducing an Evolving Local Neuro-Fuzzy Model—Application to modeling of car-following behavior. ISA Trans. 2015, 59, 375–384. [Google Scholar] [CrossRef] [PubMed]
  20. Oysal, Y.; Yilmaz, S. Fuzzy Wavelet Neural Network Models for Prediction and Identification of Dynamical Systems. IEEE Trans. Neural Networks. 2010, 21, 1599–1609. [Google Scholar]
  21. Takagi, T.; Sugeno, M. Fuzzy Identification of Systems and Its Applications to Modeling and Control. IEEE Trans. Syst. Man Cybern. 1985, 15, 116–132. [Google Scholar] [CrossRef]
  22. Miranian, A.; Abdollahzade, M. Developing a Local LSSVM-Based Neuro-Fuzzy Model for Nonlinear and Chaotic Time Series Prediction. IEEE Trans. Neural Netw. 2013, 24, 207–218. [Google Scholar] [CrossRef]
  23. Miranian, A.; Rouzbehi, K. Nonlinear Power System Load Identification Using Local Model Networks. IEEE Trans. Power Syst. 2013, 28, 2872–2881. [Google Scholar] [CrossRef]
  24. Narendra, K.; Lin, Y.-H.; Valavani, L. Stable Adaptive Controller Design, Part II: Proof of Stability. IEEE Trans. Autom. 1980, 25, 440–448. [Google Scholar] [CrossRef]
  25. Alonge, F.; Rabbeni, R.; Pucci, M.; Vitale, G. Identification and Robust Control of a Quadratic DC/DC Boost Converter by Hammerstein Model. IEEE Trans. Ind. Appl. 2015, 51, 3975–3985. [Google Scholar] [CrossRef]
  26. Xiao, W.; Dunford, W.; Palmer, P.; Capel, A. Application of Centered Differentiation and Steepest Descent to Maximum Power Point Tracking. IEEE Trans. Ind. Electron. 2007, 54, 2539–2549. [Google Scholar] [CrossRef]
Figure 1. A typical DC microgrid integrating renewable sources.
Electronics 08 00493 g001
Figure 2. (a) Standalone DC-DC boost converter circuit; and (b) the identification framework using the LMN.
Electronics 08 00493 g002
Figure 3. (a) The APRBS signal (duty cycle) for identification of boost converter; (b) waveform of converter output voltage obtained by applying the APRBS signal; and (c) waveform of inductor current obtained by applying the APRBS signal.
Electronics 08 00493 g003
Figure 4. Schematic diagram of the LLC.
Electronics 08 00493 g004
Figure 5. Identification results for the test dataset.
Electronics 08 00493 g005
Figure 6. (a) Boost converter step response for 24 V reference output voltage; (b) response to variations in source voltage; (c) response to load variations; and (d) ability of the proposed LLC to reference voltage tracking.
Electronics 08 00493 g006
Figure 7. Test DC microgrid structure.
Electronics 08 00493 g007
Figure 8. Profile of actual and estimated output voltage for bidirectional converter.
Electronics 08 00493 g008
Figure 9. (a) Step response of the proposed LLC for the bidirectional converter; (b) response to load resistance variations; (c) load current during load resistance variation; and (d) battery current during load resistance variations.
Electronics 08 00493 g009
Figure 10. (a) Response to variations in irradiance; and (b) profile of battery current during irradiance variations.
Electronics 08 00493 g010
Table 1. Clean and noisy measurement data comparison of the LMN performance.
Case StudyRMSE (Volt)MAPE (Percent)
Clean data0.55041.0553
Noise contaminated 0.58061.0905
Table 2. Numerical evaluations of the step response achieved by the proposed method.
ControllerCriterion
Rise TimeSettling TimeOvershoot
PI340 μs850 μs12%
LLC110 μs350 μs6.2%
Table 3. LLC robustness against variations in parameters of the boost converter.
Parameters VariationITAE
−10%3.12 × 10⁻⁷
−5%3.31 × 10⁻⁷
Base case3.51 × 10−7
5%5.17 × 10⁻⁷
10%7.66 × 10⁻⁷
Table 4. Microgrid Specifications.
DeviceSpecification
PV panel converter with MPPT20 kW
Bidirectional converter20 kW
Battery500 Ah
Load15 kW
Table 5. Comparison of the Step Response for the Bidirectional Converter.
ControllerCriterion
Rise Time (ms)Settling Time (ms)Overshoot (%)
PI14.1535.666.12
LLC7.0111.102.62

