Review

Energy Harvesting Technologies and Equivalent Electronic Structural Models—Review

1
Electronics and Communications Unit and Intelligent Information System Unit, IK4-Tekniker, Calle Iñaki Goenaga 5, 20600 Eibar, Spain
2
Department of Electronics Technology, University of the Basque Country (UPV/EHU), 48080 Bilbao, Spain
*
Author to whom correspondence should be addressed.
Electronics 2019, 8(5), 486; https://doi.org/10.3390/electronics8050486
Submission received: 27 March 2019 / Revised: 23 April 2019 / Accepted: 25 April 2019 / Published: 30 April 2019

Abstract

:
As worldwide awareness about global climate change spreads, green electronics are becoming increasingly popular as an alternative to diminish pollution. Thus, nowadays energy efficiency is a paramount characteristic in electronics systems to obtain such a goal. Harvesting wasted energy from human activities and world physical phenomena is an alternative to deal with the aforementioned problem. Energy harvesters constitute a feasible solution to harvesting part of the energy being spared. The present research work provides the tools for characterizing, designing and implementing such devices in electronic systems through their equivalent structural models.

1. Introduction

Electronic devices without wires or systems with wireless capabilities are increasingly popular for they do not require connection to the mains power grid. Consequently, many devices in the industrial and domestic environments are solely powered by batteries, and the connection wires are mainly for battery recharging purposes. Battery manufacturers have significantly improved battery life [1], however they require periodical maintenance; and thousands of working hours must be added to the expense of batteries. Moreover, exhausted batteries produce waste that needs to be recycled [2]. Nowadays, there is increasing interest in green electronics, and in order to be “green” an electronic system must have a contained price, be energy efficient and follow the three R rule, i.e., reduce, reuse and recycle. The price of copper does not help because it has been increasing for several years [3]. Furthermore, all around the world, copper wire theft has become a widespread problem [4]. Therefore, the growing demand for electronics without wires, that are green and energy efficient faces several technical and ecological challenges, like power efficiency, battery charge times, the autonomy of the system, and the lifespan of the batteries themselves, which is a function of the load patterns, and the charge and discharge cycles. In this context, energy harvesters have become an efficient and green alternative for gathering energy from the environment and offer an answer to some of the aforementioned challenges [5,6].
Harvesters are electronic devices that inherit the same principles and architecture as those of electronic transducers. Thus, they are essentially transducers devised to extract, not only a sample of energy from physical phenomena, but the maximum feasible amount of energy [7]. Energy harvesting systems can gather energy from sources available on industrial or other environments such as mechanical vibration, temperature gradients, natural or artificial light, elevated levels of noise, pipes with air or water fluid. Then, this energy is managed and stored to be used to feed an electronic device.
It must be considered that the main aim of energy harvesting is not to produce power at large scale but to save the harvested energy in a storage device and use it later in the daily operation of an electronic system. Therefore, the usual operation mode of an energy harvesting system implies harvesting during the peak time slots of energy availability, while the storage devices must meet the demand and supply in specified periods.
In summary, the main objectives of energy harvesting technology include:
  • Remove mains supply wires
  • Eliminate or reduce dependence on batteries
  • Increase the lifetime
  • Maintain or/and increase the functionality
  • Ease of installation
  • Low cost
  • Reduce waste
A generic energy harvesting system has three main elements [8]: a harvester, a low power management, and a low power storage system. The operation process starts gathering energy from the environment via the harvester device. Then, a power management system converts the voltage level of the harvested energy to those of standard electronic, as efficiently as possible, and powers the electronic system. Eventually, the storage system stores the excess of harvested energy.
The present research work classifies and analyses the different energy harvesters’ technologies available, their physical and/or chemical operation mode, the maturity of the state of the art, their efficiency, and the equivalent electric circuit. At the same time, this work provides some application examples.

Energy Harvester’s Technologies

There are several energy harvesting technologies [9,10,11,12,13,14,15,16,17,18,19,20]. Table 1 and Figure 1 [21,22,23,24,25,26,27,28,29,30,31] summarize the state of the art of harvesting technologies, classifying them by their characteristic parameters, operation mode, power density, system efficiency, technology development status and generated signal type. In the following sections these energy harvesting technologies are described further.

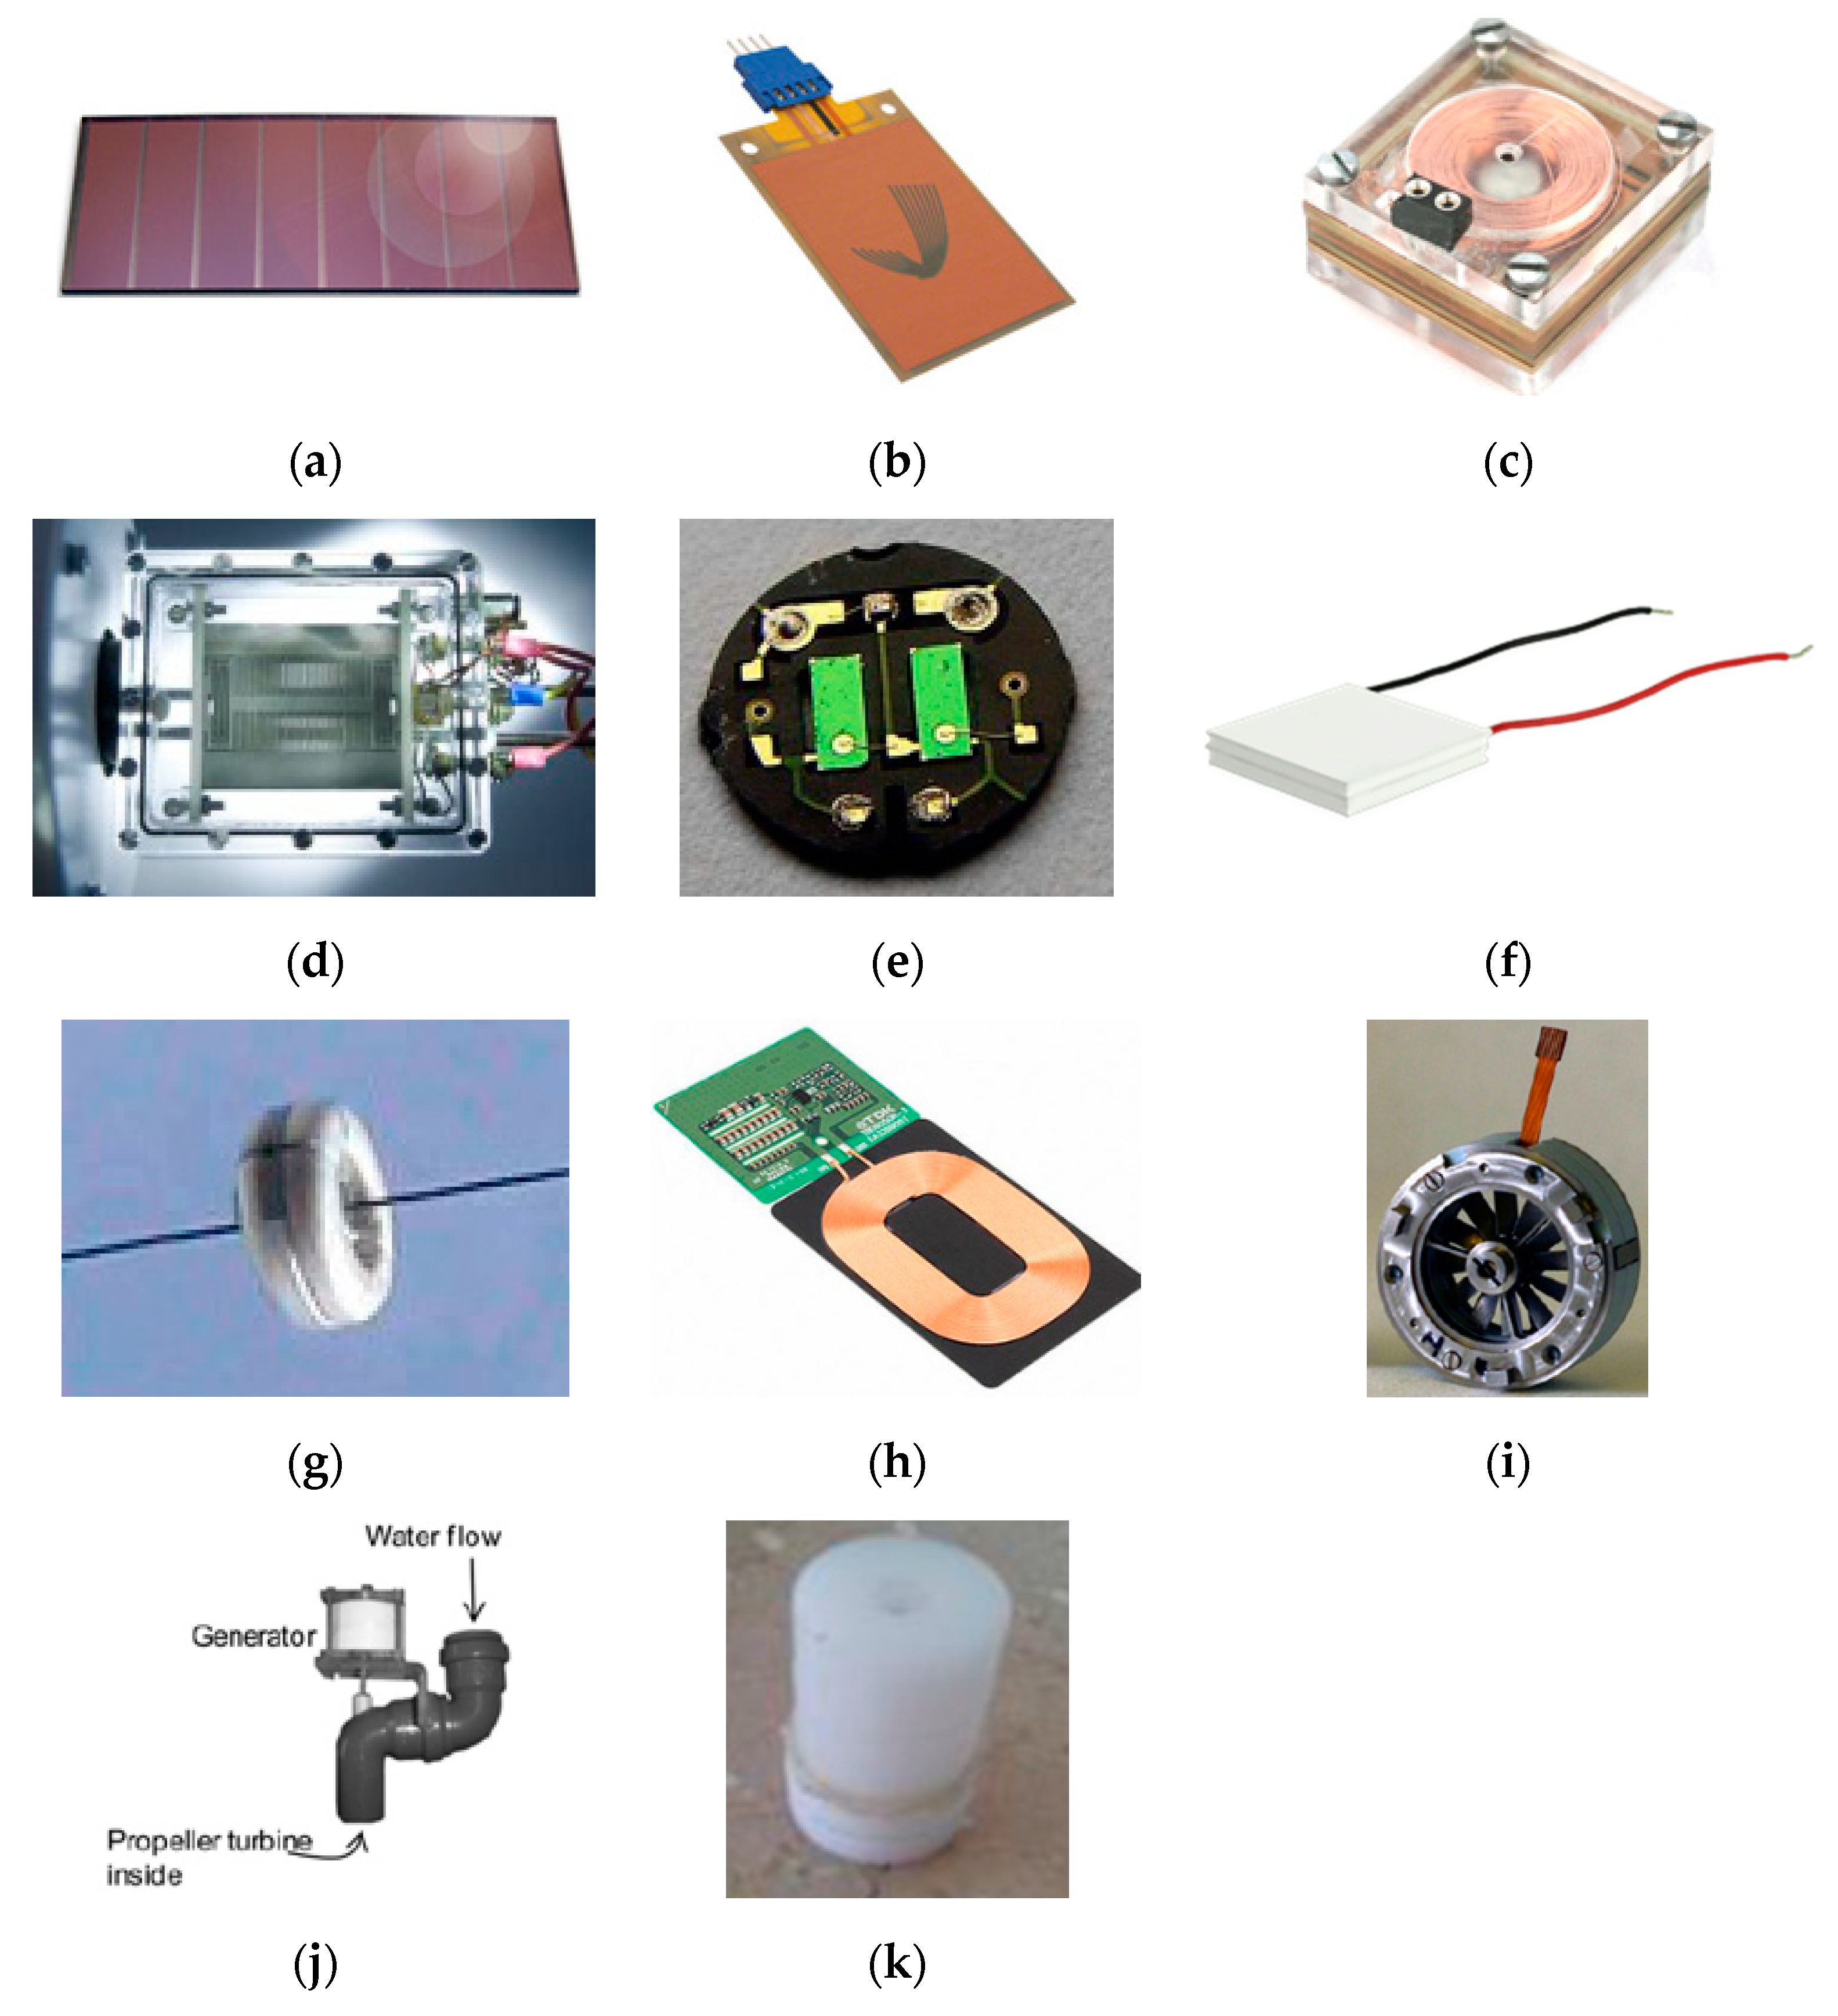
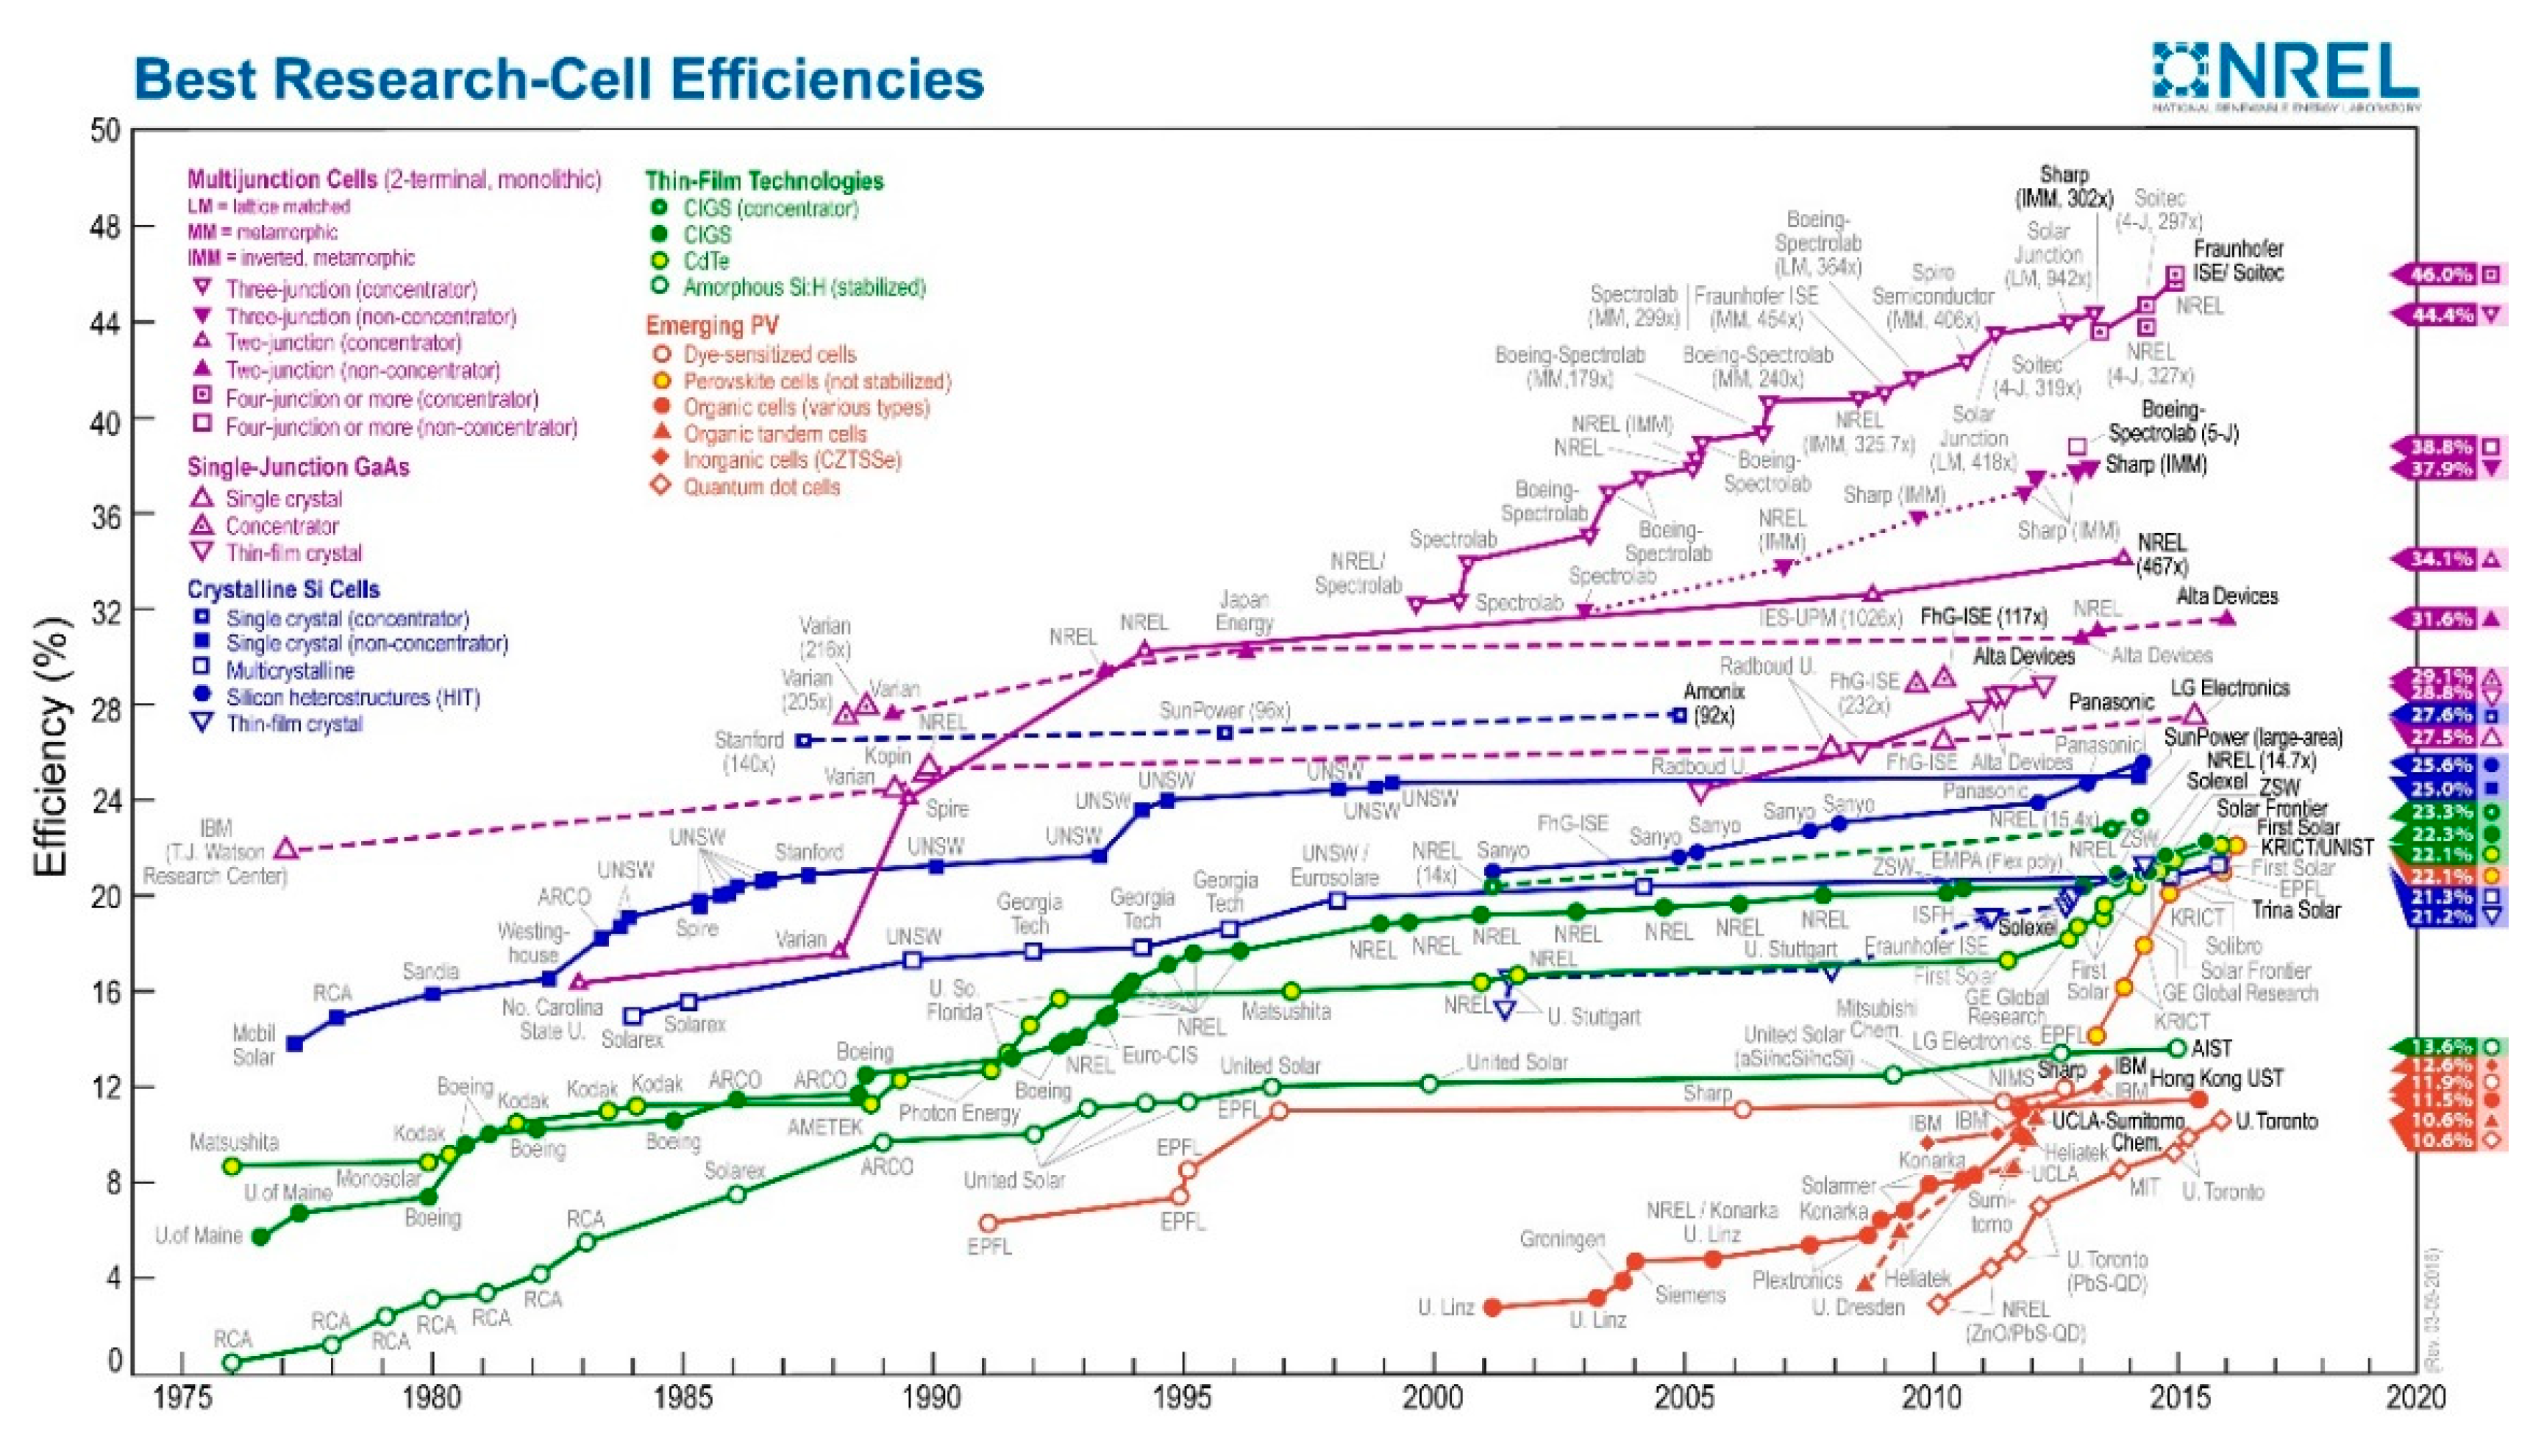
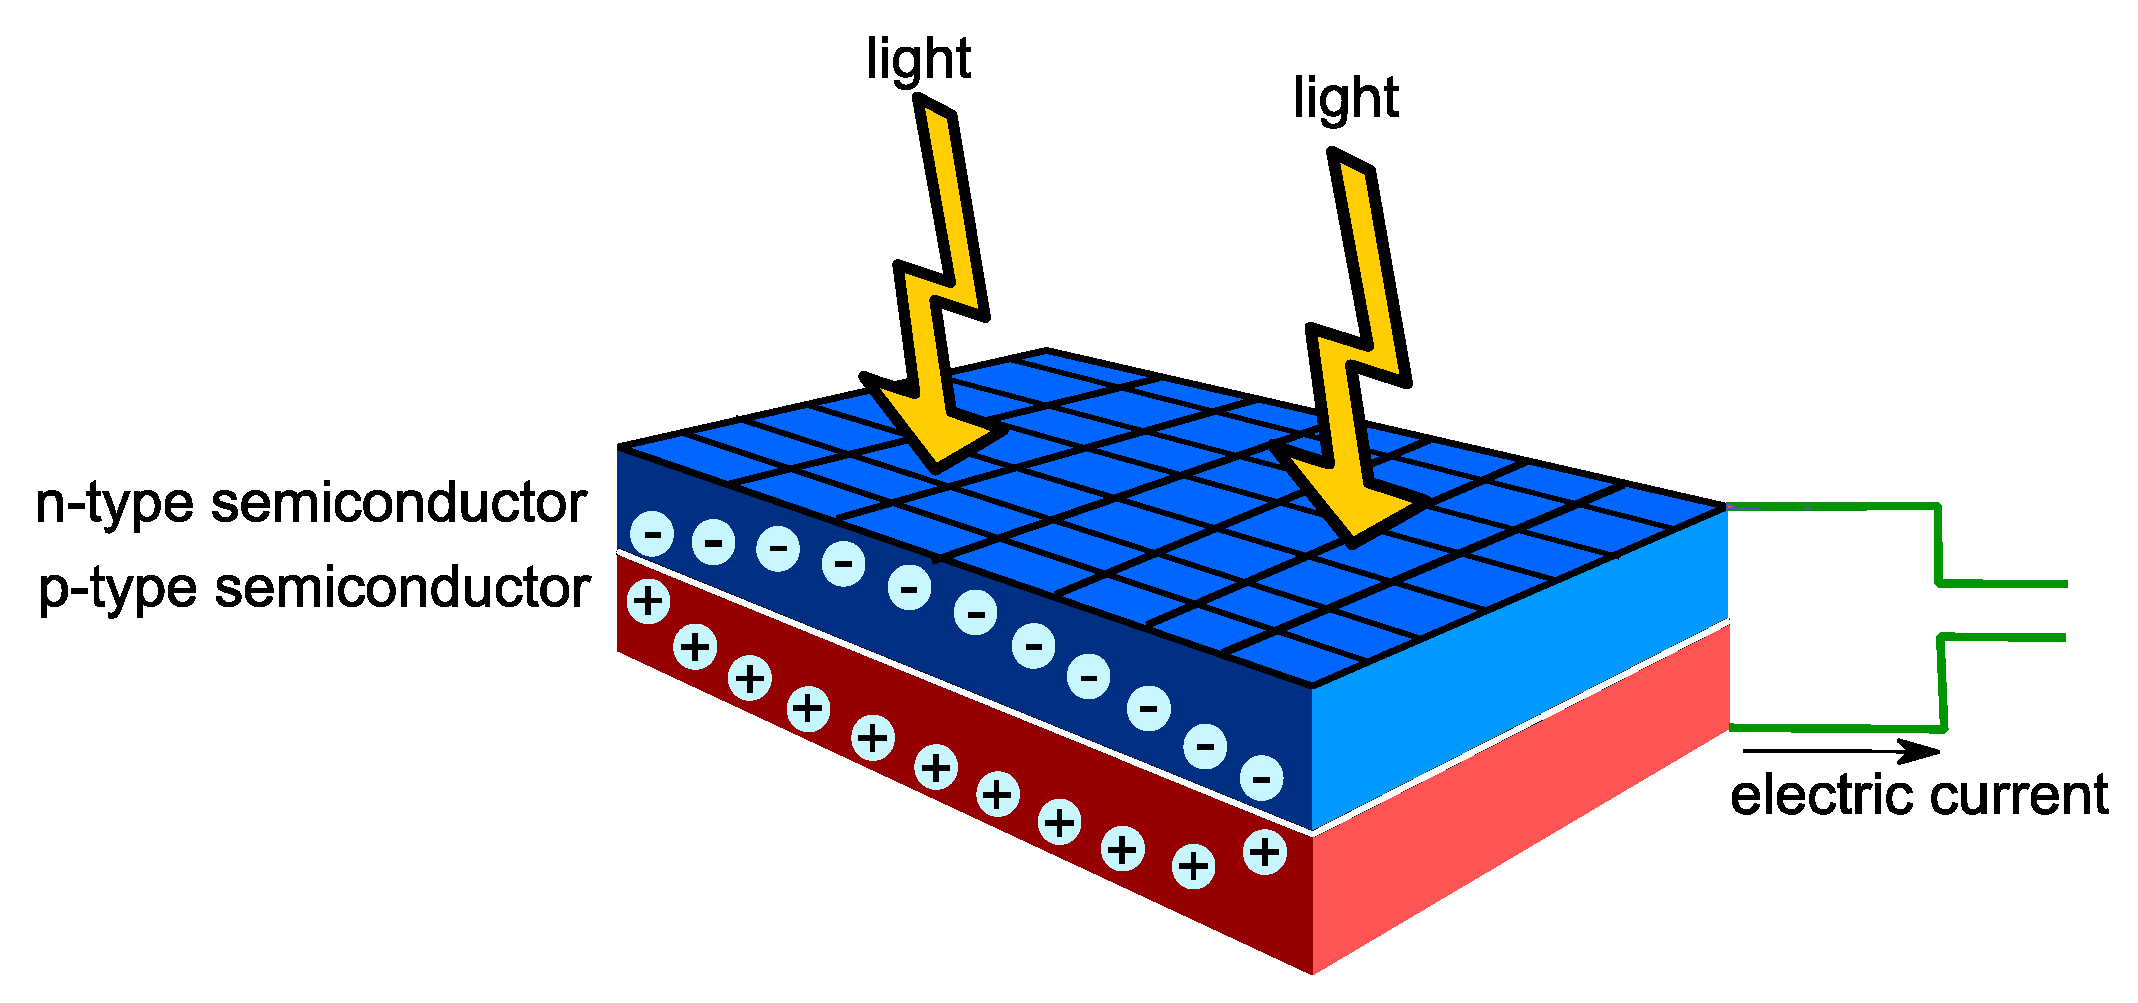
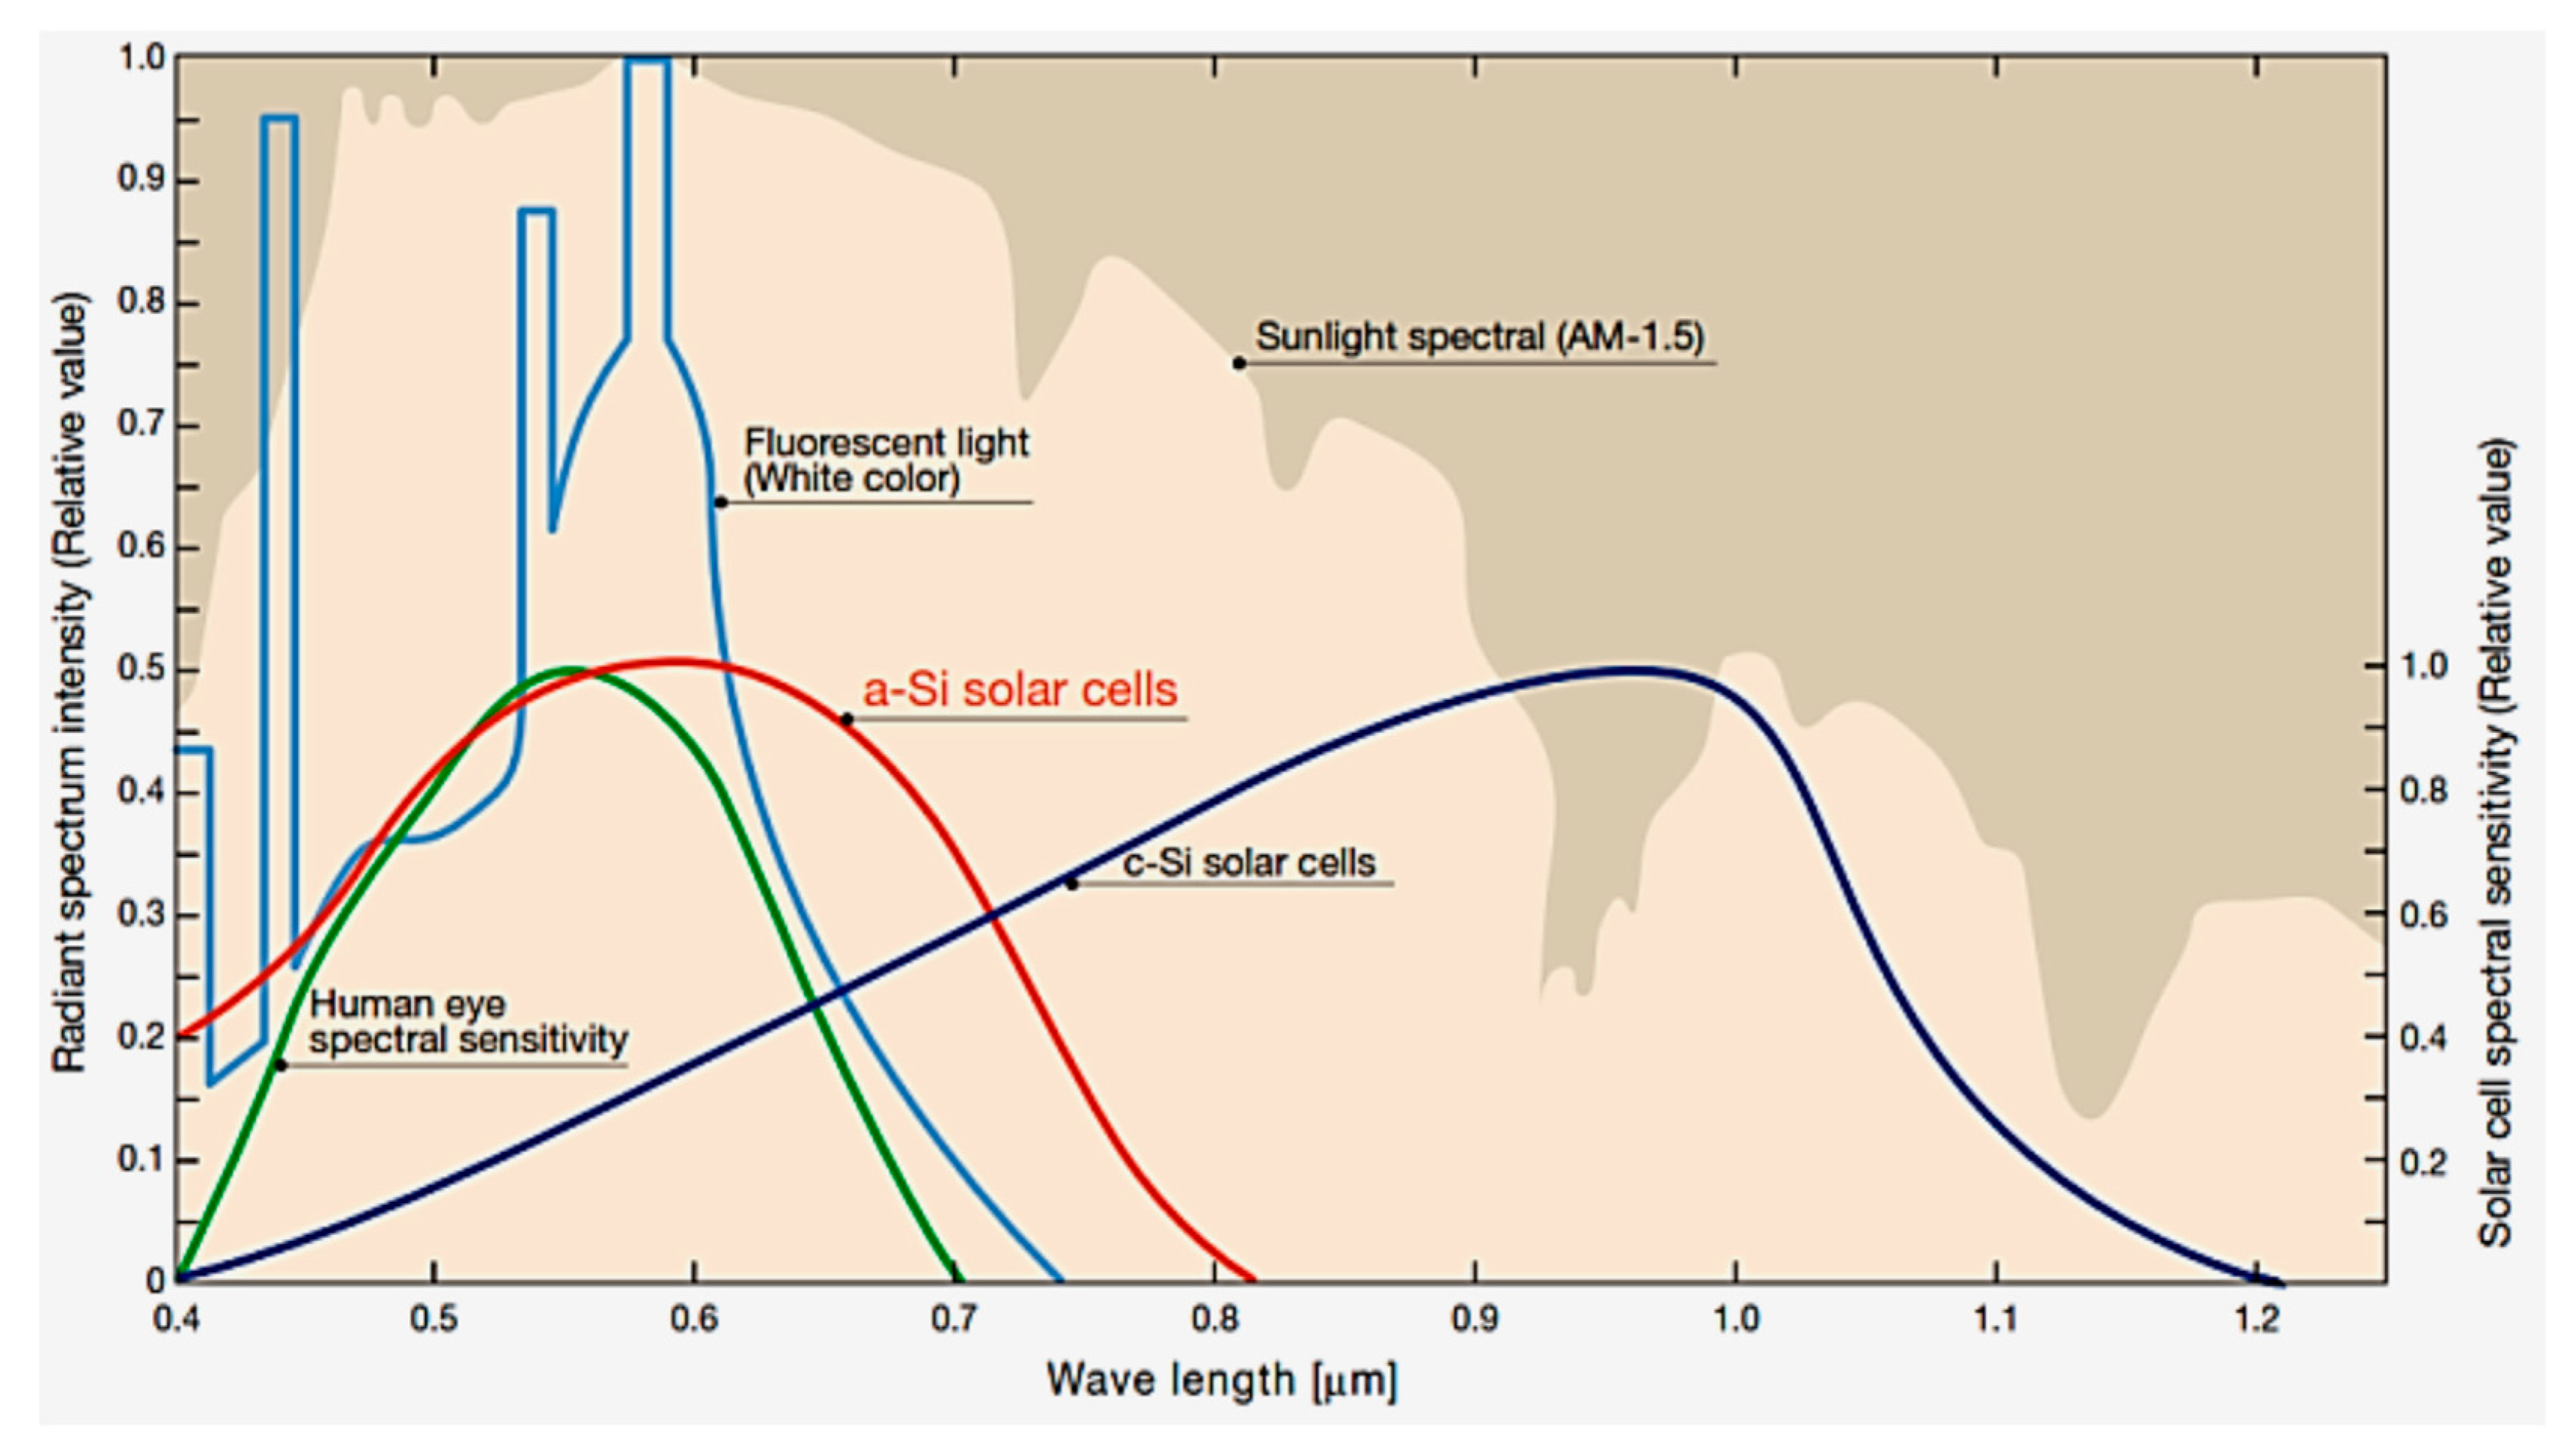
2. Photovoltaic Harvester’s Technology and Devices

Photovoltaic harvesters [12,35,36,37,38,39,40,41,42] generate electrical power, converting sunlight or artificial light into electricity using the photovoltaic principle. The solar panel is a modular device, which is composed of n cell in parallel and in series. Thus, harvested energy is proportional to the surface area of the module and can be scaled to the desired size of power generation. The amount of energy that they gather depends on weather conditions and light/dark periods. Besides, efficiency limits photovoltaic harvesters’ electric energy generation. The materials that compose the cell determine their efficiency. Current photovoltaic cells are classified into four categories based on their composition: multi-junction, crystalline silicon, thin-films and emerging. A comparison between different solar cell technologies is shown in Table 2 [17,43] and Figure 2 [44].
A solar cell is an unbiased diode that whenever exposed to light creates free electron-hole pairs, which is shown in Figure 3.
The minority carriers diffuse to the depletion region where they experience the built-in filed which sweeps them to the opposite side of the junction. In an open circuit, the separation of carriers builds up the open-circuit voltage (Voc) across the junction. If a resistance free path short-circuits the n and p regions, there is a current flow, ISC, that balances the flow of minority carriers across the junction. Thus, harvesting the generated power requires a load connected to the cell.
When a voltage is applied to the electrical contacts of the p-n junction, the cell exhibits a rectifying behavior. The current through the cell is determined by the diode ideal Equation (1).
I = I p h I d , I d = I 0 ( e q V / K T 1 )
where K is the Boltzmann constant, T is the absolute temperature, q is the electron charge and V is the voltage at the terminals of the cell. I0 is the current generated by the cell in dark light condition, and the photogenerated current Iph is the photon flux incident on the cell. The parameter Iph depends on the light wavelength, and quantum efficiency or spectral response. In the ideal conditions, the short-circuit current must be equal to Iph. Thus, Equation (2) gives the open circuit voltage of the cell, Voc.
V o c = K T q ln ( 1 + I p h I 0 )
The photovoltaic cell energy conversion efficiency is defined as the ratio of the maximum electrical power obtained Pp from the incident light power Pi. It is given by Equation (3) and it is dependent on the short-circuit current Isc, on the open circuit voltage Voc and on the fill factor ff, which is a measure of the quality of a solar cell. The ff is obtained by dividing the maximum power point with the Voc and the Isc.
η = P p P i = V p I p P i = f f I s c V o c P i
The equivalent circuit of an ideal solar cell is made of a current source connected in parallel with a rectifying diode, series (Rs) and parallel (or shunt, Rp) resistances, see Figure 4. The current source produces IL, which is the current that the cell generates when it is illuminated. The series resistance characterizes the internal resistance of the cell material and the parallel resistance represents the equivalent resistance between cells connections inside a photovoltaic module.
Photovoltaic cells designed for energy harvesting activities are suitable for both outdoor and indoor environments. Indoors light intensity is often much lower than outdoors. The sun generates power intensity far higher than that produced by artificial light sources such as an incandescent light bulb, fluorescent tube, or halogen lamp. Thus, it must be born in mind solar cell spectral properties to achieve the maximum feasible power, since spectral characteristics determine the operation range of each light type. Consequently, a photovoltaic cell would be more efficient on a given wavelength range, depending on the material which it is made of. Figure 5 shows the spectral operation range of different type of lights [45].

3. Kinetic Harvester’s Technology and Devices

Kinetic devices [35,46] convert mechanical energy into electrical energy through electromechanical transducers. The most common transduction mechanisms are piezoelectric and electromagnetic conversion.
Kinetic energy harvesters have a resonance frequency that usually ranges from tens to hundreds of Hertz. In these conditions, they provide energy that ranges from tens to hundreds of microwatts.
Overall, the moving elements limit the energy obtained mechanically. Kinetic harvesters are also sensitive to driving frequencies, i.e., they provide peak power in a narrow frequency bandwidth of mechanical oscillations around their resonant frequency. Regardless, it is feasible to tune this type of harvester [24]; thus far, this requires an operator to set-up the frequency of the device manually. Table 3 compares available vibration harvesters and the following subsections describe the most common mechanical transducers: piezoelectric, electromagnetic, electrostatic and pyroelectric.

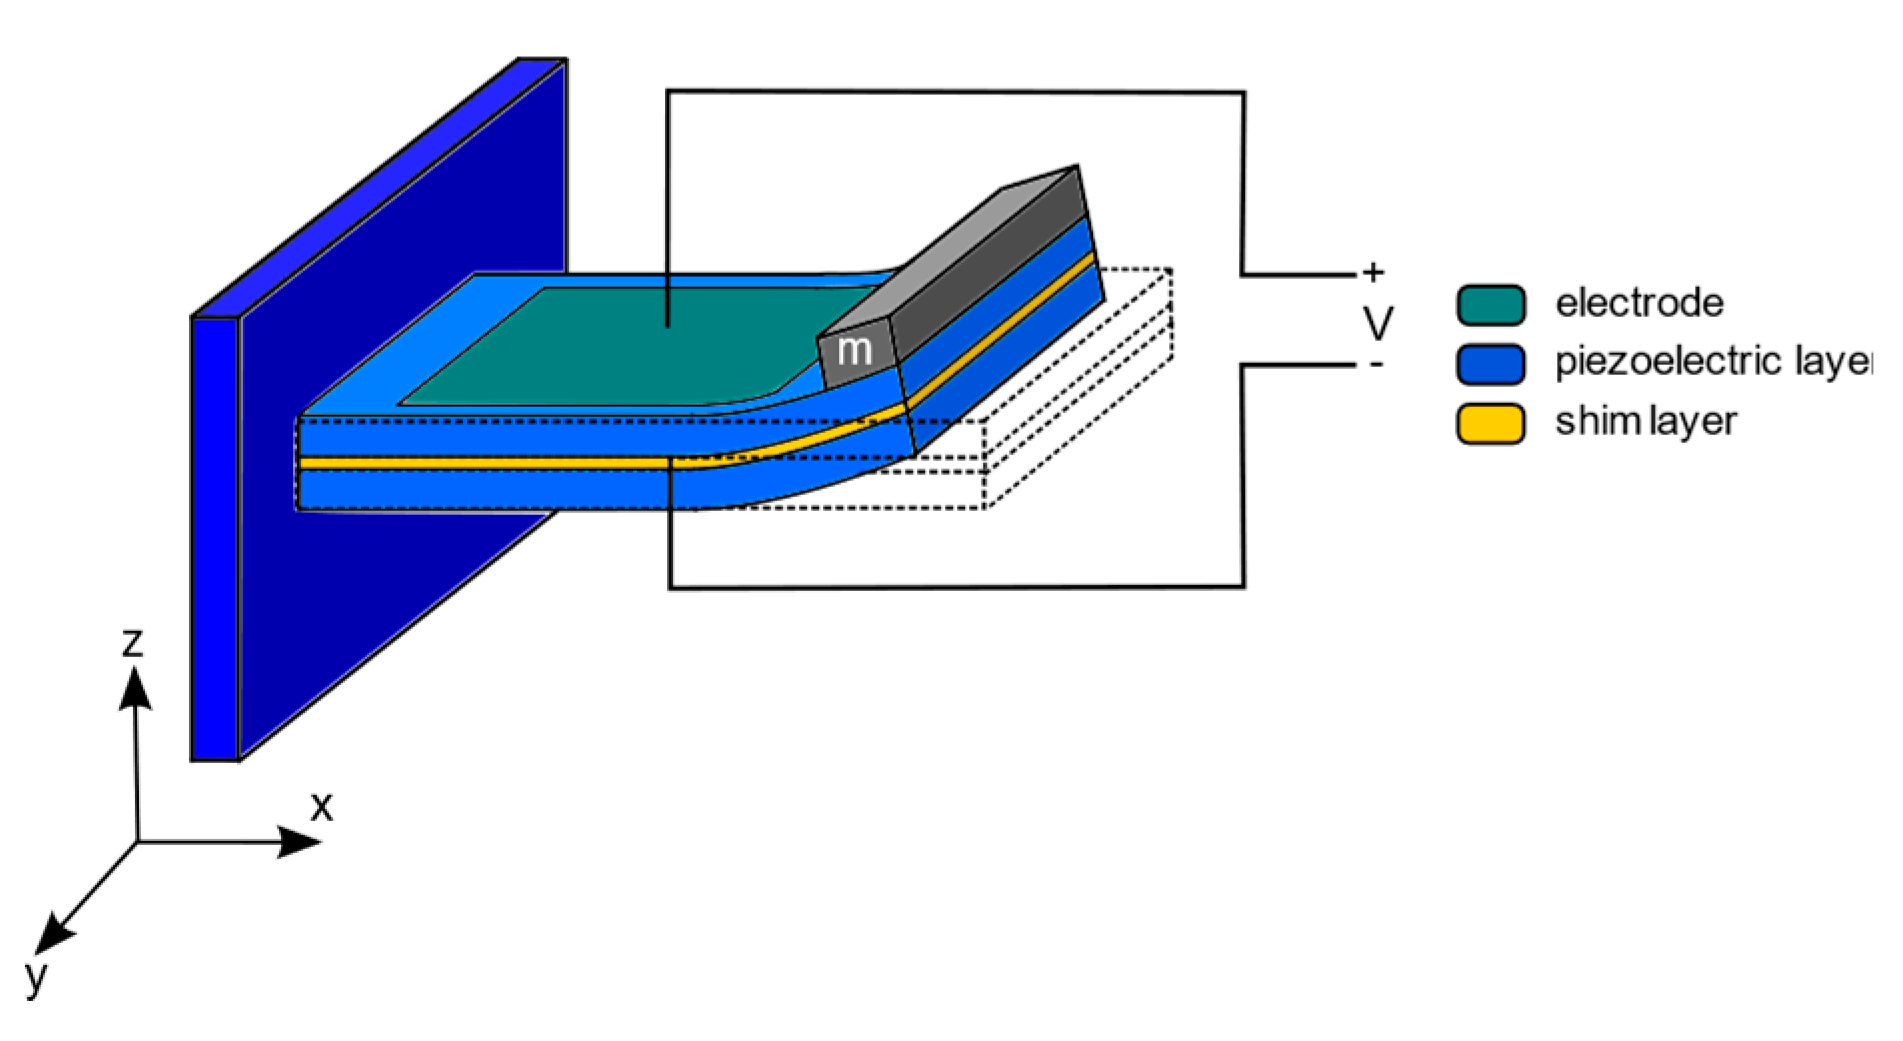
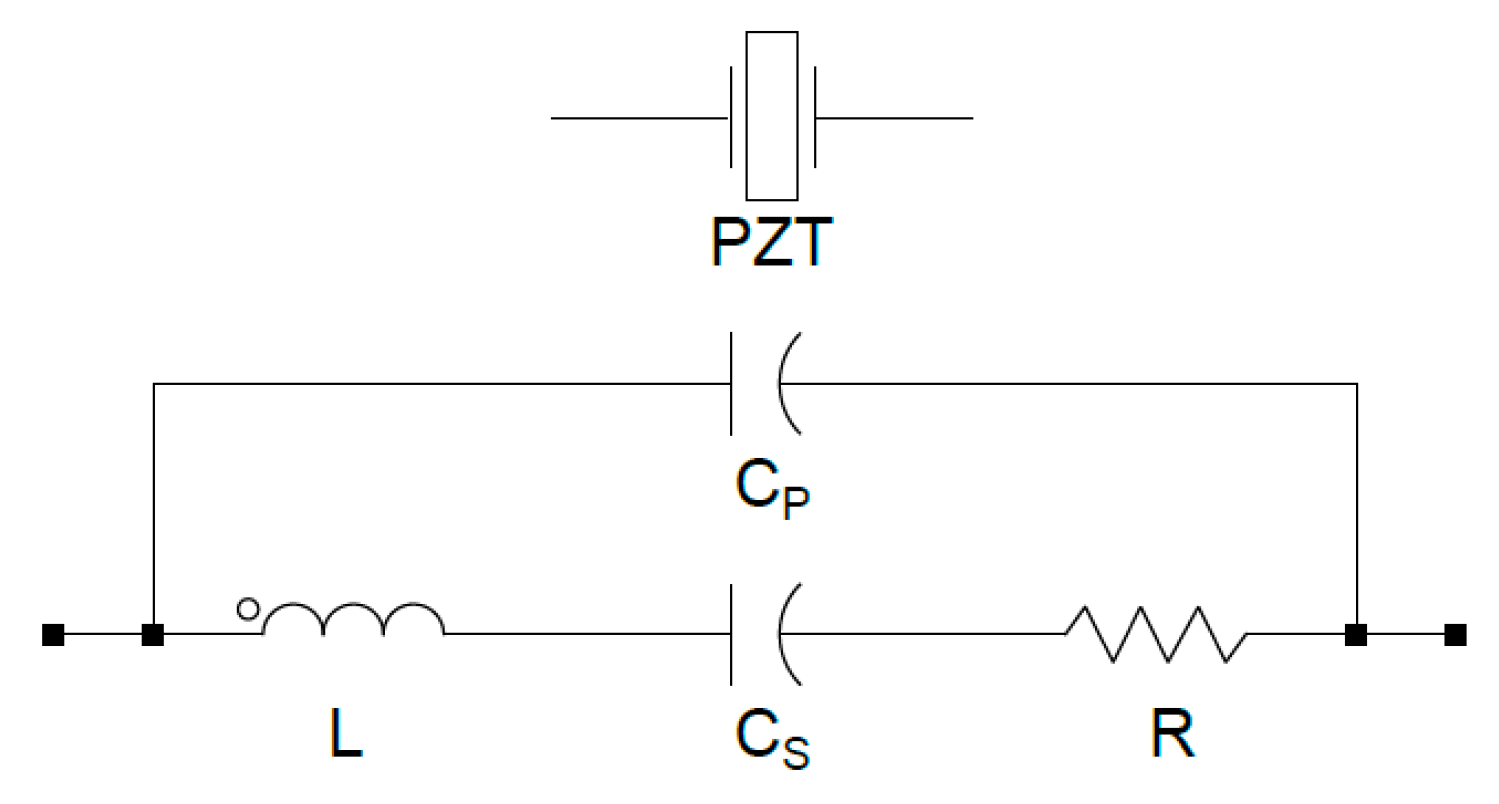
3.1. Piezoelectric Transduction

Piezoelectric harvesters [9,12,19,35,47,48,49,50,51,52,53] generate energy by bending mechanical elements, i.e., beams or membranes. The resultant mechanical vibrations oscillate at resonance frequencies which can range from tens to hundreds of Hertz.
There are several factors that cause vibrations on a rigid body in a dynamic system, such as system mass unbalance, and tear and wear of the materials. Each system has a unique behavior that can be described through the damping constant and natural frequency. The study of the dynamic characteristics of a vibrating body associated with energy harvesting is usually done with a single degree of freedom lumped spring-mass system. Thus, the general principles of a resonant inertial vibration harvester can be described through the lumped model. The energy balance equation of D’Alembert’s principle determines motion equation of the system, which is given by differential Equation (4).
m d 2 z d t 2 + D v d z d t + k z + F = m d 2 Z d t 2
where m is the seismic mass, Dv the viscous damping coefficient, k a spring of stiffness, F the applied force and z(t) the equilibrium position. Since relative movement between the mass and the inertial frame is the mechanism that provides the energy, the standard steady-state solution for the displacement of the mass is given by Equation (5).
z ( t ) = ω 2 ( k m ω 2 ) 2 + ( D v ω m ) 2 Y s i n ( ω t ϕ ) , ϕ = a r c t a n ( D v ω ( k ω 2 m ) )
where ω is the frequency and Y s i n ( ω t ϕ ) is the steady state solution for z(t) being Y (Y = A/ω2) the displacement of the amplitude and ϕ the phase-shift. The system provides its maximum energy when the excitation frequency is equal to the natural frequency of the system, ωn, given by Equation (6).
ω n = k m
The maximum power generated therefore occurs when the device is driven at its natural frequency, ωn and hence the output power is given by the Equation (7).
P m a x = m Y 2 ω n 3 4 ζ T
where ωn is the peak power and ζT the damping factor. Thus, it must be considered the effect of the applied frequency, the magnitude of the excitation vibrations and the maximum displacement mass. Whenever the input acceleration is high enough, there is an increase of damping that broadened the bandwidth of the system and, hence, will constitute a generator less sensitive to fluctuations of the excitation frequency. Frequency changes might be caused by temperature gradients over time or other environmental parameters. Also, if the amplitude of oscillations is too large, the device may present nonlinear behavior, therefore it will be difficult to keep the generator operating at resonance. In order to maximize the power output both the frequency of the generator and the level of damping should be designed to match the specific application requirements. The power obtained is proportional to the mass, which should be maximized while subject to the given size constraints. The study of the vibration spectra allows to identify the most suitable frequency of operation for the aforementioned design constraints, generator size and maximum displacement. Figure 6 shows an example of a piezoelectric harvester movement.
The piezoelectric material is electrically polarized when it is under mechanical force because it contains dipoles. The degree of polarization is function of the strain applied. Conversely, the dipoles rotate when an electric field is applied, thus deforming the material. Single crystal materials (quartz), ceramics (lead zirconide titanite, PZT), thin-film materials (sputtered zinc oxide), screen printable thick films based upon piezoceramic powders and polymer materials (polyvinylidene fluoride, PVDF) present an anisotropic piezoelectric behavior.
Piezoelectric materials are classified in two groups identified with subscript constants, as shown in Table 4 [35]. The number three refers to piezoelectric materials polarized along their thickness (i.e., electrodes attached on the top and the bottom surfaces). Thus, the subscript 33, i.e., d33 denotes that a mechanical strain applies in the direction of polarization and the subscript 31, i.e., d31 denotes a perpendicular strain.
Usually, piezoelectric material works in lateral mode 31, because the most common assembly is made of a spring bonded to its surface which transforms the vertical displacements into a lateral strain across the piezoelectric element. Unless there are applications that employ the compressive 33 mode, typically higher than the 31 equivalents. However, the compressive strains are typically much lower than the lateral strains provide by the piezoelectric bonded onto a spring or flexing structure.
Figure 7 shows the equivalent circuit of a quartz crystal resonator; the values of the components depend on the quartz characteristics. This circuit is applicable when the oscillation in the thickness shear mode is close to the fundamental resonance frequency.
Where R represents oscillation damping of the enclosure material, CS represents the capacitor created by electrodes, the crystal disc and the dielectric in between, CP is the elasticity of the crystal (oscillation energy stored in the crystal) and L is the inertial component of the oscillation.

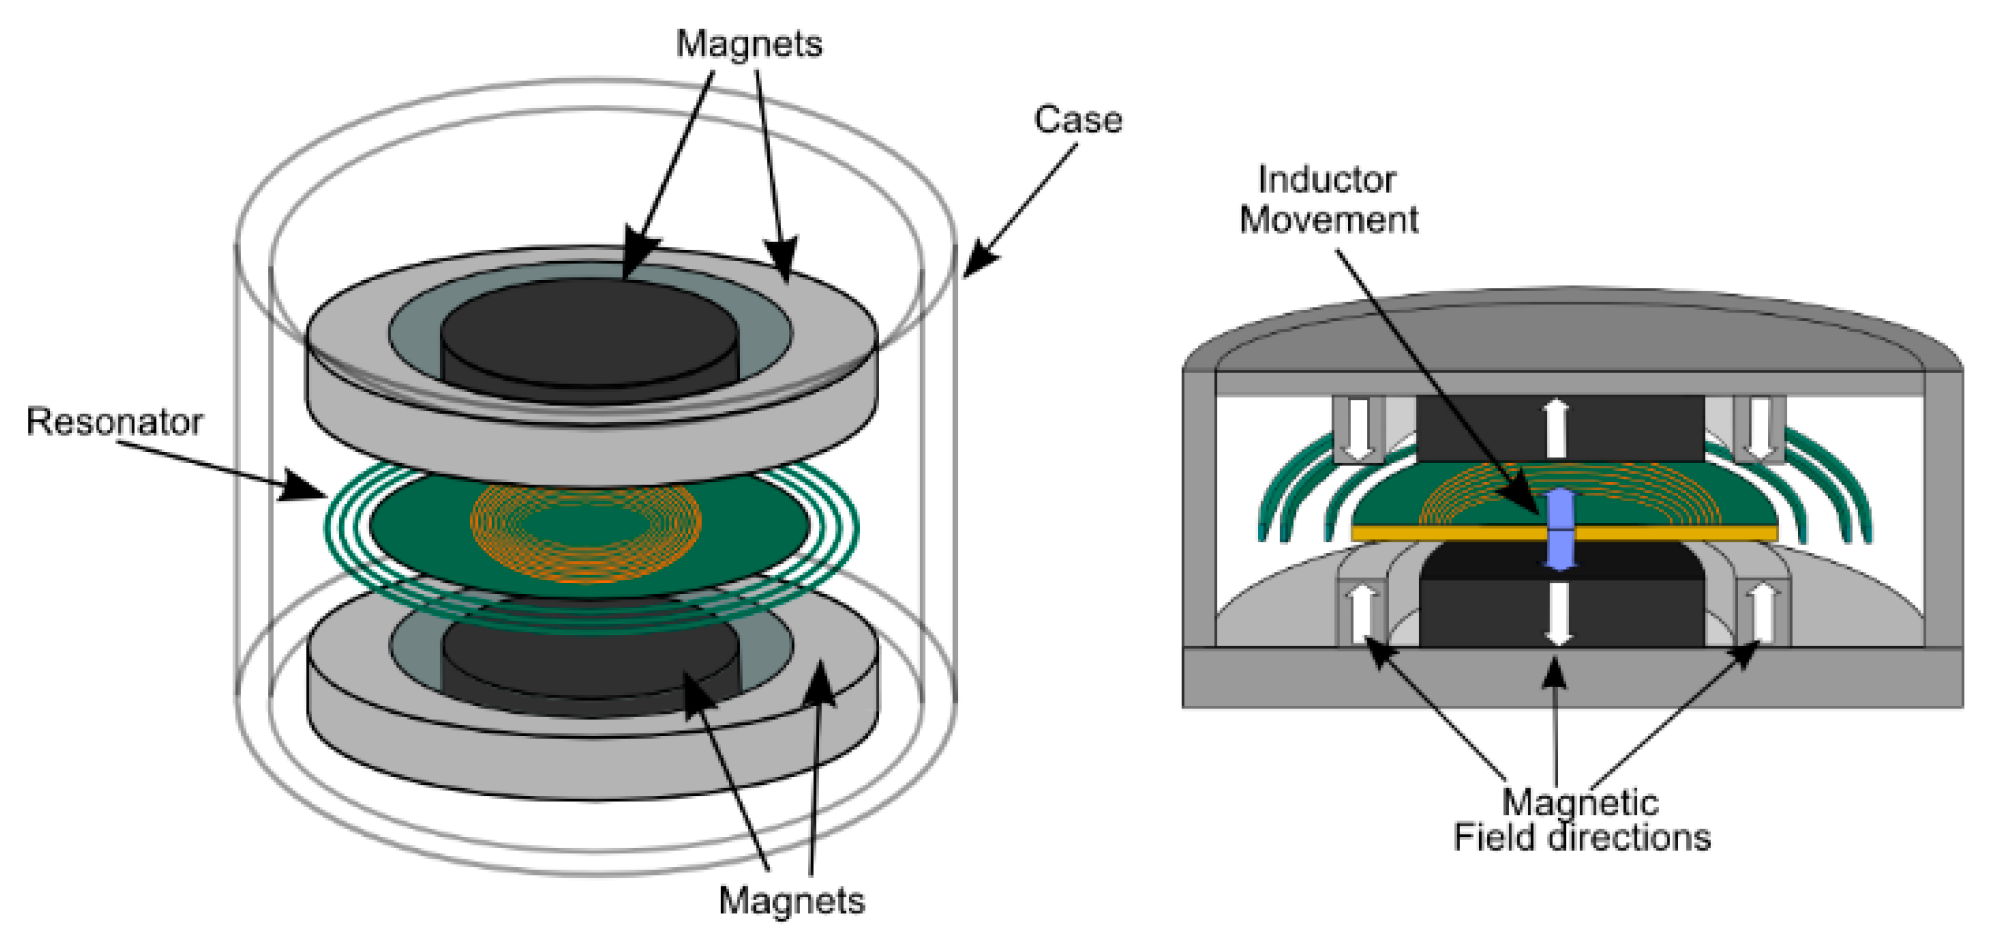
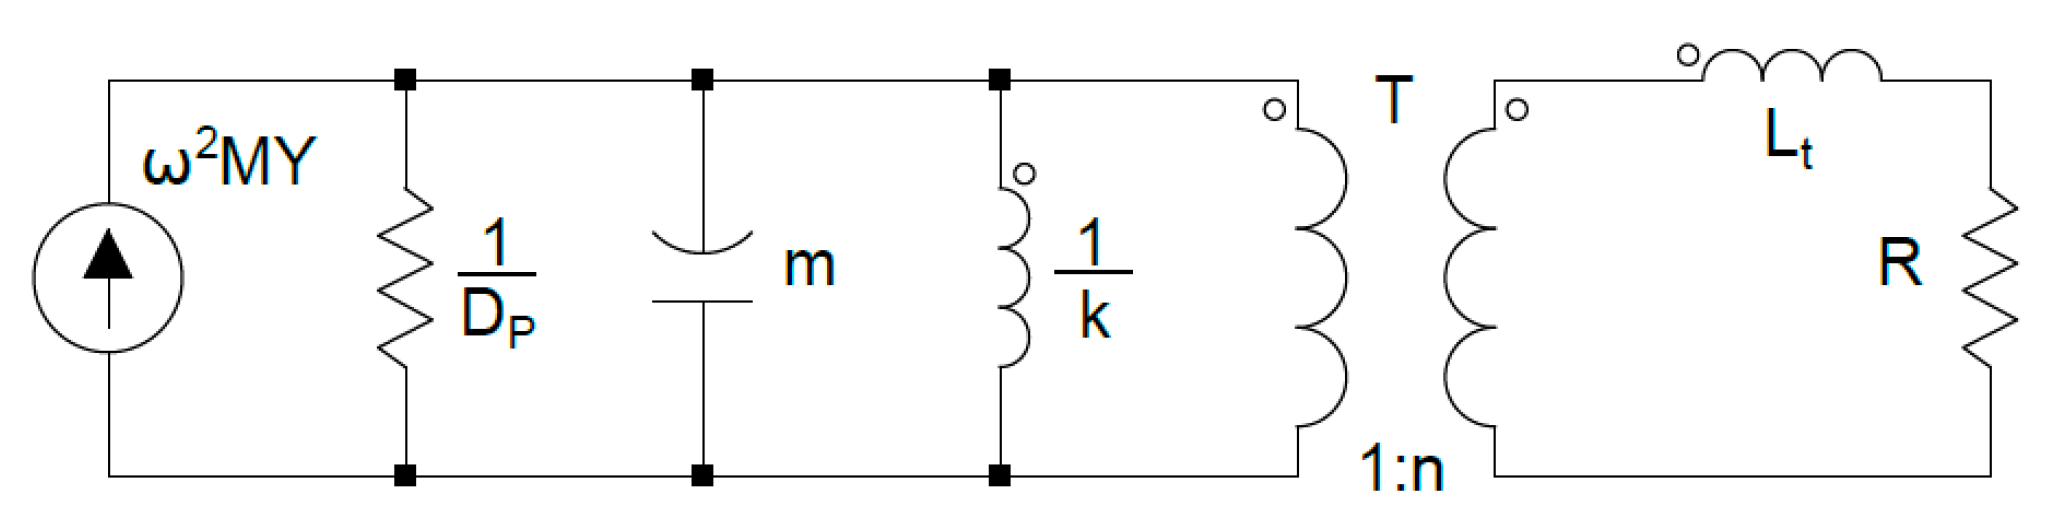
3.2. Electromagnetic Transduction

Electromagnetic harvesters [9,12,35,54,55,56,57,58,59] produce energy by means of electromotive force that a varying magnetic flux induces through a conductive coil according to Faraday’s law, Figure 8. The magnetic flux (B) source is obtained with a permanent magnet. The motion of a seismic mass attached to either a coil or magnet produces the variation of magnetic flux necessary to induce a current in the coil.
When an electric conductor moves through a magnetic field, an electromotive force (Emf) is induced between the ends of the conductor. The voltage induced in the conductor (V) is proportional to the frequency of the magnetic flux linkage ( ) of the circuit, as shown in Equation (8). The generator is a multiturn coil (N), and permanent magnets create the magnetic field.
V = N d d t
There are two possible cases:
  • Linear vibration
  • Time-varying magnetic field, B.
In the linear vibration case, there is a relative motion between the coil and the magnet in the x-direction, the voltage induced in the coil can be expressed as the product of a flux linkage gradient and the speed of movement, Equation (9). In the time-varying magnetic field (B) case, the flux density is uniform over the area, A, of the coil, then the induced voltage depends on the angle (α) between the coil area and the direction of the flux density, Equation (10).
V = N d d x d x d t
V = N A d B d t s i n α
Power is extracted from the generator by connecting the coil to a load resistance, RL. The induced current in the coil generates a magnetic field, which is opposed to the original magnetic field generated by the permanent magnets, according to the Faraday-Lenz law of electromagnetic induction. This electromagnetic induction results in an electromotive force, Fem that opposes the generator motion, which transfers mechanical energy into electrical energy. Thus, Fem is proportional to the current and the speed and it is defined in the Equation (11).
F e m = D e m d x d t , D e m = 1 R L + R c + j ω L c ( d Φ d x ) 2
where Dem is the electromagnetic damping, RL is the load, Rc the coil resistance and Lc the coil inductance, and dΦ/dx is the magnetic flux. Therefore, so as to obtain the maximum electrical power output, the generator design must maximize Dem and speed. Increasing Dem implies maximizing the flux linkage gradient and minimizing the coil impedance. The flux linkage gradient is a function of the strength of the magnets, their relative position with the coil and the direction of movement, and the area and number of turns for the coil.
The type of magnetic material determines the magnetic field strength. Usually, permanent magnets are made of ferromagnetic materials. The magnetizing force they provide is H, and the maximum energy product, BHMAX, is its figure of merit, which can be determined by the material’s magnetic hysteresis loop. Properties of some common magnetic materials are summarized in Table 5 [9,35] among them the Curie temperature, i.e., the maximum operating temperature that the material can resist before becoming demagnetized. Table 6 [60] illustrates conductor material characteristics available for electromagnetic generators.
Figure 9 represents the equivalent circuit model for vibration driven harvester using electromagnetic damping. The components on the primary side model the mechanical parts, where the current source represents the energy flux; the capacitor the mass; the inductor the spring; and the resistance the parasitic damping. The electronic components on the secondary side model the self-inductance of the coil in the electromagnetic device.

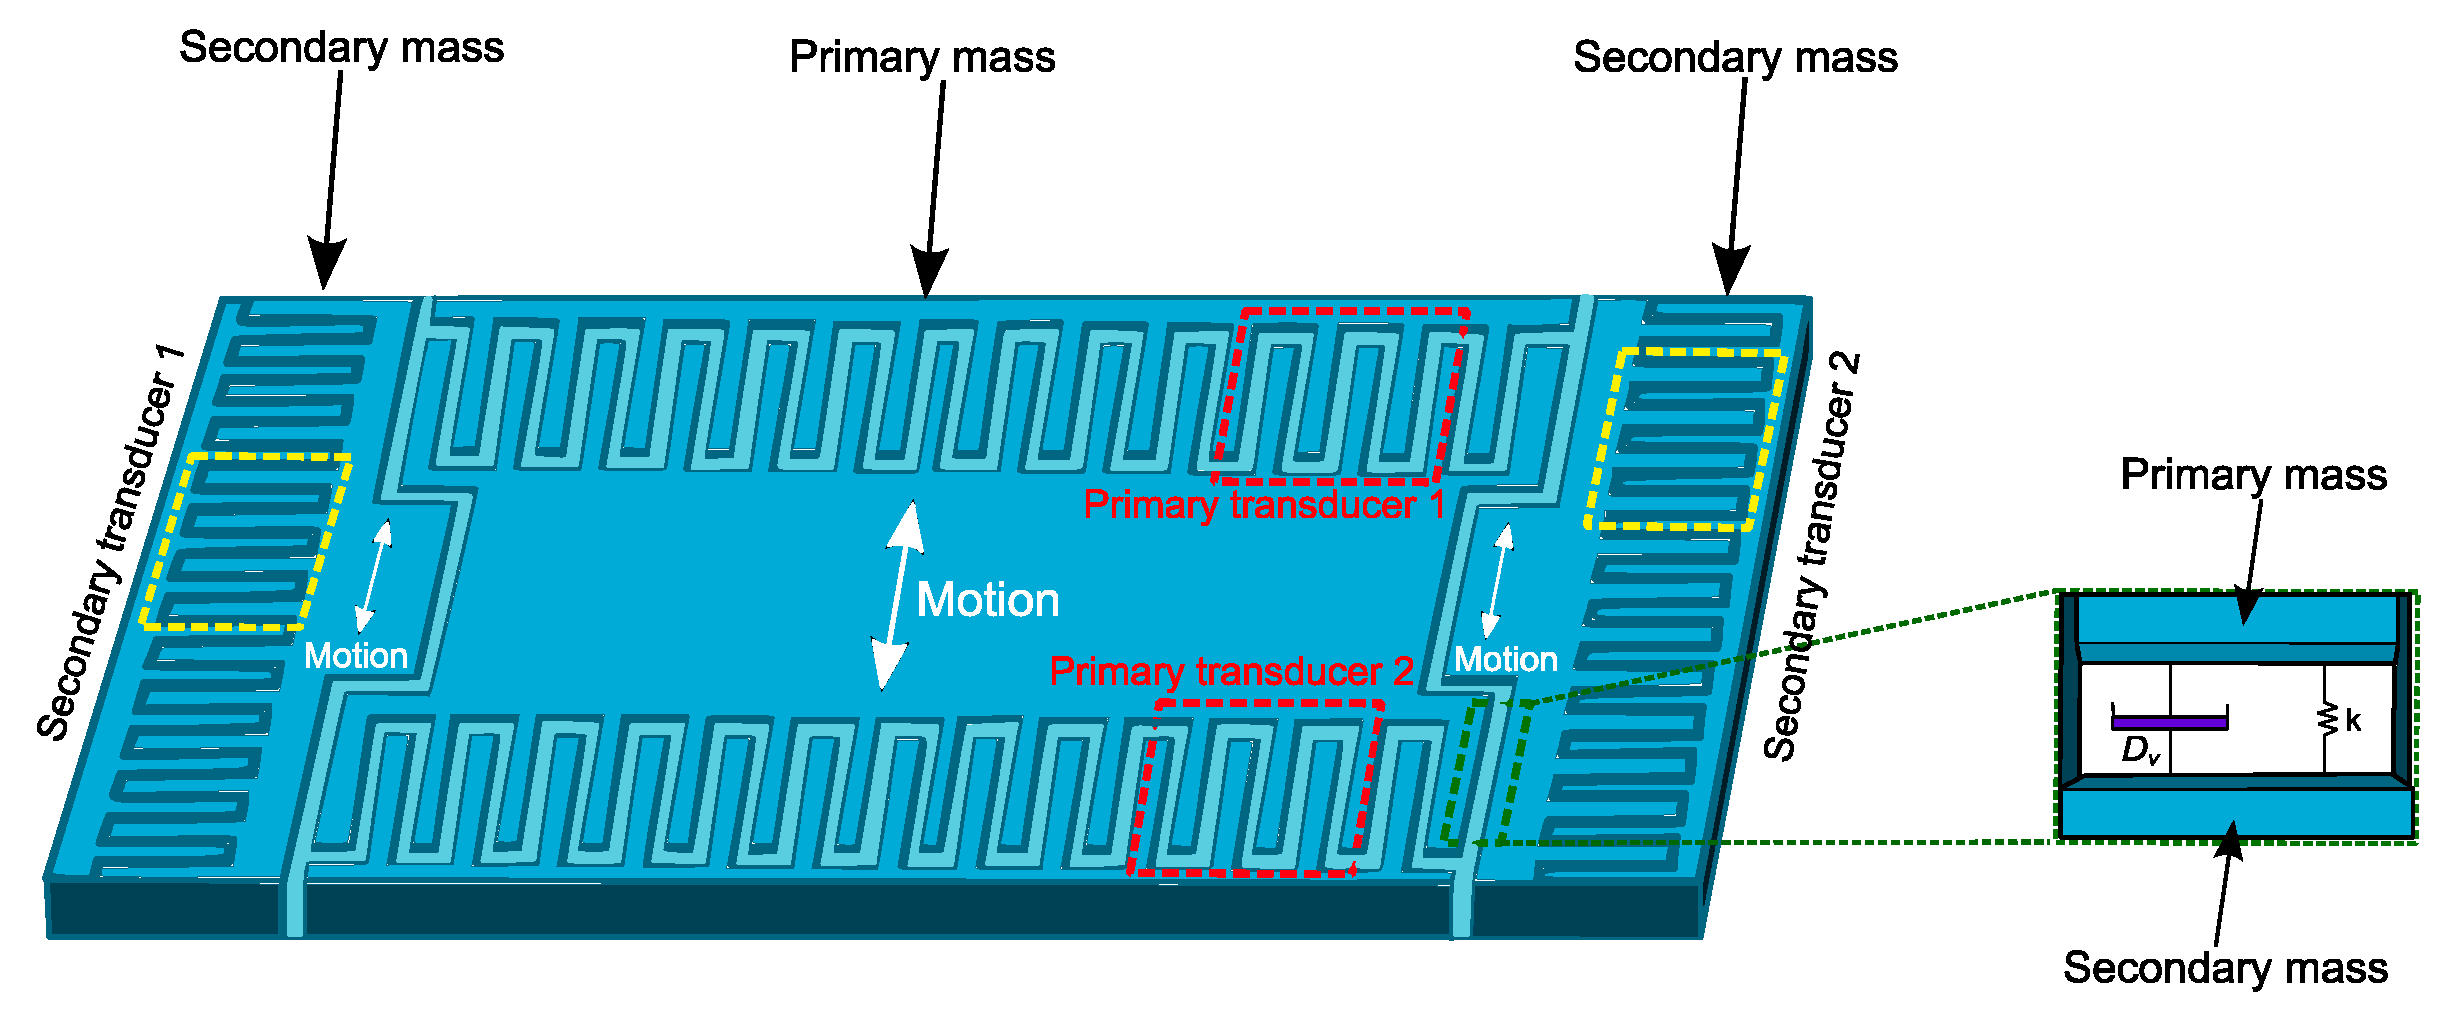
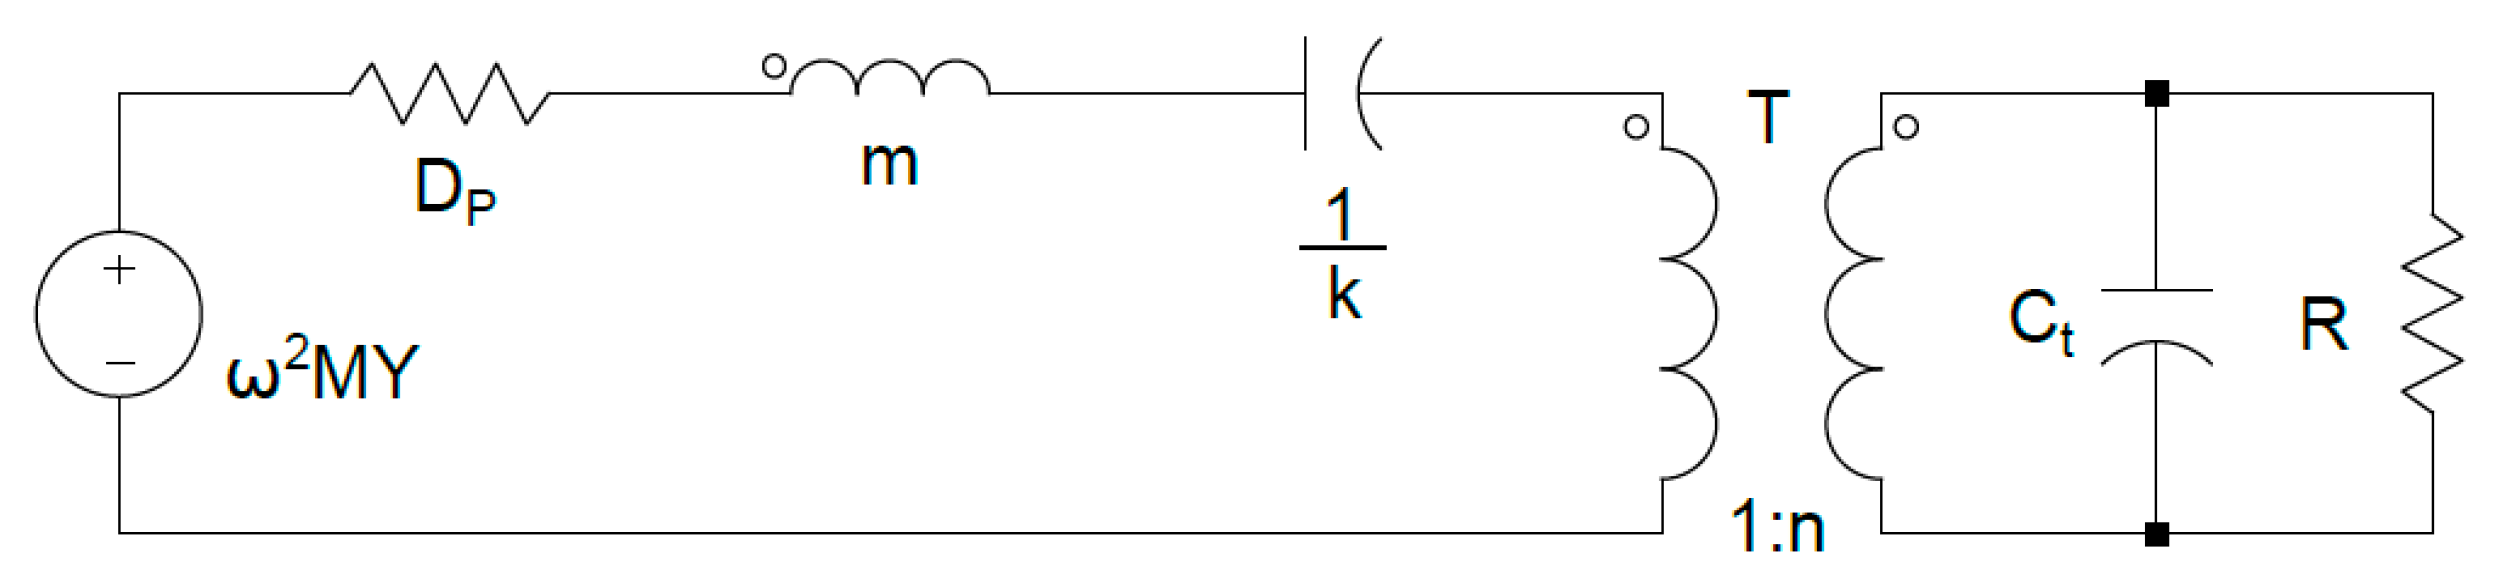
3.3. Electrostatic Transduction

Electrostatic harvesters [12,35,61,62,63,64,65,66] are made of a variable capacitor whose plates are electrically isolated from each other by air, vacuum, or an insulator, Figure 10. The external mechanical vibrations cause the gap between the plates to vary, changing the capacitance. To harvest energy, the plates must be charged. In these conditions mechanical vibrations oppose the electrostatic forces present in the device. Therefore, if a voltage V biases the capacitor and if load circuitry is linear, the motion of the movable electrode produces electrical power.
The fundamental equations that models this operation are Equations (12) and (13).
C = Q V = ε A d V = Q d ε 0 A
E = 0.5 Q V = 0.5 C V 2 = 0.5 Q 2 / C
where C is the capacitance in Farads, V is the voltage in volts, Q is the charge in coulombs, A is the area of the plates in m2, d is the gap between plates in meters, ε is the permittivity of the material between the plates, ε0 is the permittivity of free space and E is the stored energy in Joules.
Electrostatic generators can be either voltage or charge constrained. Voltage constrained devices have a constant voltage applied to the plates, therefore the charge stored on the plates varies with changes in capacitance. This usually involves an operating cycle that starts with the capacitor at its maximum capacitance value (Cmax). Then, the capacitor is charged up to a specified voltage (Vmax) from a reservoir while the capacitance remains constant. The voltage is held constant while the plates move apart until the capacitance reaches its minimum value (Cmin). The excess charge flows back to the reservoir as the plates move apart gaining energy. This energy is determined by Equation (14).
E = 1 2 ( C m a x C m i n ) V m a x 2
Alternatively, a fixed charge can be obtained using electrets materials, such as Teflon or Praylene. In either case, the mechanical work against the electrostatic forces is converted into electrical energy. The net energy gained is determined with Equation (15).
E = 1 2 ( C m a x C m i n ) V m a x V s t a r t
In both equations, Vmax must be compatible with the electronics and the fabrication technology. The previous two approaches have different strengths and weaknesses.
The electrostatic generator can be categorized into one of three types:
  • Out of plane, gap varying, voltage constrained.
  • In a plane, overlap varying, charge constrained.
  • In a plane, the gap is varying.
Table 7 shows the electrostatic force for these three types.
The electrostatic energy harvesters have many advantages over other methods of vibrating energy harvesting, such as high-quality factor Q, low noise, wide tuning range and contained size. However, electrostatic harvesters produce less energy than other kinetic harvesters and their application range is more limited due to their operation characteristics.
Figure 11 represents the equivalent circuit model for vibration driven harvester using electrostatic damping. The circuit on the primary side of the transformer models the mechanical behavior of the harvester. The voltage source represents the vibration source; the capacitor represents the mass; the inductor represents the spring; and the resistor represents the parasitic damping. The electrical elements of the generator are on the secondary side, where the capacitor models the terminal capacitance of the piezoelectric material or the moving capacitor.

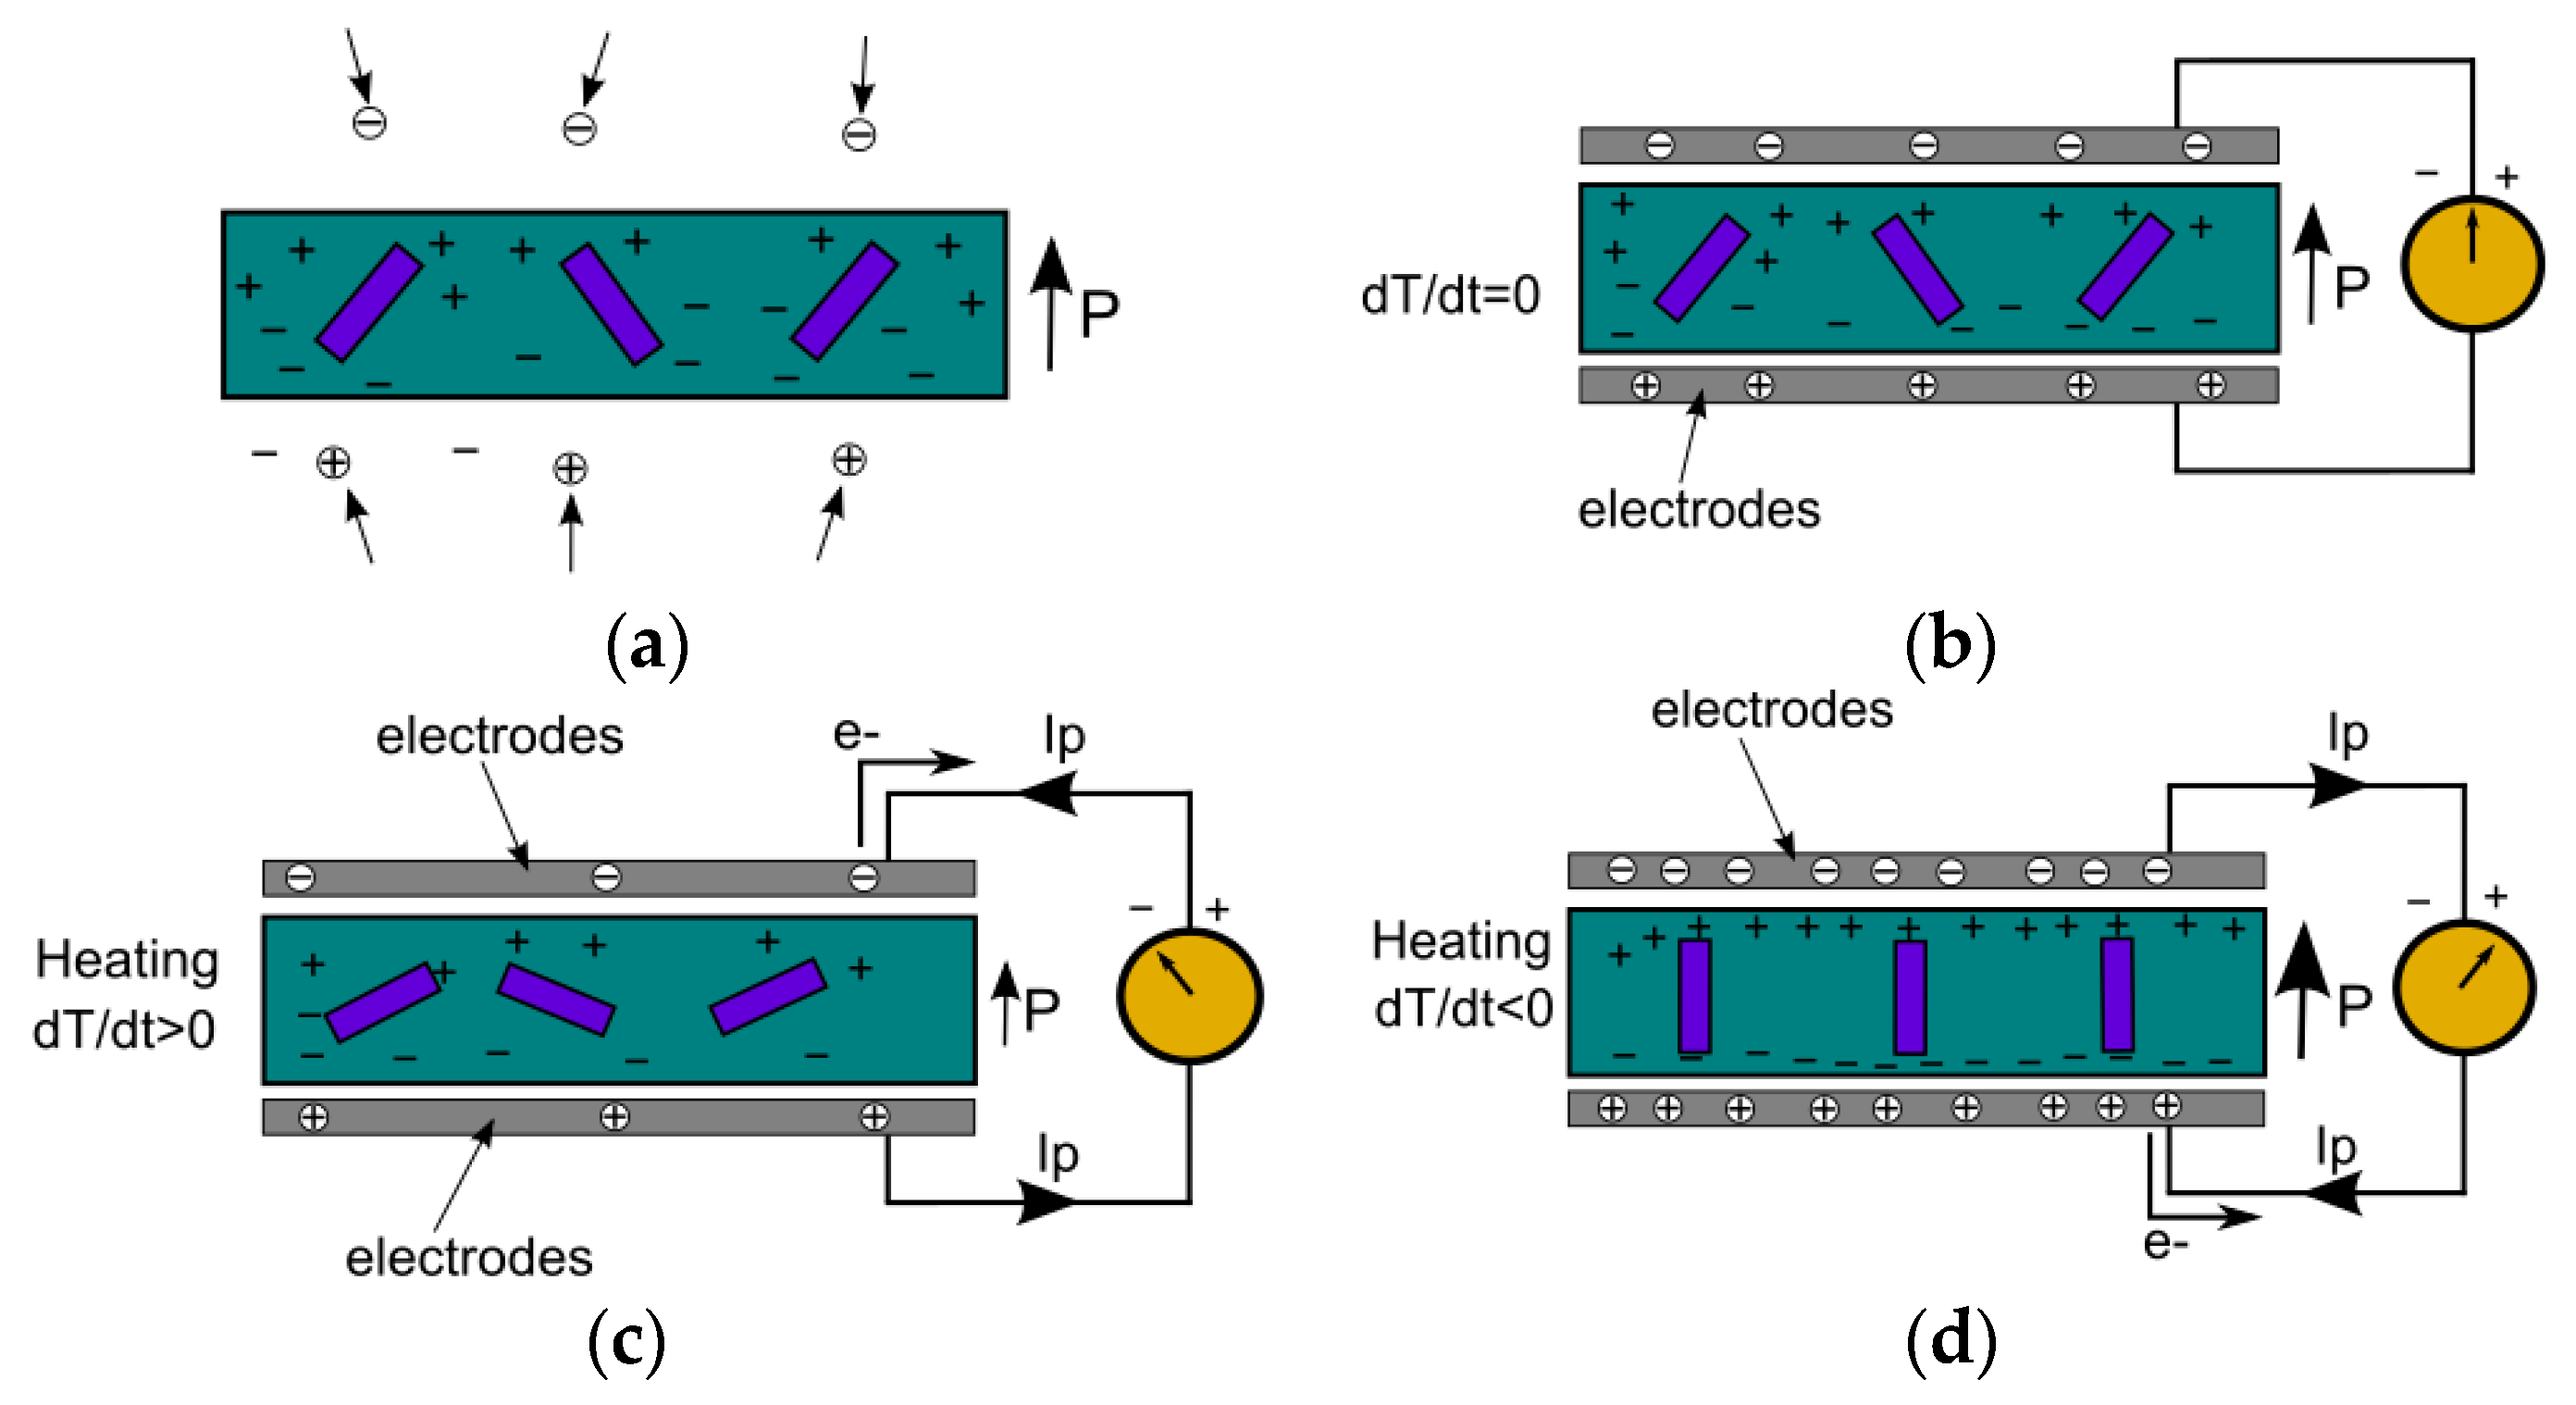
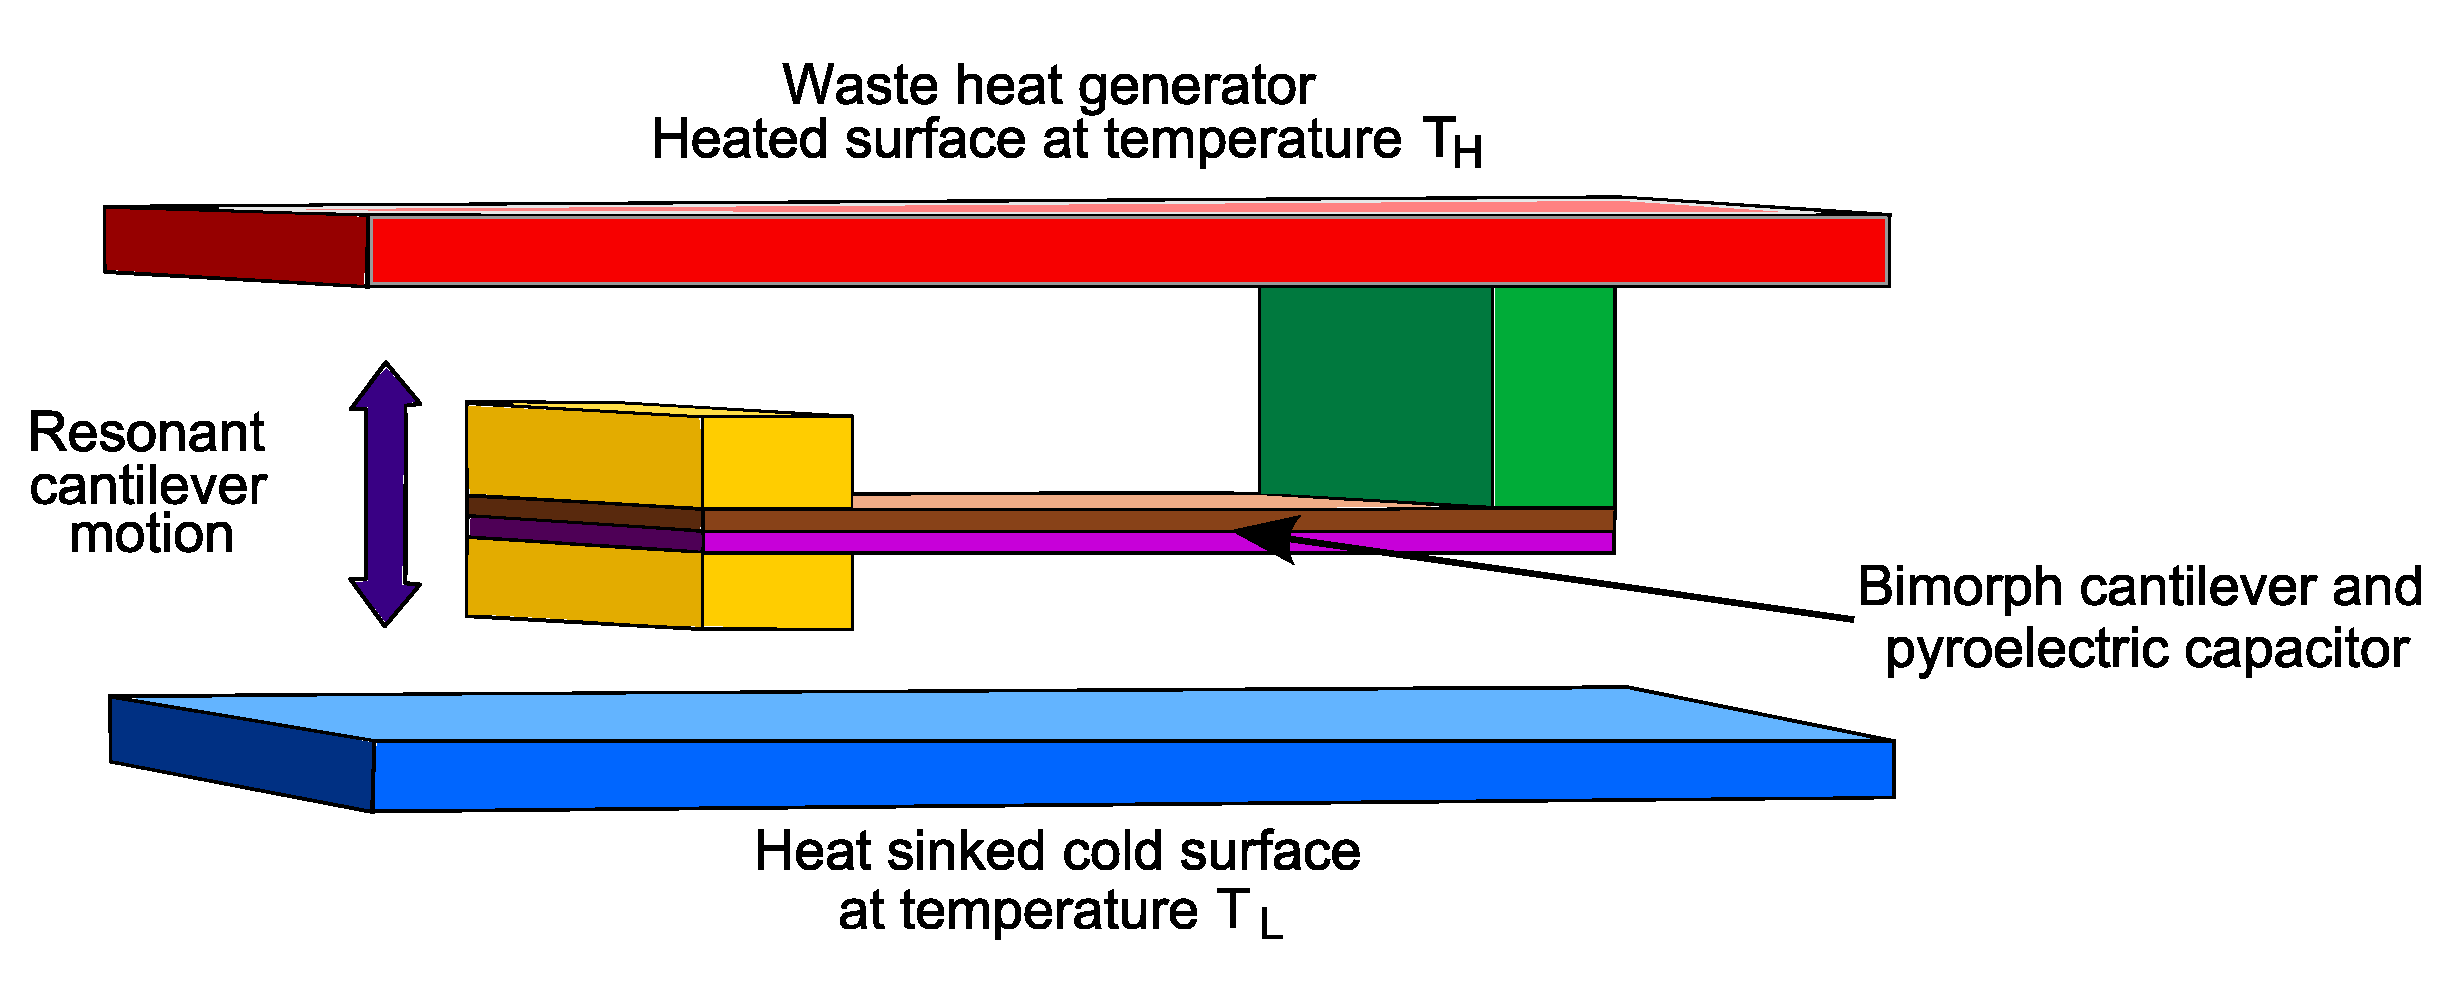
3.4. Pyroelectric Transduction

A pyroelectric harvester [67,68,69,70,71,72] converts a temperature change into electric current or voltage. Piezoelectric effect is similar, but the ferroelectric behavior is different. Pyroelectricity requires inputs that vary with the time and the provided power outputs are small because of its low operating frequencies. Nevertheless, an advantage of pyroelectrics over thermoelectrics is the stability of many pyroelectric materials up to 1200 °C or higher, which allows energy harvesting from high-temperature sources and therefore increases the thermodynamic efficiency.
The polarization P of pyroelectric materials present a strong temperature dependence because of their crystallographic structure. The spontaneous polarization of these materials is defined as the average electric dipole moment per volume unit when there is no applied electric field. By reversing the applied coercive electric field, ferroelectric materials, a subclass of pyroelectrics, can change the magnitude and direction of the spontaneous polarization. However, it is not possible to perform a direct conversion between two different temperatures Tcold and Thot because the unipolar hysteresis curves depend on the electric displacement D and electric field E exhibited by ferroelectric materials. The characteristic curves of the electric field applied across the sample are counter-clockwise oriented over the isothermal cycling. Ferroelectric materials become paraelectric when heated above their Curie temperature TCurie losing its intrinsic polarization. The electric displacement D of the material at temperature T and electric field E is defined as in Equation (16).
D ( E , T ) = ε 0 ε r ( T ) E + P s ( T )
where ε0 is the vacuum permittivity, εr(T) is the relative permittivity of the material, E is the applied electric field, and Ps(T) the saturation polarization.
Figure 12 shows the operation basics of a pyroelectric harvester:
  • Pyroelectric free charges (represented as positive and minus circles) are attracted to the material due to its spontaneous polarization (Figure 12a).
  • If a capacitor is formed with two electrodes plates and the assembly is set at constant temperature, the spontaneous polarization remains constant, consequently is no current flow through the ammeter (Figure 12b).
  • As the harvester is being heated, the dipole moment diminishes and the spontaneous polarization slows down. As a result, the number of bound charges at the electrodes decreases, causing a redistribution of charges that produce a current flow through the external circuit (Figure 12c).
  • As the harvester is being cooled, the spontaneous polarization increases, and the current sign is (Figure 12d).
Equation (17) shows the pyroelectric current Ip produced during the cycle.
I p = A f d P s d t = A f p d T d t
where Af is the surface area of the pyroelectric thin film capacitor, PS is the pyroelectric thin film polarization, T is the pyroelectric capacitor temperature, and p is the pyroelectric coefficient. Thus, the net output power Np that the pyroelectric capacitor provides is given by Equation (18).
N p = V a p p l I p = V a p p l A f p d T d t
where Vappl is the applied voltage across the pyroelectric capacitor terminals. The integration of Equation (18) over a temperature cycle gives the cumulative pyroelectric conversion output work Wout represented with Equation (19).
W o u t = V a p p l d q = N p d t = V a p p l A f p d T d t
Figure 13 shows a pyroelectric harvester with a bimorph cantilevered architecture. The bottom layer of the pyroelectric material has a large coefficient of thermal expansion (CTE) while the lower and thicker metal layer is made of a low CTE metal, such as Titanium (Ti). The bimorph metal and pyroelectric P(VDF-TrFE) layers are typically 2–10 μm thick. The uppermost metal layer creates a continuous metal film over the P(VDF-TrFE) dielectric layer. It must be thick enough to not contribute to the bimorph bending of the cantilever (typically 10–50 nm).
The cantilever structure of the harvester heats through a heat generator, the anchor. Starting from a repose condition, when cantilever temperature increases it bends towards the lower cold heat sink surface. Once it touches the cold surface of the heat sink, the structure loses heat and bends back the hot upper surface, at a pace defined by the thermal resistance of the heat sink. When it contacts again the heat source, the process is repeated indefinitely if there is a heat gradient between heat generator and sink. Transferring enough amounts of thermal energy to the pyroelectric capacitor on the cantilever requires good thermal contact between the hot and cold surfaces, i.e., low thermal resistance. The heat transfer is produced through small striction forces between the surfaces of the sink and the heat generator and the surface faces of the cantilever mass. These forces, once contact and the temperature exchange has been made, counteracts the bimorph mechanical force that pulls the cantilever structure away from the surfaces. Hence, the faster the temperature can be cycled back and forth across the device, the more efficient the energy conversion process is and the higher the amount of electrical energy generated. Besides, the amount of current and electrical energy that this architecture produces is function of the magnitude of the pyroelectric coefficient p, the size of the capacitor (plate area A), and the rate of temperature gradient changes across the pyroelectric capacitor. Additionally, the time that the cantilever remains attached to the heat and sink surfaces can be set by applying an alternating electric potential between adjacent surfaces. The equivalent electric circuit of the harvester is shown in Figure 14.
The Carnot efficiency limits thermodynamically the work available. It is given by Equation (20).
η C a r n o t = 1 T L T h
where Th is the temperature of the heat generator and TL is the temperature of the heat sink. The conversion efficiency, η, is function of the electrical energy (Wout) and the convert heat (Qin) of the thermal energy gradient power generator, Equation (21).
η = W o u t Q i n = W E W P C v T + Q I n t + Q L e a k
where WE is electrical energy, WP is the energy produced lost in the temperature cycle, Cv is the heat capacity of the pyroelectric device, QInt represents the intrinsic heat losses in the thermal cycle, and QLeak are the heat leakages between the hot and cold sources and the pyroelectric mass.
The energy conversion efficiency for any thermal energy recovery device depends on the temperature difference between the hot and cold sources. Experimental results found in the bibliography exhibit maximum overall efficiencies in the range of 3–7%, for temperature gradients of 10–20 °C. The efficiencies increase up to 20–40% if the temperature gradients are between 100–300 °C.

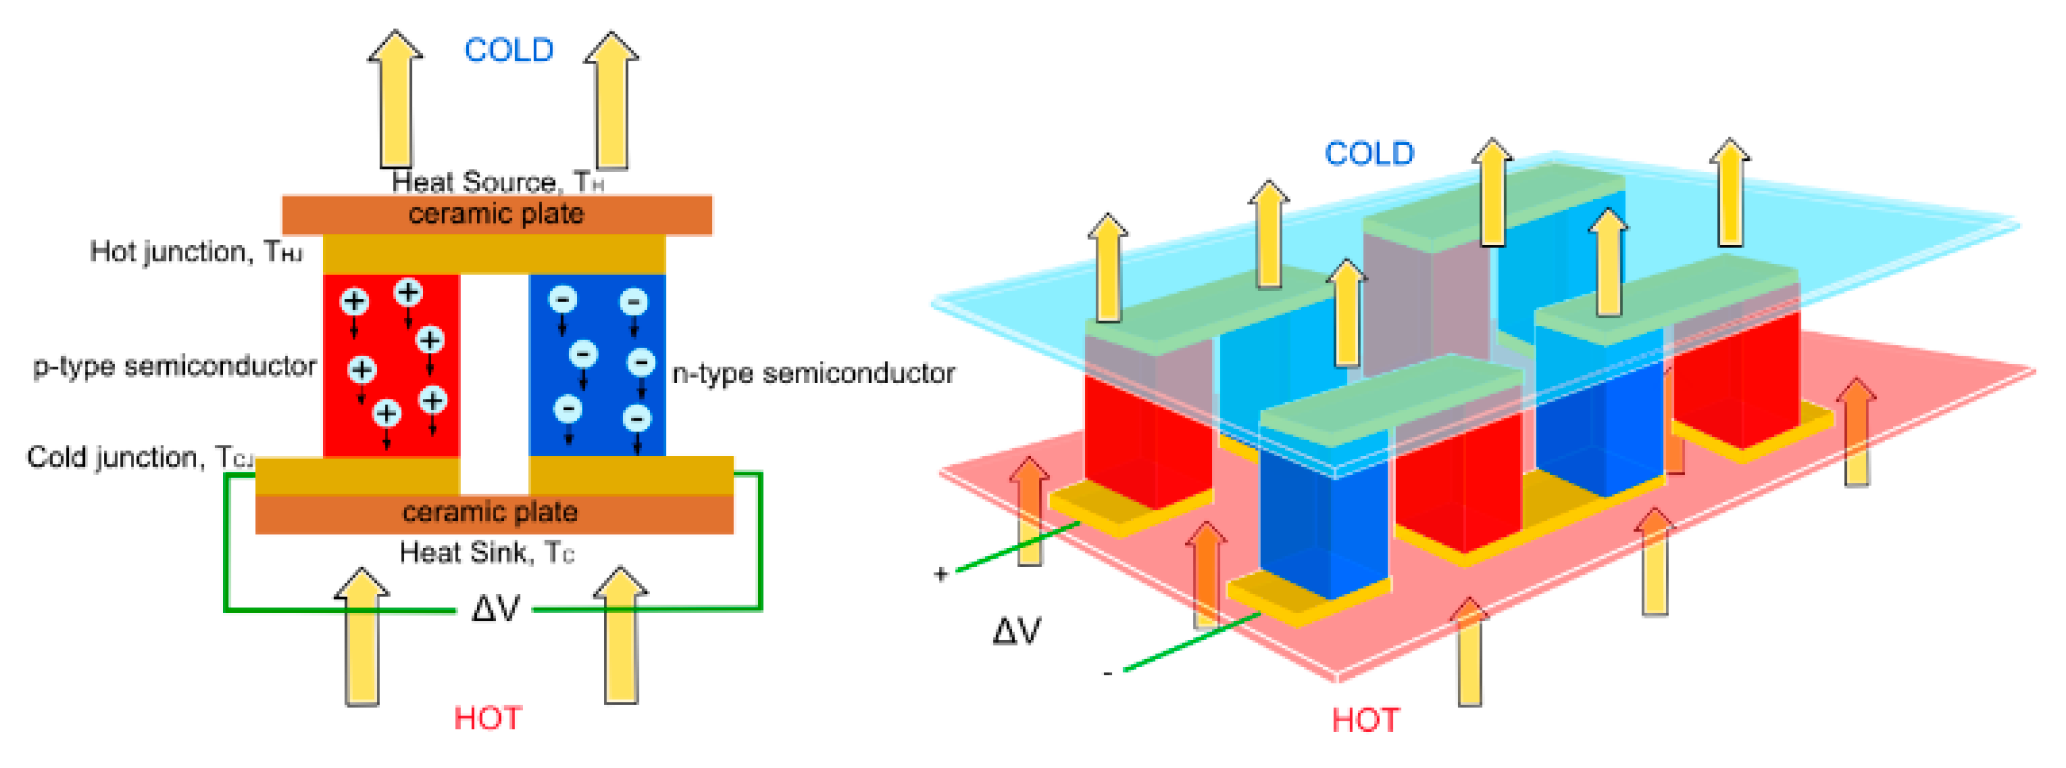
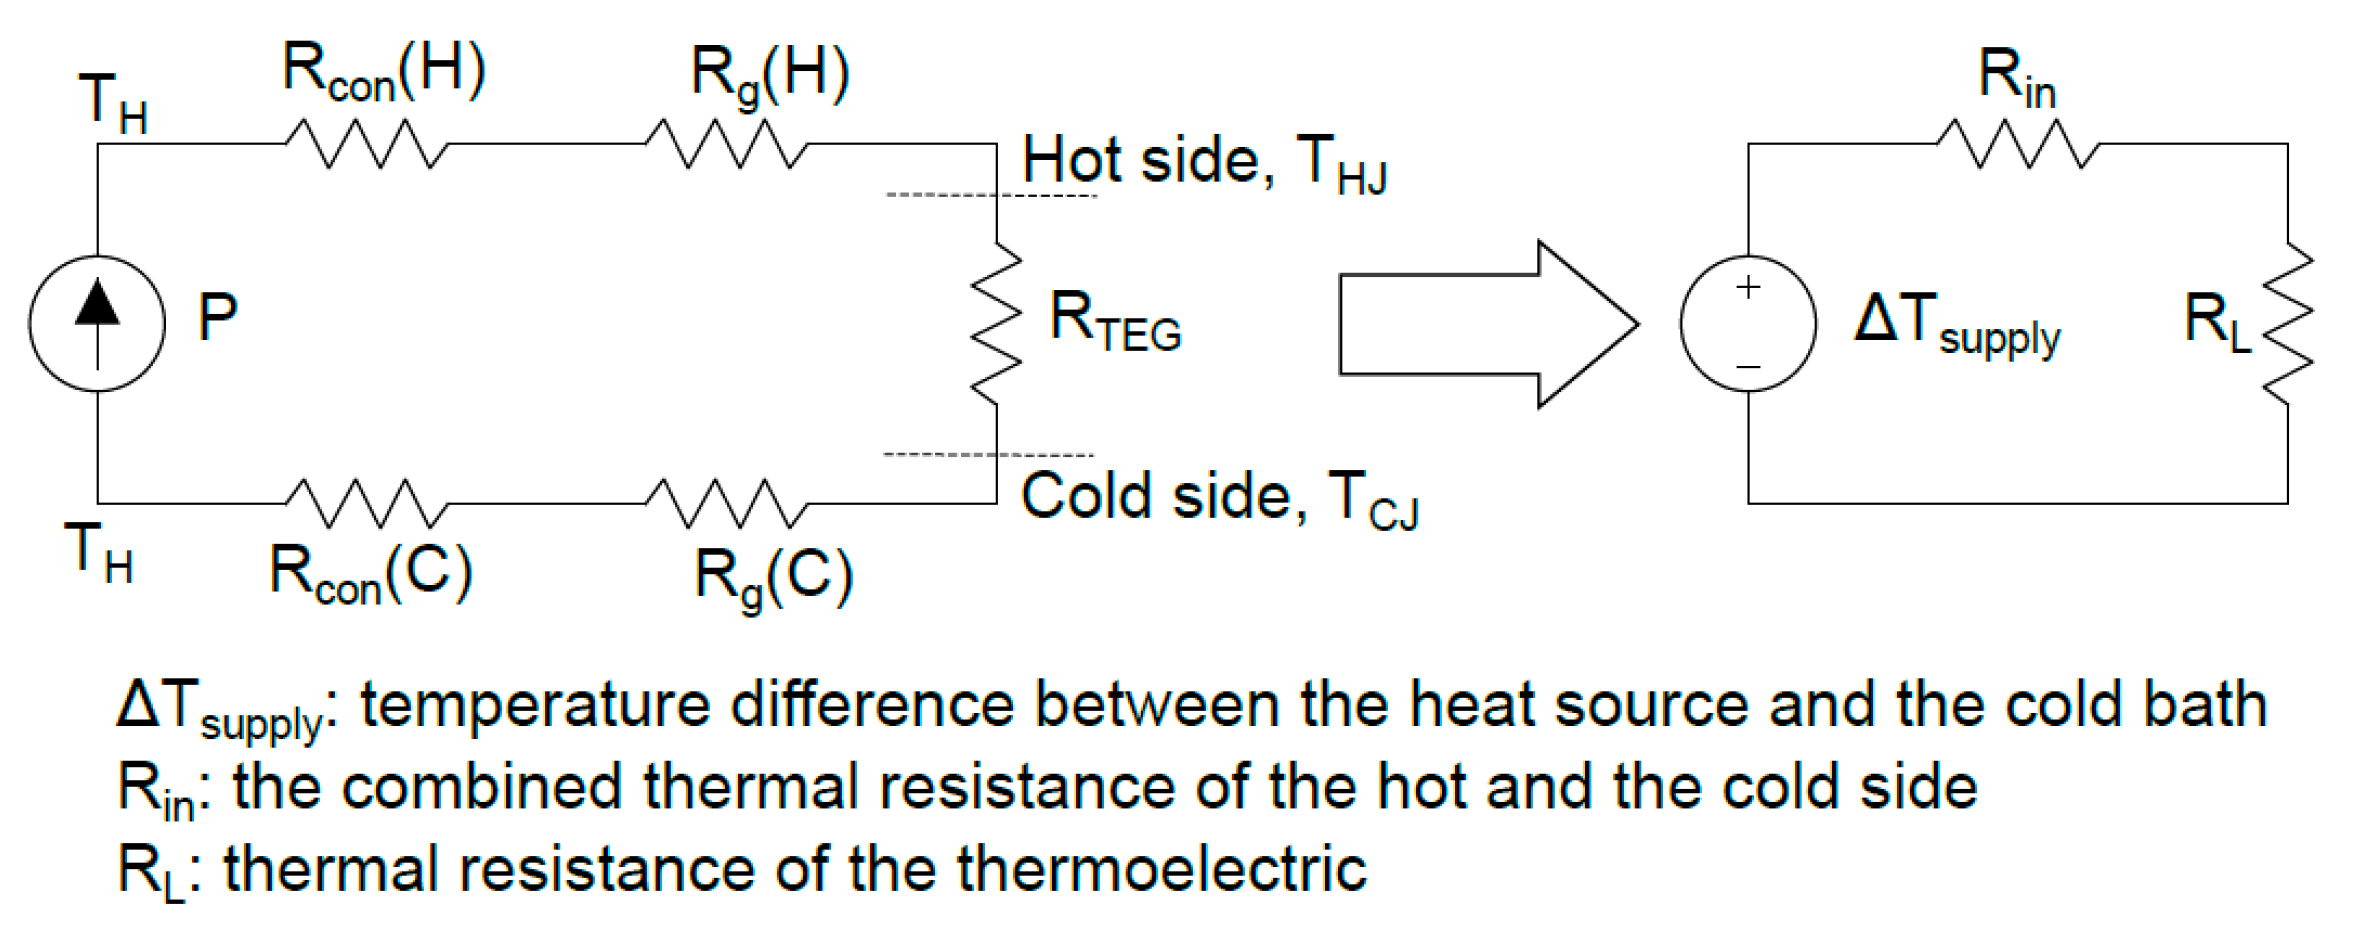
4. Thermoelectric Harvester’s Technology and Devices

Thermoelectric harvesters [9,12,35,73,74,75,76,77,78,79] are suited to environments with temperature gradients. This harvester technology exploits the Seebeck effect to convert thermal energy into electric. The temperature gradient between the material terminals provides the potential for efficient energy conversion, while heat flow provides the power. Thermoelectric devices, even when the heat flow is large, do not provide much energy because the material efficiencies are low and the Carnot theorem. Therefore, heavily doped semiconductors constitute the best thermoelectric materials.
Thus, thermoelectric harvesters are solid-state devices without moving parts. This type of device is suitable for energy harvesting application because it is silent, reliable, scalable and easily installed.
The thermoelectric effects appear because charge carriers in metals and semiconductors could change their energy levels when energy is applied, thus producing heat transfer or electric energy in form of voltage or current. When a thermoelectric material is placed under a temperature gradient, there is a diffusion of charge carriers from the hot end to the cold one. The build-up of charge carriers implies that there is a net charge (negative for electrons, e and positive for holes, h+) at the cold end, which produces a voltage between both terminals. The electrostatic repulsion due to the accumulation of charge and the chemical potential for diffusion reach an equilibrium. This property is known as the Seebeck effect and is the basis of temperature measurement with thermocouples and the thermoelectric power generation. Figure 15 shows operation mode of a thermoelectric harvester.
If there is a gradient temperature across a thermoelectric material, it becomes a thermoelectric generator able to power an electric load connected to its terminals. The temperature difference and the material Seebek coefficient determines the voltage (V = αΔT), meanwhile the heat flow drives the electrical current, which therefore determines the power output. The figure of merit of thermoelectric materials (zT) is a function of the Seebeck coefficient (α), the absolute temperature (T), the electrical resistivity (ρ) and the thermal conductivity (κ) of the material, as depicted in Equation (22).
z T = α 2 T ρ κ
The voltage level that a single thermocouple provides is in the range of mv, thus, to obtain practical output voltage and enough power for low temperature gradients, the thermocouples can be arranged electrically in series and thermally in parallel, forming the thermoelectric device. Equations (23)–(25) provides the Seebeck voltage VG at the load, the current IL, the internal resistance Rin and the load resistance RL of a thermoelectric device with N number of thermocouples in a thermoelectric area Aleg.
V G = V p n = N α p n ( T T E G ) = N α p n ( T h T c )
I L = V G R i n + R L = N α p n ( T h T c ) R i n + R L
R i n = N 2 ρ h A l e g
zT determines the maximum efficiency of a thermoelectric device, which is the average of the component materials zT values. The Carnot coefficient limits the energy conversion as depicted in Equation (26).
η C a r n o t = T T h
where ΔT = ThTc is the temperature gradient across the thermoelectric harvester. Equation (27) shows the dependency of generated electric power (P) on the convert’s heat (Q) and the system efficiency (η).
P = η Q
Therefore, it is not straightforward to obtain the exact efficiency of thermoelectric materials. Equation (28) provides an efficiency value based on the constant properties approximation.
η = T T h   1 + z T 1 1 + z T + T c / T h
The state-of-the-art thermoelectric device has an efficiency of approximately 10% due to losses in the electrical junctions, and thermal electrical contact resistances between different materials, and other thermal losses.
Figure 16 shows the equivalent circuit model of the thermoelectric energy harvester (TEG). The temperature difference, ΔTTEG, between the junctions of the TEG is lower than the temperature gradient, ΔT = ThTc, externally imposed across the thermal energy harvester. This difference is caused by thermal contacts and thermal grease resistances of the cold and hot ends of the thermal energy harvester, i.e., Rcon(H), Rcon(C) and Rg(H), Rg(C), respectively. The thermal resistance, RTEG, of the TEG is made as high as possible, in order to minimize this negative effect, the remaining thermal resistances of the energy harvester are designed as small as possible.
Based on the aforementioned thermal circuit, the temperature difference across the thermoelectric is obtained with the Equation (29).
P = T s u p p l y R L R i n + R L
And Equation (30) provides the heat flow through the circuit.
Q = T s u p p l y R i n + R L
Combining these two equations and the linear relationship between efficiency and ΔTTEG gives the electric power value. As shown in Equation (31), the higher number of thermocouples, the larger temperature difference between the hot and cold junctions, the higher absolute Seebeck coefficient and lower internal resistance, the higher output power.
P = η 1 T s u p p l y 2 R L ( R i n + R L ) 2 = N 2 α p n 2 T s u p p l y 2 R L ( R i n + R L ) 2

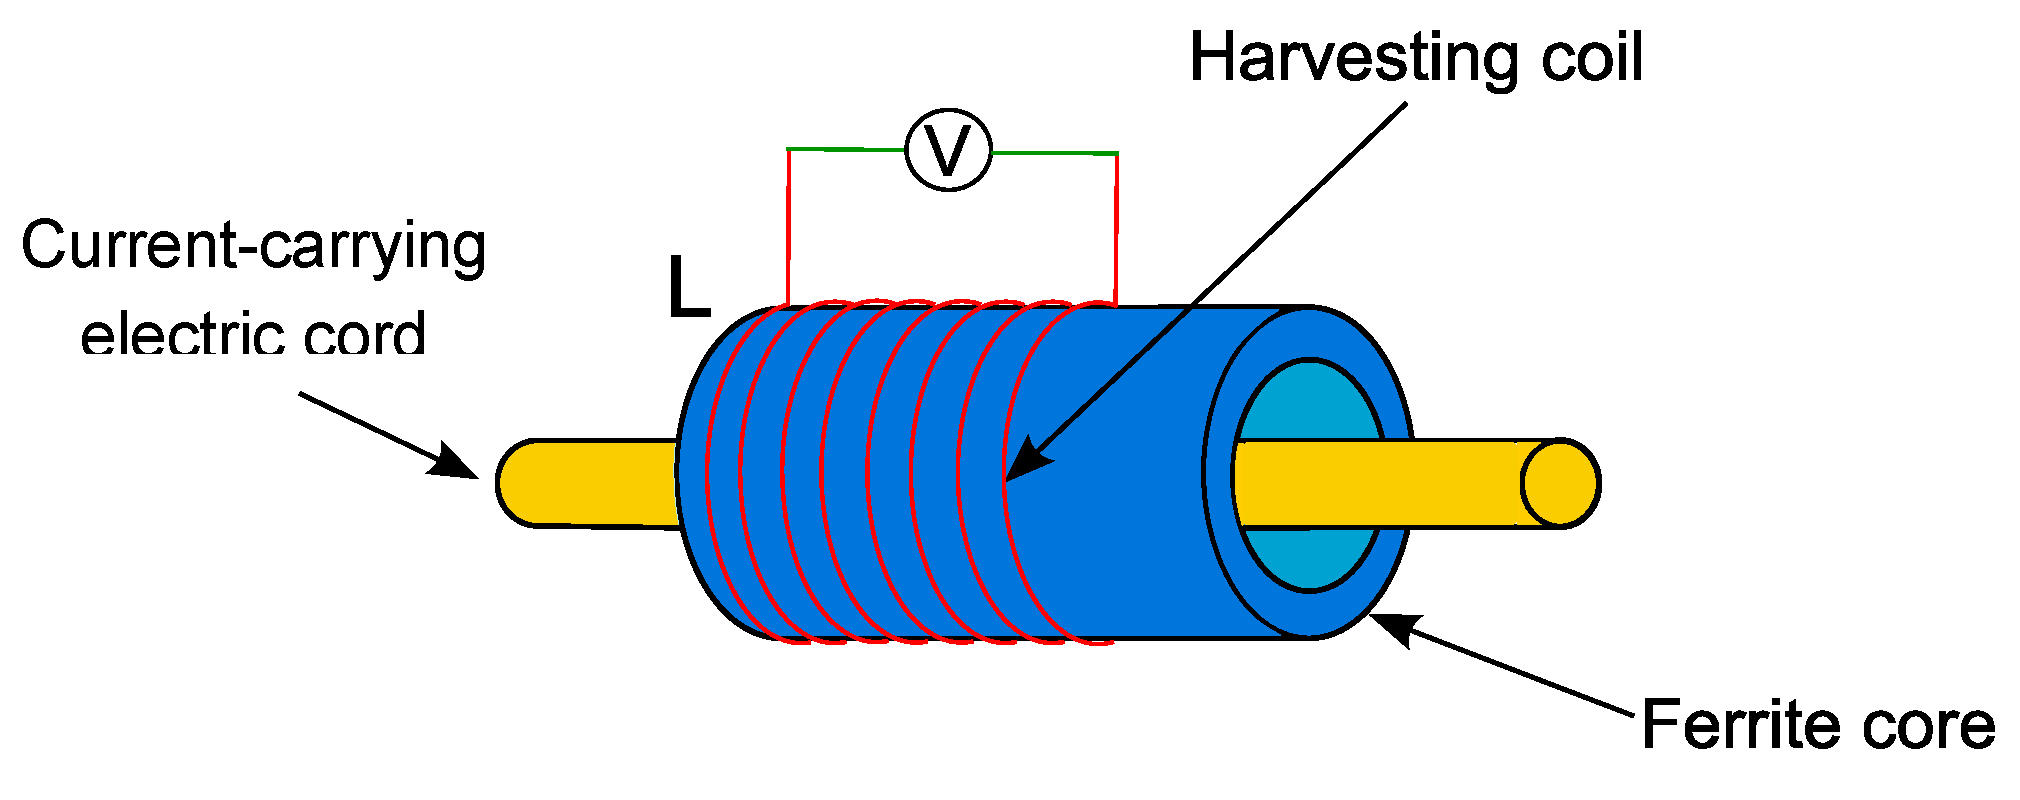
5. Magnetic Harvester’s Technology and Devices

Magnetic harvesters [80,81,82,83,84,85] are made of a ferromagnetic material and an inductor. The Faraday’s law of induction describes their behavior. When the harvester is placed close to a variable magnetic field, an induced electromotive force is generated on the inductor; this principle is the electromagnetic induction. The electricity is generated when a changing magnetic field influences the harvesting device.
The most common source of magnetic field is a conductor carrying electrical current. Thus, a standard application wraps the harvester around an electric power line, due to the high-power source and high magnetic variability. Nevertheless, is also possible to harvest power from electric power-lines, such as the harmful noise that produce the power lines in form of magnetic fields.
The flow of electric charge has an associated magnetic field. Moreover, ferromagnetic materials are ideal materials for this harvester technology. These materials have the propriety to attract a magnet and transfer electromagnetic energy to electric energy, where the usual used ferromagnetic materials are iron, nickel, cobalt, alnico and an alloy of aluminum-nickel-cobalt. Ferromagnetic materials are classified with relative permeability. The permeability ratio of a material compared with that in vacuum for the same magnetic field strength defines the relative permeability of a material. Besides, the relative permeability factor increases the magnetic field across the material. Table 8 [27] shows the relative permeability of different ferromagnetic materials.
Another consideration in the implementation process of magnetic energy harvester is the properties of the coil. The series resistance and the number of coil turns are the parameters that determine the voltage and available power generated by the harvester. Moreover, the number of turns influence the coil geometry, the wire diameter and the coil wrap density. The insulated circular wire does not fill completely the volume of the coil with conductive material, thus the percentage of copper inside a coil defines the fill factor. The area of the wire, Awire, can be related to the total cross-section area of the coil, Acoil, for a given copper fill factor, N = Acoil/Awire. The copper fill factor depends on the tightness and the shape of the winding, and the variations in the thickness of the insulation. The harvester described in the previous lines is shown in Figure 17.
The voltage produced in the harvester, the value of the coil inductance and the output power can be obtained with the Faraday’s equations. Thus, the open circuit voltage of an N turn coil placed on a cylindrical core with l length, D diameter, and a relative permeability μr is given by Equation (32).
V o c = 2 π f µ e f f N π ( D 2 ) 2 B
where B is the magnetic flux density (in air) parallel to the coil axis and f is his frequency. μeff is the effective relative permeability, which is inside 1 < μeff < μr range. The coil self-inductance is obtained with Equation (33).
L s = [ π µ 0 µ e f f N π ( D 2 ) 2 N 2 ] [ l + 0.9 ( D 2 ) ]
The magnetic harvester’s maximum output power is obtained in impedance matching situation with the load. If the coil open circuit voltage Voc under some defined conditions is optimally obtained, the output voltage Vout will be the half of Voc, Equation (34).
V o u t = 0.5 V o c = π f µ e f f N π ( D 2 ) 2 B
Finally, output power per unit volume in W/m3 is represented as in Equation (35).
P o u t / V o l = π 2 D N 4 ρ l µ e f f 2 ( f B ) 2
where ρ is the wire resistance per unit of length.
The electric circuit representation of previous equations is shown in Figure 18. Whenever a current flow cross through the core conductor, an electric field proportional to the current is generated. Then, by the principle of induction, a current proportional to the electrical field, scaled by the transformer ratio, T, is induced in the secondary coil. Besides, ferromagnetic material resistance could be added to the secondary coil to increase the accuracy of the model. The resistance Rin is the internal resistance of the inductor.
The transformer ratio is function of the distance between the core and the conductor line. Furthermore, if the magnitude of the primary current is reduced or the distance of the inductance from the conductor increases, the maximum energy provided by the harvester decreases exponentially. Therefore, it is inefficient to convert the magnetic field energy into electrical energy due to the low efficiency. Table 9 [86] compares the harvested power for different coils [81].
The magnetic field harvester could be used for monitoring electric lines because current carrying conductors are an ideal source of energy to be harvested.

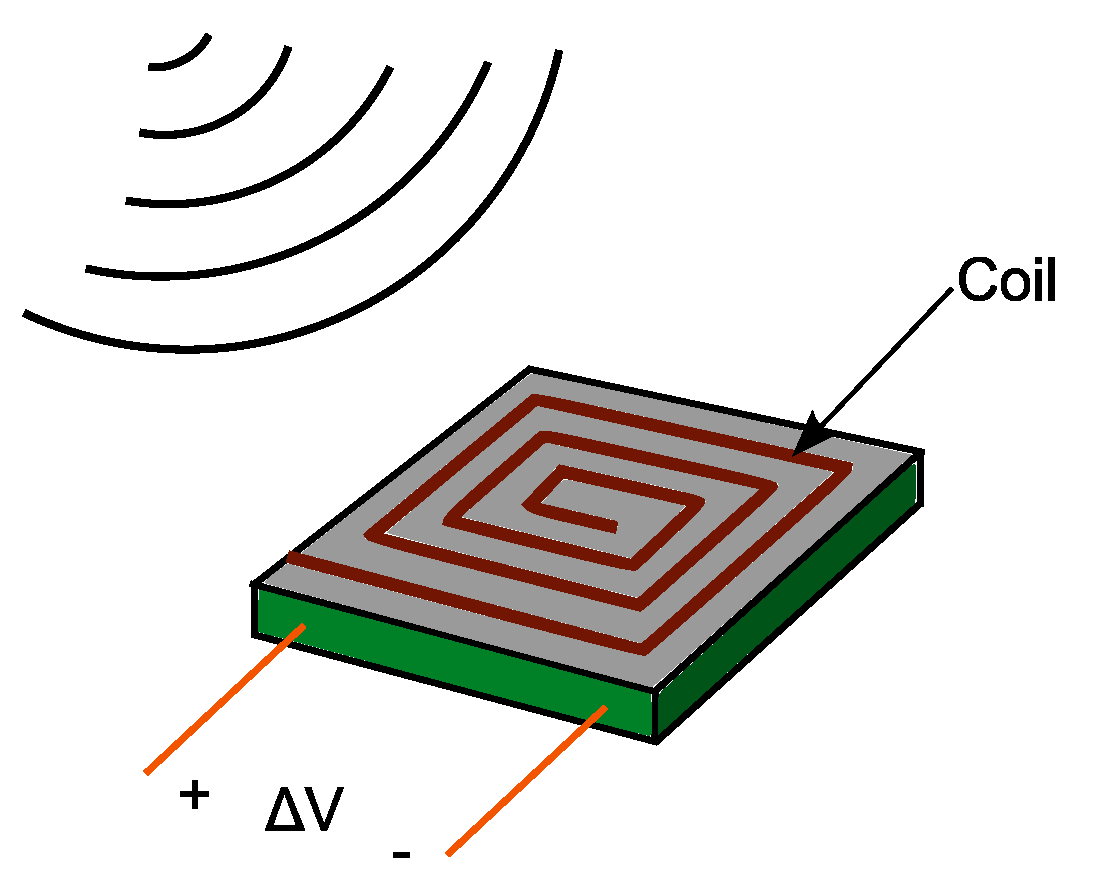
6. RF Harvester’s Technology and Devices

Radio frequency (RF) harvesters [12,87,88,89,90,91,92,93] obtain energy from RF and wireless microwave power. The background RF radiation emitted by broadcast transmitters, cell phone towers, Wi-Fi nets or low power wireless networks, could eventually be used as energy harvesting sources.
In this context, radio frequency waves include frequencies from 3 kHz to 300 GHz. The harvested power depends on the incident power density, the distance between the transmitter and receiver, the power conversion efficiency and the harvester antenna size. Thus, the intercepted power is directly proportional to the size of the antenna aperture.
A coil and a separator compose an RF harvester, Figure 19. The coil is made of conductive materials (Table 6) and the separator is made of nonconductive materials, to avoid short-circuit situations and maintain the integrity of the coil.
The electric field strength (V/m) quantifies the incoming RF radiation. In the far-field region, the electric field strength is converted into incident power density with Equation (36).
S = E 2 Z 0
where S is the incident power density (W/m2) and Z0 is the free space characteristic impedance. The incident power density not only depends on the distance between the source and the receivers, but also on the direction.
For a system with two antennae, the received power PR as a function of the transmitted power PT is given by Equation (37).
P R = P T G T G R λ 2 ( 4 π ) 2 r 2
where GT is the gain of the transmission antenna and GR the gain of the receive antenna, λ is the signal wavelength, and r is the distance between the two antennas. The far-field region, rff, is related to the antenna’s physical dimensions and the signal wavelength, which is calculated with Equation (38), and being only valid for the antennas that operate in the far-field region.
r f f = 2 D 2 λ
An RF harvester device is usually made of a harvester circuit and an integrated rectifier. An example rectifier circuit consists of a single Schottky diode. The Schottky diode makes a dynamic switching in the GHz range. Figure 20 shows the equivalent circuit.
Table 10 [87] shows the amount of energy collected with different RF energy harvesting experiments. The table shows the energy harvesting rate dependency with the source power and distance. The energy harvested is in the range of μW, an amount of energy only suitable for ultra-low power devices.

7. Dynamic Fluid Energy Harvesting

Dynamic fluid energy harvesting includes wind [29,94,95,96,97,98] and flowing water harvesters [30,99,100,101]. The core idea of dynamic fluid harvesters is to use large-scale generator technology principles in small-scale generators. In these harvesters, the electro-mechanical parts such as mini-turbine systems generate the electricity.
Both harvester technologies could have the same equivalent electromechanical circuit model (Figure 21).
Where T*drive is the fluid flow power; M the mass of the rotational parts; Cm the coefficient of frictional torque; G the electromechanical conversion coefficient; ω the mechanical angular velocity; Vg the generated voltage at the coils; Lin generator coils inductance and Rin coils internal resistance.

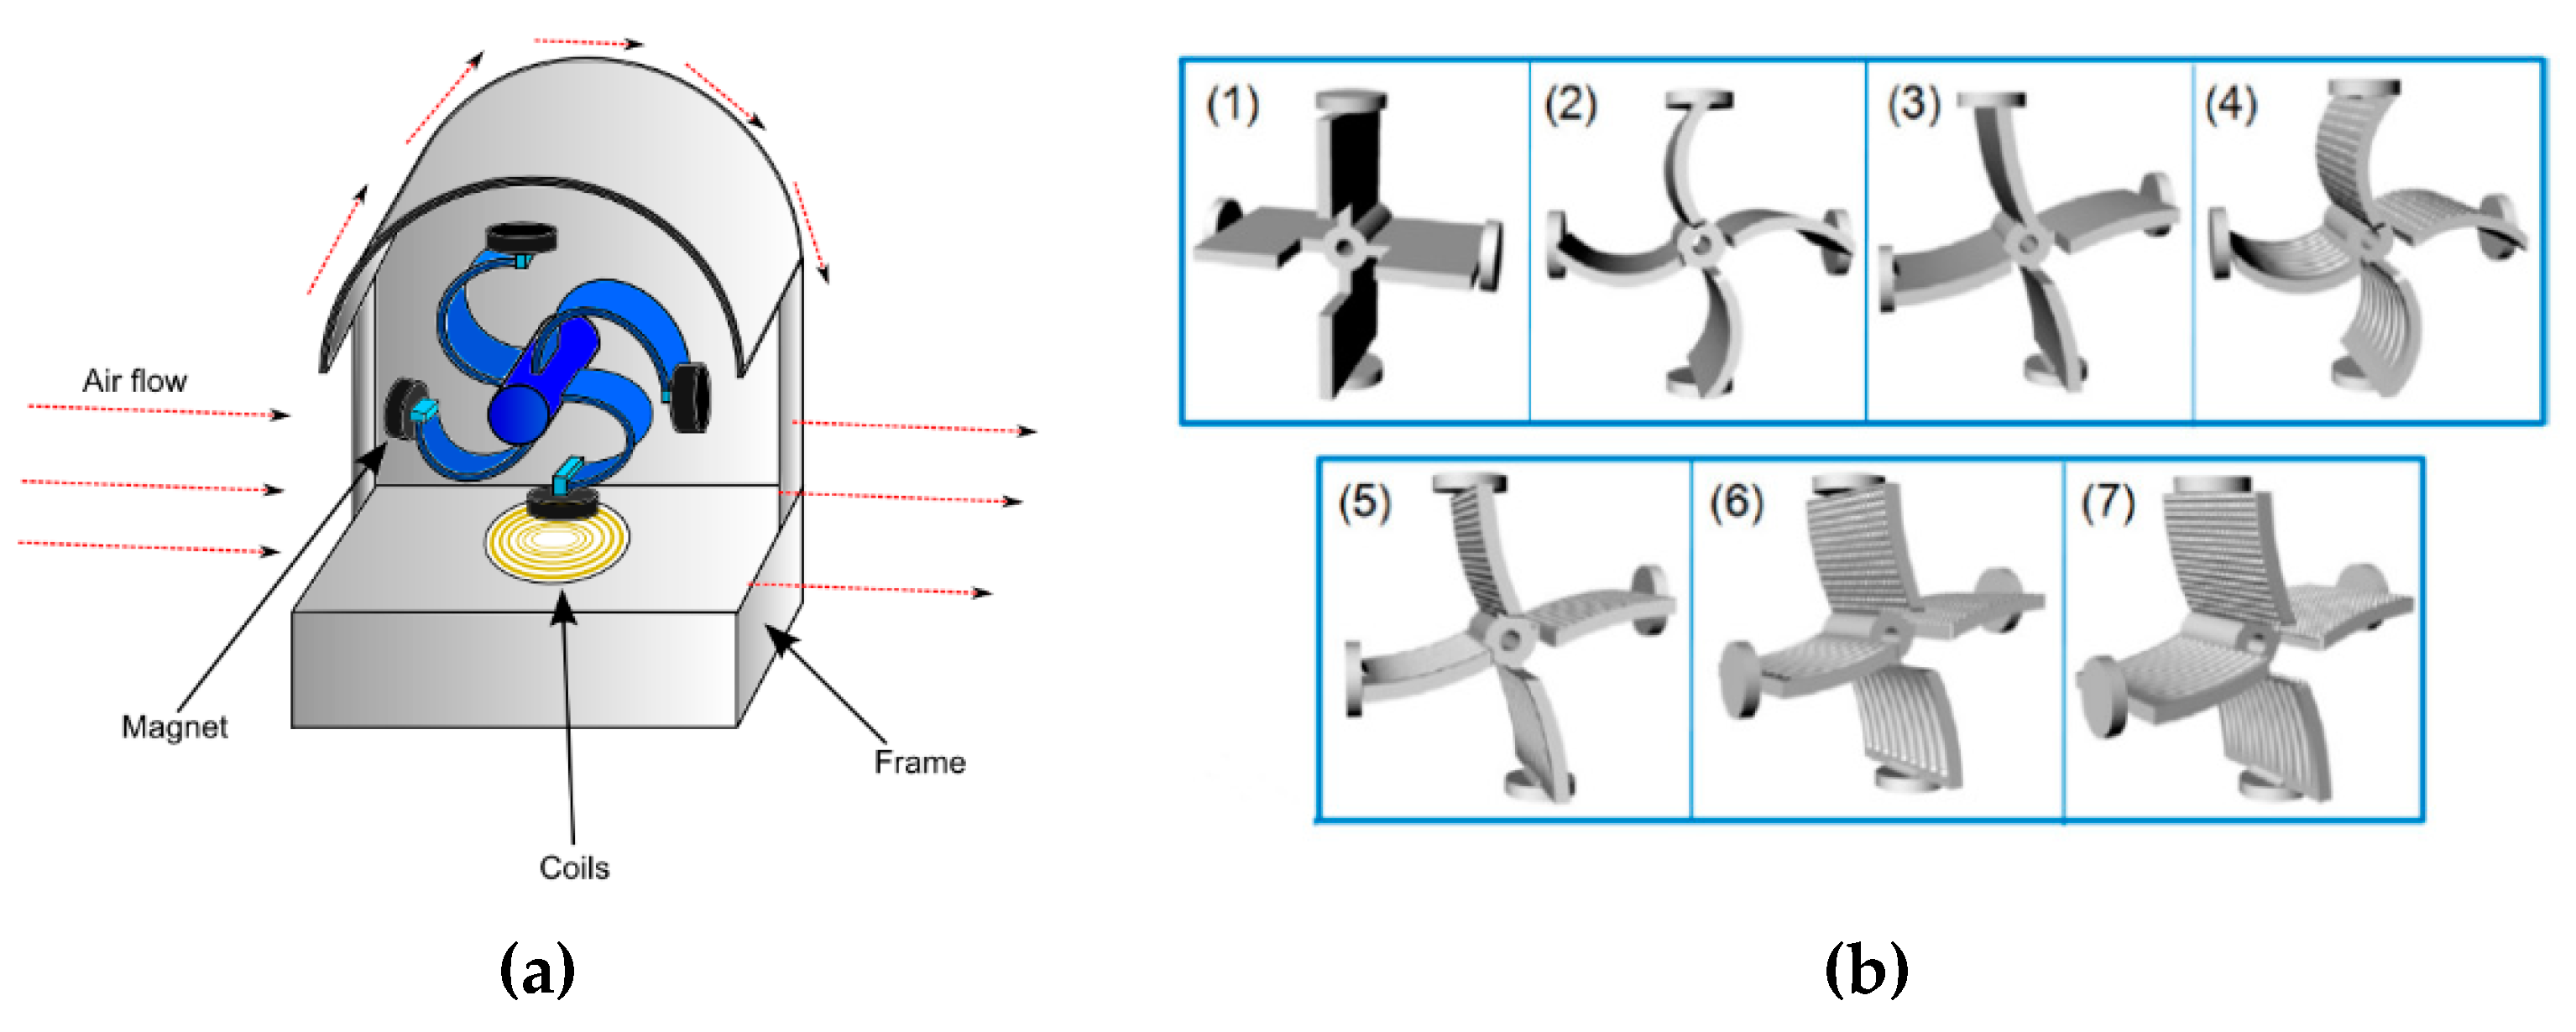
7.1. Wind Harvester’s Technology and Devices

The wind flow harvester has two parts, one mechanical and one electrical. This system converts wind energy into mechanical energy, then into electromagnetic and finally into electrical energy. The electromagnetic wind generators are reliable and have small mechanical damping and magnets suitable to operate at low wind velocities, Figure 22.
When the airflow passes through the system structure, the airflow force pushes the blades, because of that they rotate around a pivoting axis. The blades have magnets attached (rotor) and their movement generates a variable magnetic flux. Consequently, the magnetic field created is harvested as a current induced in the coils of the generator (stator).
As the miniature horizontal axis wind turbine (MHAWT) spin with the wind, so the rotor does, and captures and transforms the kinetic energy of the incoming wind into mechanical energy [102]. By the aerodynamic equation of Ibrahim [103], the available kinetic power from the airflow is Equation (39).
P w i n d = ρ A v 3 2
where ρ the air density, A is the area swept by the rotor of wind turbine, and v the wind speed. However, the conversion of wind power into rotational power in the rotor of the turbine is a complex aerodynamic phenomenon [104,105,106]. Ideally, the power obtained from the ambient wind (Paero) is expressed as in Equation (40).
P a e r o = C p ( λ , θ ) ρ A v 3 2
where Cp is the aerodynamic efficiency of the rotor or the power coefficient, which has a nonlinear dependence with the pitch angle θ of the turbine blades and the tip speed ratio λ. This final parameter is expressed in Equation (41).
λ = ω r v
where ω is the angular velocity and r the radius of the rotor. In addition, to calculate the power coefficient Cp(λ,θ) for small wind turbines, approximation equations are proposed by [107,108,109], giving as result the Equations (42) and (43).
C p ( λ , θ ) = c 1 [ ( c 2 λ i ) c 3 θ c 4 θ c 5 c 6 ] e ( c 7 λ i )
λ i = 1 [ 1 ( λ + c 8 θ ) ] [ c 9 ( θ 3 + 1 ) ]
where c1–c9 are power coefficients. In addition, the aerodynamic profiles of the turbine blades have a significant influence on the efficiency of the spinning. The blades determine directly the system torque force, which influences the output power level. The number of blades also conditions the performance of the energy harvester. System maximum efficiency and output power also depend on the impedance matching between the load, the torque force, and the wind flow.
Finally, Table 11 shows achieved results with several wind flow harvesters.

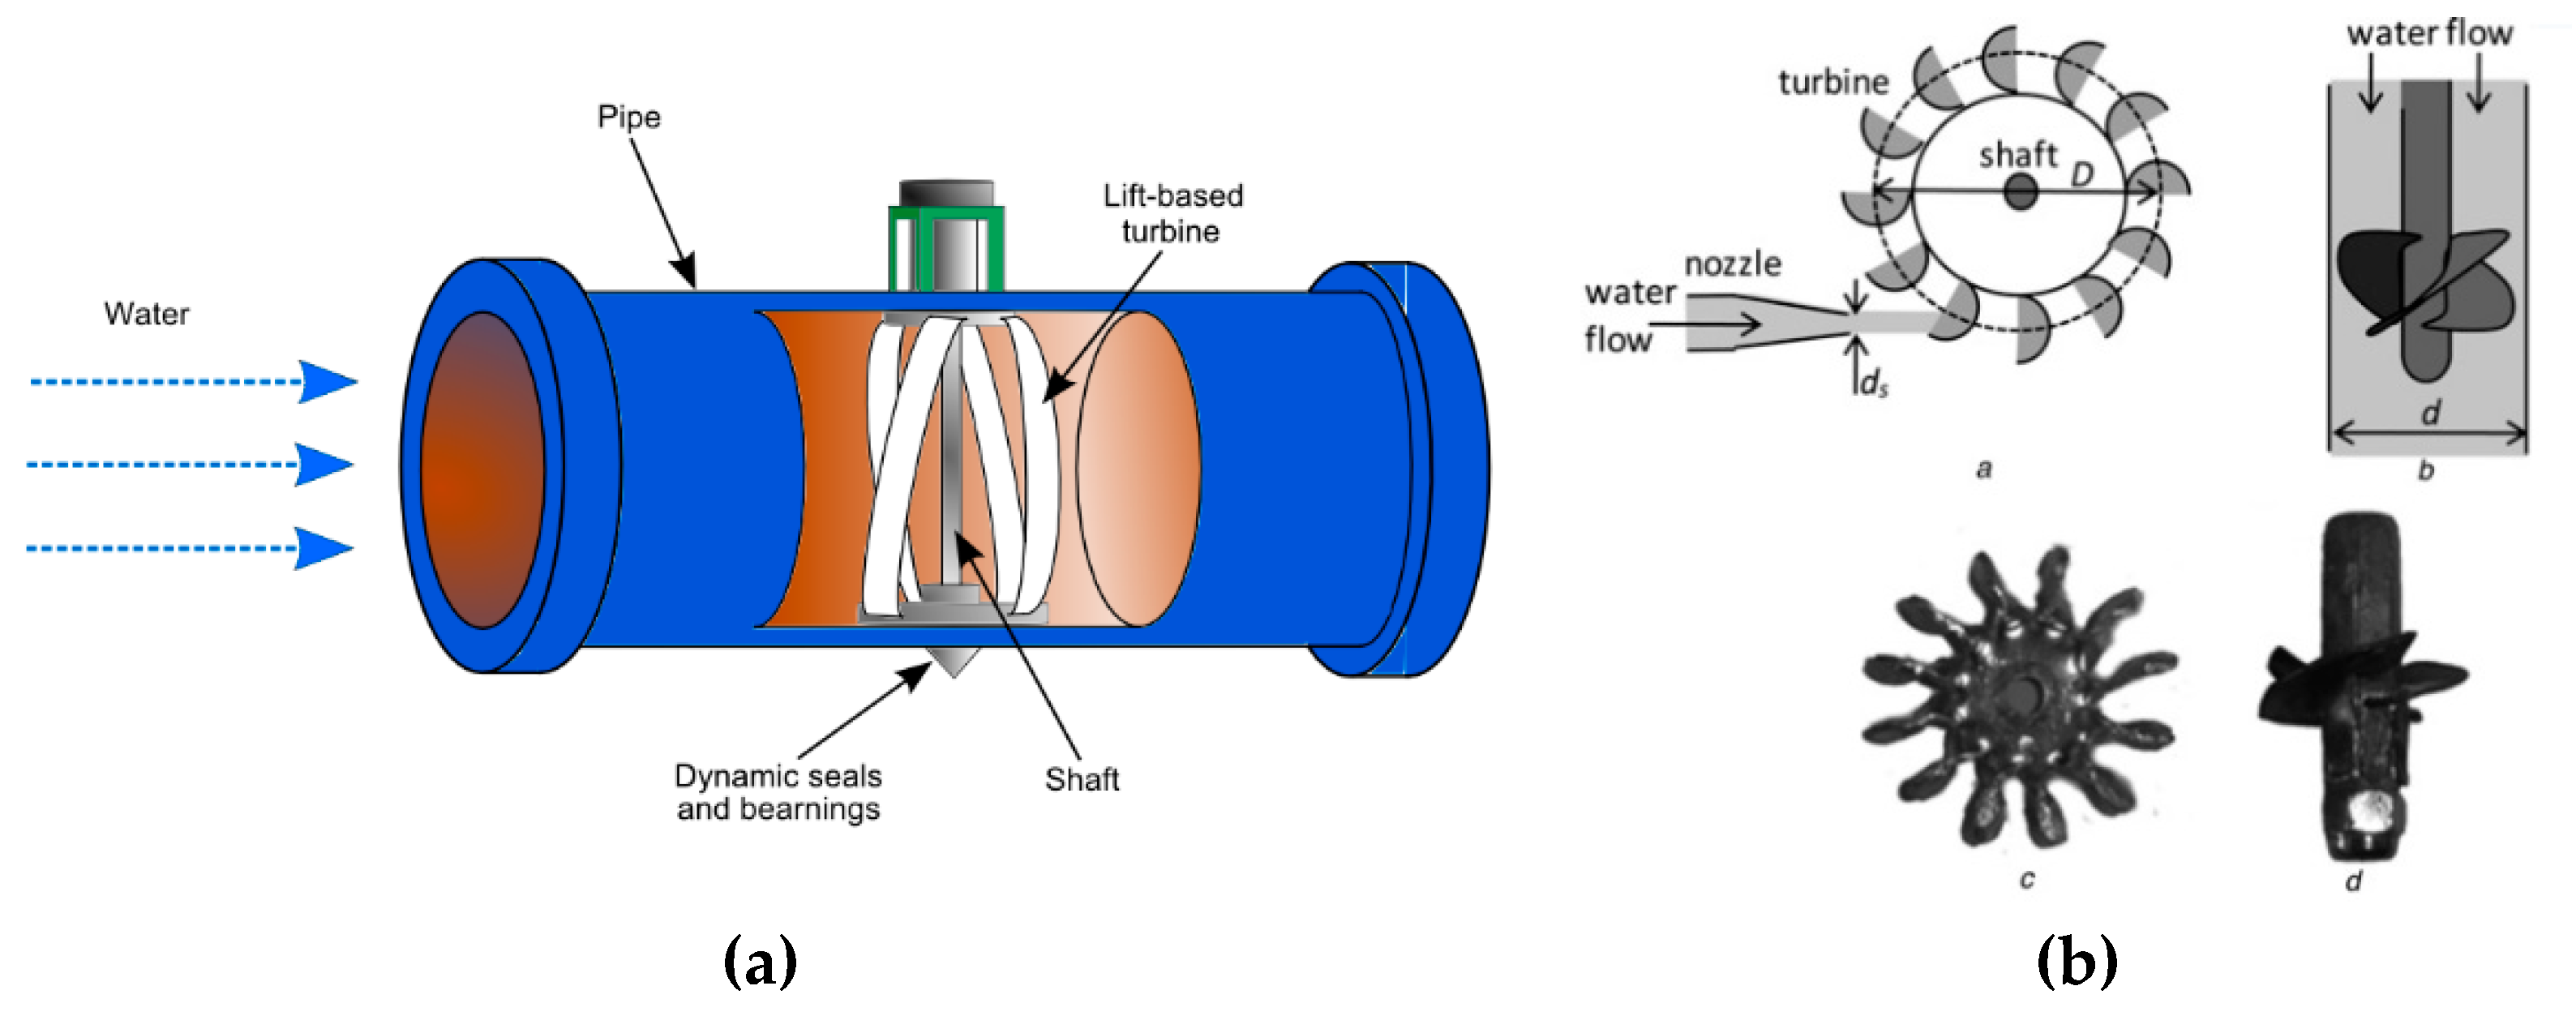
7.2. Water Flow Harvester’s Technology and Devices

The main difference between water flow and wind flow harvesters is the energy source. The operation principles of physics change from aerodynamics to hydraulics, because the flowing water has kinetic energy due to the water pressure fluctuation. This kind of harvester converts hydraulic kinetic energy into electrical energy by mechanic and electromagnetic conversions.
Water flow environments offer a high potential for energy harvesting. However, small-scale water harvesters are not common because their mechanical complexity. Figure 23a,b shows two architectures of water flow harvesters. Both are commonly used to produce electric energy in water fall and damps, i.e., at a large scale, but they are harder to implement on a smaller scale due to mechanical restraints.
Energy generation in large-scale water flow systems usually use either Pelton or propeller turbines. Pelton turbines are more efficient for high heads and low-water flows, and propeller turbines for low heads. Therefore, the available power is proportional to the product of the flow rate with the head. Equation (44) shows the available power of a hydraulic system.
P T = ρ g Q H
where ρ is the water density, g is the gravity acceleration, Q is the flow rate, and H is the effective height. Thus, the theoretical velocity is Equation (45).
v 1 = 2 g H
The flow rate is given by Equation (46).
Q = A v 1 = π d s 2 4 v 1
where A is the cross-sectional area, ds is the diameter and v1 is the maximum peripheral speed.
Reference [30] describes a water flow harvester aiming for harvesting application of reduced dimensions. The rotor proposed is a permanent magnetic ring with a diameter of 20 mm and a height of 5 mm, and the stator has a built in three-phase generator of nine coils with a maximum diameter of 5 mm. The harvester presented is then compared with other types of turbine for different water flow velocities. Table 12 shows the results achieved.
One of the applications of water flow energy harvesters is monitoring the water quality and hydraulic state of water distribution systems or rivers.

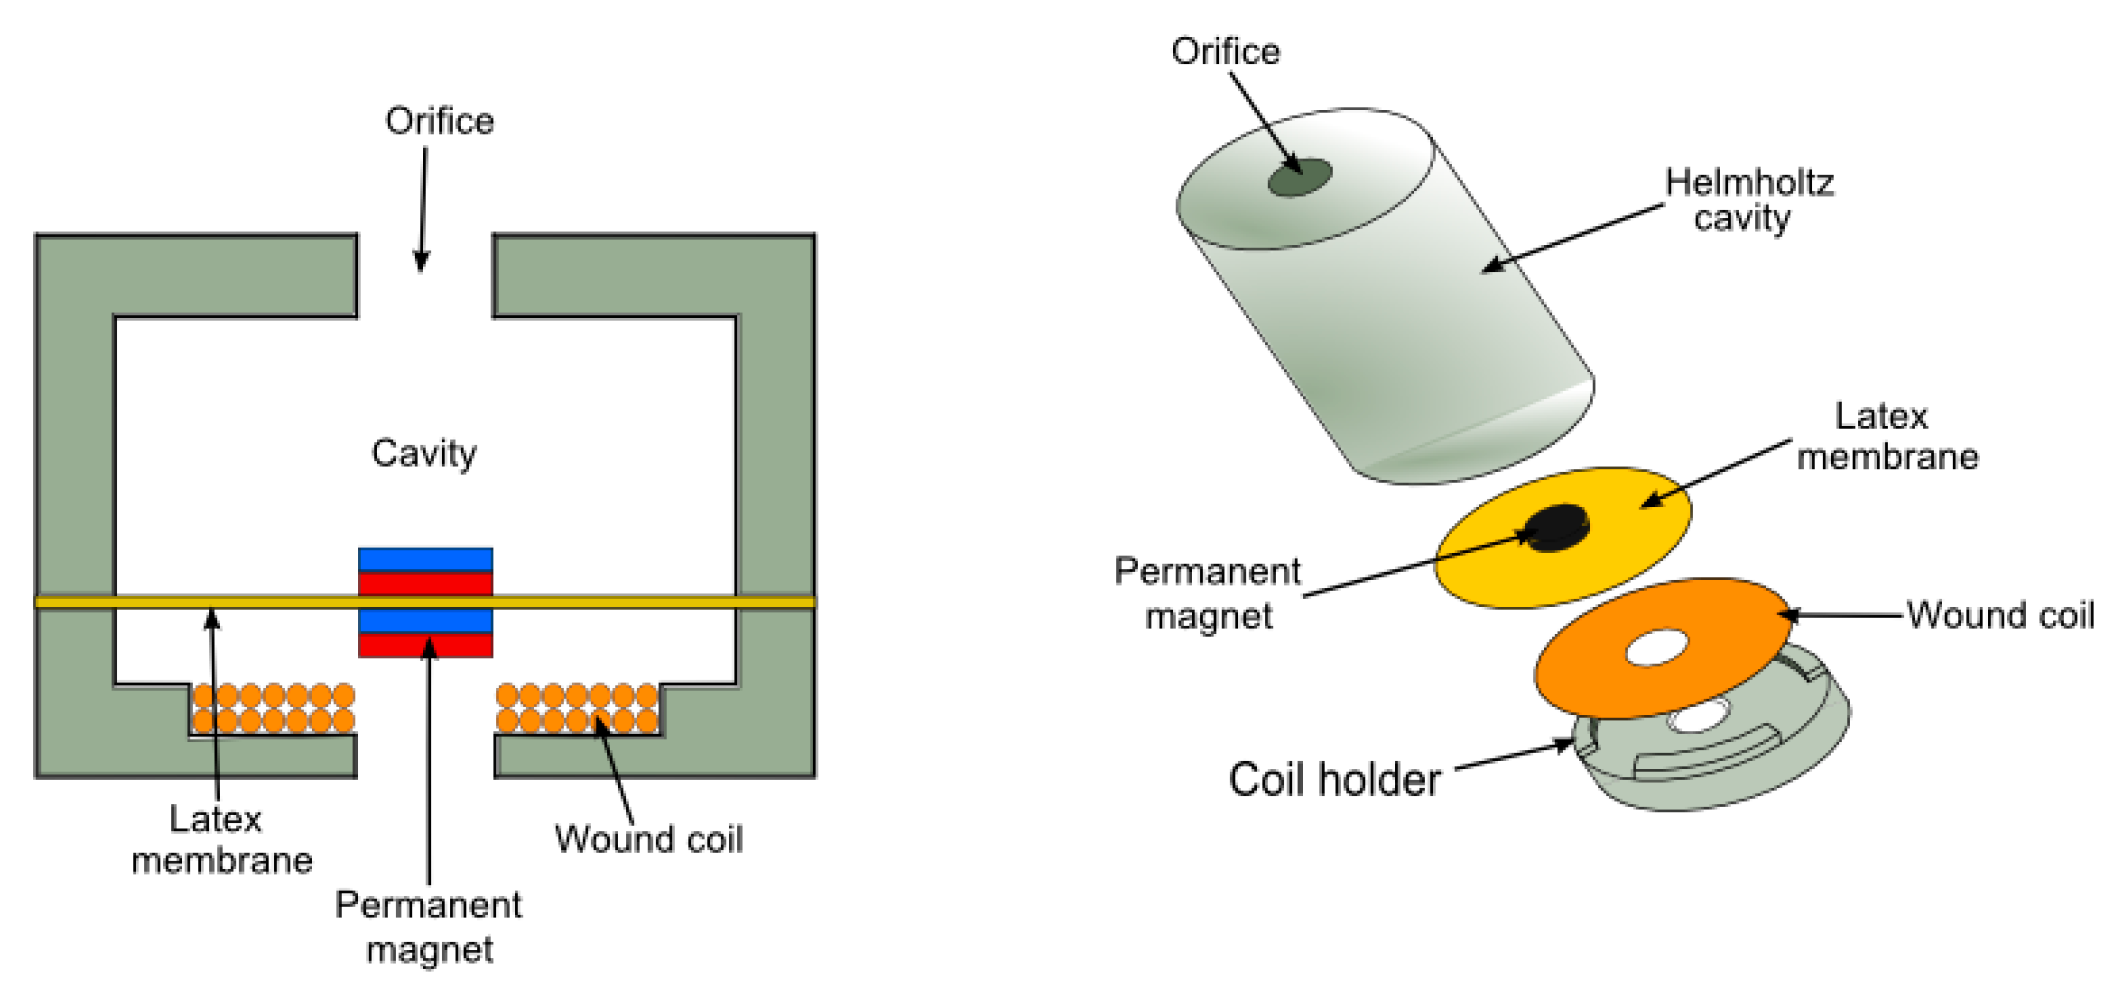
8. Acoustic Noise Harvester’s Technology and Devices

Energy harvesting from sound is a relatively new technology [31,111,112,113,114,115,116,117,118]. Acoustic noise is one of the most common pollution sources in cities, therefore it can be used as a source of energy to power electric devices with low consumption. Table 13 [111] shows some sources of acoustic noise and their intensity.
Air and material permittivity are the parameters which affect the propagation of electromagnetic waves. However, in the acoustic wave’s case, systems are dependent on mass density ρ and the bulk modulus of the medium, B. The refractive index of the medium, n, for acoustic waves is given by Equation (47).
n = v 0 ρ B
where v0 is the speed of sound in the air. And the effective modulus of the system Beff is calculated with Equation (48).
B e f f = B o ( 1 F ω 0 2 ω 2 ω 0 2 ) 1
where B0 is the bulk modulus, ω the sound frequency, F the structural factor and ω0 the resonance frequency. The system frequency of the acoustic harvester depends on the structural factor, the resonance frequency, neck area, neck length, and the volume of the cell or acoustic tube. The resonance frequency of the system can be obtained with Equation (49).
ω 1 = ω 0 1 + F = v 0 S h l h 1 + h
When the acoustic signal comes and pressure varies, the membrane diaphragm moves in response to the changing force in the air. When the membrane starts moving, the magnet is also moved creating a variable electromagnetic field. The system inductors convert the electromagnetic field into electric energy, and a small voltage is produced across the load terminals.
Figure 24 shows the architecture of an acoustic harvester, a Helmholtz Resonator. In this harvester, the acoustic signal enters the harvester through the insertion orifice into the system cavity. The power generator is in the cavity and it is made of a hard-core magnet inserted into a thin elastic material membrane. The generator inductor is placed under the elastic membrane.
Usually, acoustic signals are of low power, therefore, the harvester construction must bear in mind the availability of a suitable movement even with low-pressure variations. Another consideration is that the membrane does not vibrate evenly due to changes of the noise level during the system operation. This modifies the oscillation frequency of the membrane and decreases the system’s efficiency. The equivalent circuit for acoustic harvester is shown in Figure 25 [114].
The equivalent circuit has two parts, acoustic and electric. The transference of energy between the acoustic and the electric domain is modelled with a transformer, with a transduction ratio of Φ. On the primary side of the transformer there are, a mass MaN, a damper RaN, an acoustic cavity Cac, a lumped mass MaD, a compliance CaD and a radiation resistance. Their values represent the mechanical parameters of the harvester. On the secondary side, there are the electrical blocked capacitance CeB, the dielectric loss resistance ZeL and the load.
Table 14 [31] compares different types and acoustic harvesting technologies.

9. Conclusions

The research work presented in this article provides structural electrical models for different state of the art energy harvesting technologies. The aforementioned models allow conversion of the physical parameters of the harvesters into electronic components, thus helping the specification, scaling and design of power supply sources for electronic systems to provide the energy they require, to improve their efficiency, and at the same time, to reduce their environmental footprint.
The complete harvest modeling requires the addition of a storage system (batteries or capacitors), a power supply converter architecture (AC-DC or DC-DC) and a control system that manages and correlates the energy availability statistics over time, and the electronic load consumption patterns of the target application [119]. Those systems must be adapted to the energy and voltage waveform that each specific harvester technology provides, therefore it requires an ad hoc research of each block that constitutes a complete energy harvester.

Funding

This research received no external funding.

Acknowledgments

This work has been supported by IK4-TEKNIKER research institute own funds and the joint work of Electronics and Communications and Intelligent Information System units and by the Department of Education of the Basque Government within the fund for research groups of the Basque university system IT978-16.

Conflicts of Interest

On behalf of all authors, the corresponding author states that there is no conflict of interest.

References

  1. Walker, C. Surpassing The Limits of Battery Technology. 2016. Available online: https://chemical-materials.elsevier.com/chemical-manufacturing-excellence/surpassing-limits-battery-technology/ (accessed on 20 March 2019).
  2. Guardian, T. The Rise of Electric Cars Could Leave Us with a Big Battery Waste Problem. 10 August 2017. Available online: http://www.theguardian.com/sustainable-business/2017/aug/10/electric-cars-big-battery-waste-problem-lithium-recycling (accessed on 20 March 2019).
  3. Tollefson, J.; Reese, L. Understanding & Managing the Plethora of MCU Low-Power Modes. 2017. Available online: http://www.mouser.es/applications/low-power-ewc-low-power/. (accessed on 20 March 2019).
  4. Woias, P. Energy Harvesting, Courses in Microtec and Nanotec; FSRM – Swiss Foundation for Research in Microtechnology: Zurich, Switcherland, February 2016. [Google Scholar]
  5. Zorzi, M.; Gluhak, A.; Lange, S.; Bassi, A. From today’s INTRAnet of things to a future INTERnet of things: A wireless- and mobility-related view. IEEE Wirel. Commun. 2010, 17, 44–51. [Google Scholar] [CrossRef]
  6. Clifford, G. Energy Harvesting: How We’ll Build the Internet of Perpetual Things, Jabil, [Online]. Available online: https://www.jabil.com/content/dam/insights/white-papers/en/energy-harvesting-how-we-will-build-the-internet-of-perpetual-things (accessed on 20 March 2019).
  7. Webster, J.G.; Eren, H. Measurement, Instrumentation, and Sensors Handbook: Spatial, Mechanical, Thermal, and Radiation Measurement, 2nd ed.; CRC Press: Boca Raton, FL, USA, 2014. [Google Scholar]
  8. Tan, Y.K.; Panda, S.K. Review of Energy Harvesting Technologies for Sustainable Wireless Sensor Network (WSN). December 2010. Available online: https://www.intechopen.com/books/sustainable-wireless-sensor-networks/review-of-energy-harvesting-technologies-for-sustainable-wsn (accessed on 20 March 2019).
  9. Priya, S.; Inman, D.J. Energy Harvesting Technologies; Springer: Berlin/Heidelberg, Germany, 2009. [Google Scholar]
  10. Kazmierski, T.J.B.S. Energy Harvesting Systems: Principles, Modeling and Applications; Springer: Berlin/Heidelberg, Germany, 2011. [Google Scholar]
  11. Elvin, N.; Ertuk, A. Advances in Energy Harvesting Methods; Springer: New York, NY, USA, 2013. [Google Scholar]
  12. Spies, P.; Pollak, M.; Mateu, L. Handbook of Energy Harvesting Power Supplies and Applications; Pan Stanford Publishing: Singapore, 2015. [Google Scholar]
  13. Selvan, K.V.; Ali, M.S.M. Micro-scale energy harvesting devices: Review of methodological performances in the last decade. Renew. Sustain. Energy Rev. 2016, 54, 1035–1047. [Google Scholar] [CrossRef]
  14. Zhou, M.; Al-Furjan, M.S.H.; Zou, J.; Liu, W. Review on heat and mechanical energy harvesting from human—Principles, prototypes and perspectives. Renew. Sustain. Energy Rev. 2018, 82, 3582–3609. [Google Scholar] [CrossRef]
  15. Akbari, S. Energy Harvesting for Wireless Sensor Networks Review. In Proceedings of the 2014 Federated Conference on Computer Science and Information Systems, Warsaw, Poland, 7–10 September 2014; Volume 2, pp. 987–992. [Google Scholar]
  16. Seah, W.K.; Eu, Z.A.; Tan, H.-P. Wireless sensor networks powered by ambient energy harvesting (WSN-HEAP)—Survey and challenges. In Proceedings of the 1st International Conference on Wireless Communication, Vehicular Technology, Information Theory and Aerospace & Electronic Systems Technology, Aalborg, Denmark, 17–20 May 2009; pp. 1–5. [Google Scholar]
  17. Zhou, G.; Huang, L.; Li, W.; Zhu, Z. Harvesting ambient environmental energy for wireless sensor networks: A survey. J. Sens. 2014, 2014, 815467. [Google Scholar] [CrossRef]
  18. Moghe, R.; Yang, Y.; Lambert, F.C.; Divan, D. A Scoping Study of Electric and Magnetic Field Energy Harvesting for Wireless Sensor Networks in Power System Applications Deepak Divan. In Proceedings of the 2009 IEEE Energy Conversion Congress and Exposition, San Jose, CA, USA, 20–24 September 2009; pp. 3550–3557. [Google Scholar]
  19. Gilbert, J.M.; Balouchi, F. Comparison of energy harvesting systems for wireless sensor networks. Int. J. Autom. Comput. 2008, 5, 334–347. [Google Scholar] [CrossRef]
  20. Mitcheson, P.D.; Yeatman, E.M.; Rao, G.K.; Holmes, A.S.; Green, T.C. Energy harvesting from human and machine motion for wireless electronic devices. Proc. IEEE 2008, 96, 1457–1486. [Google Scholar] [CrossRef]
  21. HY-Line and Enocean, Solar Cells ECS 300/310. Available online: https://www.hy-line.de/en/product/detail/cat334/energy-harvesting-1/ecs-300-310/ (accessed on 20 March 2019).
  22. Digikey, Piezoelectric Energy harvester V25W, Midé Technology Corporation. Available online: https://www.digikey.com/product-detail/en/V25W/V25W-ND/2402862 (accessed on 20 March 2019).
  23. Bouendeu, E.; Greiner, A.; Smith, P.; Korvink, J. An efficient low cost electromagnetic vibration harvester. In Proceedings of the PowerMEMS 2009 Porceedings, Washington, DC, USA, 1–4 December 2009. [Google Scholar]
  24. Boisseau, S.; Despesse, G.; Seddik, B.A. Electrostatic Conversion for Vibration Energy Harvesting. In Small-Scale Energy Harvesting; Intech: London, UK, 2012; pp. 1–39. [Google Scholar]
  25. Kruse, N. Pyroelectricity, Wikipedia. 2002. Available online: https://en.wikipedia.org/wiki/Pyroelectricity (accessed on 20 March 2019).
  26. Cui_inc, Peltier Module CP85-2 Series. 2016. Available online: https://www.cui.com/product/thermal-management/peltier-devices/multi-stage-peltier-modules/cp85-2-series (accessed on 20 March 2019).
  27. Sordiashie, E. Electromagnetic Harvesting to Power Energy Management Sensors in the Built Environment. 2012. Available online: https://digitalcommons.unl.edu/cgi/viewcontent.cgi?article=1018&context=archengdiss (accessed on 20 March 2019).
  28. Digikey, WRM483245-15F5-5V-G. TDK Corporation. Available online: https://www.digikey.com/product-detail/es/tdk-corporation/WRM483245-15F5-5V-G/445-16097-ND/4702663 (accessed on 20 March 2019).
  29. Howey, D.A.; Bansal, A.; Holmes, A. Design and performance of a centimetre-scale shrouded wind turbine for energy harvesting. Smart Mater. Struct. 2011, 20, 1–12. [Google Scholar] [CrossRef]
  30. Azevedo, J.A.R.; Santos, F.E.S. Energy harvesting from wind and water for autonomous wireless sensor nodes. IET Circuits Devices Syst. 2012, 6, 413–420. [Google Scholar] [CrossRef]
  31. Khan, F.U.; Izhar, E. Acoustic-Based Electrodynamic Energy Harvester for Wireless Sensor Nodes Application. Int. J. Mater. Sci. Eng. 2013, 1, 72–78. [Google Scholar] [CrossRef]
  32. Matiko, J.W.; Grabham, N.J.; Beeby, S.P.; Tudor, M.J. Review of the application of energy harvesting in buildings. Meas. Sci. Technol. 2014, 25, 1–25. [Google Scholar] [CrossRef]
  33. Tan, Y.K.; Panda, S.K. Energy Harvesting From Hybrid Indoor Ambient Light and Thermal Energy Sources for Enhanced Performance of Wireless Sensor Nodes. IEEE Trans. Ind. Electron. 2011, 58, 4424–4435. [Google Scholar] [CrossRef]
  34. Visconti, P.; Primiceri, P.; Ferri, R.; Pucciarelli, M.; Venere, E. An Overview on State-of-art Energy Harvesting Techniques and Choice Criteria: A WSN Node for Goods Transport and Storage Powered by a Smart Solar- based EH System. Int. J. Renew. Energy Res. 2017, 7, 1281–1295. [Google Scholar]
  35. Beeby, S.; White, N. Energy Harvesting for Autonomous Systems; Artech House: Norwood, MA, USA, 2010. [Google Scholar]
  36. Randall, J.; Bharatula, N.B.; Perera, N.; von Büren, T.; Ossevoort, S.; Tröster, G. Indoor Tracking using Solar Cell Powered System: Interpolation of Irradiance. In Proceedings of the Sixth International Conference on Ubiquitous Computing (Ubicomp 2004), Nottinghan, UK, 7–10 September 2004. [Google Scholar]
  37. Mathews, I.; Kelly, G.; King, P.J.; Frizzell, R. GaAs solar cells for Indoor Light Harvesting. In Proceedings of the 2014 IEEE 40th Photovoltaic Specialist Conference (PVSC), Denver, CO, USA, 8–13 June 2014; pp. 510–513. [Google Scholar]
  38. Nasiri, A.; Zabalawi, S.A.; Mandic, G. Indoor Power Harvesting Using Photovoltaic Cells for Low-Power Applications. IEEE Trans. Ind. Electron. 2009, 56, 4502–4509. [Google Scholar] [CrossRef]
  39. Harrison, K.H.L.; Wu, J.; Jérémy, B.; Jain, S.M.; Wood, S.; Speller, E.M.; Li, Z.; Castro, F.A.; Durrantab, J.R.; Tso, W.C. Organic photovoltaic cells—Promising indoor light harvesters for self-sustainable electronics. J. Mater. Chem. A 2018, 14, 5618–5626. [Google Scholar]
  40. Mathews, I.; King, P.J.; Stafford, F.; Frizzell, R. Performance of III–V Solar Cells as Indoor. IEEE J. Photovolt. 2016, 6, 230–235. [Google Scholar] [CrossRef]
  41. Hsu, T.-W.M.; Wu, H.-H.; Tsai, D.-L.; Wei, C.-L. Photovoltaic Energy Harvester With Fractional Open-Circuit Voltage Based Maximum Power Point Tracking Circuit. IEEE Trans. Circuits Syst. II Express Briefs 2019, 22, 257–261. [Google Scholar] [CrossRef]
  42. Aoki, Y. Photovoltaic performance of Organic Photovoltaics for indoor energy harvester. Org. Electron. 2017, 48, 194–197. [Google Scholar] [CrossRef]
  43. Richter, C.; Lincot, D.; Gueymard, C.A. Solar Energy; Springer: Berlin/Heidelberg, Germany, 2013. [Google Scholar]
  44. Research Cell Efficiency Records. Solar Energy Technolgies Office, September 2015. Available online: www.energy.gov/eere/solar/downloads/research-cell-efficiency-records (accessed on 20 March 2019).
  45. Chirap, A.; Popa, V.; Coca, E.; Potorac, D.A. A study on light energy harvesting from indoor environment: The autonomous sensor nodes. In Proceedings of the 12th International Conference on Development and Application Systems, Suceava, Romania, 15–17 May 2014; pp. 127–131. [Google Scholar]
  46. Priya, S.; Son, H.-C.; Zhou, Y.; Varghese, R.; Chopra, A.; Kim, S.-G.; Kanno, I.; Wu, L.; Ha, D.S.; Ryu, J.; Polcawich, R.G. A Review on Piezoelectric Energy Harvesting: Materials, Methods, and Circuits. Energy Harvest. Syst. 2017, 4, 3–39. [Google Scholar] [CrossRef]
  47. Shu, Y.C.; Lien, I.C. Analysis of power output for piezoelectric energy harvesting systems. Smart Mater. Struct. 2006, 15, 1499–1512. [Google Scholar] [CrossRef]
  48. Harne, R.L.; Wang, K.W. A review of the recent research on vibration energy harvesting via bistable systems. Smart Mater. Struct. 2013, 22, 1–12. [Google Scholar] [CrossRef]
  49. Khaligh, A.; Zeng, P.; Zheng, C. Kinetic Energy Harvesting Using Piezoelectric and Electromagnetic Technologies—State of the Art. IEEE Trans. Ind. Electron. 2010, 57, 850–860. [Google Scholar] [CrossRef]
  50. Briscoe, J.; Dunn, S. Piezoelectric nanogenerators—A review of nanostructured piezoelectric energy harvesters. Nano Energy 2015, 14, 15–29. [Google Scholar] [CrossRef]
  51. Hwang, G.-T.; Byun, M.; Jeong, C.K.; Lee, K.J. Flexible Piezoelectric Thin-Film Energy Harvesters and Nanosensors for Biomedical Applications. Adv. Healthc. Mater. 2015, 4, 646–658. [Google Scholar] [CrossRef]
  52. Madinei, H.; Khodaparast, H.H.; Adhikari, S.; Friswell, M. Design of MEMS piezoelectric harvesters with electrostatically adjustable resonance frequency. Mech. Syst. Signal Process. 2016, 81, 360–374. [Google Scholar] [CrossRef]
  53. Rincón-Mora, G.A.; Yang, S. Tiny Piezoelectric Harvesters: Principles, Constraints, and Power Conversion. IEEE Trans. Circuits Syst. I Regul. Pap. 2016, 63, 639–649. [Google Scholar] [CrossRef]
  54. Cadei, A.; Dionisi, A.; Sardini, E.; Serpelloni, M. Kinetic and thermal energy harvesters for implantable medical devices and biomedical autonomous sensors. Meas. Sci. Technol. 2013, 25, 1–14. [Google Scholar] [CrossRef]
  55. Marioli, D.; Sardini, E.; Serpelloni, M. Electromagnetic Generators Employing Planar Inductors for Autonomous Sensor Applications. Procedia Chem. 2009, 1, 469–472. [Google Scholar] [CrossRef]
  56. Beeby, S.; Torah, R.N.; Tudor, M.J.; Glynne-Jones, P.; O’Donnell, T.; Saha, C.; Roy, S. A micro electromagnetic generator for vibration energy harvesting. J. Micromech. Microeng. 2007, 17, 1257–1265. [Google Scholar] [CrossRef]
  57. Leung, C.M.; Li, J.; Viehland, D.Z. A review on applications of magnetoelectric composites: From heterostructural uncooled magnetic sensors, energy harvesters to highly efficient power converters. J. Phys. D Appl. Phys. 2018, 51, 1–20. [Google Scholar] [CrossRef]
  58. Song, H.-C.; Kumar, P.; Sriramdas, R.; Lee, H.; Sharpes, N.; Kang, M.-G.; Maurya, D.; Sanghadasa, M.; Kang, H.-W.; Ryu, J.; et al. Broadband dual phase energy harvester: Vibration and magnetic field. Appl. Energy 2018, 225, 1132–1142. [Google Scholar] [CrossRef]
  59. Wang, W.; Cao, J.; Zhang, N.; Lin, J.; Liao, W.-H. Magnetic-spring based energy harvesting from human motions: Design, modeling and experiments. Energy Convers. Manag. 2017, 132, 189–197. [Google Scholar] [CrossRef]
  60. Electrical Resistivity and Conductivity, Wikipedia. Available online: https://en.wikipedia.org/wiki/Electrical_resistivity_and_conductivity (accessed on 20 March 2019).
  61. Le, C.P.; Halvorsen, E.; Søråsen, O.; Yeatman, E.M. Wideband excitation of an electrostatic vibration energy harvester with power-extracting end-stops. Smart Mater. Struct. 2013, 22, 1–9. [Google Scholar] [CrossRef]
  62. Deterre, M.; Risquez, S.; Bouthaud, B.; Molin, R.D.; Woytasik, M.; Lefeuvre, E. Multilayer out-of-plane overlap electrostatic energy harvesting structure actuated by blood pressure for powering intra-cardiac implants. J. Phys. Conf. Ser. 2013, 476, 1–5. [Google Scholar] [CrossRef]
  63. Naruse, Y.; Matsubara, N.; Mabuchi, K.; Izumi, M.; Suzuki, S. Electrostatic micro power generation from low-frequency vibration such as human motion. J. Micromech. Microeng. 2009, 19, 1–5. [Google Scholar] [CrossRef]
  64. Ahmed, S.; Kakkar, V. An Electret-Based Angular Electrostatic Energy Harvester for Battery-Less Cardiac and Neural Implants. IEEE Access 2017, 5, 19631–19643. [Google Scholar] [CrossRef]
  65. Khan, F.U.; Qadir, M.U. State-of-the-art in vibration-based electrostatic energy harvesting. J. Micromech. Microeng. 2016, 26, 1–28. [Google Scholar] [CrossRef]
  66. Zhang, Y.; Wang, T.; Luo, A.; Hu, Y.; Li, X.; Wang, F. Micro electrostatic energy harvester with both broad bandwidth and high normalized power density. Appl. Energy 2018, 212, 362–371. [Google Scholar] [CrossRef]
  67. Cuadras, A.; Gasulla, M.; Ferrari, V. Thermal energy harvesting through pyroelectricity. Sens. Actuators A Phys. 2010, 158, 132–139. [Google Scholar] [CrossRef]
  68. Lee, F.Y.; Navid, A.; Pilon, L. Pyroelectric waste heat energy harvesting using heat conduction. Appl. Therm. Eng. 2012, 37, 30–37. [Google Scholar] [CrossRef]
  69. Ravindran, S.; Kroener, M.; Woias, P. A standalone pyroelectric harvester for thermal energy harvesting. In Proceedings of the Power MEMS, Atlanta, GA, USA, 2–5 December 2012; pp. 80–83. [Google Scholar]
  70. Xie, M.; Zabek, D.; Bowen, C.; Abdelmageed, M.; Arafa, M. Wind-driven pyroelectric energy harvesting device. Smart Mater. Struct. 2016, 25, 1–8. [Google Scholar] [CrossRef]
  71. Siao, A.-S.; Chao, C.-K.; Hsiao, C.-C. Study on Pyroelectric Harvesters with Various Geometry. Sensors 2015, 15, 19633–19648. [Google Scholar] [CrossRef]
  72. Hsiao, C.-C.; Jhang, J.-W. Pyroelectric Harvesters for Generating Cyclic Energy. Energies 2015, 8, 3489–3502. [Google Scholar] [CrossRef]
  73. Leonov, V. Thermoelectric energy harvester on the heated human machine. J. Micromech. Microeng. 2011, 21, 1–8. [Google Scholar] [CrossRef]
  74. Li, S.; Yao, X.; Fu, J. Research on a power management system for thermoelectric generators to drive wireless sensors on a spindle unit. Sensors 2014, 14, 12701–12714. [Google Scholar] [CrossRef]
  75. Kiziroglou, M.E.; Wright, S.W.; Toh, T.T.; Mitcheson, P.D.; Becker, T.; Yeatman, E.M. Design and Fabrication of Heat Storage Thermoelectric Harvesting Devices. IEEE Trans. Ind. Electron. 2014, 61, 302–309. [Google Scholar] [CrossRef]
  76. Champier, D. Thermoelectric generators: A review of applications. Energy Convers. Manag. 2017, 140, 167–181. [Google Scholar] [CrossRef]
  77. Ito, M.; Koizumi, T.; Kojima, H.; Saito, T. From materials to device design of a thermoelectric fabric for wearable energy harvesters. J. Mater. Chem. A 2017, 5, 12068–12072. [Google Scholar] [CrossRef]
  78. Kiziroglou, M.E.; Becker, T.; Wright, S.W.; Yeatman, E.M.; Evans, J.W.; Wright, P.K. Three-Dimensional Printed Insulation For Dynamic Thermoelectric Harvesters With Encapsulated Phase Change Materials. IEEE Sens. Lett. 2017, 1, 1–4. [Google Scholar] [CrossRef]
  79. Koukharenko, E.; Boden, S.A.; Sessions, N.P.; Frety, N.; Nandhakumar, I.; White, N.M. Towards thermoelectric nanostructured energy harvester for wearable applications. J. Mater. Sci. Mater. Electron. 2018, 29, 3423–3436. [Google Scholar] [CrossRef]
  80. Moghe, R.; Divan, D.; Lambert, F. Powering Low-Cost Utility Sensors using Energy Harvesting. In Proceedings of the 2011 14th European Conference on Power Electronics and Applications, Birmingham, UK, 30 August–1 September 2011; pp. 1–10. [Google Scholar]
  81. Roscoe, N.M.; Judd, M.D. Harvesting Energy from Magnetic Fields to Power Condition Monitoring Sensors. IEEE Sens. J. 2013, 13, 2263–2270. [Google Scholar] [CrossRef]
  82. Taithongchai, T.; Leelarasmee, E. Adaptive electromagnetic energy harvesting circuit for wireless sensor application. In Proceedings of the 6th International Conference on Electrical Engineering/Electronics, Computer, Telecommunications and Information Technology, Pattaya, Thailand, 6–9 May 2009; pp. 278–281. [Google Scholar]
  83. Moon, J.; Leeb, S.B. Analysis Model for Magnetic Energy Harvesters. IEEE Trans. Power Electron. 2015, 30, 4302–4311. [Google Scholar] [CrossRef]
  84. Hosseinimehr, T.; Tabesh, A. Magnetic Field Energy Harvesting from AC Lines for Powering Wireless Sensor Nodes in Smart Grids. IEEE Trans. Ind. Electron. 2016, 63, 4947–4954. [Google Scholar] [CrossRef]
  85. Moon, J.; Leeb, S.B. Power Electronic Circuits for Magnetic Energy Harvesters. IEEE Trans. Power Electron. 2016, 31, 270–279. [Google Scholar] [CrossRef]
  86. Tashiro, K.; Wakiwaka, H.; Inoue, S.-I.; Uchiyama, Y. Energy Harvesting of Magnetic Power-Line Noise. IEEE Trans. Magn. 2011, 47, 4441–4444. [Google Scholar] [CrossRef]
  87. Lu, X.; Wang, P.; Niyato, D.; Kim, D.I.; Han, Z. Wireless Networks with RF Energy Harvesting: A Contemporary Survey. IEEE Commun. Surv. Tutor. 2014, 17, 757–789. [Google Scholar] [CrossRef]
  88. Talla, V.; Pellerano, S.; Xu, H.; Ravi, A.; Palaskas, Y. Wi-Fi RF energy harvesting for battery-free wearable radio platforms. In Proceedings of the 2015 IEEE International Conference on RFID (RFID), San Diego, CA, USA, 15–17 April 2015; pp. 47–54. [Google Scholar]
  89. Sim, Z.W. Radio Frequency Energy Harvesting for Embedded Sensor Networks in the Natural Environment. Master’s Thesis, Electrical and Electronic Engineering, The University of Manchester, Manchester, UK, 2012. [Google Scholar]
  90. Fadel, L.; Oyhenart, L.; Bergès, R.; Vigneras, V.; Taris, T. A concurrent 915/2440 MHz RF energy harvester. Int. J. Microw. Wirel. Technol. 2016, 8, 405–413. [Google Scholar] [CrossRef]
  91. Sun, M.; Abbott, D.; Al-Sarawi, S.F. A Fully Integrable RF Energy Harvester with Dynamic Efficiency Tuning. In Proceedings of the 2017 International SoC Design Conference (ISOCC 2017), Seoul, Korea, 5–8 November 2017. [Google Scholar]
  92. Clerckx, B.; Zhang, R.; Schober, R.; Ng, D.W.K.; Kim, D.I.; Poor, H.V. Fundamentals of Wireless Information and Power Transfer: From RF Energy Harvester Models to Signal and System Designs. IEEE J. Sel. Areas Commun. 2019, 37, 4–33. [Google Scholar] [CrossRef]
  93. Kuhn, V.; Lahuec, C.; Seguin, F.; Person, C. A Multi-Band Stacked RF Energy Harvester With RF-to-DC Efficiency Up to 84%. IEEE Trans. Microw. Theory Tech. 2015, 63, 1768–1778. [Google Scholar] [CrossRef]
  94. Wu, X.; Lee, D.-W. An electromagnetic energy harvesting device based on high efficiency windmill structure for wireless forest fire monitoring application. Sens. Actuators A Phys. 2014, 219, 73–79. [Google Scholar] [CrossRef]
  95. Ramasur, D.; Hancke, G.P. A wind energy harvester for low power wireless sensor networks. In Proceedings of the 2012 IEEE International Instrumentation and Measurement Technology Conference Proceedings, Graz, Austria, 13–16 May 2012; pp. 2623–2627. [Google Scholar]
  96. Ahmad, T.J.; Arsalan, M.; Black, M.J.; Noui-Mehidi, M.N. Harvesting Energy From Fluid Flow. U.S. Patent 2018/0351480 A1, 6 December 2018. [Google Scholar]
  97. Hu, G.; Tse, K.; Wei, M.; Naseer, R.; Abdelkefi, A.; Kwok, K. Experimental investigation on the efficiency of circular cylinder-based wind energy harvester with different rod-shaped attachments. Appl. Energy 2018, 226, 682–689. [Google Scholar] [CrossRef]
  98. Du, L.; Fang, Z.; Yan, J.; Zhao, Z. Enabling a wind energy harvester based on ZnO thin film as the building skin. Sens. Actuators A Phys. 2017, 260, 35–44. [Google Scholar] [CrossRef]
  99. Hoffmann, D.; Willmann, A.; Göpfert, R.; Becker, P.; Folkmer, B.; Manoli, Y. Energy Harvesting from Fluid Flow in Water Pipelines for Smart Metering Applications. J. Phys. Conf. Ser. 2013, 476, 1–5. [Google Scholar] [CrossRef]
  100. Hardik, P.; Sanat, D. Performance Prediction of Horizontal Axis Wind Turbine Blade. Int. J. Innov. Res. Sci. Eng. Technol. 2013, 2, 1401–1406. [Google Scholar]
  101. Shan, X.; Song, R.; Fan, M.; Xie, T. Energy-Harvesting Performances of Two Tandem Piezoelectric Energy Harvesters with Cylinders in Water. Appl. Sci. 2016, 6, 230. [Google Scholar] [CrossRef]
  102. Xu, F.; Yuan, F.-G.; Liu, L.; Hu, J.; Qiu, Y. Performance Prediction and Demonstration of a Miniature Horizontal Axis Wind Turbine. J. Energy Eng. 2013, 139, 143–152. [Google Scholar] [CrossRef]
  103. Ibrahim, B.K. Utilization of wind energy in space heating and cooling with hybrid HVAC systems and heat pumps. Energy Build. 1999, 30, 147–153. [Google Scholar]
  104. Heier, S. Grid Integration of Wind Energy Conversion Systems; Wiley: Hoboken, NJ, USA, 1998. [Google Scholar]
  105. Calderaro, V.; Galdi, V.; Piccolo, A.; Siano, P. A fuzzy controller for maximum energy extraction from variable speed wind power generation systems. Electr. Power Syst. Res. 2008, 78, 1109–1118. [Google Scholar] [CrossRef]
  106. Sengupta, A.; Verma, M.P. An Analytical expression for the power coefficient of an ideal horizontal-axis wind turbine. Int. J. Energy Res. 1992, 16, 453–455. [Google Scholar] [CrossRef]
  107. Slootweg, J.G.; Polinder, H.; Kling, W.L. Representing wind turbine electrical generating systems in fundamental frequency simulations. IEEE Trans. Energy Convers. 2003, 18, 516–524. [Google Scholar] [CrossRef]
  108. Borowy, B.; Salameh, Z. Optimum photovoltaic array size for a hybrid wind/PV system. IEEE Trans. Energy Convers. 1994, 9, 482–488. [Google Scholar] [CrossRef]
  109. Borowy, B.S.; Salameh, Z.M. Methodology for Optimally Sizing the Combination of a Battery Bank and PV Array in a Wind/PV Hybrid System. IEEE Trans. Energy Convers. 1996, 11, 367–375. [Google Scholar] [CrossRef]
  110. Abdulmunam, R.T.; Taha, L.; Ivey, P.C. Modeling of Low Power Electrostatic Wind Energy Harvester for Macro-Scale Applications. Int. J. Inf. Electron. Eng. 2012, 2, 912–917. [Google Scholar]
  111. Bhat, R. Acoustic Energy Harvesting. Int. J. Sci. Res. 2014, 3, 1354–1359. [Google Scholar]
  112. Park, C.M.; Lee, S.H. Propagation of acoustic waves in a metamaterial with a refractive index of near zero. Appl. Phys. Lett. 2013, 102, 1–4. [Google Scholar] [CrossRef]
  113. Peng, X.; Wen, Y.; Li, P.; Yang, A.; Bai, X. Enhanced Acoustoelectric Coupling in Acoustic Energy Harvester Using Dual Helmholtz Resonators. IEEE Trans. Ultrason. Ferroelectr. Freq. Control 2013, 60, 2121–2128. [Google Scholar] [CrossRef] [PubMed]
  114. Phipps, A.; Liu, F.; Cattafesta, L.; Sheplak, M.; Nishida, T. Demonstration of a wireless, self-powered, electroacoustic liner system. J. Acoust. Soc. Am. 2009, 125, 873–881. [Google Scholar] [CrossRef] [PubMed]
  115. Khan, F.U.; Izhar. State of the art in acoustic energy harvesting. J. Micromech. Microeng. 2015, 25, 1–13. [Google Scholar] [CrossRef]
  116. Wang, Y.; Zhu, X.; Zhang, T.; Bano, S.; Pan, H.; Qi, L.; Zhang, Z.; Yuan, Y. A renewable low-frequency acoustic energy harvesting noise barrier for high-speed railways using a Helmholtz resonator and a PVDF film. Appl. Energy 2018, 230, 52–61. [Google Scholar] [CrossRef]
  117. Yuan, M.; Cao, Z.; Luo, J.; Zhang, J.; Chang, C. An efficient low-frequency acoustic energy harvester. Sens. Actuators A Phys. 2017, 264, 84–89. [Google Scholar] [CrossRef]
  118. Zhou, Z.; Qin, W.; Zhu, P. Harvesting acoustic energy by coherence resonance of a bi-stable piezoelectric harvester. Energy 2017, 126, 527–534. [Google Scholar] [CrossRef]
  119. Pozo, B. Double Smart energy Harvesting System for Self-Powered Industrial IOT. Ph.D. Thesis, University of the Basque Country, Lejona, Spain, 2018. Available online: https://www.educacion.gob.es/teseo/mostrarRef.do?ref=444036 (accessed on 20 March 2019).
Figure 1. Energy harvesters’ technologies. (a) Photovoltaic; (b) Piezoelectic; (c) Electromagnetic; (d) Electrostatic; (e) Pyroelectric; (f) Thermoelectric; (g) Magnetic; (h) RF; (i) Wind flow; (j) Liquid flow; (k) Acoustic noise.
Electronics 08 00486 g001
Figure 2. Cell efficiencies research state.
Electronics 08 00486 g002
Figure 3. Photovoltaic harvester.
Electronics 08 00486 g003
Figure 4. Photovoltaic harvester equivalent circuit.
Electronics 08 00486 g004
Figure 5. Comparison of relative radiant spectra of sunlight vs. artificial light from incandescent bulbs and fluorescent lamps.
Electronics 08 00486 g005
Figure 6. Piezoelectric kinetic harvester.
Electronics 08 00486 g006
Figure 7. Quartz piezoelectric harvester equivalent circuit.
Electronics 08 00486 g007
Figure 8. Magnetic kinetic harvester.
Electronics 08 00486 g008
Figure 9. Equivalent circuit of an electromagnetic force harvester.
Electronics 08 00486 g009
Figure 10. Electrostatic kinetic harvester.
Electronics 08 00486 g010
Figure 11. Equivalent circuit of an electrostatic force harvester.
Electronics 08 00486 g011
Figure 12. Pyroelectric material operation modes as capacitor dielectric. (a) Pyroelectric free charges; (b) Steady state of the harvester; (c) Harvester being heated, current flowing; (d) Harvester being cooled, current flowing.
Electronics 08 00486 g012
Figure 13. Pyroelectric harvester.
Electronics 08 00486 g013
Figure 14. Pyroelectric harvester equivalent circuit.
Electronics 08 00486 g014
Figure 15. Thermoelectric harvester.
Electronics 08 00486 g015
Figure 16. Equivalent electro-thermal circuit of a thermoelectric energy harvesting device.
Electronics 08 00486 g016
Figure 17. Magnetic harvester.
Electronics 08 00486 g017
Figure 18. Equivalent circuit of a magnetic harvester with ideal impedance matching.
Electronics 08 00486 g018
Figure 19. RF harvester.
Electronics 08 00486 g019
Figure 20. The equivalent circuit of a RF harvester and an integrated rectifier.
Electronics 08 00486 g020
Figure 21. Micro-wind/water harvester equivalent circuit schematic.
Electronics 08 00486 g021
Figure 22. Micro wind harvester. (a) Micro wind harvester; (b) Wind harvester possible blades topologies.
Electronics 08 00486 g022
Figure 23. Examples of water flow harvester. (a) Water flows energy harvester; (b) Usual generators design.
Electronics 08 00486 g023
Figure 24. Acoustic noise harvester.
Electronics 08 00486 g024
Figure 25. Equivalent circuit of an acoustic harvester.
Electronics 08 00486 g025
Table 1. Current energy harvesters’ technologies’ characteristics summarized.
HarvesterPhysical/Chemical Operation ModePower DensityEfficiency (%)Mature/EmergingReferences
PhotovoltaicPhotovoltaic effectOutdoors: 15 mW/cm2
Indoors: 10–100 µW/cm2
Until 40Mature[17,32,33]
PiezoelectricPiezoelectric effect330 µW/cm3 shoes insertUntil 30Mature[17,18,32]
ElectromagneticFaraday’s lawHuman: 4 µW/cm3 @ kHz
Industrial: 306 µW/cm3 @ kHz
Until 67Mature[18,33]
ElectrostaticVibration-dependent capacitors50 µW/cm3 to 100 µW/cm39.5–23.6Emerging[17]
PyroelectricOlsen cycle3.5 µW/cm3 at the temperature
rate of 85 °C/s @ 0.11 Hz
1–3.5Emerging[32,34]
ThermoelectricSeebeck effectHuman: 100 µW/cm3
Industrial: 100 mW/cm3
10–15Mature[15,17,32]
MagneticAmpere, Maxwell, and Faraday laws1.8 mW/cm3 with 400 A
at 4 cm from conductor
0.1325Emerging[18]
RFUbiquitous radio transmittersGSM: 0.1 µW/cm2
WiFi: 0.01 µW/cm2
50–70Mature[15,34]
Wind and waterFaraday’s law1.16 mW/cm3 at the speed of 5 m/s
4.91 µW/cm3 at the speed of 3 L/s
0.61–17.6
1.7–29.5
Emerging in small scale[30,32,33]
AcousticHelmotz effect1.436 mW/cm2 at 123 dB0.012Emerging[31]
Table 2. Comparison of various solar cells types.
ClassificationEfficiencyAdvantageDisadvantage
Silicon solar cells
Mono-crystalline15–24%High conversion efficiency and reliabilityExpensive
Large silicon demand
Complexity of the production processes
Polysilicon, poly-Si15–20.4%Recession cannot be manufactured on substratesLarge silicon demand
Its cost is lower than monocrystalline onesExpensive and complex production process
Multi-junction solar cells
Cadmium sulphide (CdS)Up to 16%Low costRecycling of toxic admium
Suitable for mass production
Cadmiun telluride (CdTe)28%Absorption rate under strong lightUses tellurium a scarce natural resource
High conversion efficiencyExpensive process
Stable performanceRecycling of toxic cadmium
Gallium arsenide (GaAs)Up to 30%Absorption coefficient under strong lightExpensive process
High conversion efficiency
Endurance to high temperature
Copper indium gallium selenide (CIGS)Up to 20%Low costRequire rare earths
Good performance under dimmed light
Able to be deposit on a wide range of substrates
Adjustable optical band gap
Table 3. Comparison of various vibrational-harvesting technologies.
Piezoelectric DevicesElectromagnetic DevicesElectrostatic Devices
Advantages
-
high output voltages
-
high capacitances
-
no need to control
-
high output currents
-
long lifetime
-
robustness
-
high output voltages
-
low-cost systems
-
coupling coefficient easily adjustable
-
high coupling coefficients
-
size reduction increases capacitances
Disadvantages
-
expensive materials
-
coupling coefficient linked to material properties
-
low output voltages
-
expensive material
-
low efficiency in low frequencies and small sizes
-
low capacitances
-
high impact of parasitic capacitances
-
no direct mechanical-to-electrical conversion for electret-free converters
Table 4. Characteristic coefficients of typical piezoelectric materials.
PropertyQuartzPZT-5HPZT-5ABaTiO3PVDF
Material typeSingle crystalPiezoceramicPiezoceramicPiezoceramicPolymer
d33 (1012 C/N)−2.3 (d11)593374149−33
d31 (1012 C/N)−0.93 (d12)−274−1717823
g33 (103 Vm/N)−5819.724.814.1330
g31 (103 Vm/N)-−9.1−11.45216
k330.070.750.710.480.15
k31-0.390.310.210.12
Relative permittivity(ε/ε0)4.434001700170012
Curie temperature (°C)573195365120~150
Table 5. Properties of some common magnetic material.
Material(BH)MAX (kJ/m3)Flux Density (mT)Max. Work. Temp. (°C)Curie Temp. (°C)Density (kg/m3)
Ceramic261002504604980
Alnico421305508607200
SmCo (2:17)2083503007508400
NdFeB(N38H)3064501203207470
Table 6. Conductor materials resistivity and conductive properties.
Materialρ (Ω·m) at 20 °Cσ (S/m) at 20 °CMaterialρ (Ω·m) at 20 °Cσ (S/m) at 20 °C
Silver1.59 × 10−86.30 × 10⁷Tungsten5.60 × 10−81.79 × 10⁷
Copper1.68 × 10−85.96 × 10⁷Zinc5.90 × 10−81.69 × 10⁷
Annealed copper1.72 × 10−85.80 × 10⁷Nickel6.99 × 10−81.43 × 10⁷
Gold2.44 × 10−84.10 × 10⁷Lithium9.28 × 10−81.08 × 10⁷
Aluminium2.65 × 10−83.77 × 10⁷Iron9.71 × 10−81.00 × 10⁷
Calcium3.36 × 10−82.98 × 10⁷Tungsten5.60 × 10−81.79 × 10⁷
Table 7. Electrostatic force (Fe) variation for the three configurations.
StructureCharge ConstrainedVoltage Constrained
Out of plane gap varyingFe constantFe ~1/x
In-plane overlap varyingFe ~1/x2Fe constant
In-plane gap varyingFe ~xFe ~1/x2
Table 8. Relative permeability of conventional ferromagnetic materials.
MaterialRelative Permeability (µr)MaterialRelative Permeability (µr)
Cobalt250Permalloy100,000
Nickel600Fe3O4 (Magnetite)100
Iron6000Ferrites5000
Supermalloy107Mumetal100,000
Steel100Permendur5000
Silicon iron7000--
Table 9. Comparison of different coil modules.
HarvesterPower Density (µW/cm3)HarvesterPower Density (µW/cm3)
21.2 µT200 µT 21.2 µT200 µT
Coil 10.8171Coil 30.087.6
Coil 21.47130Coil 40.2118
Table 10. RF energy harvesting experimental data.
SourceSource Power (W)Frequency (MHz)Distance (m)Power Harvested Rate (μW)
Isotropic RF trans.4902–928155.5
Isotropic RF trans.1.78868252.3
Isotropic RF trans.1.78868272
TX91501 power trans.39155189
TX91501 power trans.3915111
KING-TV tower960,000674–680410060
Table 11. Wind speed and collected energy for different wind harvesters.
Ref.TypeWind Velocity (m/s)Generated Power (mW)
[110]Electrostatic104.761
[29]Turbine-Electromagnetic104.3
[94]Electromagnetic513.5
[95]Electromagnetic770
Table 12. Comparison of the amount of energy produce in different types hydro turbines.
TurbineP (mW)V (m/s)A (cm3)η (%)P/V (mV/cm3)
Pelton
2.2 mm
4217622.60.55
287326.53.78
663529.58.72
Pelton
3.2 mm
9217624.51.21
500326.56.58
1125528.414.80
Small Pelton4.4171.70.63
194314.127.71
491517.070.14
Three-bladed
propeller
1180.51355.00.87
34015.52.52
5921.55.54.39
Four-bladed
propeller
1050.51354.40.78
26514.31.96
46224.33.42
Table 13. Example of harvested power with different sound sources.
Sound SourceSound Intensity (dB)P (µW)
Mess Kitchen601.476
Child Shouting764.600
Mechanical887.280
Group of people9010.540
Motorbike9214.040
Tractor10223.000
Car horn10935.960
Truck horn12898.700
Table 14. Comparison of the developed acoustic energy harvesters.
TypeDevice Dimensions (mm)Sound Pressure Level (SPL) (dB)F (kHz)R (Ω)P (µW)
NeckCavity
DiameterHeightDiameterHeight
Piezoelectric2.393.186.3516.114913.5710006 × 10−6
Piezoelectric2.393.186.3516.11002455011 × 10−6
Piezoelectric2.423.166.3416.41612.6420,00030 × 103
Piezoelectric0.10.181.21.021003.510001.69 × 10−3
Electrodynamic2.546.5161250.143661503.4

