4.1. SPC-FOCV Operation under Irradiance Variations
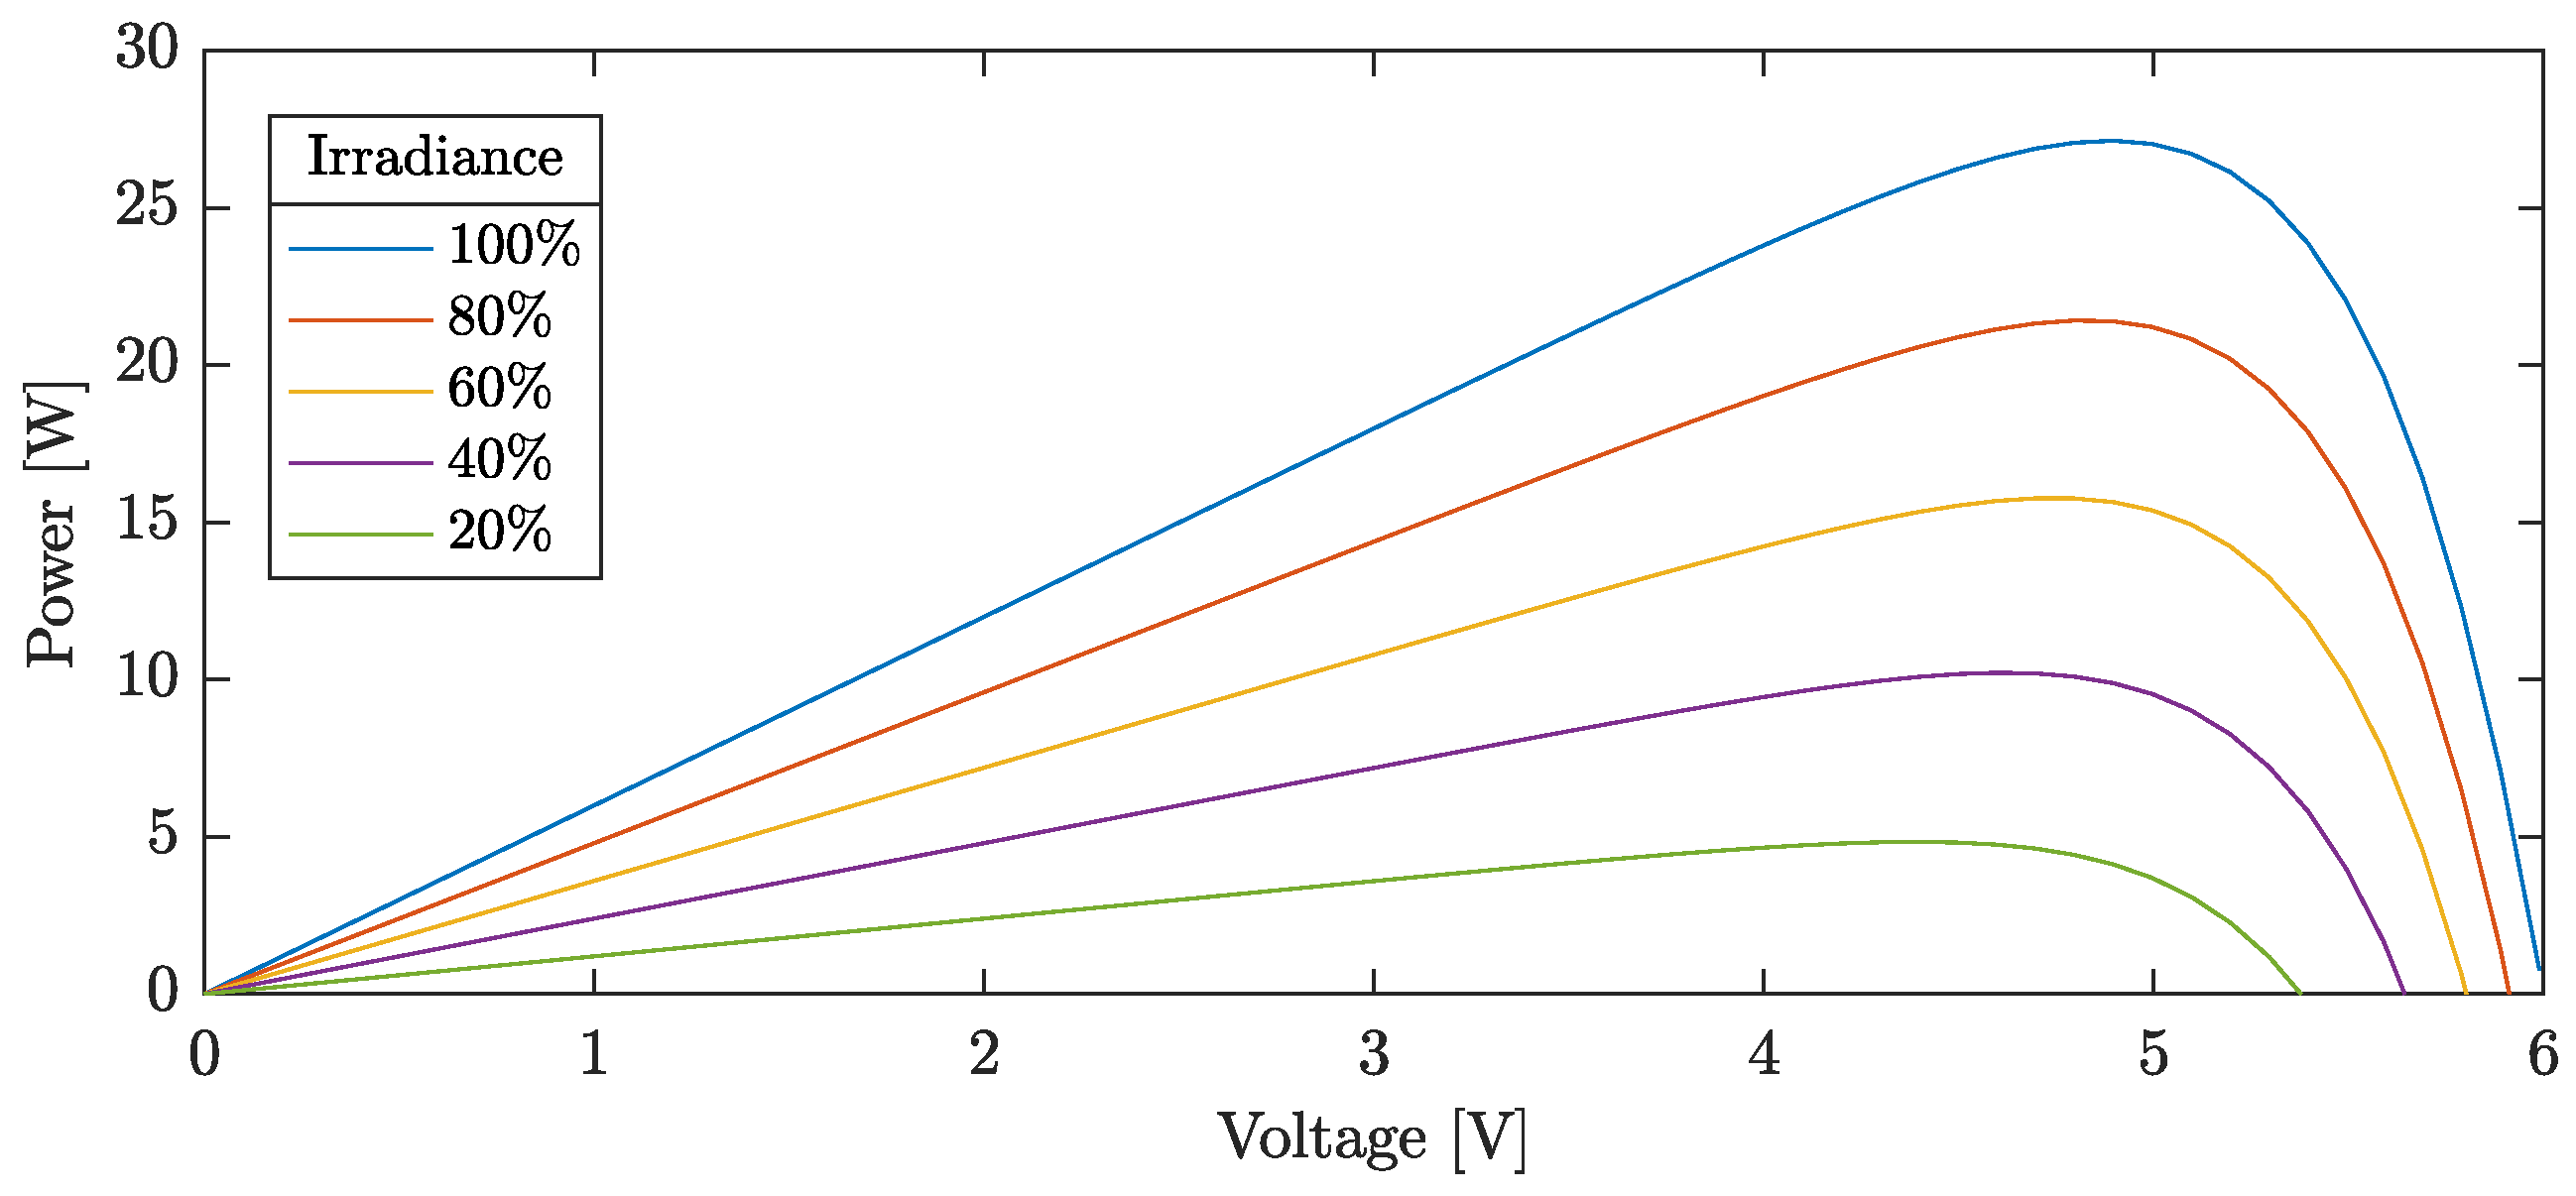
The graph of the simulated PV array’s output power vs. output voltage for constant cells temperature of 25 °C and different irradiance values is shown in
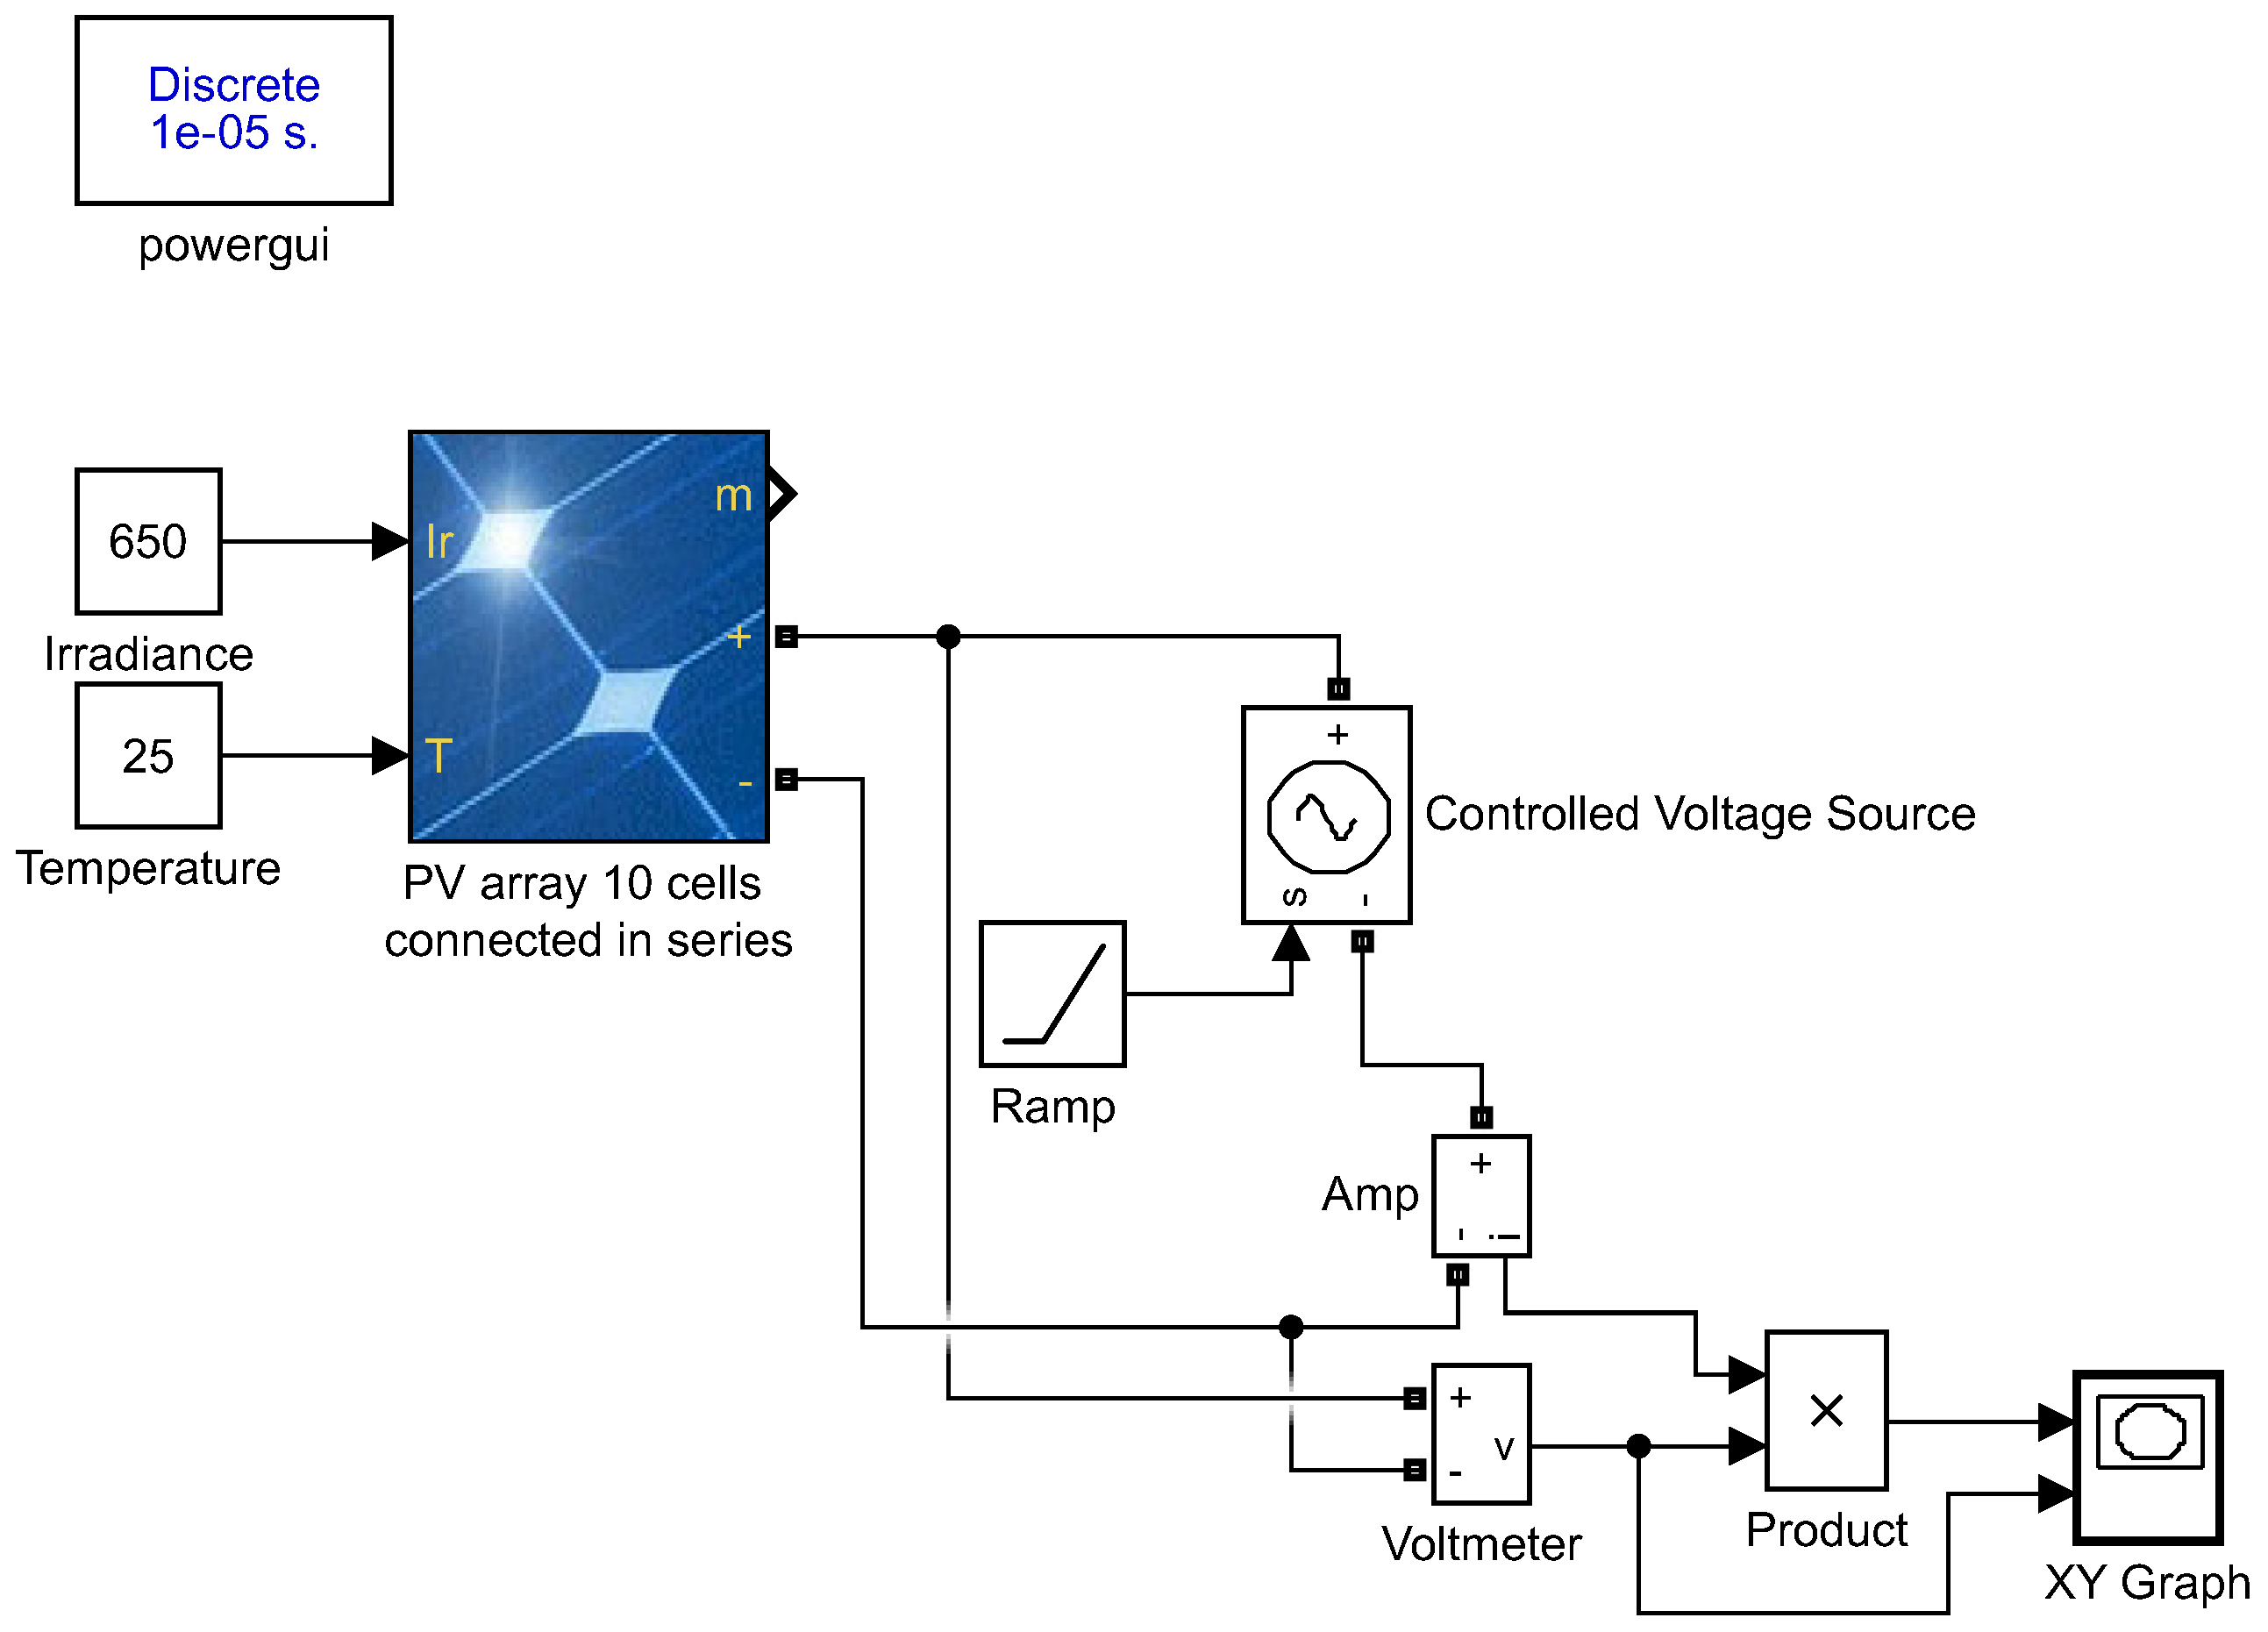
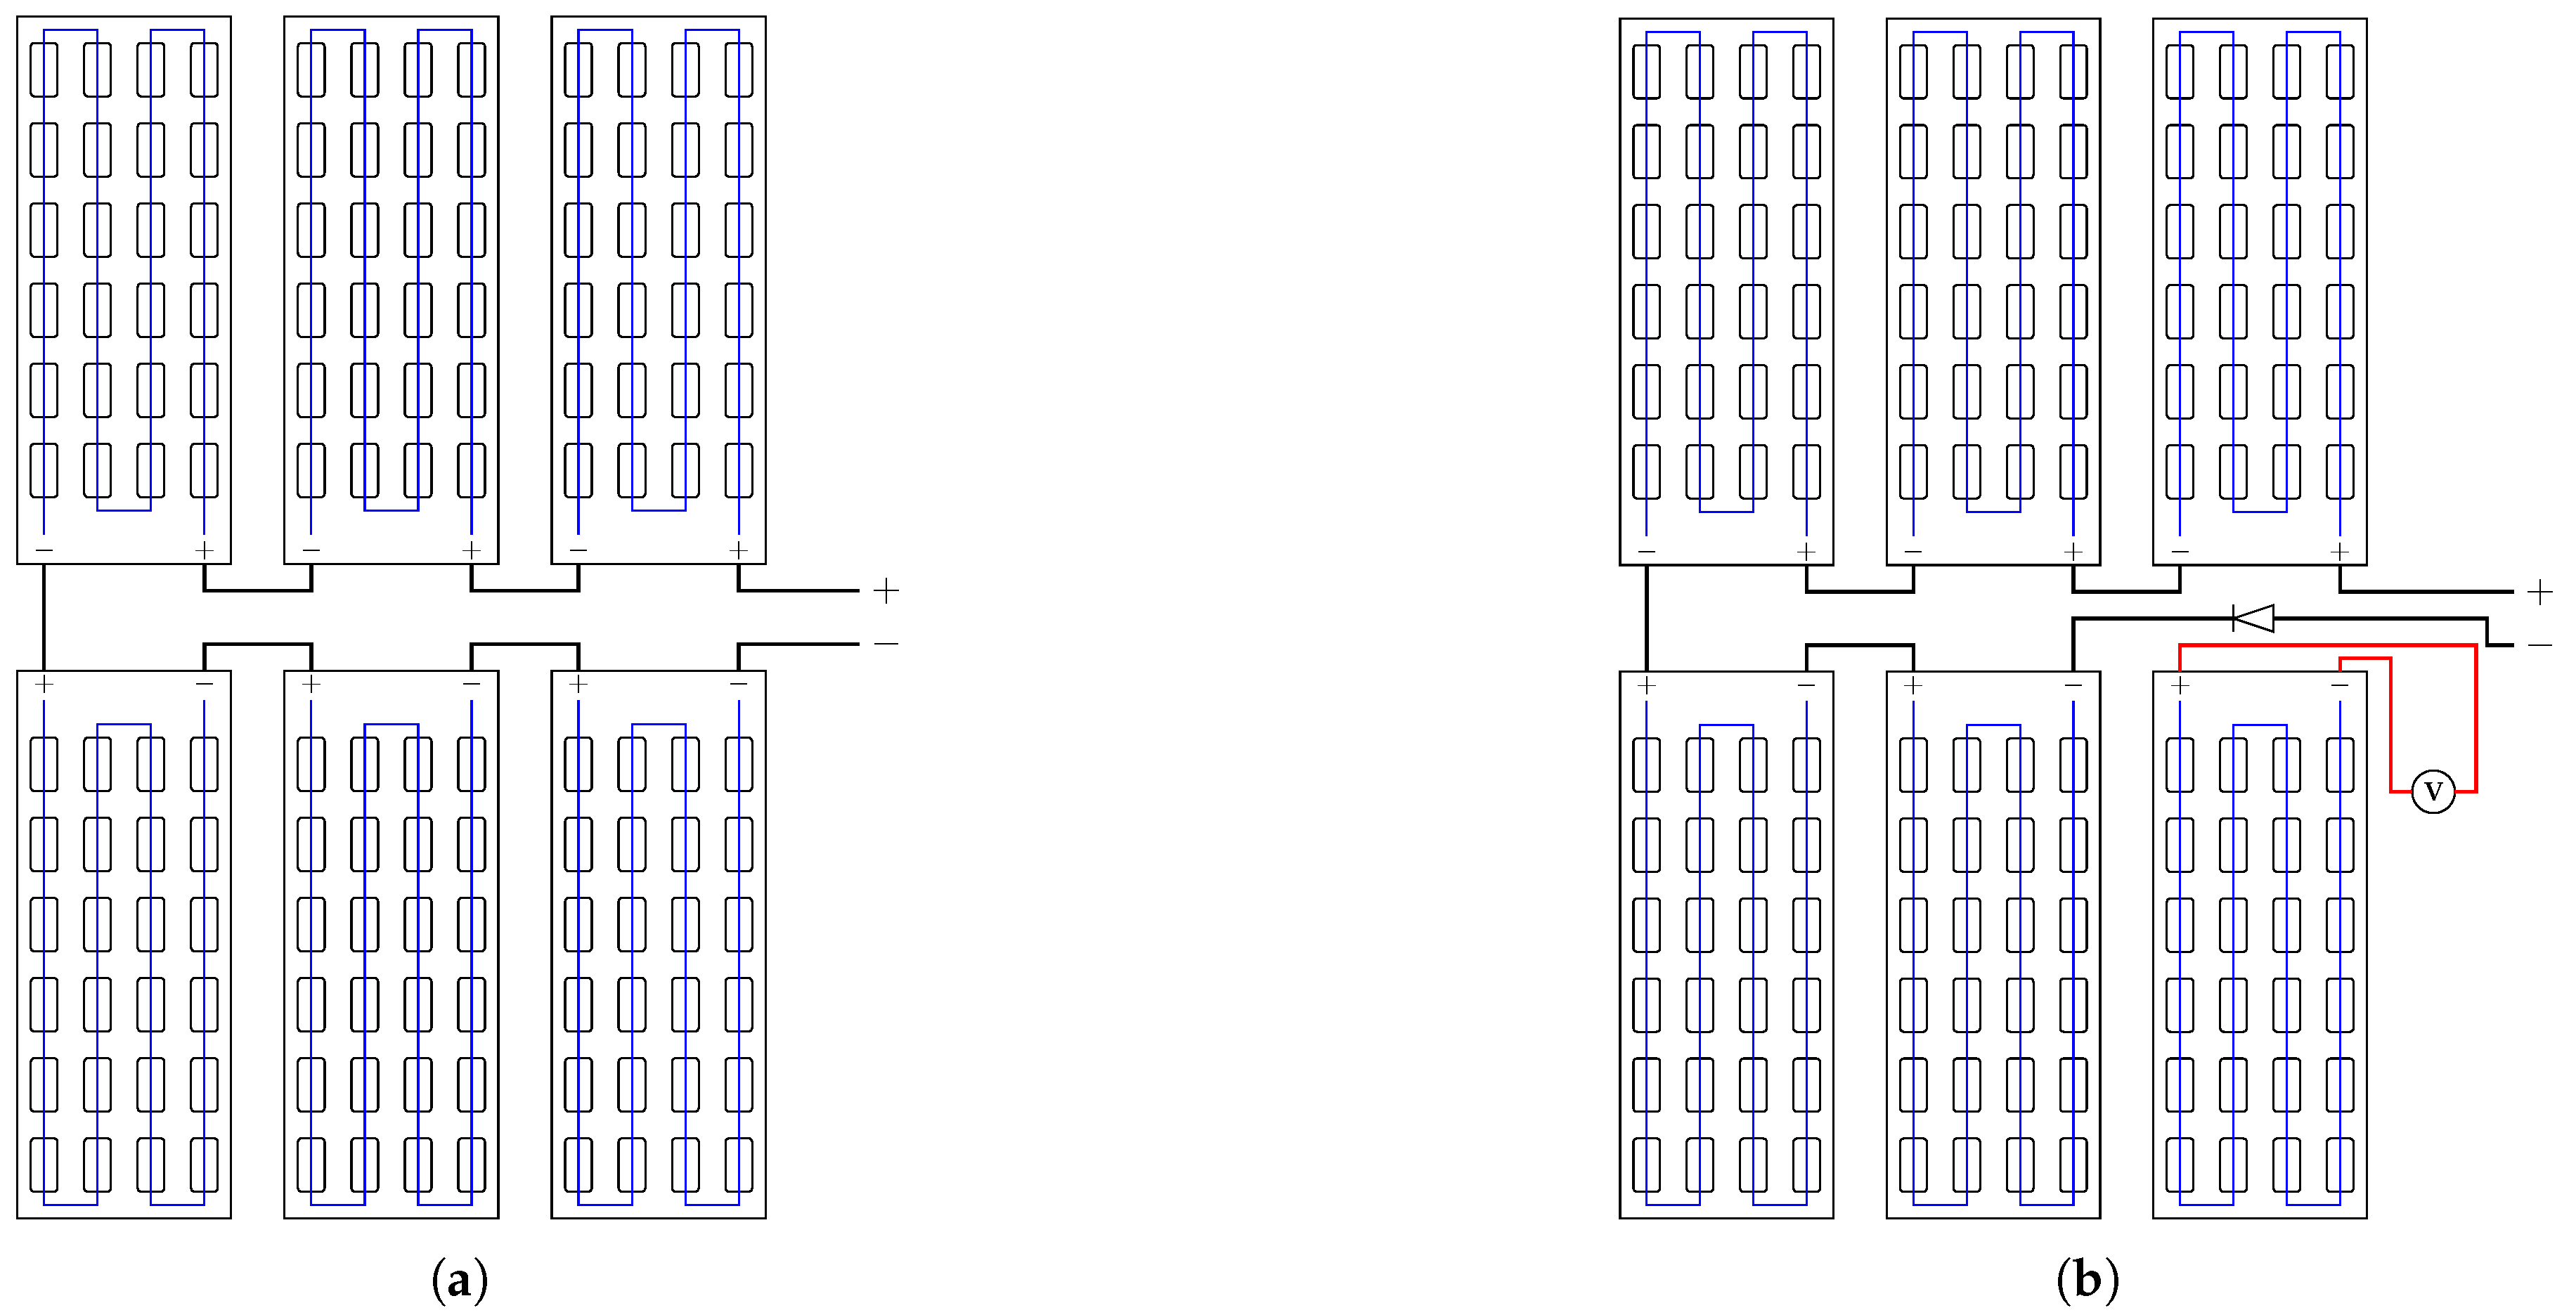
Figure 8. The output power vs. output voltage curves are obtained by the simulation circuit shown in
Figure 9 where the irradiance of the PV array is changed according to the desired curve i.e., 100%, 80%, etc. The simulated PV array consists of ten series connected cells (the parameters of the cells are shown in
Table 2) and feeds the load that is implemented by varying voltage source that is swept between zero to the value (6 V) of the array’s open circuit voltage.
This graph can be used in order to measure the value of the PV array’s voltage for each specific irradiance. This measured voltage is for ten series connected cells and corresponds to the supply period.
Before application of the SPC-FOCV method, it is important to know the value of the voltage factor
for different irradiance levels. The voltage factor values can be calculated according to (
1) or taken from the manufacturer’s datasheet. The calculated voltage factor vs. irradiance is shown in
Table 3. It can be seen that the voltage factor is constant for all irradiance values except for values of 200 W/m
2 and lower, where the voltage factor slightly decreases. Therefore, small error in
estimation is expected for irradiances below 200 W/m
2.
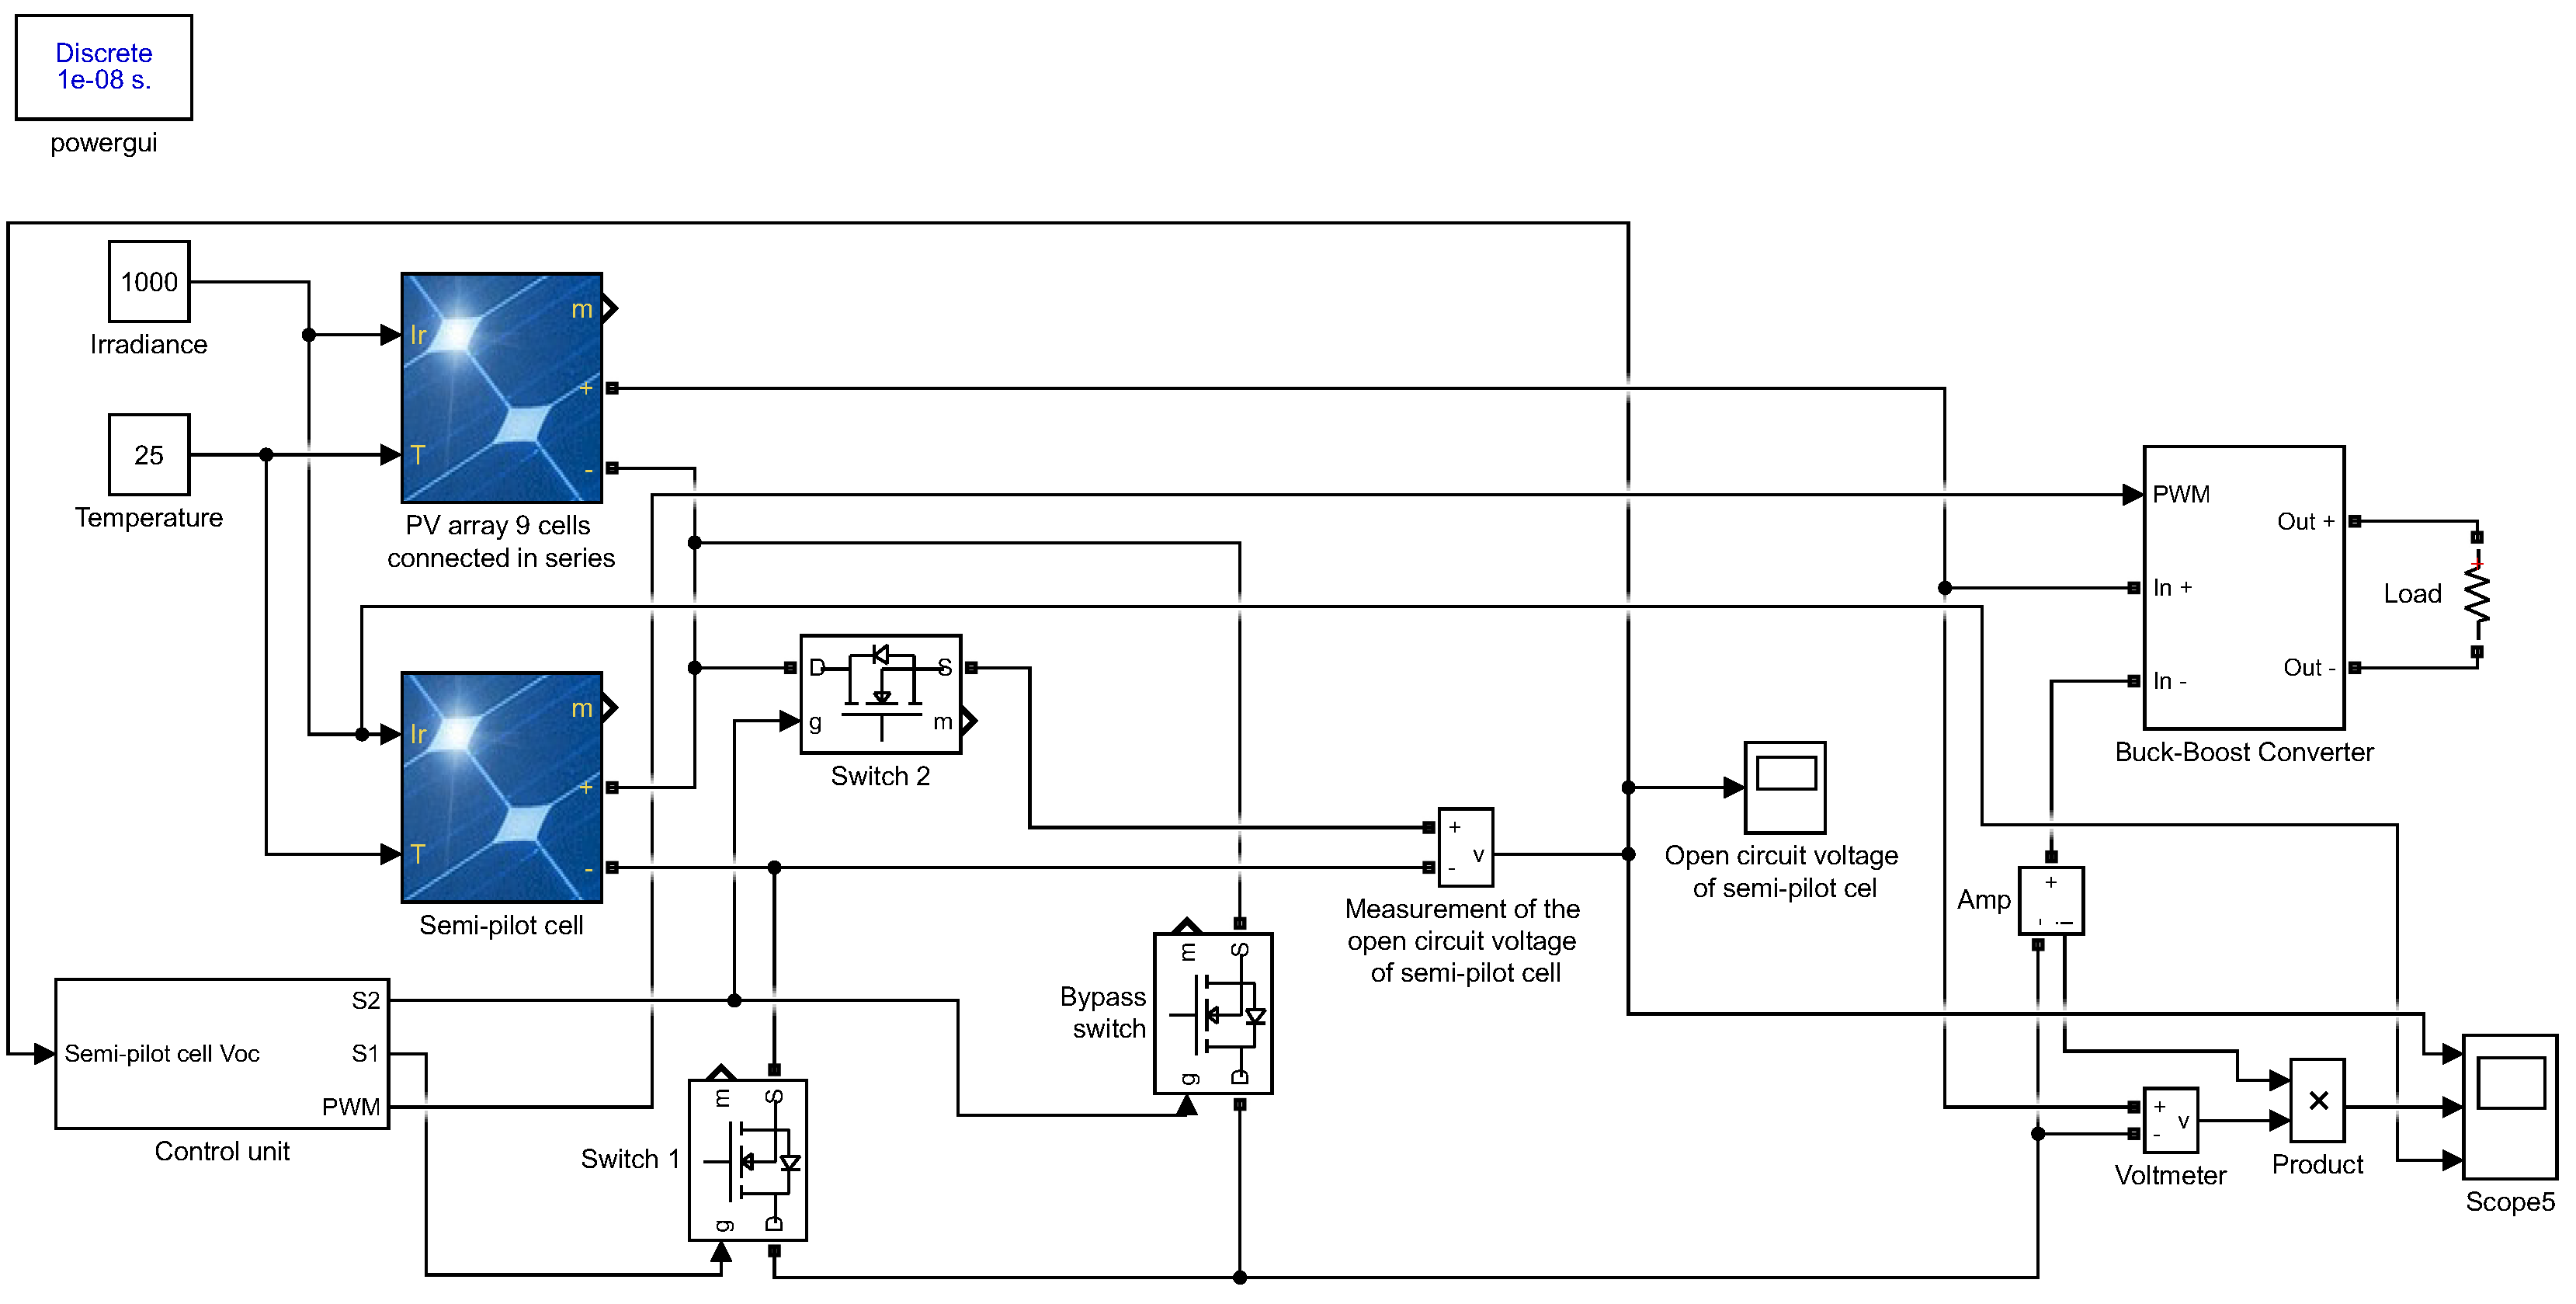
Three different scenarios were simulated and analyzed. The presented simulation results were obtained by the simulation circuit from
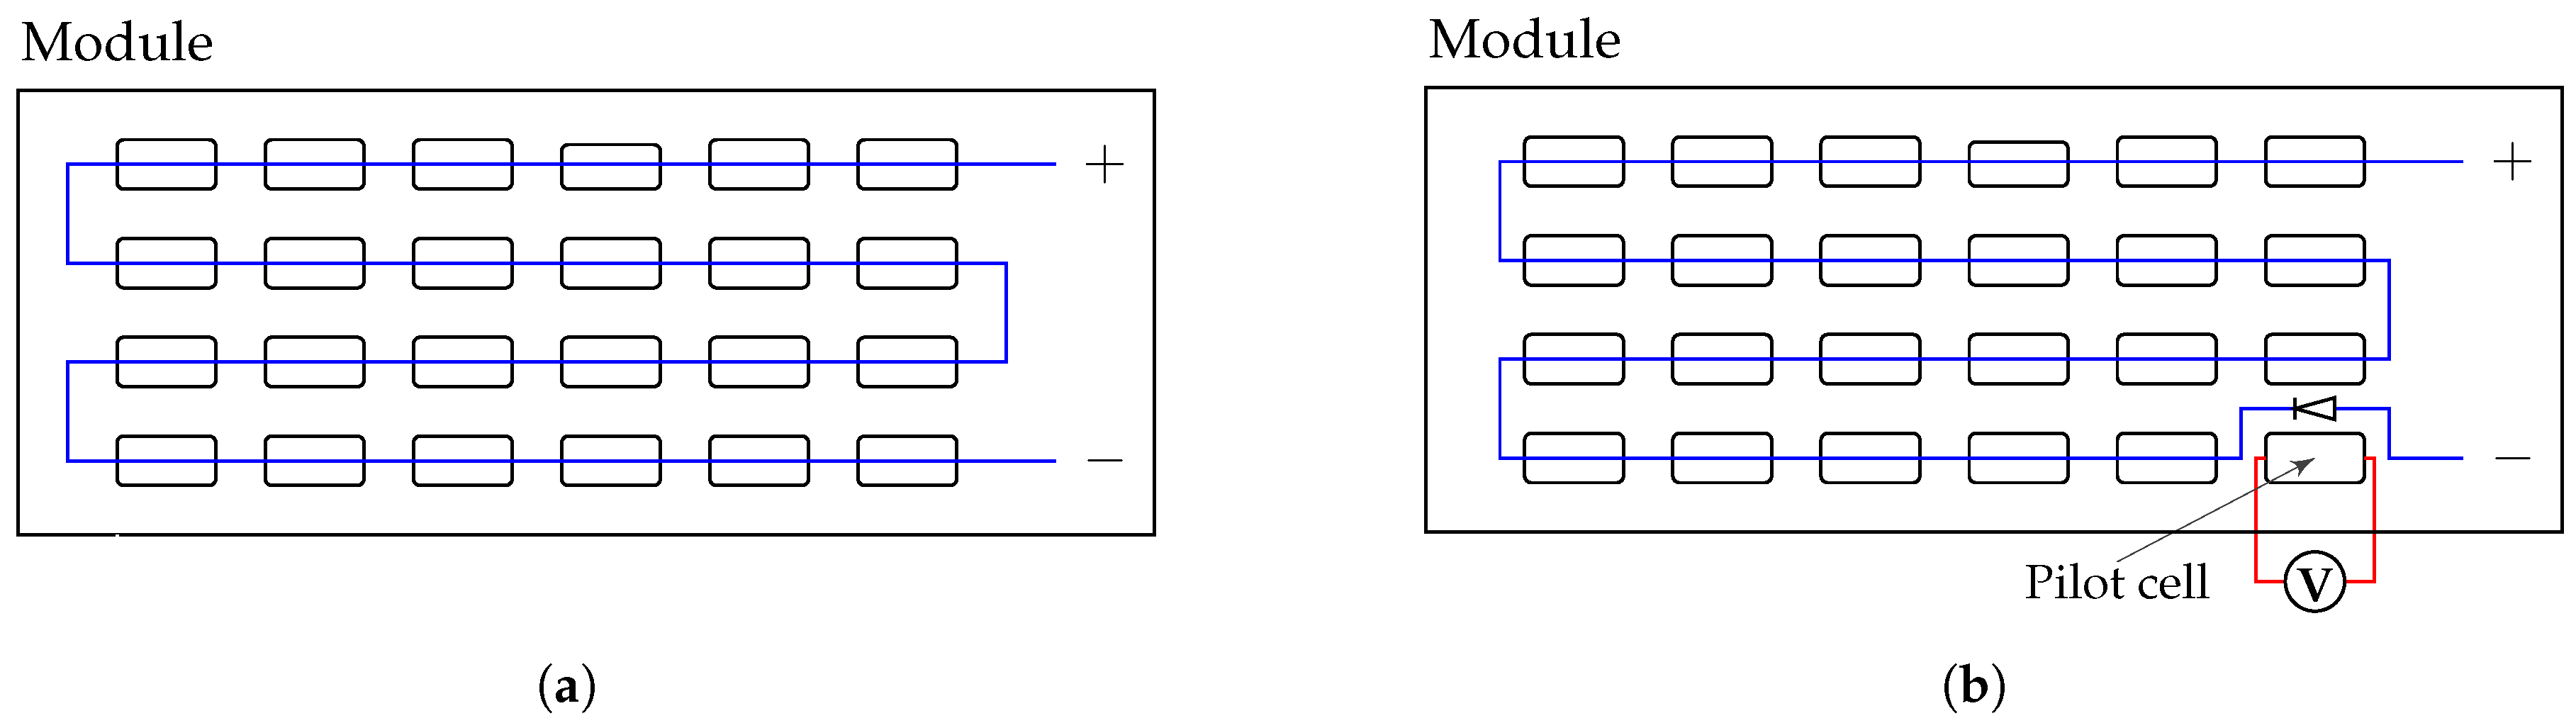
Figure 6 where irradiance conditions were matched to each scenario. In all three cases, the open circuit voltage measurement on the semi-pilot cell was performed every 0.99 s for 0.01 s (operation cycle is 1 s,
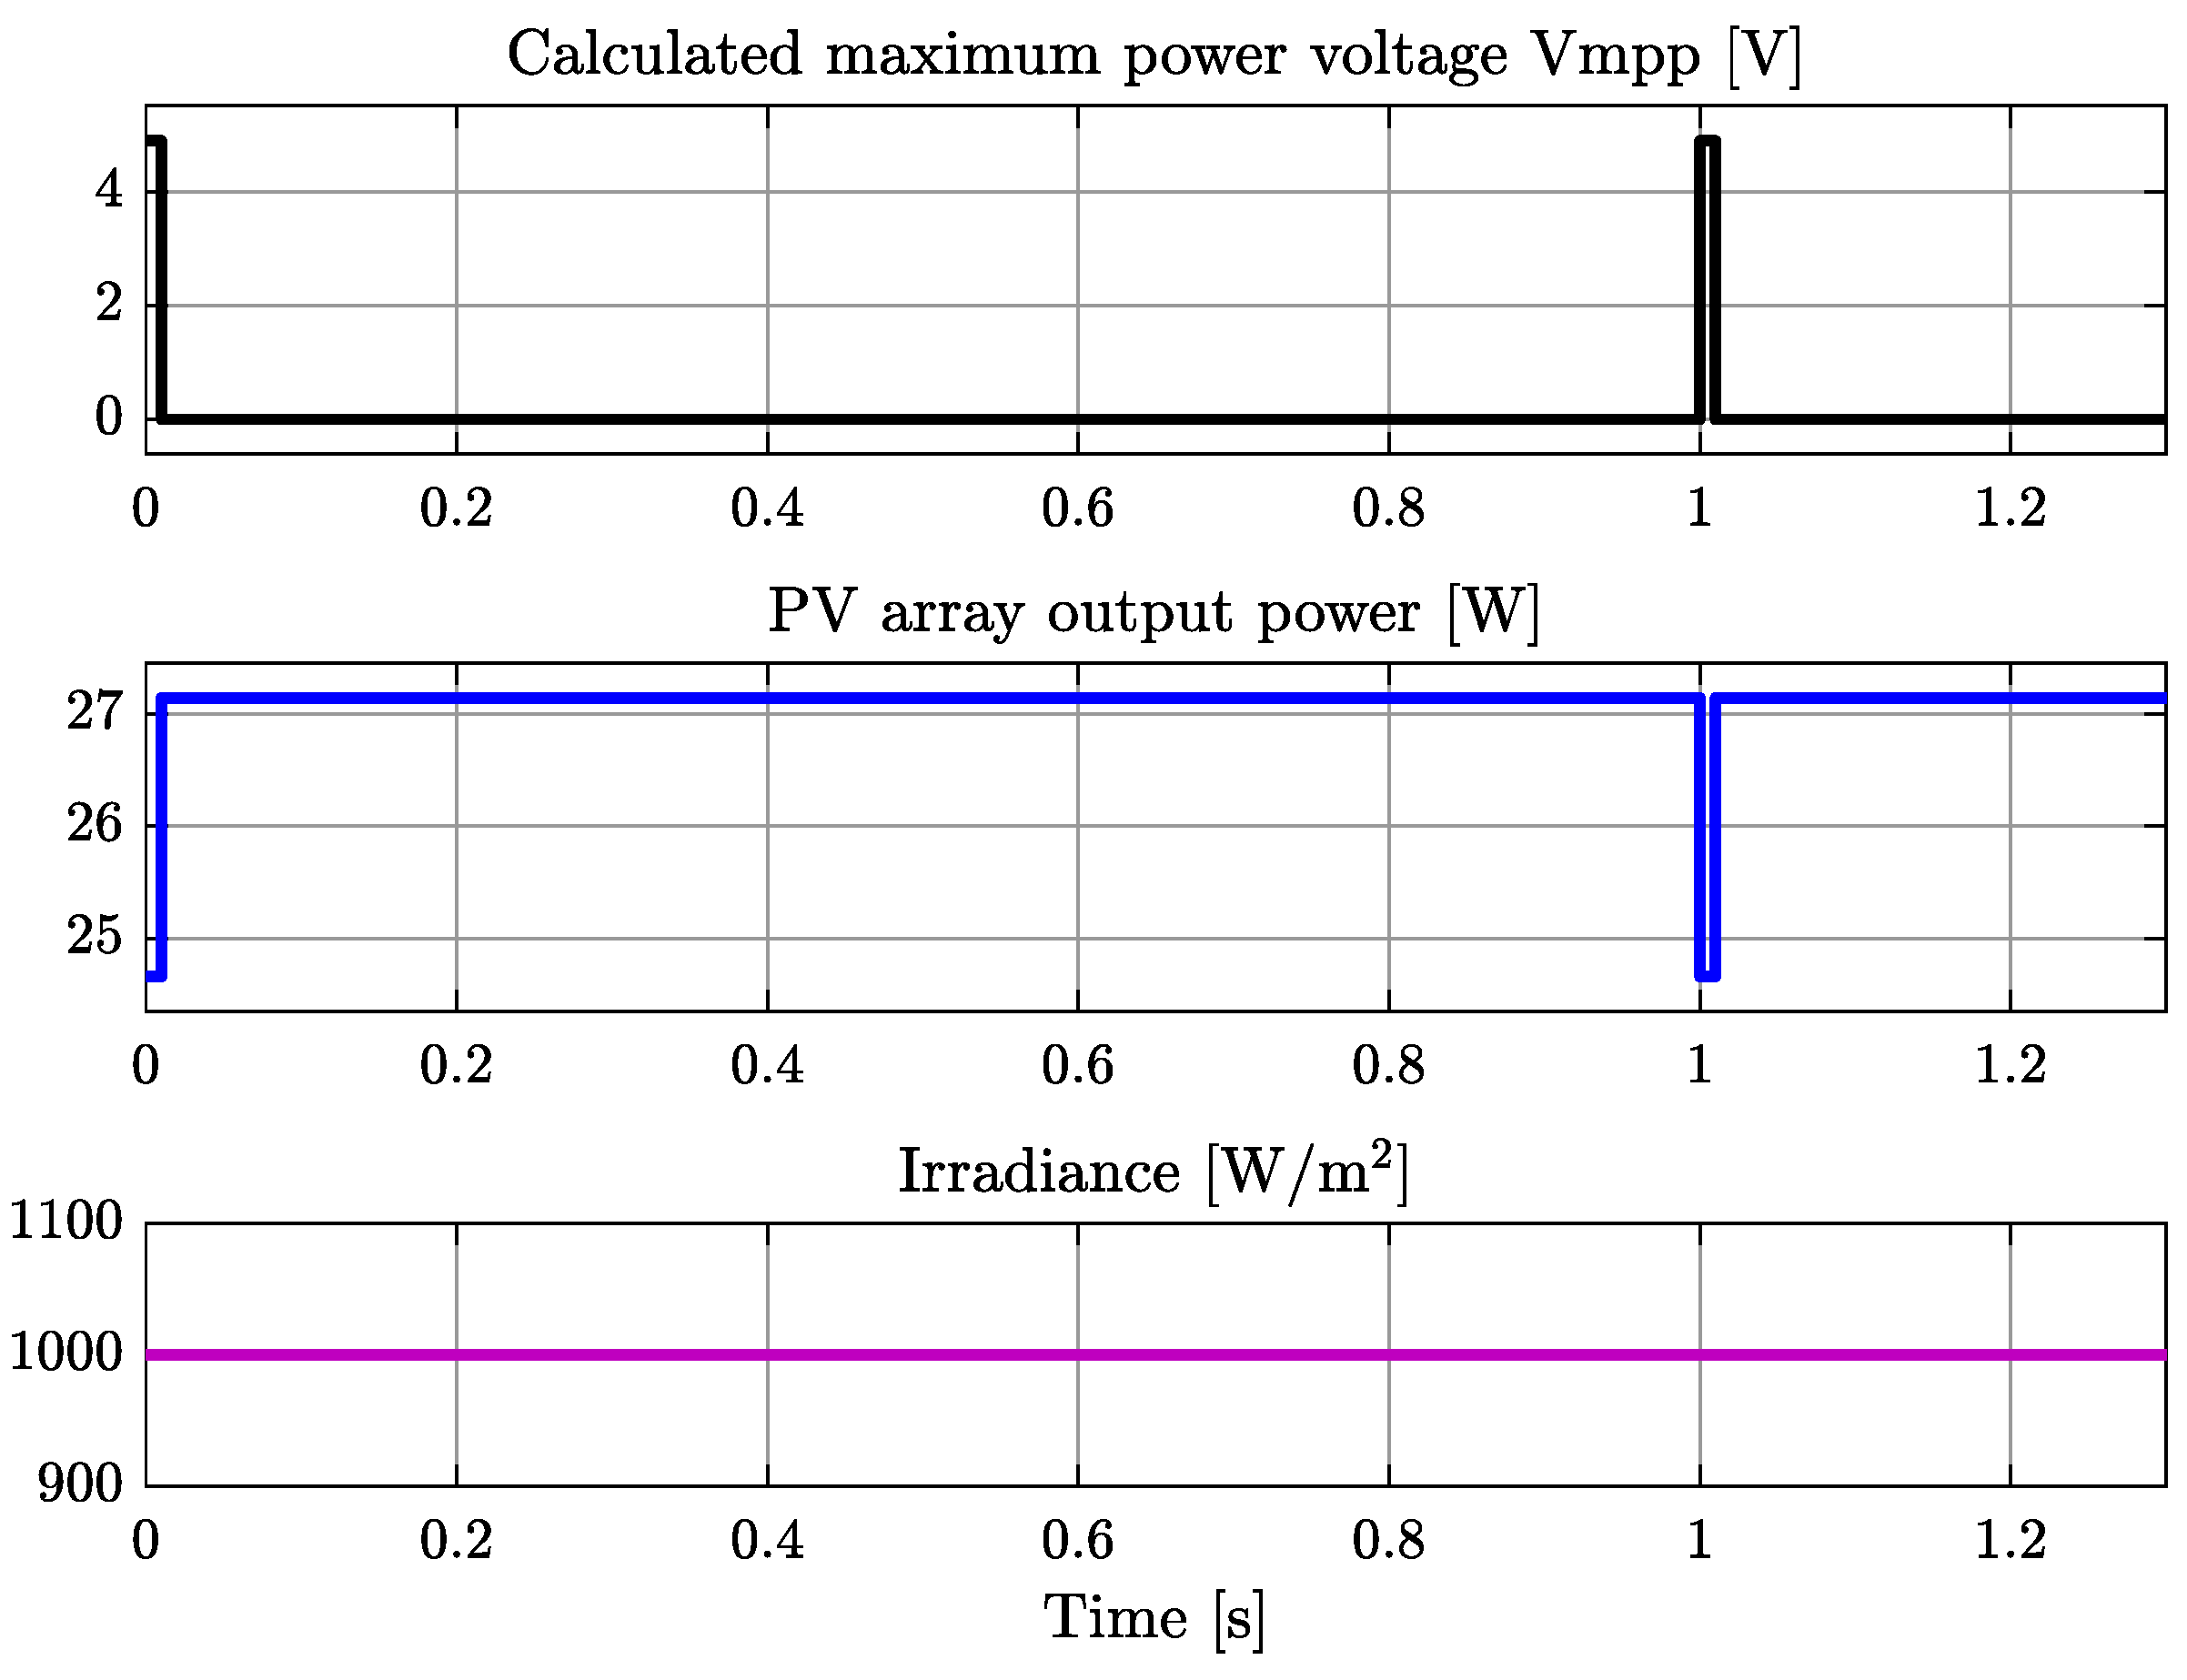
= 99%). The temperature of the cells was set to 25 °C. The first scenario corresponds to a sunny day with constant maximal irradiance of 1000 W/m
2, as shown in
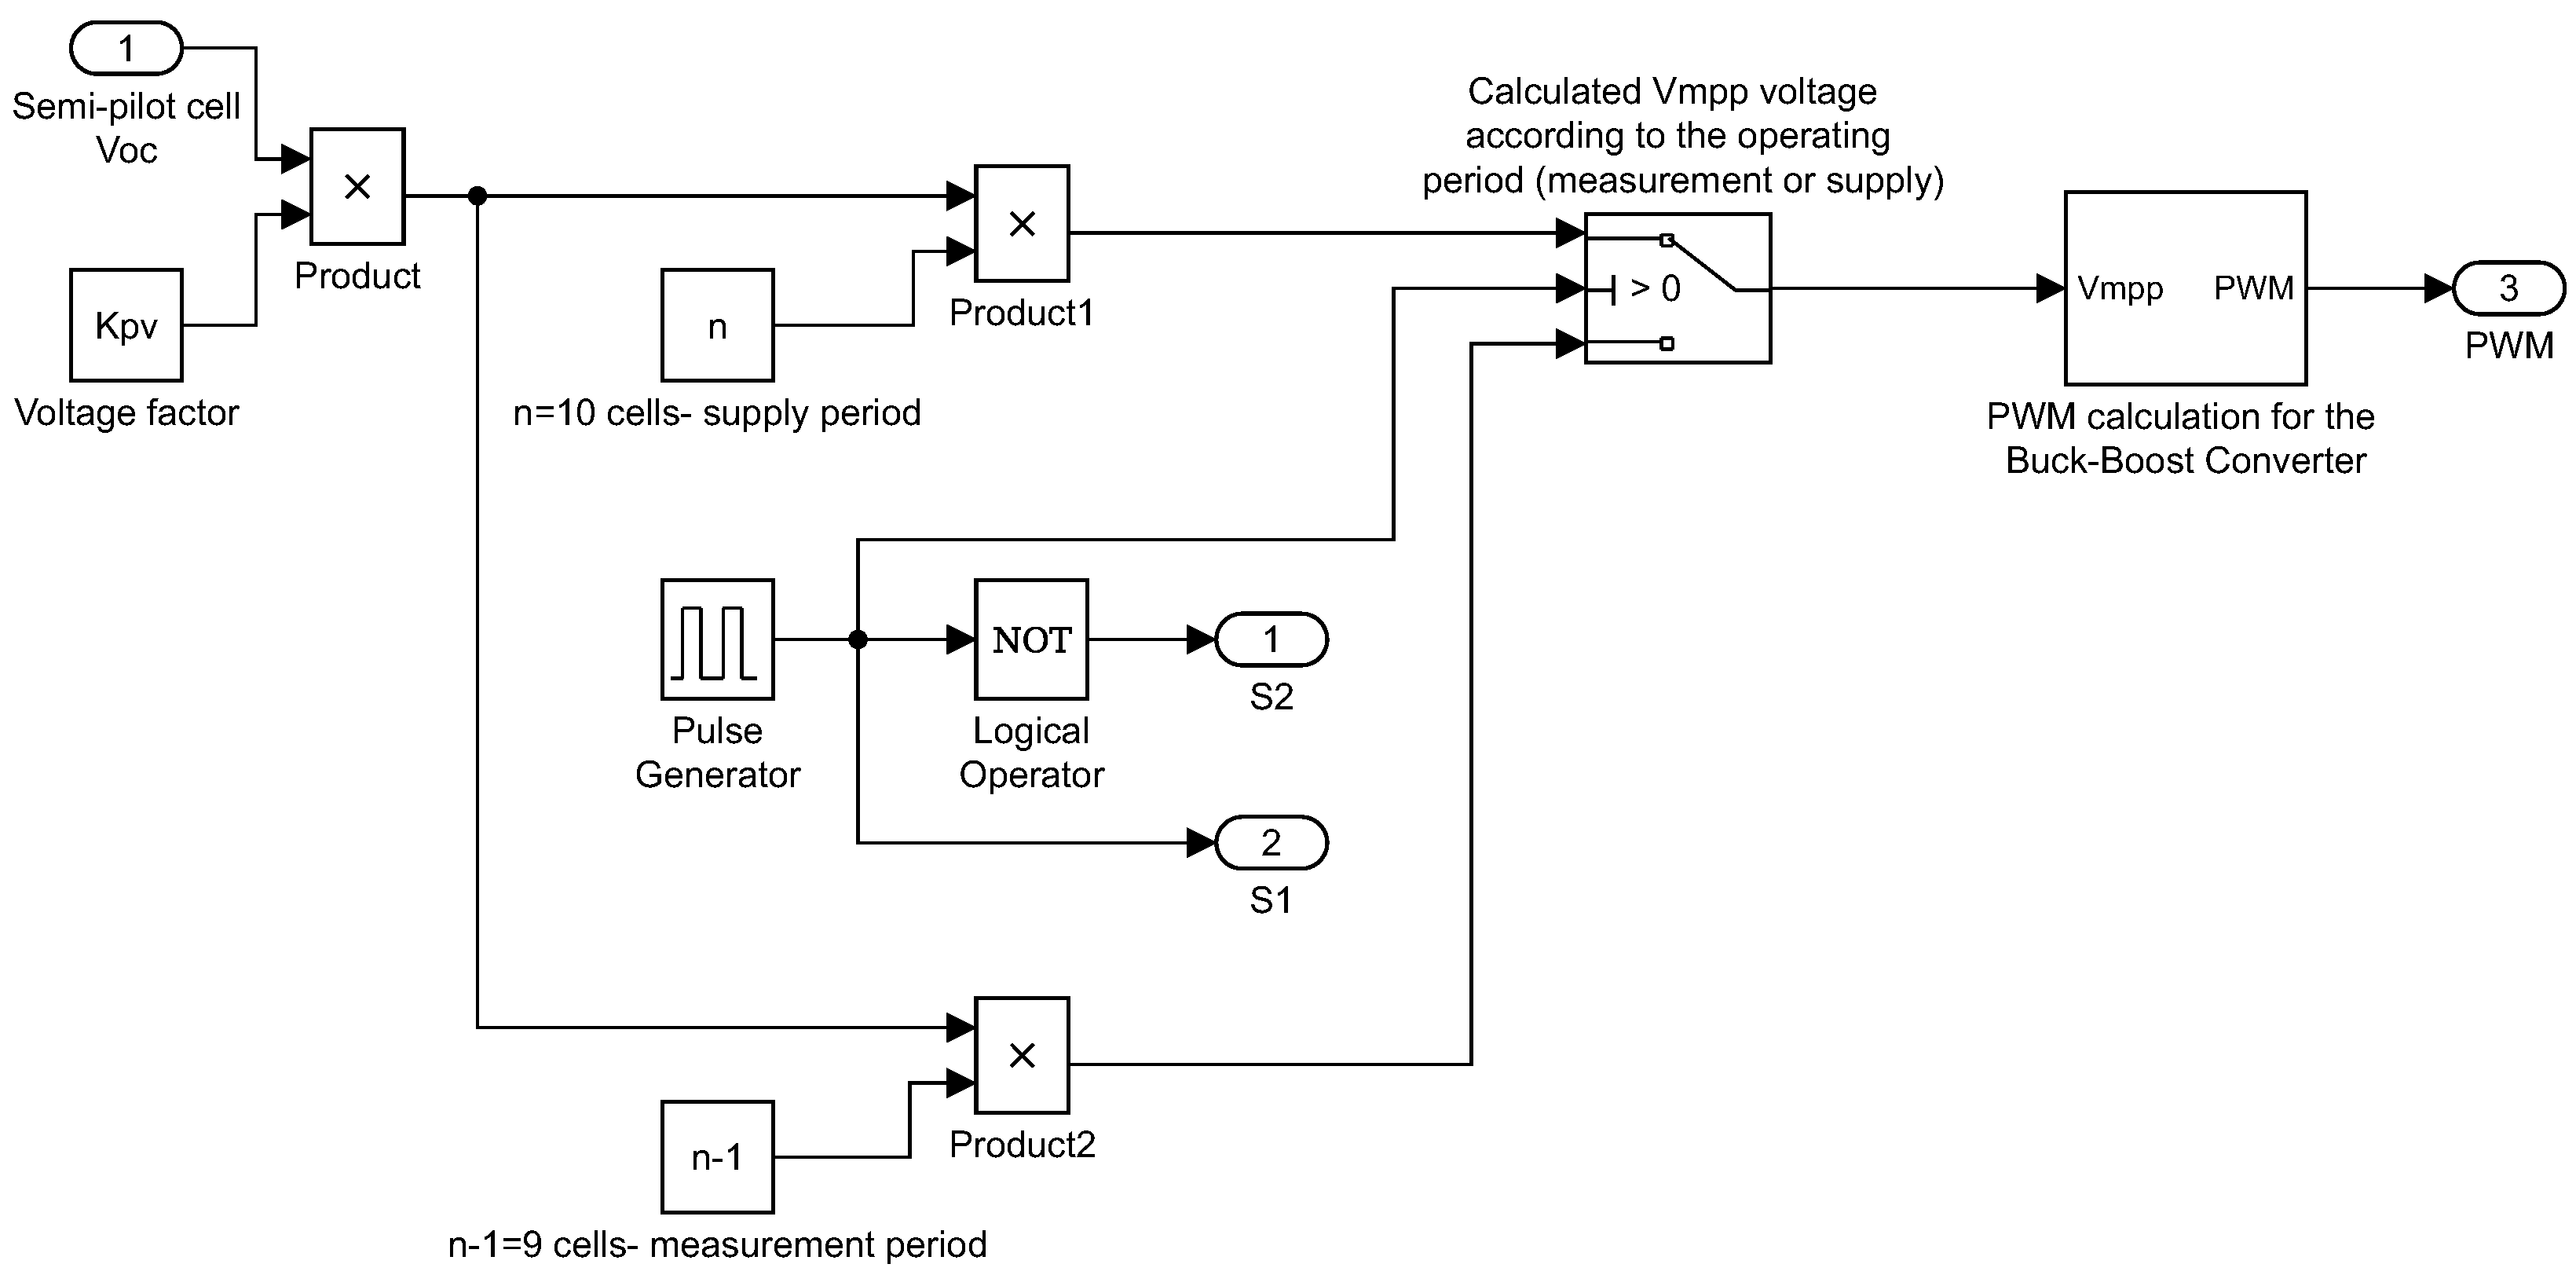
Figure 10. During the open circuit voltage measurement periods, the control unit sets the input voltage of the DC-DC converter to the value of the corresponding
voltage that is calculated by multiplication of the semi-pilot’s measured open circuit voltage 0.6 V by the voltage factor 0.816 and by the
cells:
V. The converter’s operation at the
V ensures maximal PV array output power during the measurement period. In this scenario the irradiance and temperature conditions are constant. Therefore, in all measurement periods, the measured open circuit voltage of the semi-pilot will have the same value of 0.6 V. When the measurement period ends, the control unit uses previously measured
in order to calculate new
voltage that corresponds to
n cells:
V. The control unit sets the input voltage of the DC-DC converter to 4.896 V during the following supply period in order to ensure maximal PV array output power.
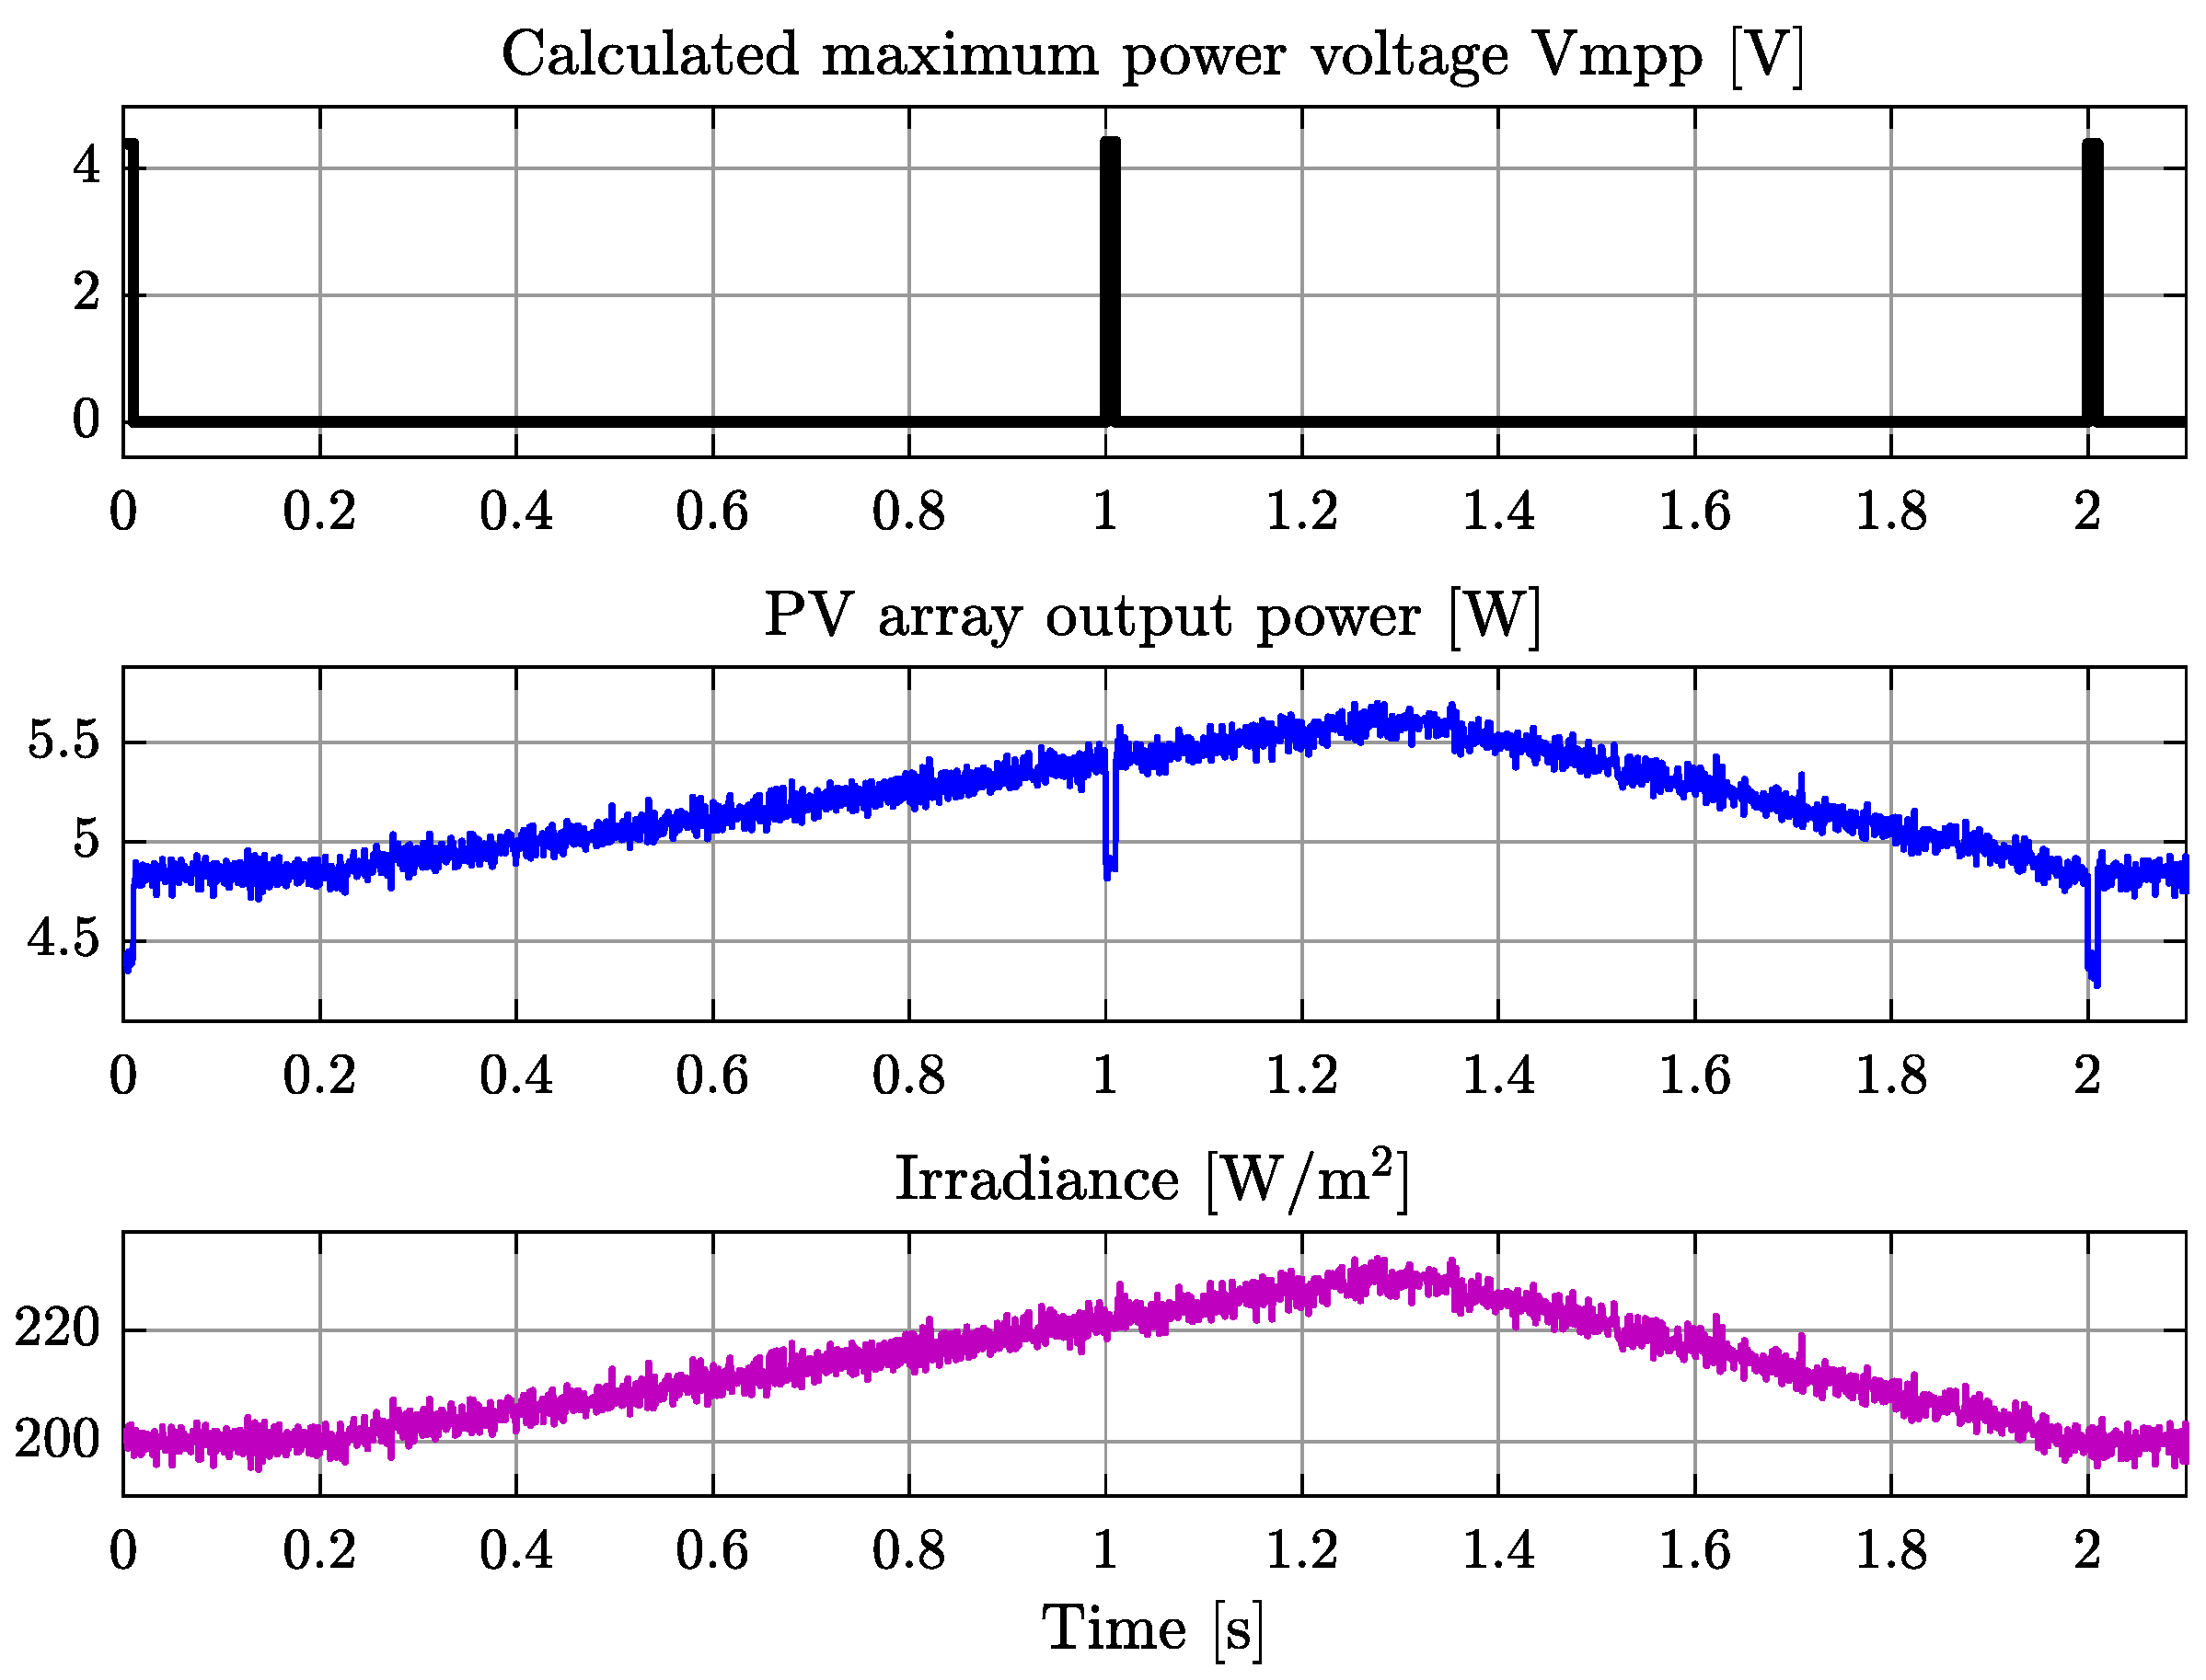
The second scenario simulates cloudy conditions of varying irradiance between 200 to 230 W/m
2 with randomly generated irradiance noise, as shown in
Figure 11. It can be seen from
Figure 11 that irradiance noise adds noise to the Pv array’s output power. In the first measurement period between 0–0.01 s, the measured open circuit voltage is 0.538 V. The DC-DC converter is tuned to
V. In the following supply period between 0.01–1 s the DC-DC converter is tuned to
V. During this supply period, the irradiance increases but the DC-DC converter remains tuned to 4.38 V until the next measurement period where the
voltage will be updated. Therefore, during the period between 0.2–1 s, the PV array’s output power is 5.36 W (not maximal) instead of 5.39 W (maximal power). The mismatch is very small 0.7%. This mismatch can be avoided by increasing the cycle’s frequency. At the second measurement period between 1–1.01 s, the irradiance was increased to 220 W/m
2 and the measured open circuit voltage equals 0.542 V. Therefore, the DC-DC converter is tuned to
V. In the following supply period between 1.01–2 s the DC-DC converter is tuned to
V. However, the irradiance variations continue and the tuned
is also not maximal.
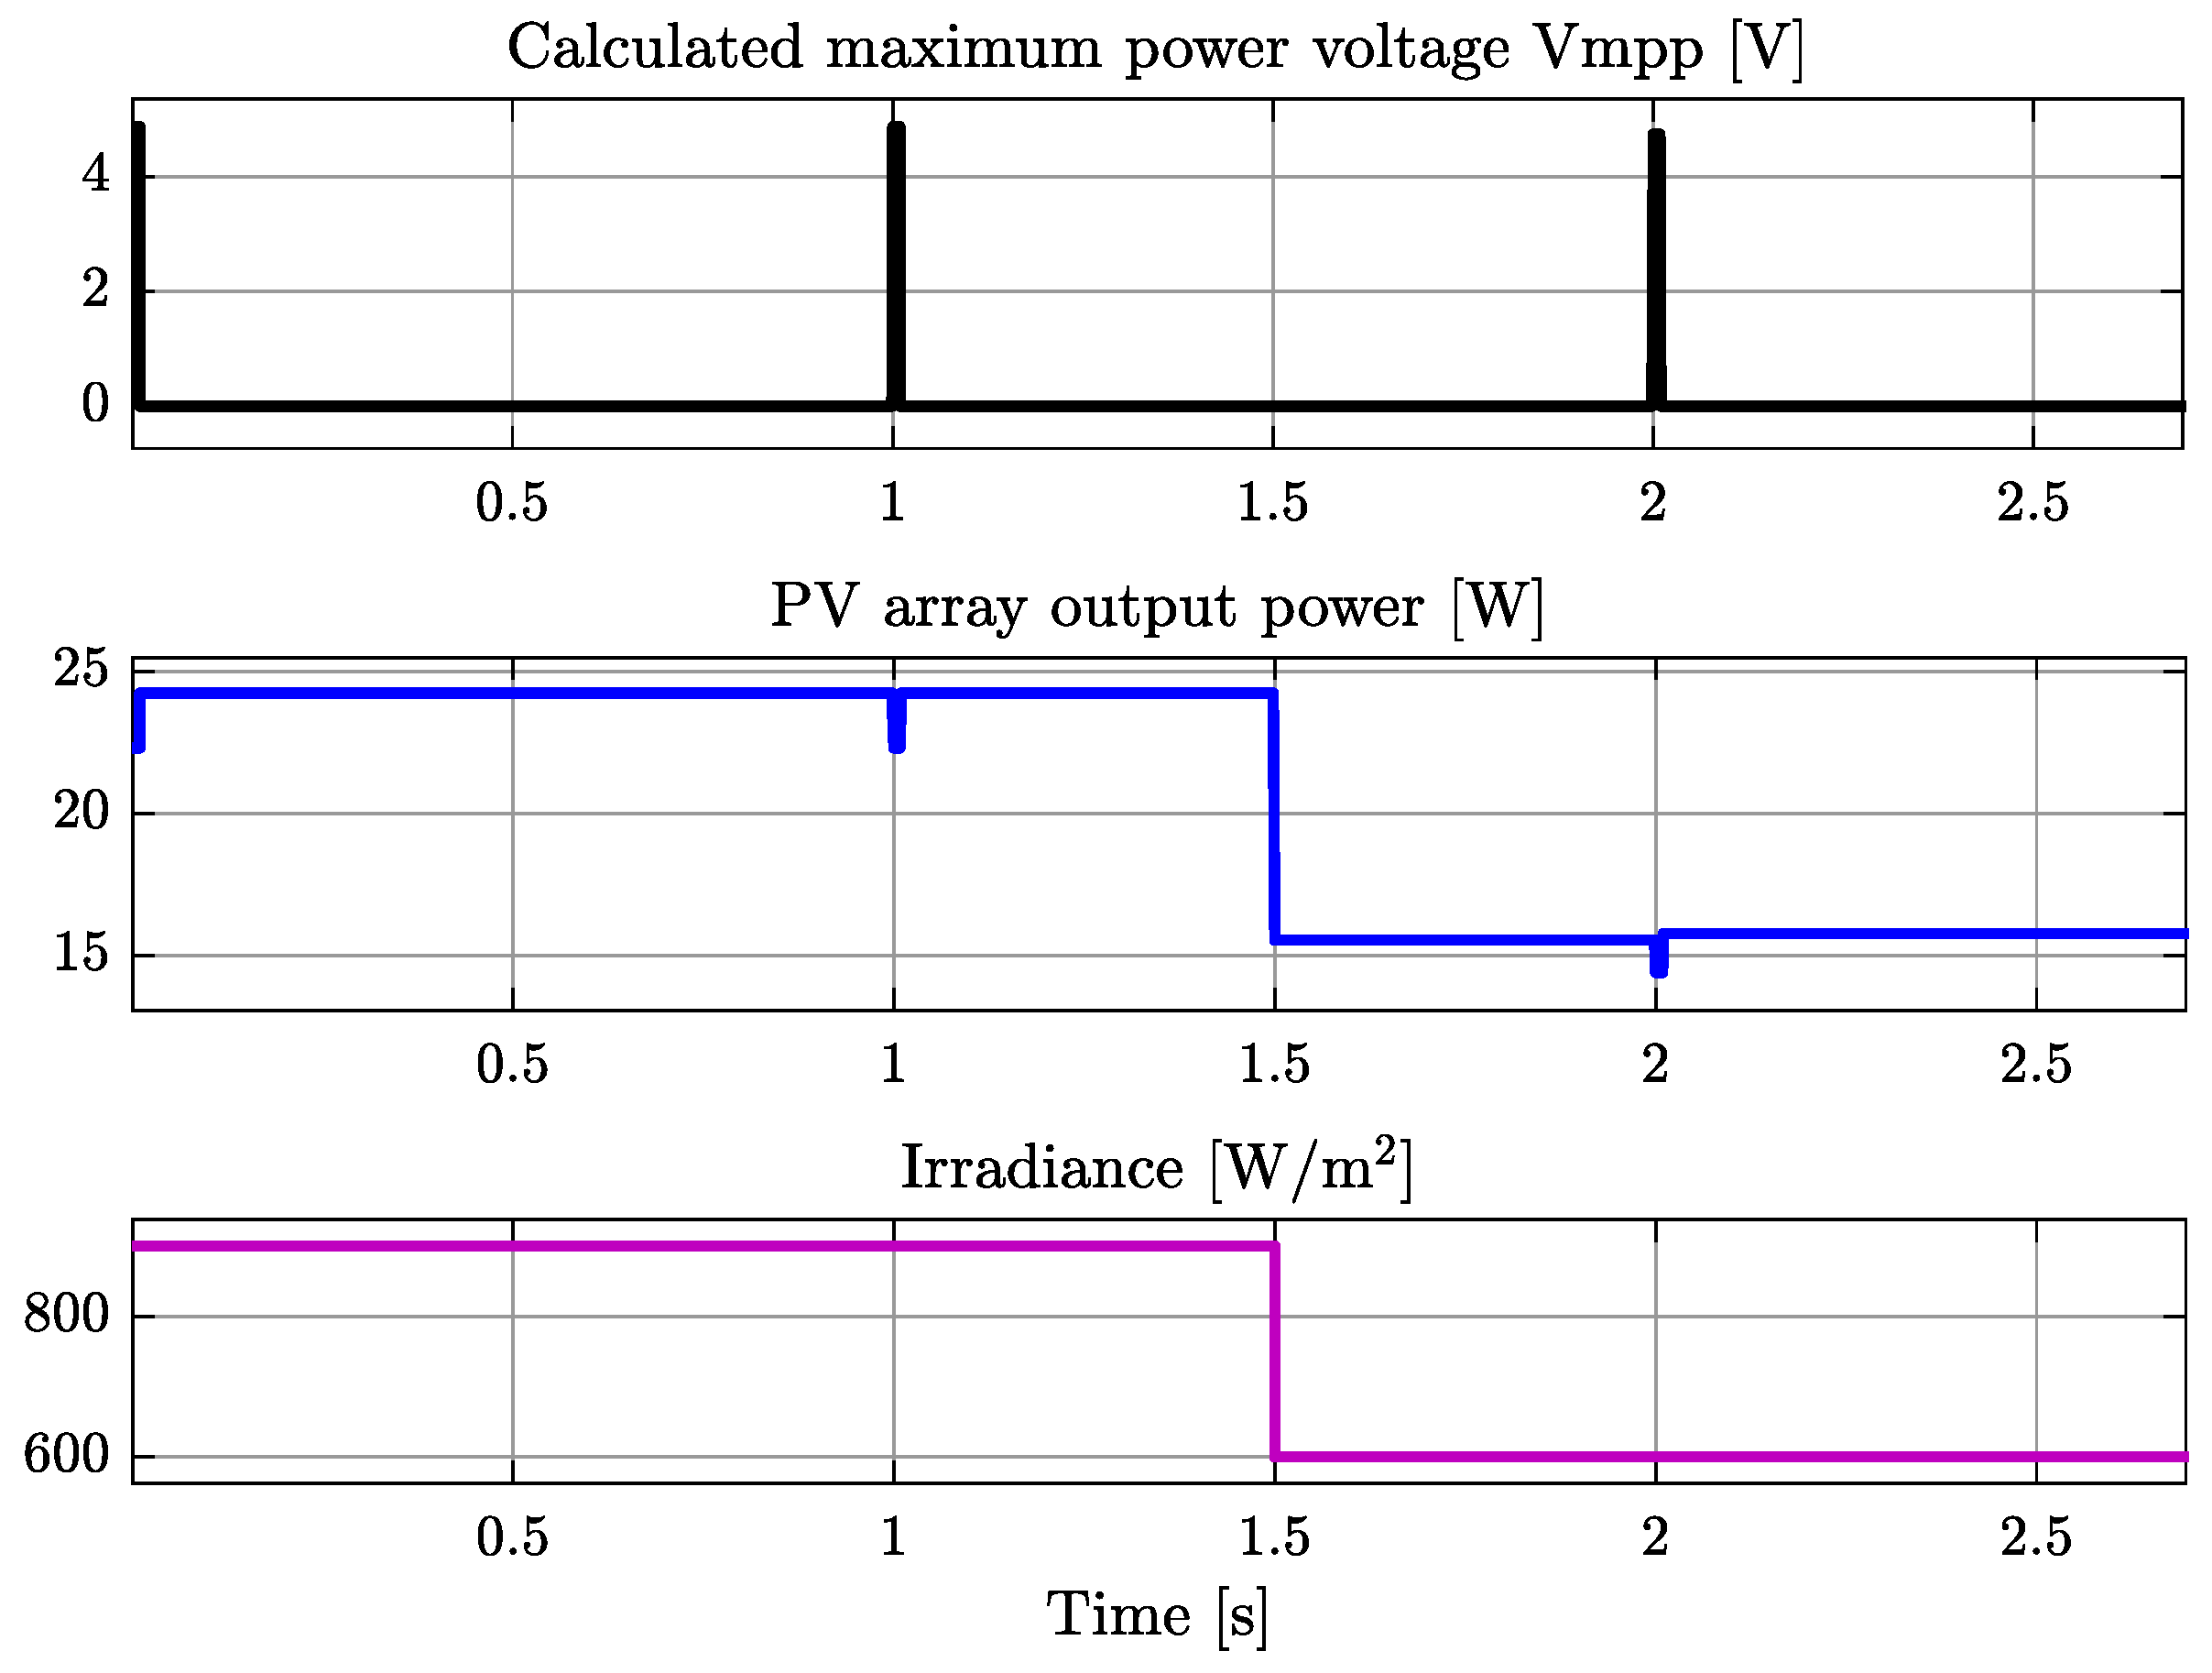
The third case presents the sudden drop in the irradiance from 900 to 600 W/m
2, as shown in
Figure 12. In this example, the first two measuring periods corresponding to 0–0.01 s and 1–1.01 s are performed under the same irradiance of 900 W/m
2. Therefore, the same open circuit voltage of 0.596 V is measured on the semi-pilot. During these measuring periods, the DC-DC converter is set to the
V. After these measurement periods begin supply periods that take place between 0.01–1 s and 1.01–2 s. The corresponding DC-DC converter’s voltage is calculated by
V. Although there is change of irradiance in the middle of the second supply period (at 1.5 s) from 900 to 600 W/m
2, the DC-DC converter will stay tuned to the 4.86 V voltage which is not the maximal power voltage for the irradiance of 600 W/m
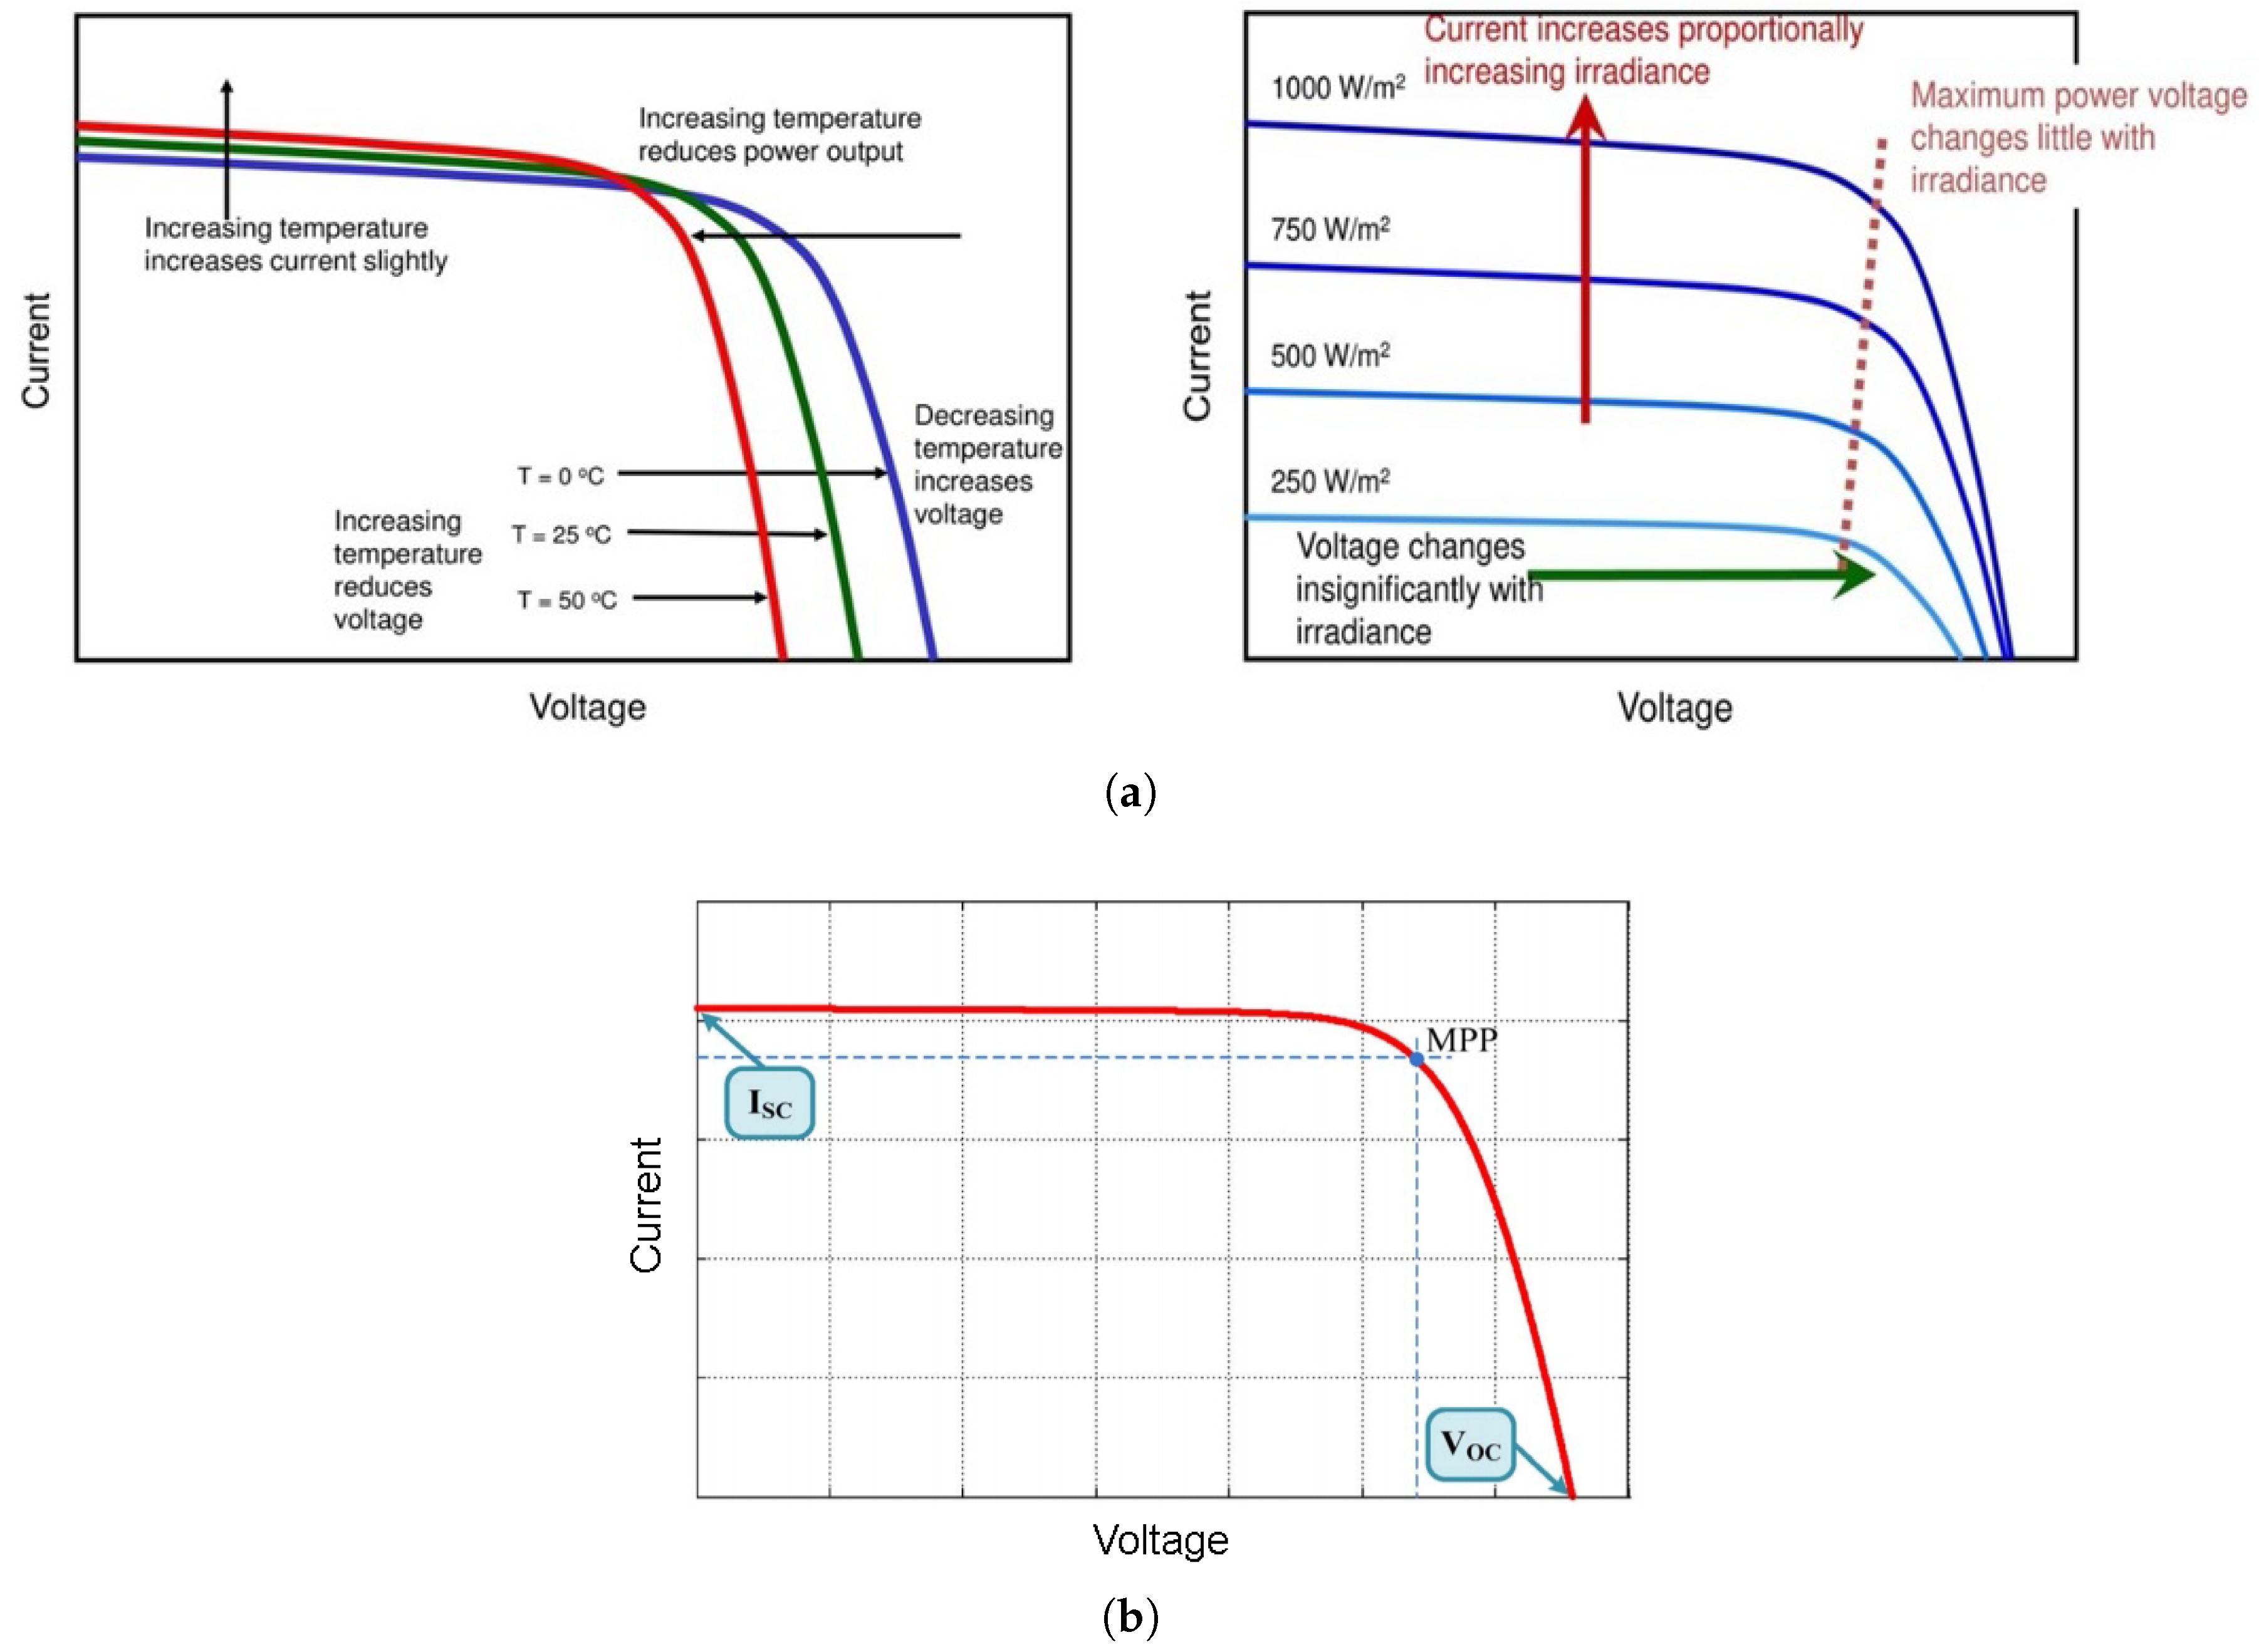
2. As a result, the output power of the PV array will be 15.7 W instead of maximal 15.78 W. The difference between the maximal and obtained powers is only 0.08 W (0.5%) because
voltage is almost uninfluenced by the irradiance variations unlike the
current which is significantly effected by the irradiance changes, see
Figure 8. This small mismatch can be further reduced by increasing the frequency of the operation cycle according to the irradiance conditions. During the third measurement period (2–2.01 s), the measured open circuit voltage of the semi-pilot is 0.58 V that corresponds to the
V. After the third measurement period, in the following supply periods, the DC-DC converter is operated with
V which is updated to the irradiance of 600 W/m
2 and the output power of the PV array is increased to 15.78 W. These simulations show that the proposed SPC-FOCV method is accurate for constant and varying irradiance conditions.
The first scenario was extended and simulated for constant irradiance values of 800, 600, 400, and 200 W/m
2. The
voltages calculated by SPC-FOCV method can be compared to the
voltages measured from the graph shown in
Figure 9. This comparison is presented in
Table 4 which shows that there is an accurate match between the measured and estimated
until irradiance values of 200 W/m
2, where the estimation error rises from zero to 0.2%.
The proposed SPC-FOCV method is compared to the conventional FOCV, pilot cell-based FOCV and P&O methods in
Table 5, for different irradiance levels and duty cycles
at constant cells temperature of 25 °C, which is the nominal temperature of the cells. The comparison is based on PV supplied power
, total power losses
, and the efficiency
.
The SPC-FOCV calculated power losses for different irradiance values are shown in
Table 6. It can be seen that the sum of the calculated switching losses of switches 1 and bypass has very low values- [uW] and therefore, only the the conduction losses effect the total power losses of the Mosfets. If the switching frequency will be significantly increased to the values of kHz, the switching losses will become more dominant and they will have to be taken into account.
Table 5 shows that for all simulated values of irradiance and duty cycles, the proposed SPC-FOCV method ensures highest supplied power
, lowest power losses
and as a result highest efficiency compared to the conventional FOCV and the pilot cell methods.
The increase of the duty cycle results in higher efficiency. Therefore, the duty cycle should be set to the highest possible value. The operation frequency should be defined according to two parameters- estimation accuracy and switching power losses. The increase of the operation frequency will result in better accuracy of the estimated voltage but the Mosfet power losses will be also increased and the efficiency will be decreased. Therefore, the operation frequency should be matched according to the irradiance conditions of the PV installation.
The P&O method identifies the maximum power point without disconnection of the PV from the load and therefore, the power losses are zero and its efficiency is 100%. However, the implementation of the P&O method is more complicated and requires DSP.
4.2. SPC-FOCV Operation under Temperature Variations
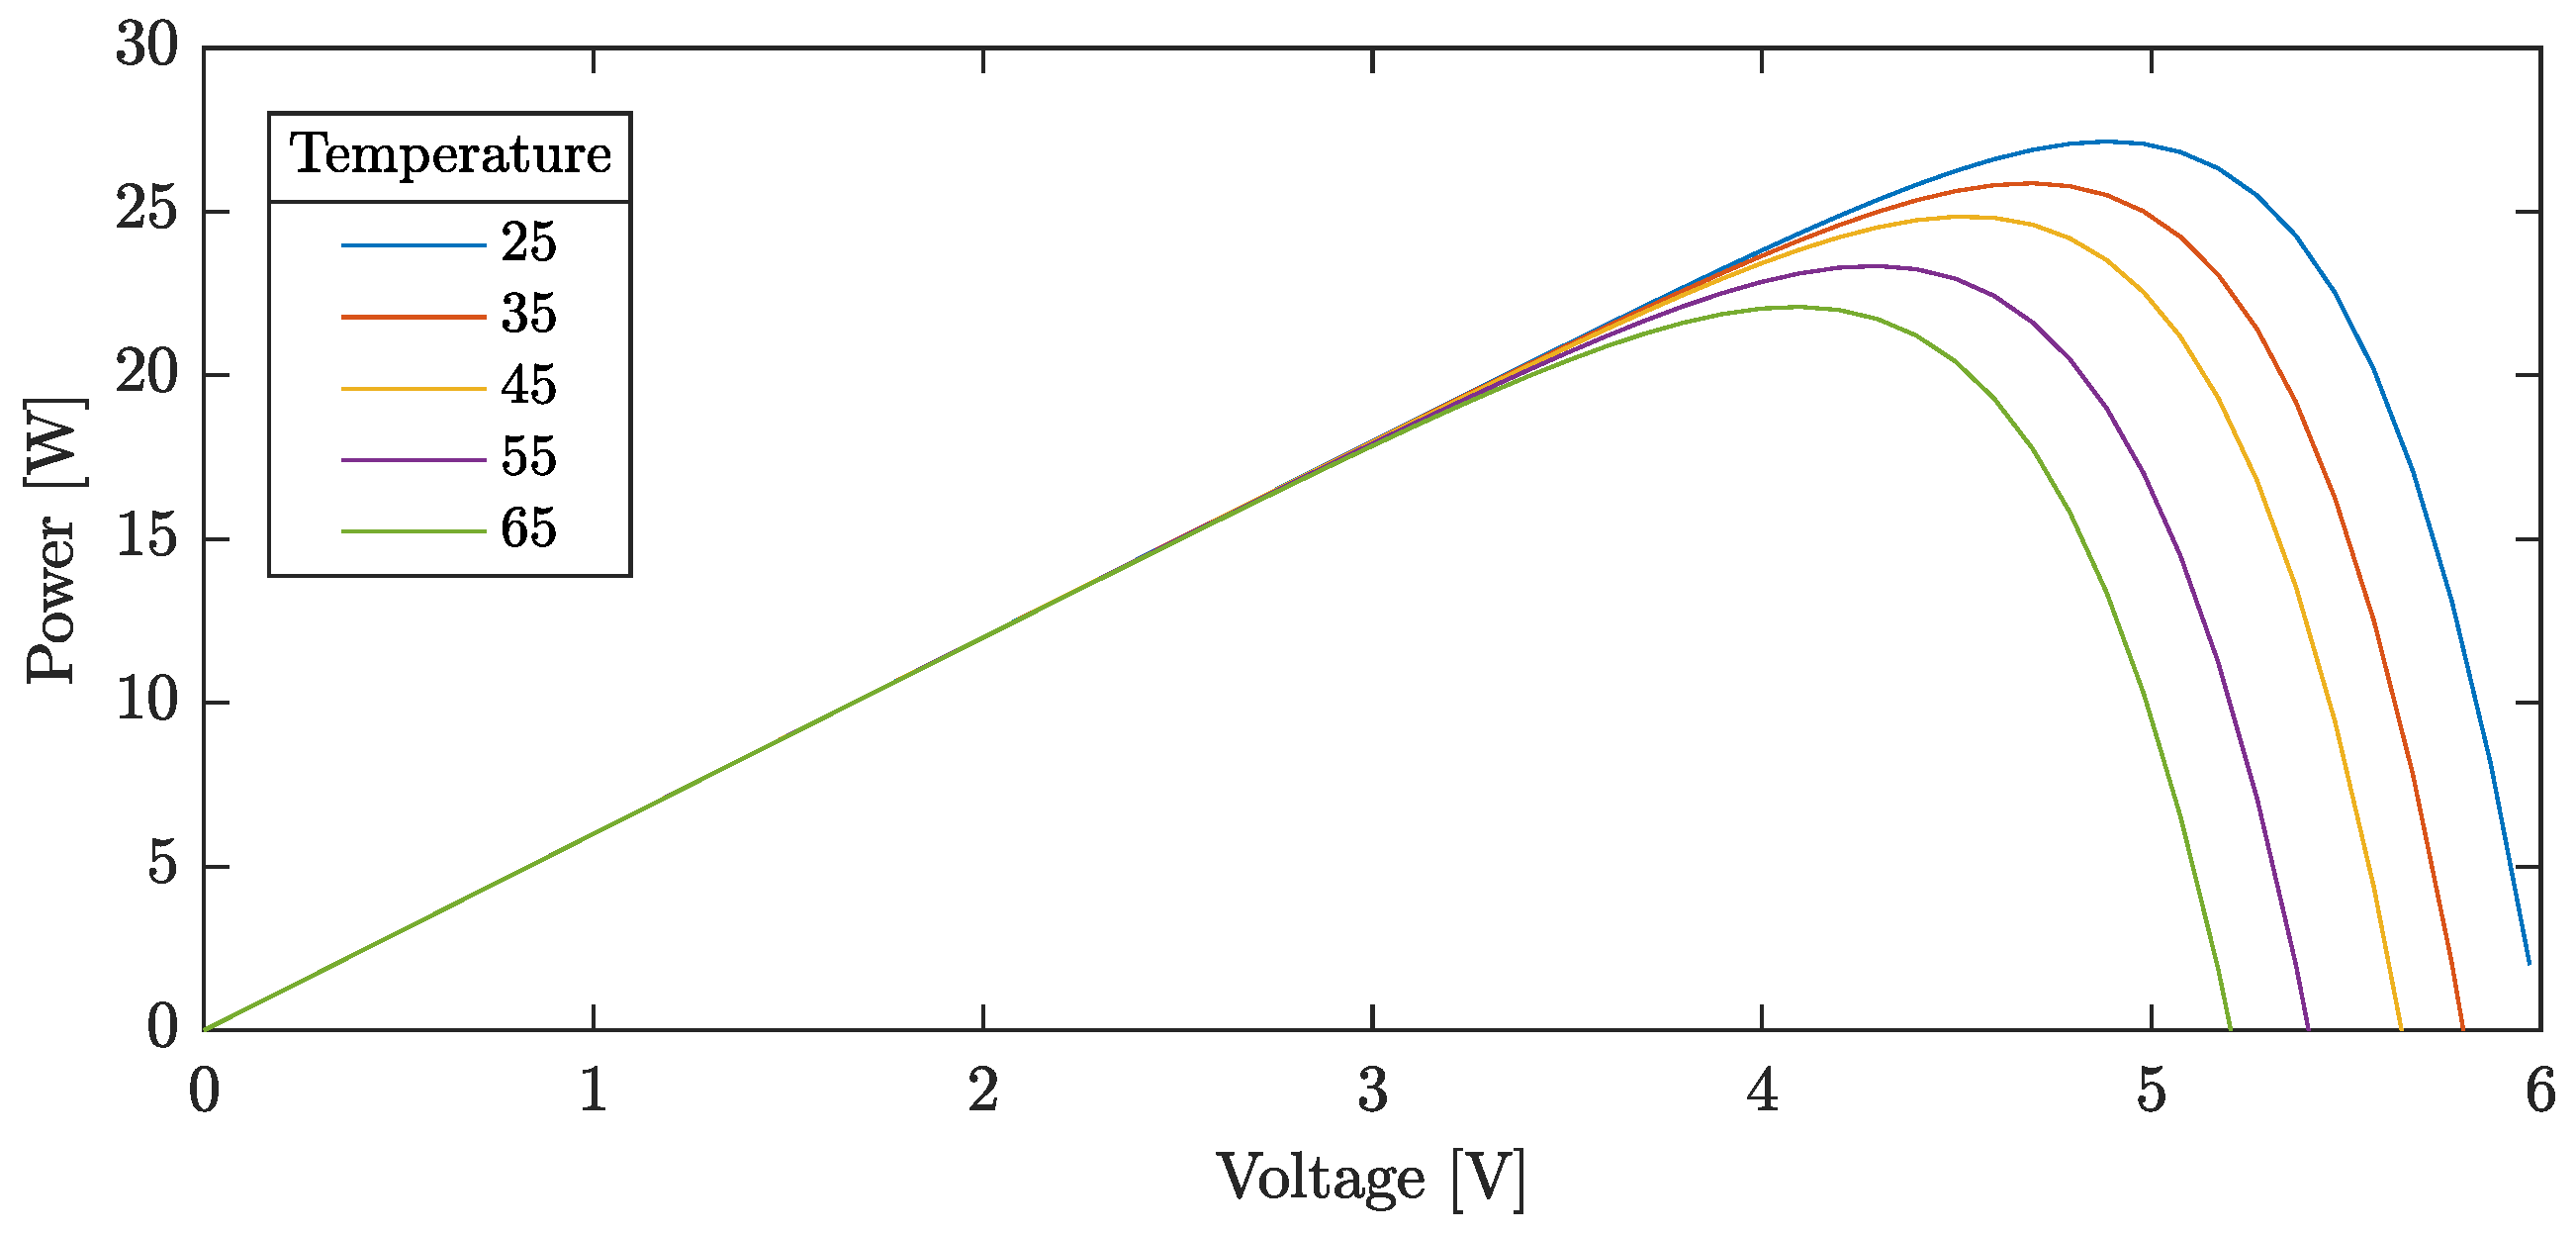
Other set of simulations was performed for temperature variations between 25 °C to 65 °C while the irradiance was kept constant at 1000 W/m
2 (the nominal temperature of the simulated panel is 25 °C). The graph of the simulated PV output power vs. output voltage curves for different temperature values is shown in
Figure 13. This graph can be used in order to measure the value of the PV array’s
voltage for each specific temperature. These curves were obtained by using simulation setup shown in
Figure 9 where the temperature of the PV array was changed according to the desired curve. It can be seen that the temperature variations significantly effect the open-circuit voltage which is reduced when the temperature is increased. The calculated voltage factor for different temperature values is shown in
Table 7.
Table 7 shows that the voltage factor decreases when temperature changes from 45 °C to 65 °C. Therefore, for these temperature values an error in
estimation is expected.
The PV panel from the previous section was operated by SPC-FOCV at 25 to 35, 45, 55, and 65 °C with operation cycle of 1 s and
= 99%. The
voltages calculated by SPC-FOCV method under varying temperatures can be compared to the
voltages measured from the graph shown in
Figure 13. This comparison is presented in
Table 8. It can be seen that
estimation error appears at temperature of 45 °C and increases with the temperature rise. At temperature of 65 °C, the estimation error is maximal 0.95%. However, this error value is very low and acceptable according to IEEE standards.
It can be seen that the SPC-FOCV method provides precise estimation of voltage during the irradiance and temperature changes except for high temperature and/or low irradiance values where small errors are present. Additional errors can appear if the irradiance or temperature vary very fast while the frequency of the operation cycle is too low and not matched to the rate of changes in irradiance or temperature. This inaccuracy can be reduced or completely avoided by increasing the frequency of the operation cycle according to the irradiance or temperature conditions.
The semi-pilot cell and its switching mechanism has to be integrated into the PV array during its manufacturing process. The proposed SPC-FOCV method is more suitable for small PV systems consisted of limited number of PV panels. The integration of the semi-pilot cell in every panel of a large PV system with many PV panels would require high manufacturing costs.


