1. Introduction
By making full use of the complementary information of the remote sensing images and other source images of the same scene, image fusion can be defined as the processing method for integrating this information together to obtain a fused image, which is more suitable for the human visual system [
1]. Through image fusion, we can obtain one composite image, which contains more special features, and can provide more useful information. As a powerful tool for image processing, image fusion covers broad range of areas [
2,
3], such as computer vision, remote sensing, and so on [
4].
Diversiform remote sensing image fusion methods have been proposed in recent years, which can be divided into three categories: Pixel-level fusion, feature-level fusion, and decision-level fusion [
5]. Feature-level fusion mainly deals with the features of the source images, while decision-level fusion makes the decision after judging the information of the source images. Compared with the aforementioned levels, pixel-level fusion can serve more useful original information, although it has some shortcomings such as being time consuming. Despite complex computation, most researchers conduct image fusion based on pixel-fusion [
6,
7], such as the image fusion method based on the spatial domain, and the image fusion method based on the transform domain.
Recently, mainstream methods of image fusion have been based on the multi-scale transforms [
8,
9], such as image fusion based on object region detection and non-subsampled contourlet transform [
10] and image fusion based on the complex shearlet transform with guided filtering [
11]. For the image fusion method based on multi-scale transforms, the source images are represented by the fixed orthogonal basis functions, and the fused image can be obtained by fusing the coefficients of different sub-bands together in the transform domain. Although the multi-scale geometric transform can represent most features of the image, which are always complex and diverse, there are some features that cannot be represented sparsely. Thus, it cannot represent all the useful features accurately by limited fixed transforms.
The rapidly developing sparse representation methods can not only more sparsely represent the source images, but also effectively extract the potential information hidden in the source images and produce more accurate fused images, compared with the multi-scale transforms [
12,
13,
14]. Based on these findings, scholars apply sparse representation to image fusion. Mitianoudis [
13] and Yang [
14] laid the foundation for image fusion based on SR. Yu [
15] applied sparse representation with K-singular value decomposition (K-SVD) to medical image fusion, Yang [
16] applied sparse representation and multi-scale decomposition to remote sensing image fusion, and Yin [
17] applied a novel sparse-representation-based method to multi-focus image fusion.
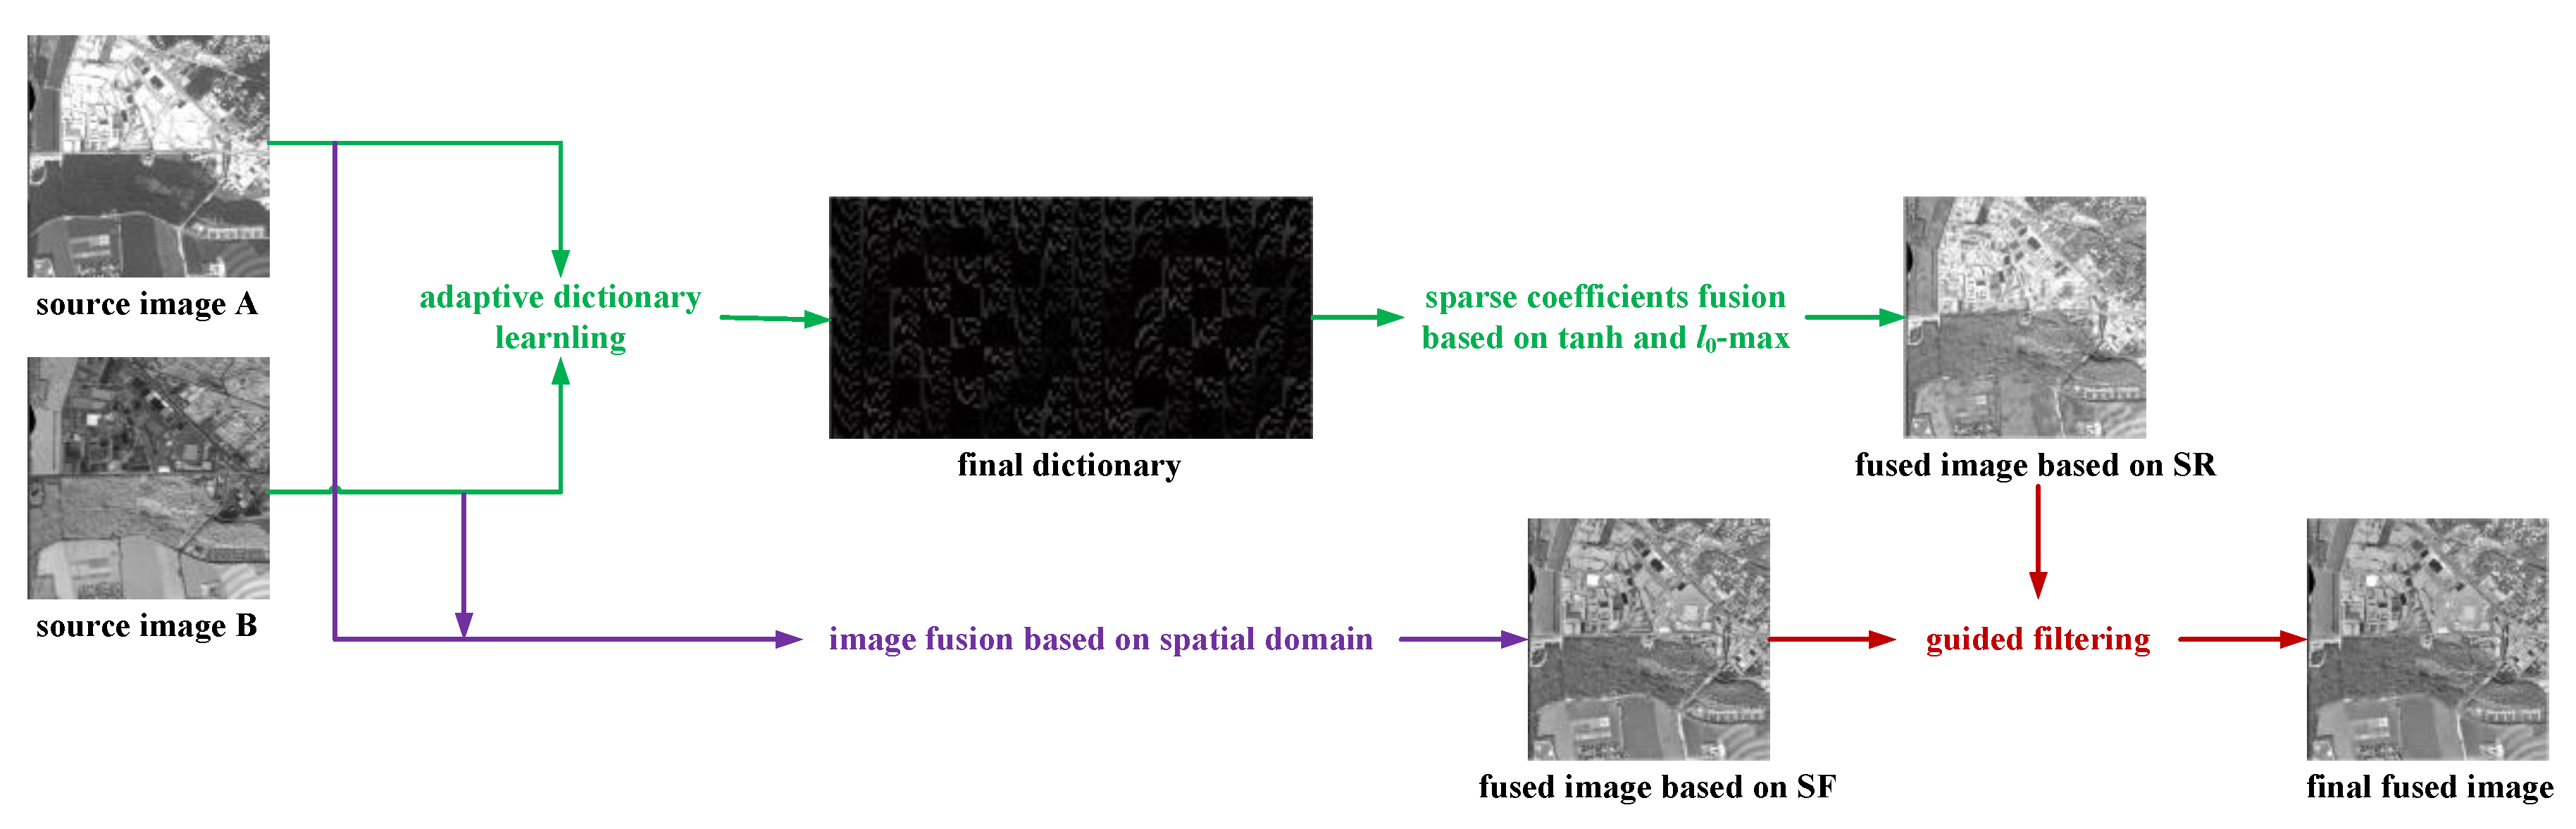
In the sparse model, the generation of the dictionary and sparse coding is crucial for the image fusion [
18]. Although the fixed over-complete dictionary can realize good fusion results, it usually takes a lot of time to obtain the sparse coefficients, resulting in inefficiency. In this paper, adaptive dictionary learning [
19,
20] is adopted for its simplicity and convenience. Motivated by the multi-strategy fusion rule based sigmoid function in reference [
21] and the characteristics of the hyperbolic tangent function, the multifarious rule based on tanh and
is proposed to fuse the sparse coefficients. Finally, by sparse reconstruction, the fused image based on SR is obtained, which is more suitable for the human visual system and subsequent image processing. However, there is more detailed information in the remote sensing images than other kinds of images. When performing image fusion by the method based on SR, it may lose some discontinuous edge features [
22], which leads to the loss of some useful information of fused images. In addition, image fusion based on SR also ignores the spatial information, which can reflect the image structure more directly and accurately. As a result, we can simultaneously fuse the source remote sensing images by the method based on SR and SF, and obtain two different fused images, namely the fused image based on SR and the fused image based on SF. In this paper the two fused images above are processed by a guided filter to obtain the final image since a guided filter has good performance with edge preserving [
23]. The main contributions of this paper can be summarized as follows.
(1) The learning of the dictionary is vital for sparse representation, and the adaptive dictionary of each source image can be generated in every step of dictionary learning. The final dictionary can be obtained by gathering together the sub-dictionaries. As a result, this work enriches the dictionary and can make the coefficients more sparsely.
(2) As is well known, the information in each source image is complementary and redundant. When fusing images to obtain the fused image, we need to consider the relationship between different source images. For the redundant information of the source images, the weighted rule would be better; on the other hand, the choose-max rule would result in a fused image with less block effect. Based on the above considerations and the characteristics of hyperbolic tangent function, the fusion rule based on tanh and is proposed in this paper.
(3) The image fusion methods based on SR can obtain the fused image by sparsely coding the source images and fusing the sparse coefficients. However, it ignores the correlation of the image information in the spatial domain and loses some important detailed information of the source images. In this paper, we adopt the image fusion method based on SF and filter the fused image based on SR and SF by the guided filter. By making full use of the information in the spatial and the sparse representation domain, the fused image can reserve more information of the source images.
The rest of this paper is organized as follows. The theory of the sparse representation is introduced briefly in
Section 2. Adaptive dictionary learning is presented in
Section 2.1, and the proposed fusion rule is given in
Section 2.2. The flow chart of the remote sensing image fusion method based on SR and guided filtering is drawn in
Section 3. In
Section 4, some experiments and result analysis are done. Finally, conclusions are made in
Section 5.
2. Sparse Representation
SR has been widely used in image processing, as one of the most powerful tools to represent signals especially image signals, such as image de-noising [
24], image coding [
25], object tracking [
26], and image super resolution [
27], etc.
In the SR model, the image is sparse and can be represented, or approximately represented, by one linear combination of a few atoms from the dictionary [
14,
28,
29]. Suppose that the source image is
, and the over-complete dictionary is
, the sparse representation model can be formulated as follows [
16,
22].
where
denotes the sparse coefficients of the image and
denotes the
, respectively, which indicate the number of non-zero elements in the corresponding vector. Usually,
, and
is the maximal sparsity.
indicates the limiting error.
For the image fusion method based on SR, there are two important steps: dictionary learning and sparse coding. Dictionary learning will be discussed in detail in
Section 2.1. When performing sparse coding by orthogonal matching pursuit (OMP) [
30] in this paper, Equation (1) can be replaced by Equation (2).
where,
is the penalty factor.
2.1. Adaptive Dictionary Learning
When fuse the source images by the methods based on SR, dictionary learning is one of important processes. To make full use of the image information, we generate a dictionary based on the source images themselves. And the generation of the adaptive dictionary can be changed into the iteration of the dictionary atoms. By the iteration process, it can realize dictionary learning with the over-complete dictionary based on the source images.
Since dictionary learning is more efficient for small image blocks, if the dictionary updating step is processed by the original source images directly, the sparsity would be seriously influenced. Thus optimal sparse coefficients cannot be obtained [
29]. In order to solve this problem, we divided the source images into image blocks, which can replace the dictionary atoms for better dictionary learning. The improved dictionary generation method can not only obtain the optimal sparse representation but also accelerates the efficiency and accuracy of the SR algorithm. However, since we perform dictionary learning on the image block rather than the whole image, the reshaped vector on every atom is not very large and it reduces the computation cost.
K-singular value decomposition (K-SVD) [
31] is one of the most used image fusion methods based on SR. Here, we adopt the K-SVD model on the sub-dictionary of the image block by the following iteration process:
where
denotes the position
in the image
and
denotes the image block with the center pixel at the corresponding position
.
Then, we can obtain the adaptive dictionary of the source image
shown in Equation (4).
At last, we can gather all the dictionaries of different source images by Equation (5), where
denotes the total number of the source images.
2.2. Fusion Rule Based on tanh and
As we all know, the fusion rules are vital for the final fusion results and for the sparse coefficients. In most cases, we always take the
rule to obtain the fused block vectors [
7], where
means the sum of absolute values of the vector elements. However, when there are noises or some unwanted pixels in the flat area of the source images, the unwanted portion will be included and lead to incorrect fusion [
17]. The information in the source images is redundant and complementary for the image fusion shown in
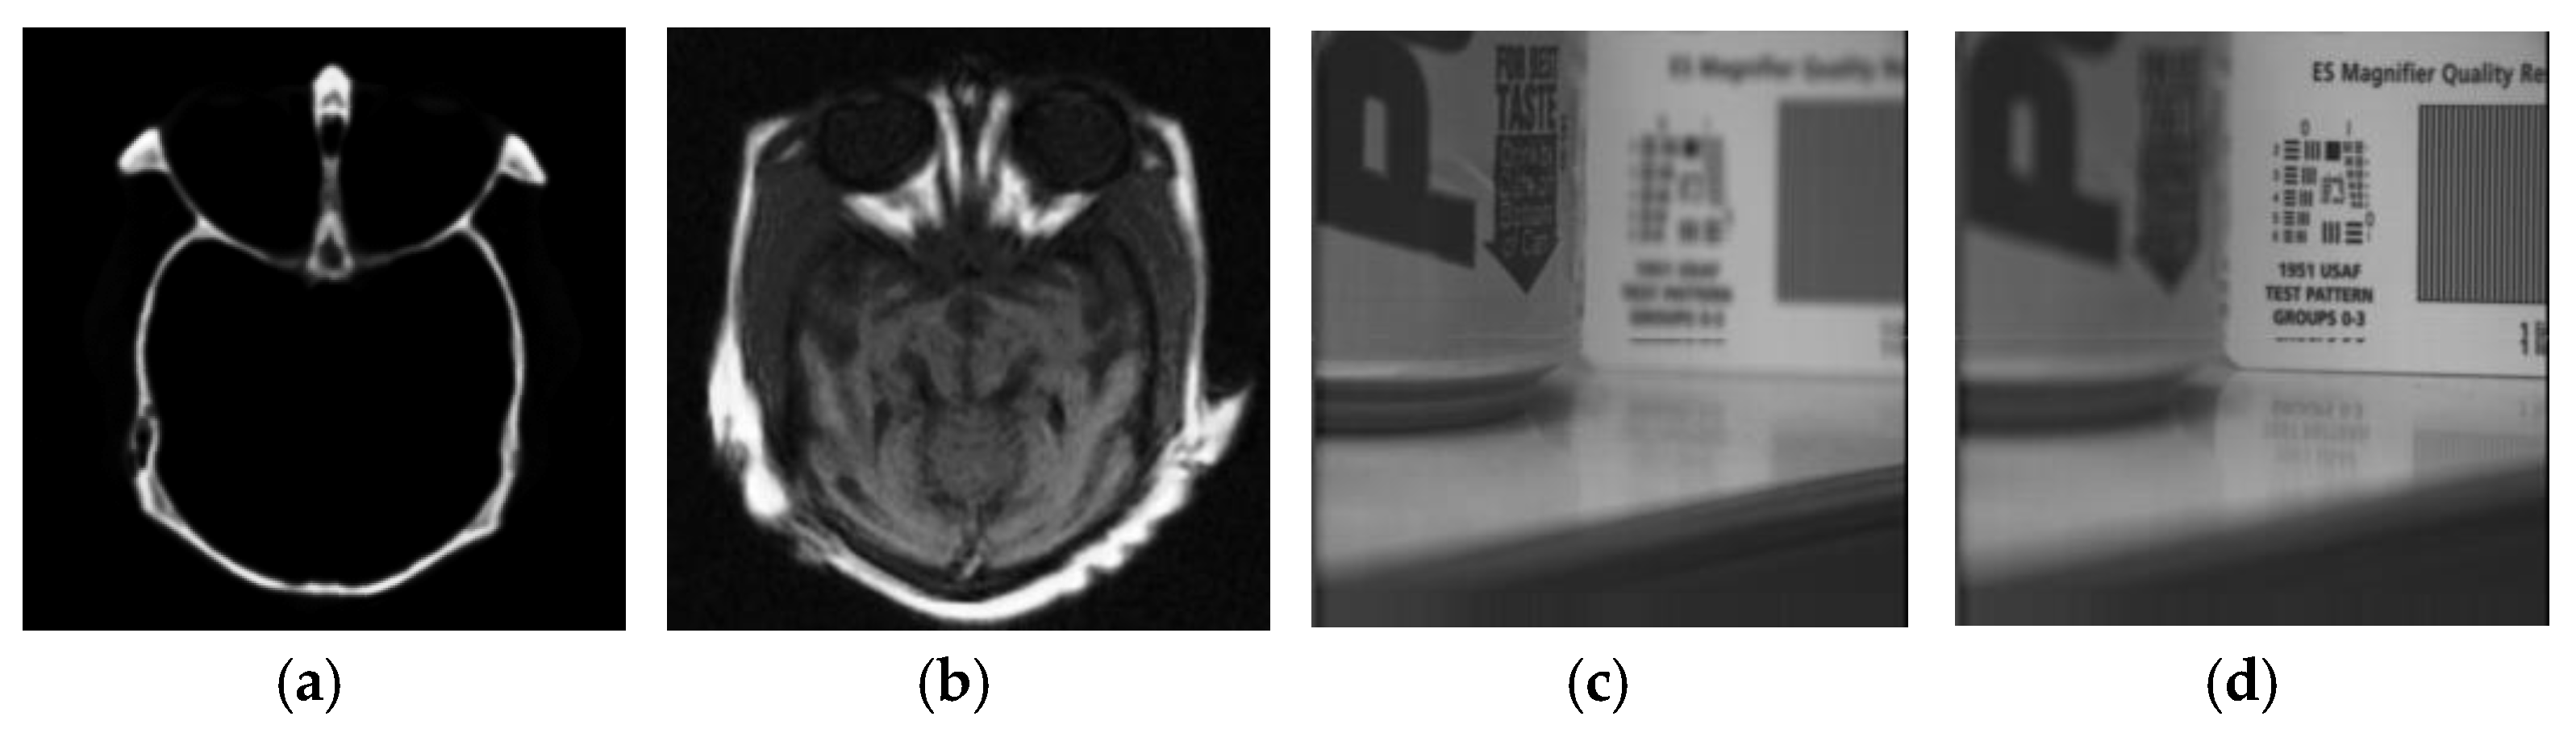
Figure 1.
Figure 1a,b are one set of medical images, which contain complementary information, while
Figure 1c,d are one set of multi-focus images, which contain redundant information. When the relationship of the image information is redundant, the weighted fusion rule is chosen, and the max fusion rule should be chosen for the complementary sparse coefficients [
21]. The fused information would be lost and incomplete if the complementary information is multiplicative by the weighted factor. Based on these considerations, we proposed one new sparse coefficient fusion rule based on tanh and
. We can obtain the fused coefficients by calculating
and the weighting factor based on tanh.
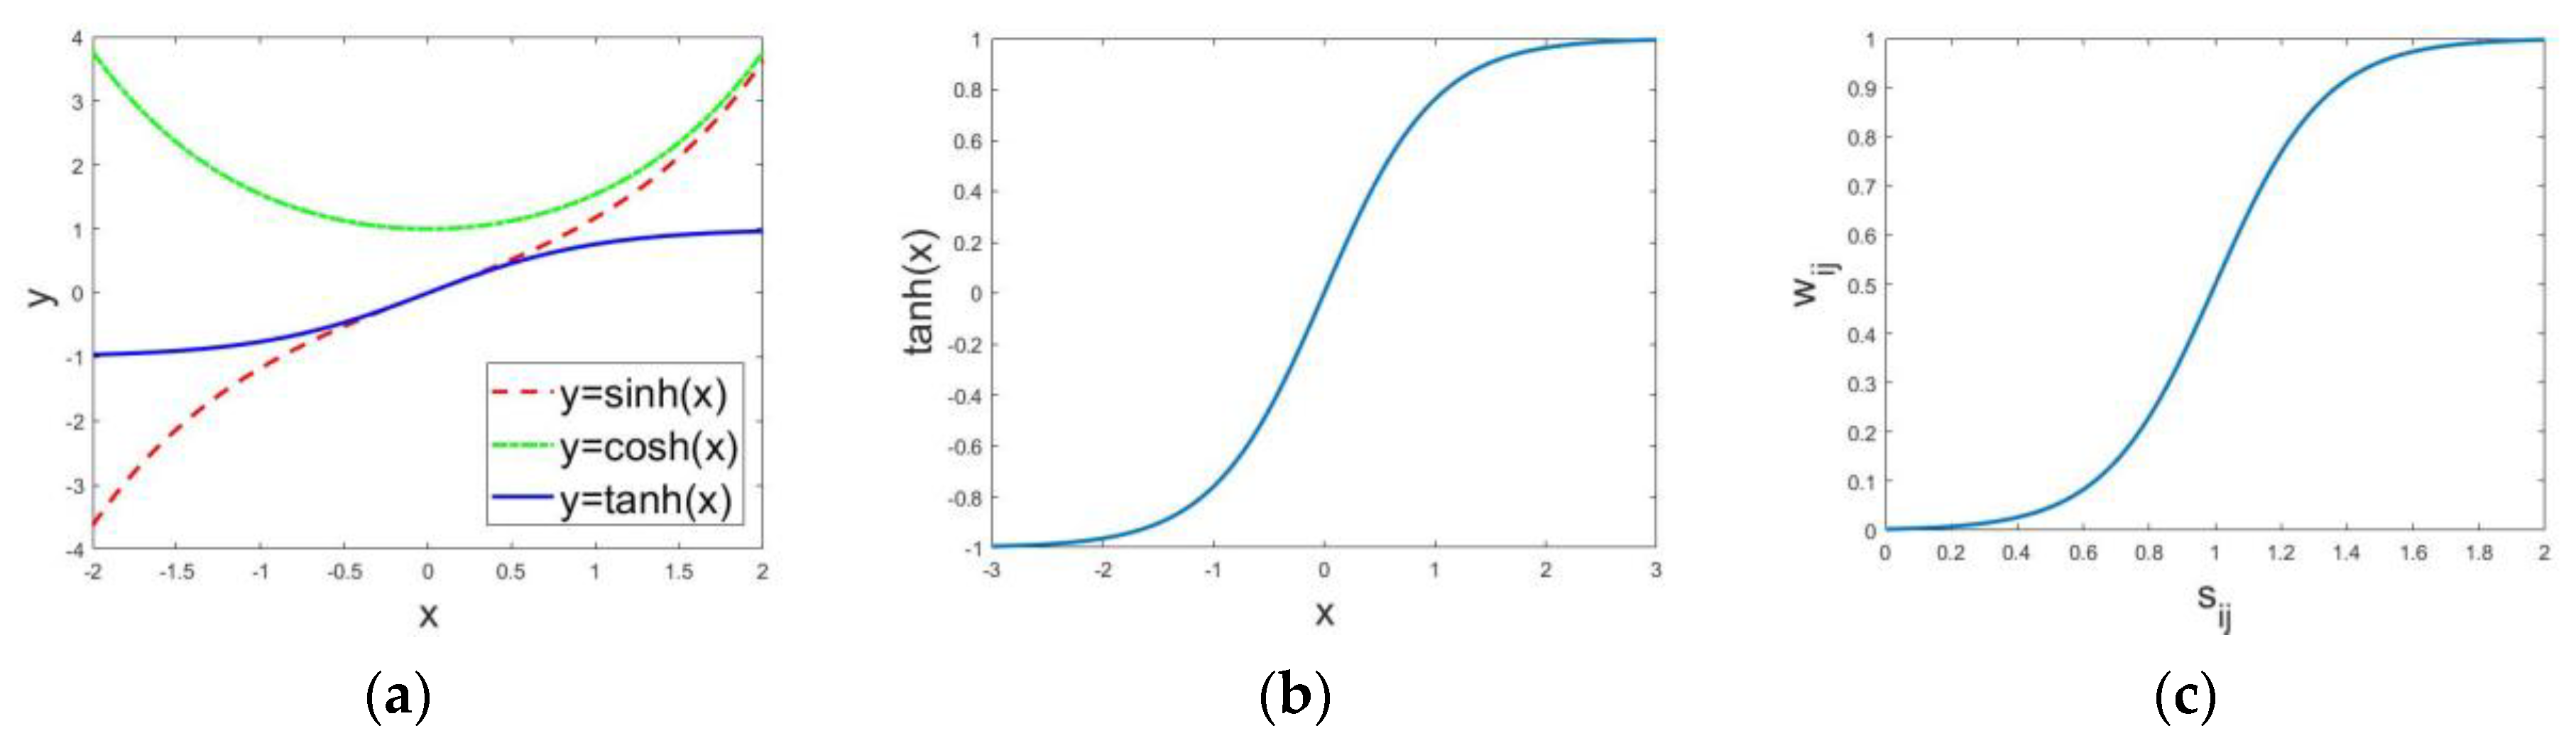
The hyperbolic tangent function is one of the hyperbolic functions, and derives from hyperbolic sine function and hyperbolic cosine function [
32]. It can be calculated as follows:
where the hyperbolic sine function and hyperbolic cosine function can be defined as Equations (7) and (8), respectively.
Figure 2 shows the different hyperbolic functions. From
Figure 2a,b we can see that tanh is symmetrical around the origin point. As
increases, the difference between the value of the hyperbolic sine function and the hyperbolic cosine function narrows, and the value of
changes from −1 to 1. When there is redundant information in different source images and the weighted fusion rule is chosen, it would be better if different degrees of redundancy corresponded to different weights. Based on the aforementioned factors, we improve tanh shown in
Figure 2c to obtain the weighted factor for fusing the sparse coefficients, and the corresponding equation is listed as Equation (9).
where
denotes the sparse coefficient at the position
and
denotes the corresponding weighted factor when adopting the fusion rule based on tanh.
denotes the sensitivity between the sparse coefficient and the weighted factor. According to the experiments on different image groups and values of the parameter
, we found that
is the best.
Compared with
Figure 2b, the curve has a steeper slope in
Figure 2c when
is closer to 1, which means that the weighted factor is very sensitive to the sparse coefficients. When
is near 0 or too large, the weighted factor
is near 0 or 1, which means that the source images have complementary information, where the fusion rule based on
is adopted.
Finally, we can obtain the fused sparse coefficients
at the position
by Equation (10).
where
and
denotes the sparse coefficients in the source image
and
.
means that both
and
are not zero. And
can be calculated by Equation (9), where
.
4. The Experiments and Result Analysis
To testify the superiority of the proposed method, a series of experiments on the remote sensing and other source images were conducted in this section. We compared our method with some classical image fusion methods, including the multi-scale weighted gradient-based fusion (MWGF) [
33], the image fusion with guided filtering (GuF) [
34], image fusion based on Laplace transformation (LP) [
35], multiresolution DCT decomposition for image fusion (DCT) [
36], the image fusion algorithm in the nonsubsampled contourlet transform domain (NSCT) [
37], image fusion with the joint sparsity model (SR) [
1], and image fusion based on multi-scale and sparse representation(MST-SR) [
8]. With adaptive dictionary learning, the size of every image block was
. Experiments conducted on dictionary learning of different source images showed that when the number of iterations was 3, it guaranteed the convergence and stability of the coefficients. In addition, the experiments in this paper were carried out by Matlab code on an Intel Core i5-2450M (Acer, Beijing, China) 2.50 GHz with 6 GB RAM.
4.1. Objective Valuation Indexes
To evaluate the experimental results more objectively, we adopted some objective valuation indexes [
37] to evaluate the fused images by different image fusion methods, which included entropy (EN), spatial frequency (SF), Q
AB/F, and structural similarity (SSIM).
When we want to balance the wealth of information in one image, EN is a wonderful choice. The larger the value of EN in the fused image is, the more information does the image contain, which means better image fusion result. And EN can be summarized as Equation (11).
where
denotes the total number of pixels included in the image and
denotes the probability distribution of pixels for each gray level.
SF can detect the total active of the fused image in the spatial domain and it denotes the expression ability of one image for minor detail contrast. The equation of SF is shown as follows:
where
stands for the horizontal frequency while
stands for the vertical frequency. And they can be calculated by Equations (13) and (14).
where
denotes the fused image with the size of
.
While Q
AB/F can balance how much the edge information of the source images
and
does the fused image contain by Sobel operator. It can be defined as Equation (15).
where
. Normally,
is one constant and the value is 1. Taking the source image
as an example, edge information retention value
and edge strength information
can be calculated by Equations (16) and (17).
where
,
are constant and they affect the sigmoid function together.
and
.
and
denote the convolution results of Sobel model with the center pixel at the position
in the horizontal and vertical directions with the source image
.
SSIM is the structural similarity between the source images and the fused image. And the equation of SSIM is as follows:
where
denotes SSIM of the source image
and fused image
, and so is
. More detail of their calculation is shown in Equations (19) and (20).
where
denote the average of pixels of the image
and
, respectively.
denote the variance and
denote the joint variance. For the convenience of calculation, we make
.
The larger all the indexes above are, the better the fused image is. What’s more, when obtaining the adaptive dictionary by the proposed method, there is slight deviation of the final results. We adopt the mean of the evaluation values in three times.
4.2. Large Scale Image Fusion of Optical and Radar Images
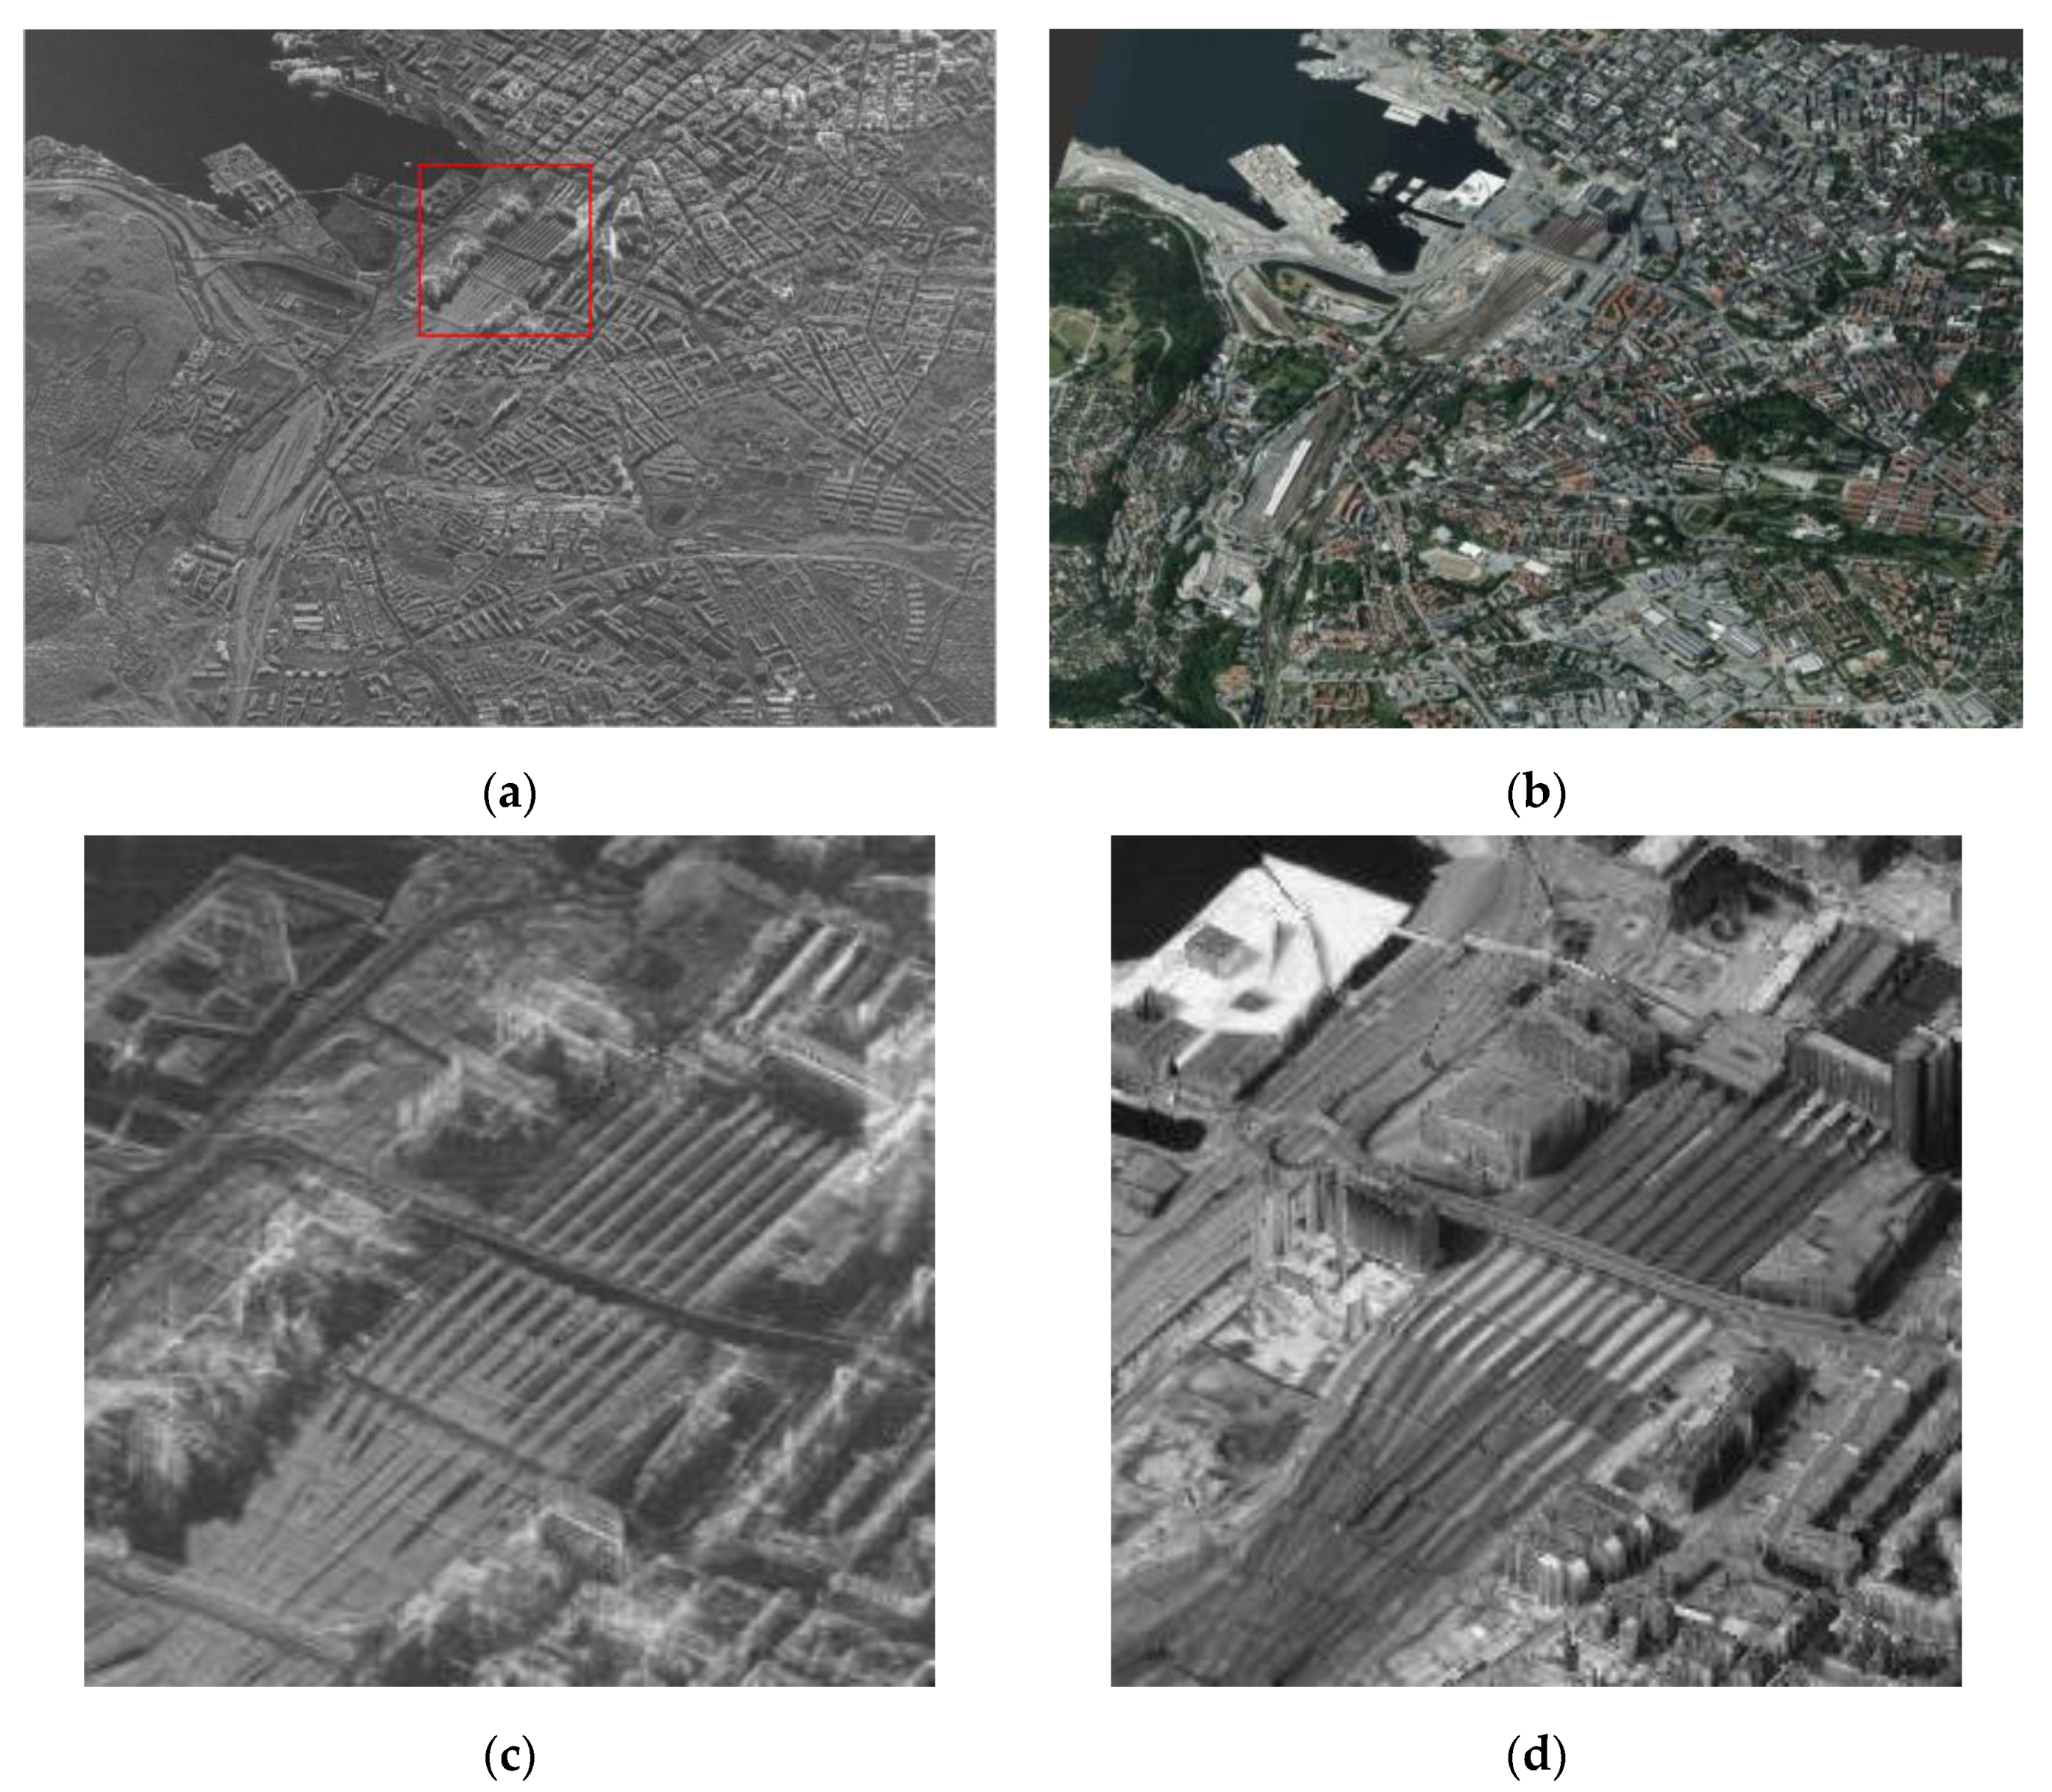
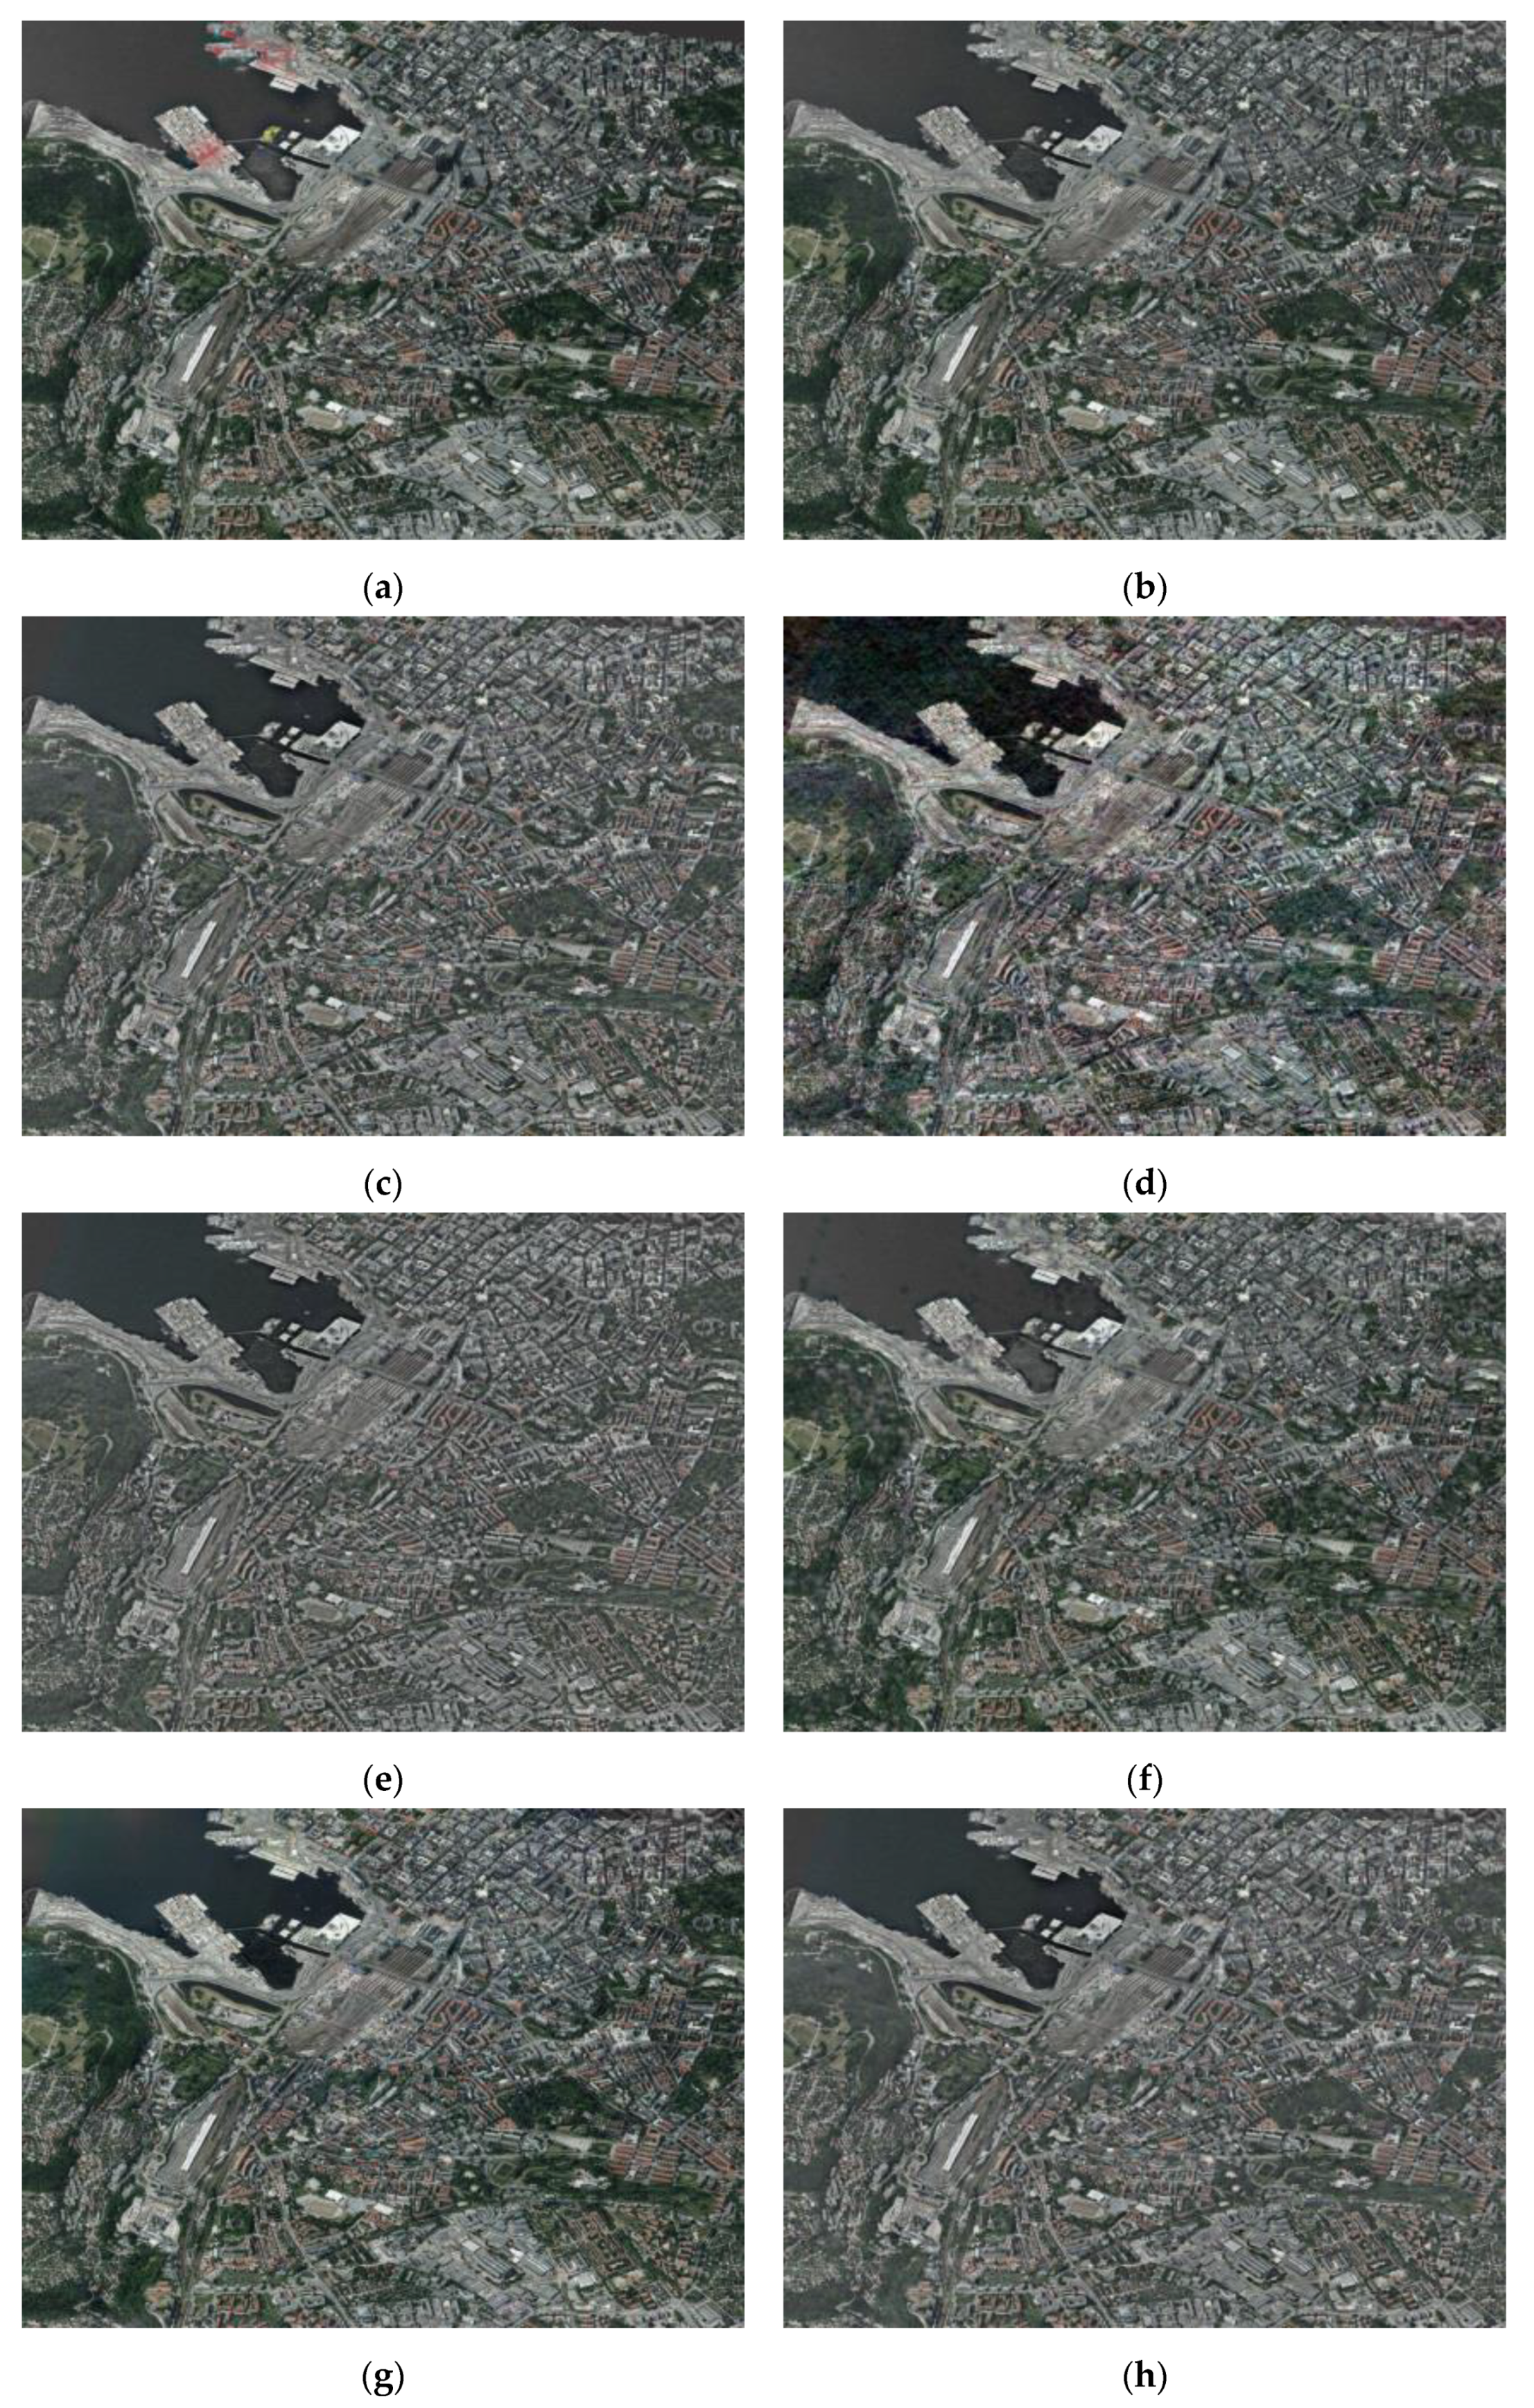
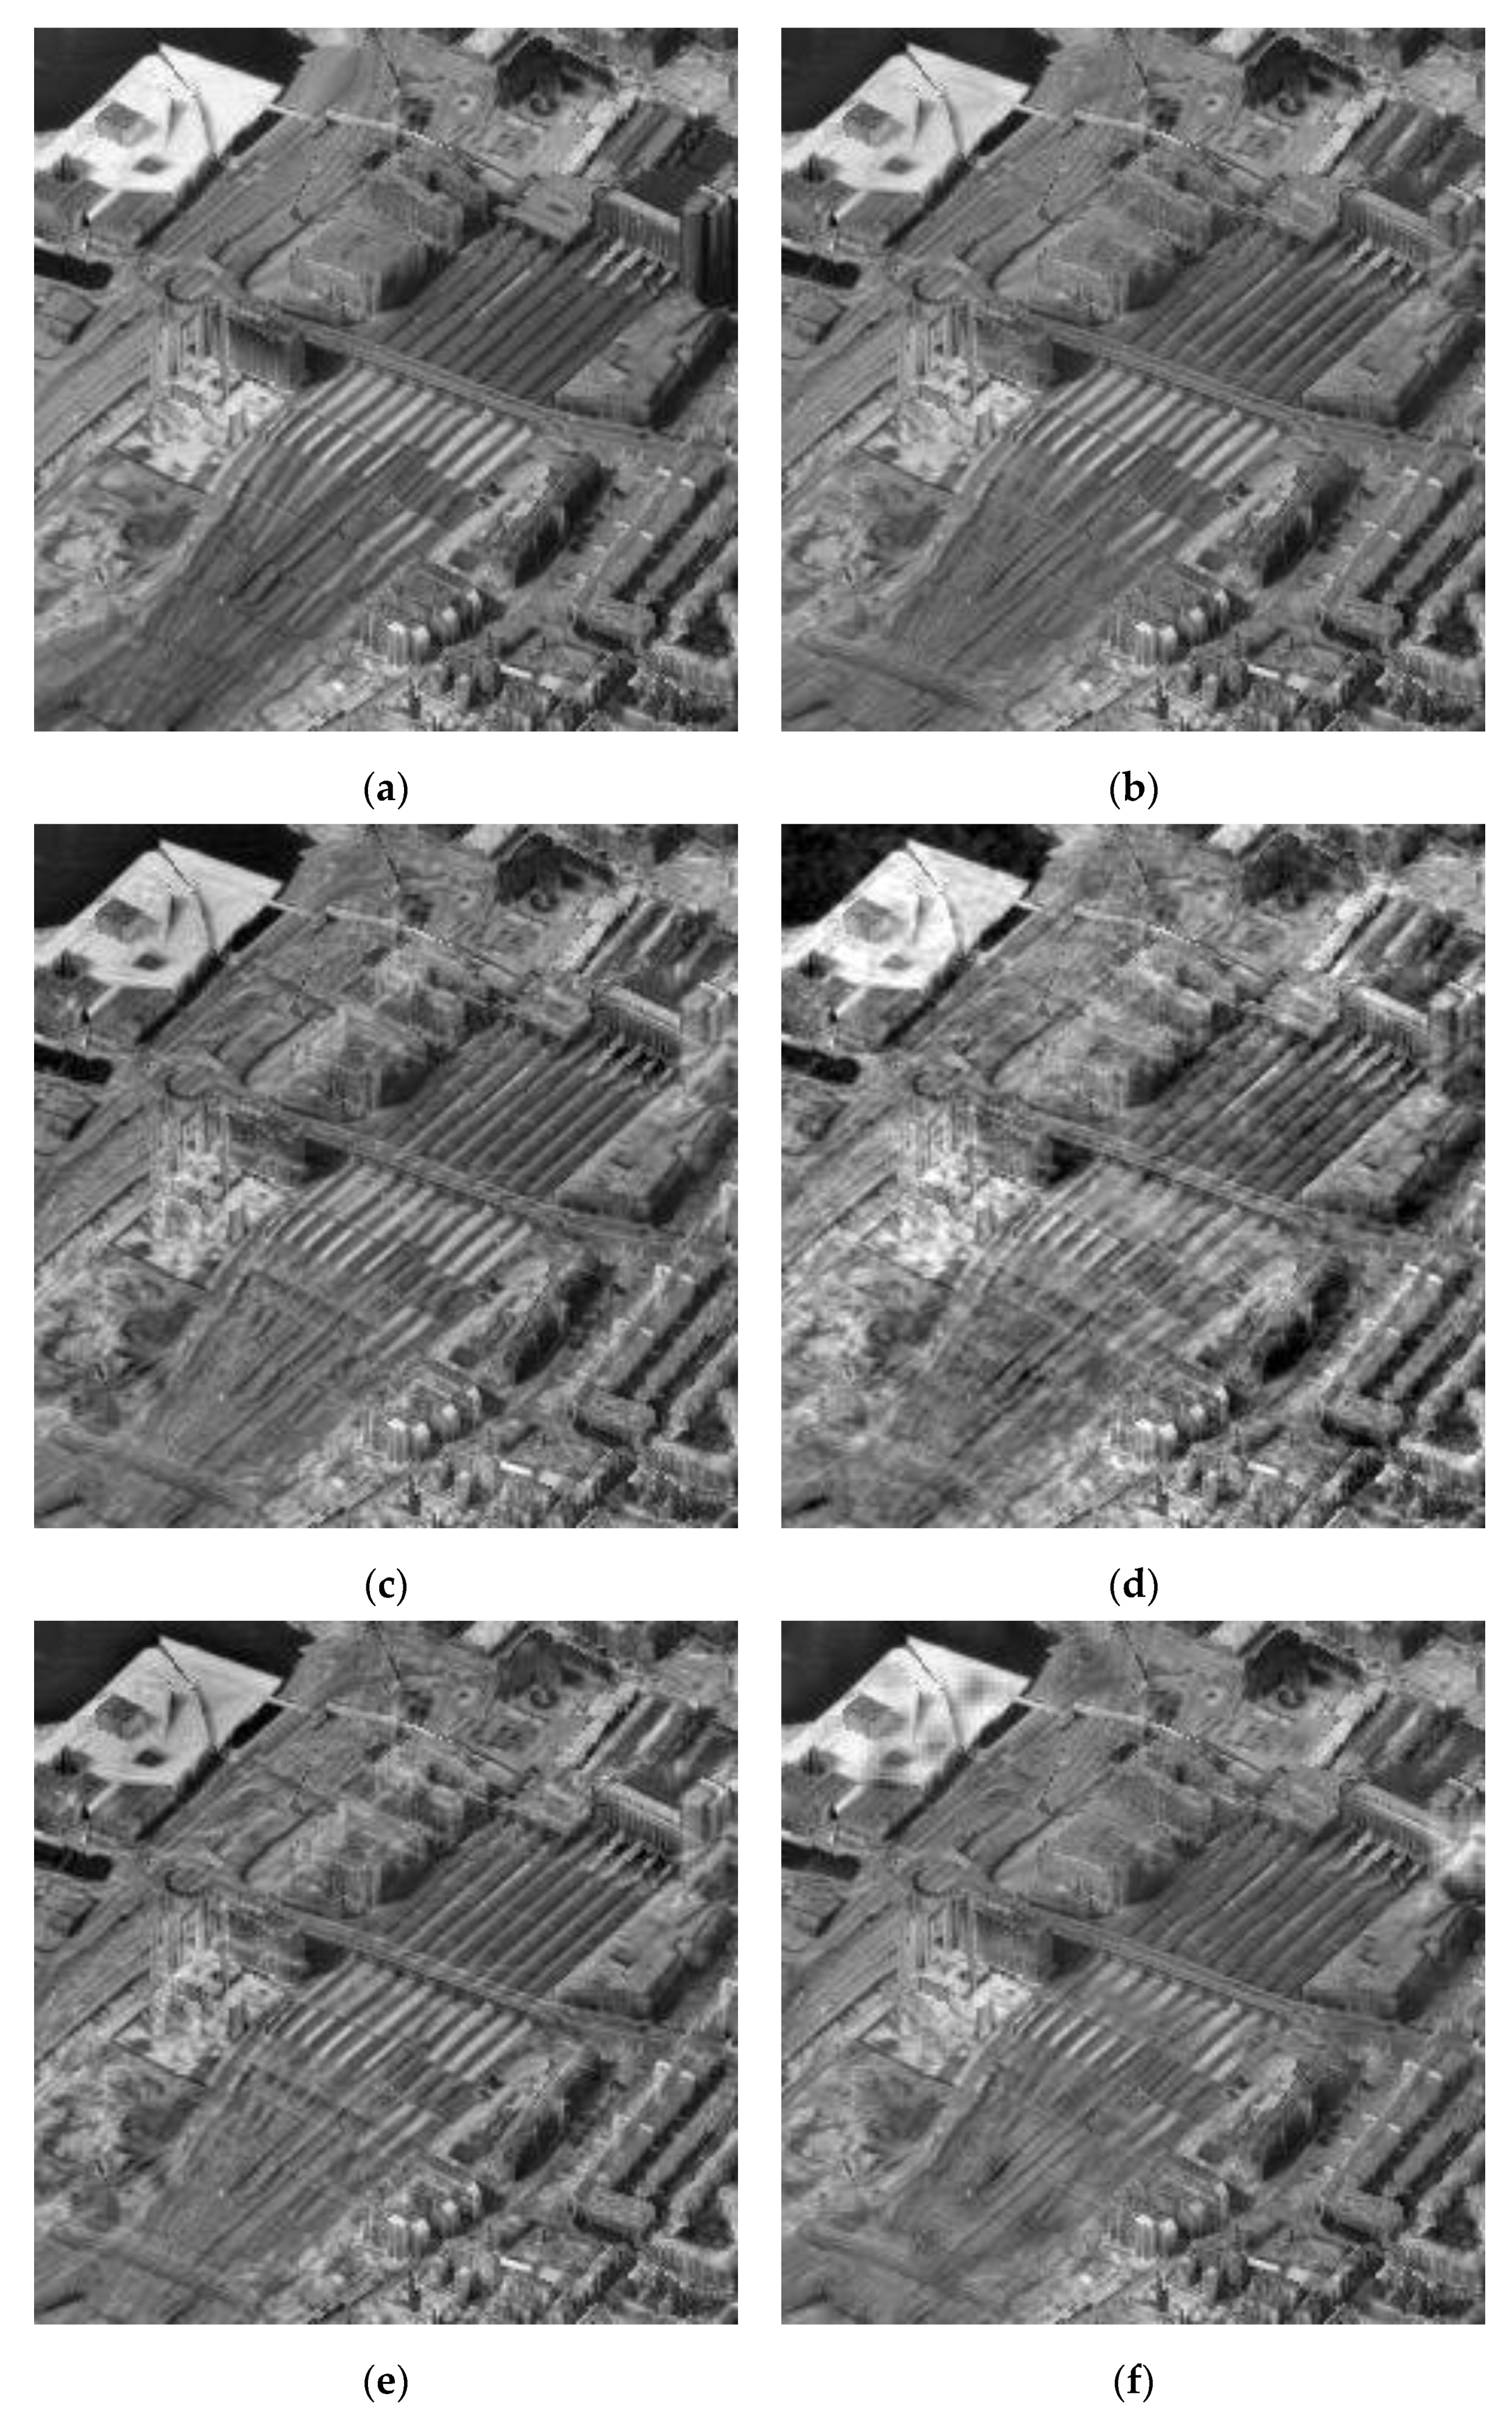
Figure 4 shows one SAR image of the harbor around Oslo with a size of
and the registered optical image on a large scale for the whole scenery [
38]. Due to the use of the high-resolution digital elevation model (DEM), the optical image fits onto the signatures of the buildings very well.
Figure 4c,d are partially enlarged details of
Figure 4a,b at the position of the red rectangle in
Figure 4a.
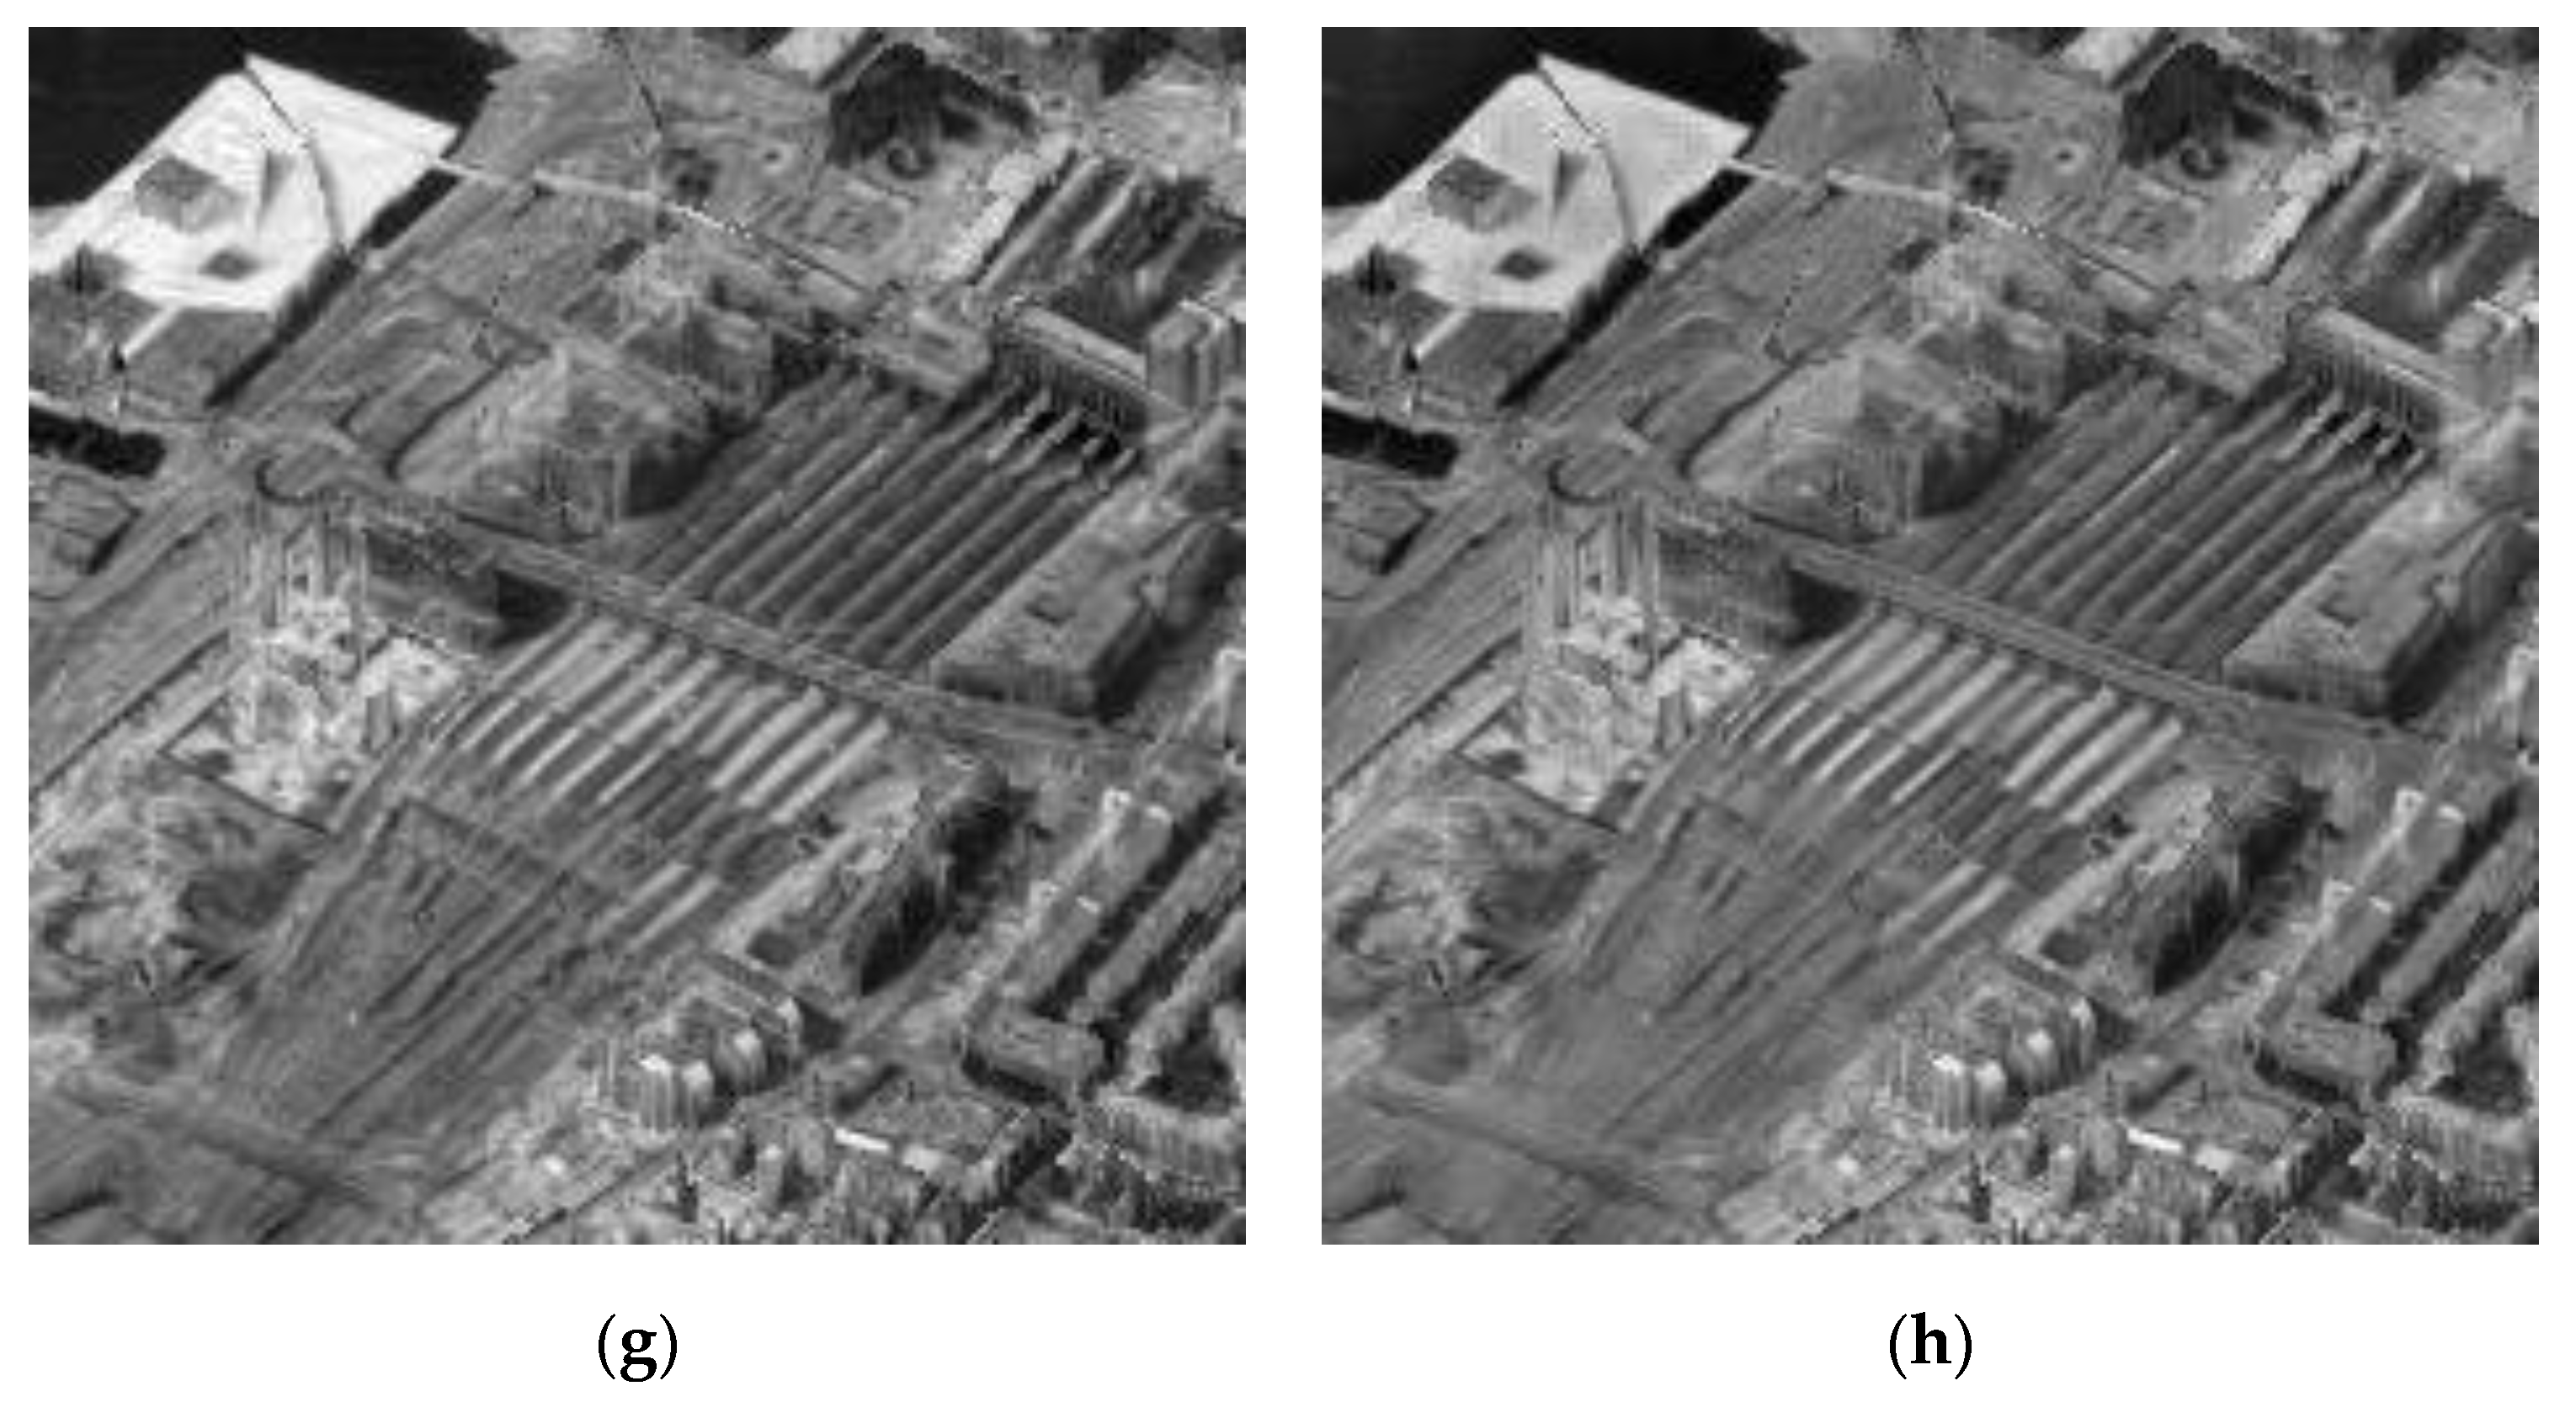
Figure 5 and
Figure 6 are the corresponding fused images obtained by the methods above, and partially enlarged views.
Since the optical image in
Figure 4b is colorful, we processed the image fusion in the RGB dimension separately. Although the visual effect of
Figure 6a is better, there was a greater color contrast in
Figure 5a, which introduced some incorrect information in the left corner. In
Figure 6, the partially enlarged detail images of
Figure 5d by DCT and
Figure 5f by SR are very blurred which seriously affects the fused images. Compared with
Figure 6g, the left corner in
Figure 6h contains more information of the remote sensing image in
Figure 5c, which indicates that the fused image by our method is better.
Table 1 shows the corresponding index values of the fused images in
Figure 5 and the best values are in bold. From
Table 1, we can see the image fusion methods based on the spatial domain such as MWGF and GuF have big ability to preserve the spatial frequency, and MWGF has a better value of Q
AB/F. However, the visual result of MWGF is the worst. Q
AB/F of the proposed method ranks third among the compared methods, which is worse than the methods based on the spatial domain. This explains why we adopt the image fusion method based on the spatial domain and guide it with the fused image-based SR in this paper. The values of EN, SF, and SSIM of the fused image obtained by the proposed method are better, which indicates that the proposed method has a better ability to fuse the remote sensing image.
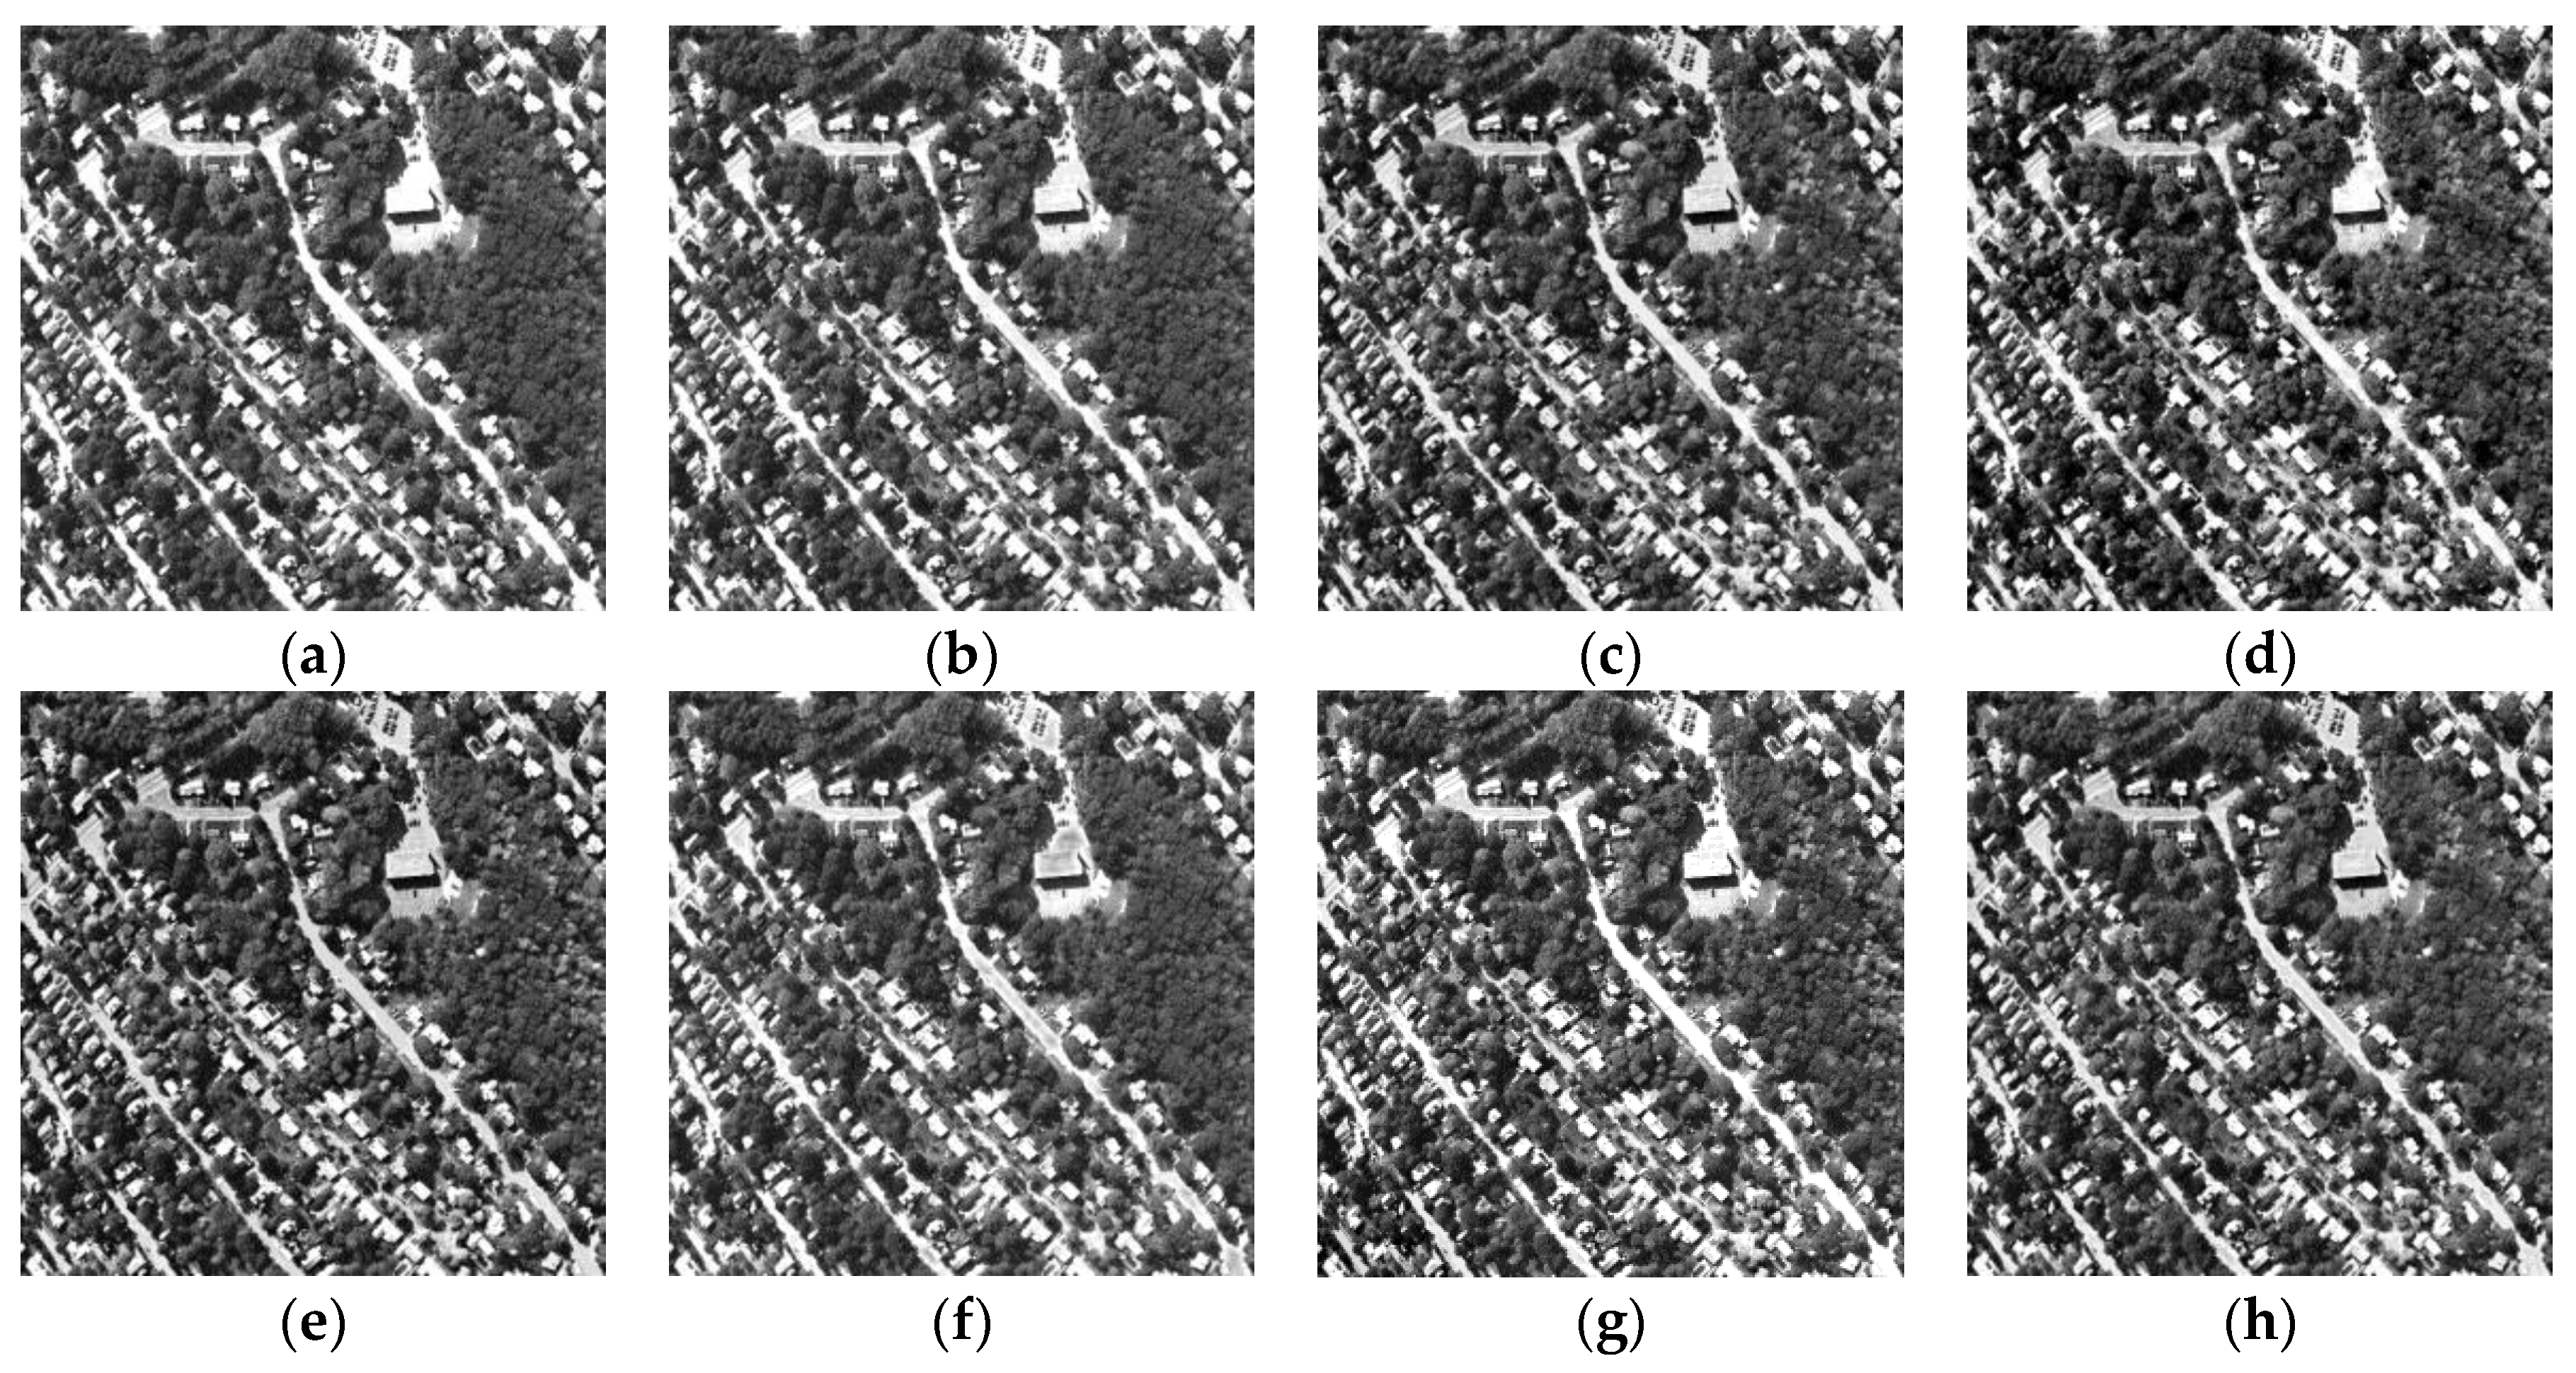
4.3. Image Fusion of Remote Sensing Images
To testify the effectiveness and universality of the proposed method, the classical image pairs shared by Durga Prasad Bavirisetti (
https://sites.google.com/view/durgaprasadbavirisetti/datasets) are used to test the performance of the fused algorithms. The dataset contains rich remote sensing images and we conduct our experiments on different kinds of image pairs, which contain the forest with greater high-frequency information, rivers with low-frequency information, and so on. To save space, we only show the four groups and the results analysis. The four groups include rich information with different types and are representative in the dataset, shown in
Figure 7.
Figure 8,
Figure 9,
Figure 10 and
Figure 11 are the fused images obtained by the diverse compared methods of the different source images.
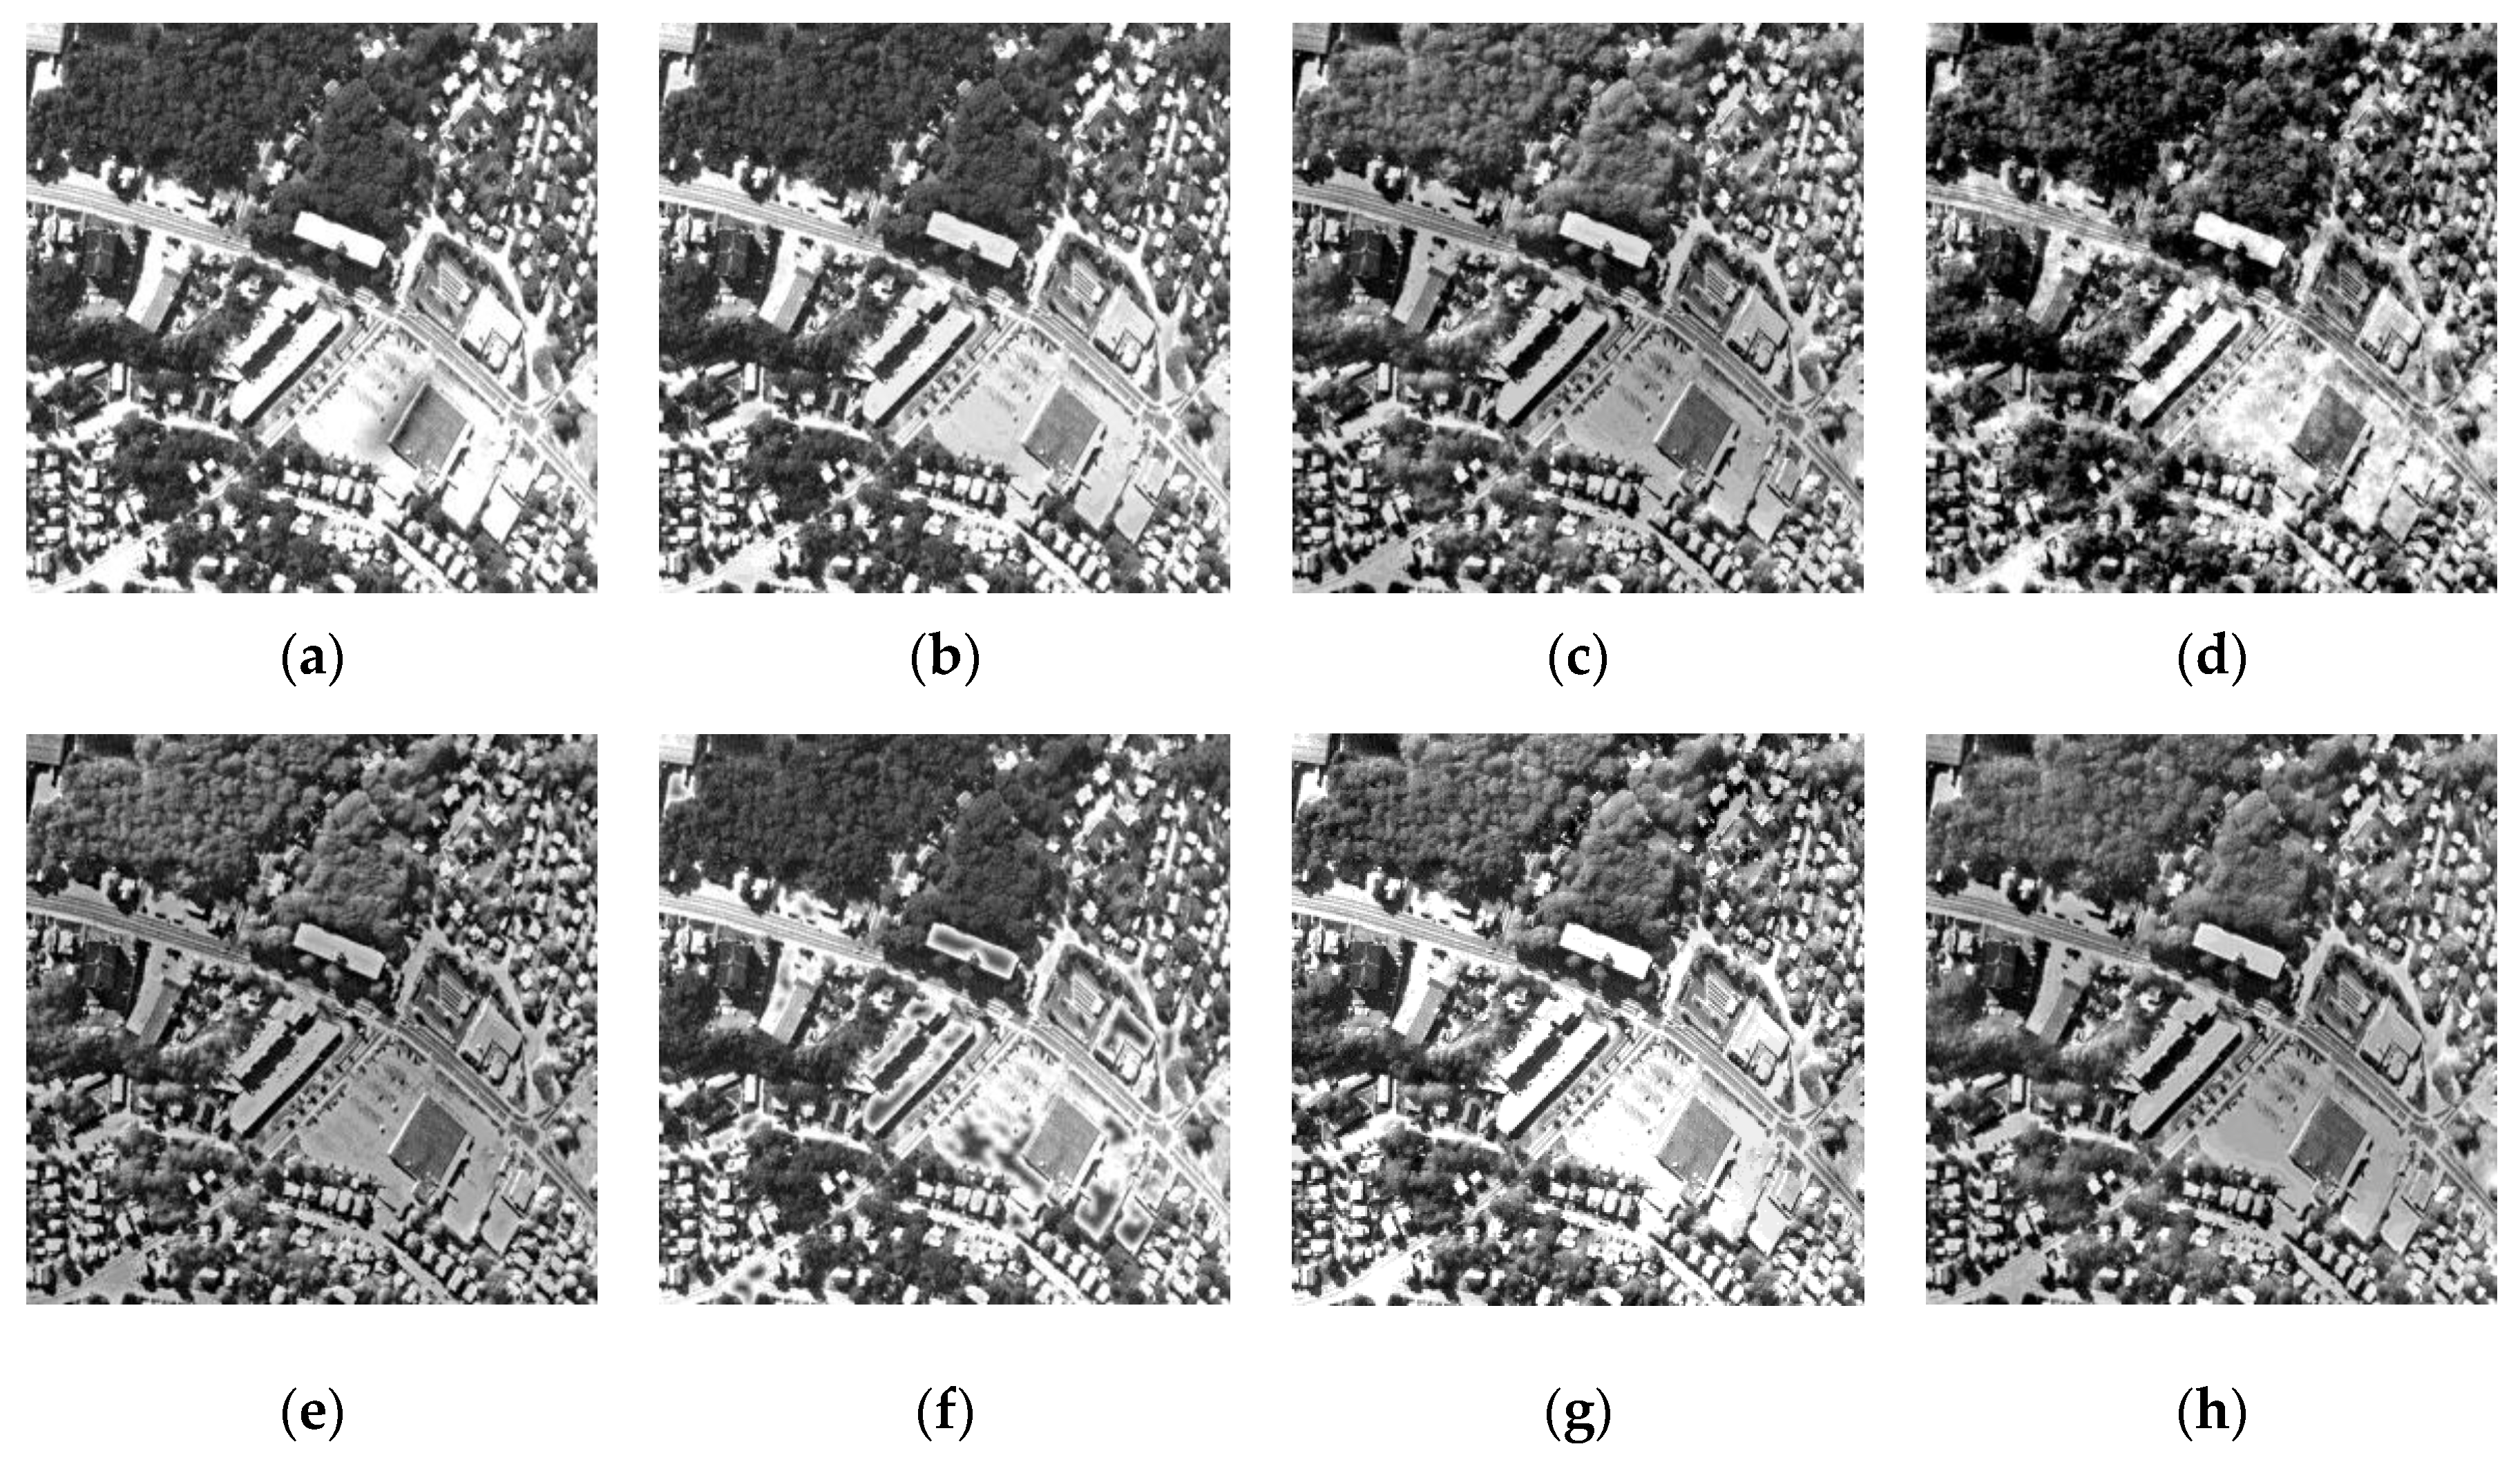
Figure 7a,b are forests and rural areas with fewer buildings, of which the top view is sharper and has richer detailed information. From
Figure 8, we can see that the trees in
Figure 8a–e is more darker than
Figure 8f–g and has less information in the second line of Group 1 in
Figure 7, which indicates that the image fusion based on SR is more powerful than the methods based on the spatial domain and transform domain. And there are some artificial textures in the roof of
Figure 8f. Above all, the fused image of
Figure 8h obtained by the proposed has better visual effect.
Compared with Group 2, there are some suburbs next to the forests in Group 1. And the contrast in
Figure 9c,e,h looks better. From the roofs in the fused images shown in
Figure 9, the flat area and edges in
Figure 9h obtained by the proposed method look more comfortable and are more suitable for we human visual system, which indicates that the proposed method has powerful ability to fuse remote sensing images.
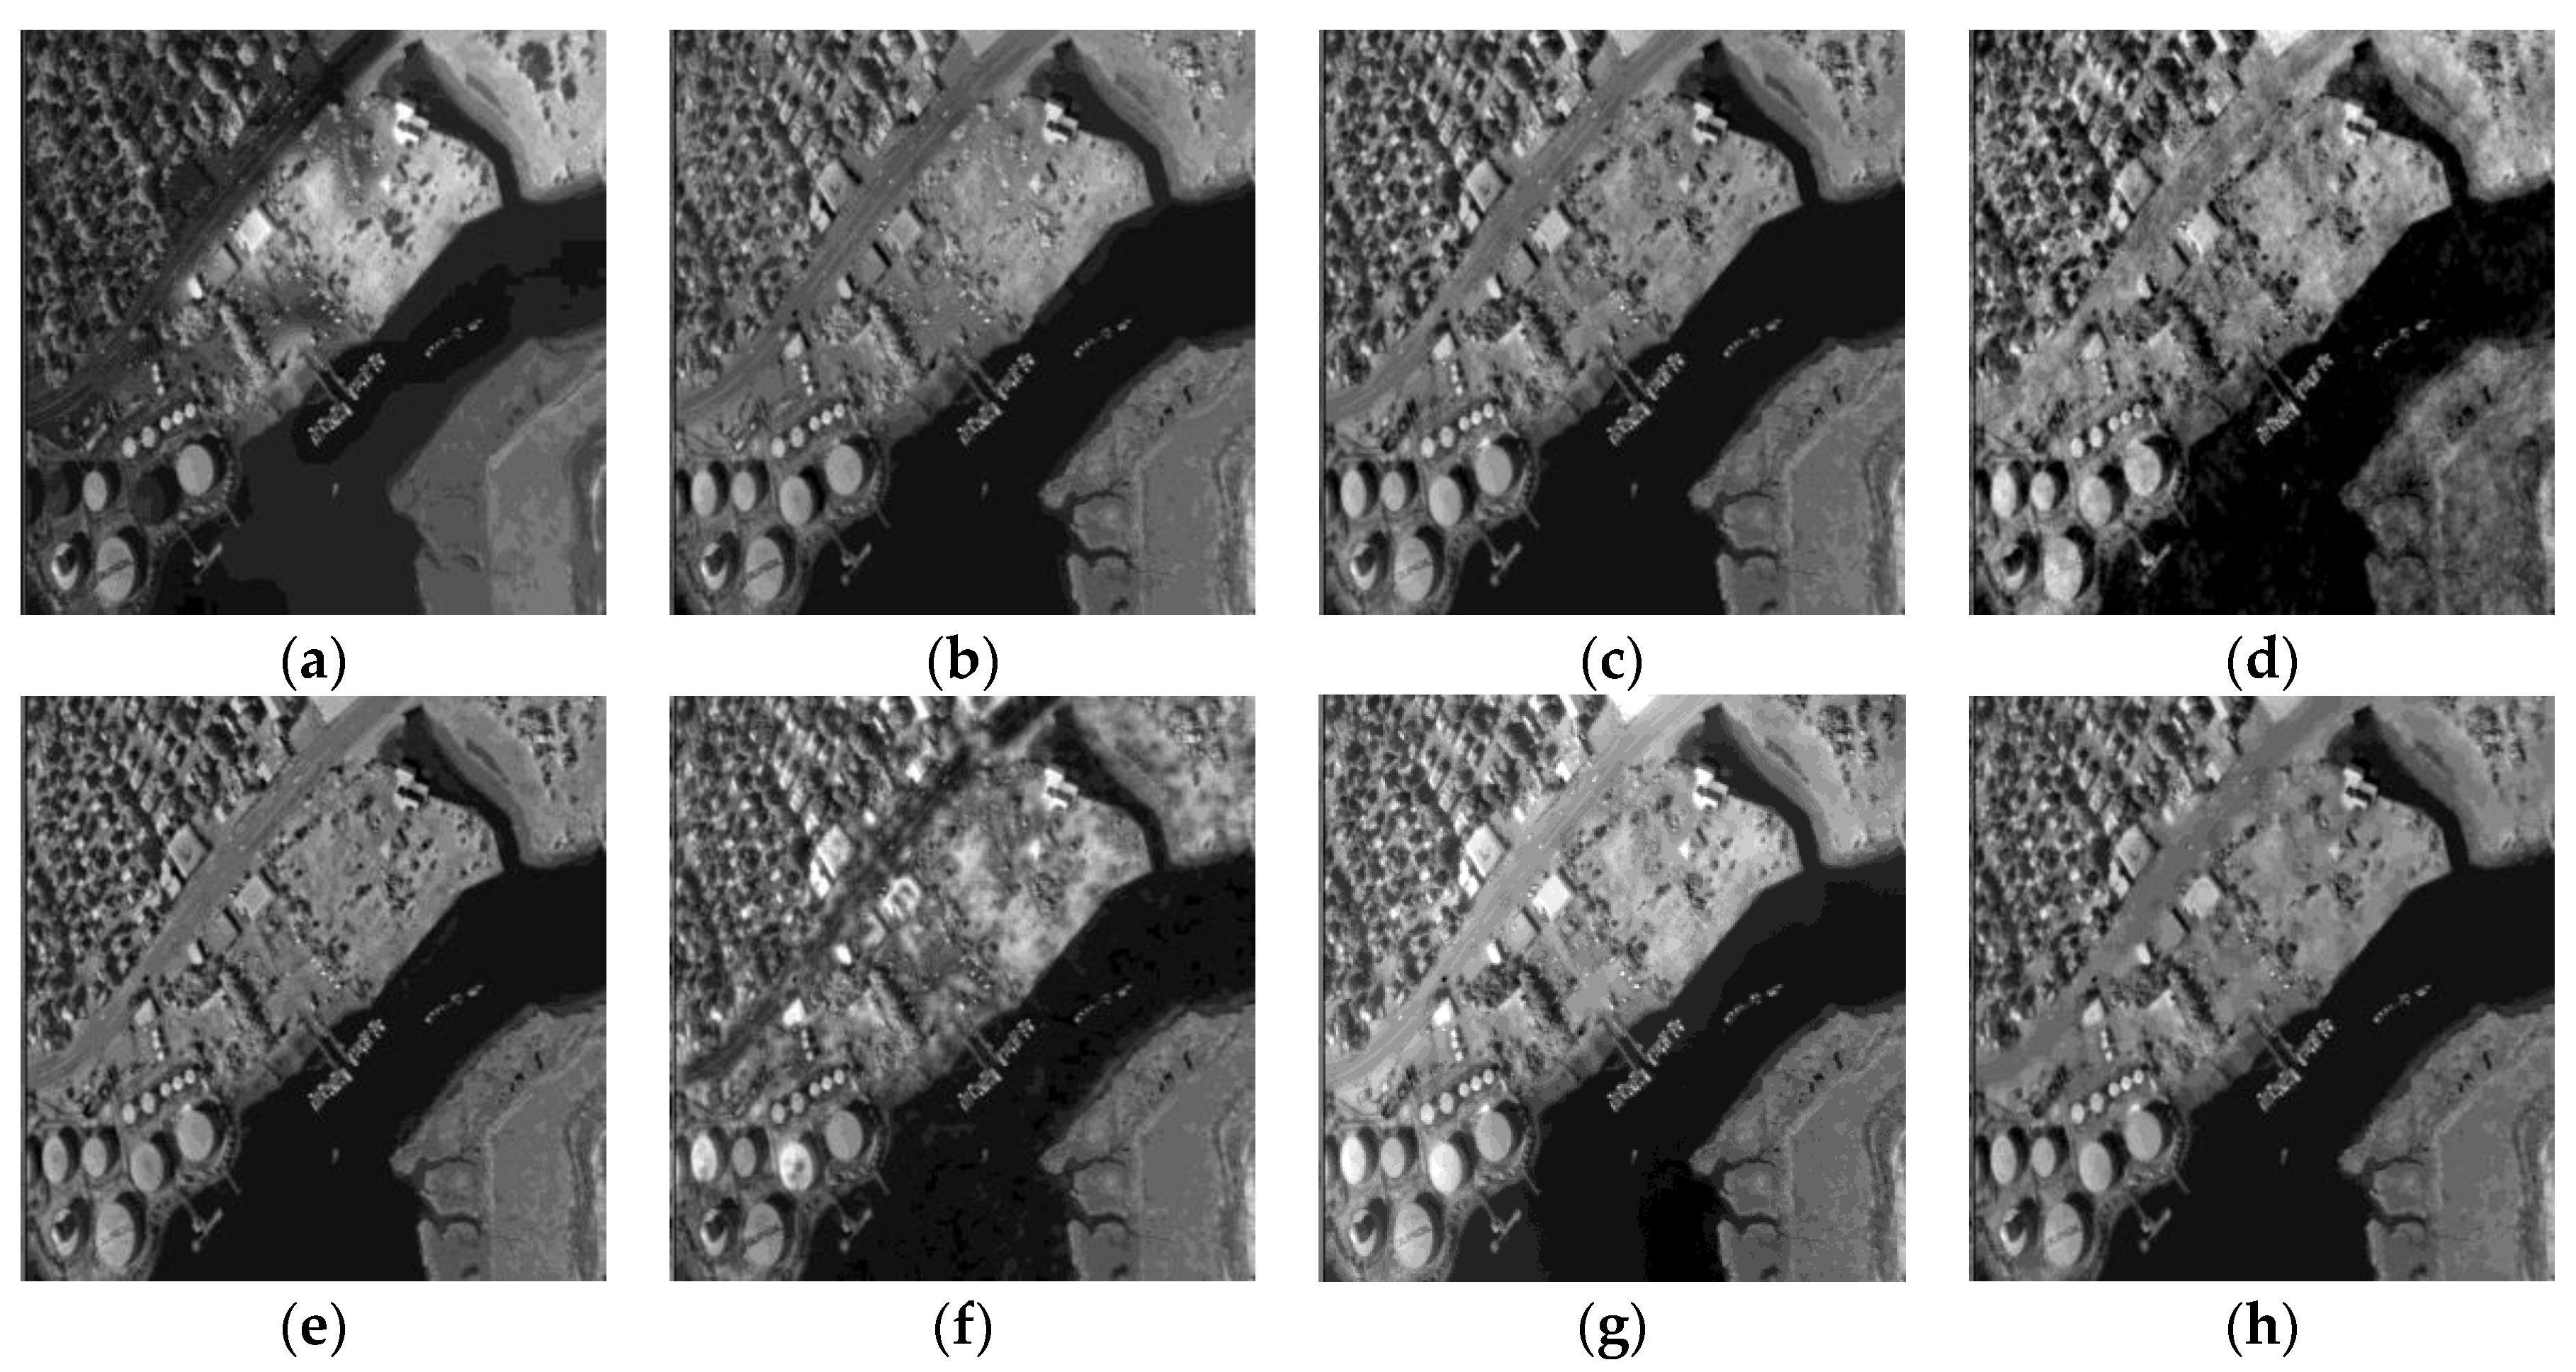
There are some river and coastal area in Group 3. And by comparing the fused images in
Figure 10, the center in
Figure 10a looks very bad and some areas in
Figure 10g are too bright, which have the strong exposure. From these figures, we can see that there is less artificial texture in
Figure 10h, which means the fused image obtained by the proposed method have better visual result.
Group 4 is one set of classic multi-sensor image pair, which can be found in most of papers about remote sensing image fusion. By comparing the bottoms of the fused images in
Figure 10, we can find that there are some unwanted spots and artificial texture in
Figure 10d, and the small round black area is very blurred or even lost in
Figure 10a–c,f. Since the rivers display as black areas like wide line or curve in the fused images, it has worst visual effect in
Figure 10f, of which the detailed information has been lost. As a result, the fused image in
Figure 10h looks more comfortable for our eyes and the proposed method has better ability to fuse remote sensing images.
Similarly, we use the aforementioned objection evaluation indexes to value the fused images in
Figure 8,
Figure 9,
Figure 10 and
Figure 11 and the objective values are shown in
Table 2,
Table 3,
Table 4 and
Table 5. As shown in
Table 2 and
Table 3, the algorithm proposed in this paper has obtained the best results for Group 1 and Group 2 in
Figure 7. This fully demonstrates that the proposed method has a better ability to perform remote sensing image fusion. Compared with Group 1 and Group 2, there is more low frequency information and less detail and edges in Group 3 and Group 4. However, the proposed method is more suitable for the images with great detail. As a result, the SSIM of the fused image by NSCT is better than others in
Table 4, but other values of the proposed method are satisfactory. All these values demonstrate that the proposed method performs better in terms of remote sensing image fusion.


