Article

Narrowband Interference Separation for Synthetic Aperture Radar via Sensing Matrix Optimization-Based Block Sparse Bayesian Learning

1
Graduate School, Space Engineering University, Beijing 101416, China
2
Space Engineering University, Beijing 101416, China
3
The 96901 Unit of PLA, Beijing 100094, China
4
The 66135 Unit of PLA, Beijing 100144, China
*
Author to whom correspondence should be addressed.
Electronics 2019, 8(4), 458; https://doi.org/10.3390/electronics8040458
Submission received: 28 March 2019 / Revised: 22 April 2019 / Accepted: 23 April 2019 / Published: 25 April 2019

Abstract

:
High-resolution synthetic aperture radar (SAR) operating with a large bandwidth is subject to impacts from various kinds of narrowband interference (NBI) in complex electromagnetic environments. Recently, many radio frequency interference (RFI) suppression approaches for SAR based on sparse recovery have been proposed and demonstrated to outperform traditional ones in preserving the signal of interest (SOI) while suppressing the interference by exploiting their intrinsic structures. In particular, the joint recovery strategy of SOI and NBI with a cascaded dictionary, which eliminates the steps of NBI reconstruction and time-domain cancellation, can further reduce unnecessary system complexity. However, these sparsity-based approaches hardly work effectively for signals from an extended target or NBI with a certain bandwidth, since neither of them is sparse in a prescient domain. Moreover, sub-dictionaries corresponding to different components in the cascaded matrix are not strictly independent, which severely limits the performance of separated reconstruction. In this paper, we present an enhanced NBI separation algorithm for SAR via sensing matrix optimization-based block sparse Bayesian learning (SMO-BSBL) to solve these problems above. First, we extend the block sparse Bayesian learning framework to a complex-valued domain for the convenience of radar signal processing with lower computation complexity and modify it to deal with the separation problem of NBI in the contaminated echo. For the sake of improving the separated reconstruction performance, we propose a new block coherence measure by defining the external and internal block structure, which is used for optimizing the observation matrix. The optimized observation matrix is then employed to reconstruct SOI and NBI simultaneously under the modified BSBL framework, given a known and fixed cascaded dictionary. Numerical simulation experiments and comparison results demonstrate that the proposed SMO-BSBL is effective and superior to other advanced algorithms in NBI suppression for SAR.

1. Introduction

High-resolution synthetic aperture radar (SAR) is an active remote sensing modality for real-time information acquisition. It plays a significant role in the field of civil exploration and military reconnaissance owing to its capability of all-weather, all-time, and high-resolution imaging. A SAR system usually operates at a wide range of microwave frequencies and it is inevitably subject to various kinds of electromagnetic interference. These kinds of interference with the characteristics of high power and narrowband may seriously degrade the quality of SAR images and cause trouble for the subsequent interpretation.
Multi-channel technology and signal processing are two typical methods of interference suppression for SAR. A multi-channel processing method [1,2] uses the space information and extracts the signal of interest (SOI) from the contaminated echo by zeroing the interference direction, and this method outperforms that of a single channel. However, this special multiplex architecture increases the complexity of the radar system and cannot be directly applied to existing devices.
From the perspective of pure signal processing, narrowband interference suppression can be mainly divided into parametric, non-parametric, and semi-parametric methods. The parametric methods such as high-order ambiguity function [3] and complex empirical mode decomposition [4] are based on interference modeling with multi-order terms. However, it is heavily dependent on model accuracy and has a large amount of calculation in the process of parameter searching. A non-parametric method such as notched filtering (NF) [5,6], least mean square (LMS) filtering [7], eigen-subspace filtering (ESF) [8], independent component analysis (ICA) [9], independent subspace analysis (ISA) [10,11], and robust principal component analysis (RPCA) [12] can suppress the interference from raw data without any prior knowledge or parametric model. Notched filtering and LMS filtering are actually equivalent to adding a band-stop filter where the interference is located, regardless of whether there is a signal component in this frequency range. The basic idea of ESF, ICA, ISA, and RPCA is the singular value decomposition (SVD) of the data matrix, and the signal or interference is reconstructed by inverse transform after extracting the dominant components. The main problem of the non-parametric method is the signal distortion, since the SOI is also suppressed when the interference is eliminated.
Sparse recovery, as a typical semi-parametric method for interference suppression, is state-of-the-art, especially in terms of reducing signal distortion. It can be considered as an optimization problem of reconstructing few coefficients with a given dictionary. The sparsity-based method is mainly used for suppressing RFI that appears in the form of spikes in a large frequency range. Considering the sparse property in the range-frequency domain and the low-rank property in the azimuth, in References [13,14], RFI was extracted and suppressed based on a sparse and low-rank model. In Reference [15], the matrix factorization technique was introduced into the sparse and low-rank model to avoid large residuals after SVD and further reduce the computational complexity at the same time. In our previous work [16], we proposed an RFI suppression method for SAR based on morphological component analysis (MCA), in which a stepwise reconstruction algorithm was adopted to the reconstruction. Given that the steps of interference reconstruction and cancellation may limit the suppression performance and increase the system complexity, the alternating direction multiplier method (ADMM) [17] was adopted to reconstruct the signal and the interference simultaneously in Reference [18]. The premise of this method is that both the SOI and interference are sparse in their respective domains.
The observed scene in most SAR images is not sparse and it is difficult to find a proper dictionary to represent the echo signal with few nonzero coefficients. Moreover, the narrowband interference (NBI) of a noise-modulated type with a certain bandwidth is not sparse either in the frequency domain. Classical recovery algorithms [19,20] such as basis pursuit (BP), matching pursuit (MP), and orthogonal matching pursuit (OMP) fail to recover the signal accurately. The block MP (BMP) and block OMP (BOMP) algorithm proposed in Reference [21] can improve the reconstruction probability with a slight requirement for sparsity by exploiting the block sparse structure. Still, with the increase in scene complexity and interference bandwidth, the reconstruction probability decreases, since the block sparse feature gradually weakens. The global minimum of the above algorithm is not really the sparsest solution, unless strict conditions are satisfied. Hence, sparse Bayesian learning (SBL) [22], which considers all unknown parameters as random variables and adds appropriate prior distributions according to the sparse structure, is no doubt a better choice. Derived from the SBL framework, block sparse Bayesian learning (BSBL) [23,24] is a robust recovery algorithm for both sparse and non-sparse signals from a low-dimensional space by exploiting the temporal correlation of intra-block data. In Reference [25], the BSBL framework is first used and modified for RFI suppression where the target or observed scene is not strictly sparse but block sparse, and the S-BSBL and A-BSBL algorithms are, respectively, proposed to improve reconstruction performance and reduce the amount of computation. Judging from the results of interference suppression, the BSBL-based approach is indeed superior to other advanced ones and can be used more widely.
Nevertheless, there remain several problems to be solved. As is known, radar signals are complex-valued in most processing steps, so the BSBL algorithm cannot be directly applied. A widely accepted trade-off approach is to concatenate the real and imaginary parts of the signal into a new vector. There are two main shortcomings in this scheme. One is that the length of the new real-valued vector is twice as long as the original complex-valued vector and the corresponding sensing matrix will expand in square with the signal length increasing, which will result in a huge amount of computational burden. The other is that the reconstruction performance may be degraded due to the loss of structural information, since the real and imaginary part of the signal are processed separately. In addition, while the BSBL framework is robust to the interatomic coherence in the sensing matrix for the reconstruction of a clean signal, the block coherence of sub-dictionaries corresponding to different components in the contaminated echo has a great impact on the separated reconstruction performance, since the diagonal block of the covariance matrix cannot be effectively distinguished.
To solve these problems above, our goal is to reduce the amount of calculation with a modified BSBL algorithm, which can be applied to the complex-valued signal directly and further improve the performance of NBI separation by optimizing the cascaded sensing matrix.
The main contents of this paper are divided into three parts. In Section 2, the problem of separated reconstruction for SOI and NBI based on complex-valued block sparse Bayesian learning framework is formulated. In Section 3, the optimal sensing matrix is designed by minimizing the newly defined block coherence measure, and the SMO-BSBL algorithm for NBI separation, which is embedded in the entire procedure of SAR imaging, is presented. In Section 4, numerical experiments with simulated data are carried out, and results of the proposed algorithm in this paper are compared with existing BSBL-based algorithms.

2. Problem Formulation

2.1. Sparse Model and Joint Recovery

The raw SAR echo is usually considered as the convolution of the scattering points and the transmitted signal from radar. The most commonly used signal type is the linear frequency-modulated (LFM) signal and the ideal echo signal in the analogy domain can be expressed as [26]
s r ( τ , t ) = p = 1 P σ p w r ( t 2 R p ( τ ) / c ) exp ( j 4 π R p ( τ ) / λ ) exp [ j π K r ( t 2 R p ( τ ) / c ) 2 ]
where t is the fast time in range direction; τ is the slow time in azimuth direction; P is the number of scattering points in observed scene; σp is the backscatter coefficient of the p-th point; c is the speed of light; λ is the electromagnetic wavelength; Rp is the oblique distance between scattering point and SAR platform; Kr is the frequency modulation slope; wr(·) denotes the rectangular window function with the length of r.
In real-world environments, SAR may be subjected to various forms of interference, including the natural radiation and the man-made interference. The former is also subject to RFI and commonly modeled in the form of multi-tone complex sine, which adds bright stripes to SAR images. This type of NBI in analog time domain can be expressed as
n 1 ( t ) = i = 1 L A i ( t ) exp { j [ 2 π f i ( t ) t + φ i ( t ) ] }
where A(t), f(t), and ϕ(t) are, respectively, the amplitude, carrier frequency, and phase varying over time; L is the number of interference tone. The latter, which is often generated artificially by modulating a narrowband noise into the frequency band of the signal, will add speckles similar to salt and pepper on the image. This type of NBI mainly includes the amplitude-modulated type and frequency-modulated type, and its general mathematical model in the analog time domain can be expressed as
n 2 ( t ) = [ U 0 + U n ( t ) ] exp { j [ 2 π f t + 2 π K F M 0 1 U n ( τ ) d τ + φ ( t ) ] }
where U0 is the constant amplitude; Un(t) is the band-limited noise whose amplitude may change over time; KFM is the frequency-modulated slope. The waveform and spectrum diagram of two types of NBI added to the LFM signal are shown in Figure 1.
As shown in Figure 1a, the NBI based on the complex sine model is sparse in the frequency domain, since there are only a few dominant, scattered interference components with an extremely narrow bandwidth. In contrast, the narrowband noise-modulated NBI in Figure 1b is not strictly sparse in frequency because it densely occupies a segment of the spectrum. Moreover, the high-power characteristic of this kind of NBI is not as outstanding as that of RFI, which indicates that it is more difficult to extract and separate from the SOI. Therefore, we mainly focus on this narrowband noise-modulated NBI and seek effective approaches to suppress it.
For the convenience of theoretical analysis, the echo contaminated with NBI in each pulse is analyzed in the discrete domain, which is expressed in the form of N-dimensional complex-valued vectors, i.e.,
x ˜ = s ˜ + n ˜ + w ˜
where s ˜ N is the SOI component; n ˜ N is the NBI component; w ˜ N is the additional white noise assumed to satisfy complex Gaussian distribution w ˜ ~ C N ( 0 , σ 2 I w ) , where I is an identity matrix.
If the observed scene is divided into grids, the echo x ˜ can be considered as the accumulation of transmitted signals with a different delay of range. In addition, the SAR system is a collaborative platform and its signal form and parameters are known. Therefore, the basis dictionary Ψ ˜ s of the SOI can be constructed by the reference signal with delays of range, and the SOI can be expressed as s ˜ = Ψ ˜ s α ˜ s , where α ˜ s is the coefficient vector with few nonzero elements in the sparse case. Similarly, the NBI component in each pulse can be represented with few aggregated atoms on a specific basis Ψ ˜ n , since it is sparse or block sparse in the frequency domain, which can be expressed as n ˜ = Ψ ˜ n α ˜ n , where α ˜ n is the coefficient vector used for representing the NBI.
Compressed sensing theory has demonstrated that an N-dimensional vector with a sparse structure can be accurately recovered from M-dimensional (M < N) compressed measurements via nonlinear optimization with a high probability. The SAR echo contaminated with NBI after compressed sampling can be expressed as the following cascaded matrix form:
y ˜ = Φ ˜ ( Ψ ˜ s α ˜ s + Ψ ˜ n α ˜ n ) + w ˜ = [ Θ ˜ s    Θ ˜ n ] [ α ˜ s α ˜ n ] + w ˜
where Φ ˜ is the compressed observation matrix; Θ ˜ s and Θ ˜ n are the sensing matrix of SOI and NBI, respectively.
The separated optimization problem in Equation (5) can be expressed as
{ α ˜ s , α ˜ n } = arg min { α ˜ s , α ˜ n } = α ˜ s 0 + α ˜ n 0
where | | | | p denotes the lp-norm. Since minimizing the l0-norm needs to list all possible combinations of non-zero elements in a sparse vector, which will take an enormous amount of time, a relaxed form of (6) can be expressed as
{ α ˜ s , α ˜ n } = arg min { α ˜ s , α ˜ n } = α ˜ s 1 + λ α ˜ n 1     s . t .     y ˜ Ψ ˜ s α ˜ s Ψ ˜ n α ˜ n 2 < ε
where λ is a constant regularization parameter.
The ADMM algorithm [17] is widely used for this joint optimization problem as long as components are sparse in their respective domain. However, when the target is not sparse in the observed scene or the spectrum of NBI occupies a certain amount of bandwidth, the simultaneous reconstruction performance of components via ADMM degrades or even fails. The BSBL performs better for highly underdetermined problems compared to existing algorithms, which can obtain the sparsest solution by modeling the temporal correlation, even in non-sparse cases. In Reference [25], it was verified that BSBL is superior to ADMM in terms of joint reconstruction when the target is not sparse. It is worth noting that the BSBL-based NBI suppression is still implemented in real-valued signals formed by splicing the real and imaginary part of the complex signals. This approach not only destroys the phase structure, which is significant for SAR, but also increases the computational cost. Next, we modify the original BSBL framework to enable it to deal with the complex-valued signal directly.

2.2. Complex BSBL Framework

The initial BSBL framework is generally applicable to real-valued signal processing. The most common way to deal with the complex-valued radar signal is to process the real and imaginary part separately, and this bi-channel signal observation model can be expressed as
[ Re ( y ˜ ) Im ( y ˜ ) ] = [ Re ( Θ ˜ s ) Re (   Θ ˜ n ) Im ( Θ ˜ s ) Im (   Θ ˜ n ) Im ( Θ ˜ s ) Im (   Θ ˜ n ) Re ( Θ ˜ s ) Re (   Θ ˜ n ) ] [ Re ( α ˜ s ) Re ( α ˜ n ) Im ( α ˜ s ) Im ( α ˜ n ) ] + [ Re ( n ˜ ) Im ( n ˜ ) ]
where Re(·) and Im(·) denote the real part and imaginary part of the complex vector. Here, we attempt to modify the BSBL so that it can be directly adopted to complex signal processing with less computation instead of the above approach.
To solve the optimization problem in Equation (6) via a complex BSBL framework, the 2N-dimensional cascaded coefficient vector to be reconstructed is divided into cascaded blocks of the same length, i.e.,
α ˜ = [ α ˜ s 1 , , α ˜ s d 1 d 1 s , , α ˜ s d g s 1 + 1 , , α ˜ s N d g s    α ˜ n 1 , , α ˜ n d 1 d 1 n , , α ˜ s d g n 1 + 1 , , α ˜ s N d g n ] T
where di is the length of the i-th block; gs and gn are the number of blocks for SOI and NBI. Similarly, the sensing matrix is divided into blocks corresponding to the coefficient vector, i.e.,
Θ ˜ = [ Θ ˜ s 1 , , Θ ˜ s g s g s Θ ˜ n 1 , , Θ ˜ n g n g n ] .
Given that the covariance matrix is a semi-positive Hermitian matrix and the imaginary part of each diagonal element is zero, we assume that blocks are independent of each other and α ˜ i in each block satisfies a multivariate complex Gaussian distribution α ˜ i ~ C N ( 0 , C 0 , i ) , where C 0 , i = γ i B ˜ i d i × d i is the prior covariance matrix of α ˜ i ; B ˜ is a Hermitian matrix used for characterizing the correlation structure of α ˜ i ; γ i is a real non-negative correlation coefficient. Most γ i will approach zero in the process of Bayesian learning owing to automatic relevance determination [22]. In other words, a sparse solution is obtained by changing α ˜ i into an irrelevant zero-valued vector or complex Gaussian noise with low variance. Thus, the prior covariance of α ˜ can be expressed as
C 0 = γ B ˜
where γ = d i a g ( γ 1 , , γ g s + g n ) ; B ˜ = d i a g ( B ˜ i , , B ˜ g s + g n ) ; denotes the Kronecker product. Under the parameters γ and B ˜ , the prior probability density function of α ˜ can be expressed as [27] (p. 504)
p ( α ˜ ; γ , B ˜ ) = 1 π N | C 0 | exp ( α ˜ H C 0 1 α ˜ )
where | |   denotes the determinant value; ( ) H denotes the conjugate transposition. The Gaussian likelihood function of compressed observation y ˜ is
p ( y ˜ | α ˜ ; σ 2 ) = 1 π M σ 2 M exp [ 1 σ 2 ( y ˜ Θ ˜ α ˜ ) H ( y ˜ Θ ˜ α ˜ ) ] .
According to the Bayesian criterion, under the parameters γ , B ˜ , and σ 2 , the posterior probability density function of α ˜ is
p ( α ˜ | y ˜ ; γ , B ˜ , σ 2 ) = p ( y ˜ | α ˜ ; γ , B ˜ , σ 2 ) p ( α ˜ ; γ , B ˜ , σ 2 ) p ( y ˜ )
where p ( y ˜ ) = p ( y ˜ | α ˜ ; γ , B ˜ , σ 2 ) p ( α ˜ ; γ , B ˜ , σ 2 ) d α ˜ d γ d B ˜ d σ 2 .
Considering that it is difficult to give an analytical expression of the above integral formula, we decompose it into another form based on Bayesian rule and Gaussian identity [28], i.e.,
p ( α ˜ | y ˜ ; γ , B ˜ , σ 2 ) = p ( y ˜ | α ˜ ; σ 2 ) p ( α ˜ ; γ , B ˜ ) p ( y ˜ ; γ , B ˜ , σ 2 )
where p ( y ˜ ; γ , B ˜ , σ 2 ) = p ( y ˜ | α ˜ ; σ 2 ) p ( α ˜ ; γ , B ˜ ) d α ˜ . The likelihood function of y ˜ is then
p ( y ˜ ; γ , B ˜ , σ 2 ) = 1 π M | σ 2 I n ˜ + Θ ˜ C 0 Θ ˜ H | exp [ y ˜ H ( σ 2 I n ˜ + Θ ˜ C 0 Θ ˜ H ) 1 y ˜ ] .
Thus, the posterior probability density function of α ˜ can be expressed as
p ( α ˜ | y ˜ ; γ , B ˜ , σ 2 ) = 1 π N | C α ˜ | exp [ ( α ˜ μ α ˜ ) H C α ˜ 1 ( α ˜ μ α ˜ ) ]
where C α ˜ = ( C 0 1 +   σ 2 Θ ˜ H Θ ˜ ) 1 ; μ α ˜ = σ 2 C α ˜ Θ ˜ H y ˜ . Here, the maximum posterior estimation of the complex coefficient vector α ˜ is
α ˜ = μ α ˜ = σ 2 ( C 0 1 +   σ 2 Θ ˜ H Θ ˜ ) 1 Θ ˜ H y ˜ .
Expectation maximum (EM) is a typical optimization algorithm for BSBL, according to which the parameters γ , B ˜ , and σ 2 of each block can be updated as described in Reference [23,24]. In the EM algorithm, the goal is to maximize the likelihood function of p ( y ˜ ; γ , B ˜ , σ 2 ) , which is equivalent to minimizing the following cost function, which can be expanded according to the matrix inverse operation, i.e.,
L ( γ , B ˜ , σ 2 ) 2 log p ( y ˜ | α ˜ ; σ 2 ) p ( α ˜ ; γ , B ˜ ) d α ˜ = log | γ B ˜ | + N log σ 2 + log | C α ˜ 1 | + σ 2 y ˜ Θ ˜ μ α ˜ 2 2 + μ α ˜ H C 0 μ α ˜
What needs to be noticed here is that both the correlation matrix B ˜ and the prior covariance matrix C α ˜ are defined as a complex-valued matrix, but their diagonal elements are real. In order to ensure that all γ i are real-valued as we initially defined, we set an absolute constraint on them. We then calculate these parameters by calculating the partial derivative of the cost function. The noise variance was deduced in Reference [23], and here we focus on the other two parameters, which can be deduced by employing the complex-valued matrix derivation rules. Based on Proposition 3.14 in Reference [29], we can update σ 2 , γ i , and B ˜ i , which are located in a complex variable function as follows:
σ 2 = y Θ ˜ μ α ˜ 2 2 + t r ( C α ˜ , i Θ ˜ H Θ ˜ ) N
γ i = | t r [ B ˜ i 1 ( μ α ˜ , i μ α ˜ , i H + C α ˜ , i ) ] d i |
B ˜ i = ( μ α ˜ , i μ α ˜ , i H + C α ˜ , i ) γ i
where tr(·) denotes the trace operation.
Given that B ˜ can be modeled as a first-order auto-regressive (AR) process and constrained in a Toeplitz form to avoid over-fitting [24], we assign different AR coefficients for the correlation matrix corresponding to each component. In other words, B ˜ i i ( i = 1 , , g s ) and B ˜ i i ( i = g s + 1 , , g s + g n ) are updated, respectively, in order to reconstruct SOI and NBI simultaneously from the contaminated echo, since the intra-block correlation of the two components are not similar. The Toeplitz form of the correlation matrix can be expressed uniformly as
B ˜ i ~ Toeplitz ( 1 , r ˜ , , r ˜ d 1 )
where r ˜ denotes the average AR coefficient. Generally, r ˜ is obtained by empirical formula, which can be defined as the mean value ratio of all minor and principal diagonal elements [24], i.e.,
r ˜ = 1 g i = 1 g tr ( B ˜ i , s u b , 1 ) / ( d i 1 ) tr ( B ˜ i , m a i n ) / d i ,   | r ˜ | 0.9
where B ˜ i , m a i n and B ˜ i , s u b , 1 denote the principle and the first minor diagonal elements.

3. NBI Separation Based on SMO-BSBL

As stated above, the final coefficients of SOI and NBI were reconstructed simultaneously with the cascaded dictionary via the complex BSBL framework. However, the effectiveness of actual separation was not satisfactory. In this section, we analyze the problem and put forward an effective approach to suppress these adverse effects.
There are two main reasons why the separation performance was not as good as expected. First, the cascaded dictionary was directly built by splicing the SOI and the NBI dictionary, the coherence of which is not taken into account. The coherence of these two sub-dictionaries has great impact on reconstruction, especially on separated reconstruction. It was demonstrated in References [30,31] that a well-designed observation matrix or optimized dictionary used for reducing the coherence can improve reconstruction performance. The sub-dictionaries were predefined and fixed according to the signal model, so the only approach is to carefully design the observation matrix. Second, the correlation characteristic of noise-modulated NBI was generally far weaker than that of the SOI. If the threshold for pruning out the blocks of each component were assigned with the same value, the global convergence rate of the algorithm would decrease. Therefore, the pruning threshold for the correlation coefficient should be adaptively adjusted.

3.1. Block Coherence Measure

Setting the AR coefficients in B ˜ corresponding to SOI and NBI to different values is equivalent to dividing the cascaded sensing matrix with its corresponding coefficient vector into two parts. We call each part an external block. Blocks in each external part are internal blocks. The noise-modulated NBI model is not sparse but block sparse in the frequency domain. Therefore, more general conclusions can be obtained by analyzing the block coherence, since the traditional coherence is a special case when the block size is 1. The diagram of the structural relationship between the external block and the internal block is shown in Figure 2. The hierarchical block structure shown in Figure 2a can be extended to cases of more interference components rather than just limited to one type of NBI.
In Reference [32], the dictionary coherence, which is used for measuring the similarity of atoms is defined as
μ = m a x u , v u | ψ u H ψ v |
where ψ u is the u-th column of dictionary Ψ ; | · | denotes the absolute operation. The sensing matrix coherence is extended to a block structure in Reference [21]. The inter-block coherence is mainly used for quantifying the global property, which is defined as
μ B = max i , j i 1 d ρ ( G i , j ) = max i , j i 1 d ρ ( Ψ i H Ψ j )
where Ψ i is the i-th block of Ψ with d normalized columns; G i , j denotes the (i,j)-th Gram matrix with the dimension of d × d (yellow entries in Figure 2b); ρ denotes the spectral norm expressed as
ρ ( G ) = λ max ( G H G )
where λmax is the maximum eigen-value of a positive-semidefinite matrix. Correspondingly, the intra-block coherence used for quantifying the local property is defined as
ν B = m a x i m a x u , v u | G i , i u , v |
where G i , i u , v is the (u,v)-th block in the i-th Gram matrix with the dimension of d × d (the red entries in Figure 2b).
For the purpose of improving the average performance of reconstruction as well as separation, all pairs of external blocks and all pairs of internal blocks should be as orthogonal as possible. Therefore, we further generalize the block structure and redefine the block coherence measure.
Assume that there are gex external blocks and gin internal blocks in each external block. Meanwhile, the number of elements in each internal block is d. The cascaded sensing matrix and the corresponding coefficient vector should then be divided into gex parts. Similar to the definitions above, we define the total external block coherence to measure their orthogonality, which can be expressed as
μ B , e x t o t a l = p = 1 g e x q p G p , q F 2
where Gp,q is the (p,q)-th external Gram matrix with the dimension of dgin × dgin (green entries in Figure 2b); | | | | F 2 denotes the Frobenius norm, which is calculated by the sum of the square of all elements in the matrix. For each internal block, we define the total internal coherence measure as
μ B , i n t o t a l = p = 1 g e x i = 1 g i n j i G p i , j F 2 = p = 1 g e x G p F 2 p = 1 g e x i = 1 g i n G p i F 2
where G p i , j is the (i,j)-th block in the p-th external Gram matrix (the yellow entries in Figure 2b).

3.2. Sensing Matrix Optimization

The optimization of sensing matrix Θ ˜ in this paper can be defined as the design of an optimal observation matrix Φ ˜ that improves the performance of NBI separation with a given cascaded block dictionary Ψ ˜ , where Θ ˜ = Φ ˜ Ψ ˜ . The total block coherence measure is
μ B , e x t o t a l + μ B , i n t o t a l = p = 1 g e x q p G p , q F 2 + p = 1 g e x G p F 2 p = 1 g e x i = 1 g i n G p i F 2 = G I F 2 ξ
where ξ     = p = 1 g e x i = 1 g i n G p i I F 2 denotes the penalty for each internal block to measure the normalization error. If the penalty is also taken into account, the problem becomes one of finding an optimal observation matrix Φ ˜ to minimize | | G I | | F 2 . Of course, we expect both the internal and external block coherence to be as small as possible so that the reconstruction and separation performance are synchronously optimal. However, it was demonstrated in Reference [33] that there is a lower bound in the process of minimizing the equivalent objective function. Inspired by Reference [30], we define a total block coherence measure by weighting μ B , i n t o t a l and μ B , e x t o t a l , and build an objective function with the weighted block coherence measure as well as the block normalization penalty, i.e.,
Φ ˜ = arg min Φ ˜   ( 1 η ) μ B , e x t o t a l ( Φ ˜ ) + η μ B , i n t o t a l ( Φ ˜ ) + 1 2 ξ   ( Φ ˜ )
where η ( 0 < η < 1 ) is the parameter controlling the weight of the external and internal block coherence. To obtain the optimal solution of Equation (32), we first initialize the observation matrix by minimizing | | G I | | F 2 , which can be implemented by the eigen-value decomposition of Ψ ˜ Ψ ˜ H , i.e.,
Ψ ˜ Ψ ˜ H = U ˜ Λ U ˜ H
where Λ is a real diagonal matrix composed of eigen-values; the columns of U ˜ are the eigen-vectors corresponding to the eigen-values. The initial observation matrix is
Φ ˜ ( 0 ) = I M , 0 Λ 1 / 2 U ˜ H
where I M , 0 denotes the augmentation matrix of I M with zero-valued column vectors.
We define the objective function in the form of Gram matrix as
f ( G )    = ( 1 η ) G g B , e x ( G ) F 2 + η G g B , i n ( G ) F 2 + 1 2 G g ξ ( G ) F 2
where
g ξ ( G p , q i , j )    = { I , p = q , i = j G p , q i , j , e l s e g B , ex ( G p , q i , j ) = { 0 , p q G p , q i , j , e l s e g B , in ( G p , q i , j ) = { 0 , p = q , i j G p , q i , j , e l s e
Then, according to Proposition 1 in Reference [30], the updated observation matrix at the n-th iteration can be obtained by
Φ ˜ ( n ) = Λ M 1 / 2 V ˜ M H Λ 1 / 2 U ˜ H
where Λ M and V ˜ M are the top M eigen-values and the corresponding eigen-vectors of P ˜ H P ˜ H ; P ˜ = Λ 1 / 2 U H Ψ ˜ ; H = 2 3 [ ( 1 η ) g B , e x ( G ) + η g B , i n ( G ) + 1 2 g ξ ( G ) ] .

3.3. SMO-BSBL Algorithm

Based on the above analysis and derivation, we provide the detailed sensing matrix optimization-based block sparse Bayesian learning (SMO-BSBL) algorithm for NBI separation and SOI reconstruction in Table 1. Given that the correlation coefficients of NBI are much smaller than that of SOI and that they are calculated separately, we employ the cell-averaging constant false-alarm rate (CA-CFAR) [34] to update the pruning threshold of correlation coefficients of SOI adaptively to avoid low convergence rate when the fixed threshold is initially set too low. The adaptive threshold can be calculated by
γ T = T h 1 N c i = 1 N c γ i
where T h = N c ( P f a 1 / N c 1 ) denotes the threshold product factor; N c is the number of detection cells; P f a is the false-alarm rate. From Equation (38), the pruning threshold is affected by the product factor determined by false-alarm rate as well as the number of detection cells. The product factor values under different false-alarm rates are shown in Table 2. If the factor were set too high, over-pruning would occur, which led to serious distortion of the reconstructed SOI. If it was set too low, the convergence rate would not be guaranteed. In this paper, we choose Pfa = 10-2 as a trade-off value to determine the pruning threshold according to empirical results of tentative experiments without interference.

3.4. SAR Imaging Procedure with NBI Separation

The flowchart of SAR imaging with NBI separation based on SMO-BSBL is shown in Figure 3. It is obvious that the proposed algorithm can be embedded in the imaging process with excellent compatibility. As indicated by the omissible procedure in the dashed wireframe in Figure 3, the steps of NBI reconstruction and cancellation that increase the system complexity are not necessary in the presented procedure, and the reconstructed coefficients corresponding to the SOI can be directly used for clean image formation. Furthermore, the echo data in each pulse can be processed in parallel, and the formed two-dimensional matrix will then be used for range-azimuth imaging with range cell migration correction (RCMC). The two-dimensional imaging process with compressed measurements is explained in Reference [35], so we will not discuss it in detail in this paper.

4. Experiments

4.1. Experiment Setup

4.1.1. Simulation Specification

In order to demonstrate the effectiveness and superiority of the proposed algorithm, we carried out multiple numerical experiments with simulated data. We started with a simple case where the proposed SMO-BSBL was adopted to one-dimensional range profile imaging of a multi-points target that is non-sparse in range cells. We then extended the case to the range-azimuth imaging of an aircraft target. At the same time, we analyzed the performance under different parameters and compared it with that of other advanced algorithms. Simulations were carried out in window7(64bit) system on the computer with 3.4GHz Intel Core i7-4770 CPU and 16GB memory.

4.1.2. Performance Indicators

To benchmark the performance of NBI suppression via different methods comprehensively, we employed multiple indicators in both the signal and image domains. In the signal domain, the following indicators can be used for evaluating the performance of SOI reconstruction and NBI separation.
(1) Normalized mean square error (NMSE).
The mean square error (MSE) is widely used to measure how much the reconstructed signal deviates from the original. Considering that the MSE may be affected by signal type and power, we normalize it as
N M S E = x x ^ 2 2 x 2 2
where x and x ^ are, respectively, the original and reconstructed signal; | | | | 2 denotes the l2-norm. In this paper, when x represents the SOI, the NMSE, which reflects the degree of signal distortion, can also be considered as the ratio of the constructed residual error to the real signal.
(2) Interference suppression degree (ISD).
We also employ the ISD to check the NBI suppression effectiveness, which is defined as
ISD = 20 log 10 x s 2 s ^ s 2
where x is the contaminated signal; s and s ^ are the original and reconstructed SOI, respectively. The ISD reflects the ratio of undesirable components in the SOI before and after interference suppression. It is a comprehensive indicator in which both the interference suppression performance and signal distortion are considered. A larger ISD indicates a better performance of NBI separation.
As mentioned at the beginning of this paper, NBI may cause serious damage to SAR images. Therefore, the performance can also be evaluated from the perspective of image quality. In Reference [36], we proposed several performance indicators for quality evaluation of SAR image. In this paper, we select the peak signal-to-noise ratio (PSNR), the equivalent number of looks (ENL), and the image entropy as the main indicators for the image quality evaluation.
(1) Peak signal-to-noise ratio (PSNR).
The PSNR is a common indicator for evaluating the reconstructed image quality, which is often defined by the MSE. Given that SAR images are more discrete than optical ones, here we redefine part of the physical meaning and apply it to the reconstructed SAR image evaluation. The PSNR for a SAR image can be defined as
P S N R = 10 log 10 ( p = 1 P max P | A i , j | 2 1 N a N r P ( i = 1 N a j = 1 N r | A i , j | 2 p = 1 P max P | A i , j | 2 ) )
where Na and Nr are the number of azimuth and range cells of a SAR image; P is the number of scattering points; Ai,j denotes the complex value of the point at the (i,j)-th position; | · | denotes the modulus value; maxP represents picking out P largest values. The PSNR reflects the extent to which the SAR image is affected by noise or interference, and a larger value of PSNR indicates better image quality. It is worth noting that the PSNR specifically redefined for SAR can evaluate the quality of a reconstructed SAR image without any prior information of the original one as long as the number of target points is known or probably known.
(2) Equivalent number of looks (ENL).
The ENL is often used for measuring the relative intensity of speckle noise for SAR. Considering that SAR data is complex-valued, it is necessary to convert it to a grayscale one in advance. The ENL of a SAR image is defined as
E N L = 10 log 10 μ 2 σ 2
where μ and σ are the mean and standard deviation of SAR image grayscale. The ENL can reflect the contrast ratio of the image, and a larger ENL indicates that there is more noise or interference in the SAR image, which leads to substantial blurring.
(3) Image entropy.
The image entropy is a statistical form used for representing the aggregation characteristic of the grayscale distribution and for measuring the average amount of information in an image. It can be expressed as
E = i N G p i log 2 p i
where pi is the probability of the i-th grayscale level; NG is the total number of all grayscale levels in the image. For traditional images, a larger entropy indicates that the image contains more information and is of higher quality. However, the principle of SAR imaging is different from that of conventional optical imaging, and a non-uniform grayscale histogram distribution can highlight the texture or the contour in the observation scene. Therefore, we would rather obtain a SAR image with a smaller entropy after the noise-modulated NBI suppression.

4.2. Simulation and Analysis

4.2.1. Range Profile Imaging

Given that the BSBL framework is capable of reconstructing signals in non-sparse cases, it is obviously a better option for recovering the extended target or signal with a certain bandwidth. To verify the effectiveness and superiority of our proposed algorithm, we simulated range profile imaging for an extended target.
First, we modeled an extended target by generating 30 scattering points with random normalized backscattering coefficients from 0 to 1 and random locations within the range of 256 m. The signal transmitted from a 3-km-high radar was modeled as an LFM waveform, and the signal bandwidth and pulse width were 100 MHz and 1 μs, respectively. Since the number of valid range cells was 265 and the theoretical range resolution was 1.5 m according to the above parameters, we considered a target with more than 20 scattering points as an extended target. Here, the number of range cell was set to 512.
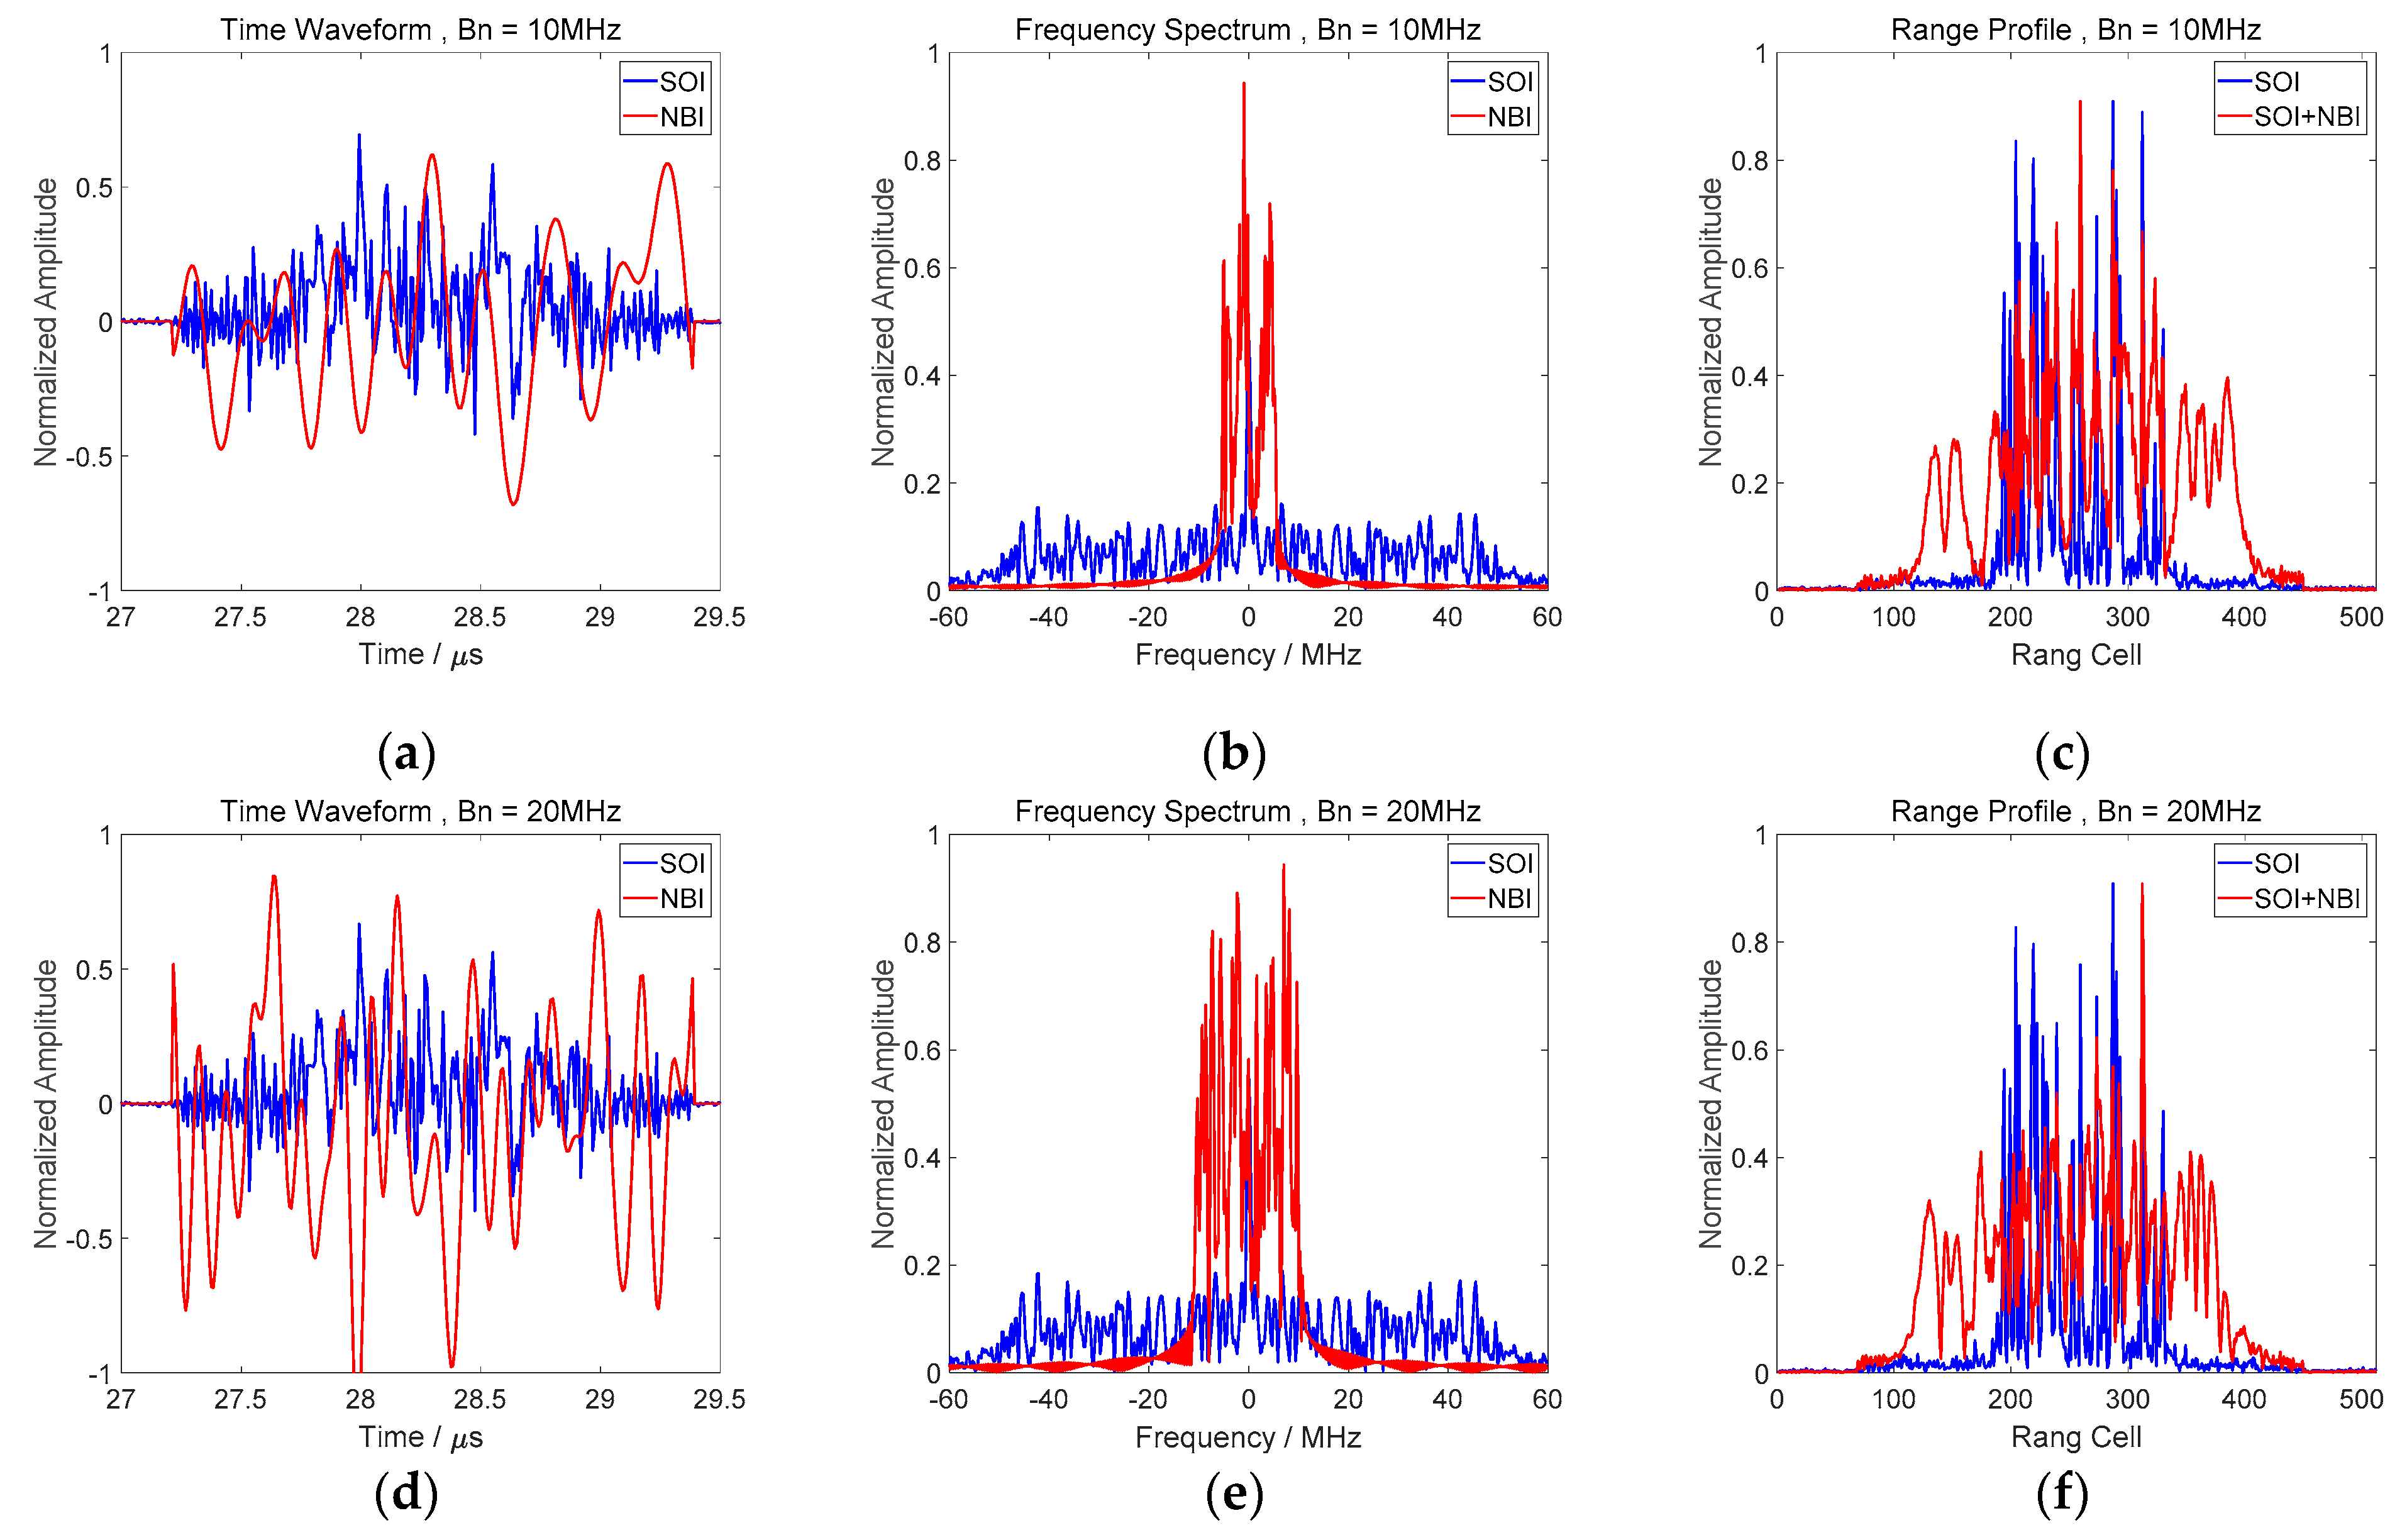
We then generated the NBI data by modulating a band-limited noise signal with Rayleigh distribution to the carrier frequency of SAR and aligning it with the central band of transmitted signal, and added the NBI to the raw echo. The interference-to-signal ratio (ISR) was set to 15 dB and the additive signal-to-noise ratio (SNR) was set to 30 dB. The bandwidth of NBI was successively set to 10 MHz and 20 MHz. The waveform in the time domain and the spectrum in the frequency domain of SOI and NBI as well as the range distribution of the extended target are shown in Figure 4.
It is obvious that the SOI and NBI is non-sparse in both the time and frequency domains. The distribution of the extended target in range cells is not sparse either. In other words, it is almost impossible to represent the signal and NBI with a small number of non-zero coefficients via traditional sparsity-based methods such as BP, MP, and OMP. Therefore, we attempted to compare the NBI separation performance of our proposed algorithm only with other advanced BSBL framework-based algorithms.
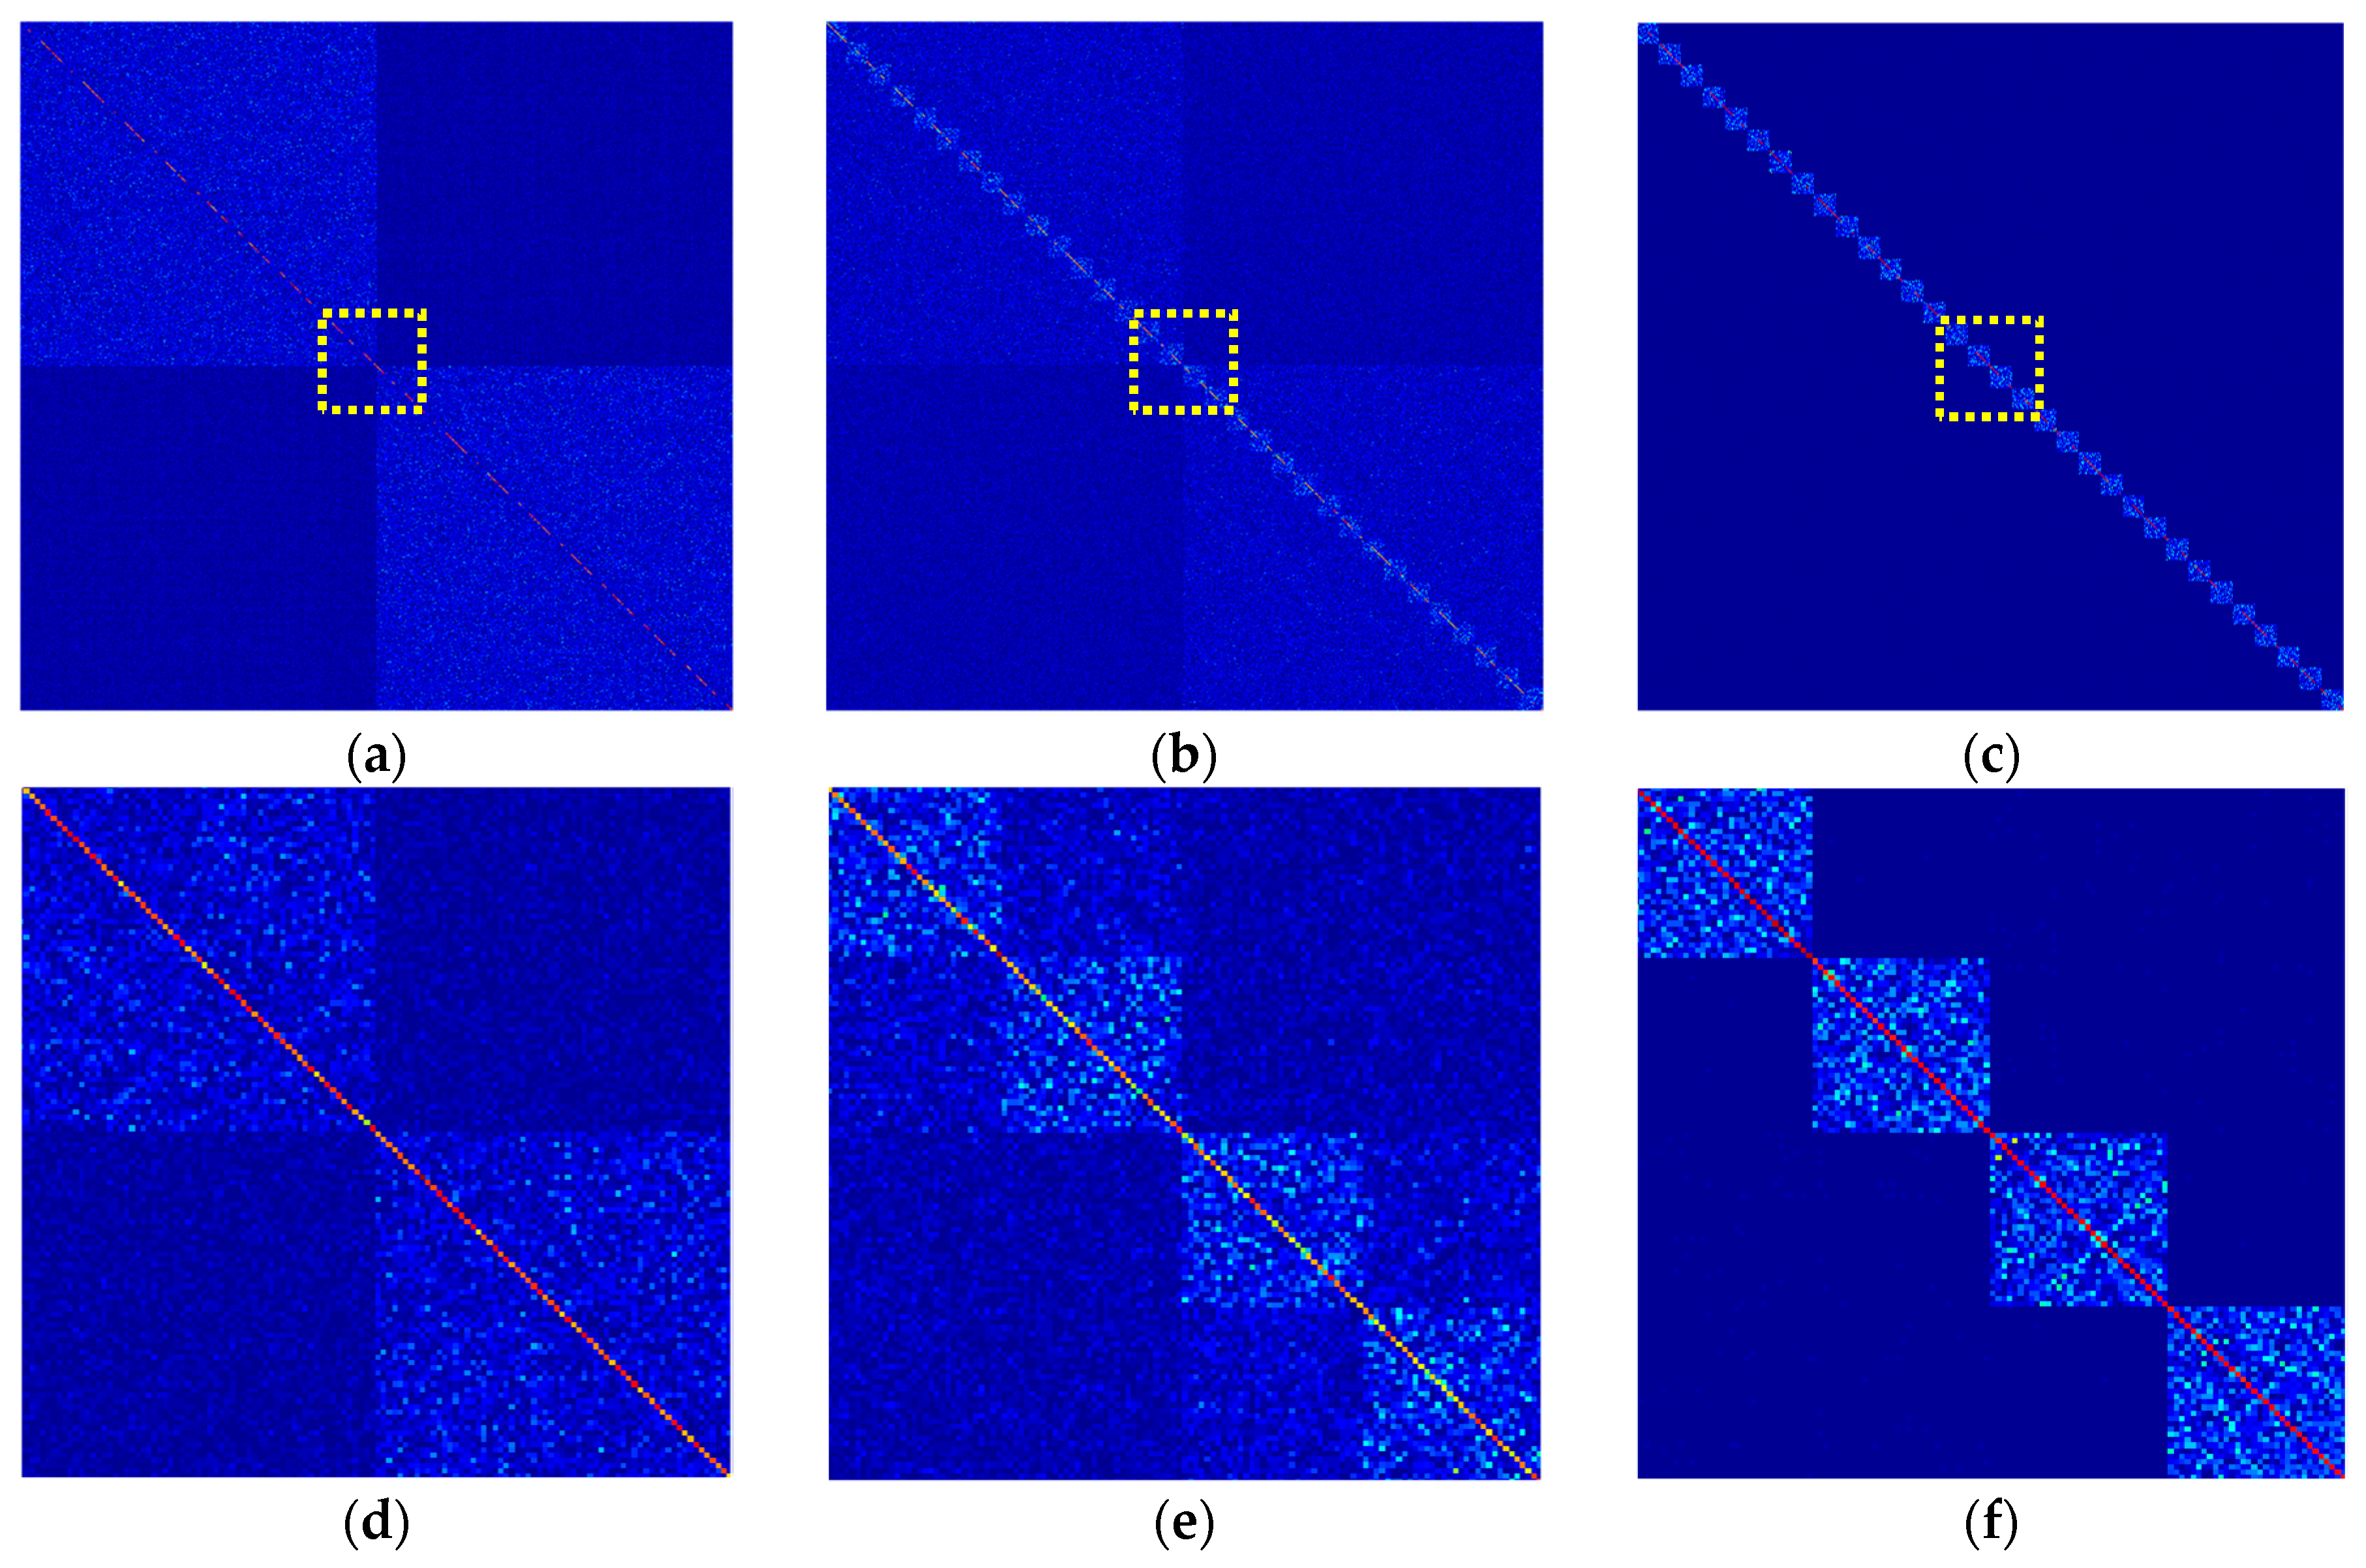
Next, we performed the separated reconstruction of SOI and NBI from the contaminated echo with the proposed SMO-BSBL algorithm in this paper. The initial dictionary used for representing SOI was composed of a reference signal with delays, and the Fourier basis was used as the initial dictionary for NBI. The number of external blocks was 2, and each external block contained 16 internal blocks. The internal block size was set to 16, and the maximum iteration was set to 500 to guarantee convergence. In order to find a better weight for sensing matrix optimization, we set η from 0.1 to 0.9 and carried out the reconstruction simulation 100 times. The Gram matrices optimized with different weights and signal reconstruction performance are shown in Figure 5 and Figure 6.
There is an irreconcilable contradiction between the external and internal block coherence. When the weight controlling parameter η is set to a small value, as shown in Figure 5a,d, we attempted to minimize the coherence measure between external blocks as far as possible, ignoring the internal block coherence. On the contrary, in Figure 5c,f, η with a larger value indicates that minimizing the internal block coherence measure is more dominant, regardless of which component the internal block belongs to. Therefore, a trade-off weight value is set in Figure 5b,e to take both the two block structures into account. From the statistical result of reconstruction simulation in Figure 6a,b, we obtained the minimum reconstruction error for both SOI and NBI when η is close to 0.5. In Figure 6c, however, when η reaches 0.5, the convergence time increases dramatically. Thus, we set η to 0.4 as a trade-off value for subsequent experiments.
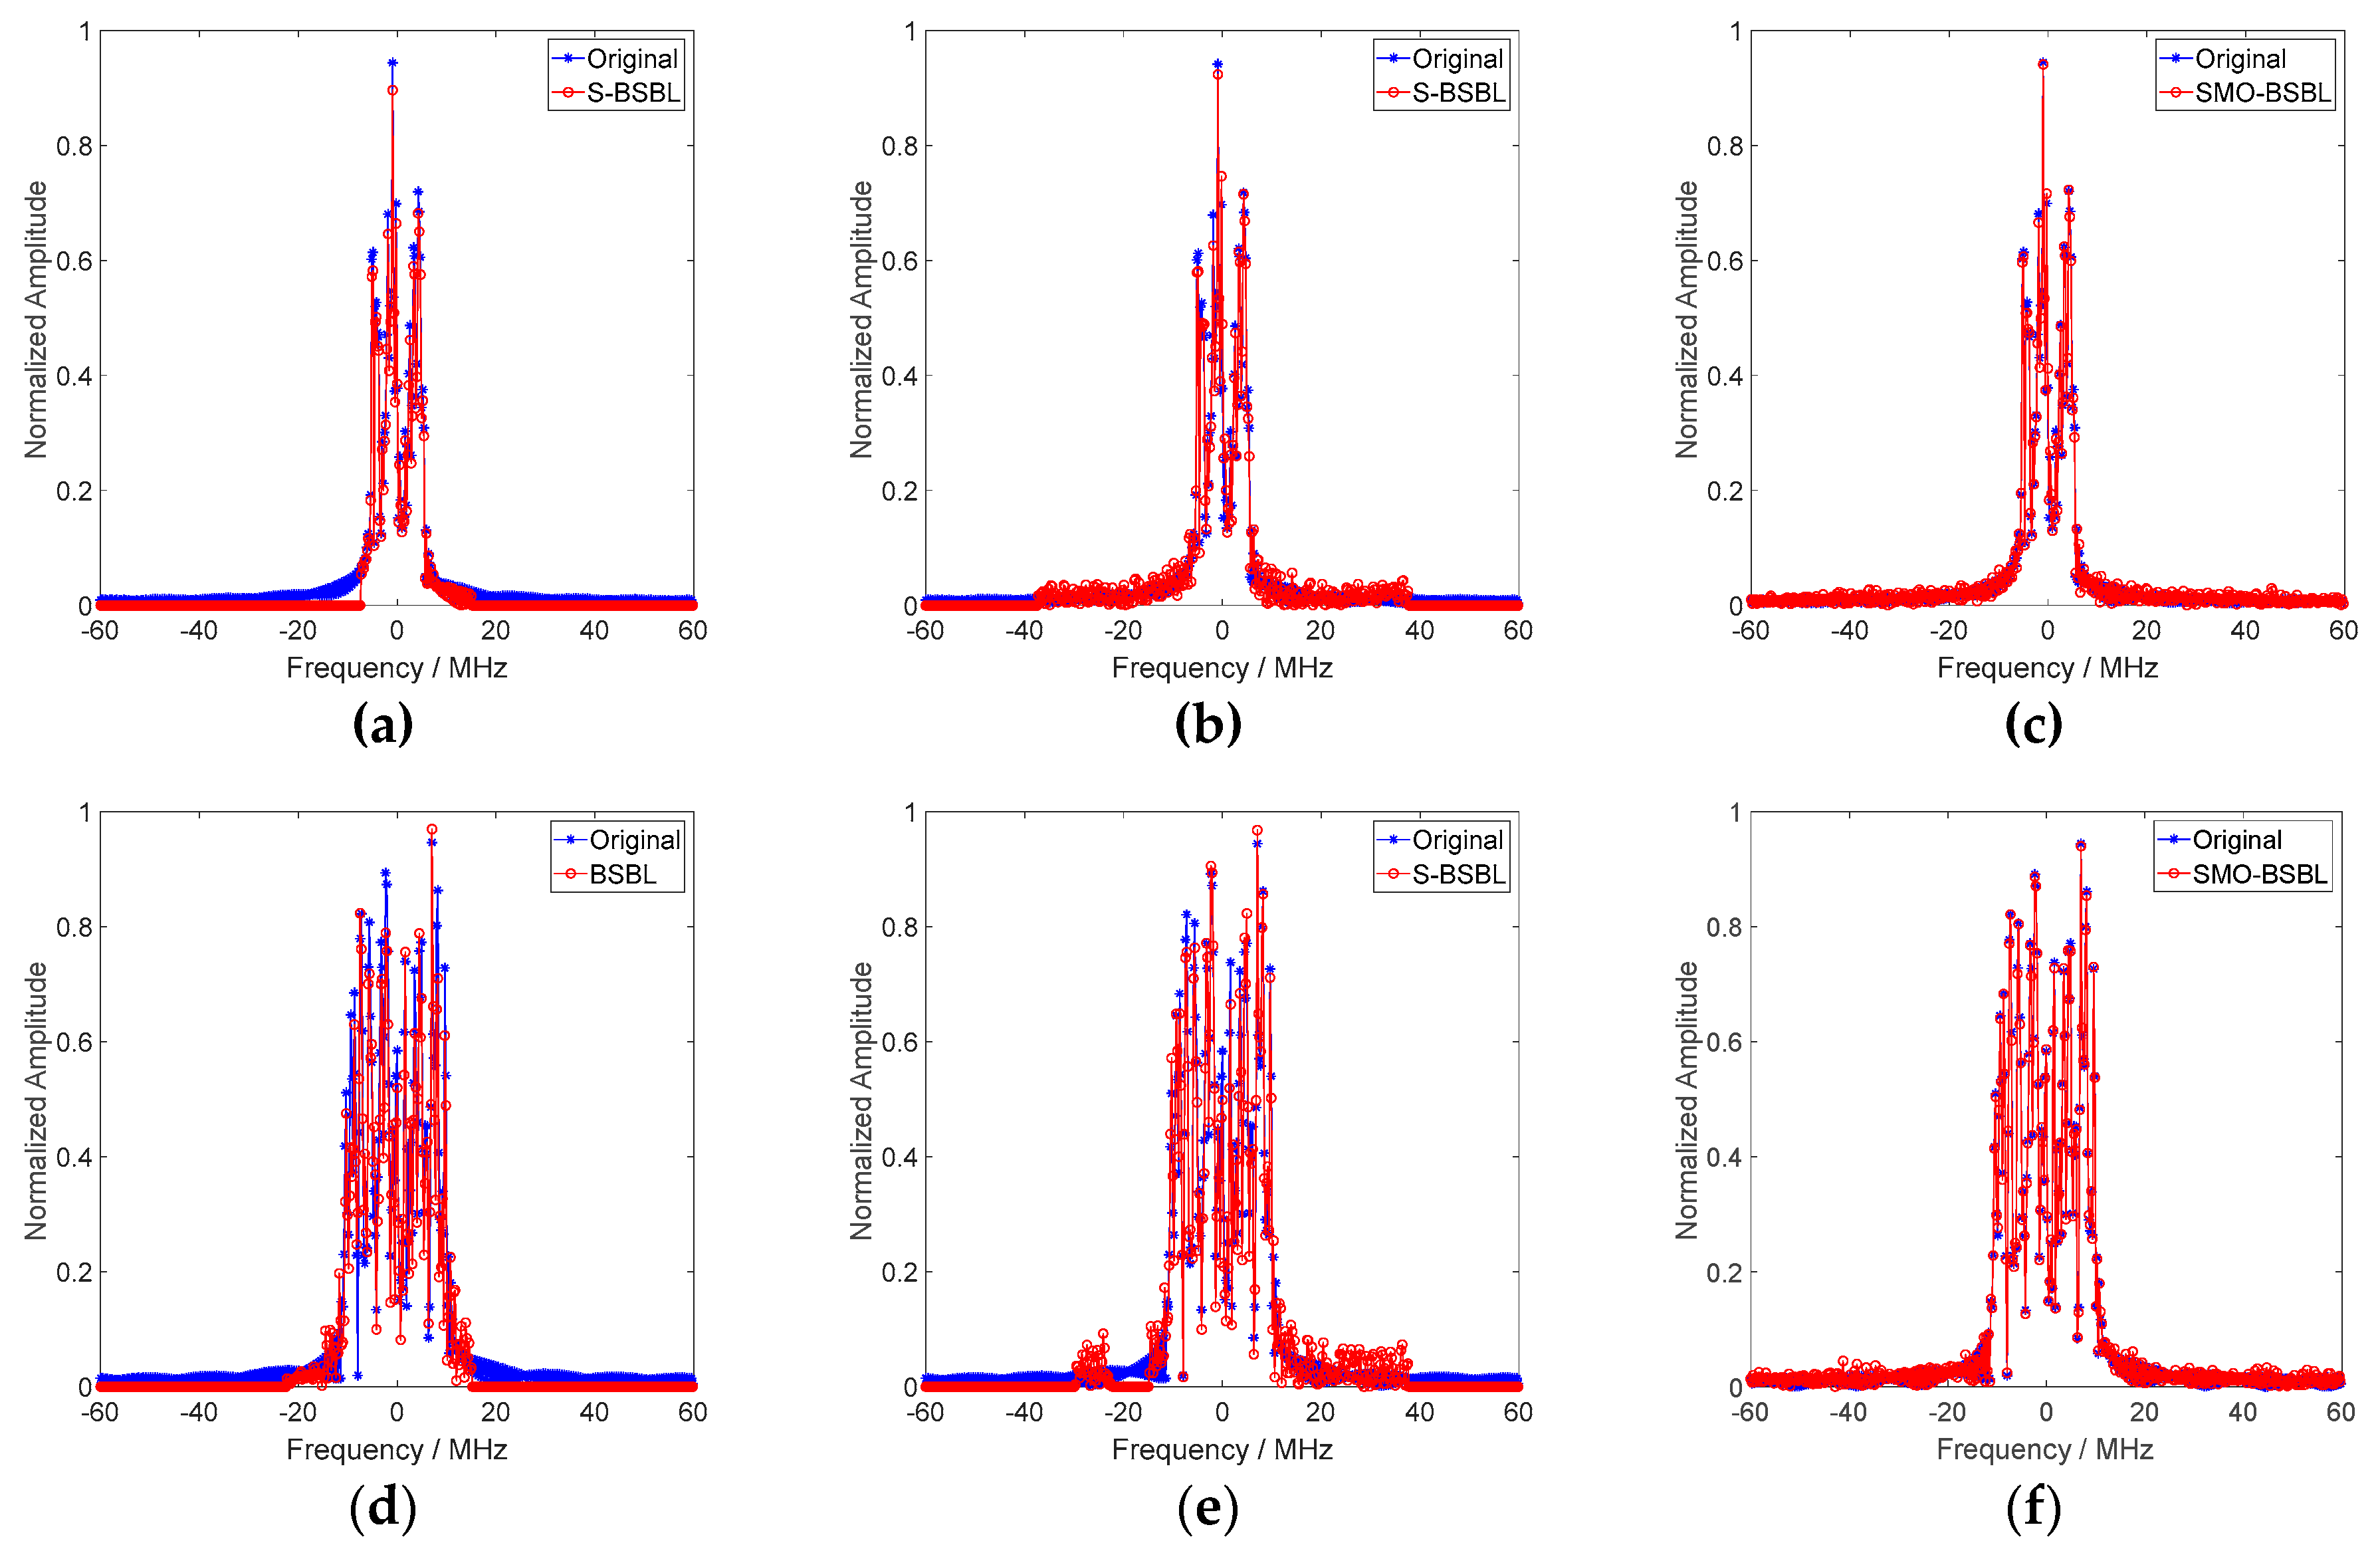
In addition, we adopted the basic BSBL combined with a cascaded dictionary in our previous work [16], which makes no distinction when updating the covariance matrix of different components, and the S-BSBL [25], which takes this distinction into account but ignores the block coherence of the cascade dictionary, to make a comparison under the same parameters. The spectrum of reconstructed NBI and the range profile of the extended target via different algorithms are shown in Figure 7 and Figure 8.
In Figure 7a–c, the NBI with a bandwidth of 10 MHz is successively reconstructed via BSBL, S-BSBL, and SMO-BSBL. It can be seen from the spectra that the proposed SMO-BSBL algorithm performs better than the other two. In Figure 7d–e, with the NBI bandwidth increasing, performance degradation occurs for each algorithm, which is due to the expansion of overlap between NBI and SOI in the frequency domain. Nevertheless, the proposed algorithm is still superior to the other two algorithms.
As shown in Figure 8, the proposed algorithm outperforms the others with a smaller error from range profile imaging through pulse compression of the reconstructed SOI. Specifically, it is obvious that the distortion of the range profile after NBI suppression with BSBL is substantial. The comparison shows the significance of block coherence to separated reconstruction.
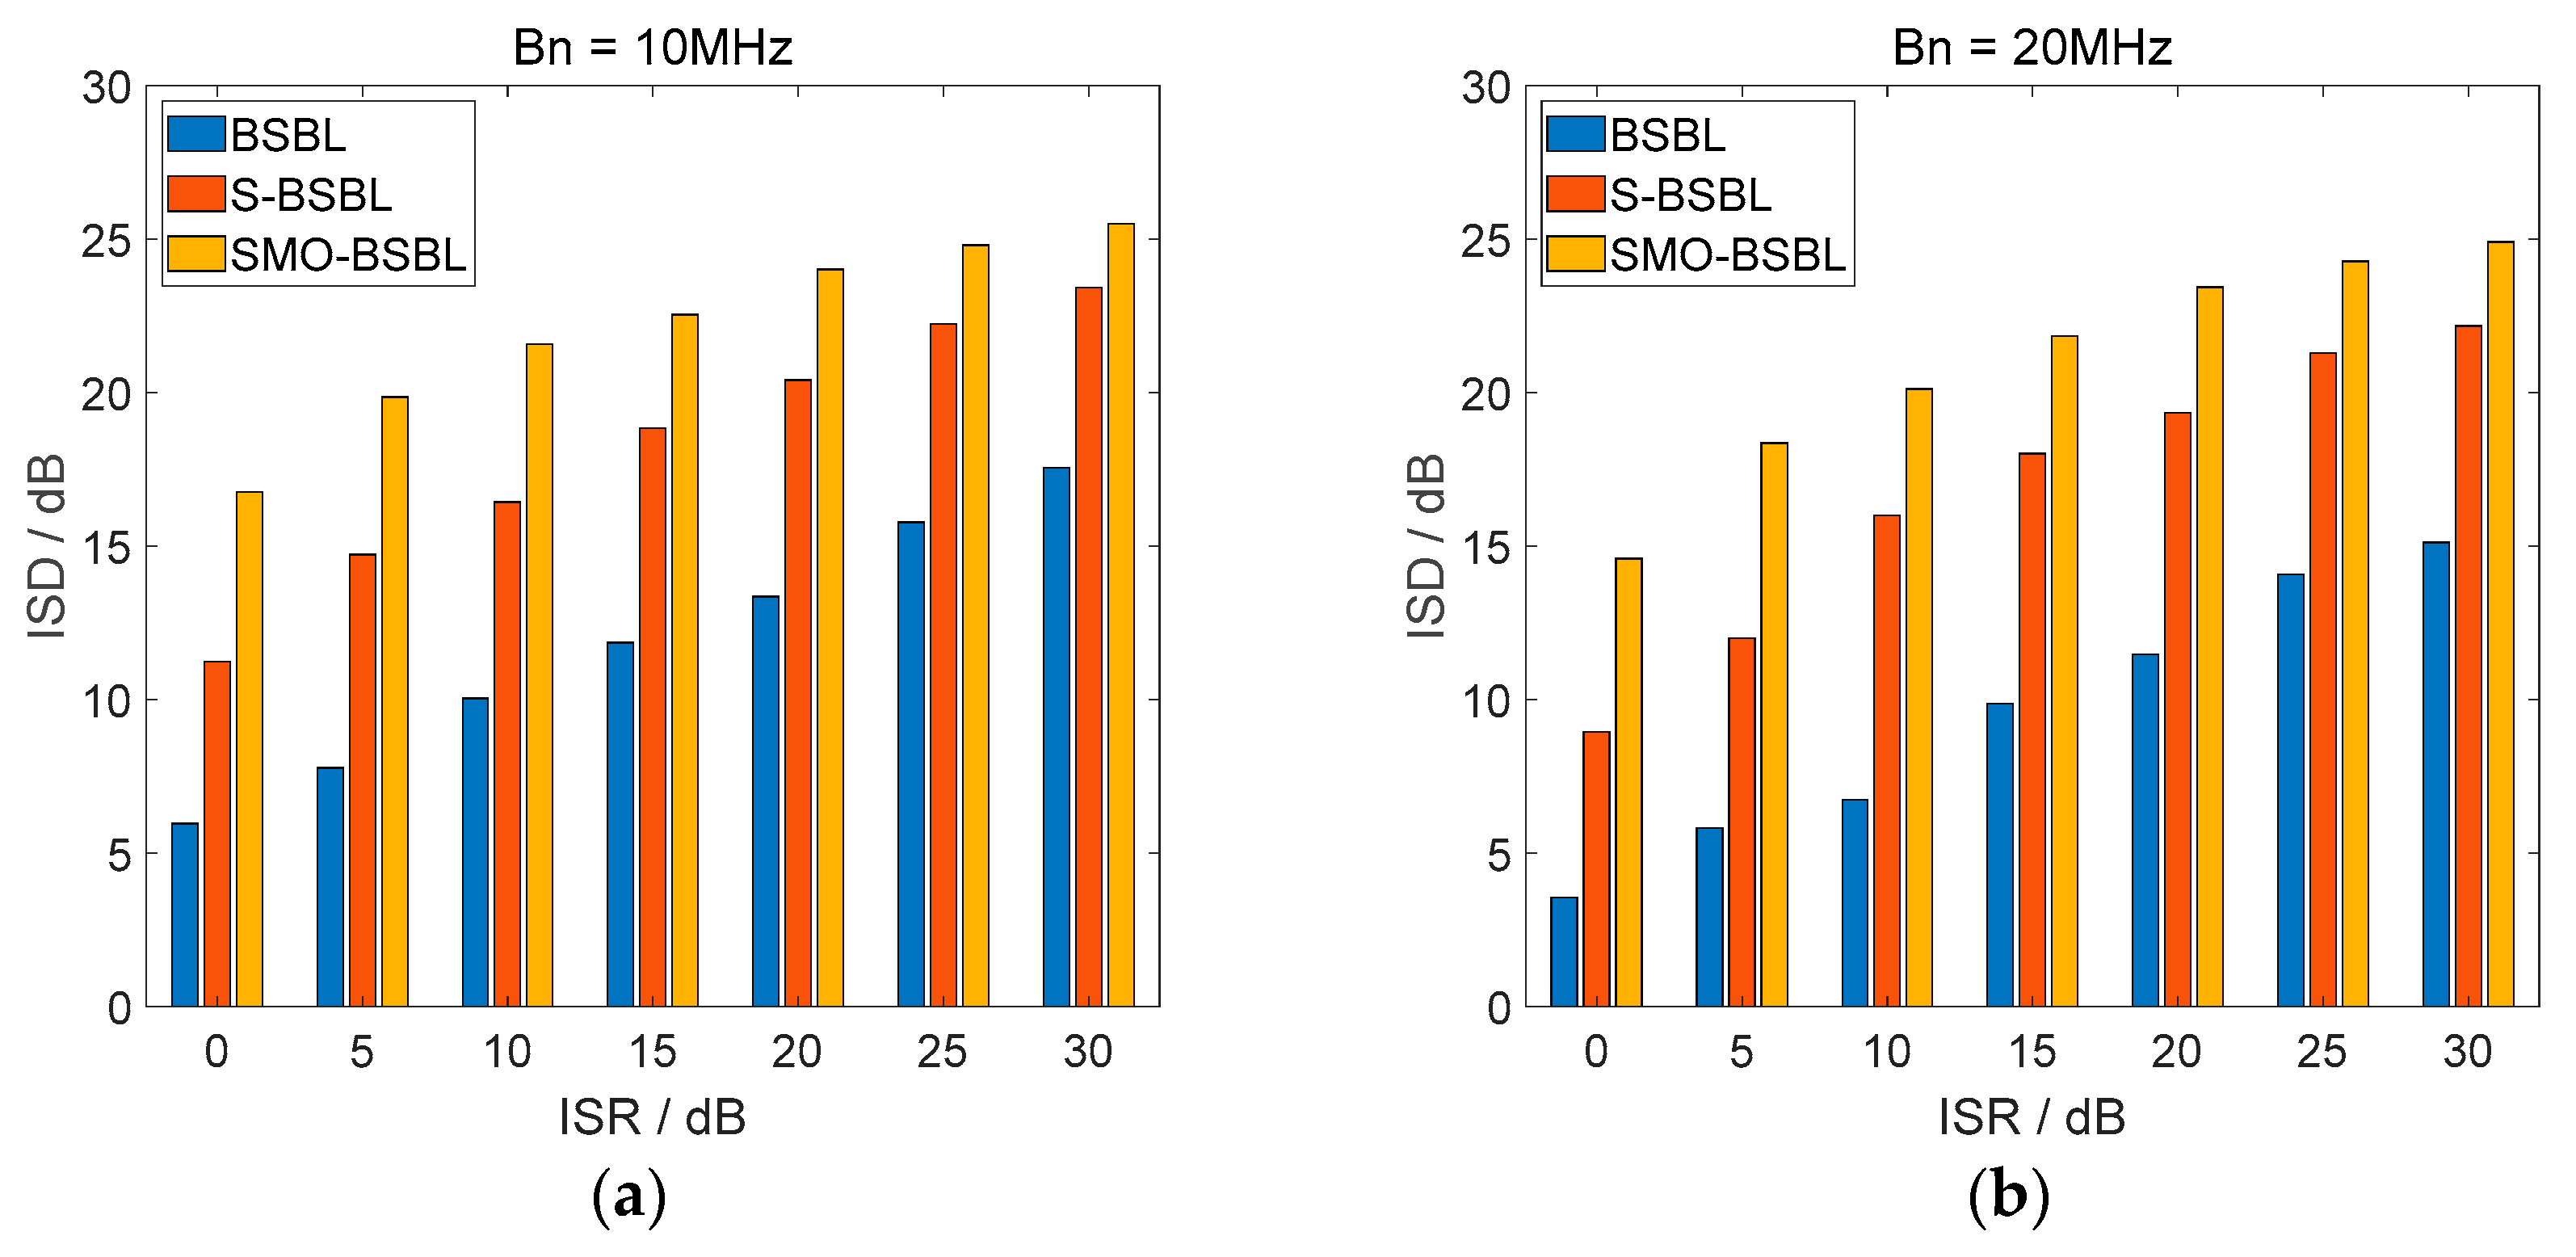
We then calculate the interference suppression degree (ISD) with 500 numerical simulations for each value of ISR ranged from 0 to 30 dB. The statistical results are shown in Figure 9.
As shown in Figure 9, the ISD increases with ISR, and the average ISD of the proposed SMO-BSBL is nearly 5 dB higher than that of S-BSBL and 10 dB higher than that of BSBL. The SMO-BSBL and the S-BSBL are less affected by the bandwidth of NBI than is BSBL.
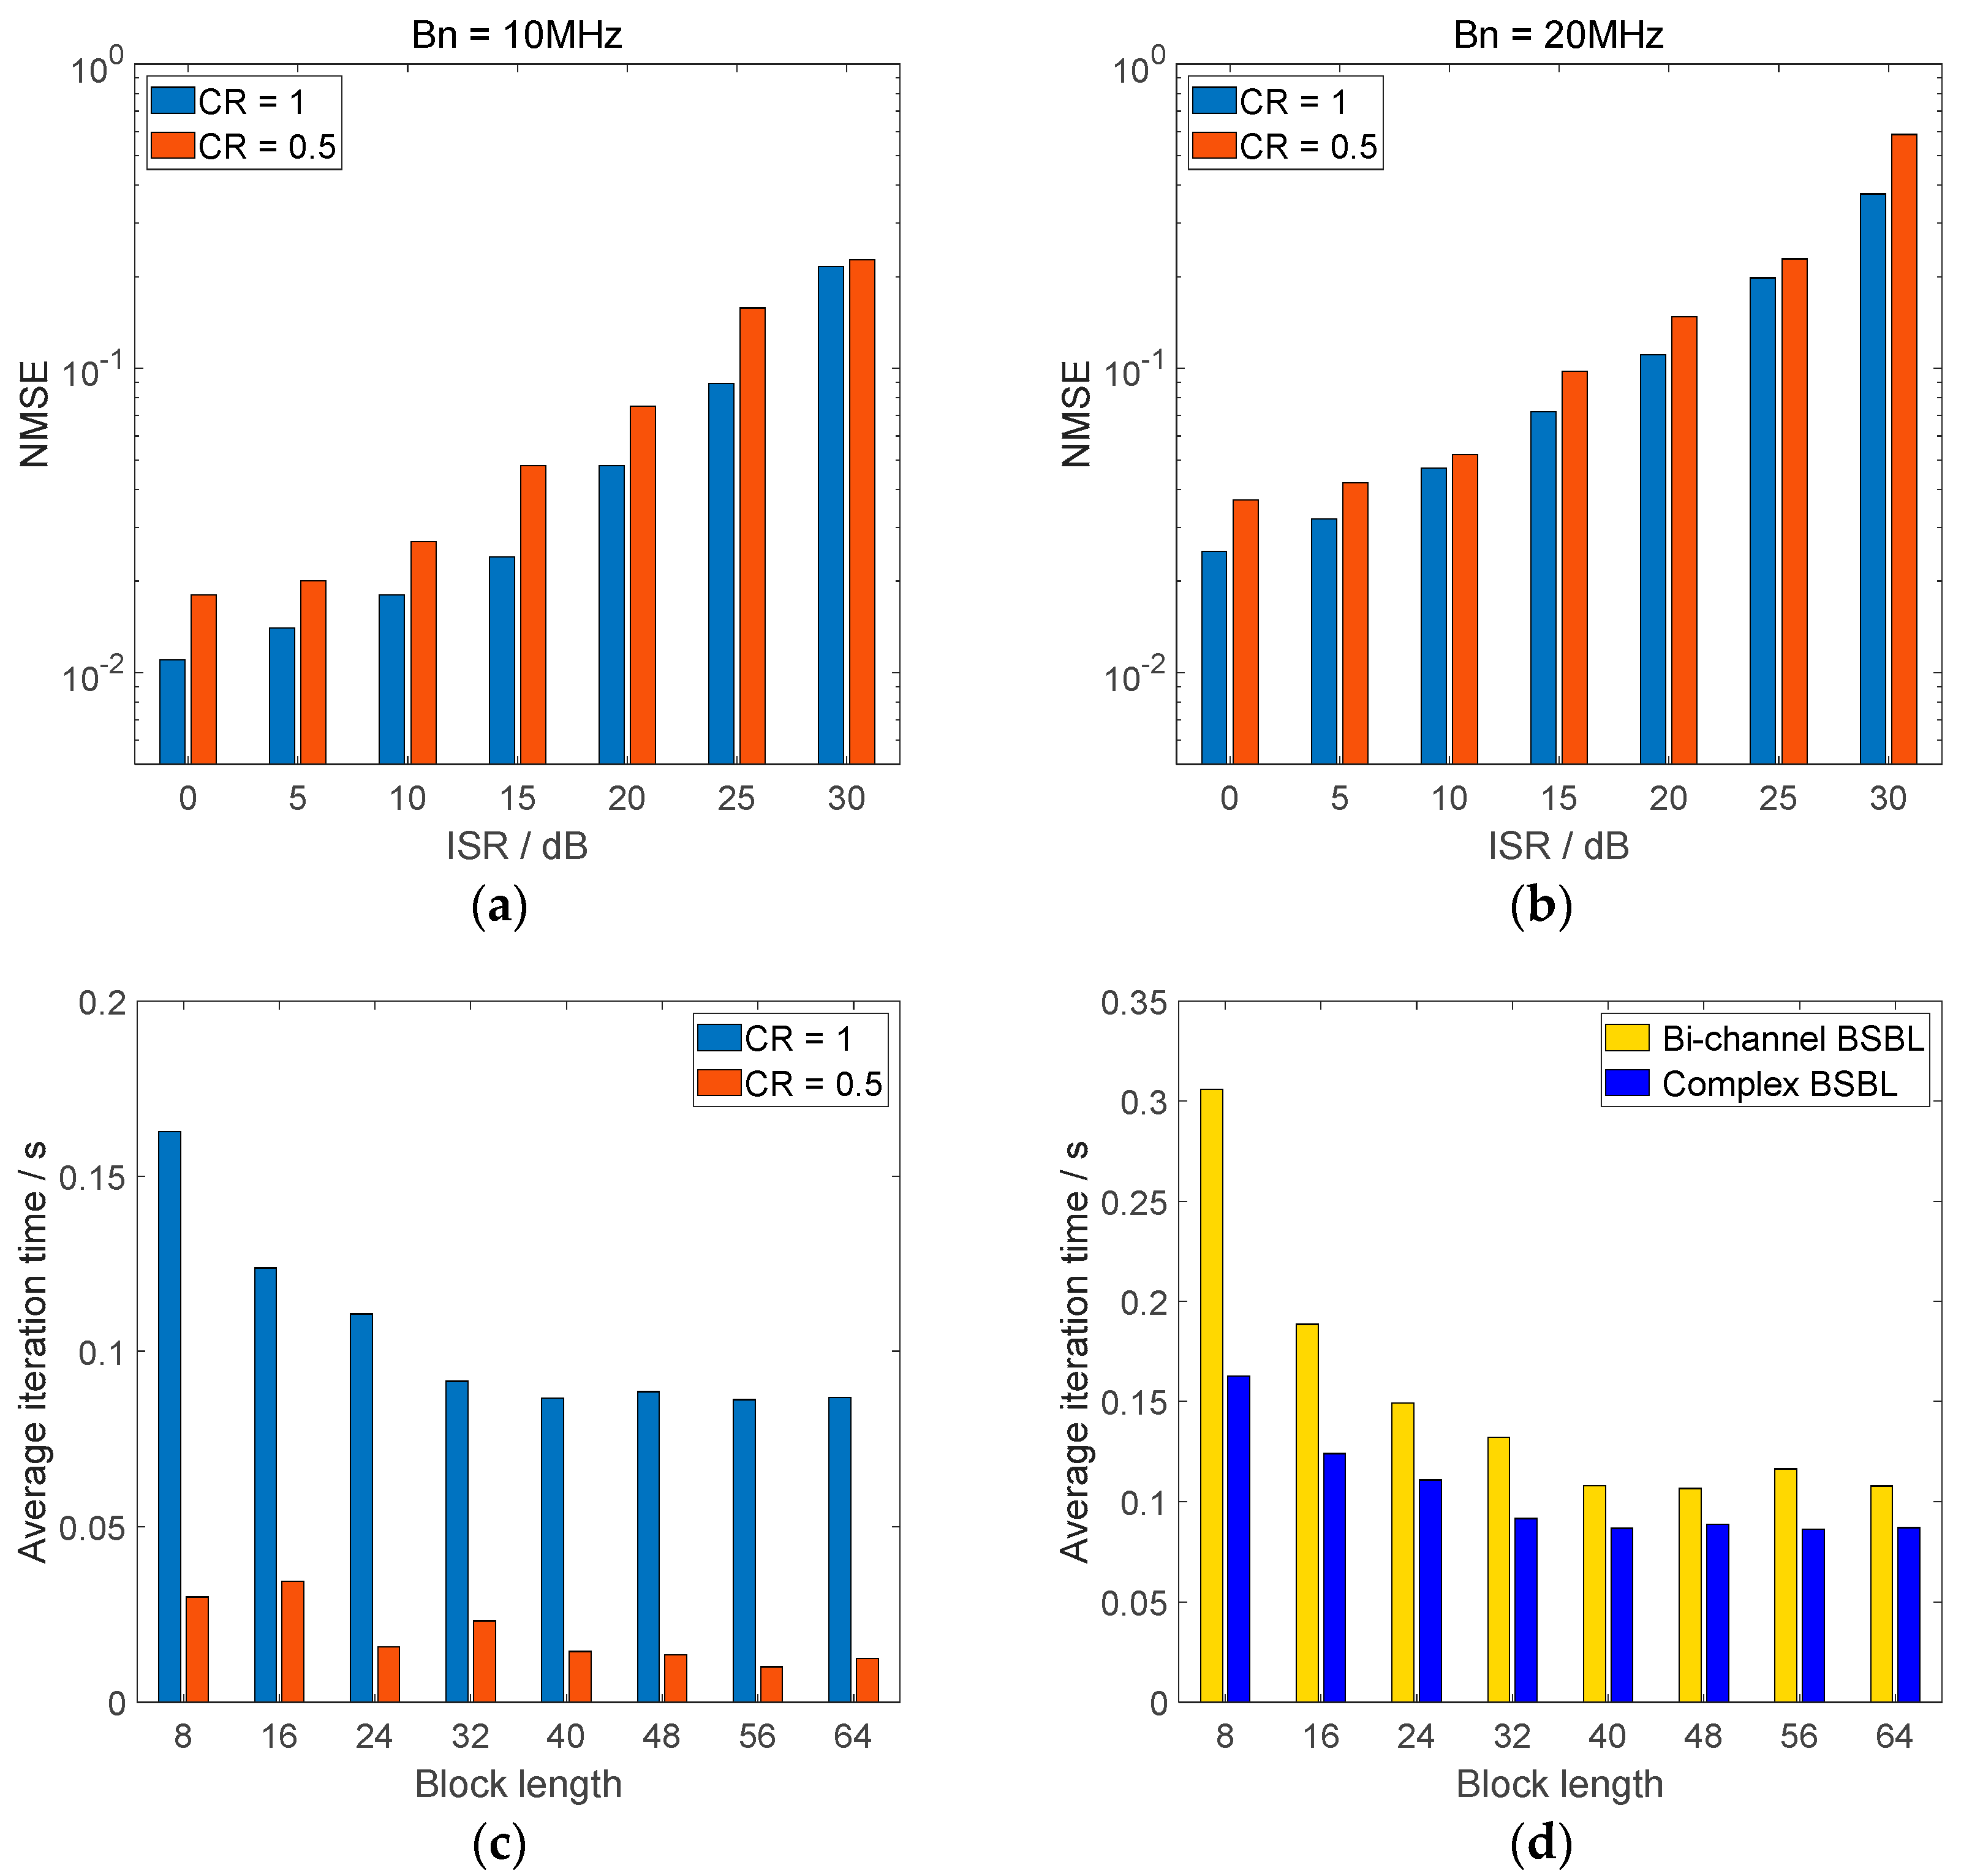
In addition, we analyzed the influence of compressed ratio (CR), which is defined as the ratio of the actual sampling rate to the Nyquist rate, and the influence of block parameters on the separated reconstruction performance of our proposed SMO-BSBL algorithm. We set 1 and 0.5, respectively, for CR to check signal reconstruction robustness with compressed measurement and calculated the average NMSE under different ISRs. To benchmark the algorithm complexity, we set the block size from 8 to 64 empirically according to signal length, and calculated the average iteration time under different block size. We also compared the time performance of the widely used Bi-channel BSBL, the complex BSBL in this paper, and the case of compressed sampling. The statistical results of 100 simulation experiments are shown in Figure 10.
As shown in Figure 10a,b, when CR is set to 0.5, which indicates that only half of all the data were used to reconstruct the SOI and NBI, it is inevitable that the performance will degrade relative to full sampling. However, the degradation of performance is acceptable, especially when the bandwidth of NBI increases. Another benefit of compressed sampling is the reduction of the data dimension; as can be seen in Figure 10c, the average iteration time using compressed data is significantly lower than that using full data. We admit that it takes a certain amount of time in the process of sensing matrix optimization to improve reconstruction performance; nevertheless, our algorithm, as shown in Figure 10d, is more time-efficient than the widely used bi-channel approach in the process of signal reconstruction.

4.2.2. Range-Azimuth Imaging

To further verify the performance of NBI separation in range-azimuth imaging, we modeled an aircraft target with multiple scattering points and carried out simulation experiments with the proposed algorithm. For the convenience of analysis and verification, we assumed that the SAR platform operates in airborne strip-map mode. Referring to the parameters in our previous work, the main simulation parameters in this section were set using parameters listed in Table 3.
The imaging results without NBI via BSBL at different CRs are shown in Figure 11. The CR is set to 1, 0.5, and 0.25 in turn, and the block size is 16. It can be seen that the BSBL-based imaging algorithm avoids the sidelobe effect by replacing the matched filtering with sparsity-based reconstructing and improves the quality of the SAR image. As the CR decreases, the imaging quality degrades slightly; however, when CR drops to 0.25, the quality is still high enough to distinguish the target.
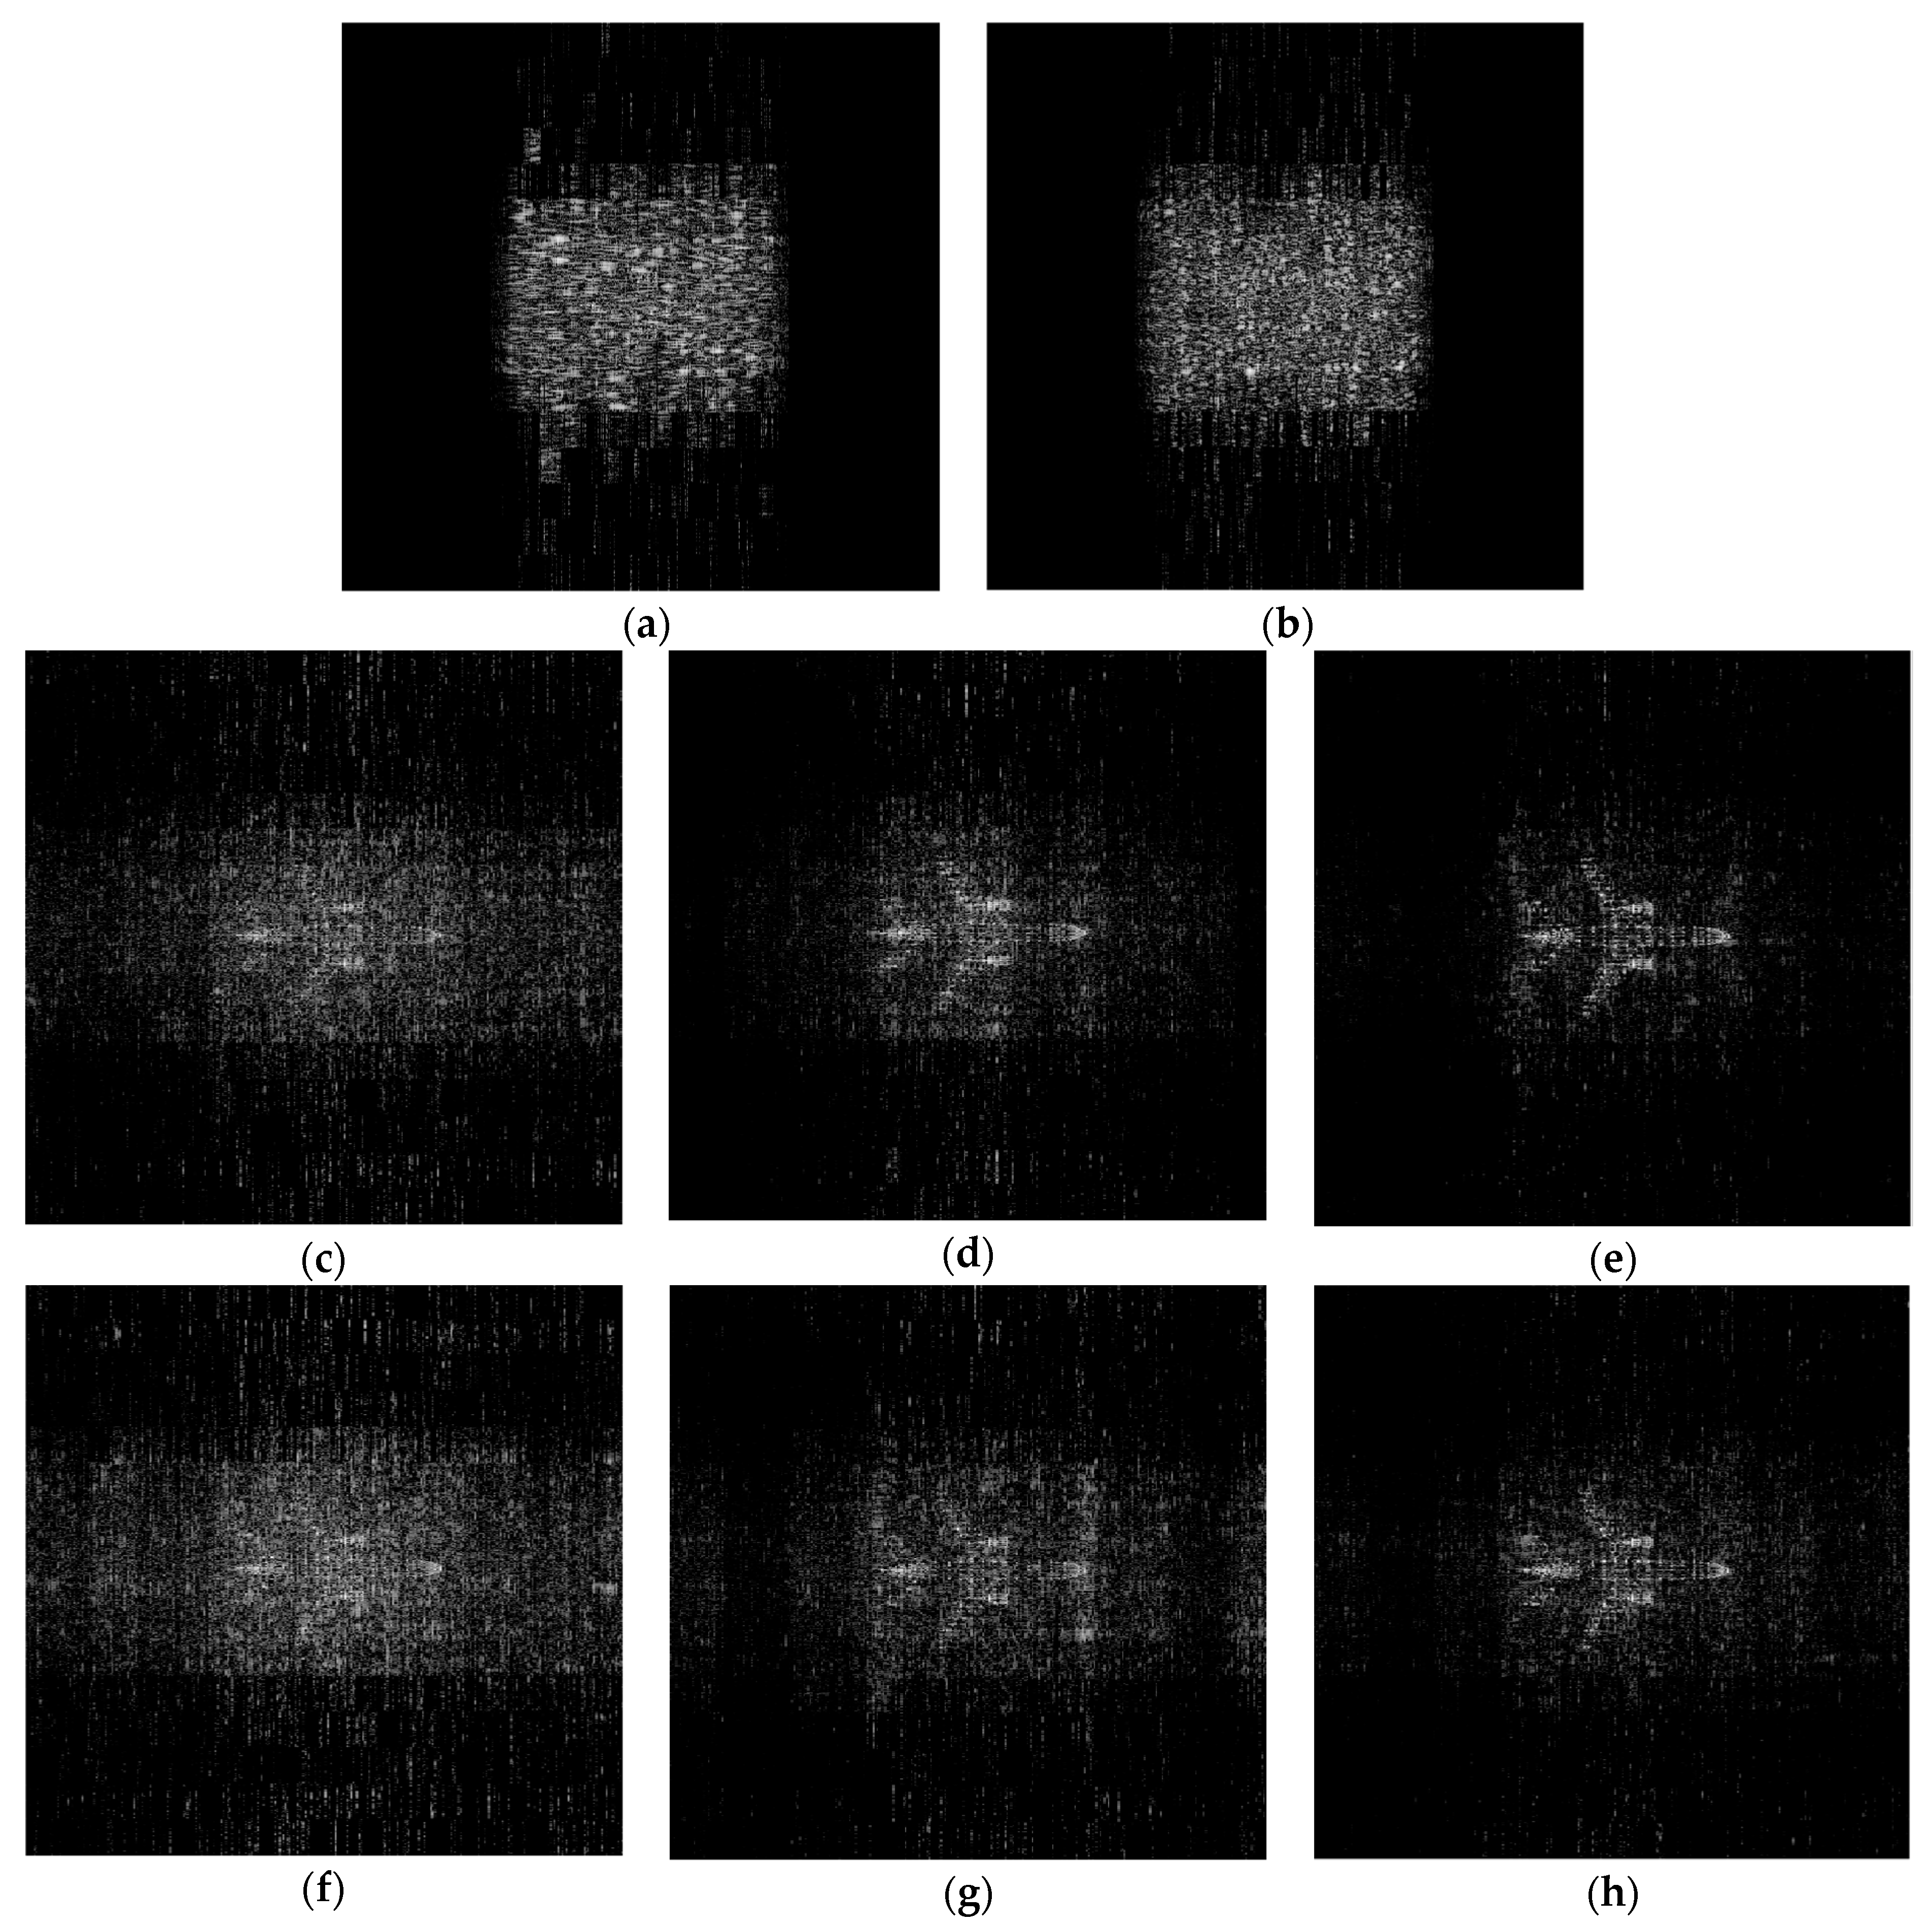
On the basis of the above results, we carried out numerical experiments of NBI separation for the simulated aircraft target. Narrowband noise-modulated interference was added to the raw echo data. We assumed that the pulse width of the NBI was equal to the entire duration of the signal for each pulse. The ISR was set to 15 dB, the CR was set to 0.5, and the bandwidth of the NBI was set to 10 MHz and 20 MHz. Imaging results before and after NBI suppression via our proposed SMO-BSBL as well as other advanced algorithms are shown in Figure 12.
In Figure 12a,b, without any suppression approach, NBI completely obscures the target in the SAR image when its bandwidth is 10% of the signal bandwidth. In Figure 12c–e, BSBL, S-BSBL, and SMO-BSBL are adopted to separate the NBI. The BSBL algorithm, which only builds a cascaded dictionary to separate NBI and the SOI, fails to recover the target effectively, since it makes no distinction between the two components when updating the covariance matrix and correlation coefficients. The S-BSBL algorithm takes this distinction into account and improves the separation and reconstruction quality. However, the suppression result is still not satisfactory, since the coherence between different sub-dictionaries will seriously disrupt the reconstruction process. In contrast, the SMO-BSBL algorithm proposed in this paper shows a superior performance in this kind of NBI separation owing to the optimal sensing matrix, which is designed to minimize the total block coherence measure. In Figure 12f–h, with the bandwidth of the NBI increasing, the target is more substantially covered. It is difficult for BSBL and S-BSBL to extract and separate NBI from the contaminated echo. The SMO-BSBL is still capable of separating NBI despite some performance degradation.
To benchmark the NBI separation performance in the image domain, we calculated the PSNR, ENL, and image entropy of the reconstructed SAR images using Equations (41)–(43). The statistical results are shown in Table 4.
As shown in Table 4, the quality of the reconstructed image via the proposed SMO-BSBL is superior to the other two advanced algorithms according to the statistical results of indicators.

5. Conclusions

In this paper, we present an enhanced NBI separation algorithm for SAR data on the basis of a sparse Bayesian learning framework. The proposed sensing matrix optimization-based block sparse Bayesian learning, which is abbreviated as SMO-BSBL, is focused on reducing the block coherence between the sensing matrix of the SOI and NBI in order to improve the separated reconstruction performance. First, we review the NBI suppression problem based on the sparse recovery model, and we then extend the basic BSBL framework to a complex-valued domain for the radar signal to reduce computational complexity. For the sake of enhancing the separability, we propose a new block coherence measure that is calculated by the newly defined external and internal block structure. We obtained an optimal sensing matrix by minimizing the optimization objective function and adopted it to the modified BSBL framework for sparse reconstruction. Moreover, we described the entire procedure of NBI separation for SAR imaging where the proposed algorithm can be embedded with excellent compatibility. Finally, we carried out simulation experiments including range imaging and range-azimuth imaging of extended targets to verify the effectiveness and superiority of our proposed algorithm. The statistical results of different indicators demonstrate that the SMO-BSBL in this paper outperforms other advanced BSBL-based algorithms for NBI separation. It is necessary to note here that, while the reconstruction time reduces under a complex BSBL framework, the total computational complexity still increases, since the sensing matrix optimization process requires additional time as a cost. Therefore, how to accelerate the convergence rate of optimization process to improve the real-time performance is our future work. In addition, given that the practical SNR condition for SAR system is not ideal in real environment, and the estimation rules of noise variance are different with different SNR ranges in basic BSBL framework, analyses of the impact of SNR on the algorithm performance will also be the focus in the subsequent studies.

Author Contributions

Methodology and formal analysis: G.L.(Guojing Li); investigation: G.L.(Guochao Lao) and S.K.; simulation: G.L.(Guojing Li), S.K., and D.Y.; writing—review and editing: G.L.(Guojing Li); supervision: W.Y.

Funding

This research was funded by a Research Project of State Key Laboratory of Complex Electromagnetic Environment Effects on Electronics and Information System, grant number 2017Z0203B.

Conflicts of Interest

The authors declare no conflict of interest.

References

  1. Lin, X.; Li, X.; Man, X.; Tian, W. Narrow-band interference suppression method in multichannel SAR based on beamforming technique and sparse recovery. Electron. Lett. 2018, 54, 1189–1191. [Google Scholar] [CrossRef]
  2. Meller, M.; Niedźwiecki, M. Multichannel self-optimizing narrowband interference canceller. Signal Process 2014, 98, 396–409. [Google Scholar] [CrossRef]
  3. Djukanovic, S.; Popovic, V. A Parametric Method for Multicomponent Interference Suppression in Noise Radars. IEEE Trans. Aerosp. Electron. Syst. 2012, 48, 2730–2738. [Google Scholar] [CrossRef]
  4. Zhou, F.; Xing, M.; Bai, X.; Sun, G.; Bao, Z. Narrow-Band interference suppression for SAR based on complex empirical mode decomposition. IEEE Geosci. Remote S. 2009, 6, 423–427. [Google Scholar] [CrossRef]
  5. Lamont-Smith, T.; Hill, R.D.; Hayward, S.D.; Yates, G.; Blake, A. Filtering approaches for interference suppression in low-frequency SAR. IEEE Proc. Radar Sonar. Navig. 2006, 153, 338–344. [Google Scholar] [CrossRef]
  6. Wu, P.; Yang, L.; Zhang, Y. A modified notch filter for suppressing radio-frequency-interference in P-band SAR data. In Proceedings of the 2016 IEEE International Geoscience and Remote Sensing Symposium (IGARSS), Beijing, China, 10–15 July 2016. [Google Scholar]
  7. Lord, R.T.; Inggs, M.R. Efficient RFI suppression in SAR using LMS adaptive filter integrated with range/Doppler algorithm. Electron. Lett. 1999, 35, 629–630. [Google Scholar] [CrossRef]
  8. Zhou, F.; Wu, R.; Xing, M.; Bao, Z. Eigensubspace-Based filtering with application in Narrow-Band interference suppression for SAR. IEEE Geosci. Remote S. 2007, 4, 75–79. [Google Scholar] [CrossRef]
  9. Zhou, F.; Tao, M.; Bai, X.; Liu, J. Narrow-Band interference suppression for SAR based on independent component analysis. IEEE Trans. Geosci. Remote 2013, 51, 4952–4960. [Google Scholar] [CrossRef]
  10. Tao, M.; Zhou, F.; Liu, J.; Liu, Y.; Zhang, Z.; Bao, Z. Narrow-Band interference mitigation for SAR using independent subspace analysis. IEEE Trans. Geosci. Remote 2014, 52, 5289–5301. [Google Scholar]
  11. Zhou, F.; Tao, M. Research on methods for narrow-band interference suppression in synthetic aperture radar data. IEEE J.-STARS 2015, 8, 3476–3485. [Google Scholar] [CrossRef]
  12. Su, J.; Tao, H.; Tao, M.; Wang, L.; Xie, J. Narrow-Band interference suppression via RPCA-Based signal separation in time–frequency domain. IEEE J.-STARS 5016, 10, 5016–5025. [Google Scholar] [CrossRef]
  13. Nguyen, L.H.; Tran, T.D. Efficient and robust RFI extraction via sparse recovery. IEEE J.-STARS 2016, 9, 2104–2117. [Google Scholar] [CrossRef]
  14. Huang, Y.; Liao, G.; Li, J.; Xu, J. Narrowband RFI suppression for SAR system via fast implementation of joint sparsity and Low-Rank property. IEEE Trans. Geosci. Remote 2018, 56, 2748–2761. [Google Scholar] [CrossRef]
  15. Huang, Y.; Liao, G.; Zhang, Z.; Xiang, Y.; Li, J.; Nehorai, A. Fast narrowband RFI suppression algorithms for SAR systems via Matrix-Factorization techniques. IEEE Trans. Geosci. Remote 2019, 57, 250–262. [Google Scholar] [CrossRef]
  16. Li, G.; Liu, G.; Ye, W. RFI mitigation for SAR based on compressed sensing and morphological component analysis. In Proceedings of the 2017 IEEE International Conference on Signal Processing, Communications and Computing (ICSPCC), Xiamen, China, 22–25 October 2017. [Google Scholar]
  17. Boyd, S.; Parikh, N.; Chu, E.; Peleato, B.; Eckstein, J. Distributed Optimization and Satistical Learning via the Alternating Direction Method of Mmultipliers; Now Publishers Inc.: Hanover, MA, USA, 2011; pp. 13–24. [Google Scholar]
  18. Liu, H.; Li, D. RFI suppression based on sparse frequency estimation for SAR imaging. IEEE Geosci. Remote Sens. 2016, 13, 63–67. [Google Scholar] [CrossRef]
  19. Donoho, D. Compressed sensing. IEEE Trans. Inform. Theory 2006, 52, 1289–1306. [Google Scholar] [CrossRef]
  20. Tropp, J.A.; Gilbert, A.C. Signal recovery from random measurements via orthogonal matching pursuit. IEEE Trans. Inform. Theory 2007, 53, 4655–4666. [Google Scholar] [CrossRef]
  21. Eldar, Y.C.; Kuppinger, P.; Bolcskei, H. Block-Sparse signals: Uncertainty relations and efficient recovery. IEEE Trans. Signal Proces. 2010, 58, 3042–3054. [Google Scholar] [CrossRef]
  22. Tipping, M.E. Sparse Bayesian learning and the relevance vector machine. J. Mach. Learn. Res. 2001, 1, 211–244. [Google Scholar]
  23. Zhang, Z.; Rao, B.D. Sparse signal recovery with temporally correlated source vectors using sparse bayesian learning. IEEE J.-STSP 2011, 5, 912–926. [Google Scholar] [CrossRef]
  24. Zhang, Z.; Rao, B.D. Extension of SBL algorithms for the recovery of block sparse signals with Intra-Block correlation. IEEE Trans. Signal Proces. 2013, 61, 2009–2015. [Google Scholar] [CrossRef]
  25. Lu, X.; Su, W.; Yang, J.; Gu, H.; Zhang, H.; Yu, W.; Yeo, T.S. Radio frequency interference suppression for SAR via block sparse Bayesian learning. IEEE J.-STARS 2018, 11, 4835–4847. [Google Scholar] [CrossRef]
  26. Cumming, I.G.; Wong, F.H. Digital Processing of Synthetic Aperture Radar Data: Algorithms and Implementation; Publishing House of Electronics Industry: Beijing, China, 2012; pp. 75–104. [Google Scholar]
  27. Kay, S.M. Fundamentals of Statistical Signal Processing: Estimation Theory; Prentice Hall PTR: Upper Saddle River, NJ, USA, 1993; p. 504. [Google Scholar]
  28. Mahler, R. Statistical Multisource-Multitarget Information Fusion; Artech House: Norwood, MA, USA, 2007; pp. 699–703. [Google Scholar]
  29. Hj∅rungnes, A. Complex-Valued Matrix Derivatives: With Applications in Signal Processing and Communications; Cambridge University Press: New York, NY, USA, 2011; pp. 43–59. [Google Scholar]
  30. Zelnik-Manor, L.; Rosenblum, K.; Eldar, Y.C. Sensing matrix optimization for Block-Sparse decoding. IEEE Trans. Signal Proces. 2011, 59, 4300–4312. [Google Scholar] [CrossRef]
  31. Zelnik-Manor, L.; Rosenblum, K.; Eldar, Y.C. Dictionary optimization for Block-Sparse representations. IEEE Trans. Signal Proces. 2012, 60, 2386–2395. [Google Scholar] [CrossRef]
  32. Elad, M.; Bruckstein, A.M. A generalized uncertainty principle and sparse representation in pairs of bases. IEEE Trans. Inform. Theory 2002, 48, 2558–2567. [Google Scholar] [CrossRef] [Green Version]
  33. Duarte-Carvajalino, J.M.; Sapiro, G. Learning to sense sparse signals: Simultaneous sensing matrix and sparsifying dictionary optimization. IEEE Trans. Image Process. 2009, 18, 1395–1408. [Google Scholar] [CrossRef] [PubMed]
  34. Gandhi, P.; Kassam, S. Analysis of CFAR processors in nonhomogeneous background. IEEE Trans. Aerosp. Electron. Syst. 1988, 24, 427–445. [Google Scholar] [CrossRef]
  35. Fang, J.; Xu, Z.; Zhang, B.; Hong, W.; Wu, Y. Fast Compressed Sensing SAR Imaging Based on Approximated Observation. IEEE J.-STARS 2014, 7, 352–363. [Google Scholar]
  36. Lao, G.; Ye, W.; Li, G.; Zhang, W. A quality evaluation method of SAR image based on grayscale image and electromagnetic scattering characteristics. In Proceedings of the 8th International Conference on Digital Image Processing, Chengdu, China, 29 August 2016; Society of Photo-Optical Instrumentation Engineers (SPIE): Bellingham, WA, USA, 2016. [Google Scholar] [CrossRef]
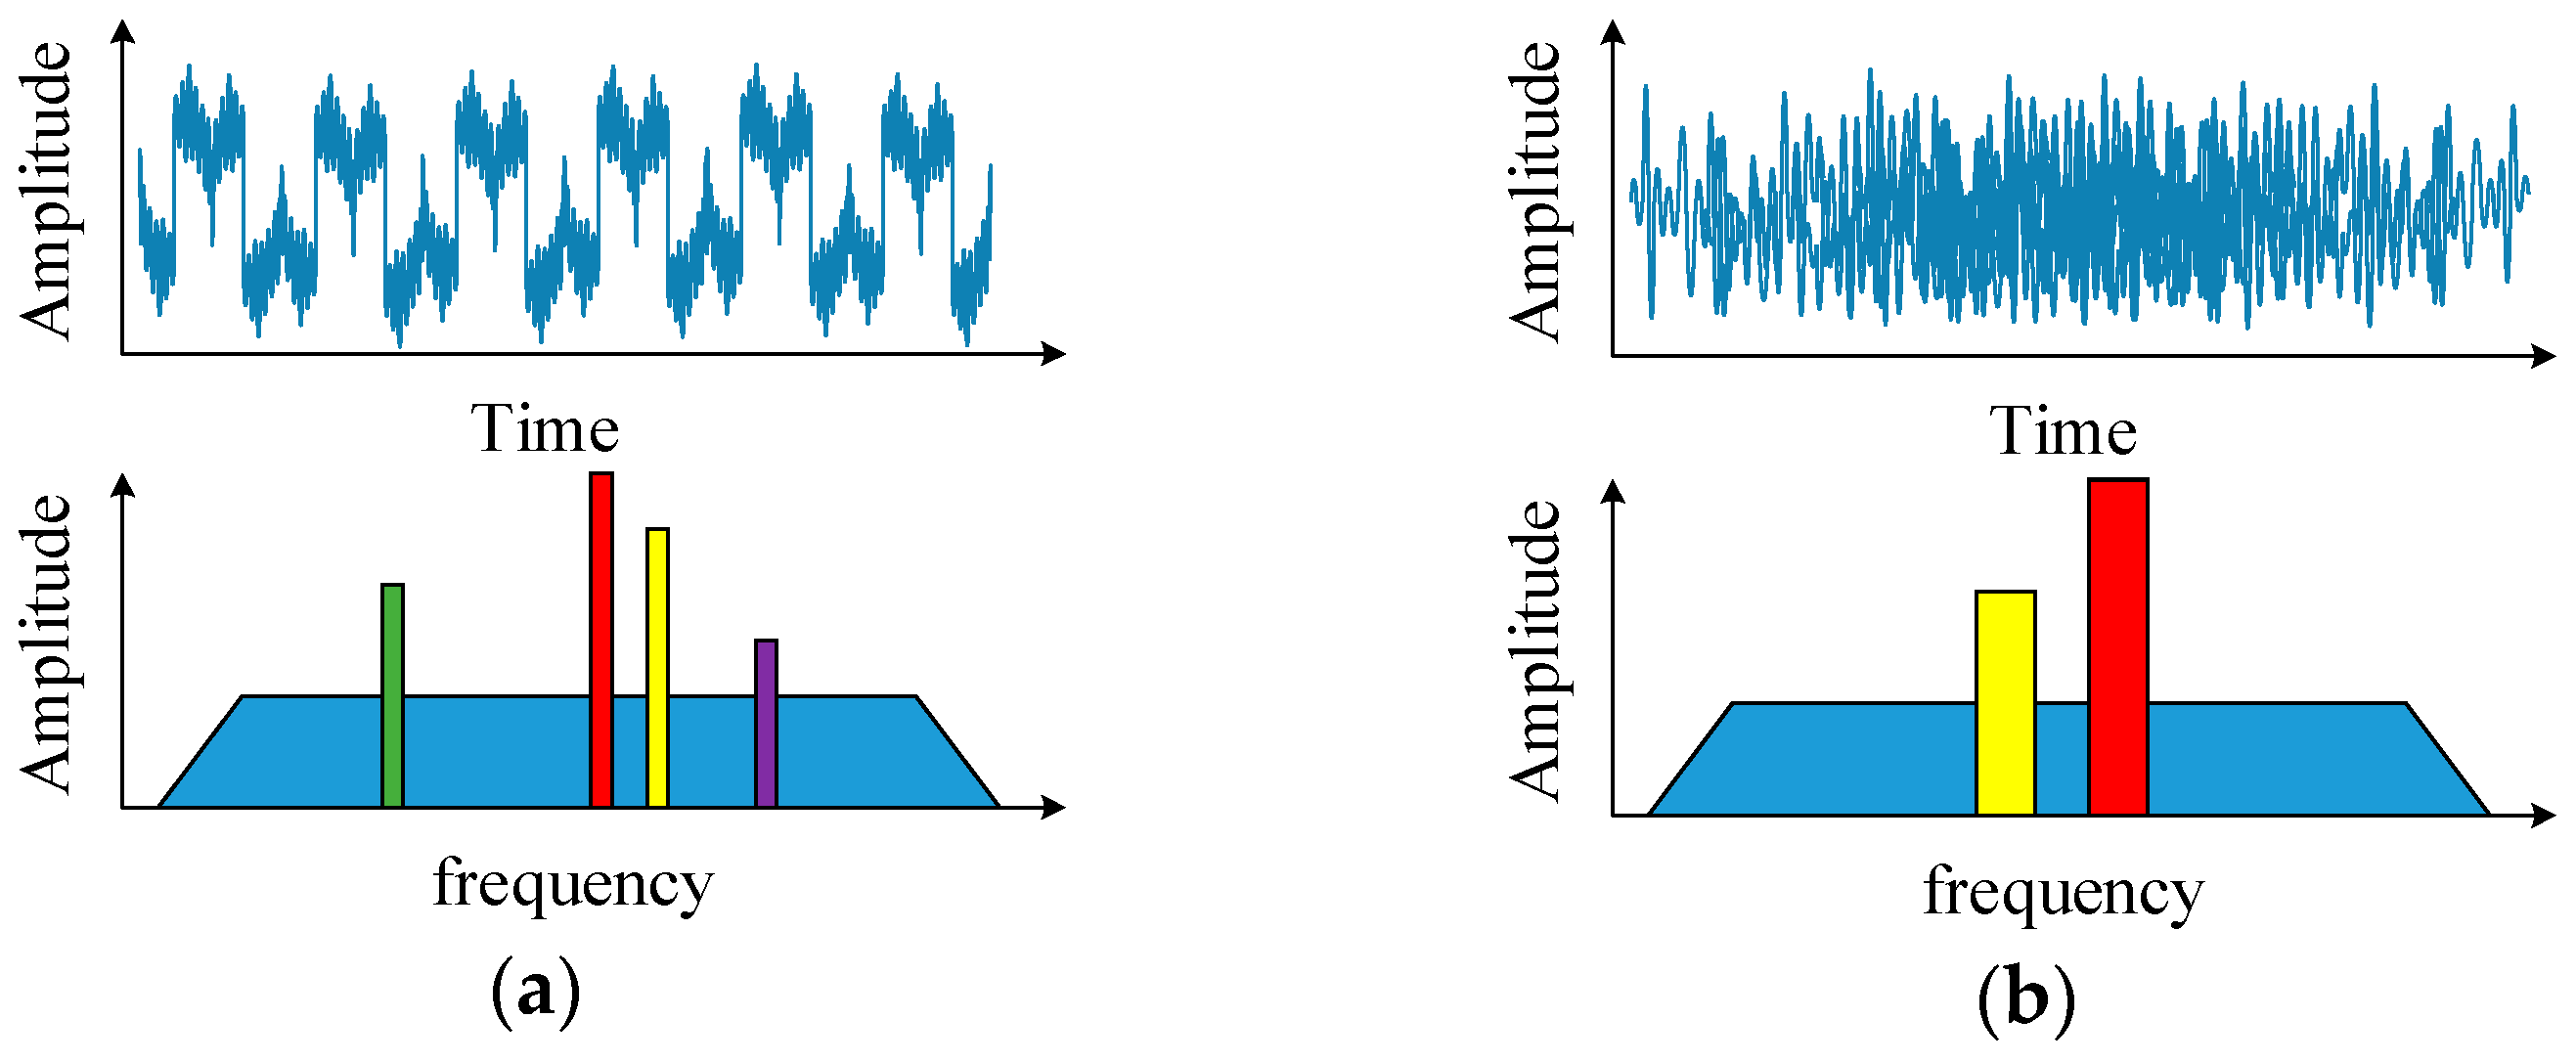
Figure 1. Waveform and spectrum diagram for two types of narrowband interference (NBI): (a) complex sine model; (b) noise-modulated model.
Electronics 08 00458 g001
Figure 2. Diagram of the structure relationship between external block and internal block. (a) The hierarchical block structure with gex external blocks and gin internal blocks with the size of d. The solid wireframe represents the external block, the dashed wireframe represents the internal block, and different components are in different colors. (b) The Gram form of the sensing matrix with two external blocks and two internal blocks of size four in each external block. Entries belonging to different external blocks are in green. Entries belonging to the same external block, but different internal blocks, are in yellow. Entries belonging to the same internal block are in red, and diagonal entries are in blue.
Electronics 08 00458 g002
Figure 3. Synthetic aperture radar (SAR) imaging procedure with NBI separation via the SMO-BSBL algorithm (the procedure in the dashed wireframe can be omitted when it is unnecessary).
Electronics 08 00458 g003
Figure 4. Characteristic of the signal of interest (SOI) and NBI in different domains. (a) Waveform in time domain, Bn = 10 MHz; (b) spectrum in the frequency domain, Bn = 10 MHz; (c) range distribution, Bn = 10 MHz; (d) waveform in time domain, Bn = 20 MHz; (e) spectrum in frequency domain, Bn = 20 MHz; (f) range distribution, Bn = 20 MHz.
Electronics 08 00458 g004
Figure 5. Gram matrices optimized with different weights. (a) η = 0.1; (b) η = 0.5; (c) η = 0.9; (d) enlarged view of η = 0.1 in the dashed wireframe; (e) enlarged view of η = 0.5 in the dashed wireframe; (f) enlarged view of η = 0.5 in the dashed wireframe.
Electronics 08 00458 g005
Figure 6. Histogram of reconstruction performance under different weights. (a) Reconstruction error with Bn = 10 MHz; (b) reconstruction error with Bn = 20 MHz; (c) SMO convergence time.
Electronics 08 00458 g006
Figure 7. Spectrum of the reconstructed NBI. (a) BSBL, Bn = 10 MHz; (b) S-BSBL, Bn = 10 MHz; (c) SMO-BSBL, Bn = 10 MHz; (d) BSBL, Bn = 20 MHz; (e) S-BSBL, Bn = 20 MHz; (f) SMO-BSBL, Bn = 20 MHz.
Electronics 08 00458 g007
Figure 8. Range profile of the reconstructed SOI. (a) BSBL, Bn = 10 MHz; (b) S-BSBL, Bn = 10 MHz; (c) SMO-BSBL, Bn = 10 MHz; (d) BSBL, Bn = 20 MHz; (e) S-BSBL, Bn = 20 MHz; (f) SMO-BSBL, Bn = 20 MHz.
Electronics 08 00458 g008aElectronics 08 00458 g008b
Figure 9. Interference suppression degree under different interference-to-signal ratio (ISR). (a) Bn = 10 MHz; (b) Bn = 20 MHz.
Electronics 08 00458 g009
Figure 10. Reconstruction and time performance under different compressed ratio (CR) and block length. (a) Signal reconstruction error, Bn = 10 MHz; (b) signal reconstruction error, Bn = 20 MHz; (c) average iteration time under different CR; (d) average iteration time under different methods.
Electronics 08 00458 g010
Figure 11. Range-azimuth imaging results via BSBL without NBI. (a) CR = 1; (b) CR = 0.5; (c) CR = 0.25.
Electronics 08 00458 g011
Figure 12. Range-azimuth imaging results of the simulated aircraft target. (a) Without NBI suppression (Bn = 10 MHz); (b) without NBI suppression (Bn = 20 MHz); (c) BSBL (Bn = 10 MHz); (d) S-BSBL (Bn = 10 MHz); (e) SMO-BSBL (Bn = 10 MHz); (f) BSBL (Bn = 20 MHz); (g) S-BSBL (Bn = 20 MHz); (h) SMO-BSBL (Bn = 20 MHz).
Electronics 08 00458 g012
Table 1. NBI separation algorithm based on sensing matrix optimization-based block sparse Bayesian learning (SMO-BSBL).
Task: Find an Optimal Observation Matrix to Improve NBI Separation and SOI Reconstruction Based on Block Sparse Bayesian Learning.
Inputs:
 1. Random observation matrix Φ ˜ ;
 2. Compressed measurement y ˜ ;
 3. Cascaded dictionary Ψ ˜ = [ Ψ ˜ s    Ψ ˜ n ] ;
 4. Block size d i ( i = 1 , , g ) ;
 5. Number of external and internal blocks g e x , g in ;
 6. Coherence weight η ;
Outputs:
 1. Optimal observation matrix Φ ˜ ;
 2. Reconstructed NBI-free signal s ˜ ;
Initialization:
 1. Initialize Φ ˜ as an M×N Gaussian random matrix;
 2. Initialize the maximum number of optimizing iterations as Nmax = 500;
 3. Initialize the public parameters to be estimated as σ 2 = 10 3 ;
 4. Initialize the parameters for separation as B = [ B s   B n ] = d i a g [ eye ( d 1 ) , , eye ( d g ) ] , γ = [ γ s γ n ] = 1 ;
 5. Initialize the threshold for pruning out γ as γ T s = γ T n = 10 2 ;
 6. Initialize the iteration stop condition as Δ γ s t o p = 10 5 ;
 7. Initialize the maximum number of reconstructive iterations as Kmax = 1000;
A. Sensing matrix optimizing stage
 1. Calculate the total block coherence by Equations (29)–(31);
 2. Build objective function for optimizing by Equation (32);
 3. Calculate a new initialized observation matrix Φ ˜ ( 0 ) by Equations (33)–(34);
  Repeat from n = 0 until n = Nmax − 1
  (1) Calculate the Gram matrix by G ( n ) = ( Φ ˜ ( n ) Ψ ˜ ) H Φ ˜ ( n ) Ψ ˜ ;
  (2) Build the equivalent objective function by Equations (35)–(36);
  (3) Update the optimal Φ ˜ ( n ) by Equation (37);
  (4) n = n + 1;
 4. Set Φ ˜ = Φ ˜ ( n ) ;
B. Separation and reconstruction stage:
 1. Reset the sensing matrix by Θ ˜ = Φ ˜ Ψ ˜ ;
Repeat from k = 1 until Kmax or | | γ k γ k 1 | | < Δ γ s t o p ;
  (1) Update the prior covariance matrix C 0 by Equation (11);
  (2) Update the covariance matrix by C α ˜ = ( C 0 1 +   σ 2 Θ ˜ H Θ ˜ ) 1 ;
  (3) Update the expectation by μ α ˜ = σ 2 C α ˜ Θ ˜ H y ˜ ;
  (4) Update the parameters σ 2 , γ s ( k ) , B ˜ s ( k ) , γ n ( k ) , B ˜ n ( k ) by Equations (20)–(24);
  (5) Update the threshold of γ T s by Equation (38)
  (6) k = k + 1
 2. Calculate coefficient by α ˜ = [ α ˜ s ; α ˜ n ] = μ α ˜ ;
 3. Reconstruct the NBI-free signal by s ˜ = Ψ ˜ α ˜ s .
Table 2. Product factor values under different false-alarm rates.
Pfa = 10−1Pfa = 10−2Pfa = 10−3Pfa = 10−4
Nc = 43.118.6518.4936.00
Nc = 82.696.2310.9717.30
Nc = 162.485.348.6412.45
Nc = 322.394.957.7110.67
Table 3. Main simulation parameters of SAR imaging.
Parameter ClassParameter NameParameter Value
PlatformPlatform height3000 m
Pitch angle45°
Squint Angle
TargetNumber of points1932
Scene vertical range −128 to 128 m
Scene parallel range −128 to 128 m
SignalCarrier frequency3 GHz
Bandwidth100 MHz
Pulse width1 μs
Pulse repetition frequency 125 Hz
Oversampling coefficient1.2
Size of Range-Azimuth Cells512×512
Table 4. Statistical results of simulated SAR image quality.
OriginalBnContaminatedBSBLS-BSBLSMO-BSBL
PSNR (dB)18.80910 MHz10.48911.44115.61716.322
20 MHz10.47911.31912.77014.915
ENL (dB)1.53710 MHz3.8402.9502.3662.140
20 MHz3.6812.9413.4632.636
Entropy3.90210 MHz6.0065.4044.4354.292
20 MHz5.8775.1224.9504.577