Performance Analysis of Bandwidth Allocation Based on Dynamic User Priority for Indoor Visible Light Communication Ultra-Dense Networks


Abstract
1. Introduction
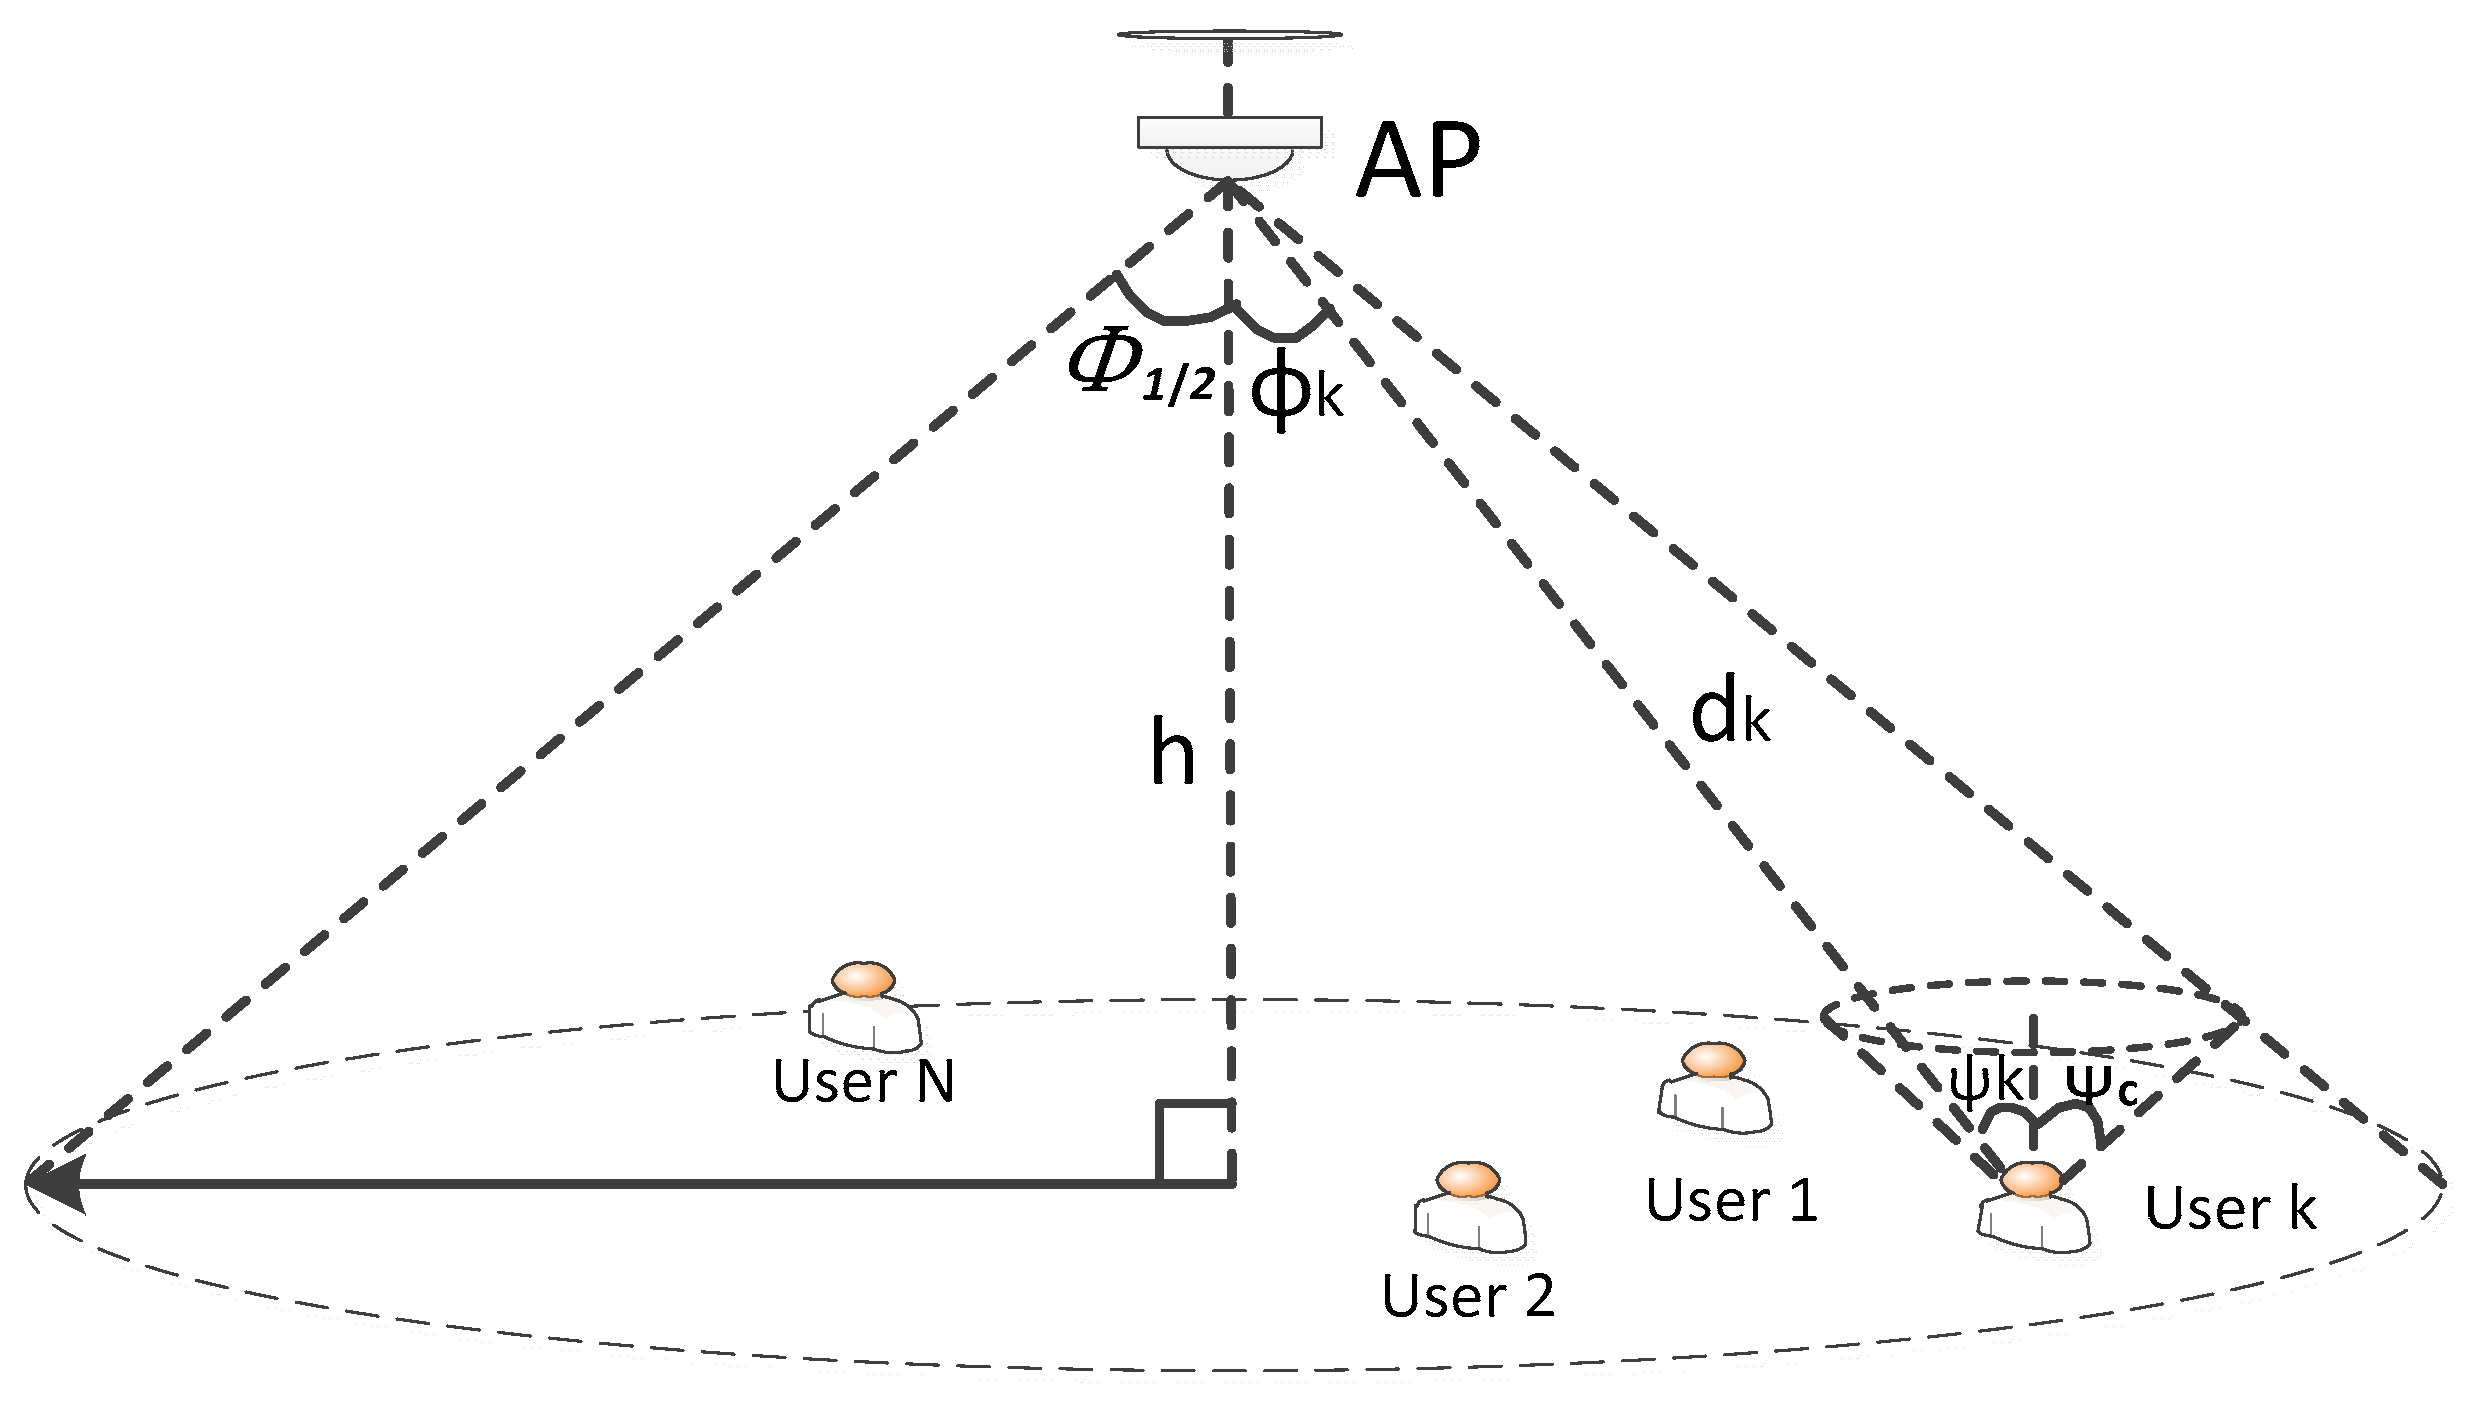
2. Problem Analysis
3. Resource Allocation Method Based on Dynamic User Priority
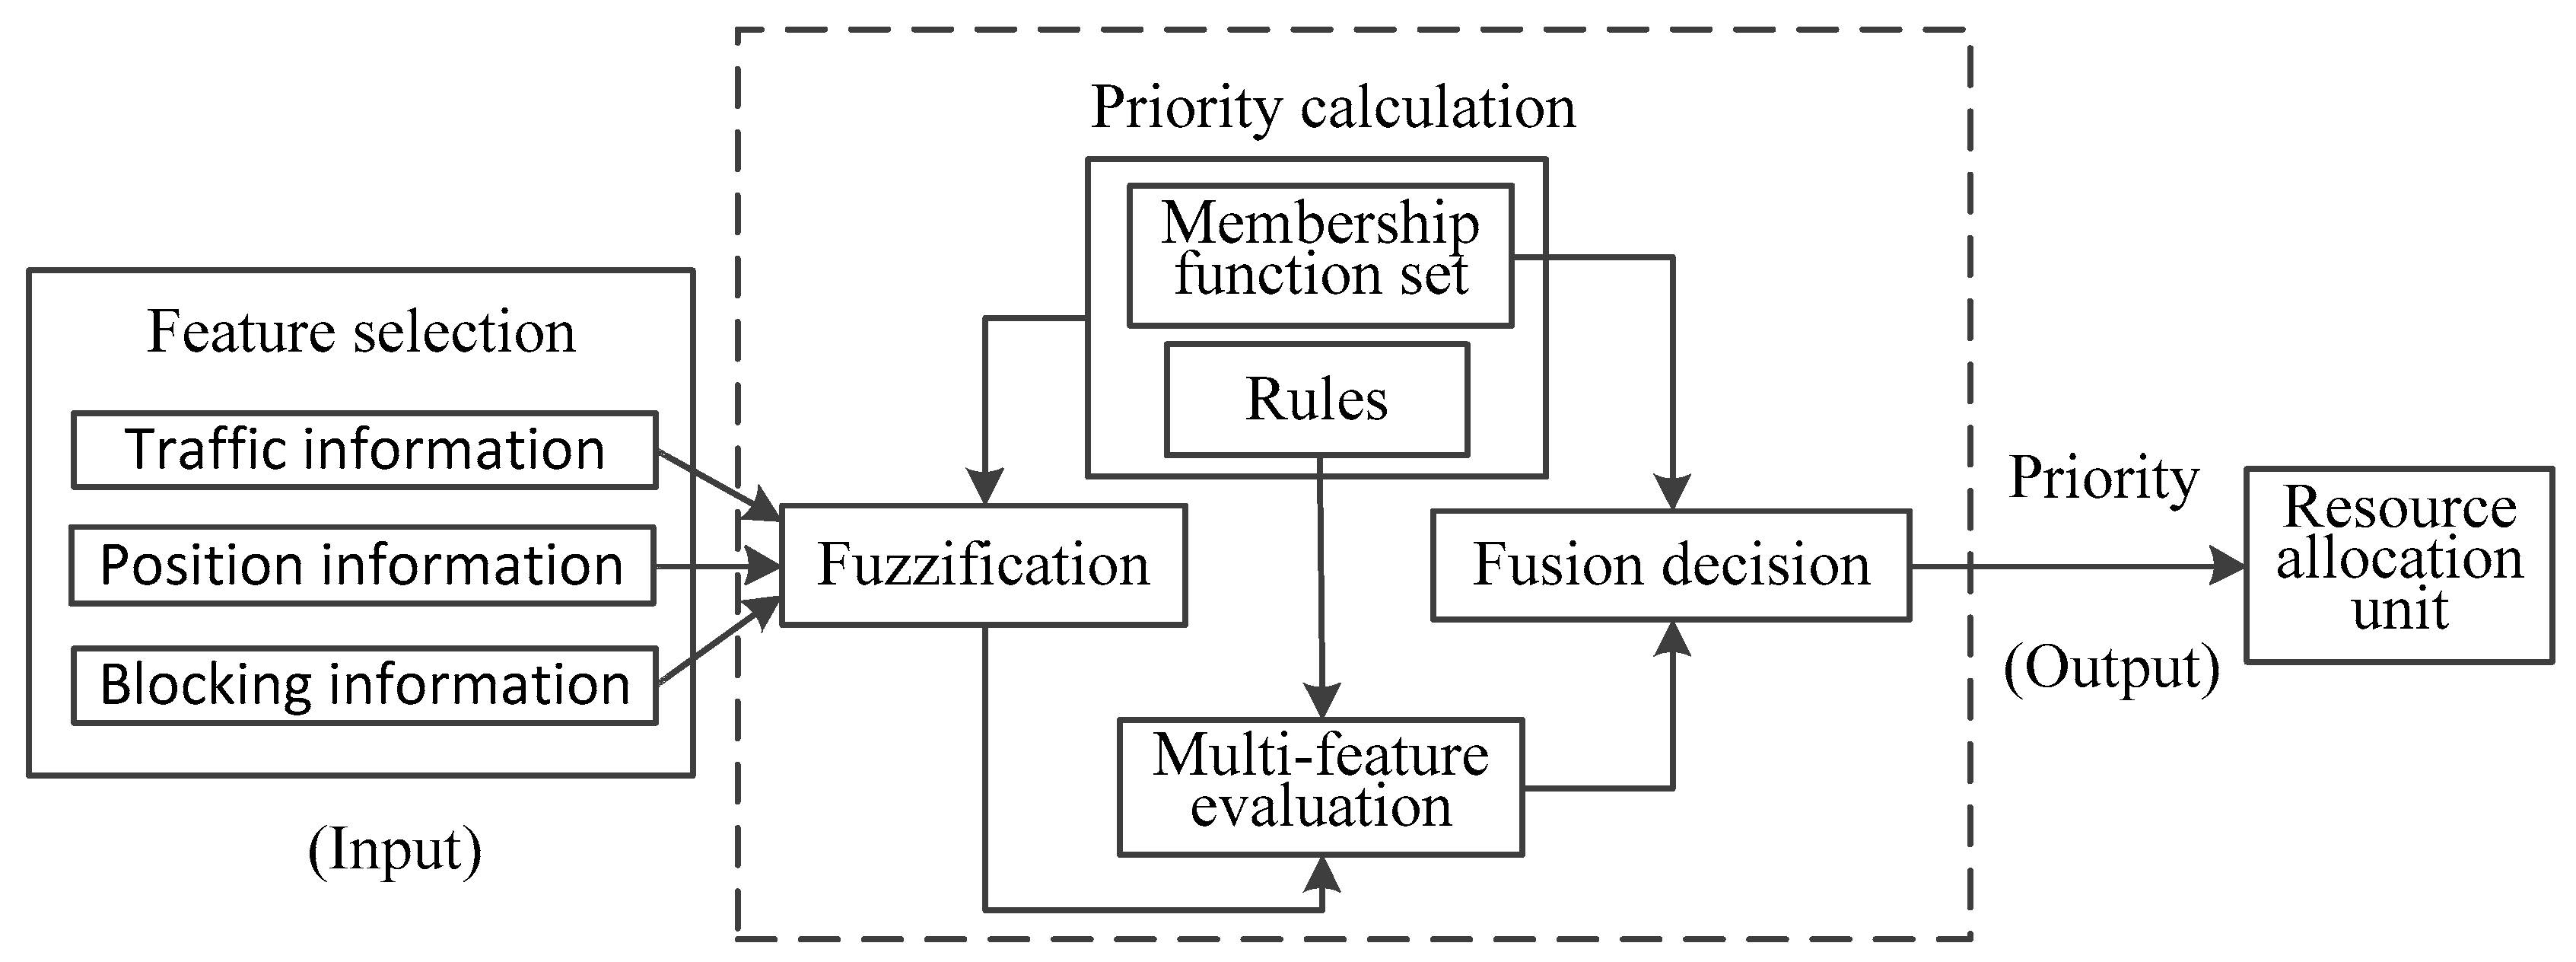
3.1. Outline
3.2. Dynamic User Priority
3.2.1. User Feature Selection
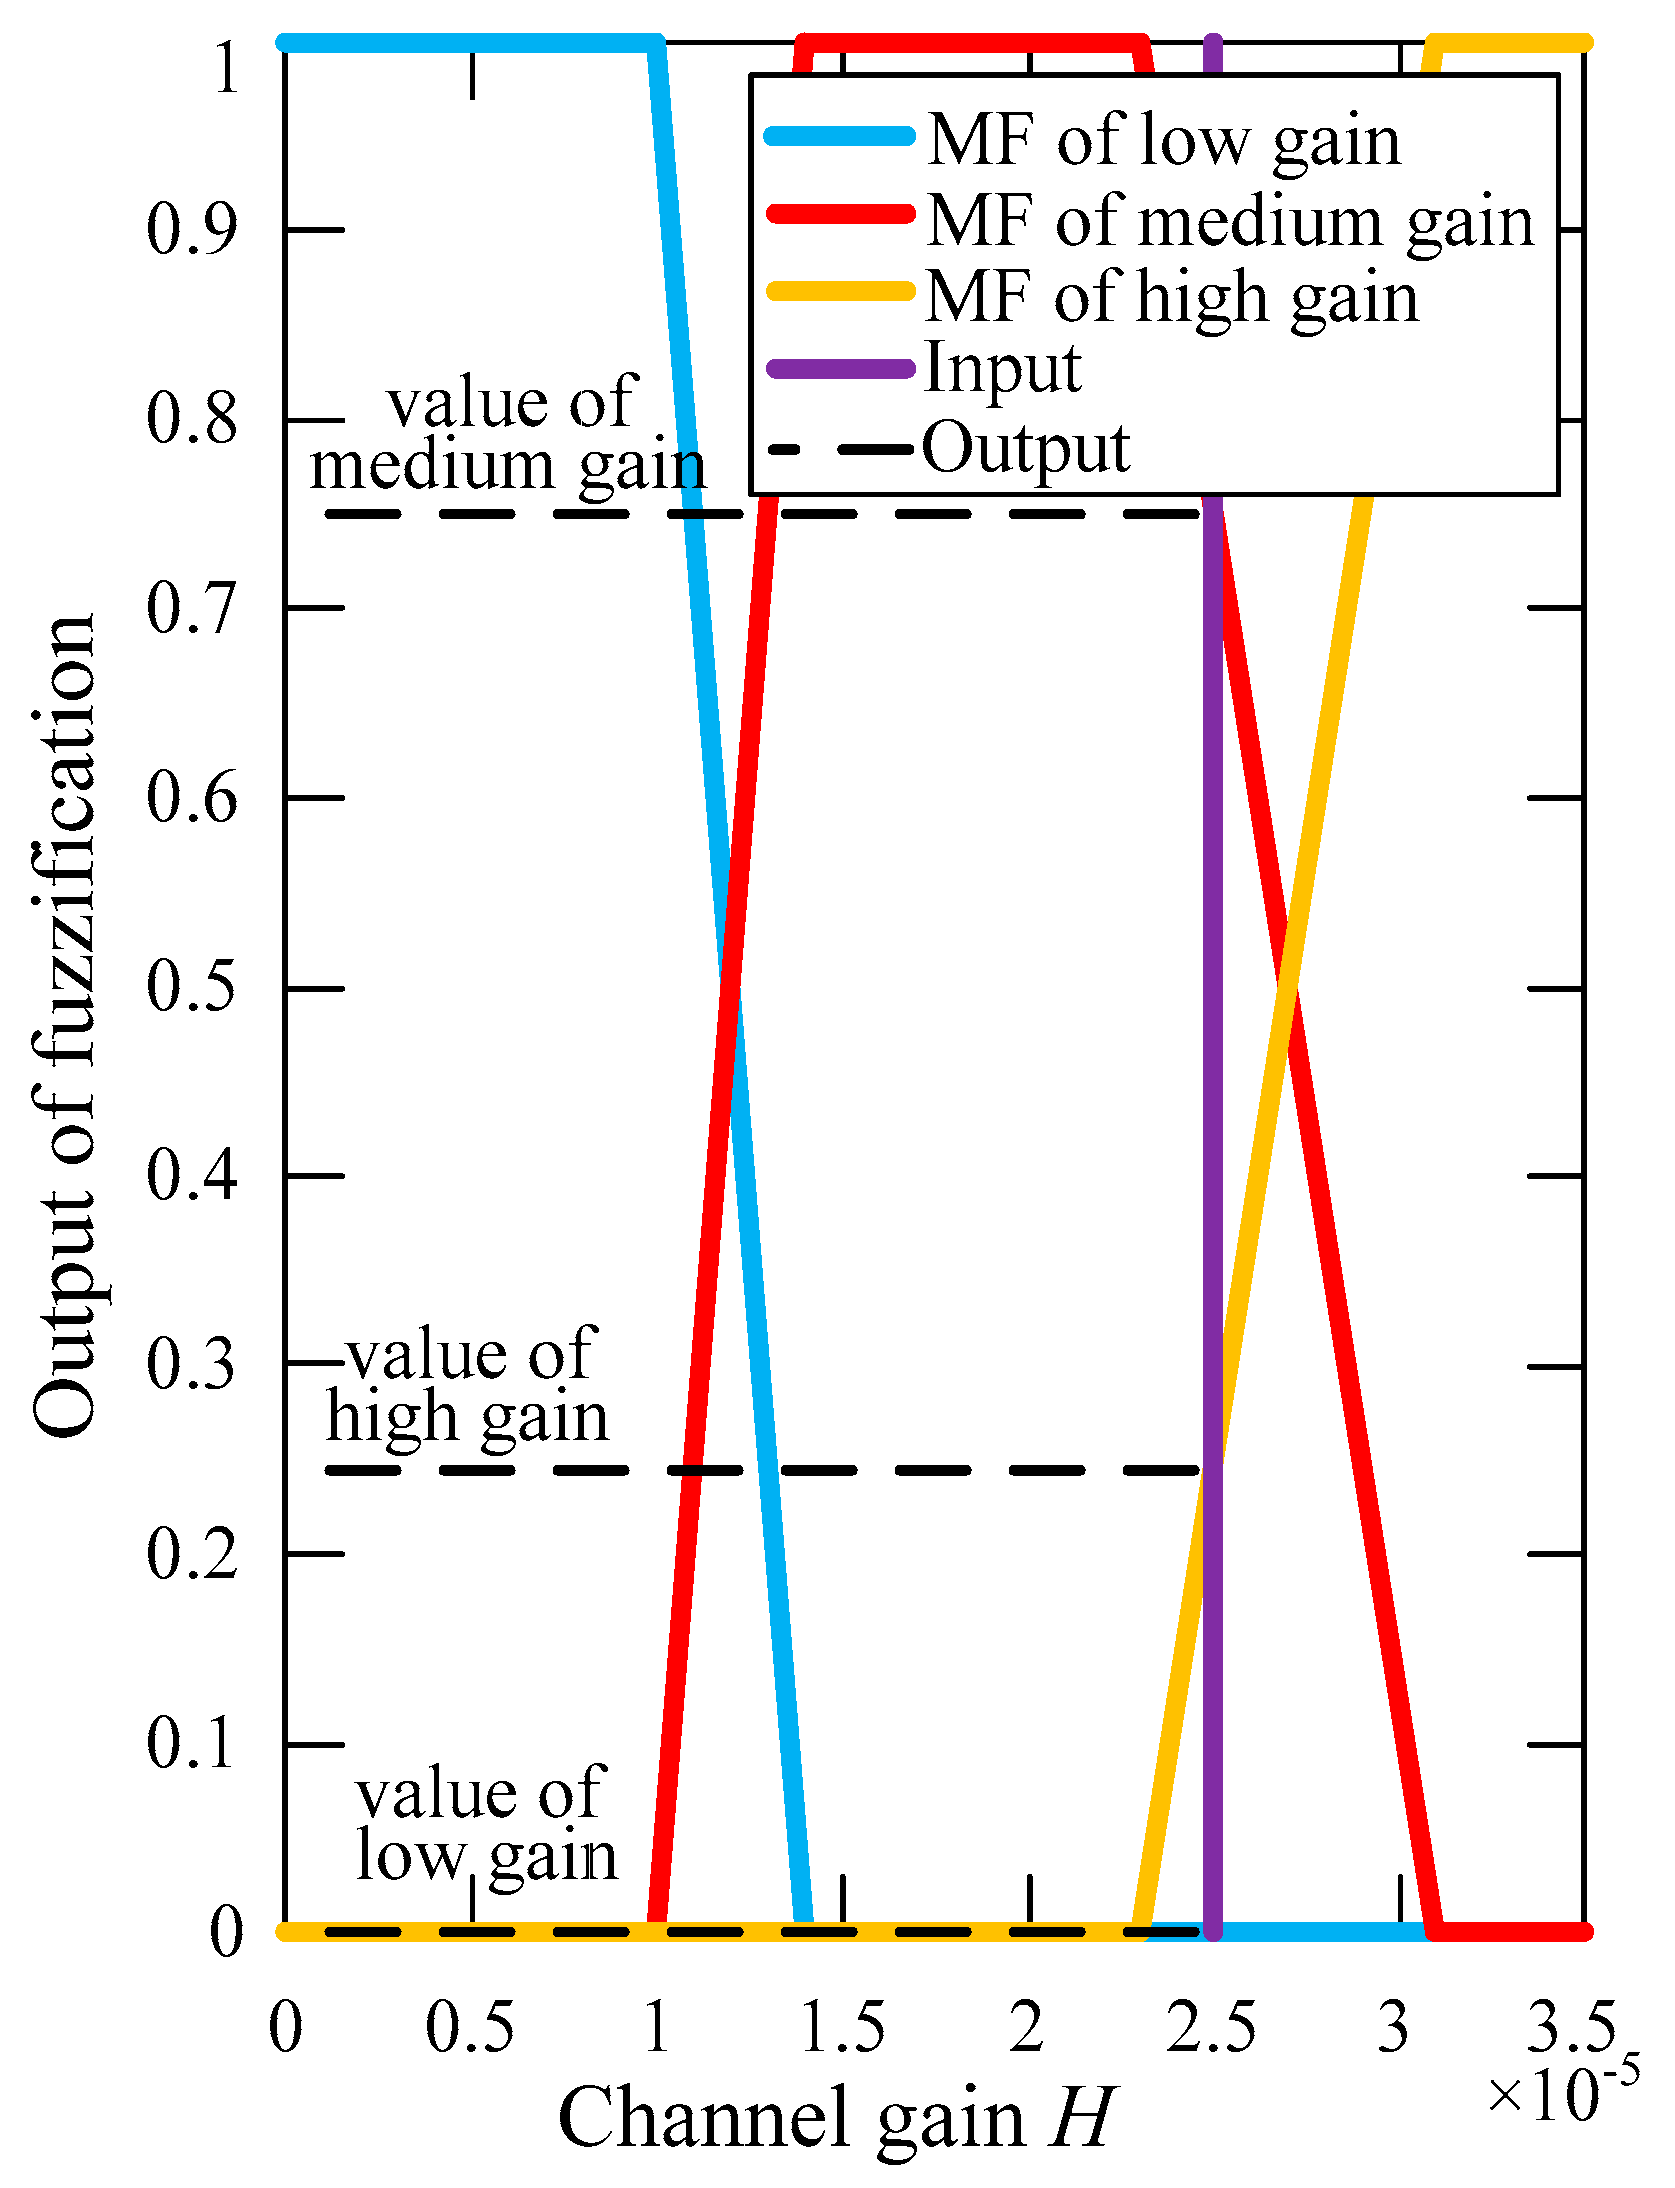
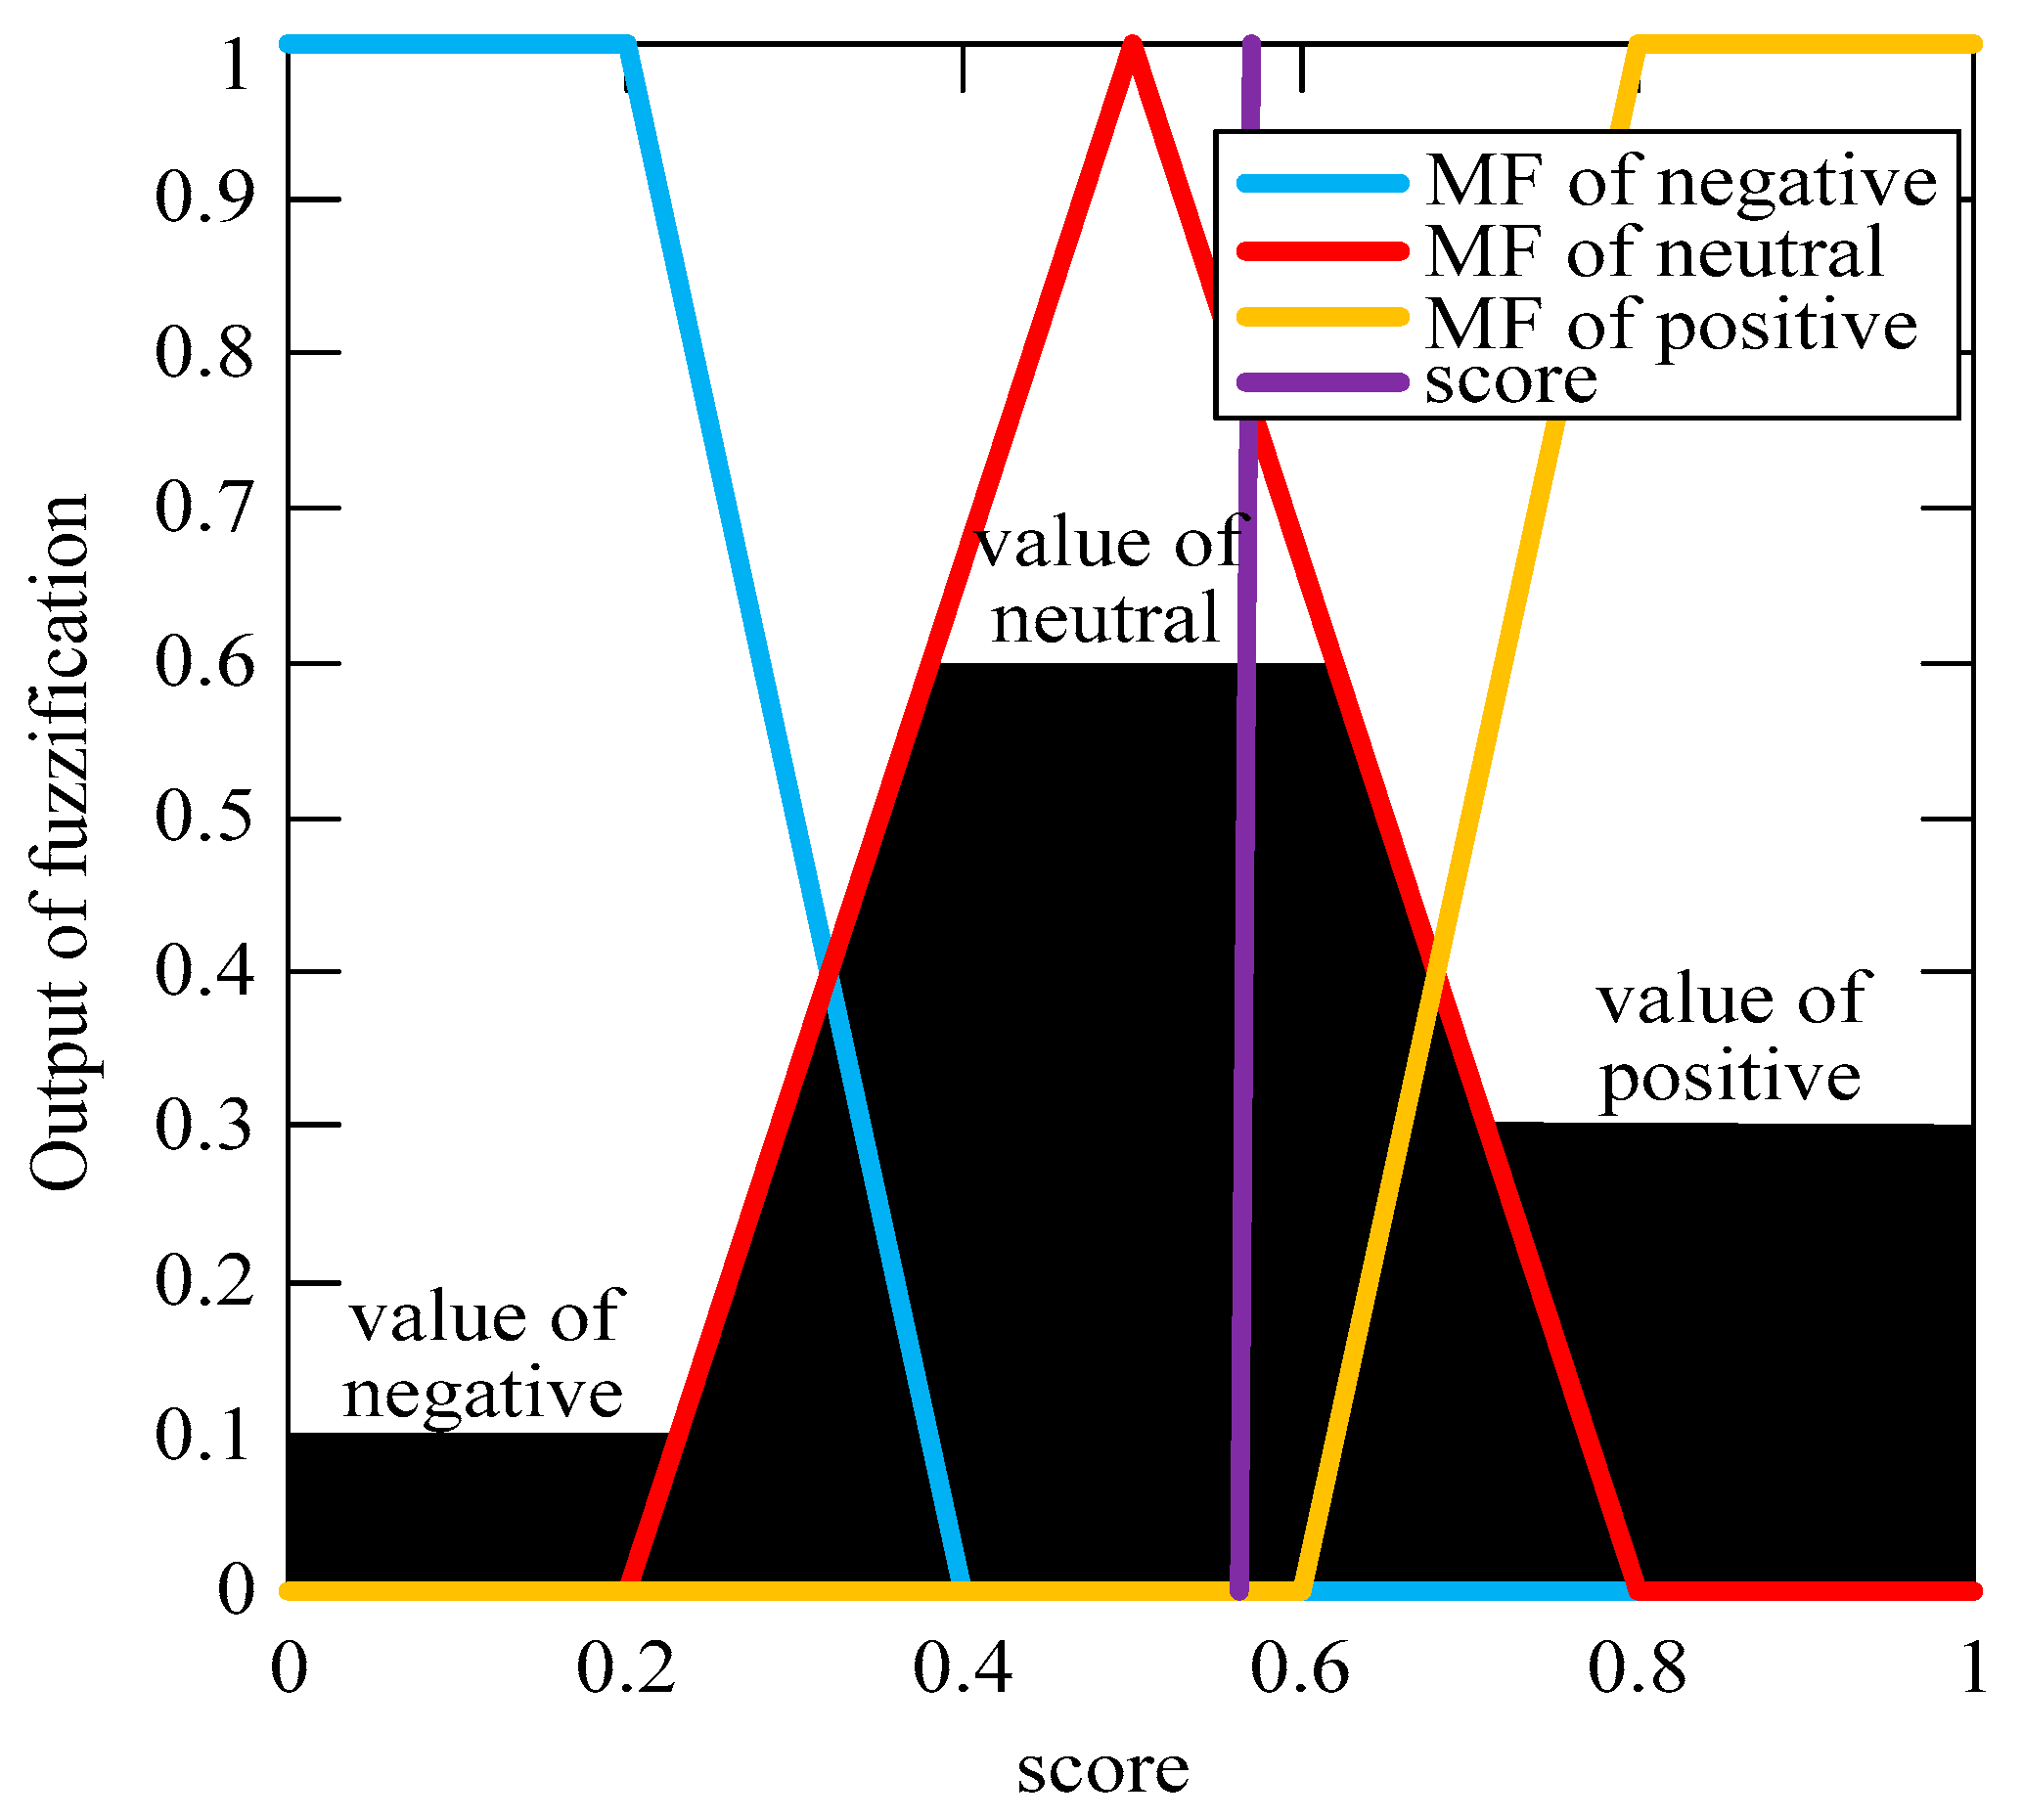
3.2.2. User Priority Calculation
3.3. Bandwidth Allocation
4. Simulation Results
4.1. Condition
4.2. Dynamic User Priority Model Analysis
4.2.1. Analysis on Feature Dimension
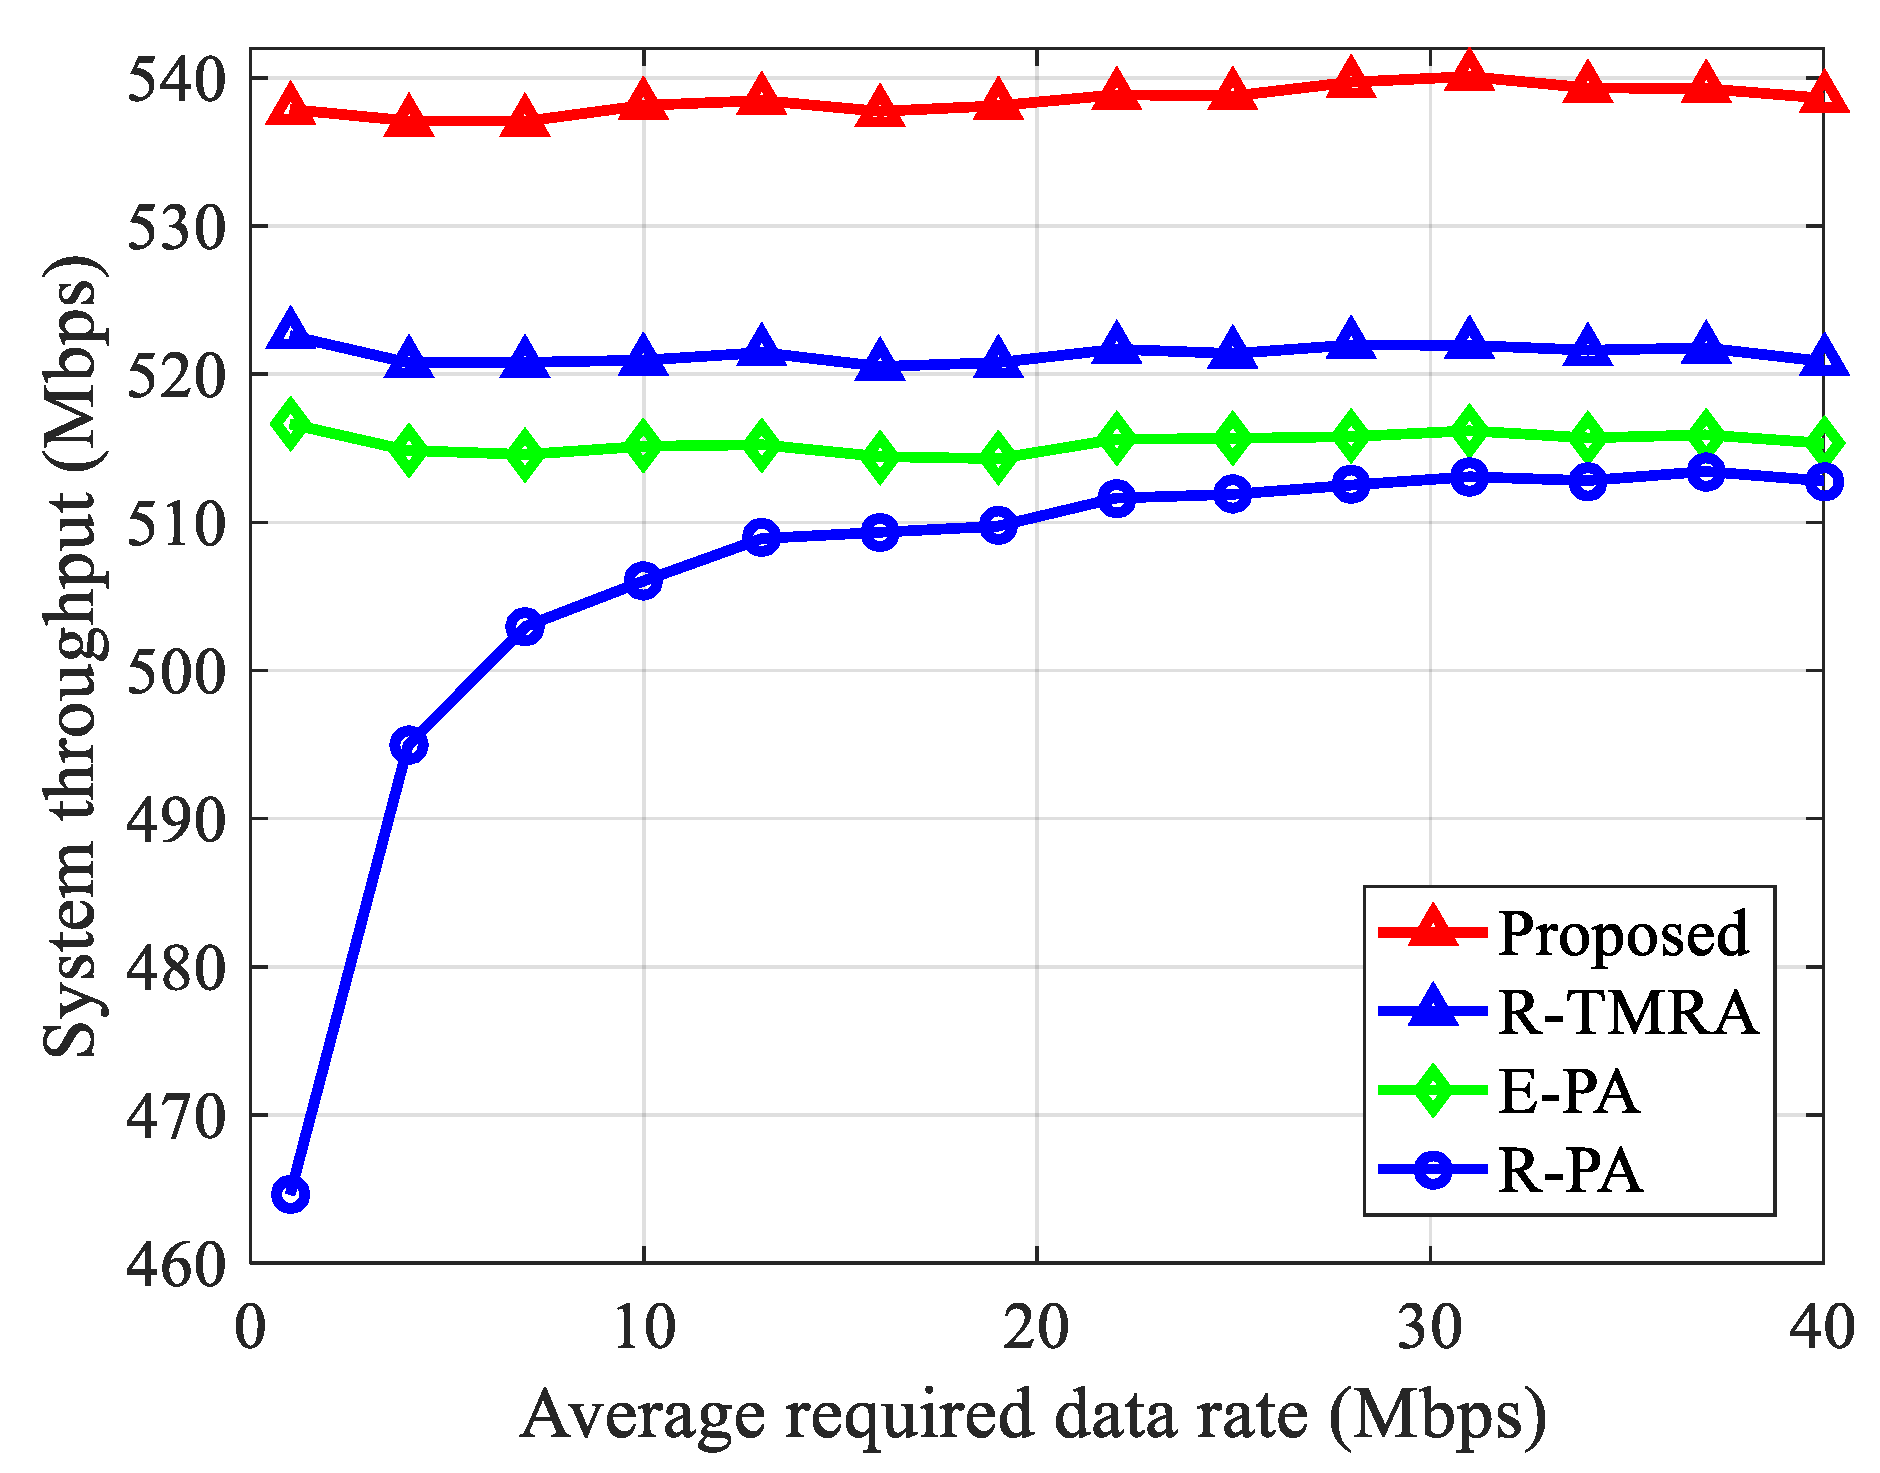
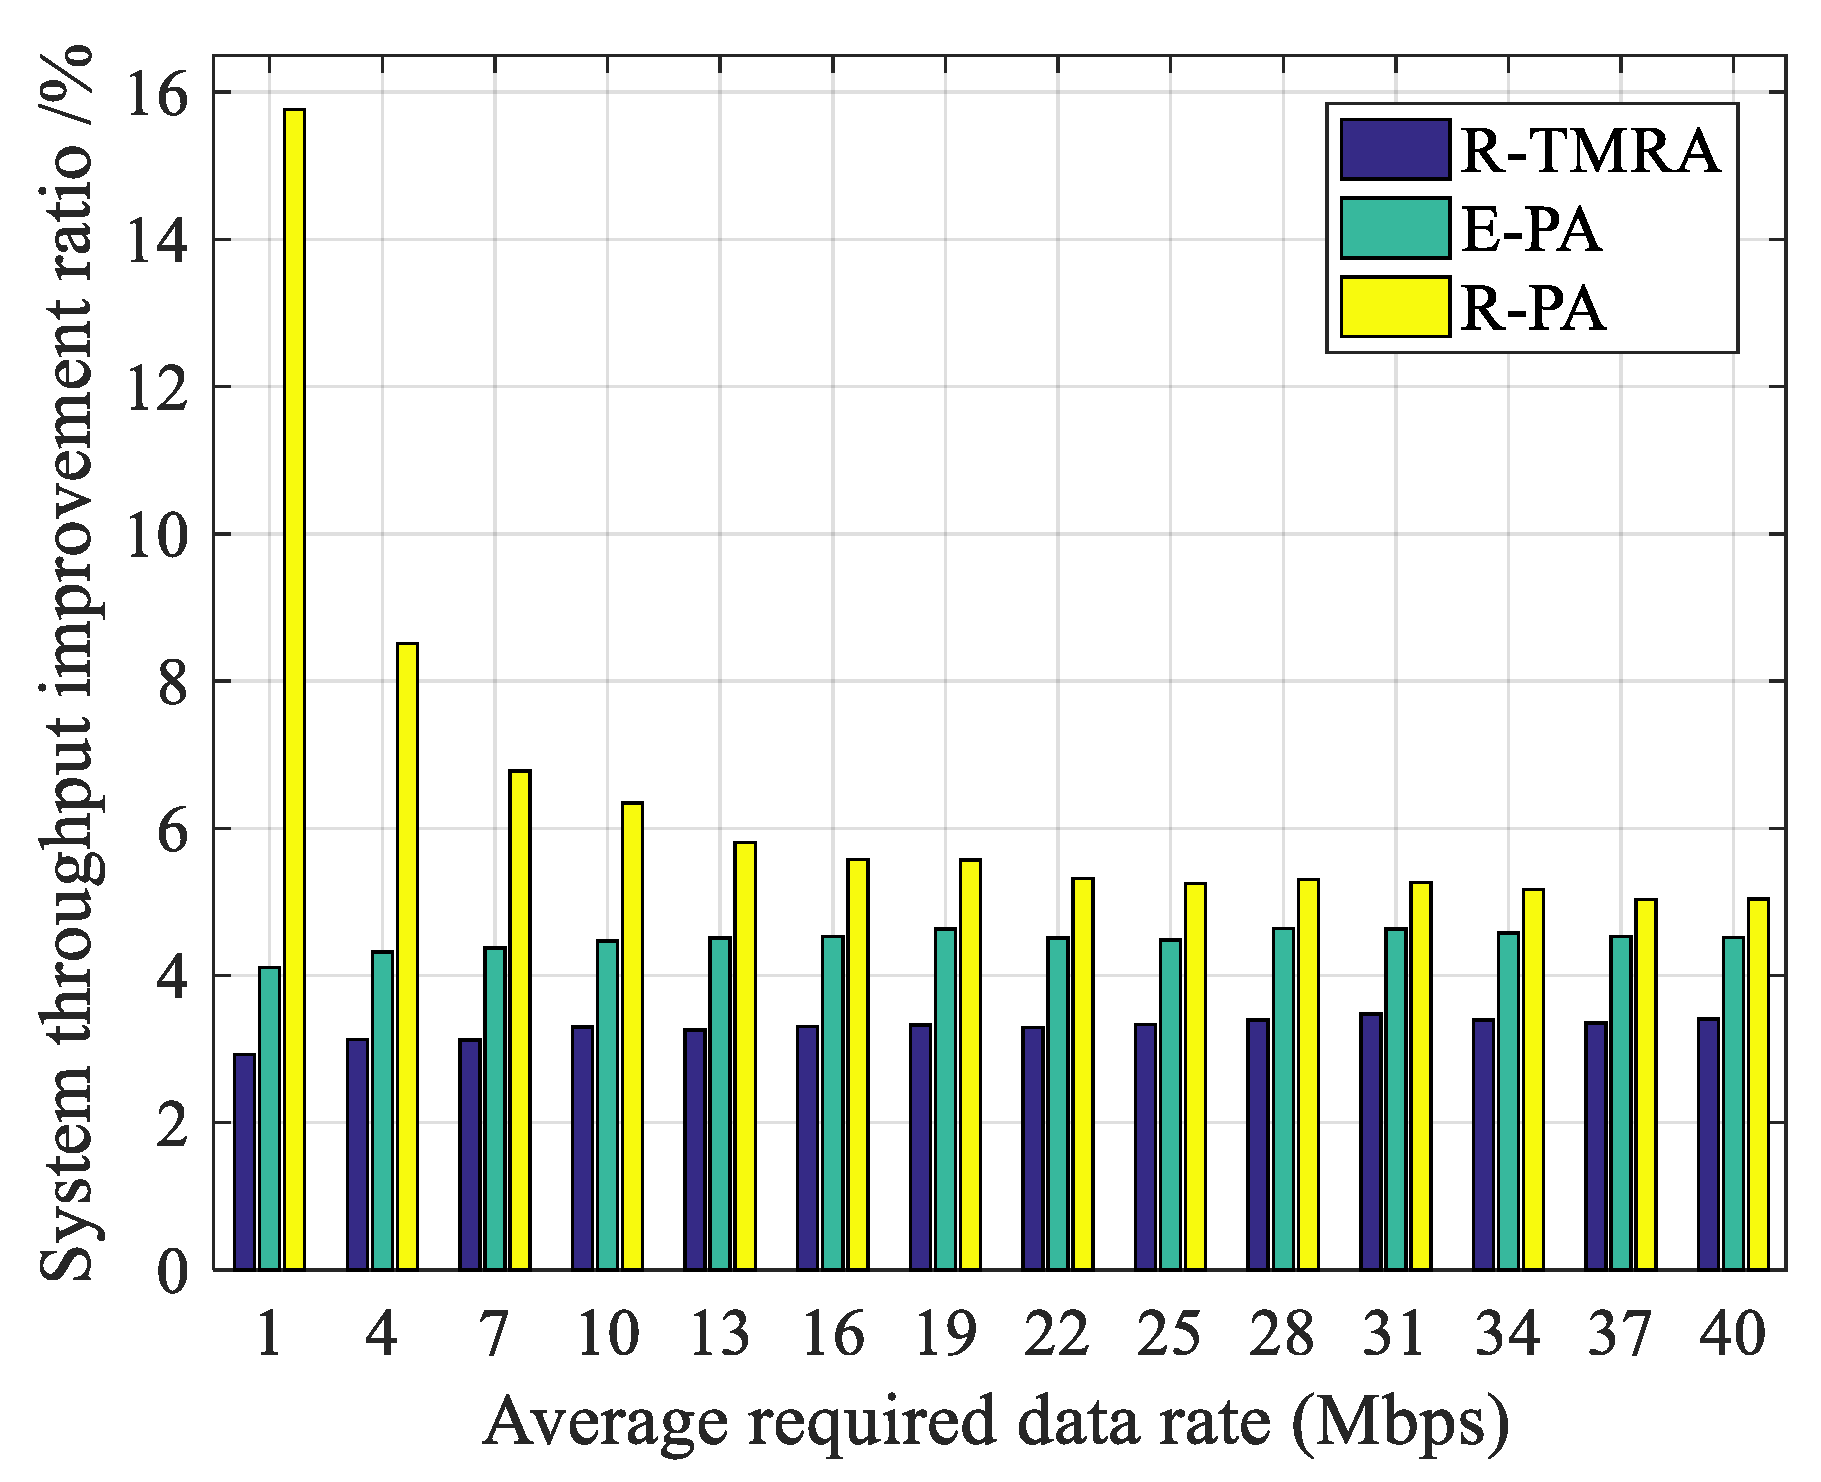
4.2.2. Analysis on Average Required Data Rate
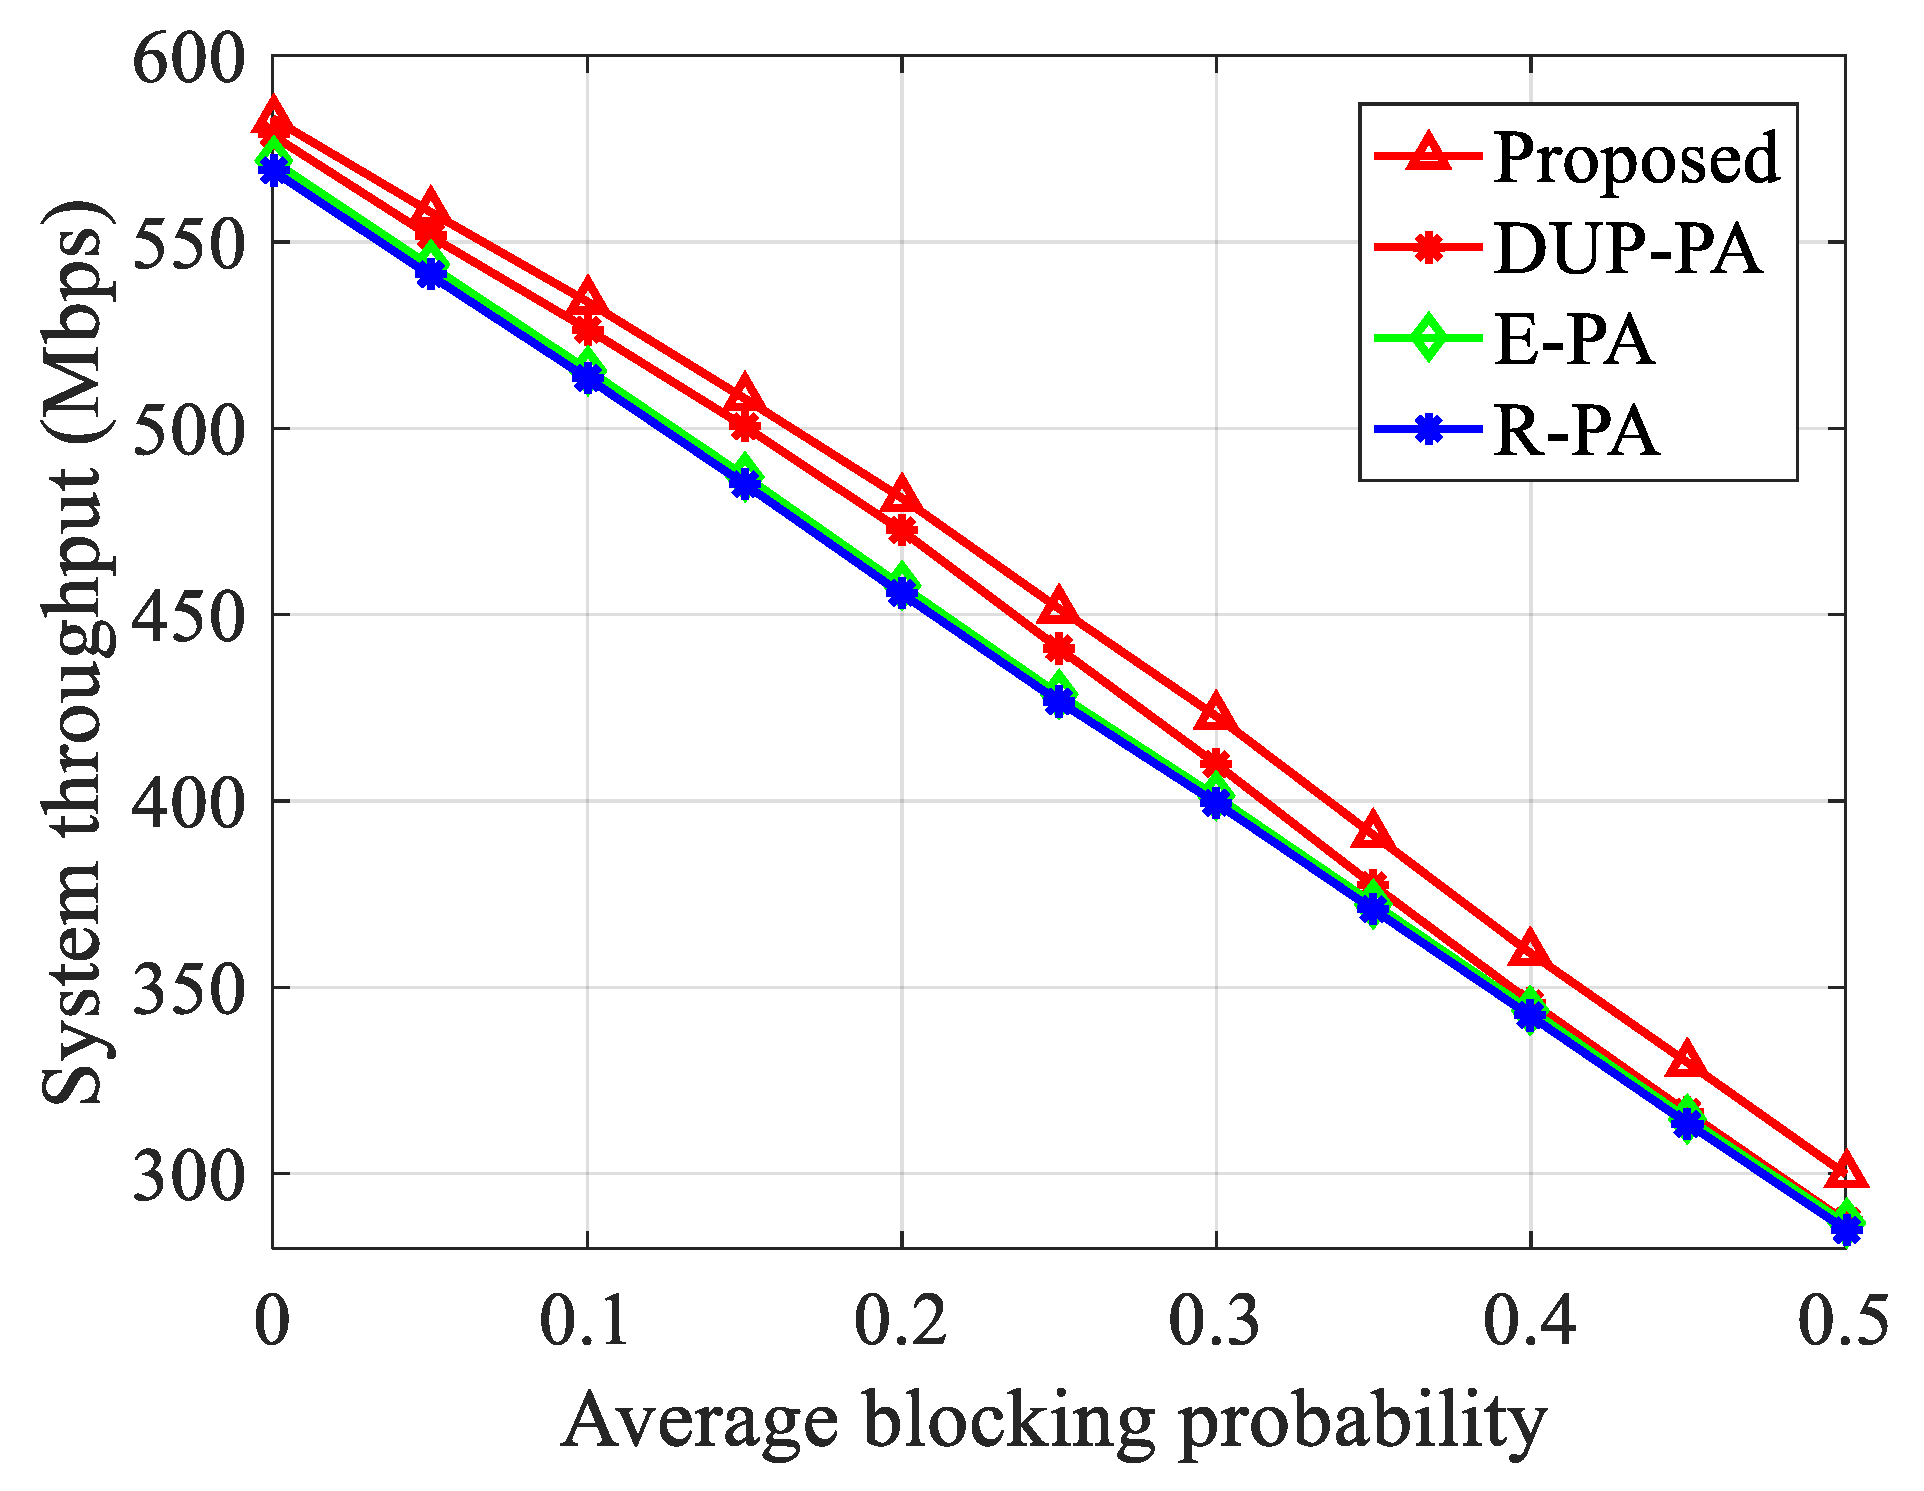
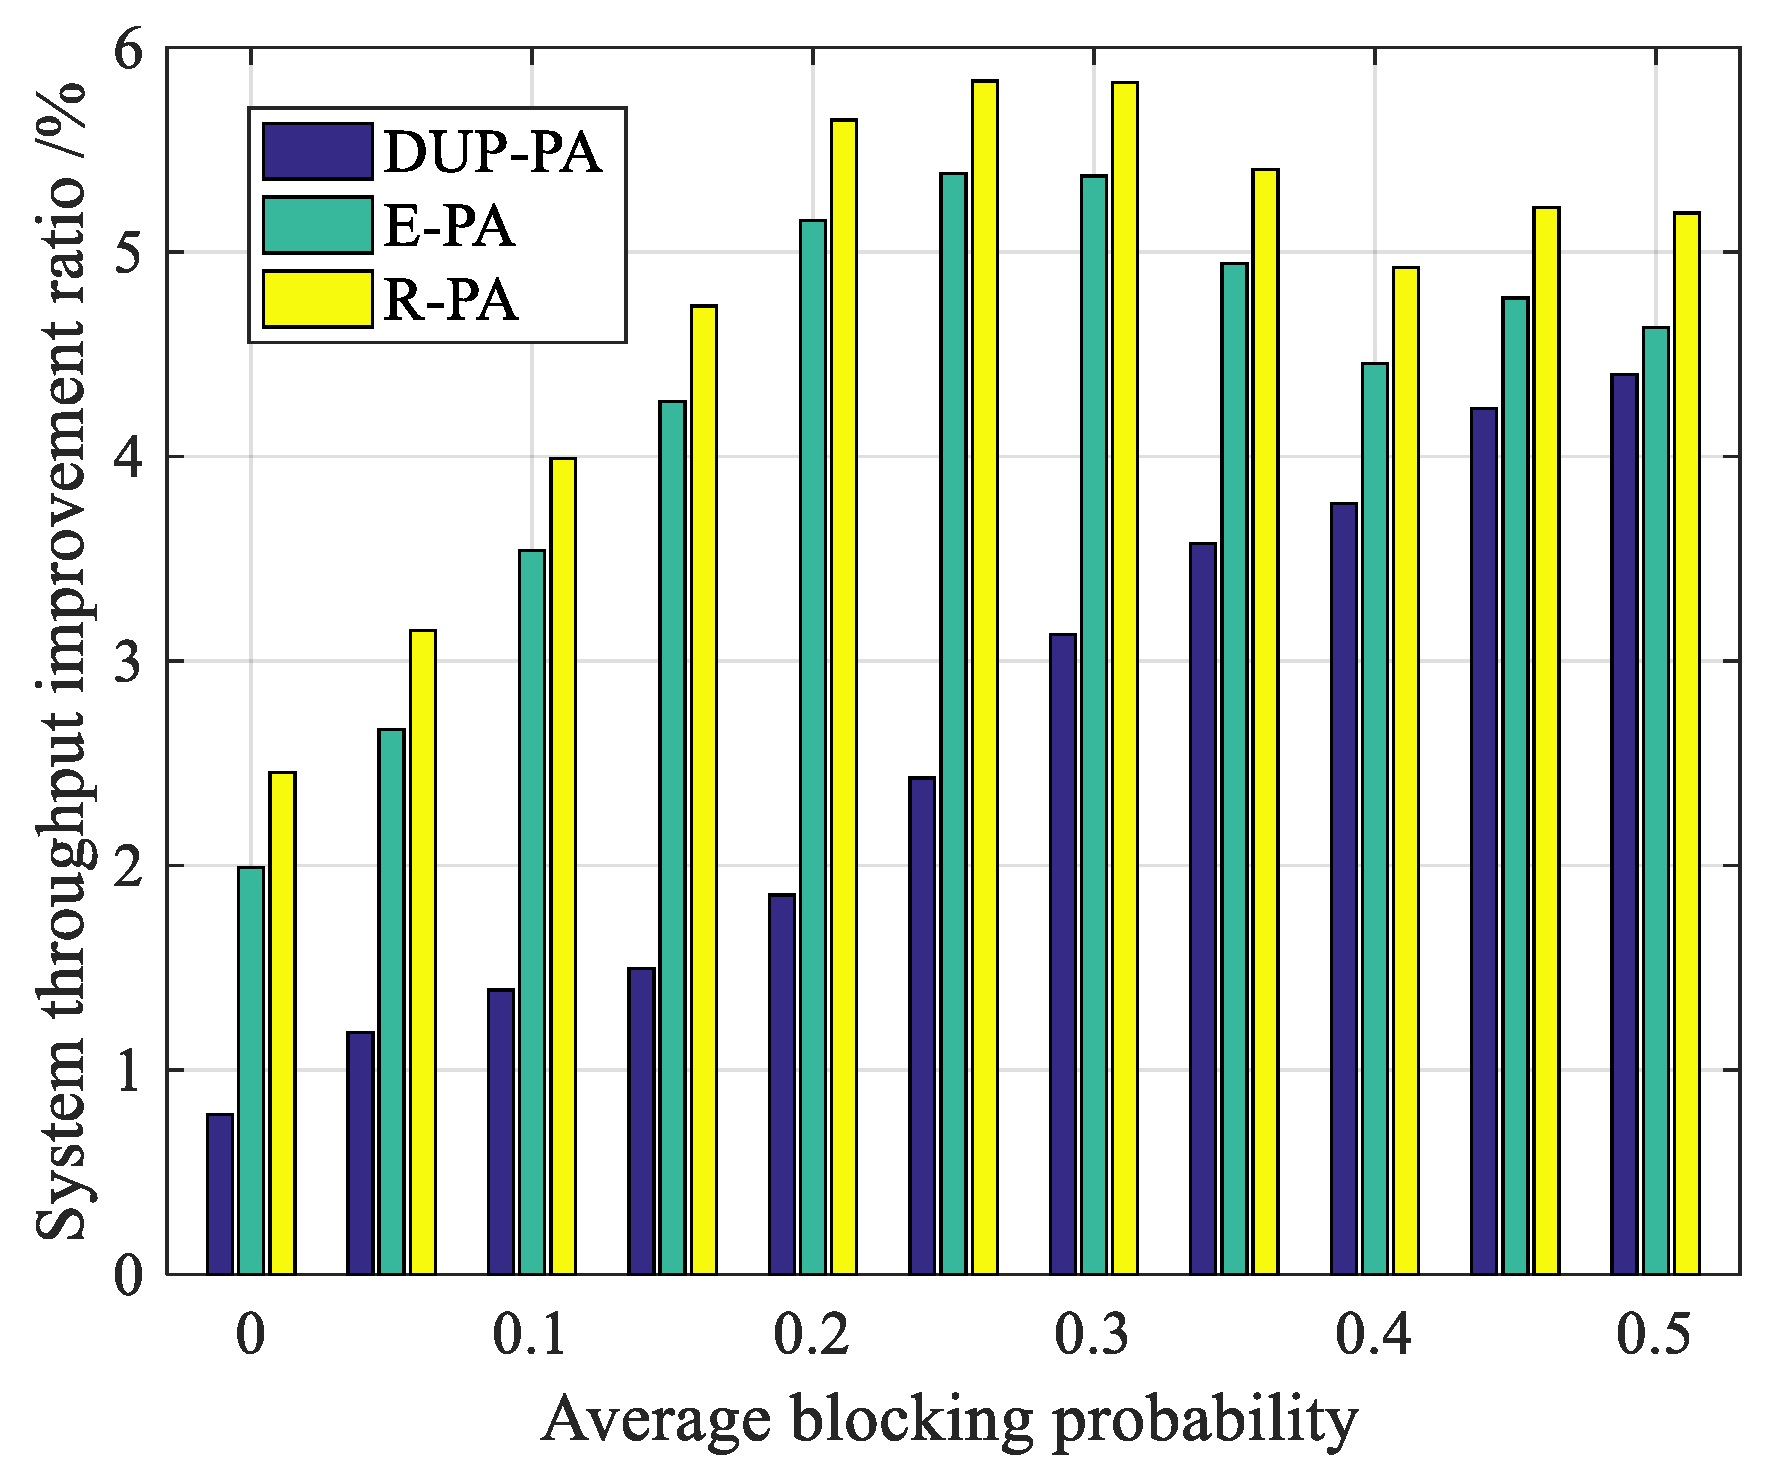
4.2.3. Analysis on Average Blocking Probability
4.2.4. Analysis on Channel Gain
4.3. Performance Analysis for the Proposed DUP-TMRA Method
4.3.1. Comparisons in Allocation Schemes
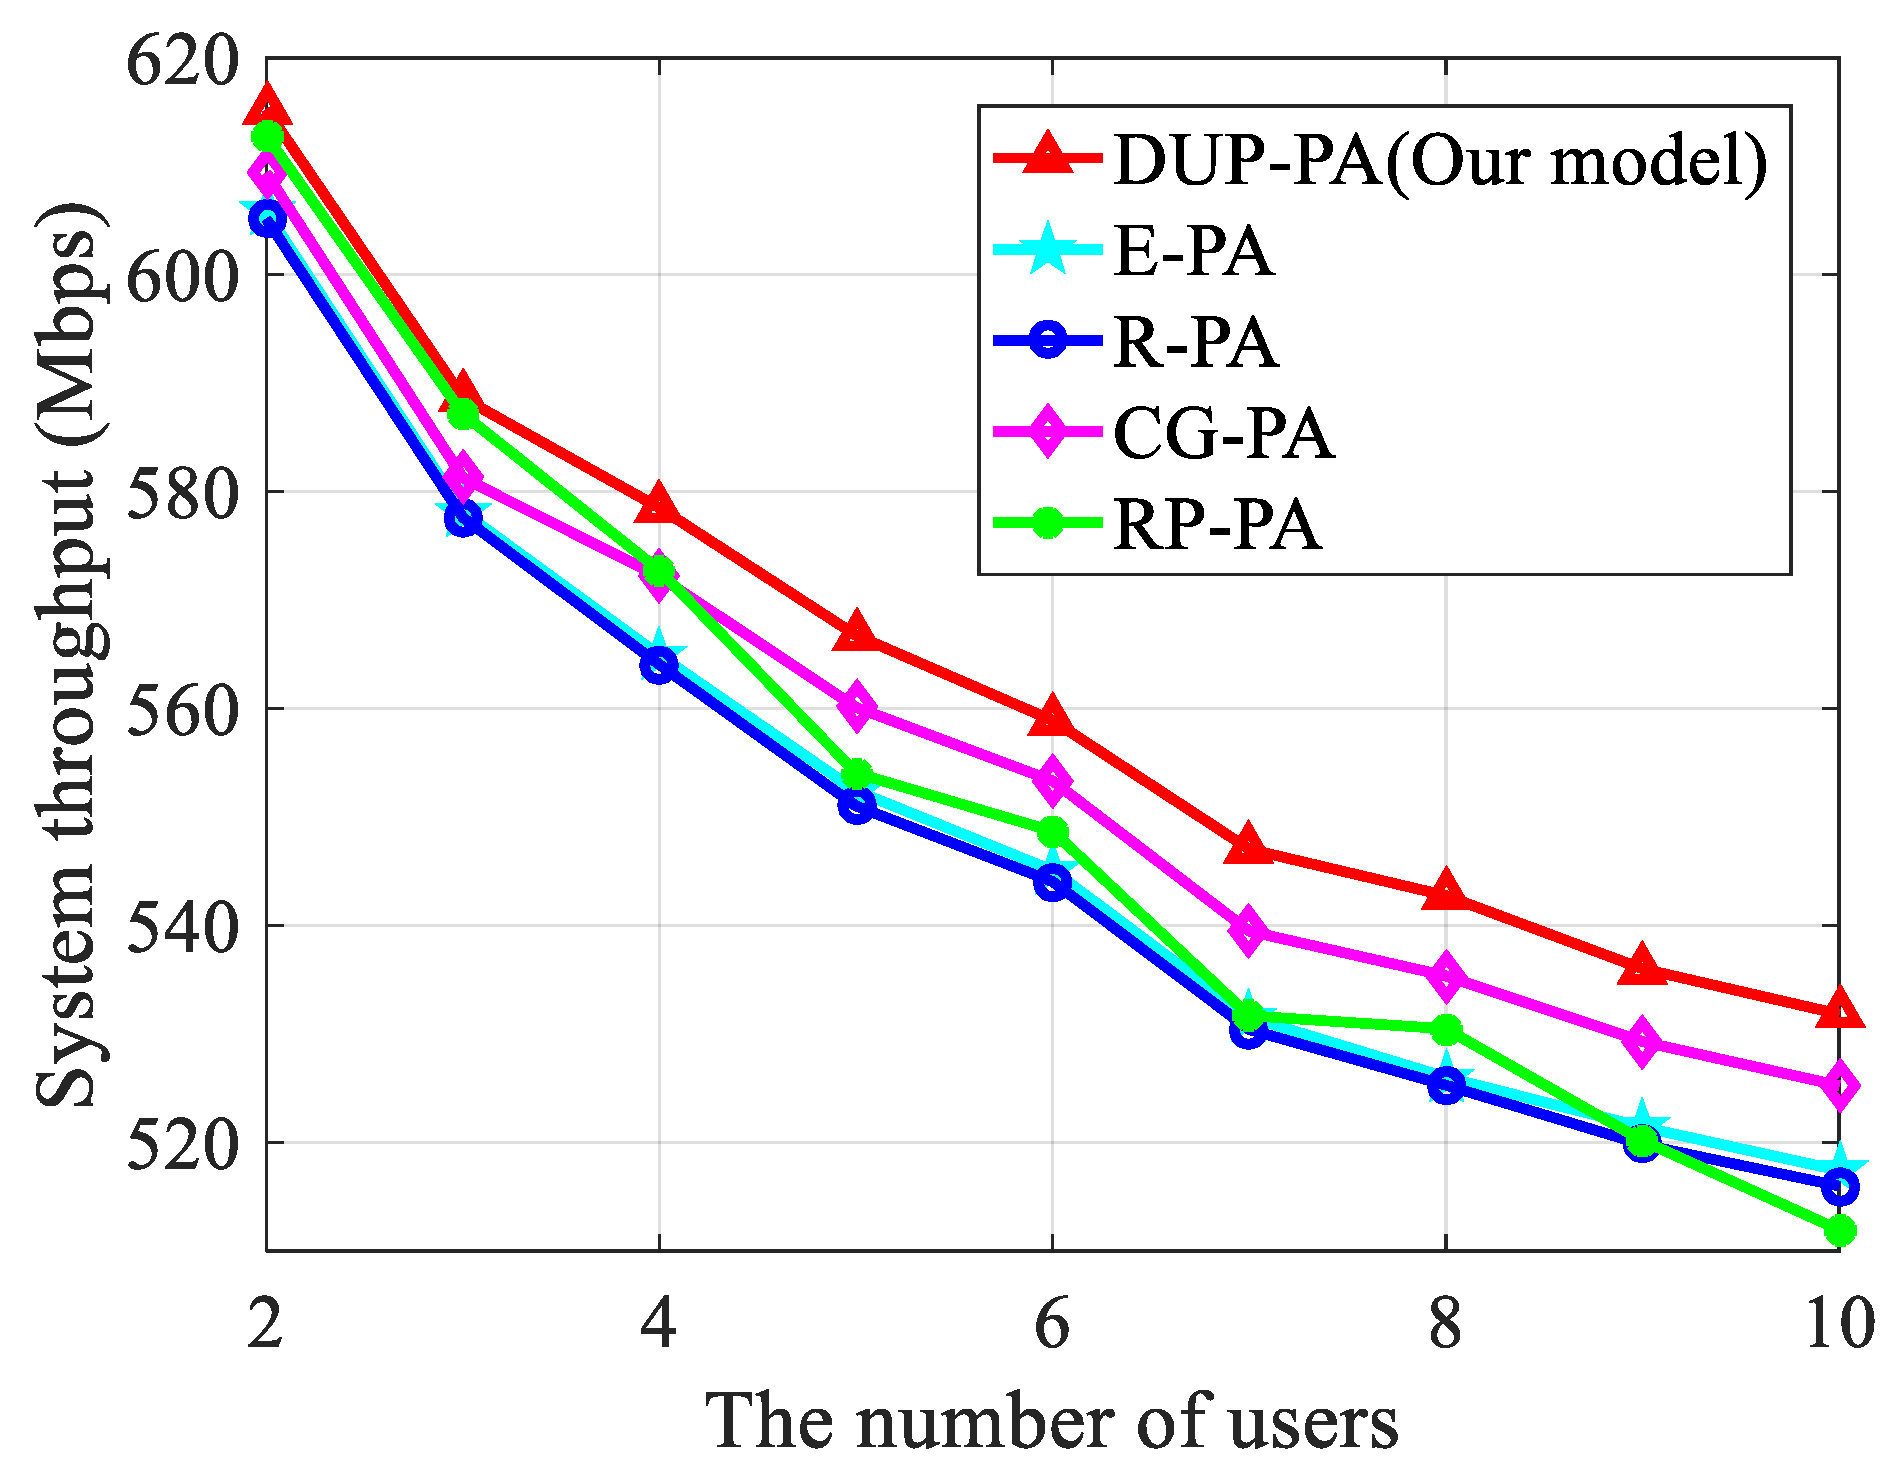
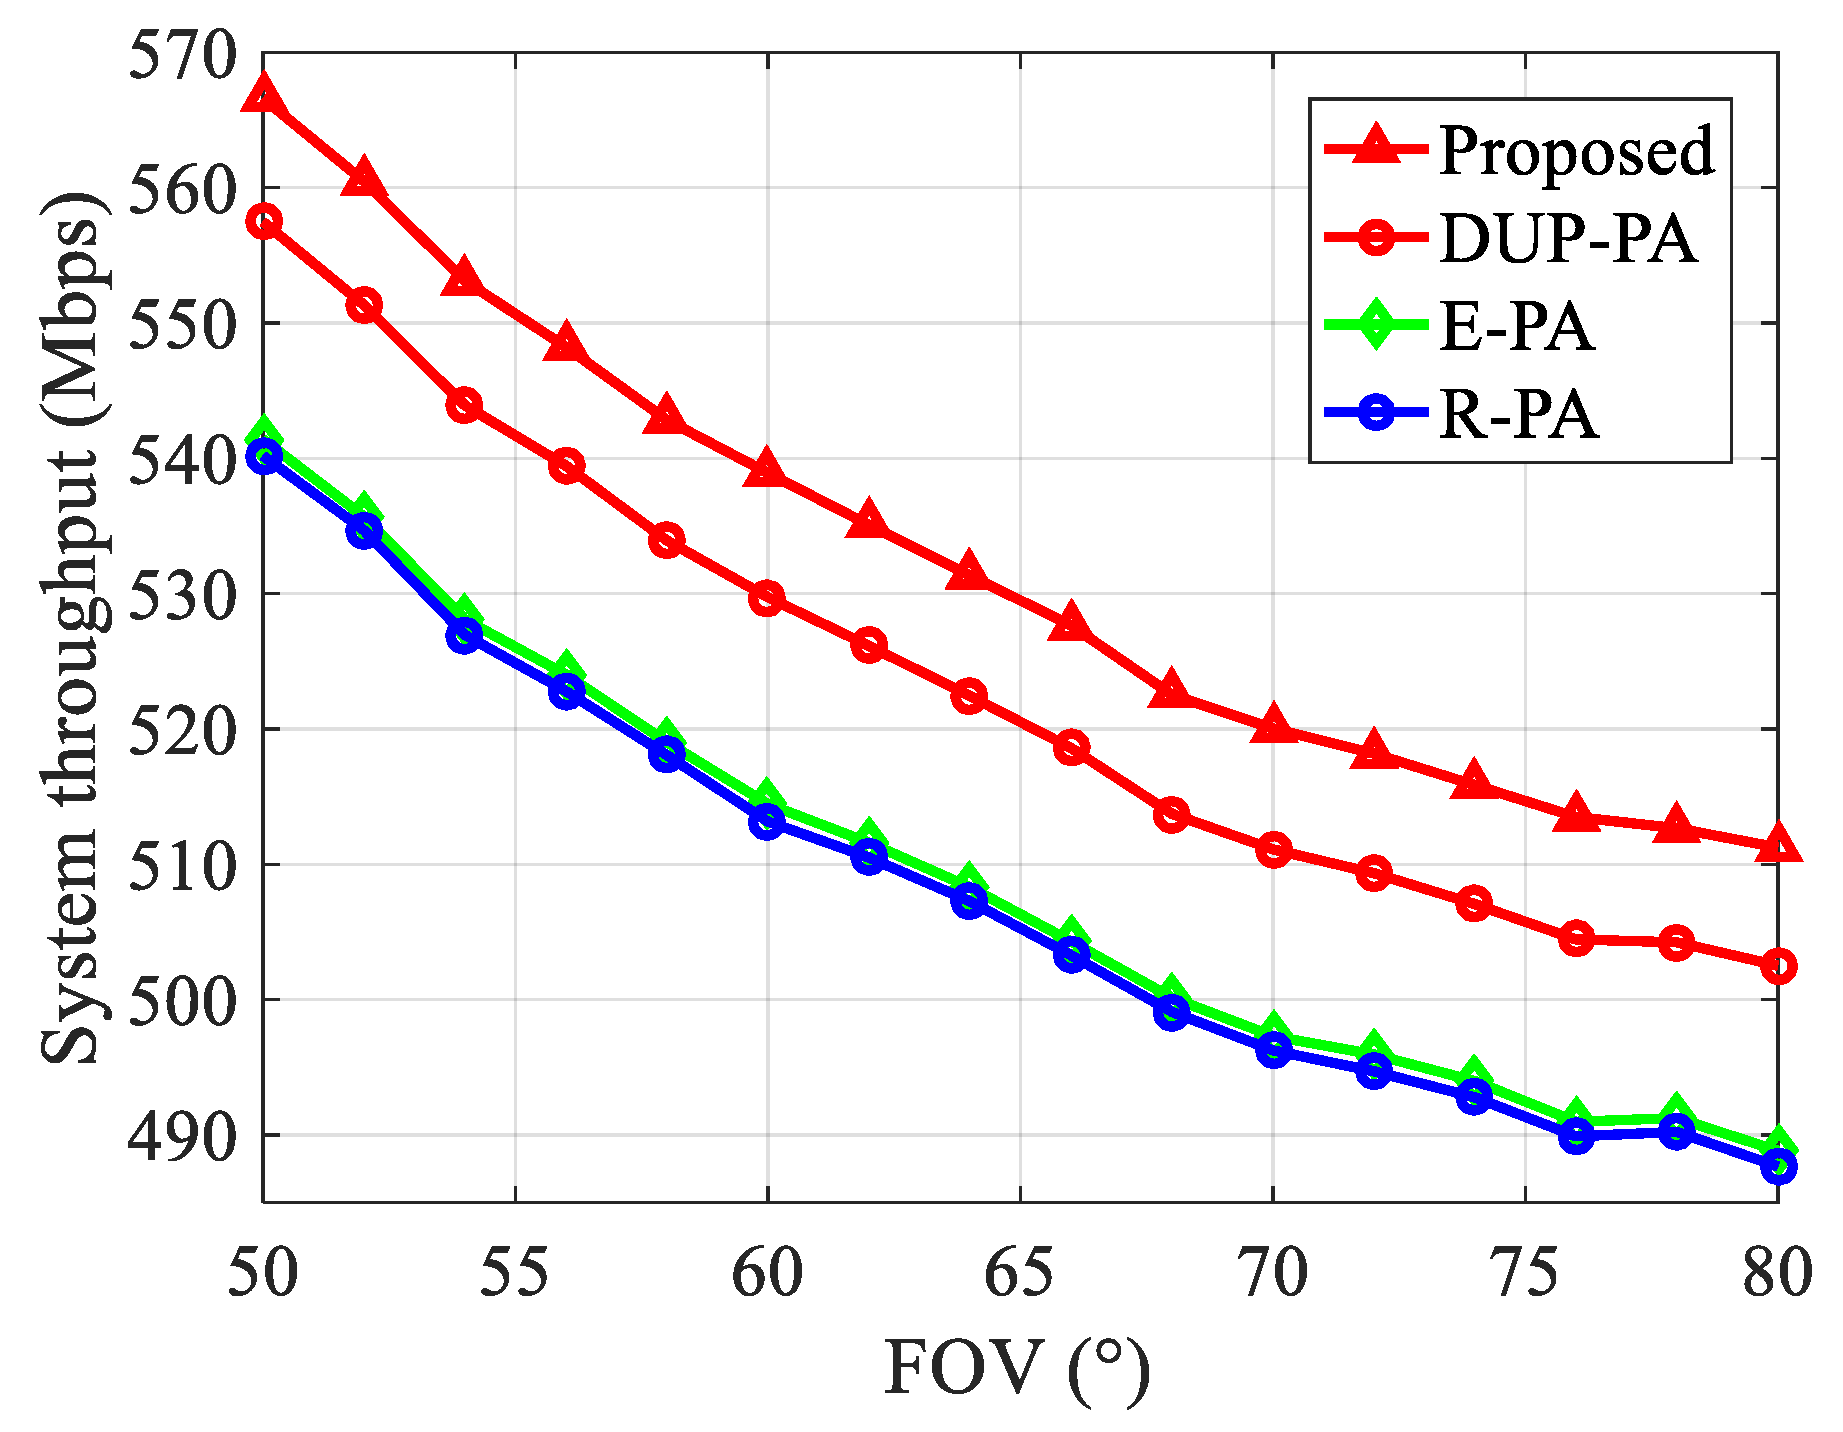
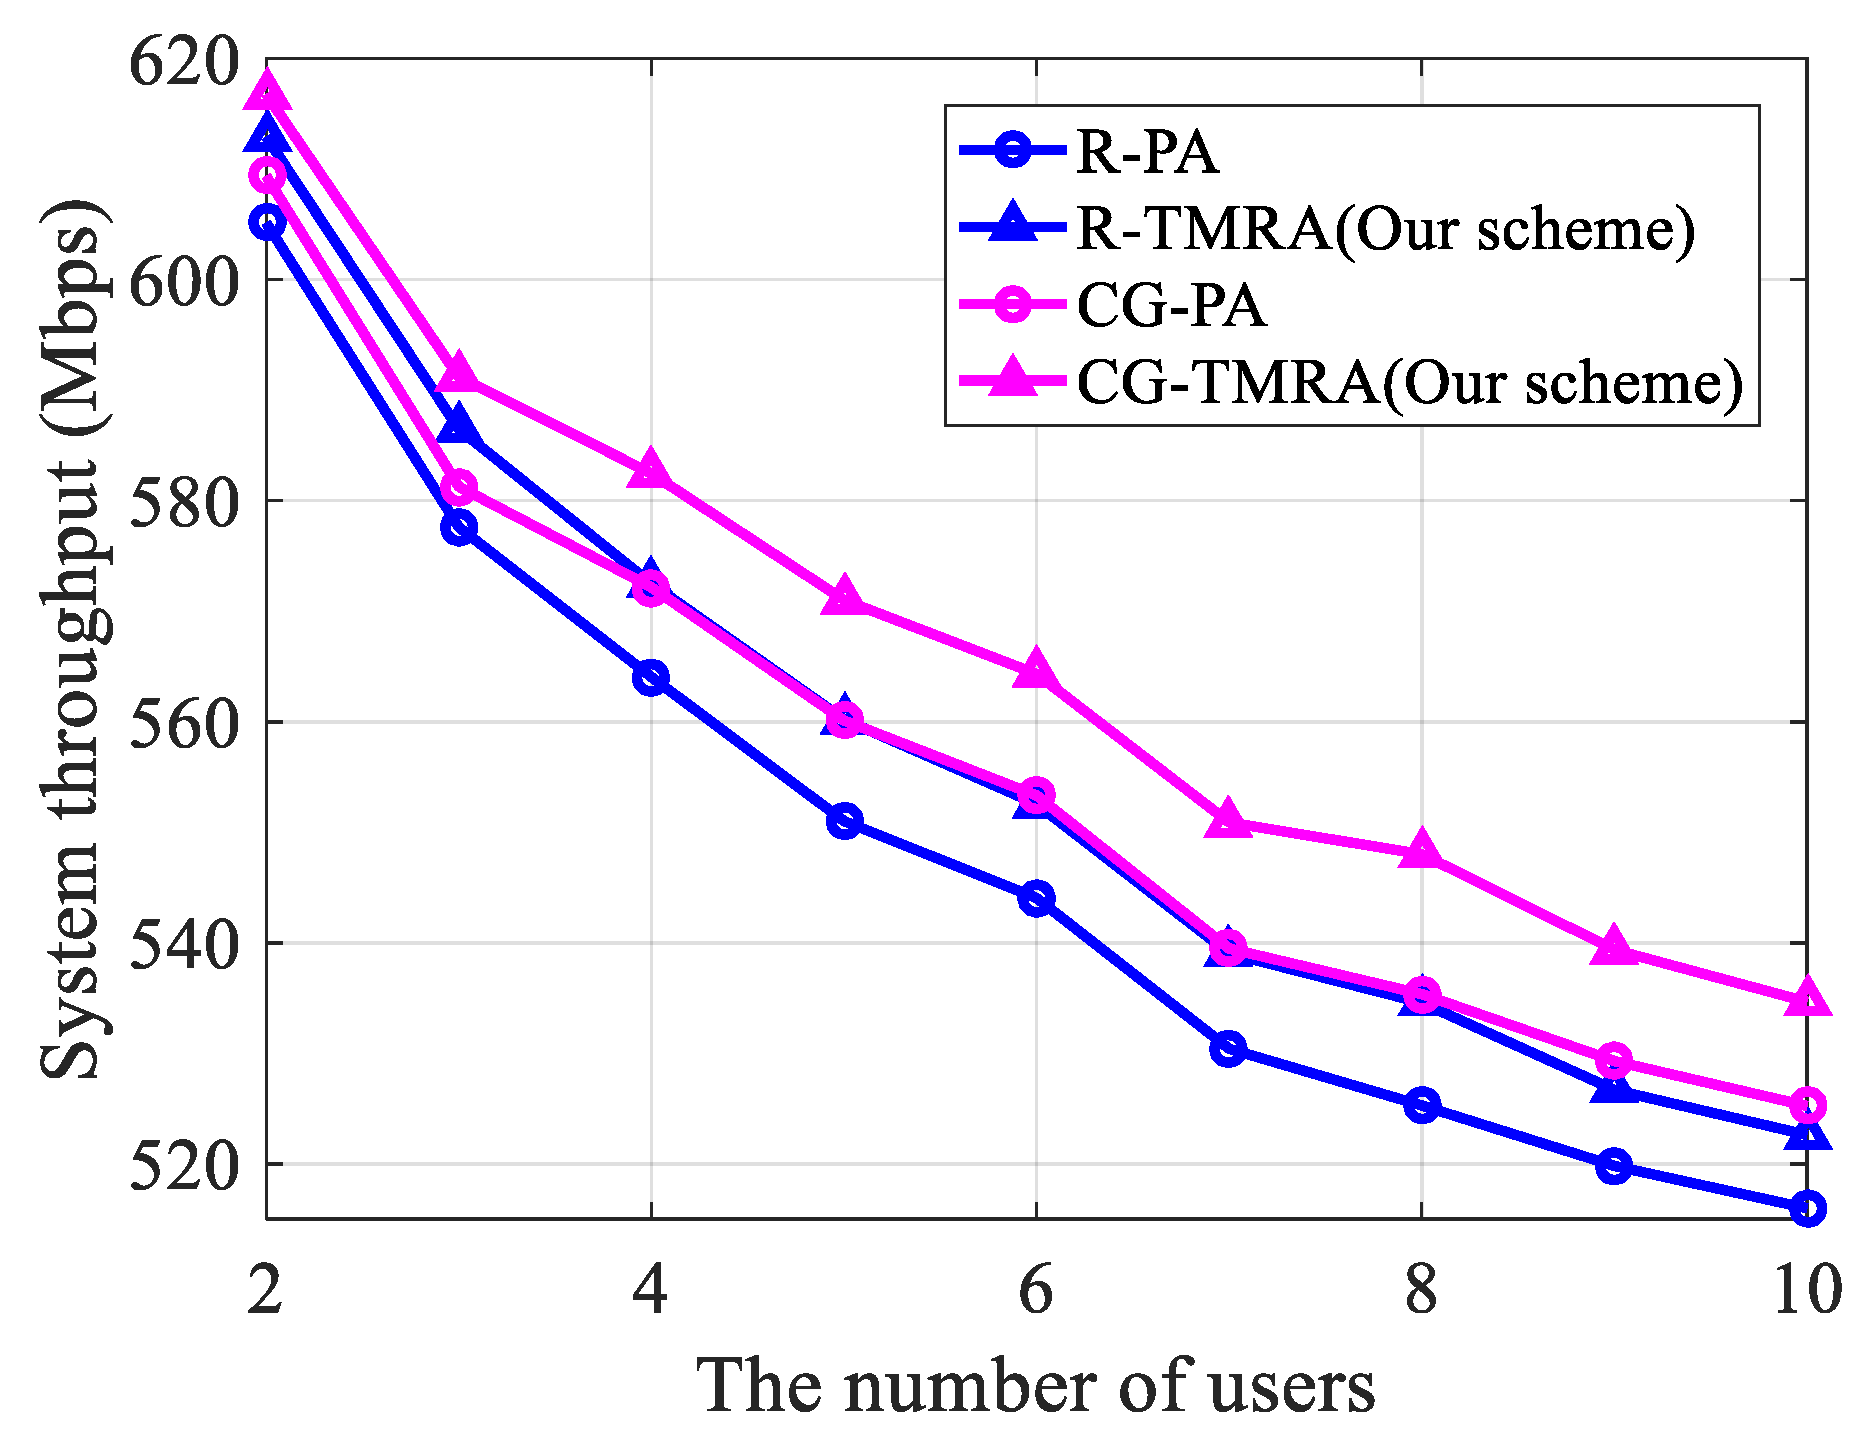
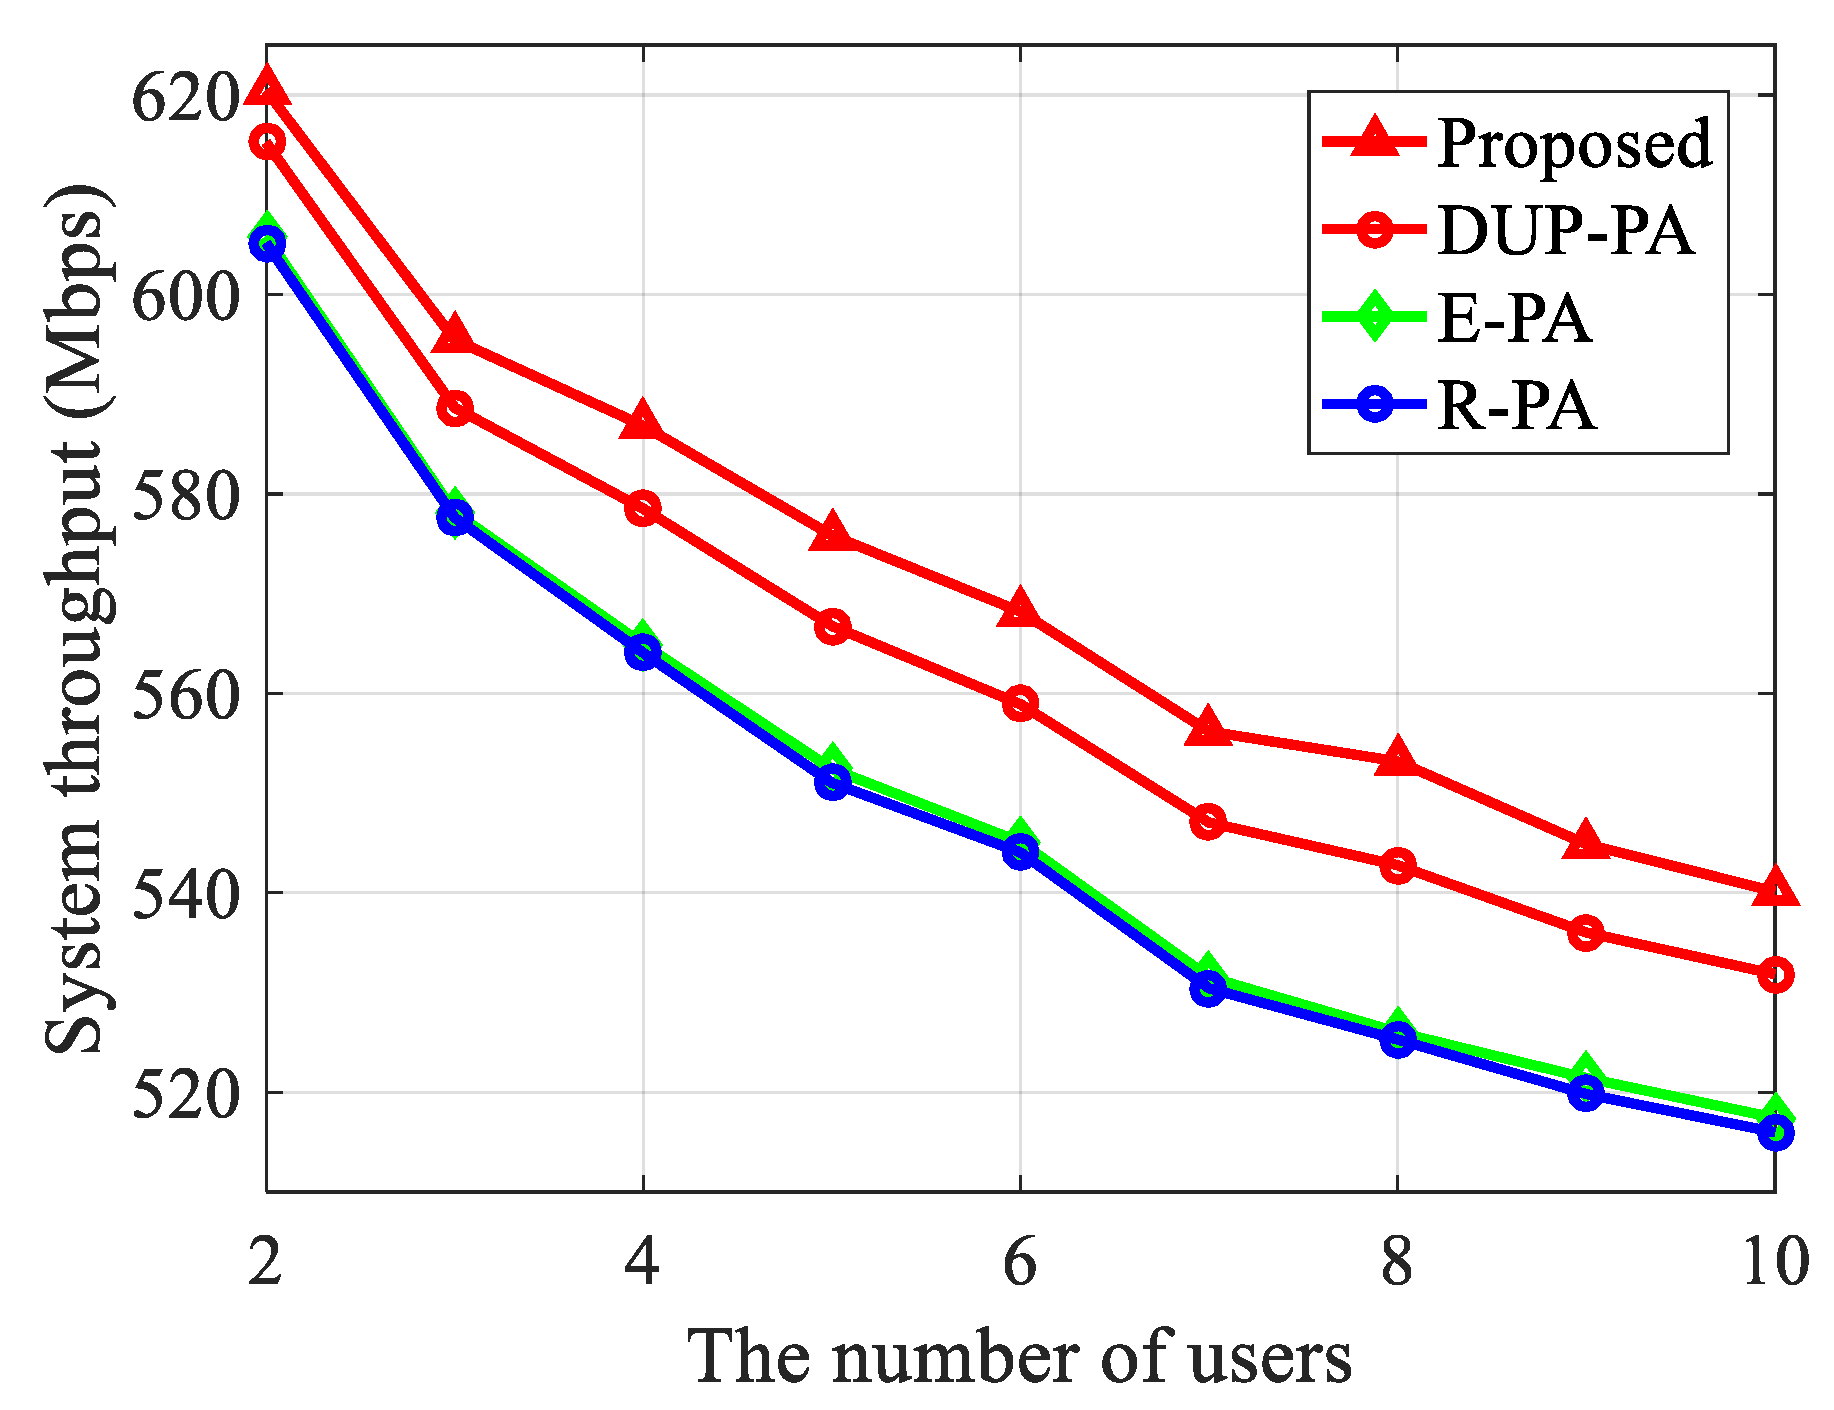
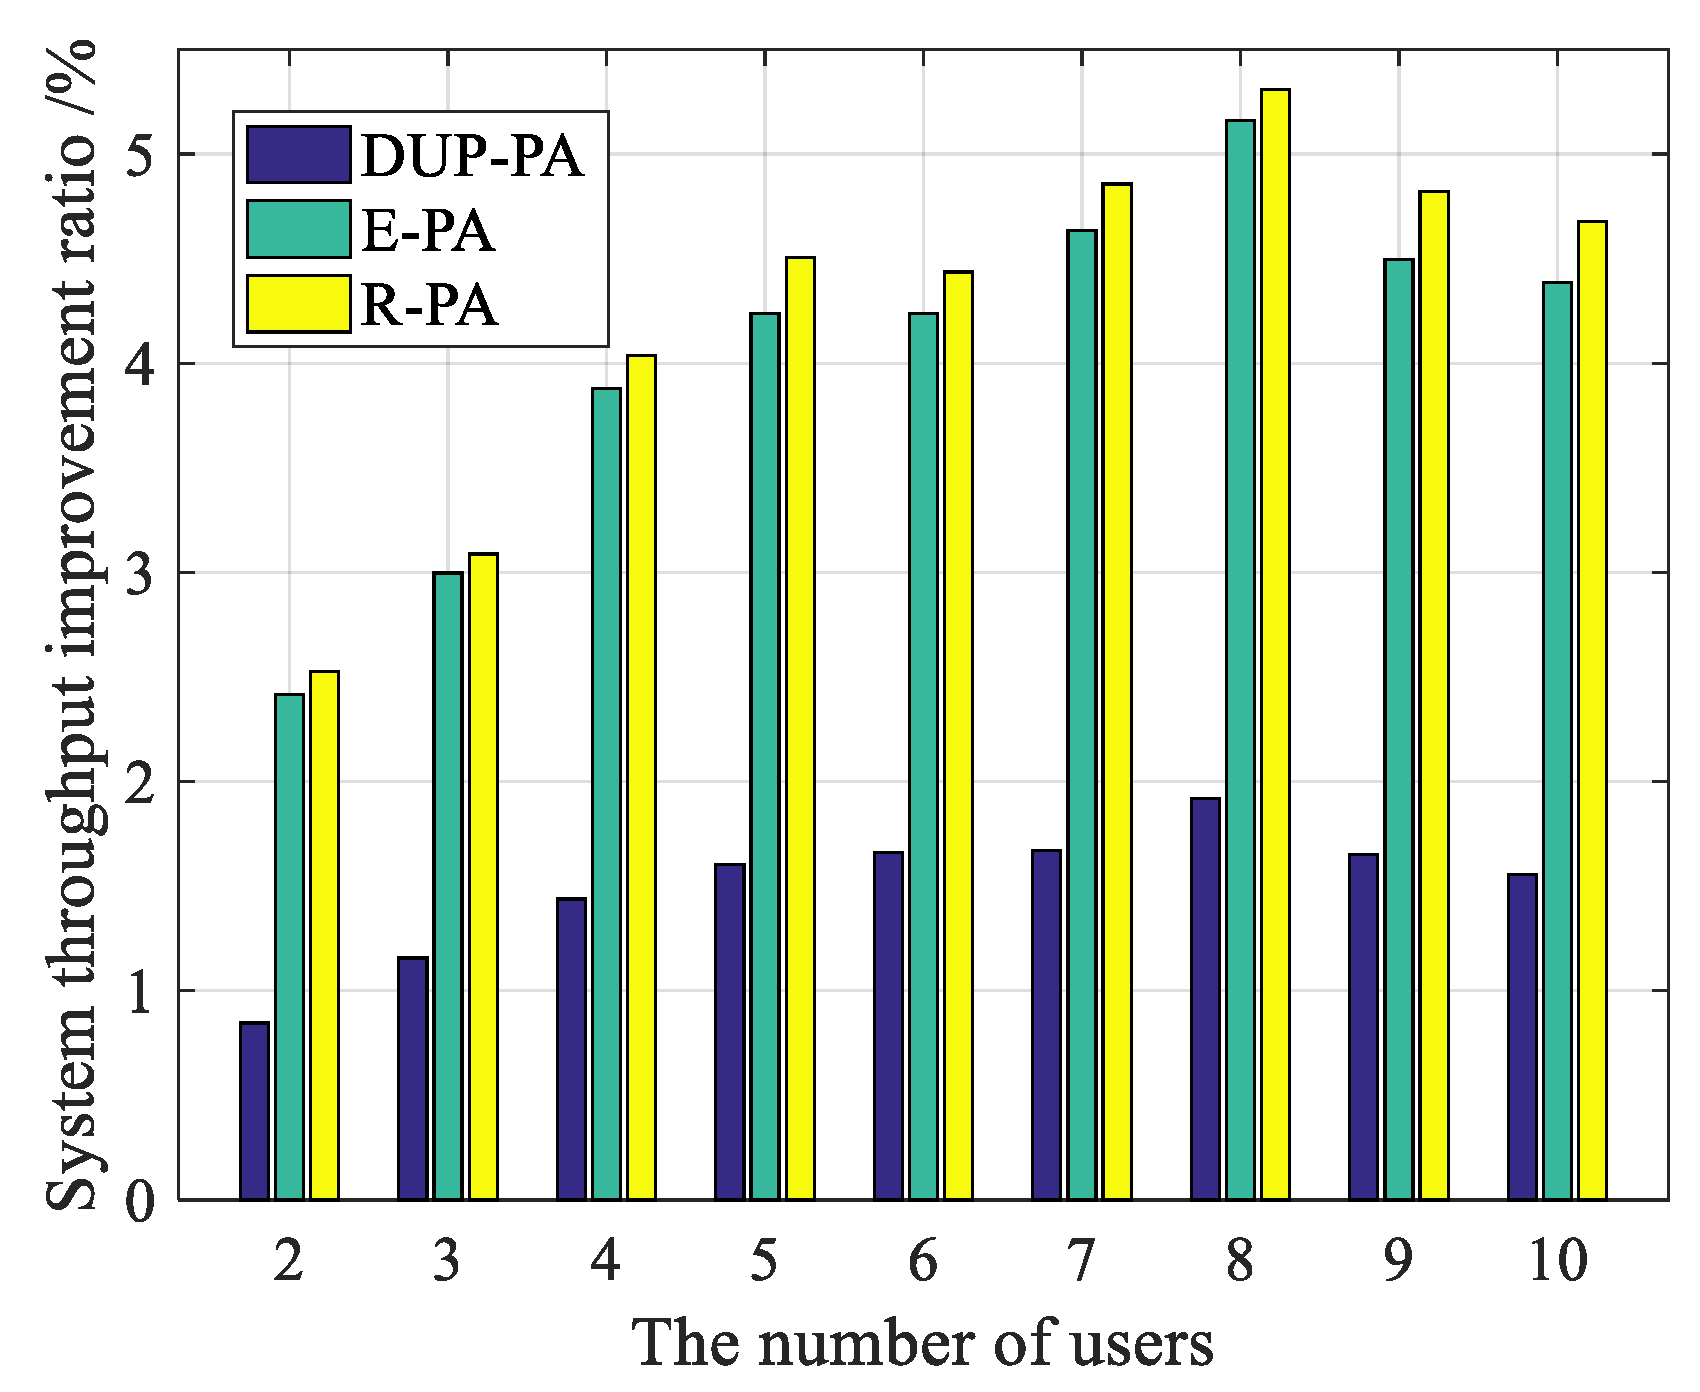
4.3.2. Analysis on System Throughput
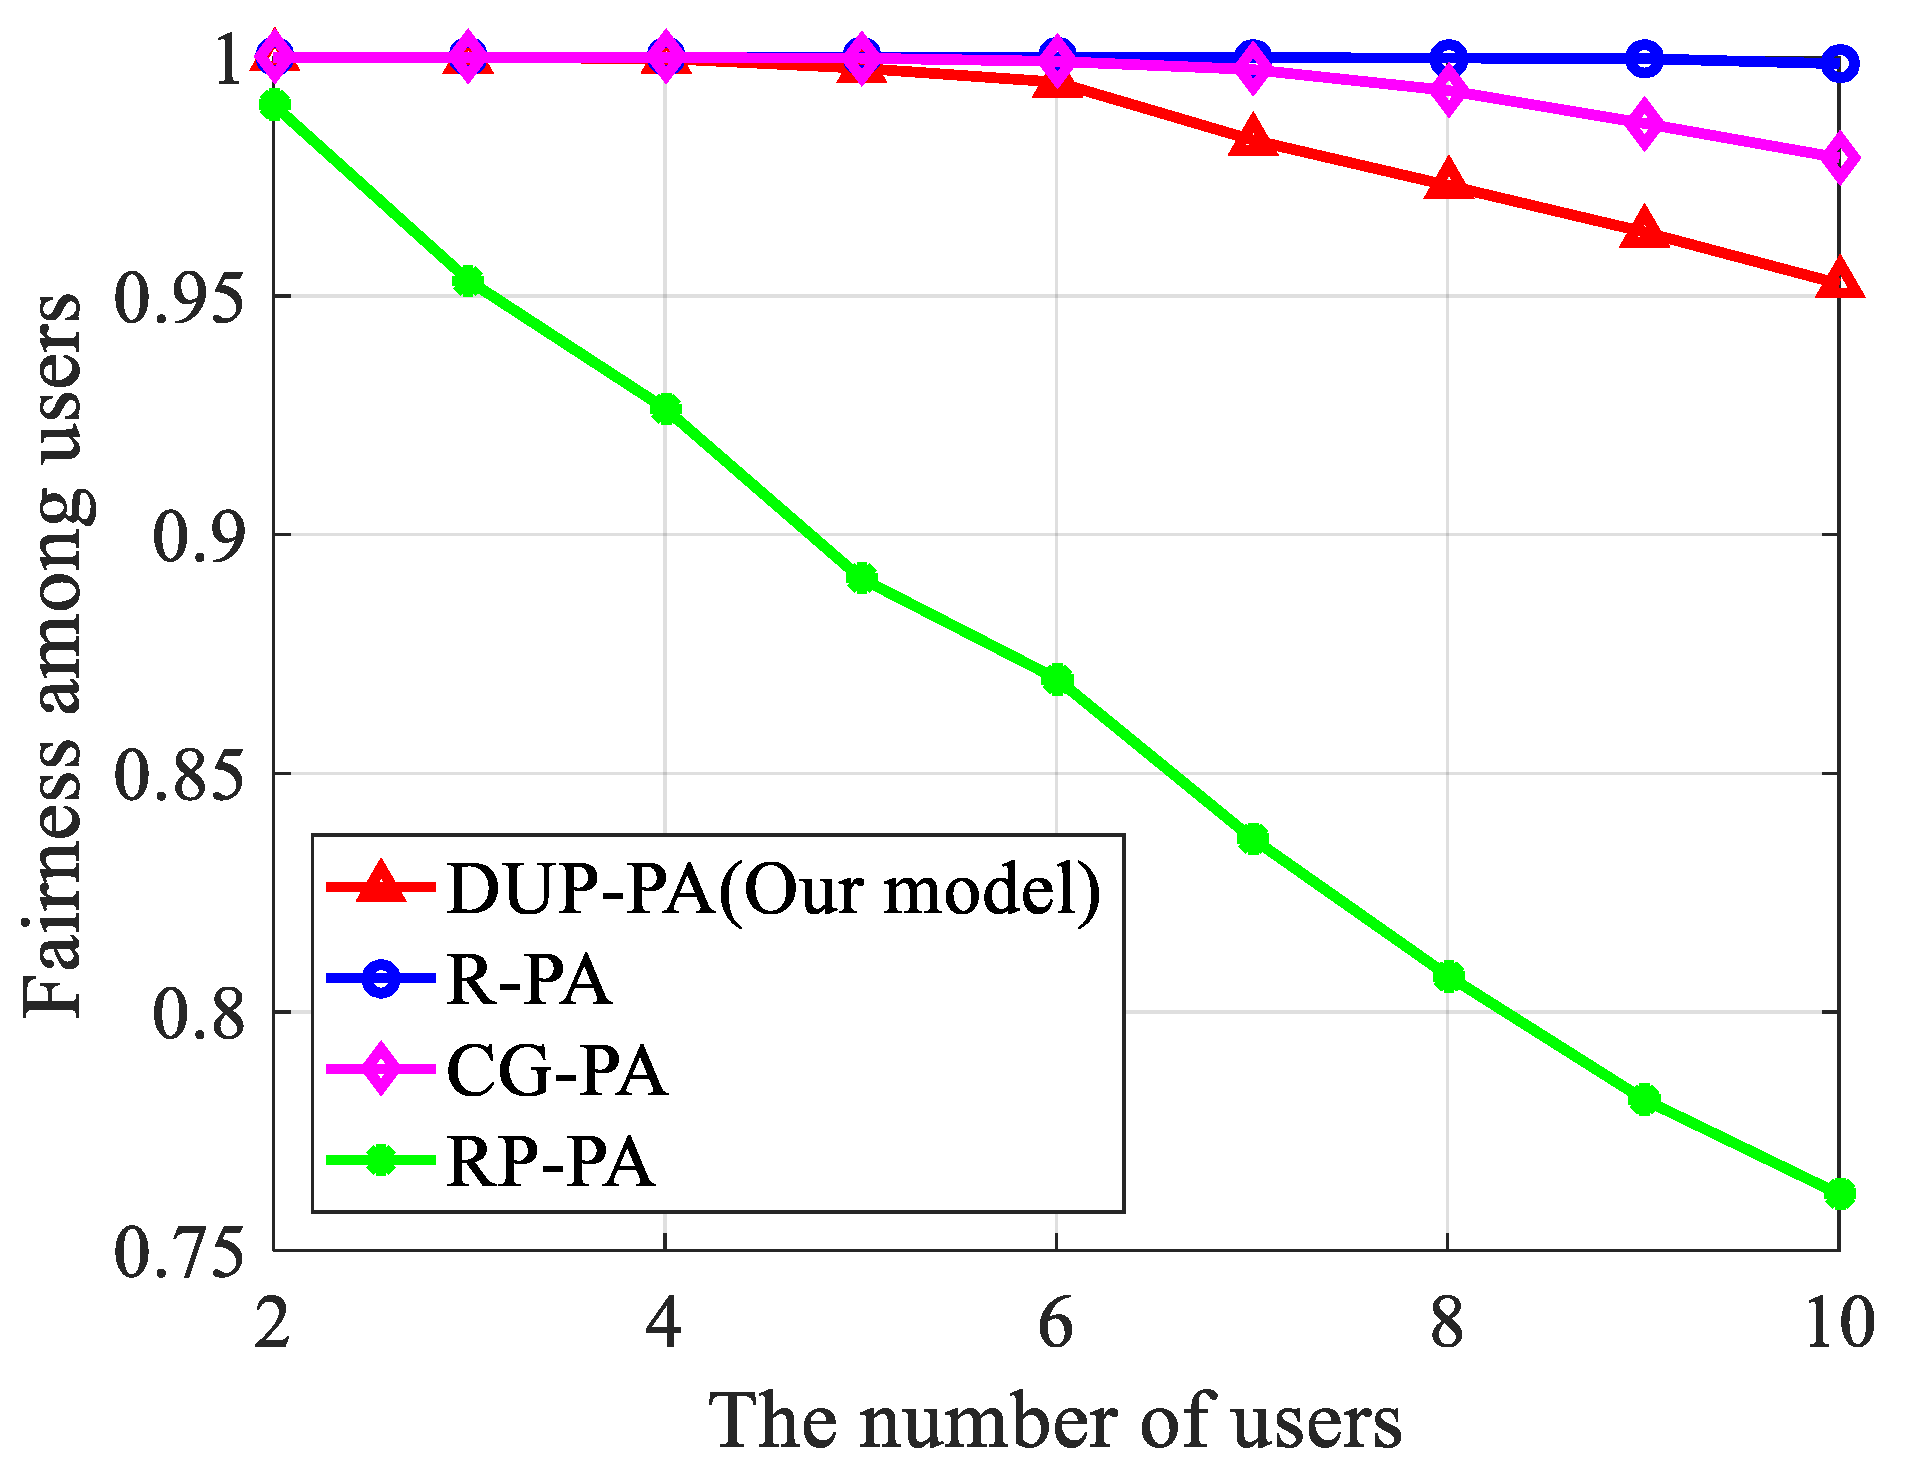
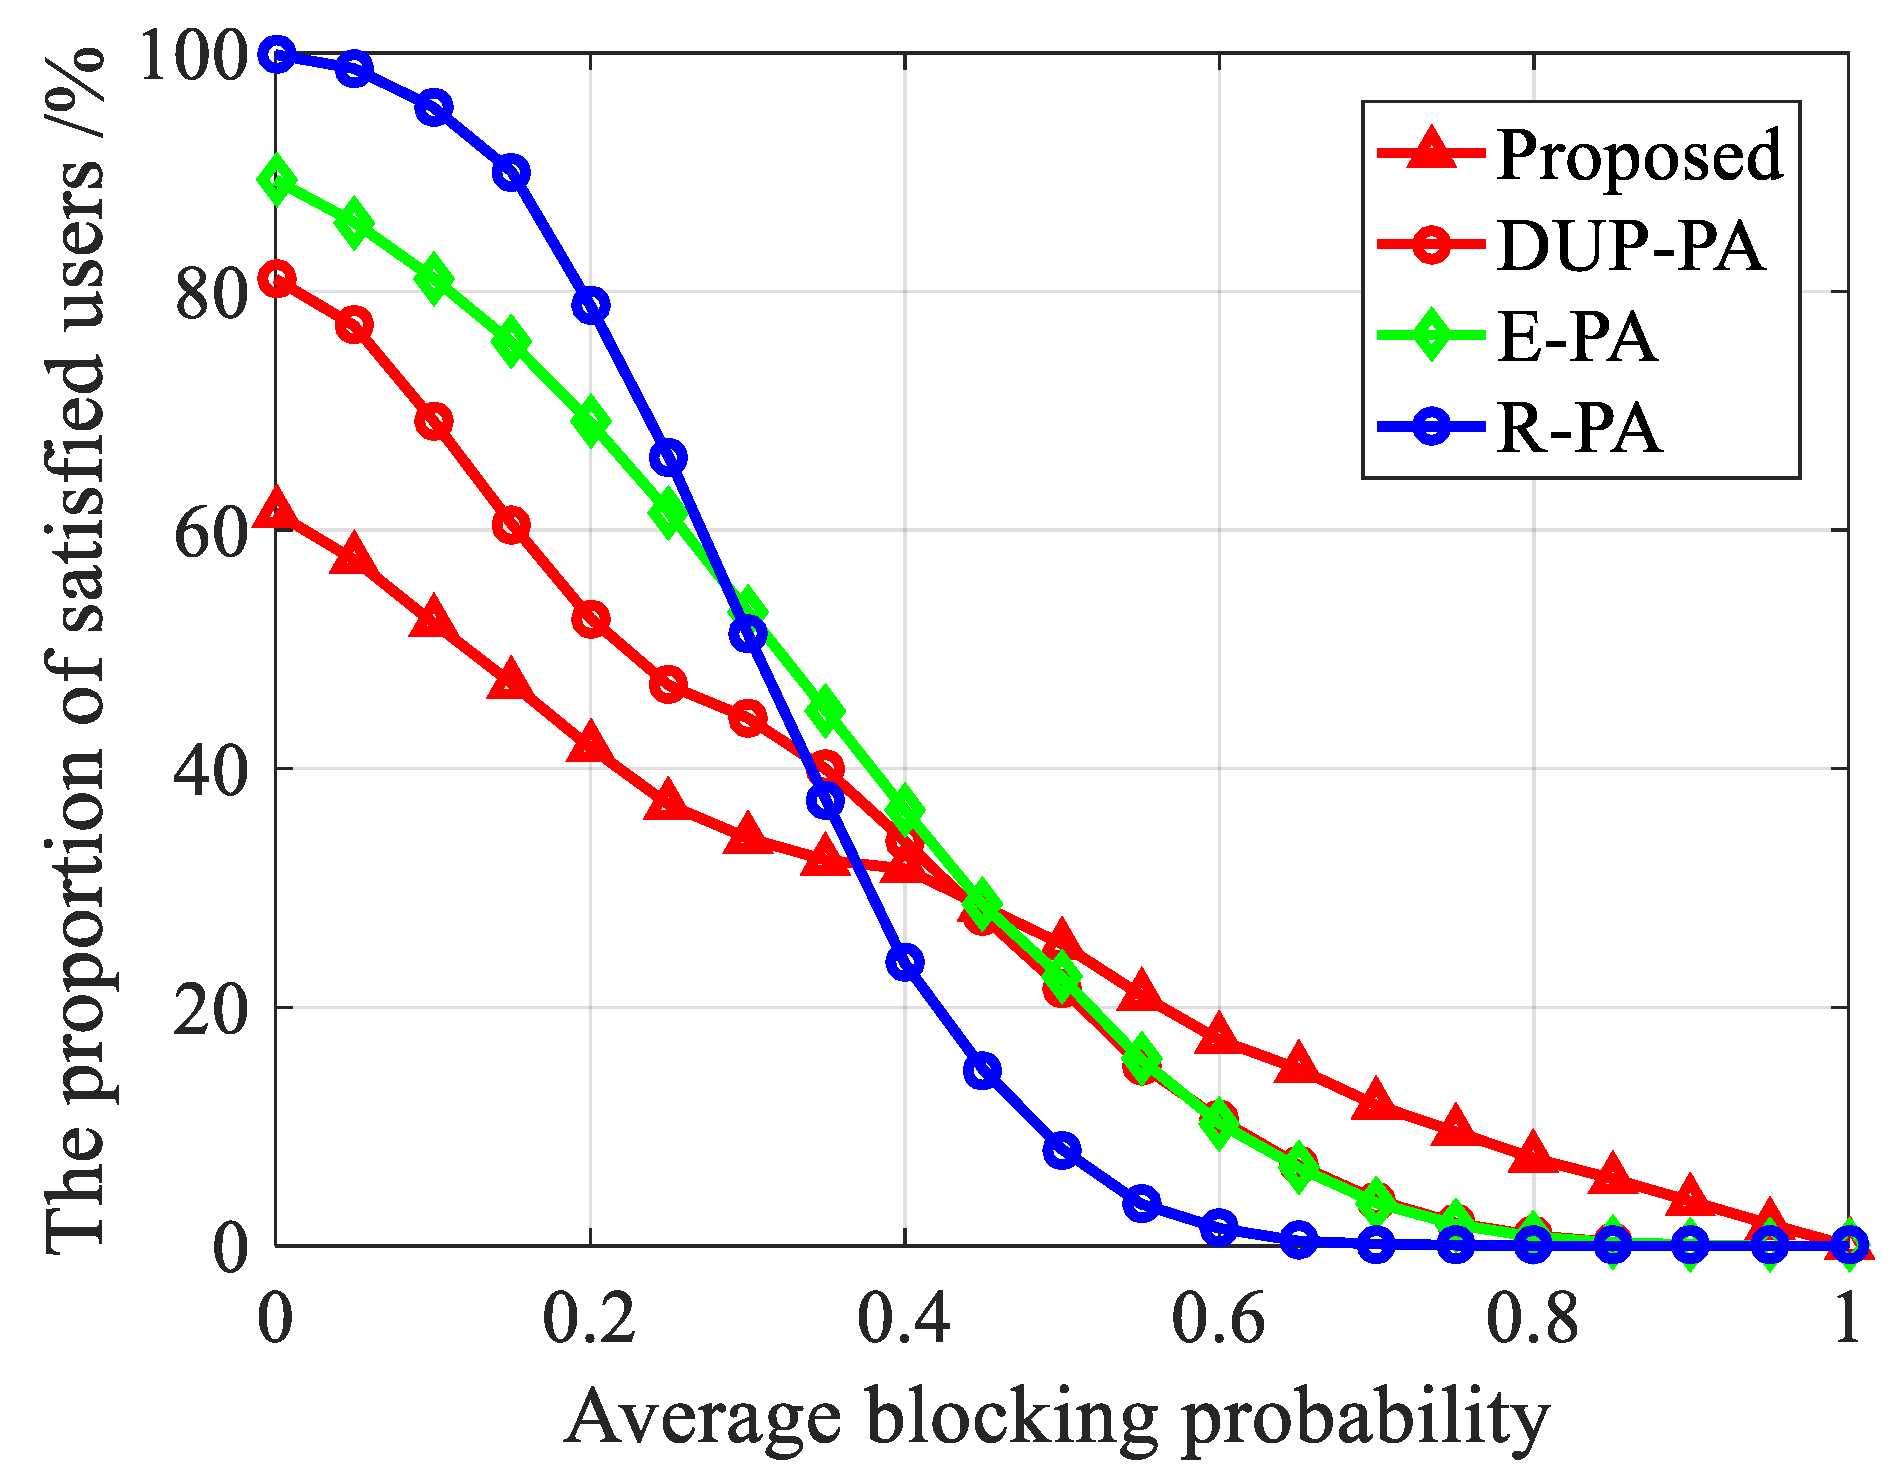
4.3.3. Analysis on the Degree of Satisfaction
5. Conclusions
Author Contributions
Funding
Conflicts of Interest
References
- Haas, H.; Yin, L.; Wang, Y.; Chen, C. What is LiFi? J. Lightwave Technol. 2016, 34, 1533–1544. [Google Scholar] [CrossRef]
- Feng, L.; Hu, R.Q.; Wang, J.; Xu, P.; Qian, Y. Applying VLC in 5G Networks: Architectures and Key Technologies. IEEE Network 2016, 30, 77–83. [Google Scholar] [CrossRef]
- Bawazir, S.S.; Sofotasios, P.C.; Muhaidat, S.; Al-Hammadi, Y.; Karagiannidis, G.K. Multiple Access for Visible Light Communications: Research Challenges and Future Trends. IEEE Access 2018, 6, 26167–26174. [Google Scholar] [CrossRef]
- Chen, S.; Qin, F.; Hu, P.D.B.; Li, X.; Liu, J. User-Centric Ultra-Dense Networks for 5G; Springer Nature: Basingstoke, UK, 2018; p. 7. [Google Scholar]
- Kafafy, M.; Fahmy, Y.; Abdallah, M.; Khairy, M. Power Efficient Downlink Resource Allocation for Hybrid RF/VLC Wireless Networks. In Proceedings of the 2017 IEEE Wireless Communications and Networking Conference (WCNC), San Francisco, CA, USA, 19–22 March 2017; pp. 1–6. [Google Scholar]
- Wu, W.; Zhou, F.; Yang, Q. Dynamic network resource optimization in hybrid VLC and radio frequency networks. In Proceedings of the 2017 International Conference on Selected Topics in Mobile and Wireless Networking (MoWNeT), Avignon, France, 17–19 May 2017; pp. 1–7. [Google Scholar]
- Dong, X.; Chi, X.; Sun, H.; Zhu, Y. Scheduling with heterogeneous qos provisioning for indoor visible-light communication. Curr. Opt. Photonics 2018, 2, 39–46. [Google Scholar]
- Uddin, M.S.; Chowdhury, M.Z.; Jang, Y.M. Priority-based resource allocation scheme for visible light communication. In Proceedings of the 2010 Second International Conference on Ubiquitous and Future Networks (ICUFN), Jeju Island, Korea, 16–18 June 2010; pp. 247–250. [Google Scholar]
- Chowdhury, M.Z.; Uddin, M.S.; Jang, Y.M. Dynamic channel allocation for QoS provisioning in visible light communication. In Proceedings of the 2011 IEEE International Conference on Consumer Electronics (ICCE), Las Vegas, NV, USA, 9–12 January 2011; pp. 13–14. [Google Scholar]
- Chowdhury, M.Z.; Uddin, M.S.; Jang, Y.M. Dynamic Channel Allocation for Class-Based QoS Provisioning and Call Admission in Visible Light Communication. Arab. J. Sci. Eng. 2013, 39, 1007–1016. [Google Scholar] [CrossRef]
- Chowdhury, M.Z.; Jang, Y.M.; Haas, Z.J. Priority based bandwidth adaptation for multi-class traffic in wireless networks. Int. J. Multimedia Ubiquitous Eng. 2014, 7, 445–450. [Google Scholar]
- Wu, X.; Safari, M.; Haas, H. Three-state fuzzy logic method on resource allocation for small cell networks. In Proceedings of the 2015 IEEE 26th Annual International Symposium on Personal, Indoor, and Mobile Radio Communications (PIMRC), Hong Kong, China, 30 August–2 September 2015; pp. 1168–1172. [Google Scholar]
- Wu, X.; Safari, M.; Haas, H. Bidirectional Allocation Game in Visible Light Communications. In Proceedings of the 2016 IEEE 83rd Vehicular Technology Conference (VTC Spring), Nanjing, China, 15–18 May 2016; pp. 1–5. [Google Scholar]
- Wu, X.; Safari, M.; Haas, H. Access Point Selection for Hybrid Li-Fi and Wi-Fi Networks. IEEE Trans. Commun. 2017, 65, 5375–5385. [Google Scholar] [CrossRef]
- Wang, Y.; Wu, X.; Haas, H. Fuzzy logic based dynamic handover scheme for indoor Li-Fi and RF hybrid network. In Proceedings of the 2016 IEEE International Conference on Communications (ICC), Kuala Lumpur, Malaysia, 22–27 May 2016; pp. 1–6. [Google Scholar]
- Komine, T.; Nakagawa, M. Fundamental analysis for visible-light communication system using LED lights. IEEE Trans. Consum. Electron. 2004, 50, 100–107. [Google Scholar] [CrossRef]
- Stefan, I.; Burchardt, H.; Haas, H. Area spectral efficiency performance comparison between vlc and rf femtocell networks. In Proceedings of the 2013 IEEE International Conference on Communications, Budapest, Hungary, 9–13 June 2013; pp. 3825–3829. [Google Scholar]
- Jin, F.; Zhang, R.; Hanzo, L. Resource allocation under delay-guarantee constraints for heterogeneous visible-light and rf femtocell. IEEE Trans. Wireless Commun. 2015, 14, 1020–1034. [Google Scholar] [CrossRef]
- Kashef, M.; Abdallah, M.; Qaraqe, K. Power allocation for downlink multi-user SC-FDMA visible light communication systems. In Proceedings of the 2015 49th Annual Conference on Information Sciences and Systems (CISS), Baltimore, MD, USA, 18–20 March 2015. [Google Scholar]
- Burchardt, H.; Sinanovic, S.; Bharucha, Z.; Haas, H. Distributed and autonomous resource and power allocation for wireless networks. IEEE Trans. Commun. 2013, 61, 2758–2771. [Google Scholar] [CrossRef]


| No. | State | |||
|---|---|---|---|---|
| 1 | - | High | Low | Positive |
| 2 | High | Med | Low | Positive |
| 3 | High or Med-High | High | High | Neutral |
| 4 | Not High | Med | Low | Neutral |
| 5 | High | Med | High | Neutral |
| 6 | High or Med-High | Low | Low | Neutral |
| 7 | Low-Med or Low | High | High | Negative |
| 8 | Not High | Med | High | Negative |
| 9 | Low-Med or Low | Low | Low | Negative |
| 10 | - | Low | High | Negative |
| Parameter | Value |
|---|---|
| Room size | 2.5 × 2.5 × 3 m |
| Transmit optical power of AP, | 9 W |
| Height between the AP and user, | 1.65 m |
| Half-intensity radiation angle, | 60° |
| FOV semi-angle of PD, | 60° |
| The refractive index, | 1.5 |
| Detector responsivity, | 0.53 A/W |
| The physical area of a PD, | 10−4 m2 |
| Power spectral density of noise, | 10−21 A2/Hz |
| Bandwidth per optical AP, | 40 MHz |
| The gain of the optical filter, | 1 |
| Average required data rate, | 40 Mbps |
| Average blocking probability, | 0.1 |
| The number of users, | 10 |
© 2019 by the authors. Licensee MDPI, Basel, Switzerland. This article is an open access article distributed under the terms and conditions of the Creative Commons Attribution (CC BY) license (http://creativecommons.org/licenses/by/4.0/).
Share and Cite
Bai, X.-W.; Li, Q.; Tao, S.-Y. Performance Analysis of Bandwidth Allocation Based on Dynamic User Priority for Indoor Visible Light Communication Ultra-Dense Networks. Electronics 2019, 8, 276. https://doi.org/10.3390/electronics8030276
Bai X-W, Li Q, Tao S-Y. Performance Analysis of Bandwidth Allocation Based on Dynamic User Priority for Indoor Visible Light Communication Ultra-Dense Networks. Electronics. 2019; 8(3):276. https://doi.org/10.3390/electronics8030276
Chicago/Turabian StyleBai, Xiang-Wei, Qing Li, and Si-Yu Tao. 2019. "Performance Analysis of Bandwidth Allocation Based on Dynamic User Priority for Indoor Visible Light Communication Ultra-Dense Networks" Electronics 8, no. 3: 276. https://doi.org/10.3390/electronics8030276
APA StyleBai, X.-W., Li, Q., & Tao, S.-Y. (2019). Performance Analysis of Bandwidth Allocation Based on Dynamic User Priority for Indoor Visible Light Communication Ultra-Dense Networks. Electronics, 8(3), 276. https://doi.org/10.3390/electronics8030276