1. Introduction
Steady-state visual evoked potential (SSVEP), as one of the most widely used responses in electroencephalogram (EEG) -based brain–computer interfaces (BCIs), has received sustained attention [
1,
2,
3,
4,
5,
6,
7]. When participants attend a periodic visual stimulus, SSVEPs are elicited at the stimulation frequency and its harmonics [
8]. Correspondingly, by encoding different targets with distinct frequencies, BCI systems can be realized via real-time frequency recognition of the recorded SSVEPs [
3,
9]. To date, the frequency-coding SSVEP BCIs have achieved significant progress, featured by the relatively large number of simultaneously decodable targets and the high communication speed [
5,
6], thereby potential for real-life applications such as letter typing.
When flicker stimuli were presented at different spatial locations in the visual field, distinct SSVEP responses would be elicited [
10]. The phenomenon, known as the retinotopic mapping [
11,
12], has gained increasing interest in recent BCI studies. While pilot BCI studies have mainly focused on designing visual spatial patterns to increase possible BCI target numbers [
13] or enhance the signal-to-noise ratio (SNR) of SSVEP [
14], efforts have been devoted to decoding the spatial information embedded in SSVEP responses directly [
15,
16]. Unlike the traditional frequency-coded SSVEP BCI paradigm in which SSVEP responses were modulated by targets with different frequencies [
3,
9], it is feasible to design a spatially-coded SSVEP BCI by encoding responses by targets with different spatial locations. Indeed, previous studies have demonstrated that overtly attending to targets at distinct spatial directions relative to a centrally-displayed flicker stimulus could evoke separable SSVEP responses [
15,
16]. Moreover, the differences in responses are sufficient to support the decoding of directions at a single-trial level to achieve a dial [
15] and spatial navigation task [
16], suggesting the feasibility of a single-stimulus, multi-target SSVEP BCI. Compared with the frequency-coded BCIs in which multiple stimuli are required to encode multiple targets, this single-stimulus design can considerably simplify the stimulation setup and the user interface of BCIs [
17,
18]. In addition, given the fact that the stimulus always appears in the peripheral visual field, this single-flicker SSVEP BCI paradigm is expected to reduce the visual burden at the same time [
16], indicating its potential to be a good candidate for practical applications.
However, the previous spatially-coded SSVEP studies only utilized spatial directions to encode targets, and the resulting nine- or four-command designs have limited the potential applications of spatially-coded BCIs when compared with the conventional frequency-coded SSVEP BCIs. For example, in a drone control task, while previous designs are only sufficient to control the moving directions, it is possible to send more commands such as speeding, stopping, climbing, etc., if more command channels could be achieved. One way to extend the range of feasible application scenarios is to include the visual eccentricity information for increasing the number of targets. Indeed, SSVEP responses have been observed to reduce along with the increase of the eccentricity of stimuli from the fixation spot [
19], providing neurophysiological evidence in support of the eccentricity decoding in SSVEP responses. Joint decoding of eccentricity and direction information is expected to substantially increase the number of targets, by making a better use of the visual spatial information. Nevertheless, the eccentricity information could contribute to extending the encoding dimension only when the spatial patterns remain separable even with a large eccentricity. Specifically, the weaker SSVEP responses along with increasing eccentricities may lead to a reduced accuracy for the direction classification at the same time, thus influencing the BCI performance in a complex way. Although there are previous studies suggesting a relatively stable spatial patterns of visual motion-onset responses with increasing eccentricities [
17,
18], efforts are still needed to evaluate how visual eccentricity information modulates the SSVEP responses and whether this modulation could contribute to decoding visual spatial information at a single-trial level.
In the present study, the feasibility of a spatially-coded BCI to encode targets with both the eccentricity and direction information simultaneously was evaluated. Eight directions (left, left-up, up, right-up, right, right-down, down, and left-down) and two eccentricities (2.5° and 5°) relative to one flicker stimulus were employed to encode 16 targets. During the experiment, participants were instructed to direct their overt attention to one of the targets EEG recorded. Then, SSVEP responses modulated by different visual directions and eccentricities were analyzed, and the 16-target classification performances were evaluated in an offline manner. Our results suggest the feasibility of the simultaneous decoding of visual eccentricity and direction information based on SSVEP.
2. Methods
2.1. Participants
Twelve participants (five females, aged from 23 to 28 years, mean 24.8 years) with normal or corrected-to-normal vision participated in the experiment. All participants were given informed consent before experiments and received financial compensation for their participation. The study was approved by the local Ethics Committee at the Department of Psychology, Tsinghua University.
2.2. Visual Stimulation
The visual stimulation in the experiment is illustrated at the top panel of
Figure 1. An LCD computer monitor (144 Hz refresh rate, 1920 × 1080 pixel resolution, 23.6-inch, and a viewing distance of 50 cm) was used to present the stimulation. A white disk (radius = 2.5°) was centrally displayed on the screen (indicated as the gray disk in the top panel of
Figure 1). During the experiment, the disk flickered at 12 Hz with a sampled sinusoidal stimulation method [
20], forming a flicker stimulus to elicit SSVEPs. The stimulus lasted 4000 ms in total. One small red square (0.25° × 0.25°) would appear on the screen to indicate where the participants should direct their overt attention during the experiment. There were 16 possible targets arranged surrounding the central circle at eight directions (left, left-up, up, right-up, right, right-down, down, and left-down) and two eccentricities (2.5° and 5°). Since a previous study observed a rapid drop of SSVEP responses when the stimulus presented beyond 5° away from the central fixation spot [
19], 2.5° and 5° were chosen conservatively to evaluate the feasibility of eccentricity decoding in the present study. Eccentricities larger than 5° will be explored in further studies.
2.3. Experimental Procedure
The experiment included ten blocks in total. The duration of the inter-block intervals was controlled by participants themselves with a lower limit of 30 s set in the experimental program. In each block, 16 trials corresponding to each attention target were presented with a random order. As demonstrated at the bottom panel of
Figure 1, for each trial, one red square was displayed to cue the to-be-attended target for 1000 ms at the beginning, then followed by a 4000 ms flicker stimulus. Since the proposed study is an offline study, the red square highlighted the to-be-attended target for the whole flickering duration for the participants to stay focused. While this highlighting strategy cannot be used in online experiments without pre-defined targets, the performance calculated with this offline design is believed to be a reasonable estimation of follow-up online studies, as a similar strategy has been adopted in our previous 4-direction decoding studies [
16,
17]. The inter-trial interval varied from 1000 to 1500 ms, during which participants could blink or swallow. The Psychophysics Toolbox [
20,
21] based on MATLAB (The Mathworks, Natick, MA, USA) was employed to present the stimulation.
2.4. EEG Recordings
EEG was recorded continuously at a sampling rate of 1000 Hz with a SynAmps2 amplifier (Compumedics NeuroScan, Charlotte, NC, USA). Sixty-four electrodes were recorded according to the international 10–20 system with a reference at the vertex and a forehead ground at AFz. Electrode impedances were kept below 10 kΩ during the experiment. The experiment was carried out in an electromagnetically shielded room.
2.5. Data Preprocessing
Continuous EEG data were first band-pass filtered to 1.5–80 Hz, and a 50 Hz notch filter was used to remove the line noise. Next, EEG data were segmented into 4000 ms trials after the onset of the stimulus, resulting in 10 trials for each of the 16 attentional targets. Then, a set of 9 electrodes covering the parietal-occipital (PO5/6/7/8, O1/2, Pz, POz, and Oz), where the SSVEPs typically show maximal responses, was chosen for further analysis.
2.6. SNR Evaluation
In order to describe the SSVEP response strength when attending to targets at different directions and eccentricities in a quantitive way, a newly-proposed method [
22], which could evaluate the SSVEP SNR of the multi-channel EEG data response while considering multiple harmonics, was employed in the present study. Here, the stimulus frequency, as well as its second and third harmonics, were included in SNR calculation and the following-up BCI classification.
First, for each subject, the SSVEP signal was defined as the projection of every single-trial EEG data in the subspace of the stimulus frequency and its harmonics, while noise was defined as the residual after the projection. SNR, which was defined as the ratio between signal and noise, was calculated for each trial with the Formula (1). Then, the single-trial SNR were averaged for each attentional target as the index of the responses. Details about the mathematical derivation can be found in [
22].
Here, T is the 9-channel averaged EEG data, and ϕ is the reference signal. I is a Unit matrix.
Finally, a two-way repeated measure analysis of variance (RMANOVA) with two within-subject factors, i.e., direction (left, left-up, up, right-up, right, right-down, down, and left-down) and eccentricity (2.5° and 5°), was conducted to determine their possible effects on the SNR of SSVEP statistically. p-Values smaller than 0.05 were considered statistically significant after Greenhouse–Geisser correction. Statistical analyses were performed with SPSS (22.0.0, IBM, Armonk, NY, USA).
2.7. BCI Classification
In the offline performance evaluation, the single-trial 4000 ms EEG data were used for BCI classification without any manual artifact rejection procedures, as in many previous BCI studies [
3,
4,
5]. A canonical correlation analysis (CCA)-based classification algorithm [
23] was employed to capture the distinct SSVEP patterns, as reported in [
15,
16]. Note that all the offline classifications were evaluated with a 10-fold cross-validation procedure.
First of all, in order to evaluate how directions and eccentricities contribute to the classification performances, 8-directions classification at each eccentricity and the 2-eccentricity classification in each direction were conducted.
In the training phase, K-trial EEG data when the participant was attending to the target location c were concatenated as
. Then, the reference signal Y was obtained by replicating the ϕ (see Formula (2)) K times:
Here, K is 9 for each target as 90% of the EEG data were used as the training set. CCA was employed to find spatial filters
and
(c = 1, 2, …, N) to maximize the canonical correlation
= [
] between X and reference signal Y:
Here, N is the target number. For 8-directions classification, N = 8, and for the 2-eccentricity classification, N = 2. The M is the number of canonical correlation coefficients and is set as 6, the same as reported in [
15,
16].
Then, for each trial in the training set, a
feature vector was composed by calculating the canonical correlations
for all N targets and concatenating them as [
], which was used to train a support vector machine (SVM) classifier with a linear kernel using the LIBSVM toolbox [
24]. The regularization parameter of the linear kernel was decided based on a grid search strategy for each iteration in the cross-validation procedure, by using the corresponding data in the training set.
In the testing phase, the EEG trial to be classified is filtered with , and the correlation coefficients with the corresponding reference signals are computed, (c = 1, 2, …, N). The concatenated correlation coefficients [] constituted the feature vector for the testing trial, which then was used to recognize the target by the classifier.
After decoding the directions and eccentricities separately, a 16-target classification, which decoded the visual eccentricity and direction information simultaneously, was conducted with the above-mentioned CCA method. Here, N = 16.
Finally, in order to evaluate how the visual eccentricity information influences the joint classification of directions and eccentricities, three conditions were compared: individual filter, 2.5° filter, and 5° filter. The individual filter means the spatial filters
and
(c = 1, 2, …, 16) were trained with data from their respective eccentricities, corresponding to the results in
Table 1. The 2.5° filter, however, indicates the classification accuracies were calculated all by using spatial filters trained with data with an eccentricity of 2.5°, even for those with an eccentricity of 5°. The 5° filter could be explained similarly.
3. Results
As illustrated in
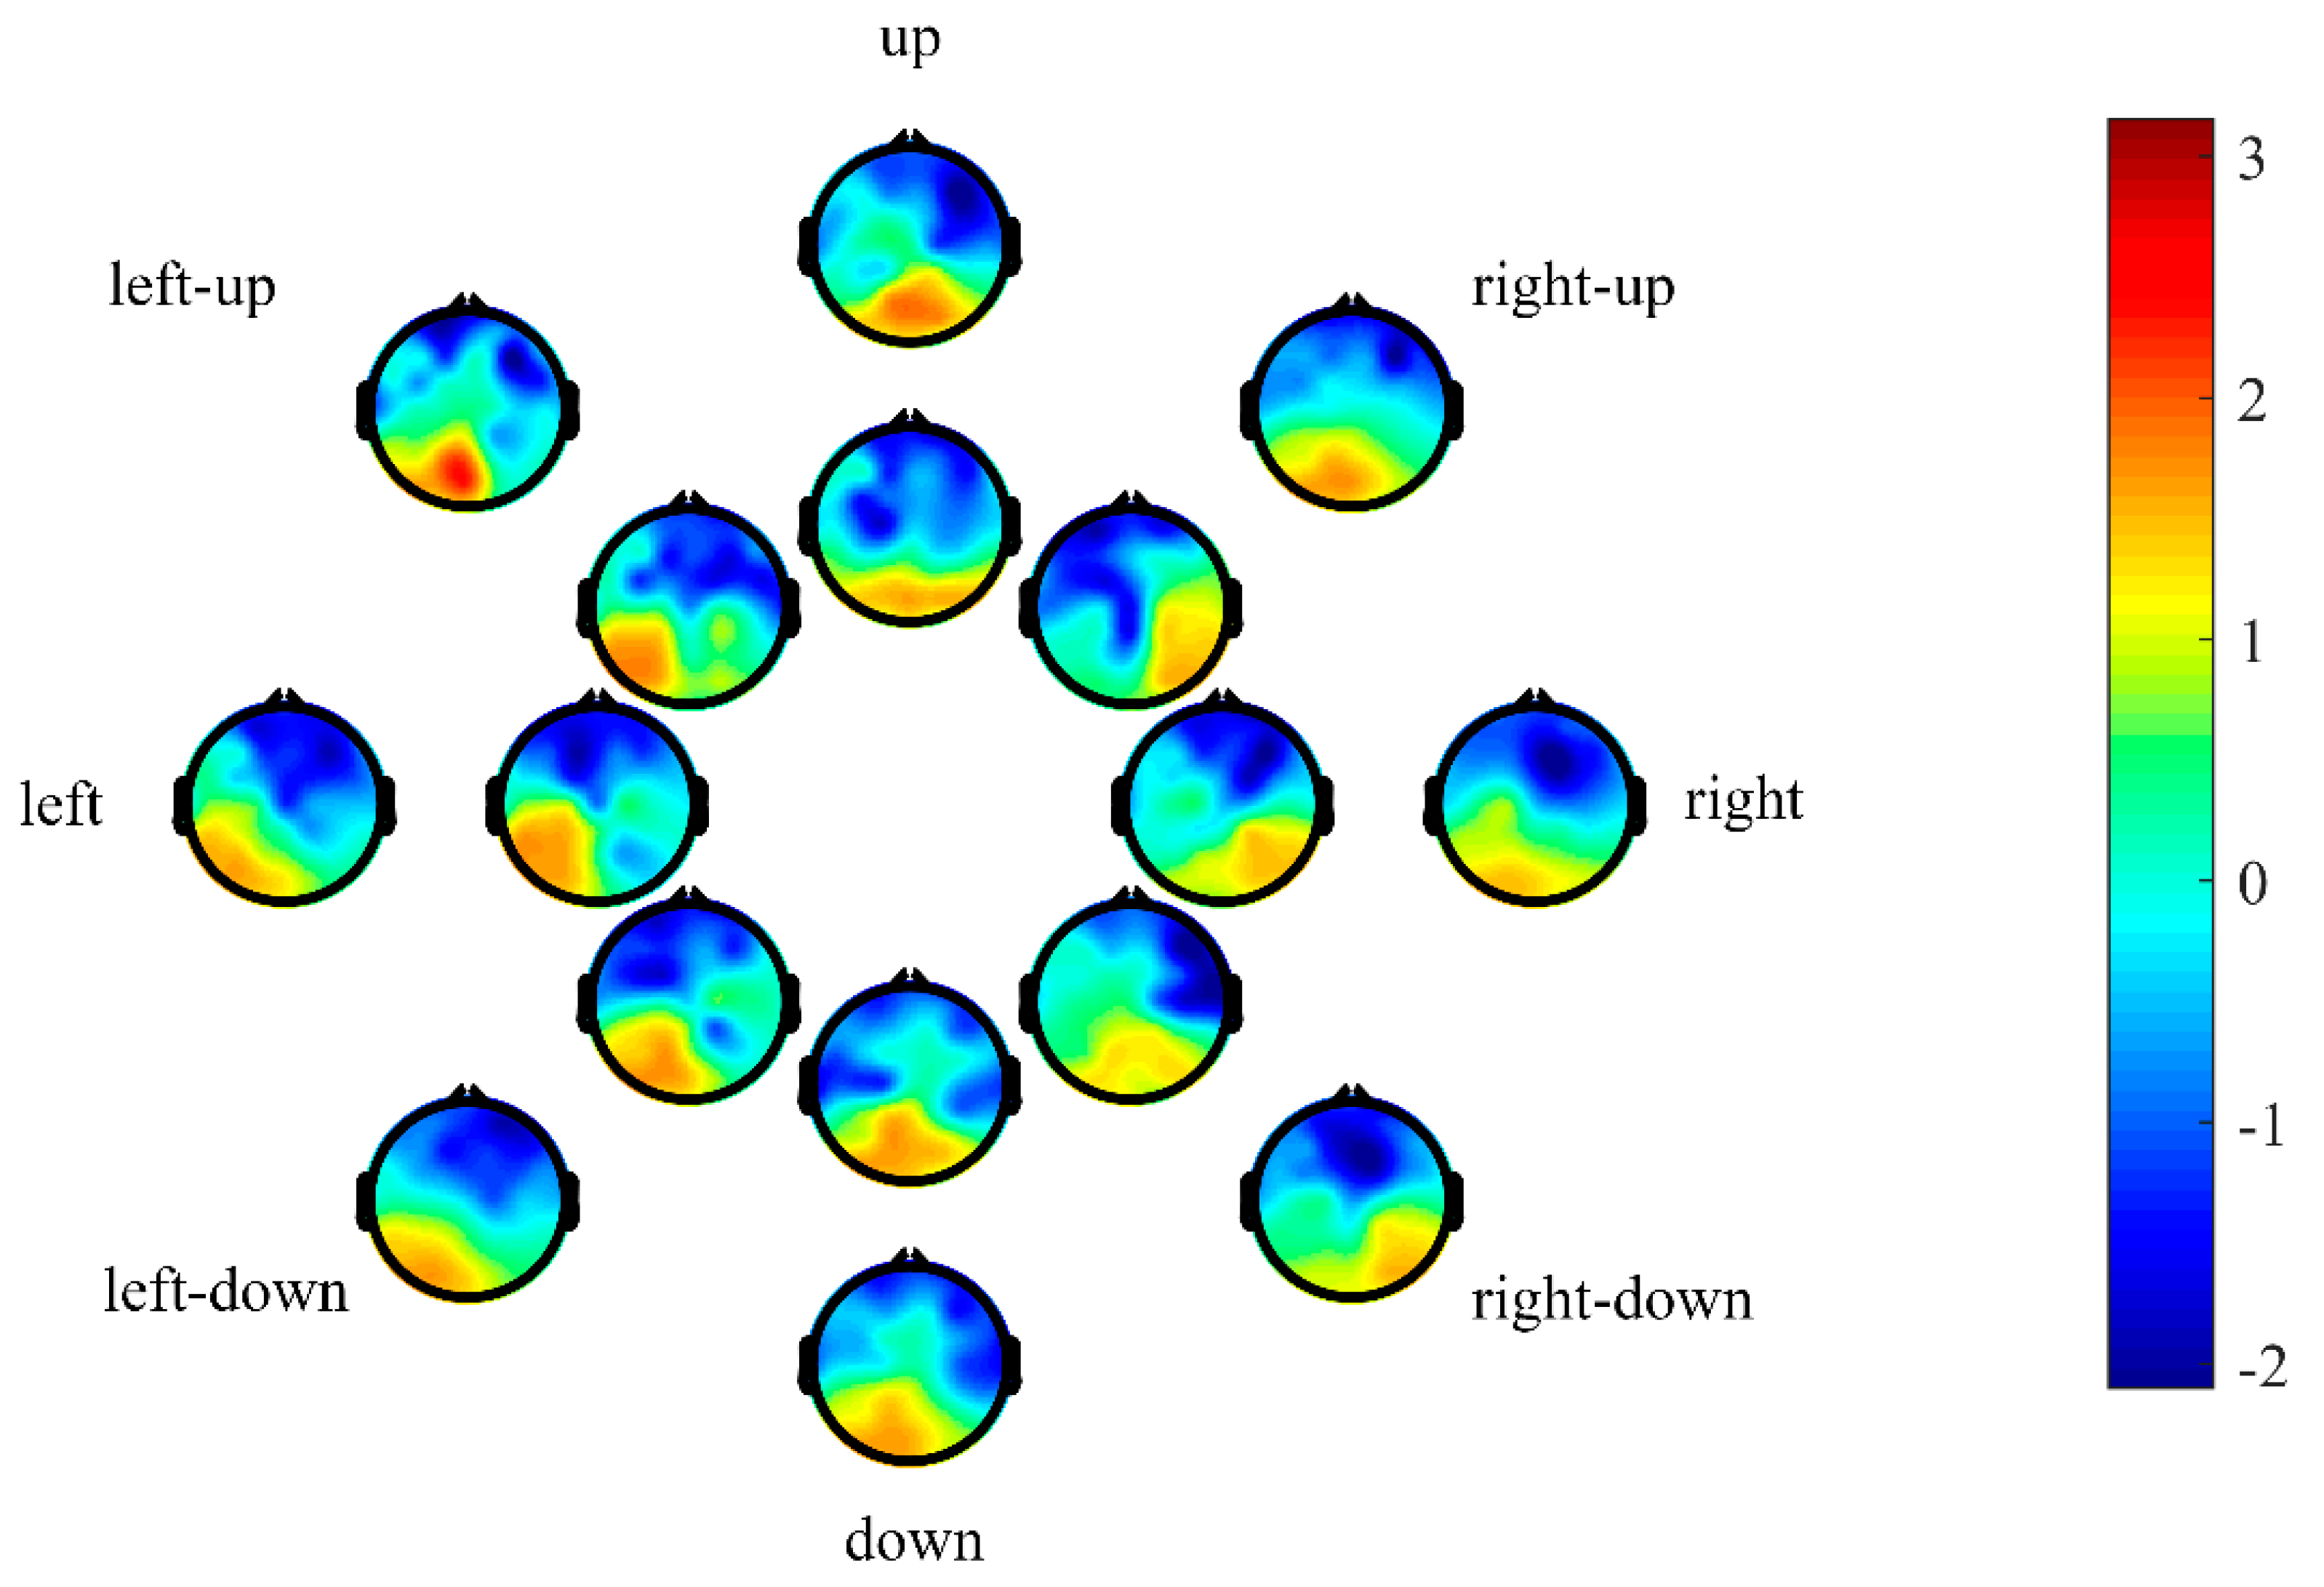
Figure 2, a typical SSVEP response over occipital and parietal areas could be found across conditions. When attending to targets at different directions and eccentricities, distinct SNR topographies for SSVEP were elicited with a shift of the response over the parietal-occipital areas. Specifically, when participants attended to the target at the right side, the flicker stimulus appeared in their left visual field, leading to a right-dominant response, and the opposite relation held for the target at the left side, suggesting a contralateral response. In addition, the SSVEP spatial patterns remained similar, for different eccentricities of the flicker stimulus. The dissimilarities of SSVEP topographies at the right and right-up conditions for this specific subject might be due to the relatively low signal-to-noise ratio at the eccentricity of 5°, leading to a failure to effectively capture the expected SSVEP activities.
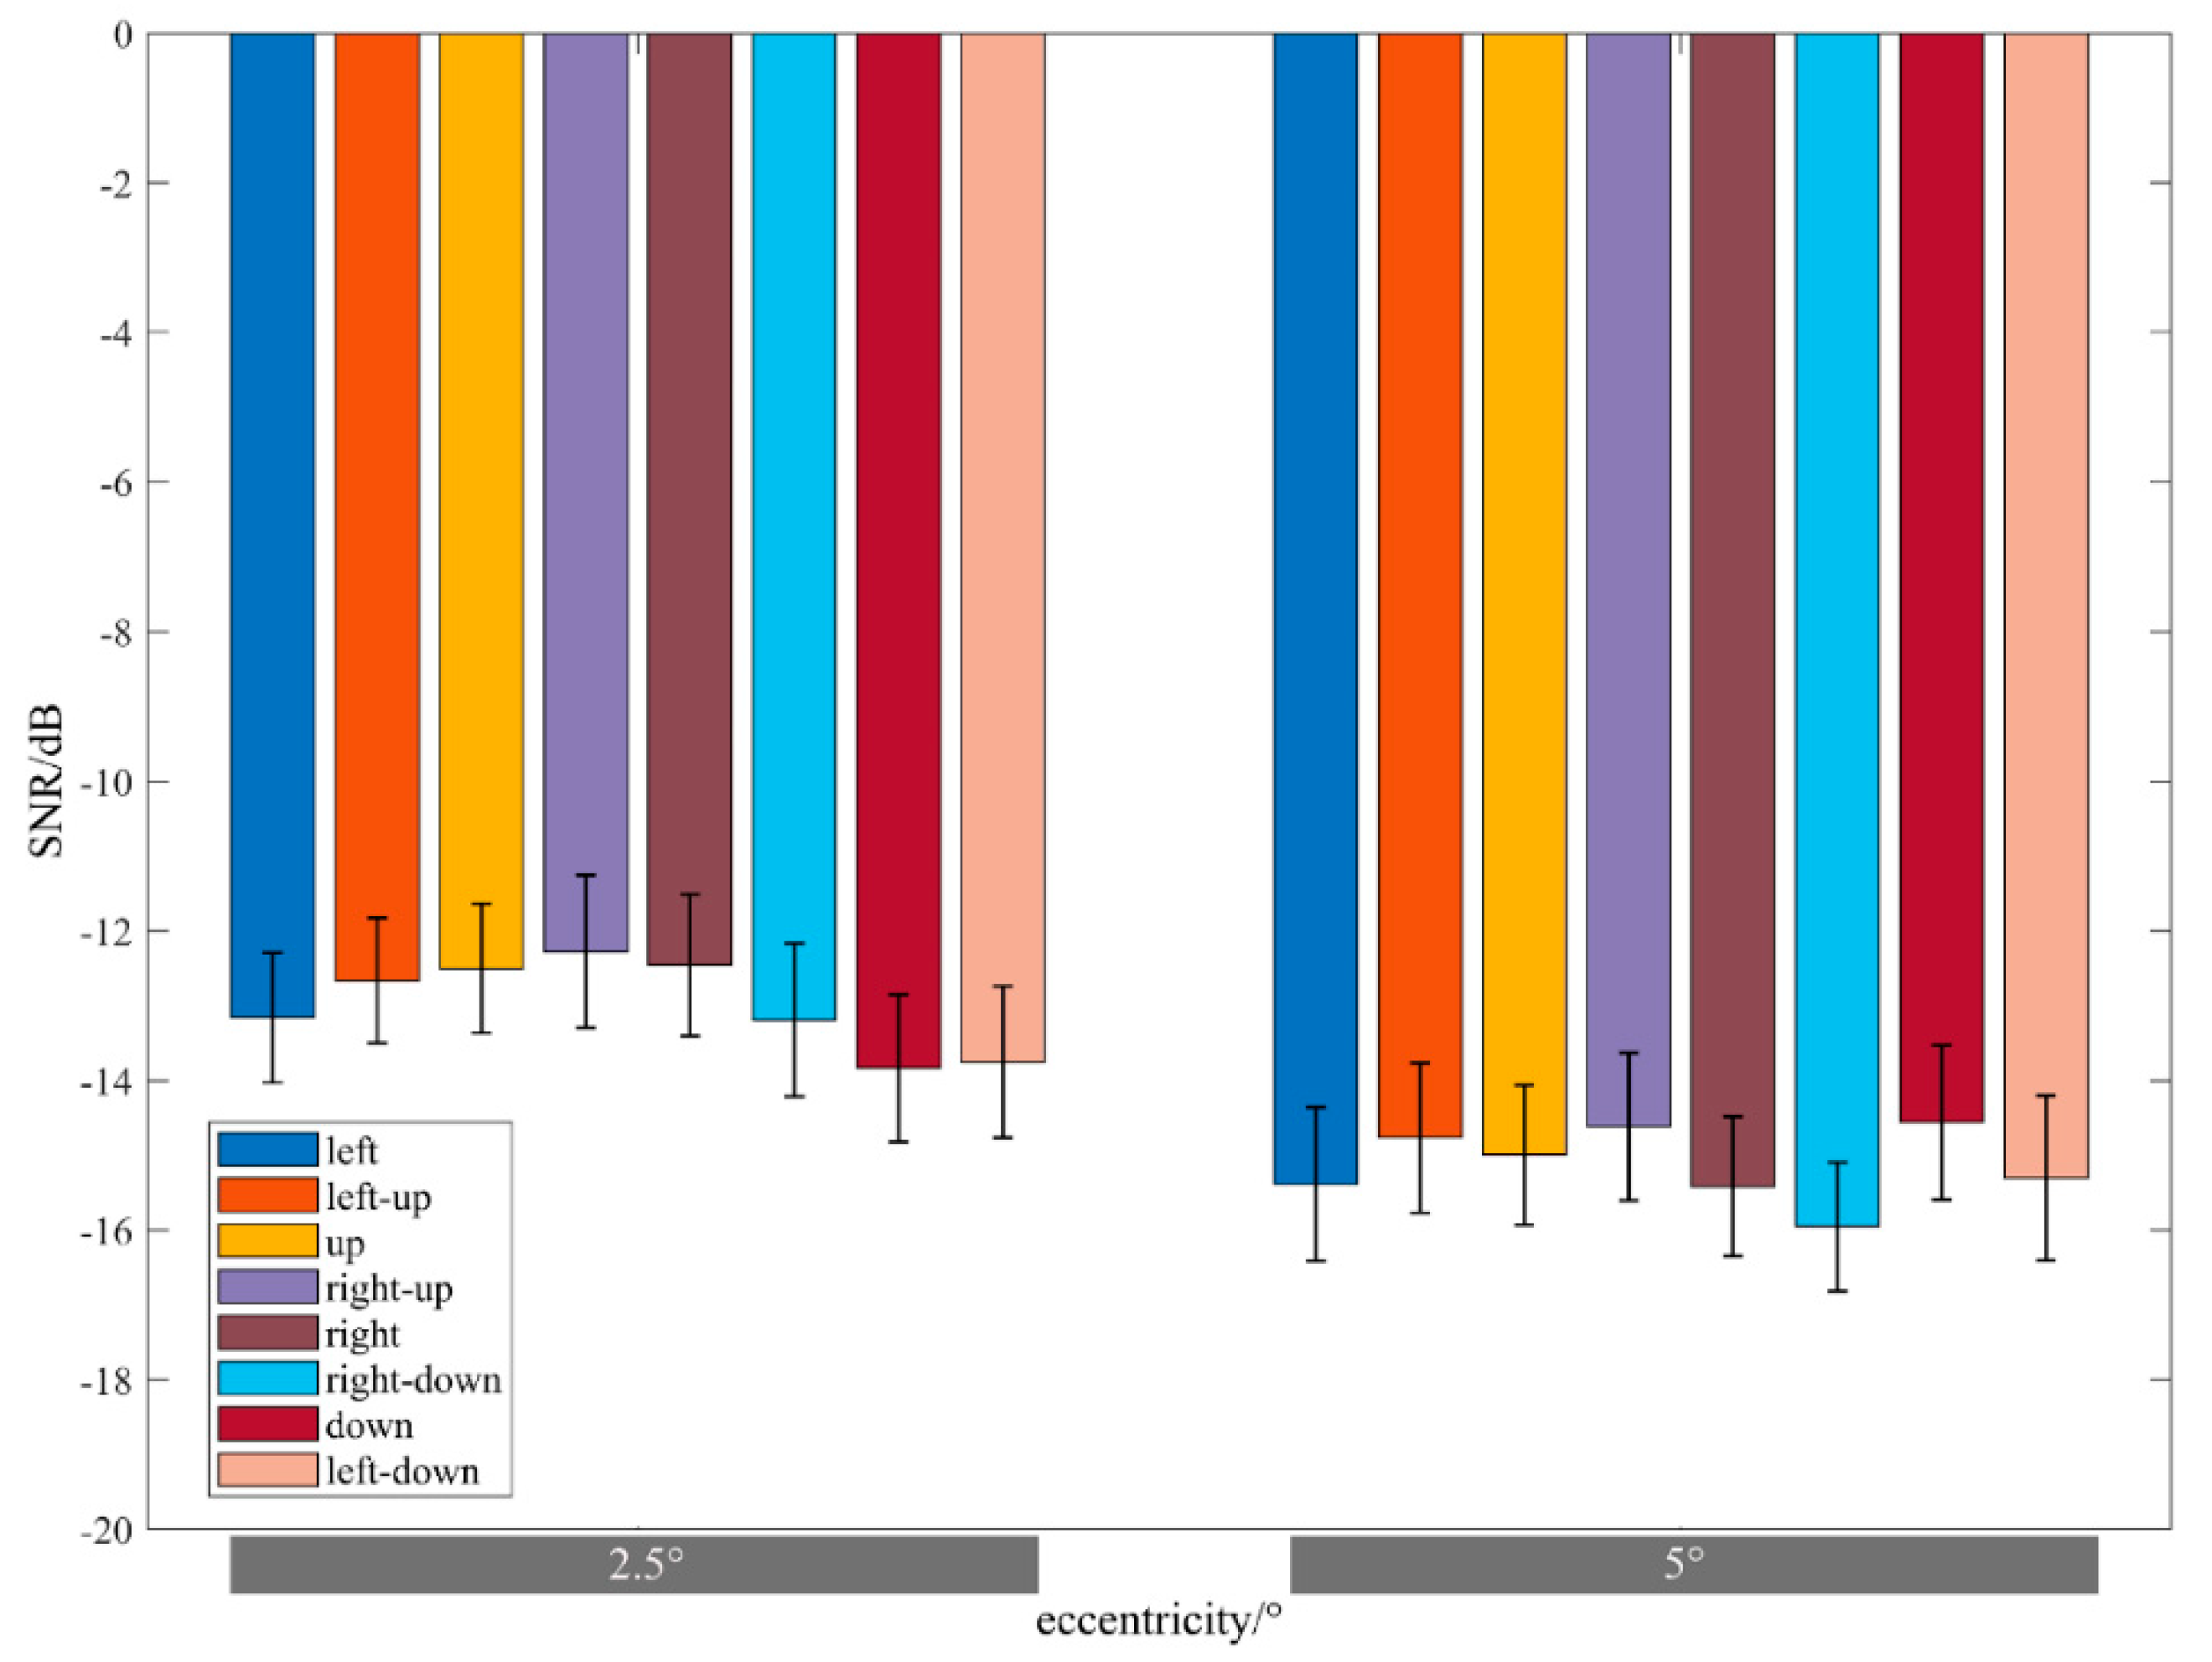
Figure 3 shows the SNRs when attending to targets at different eccentricities and directions. At the eccentricity of 2.5°, the SNRs are −13.2 ± 3.00 dB, −12.7 ± 2.83 dB, −12.5 ± 2.99 dB, −12.3 ± 3.46 dB, −12.4 ± 3.27 dB, −13.2 ± 3.52 dB, −13.8 ± 3.37 dB, and −13.8 ± 3.51 dB for left, left-up, up, right-up, right, right-down, down, and left-down, respectively. At the eccentricity of 5°, the SNRs are −15.4 ± 3.53 dB, −14.8 ± 3.06 dB, −15.0 ± 3.11 dB, −14.6 ± 3.41 dB, −15.4 ± 3.23 dB, −16.0 ± 2.97 dB, −14.6 ± 3.57 dB, and −15.3 ± 3.80 dB for left, left-up, up, right-up, right, right-down, down, and left-down, respectively. In addition, the baseline SNRs were also calculated from the EEG data recorded during the rest time when no flicker stimulus existed. The average baseline across participants is −20.5 ± 2.25 dB. Even when attending to targets at the eccentricity of 5°, SNRs were still much higher than the baseline, suggesting a robust SSVEP response.
RMANOVA showed a significant main effect of eccentricity on SSVEP SNRs (2.5° > 5°, F(1, 11) = 21.7, p = 0.001), suggesting SNRs decreased as the eccentricity increased. No significant main effect of the direction was found on SSVEP SNRs (F(7, 77) = 1.55, p = 0.214). Besides, no significant interaction effect was observed on SSVEP SNR (F(7, 77) = 1.72, p = 0.161).
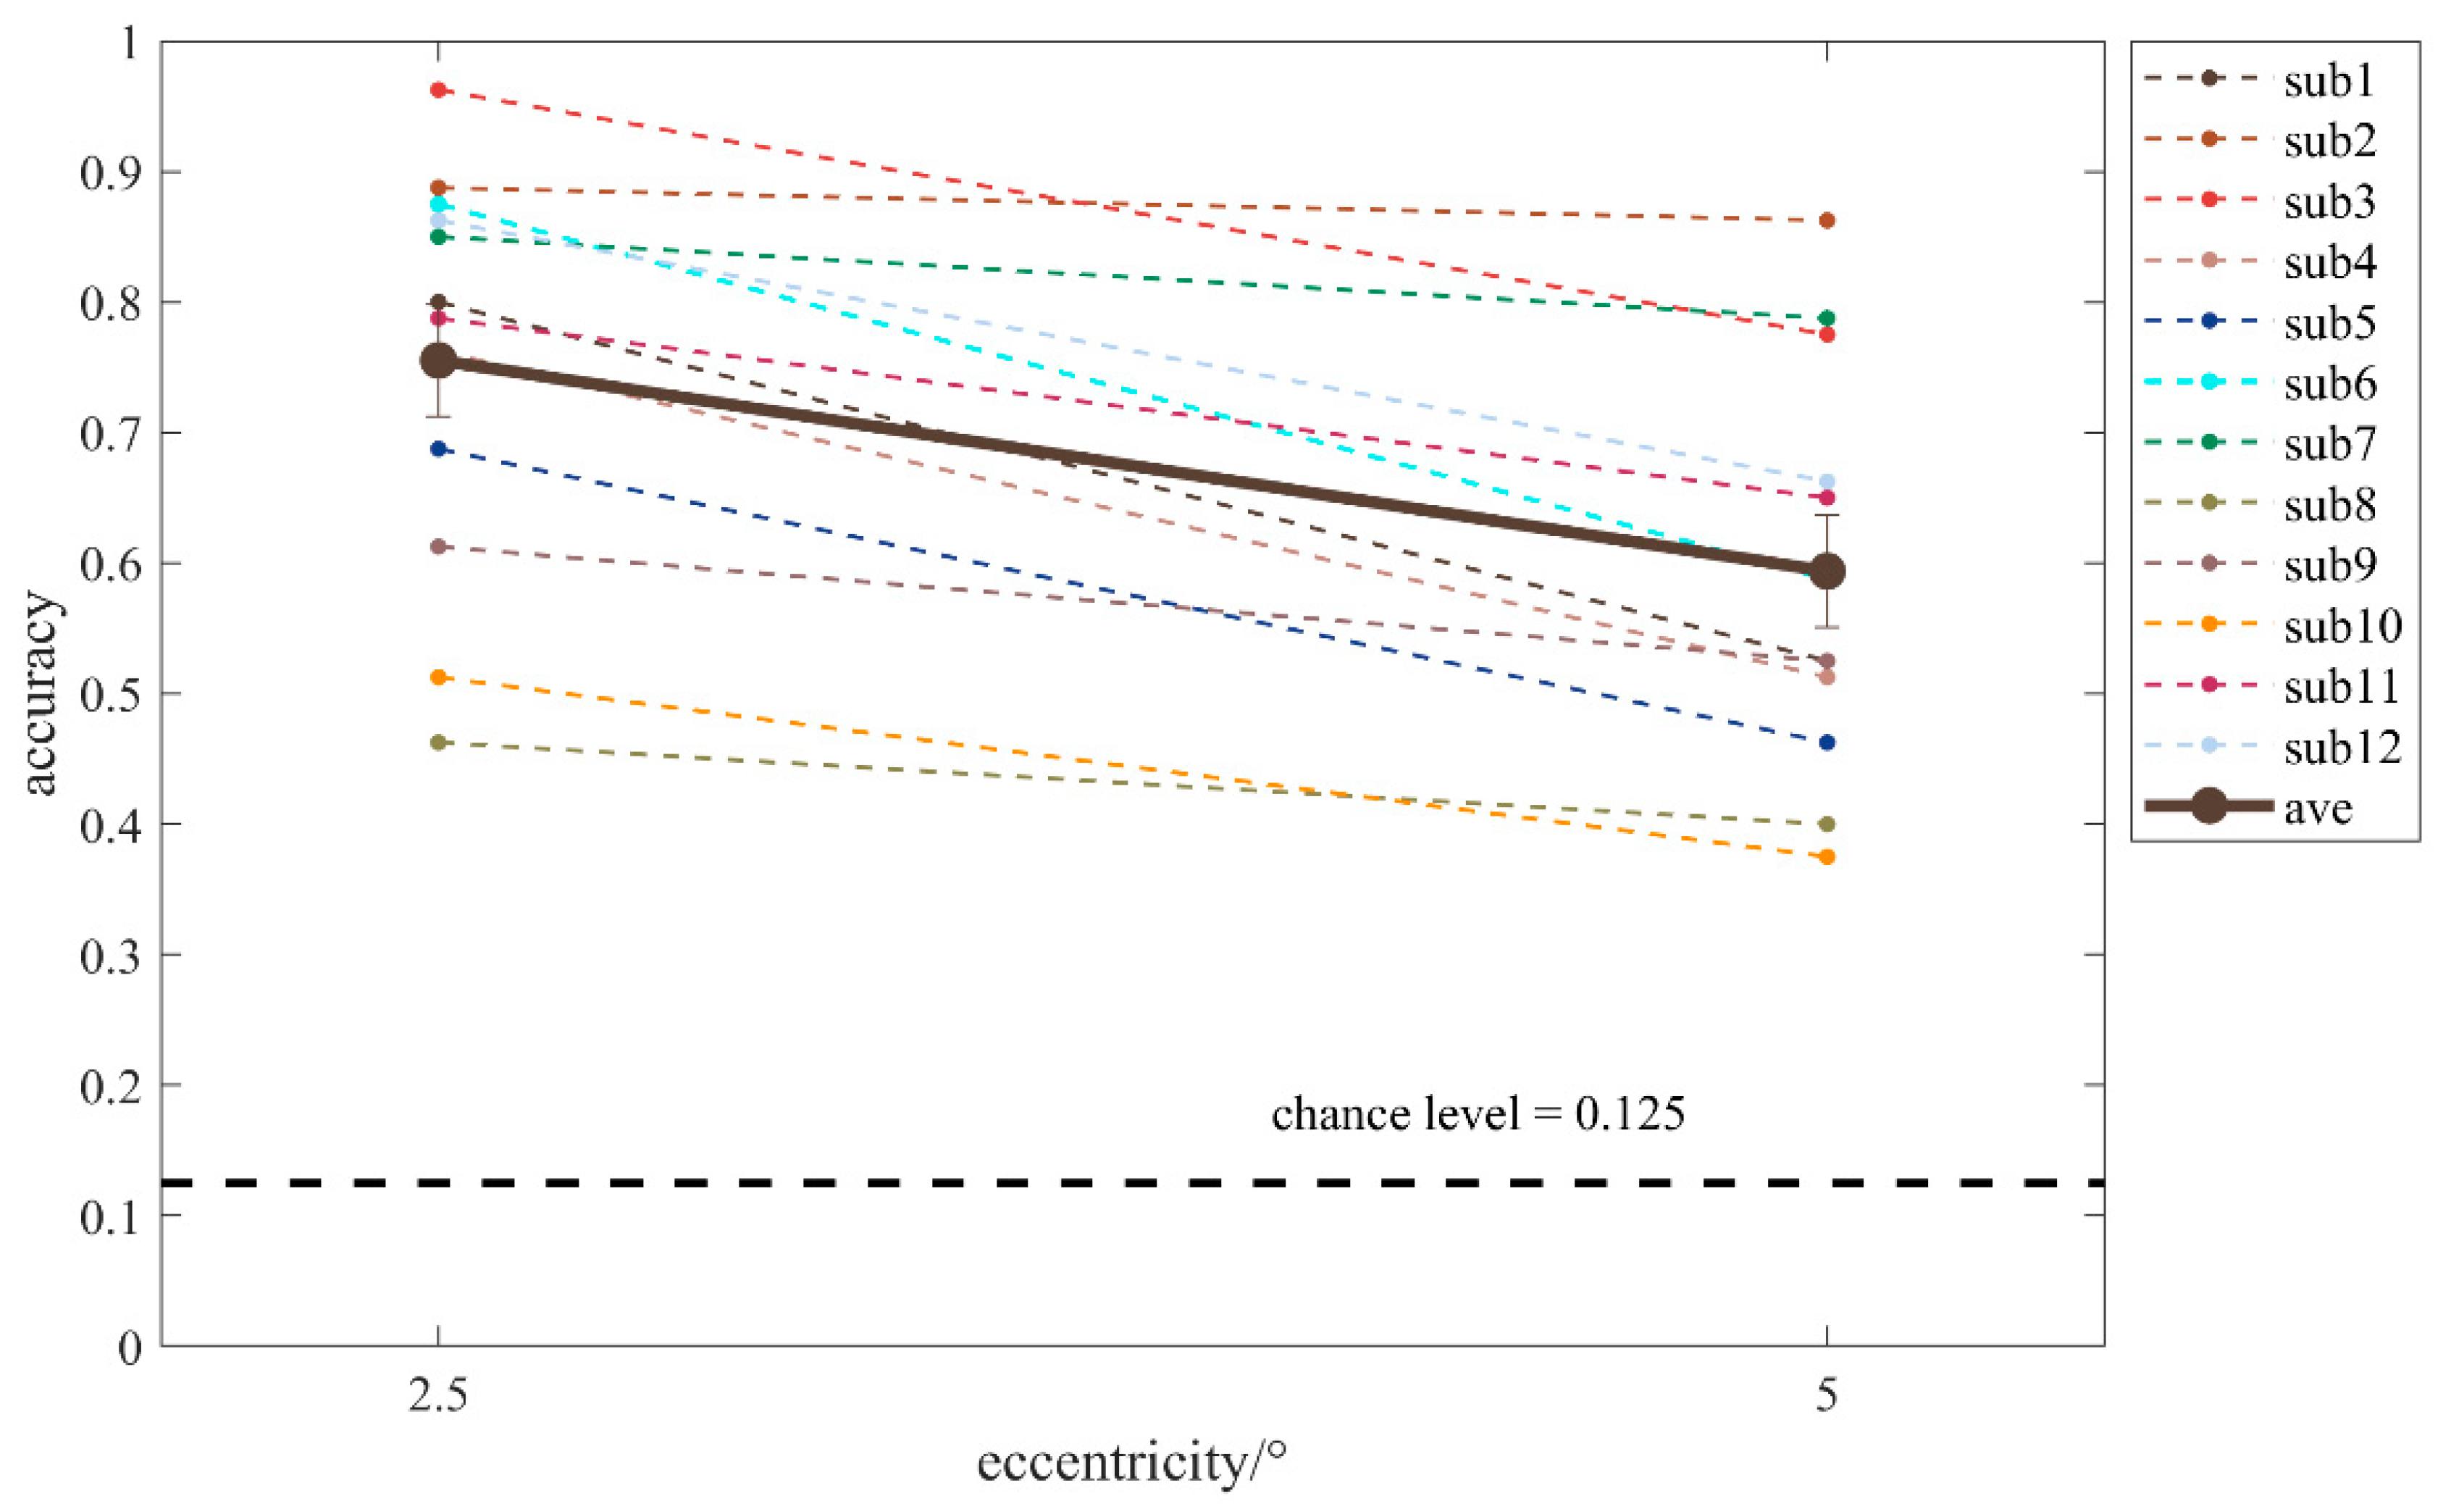
The 8-direction classification accuracies at the eccentricity of 2.5° and 5° are shown in
Figure 4. The accuracies were 75.5 ± 14.9% and 59.4 ± 15.0% at 2.5° and 5°, respectively. As shown, the classification accuracy is significantly reduced for the targets with the larger eccentricity with a paired
t-test (t(11) = 6.27,
p < 0.001).
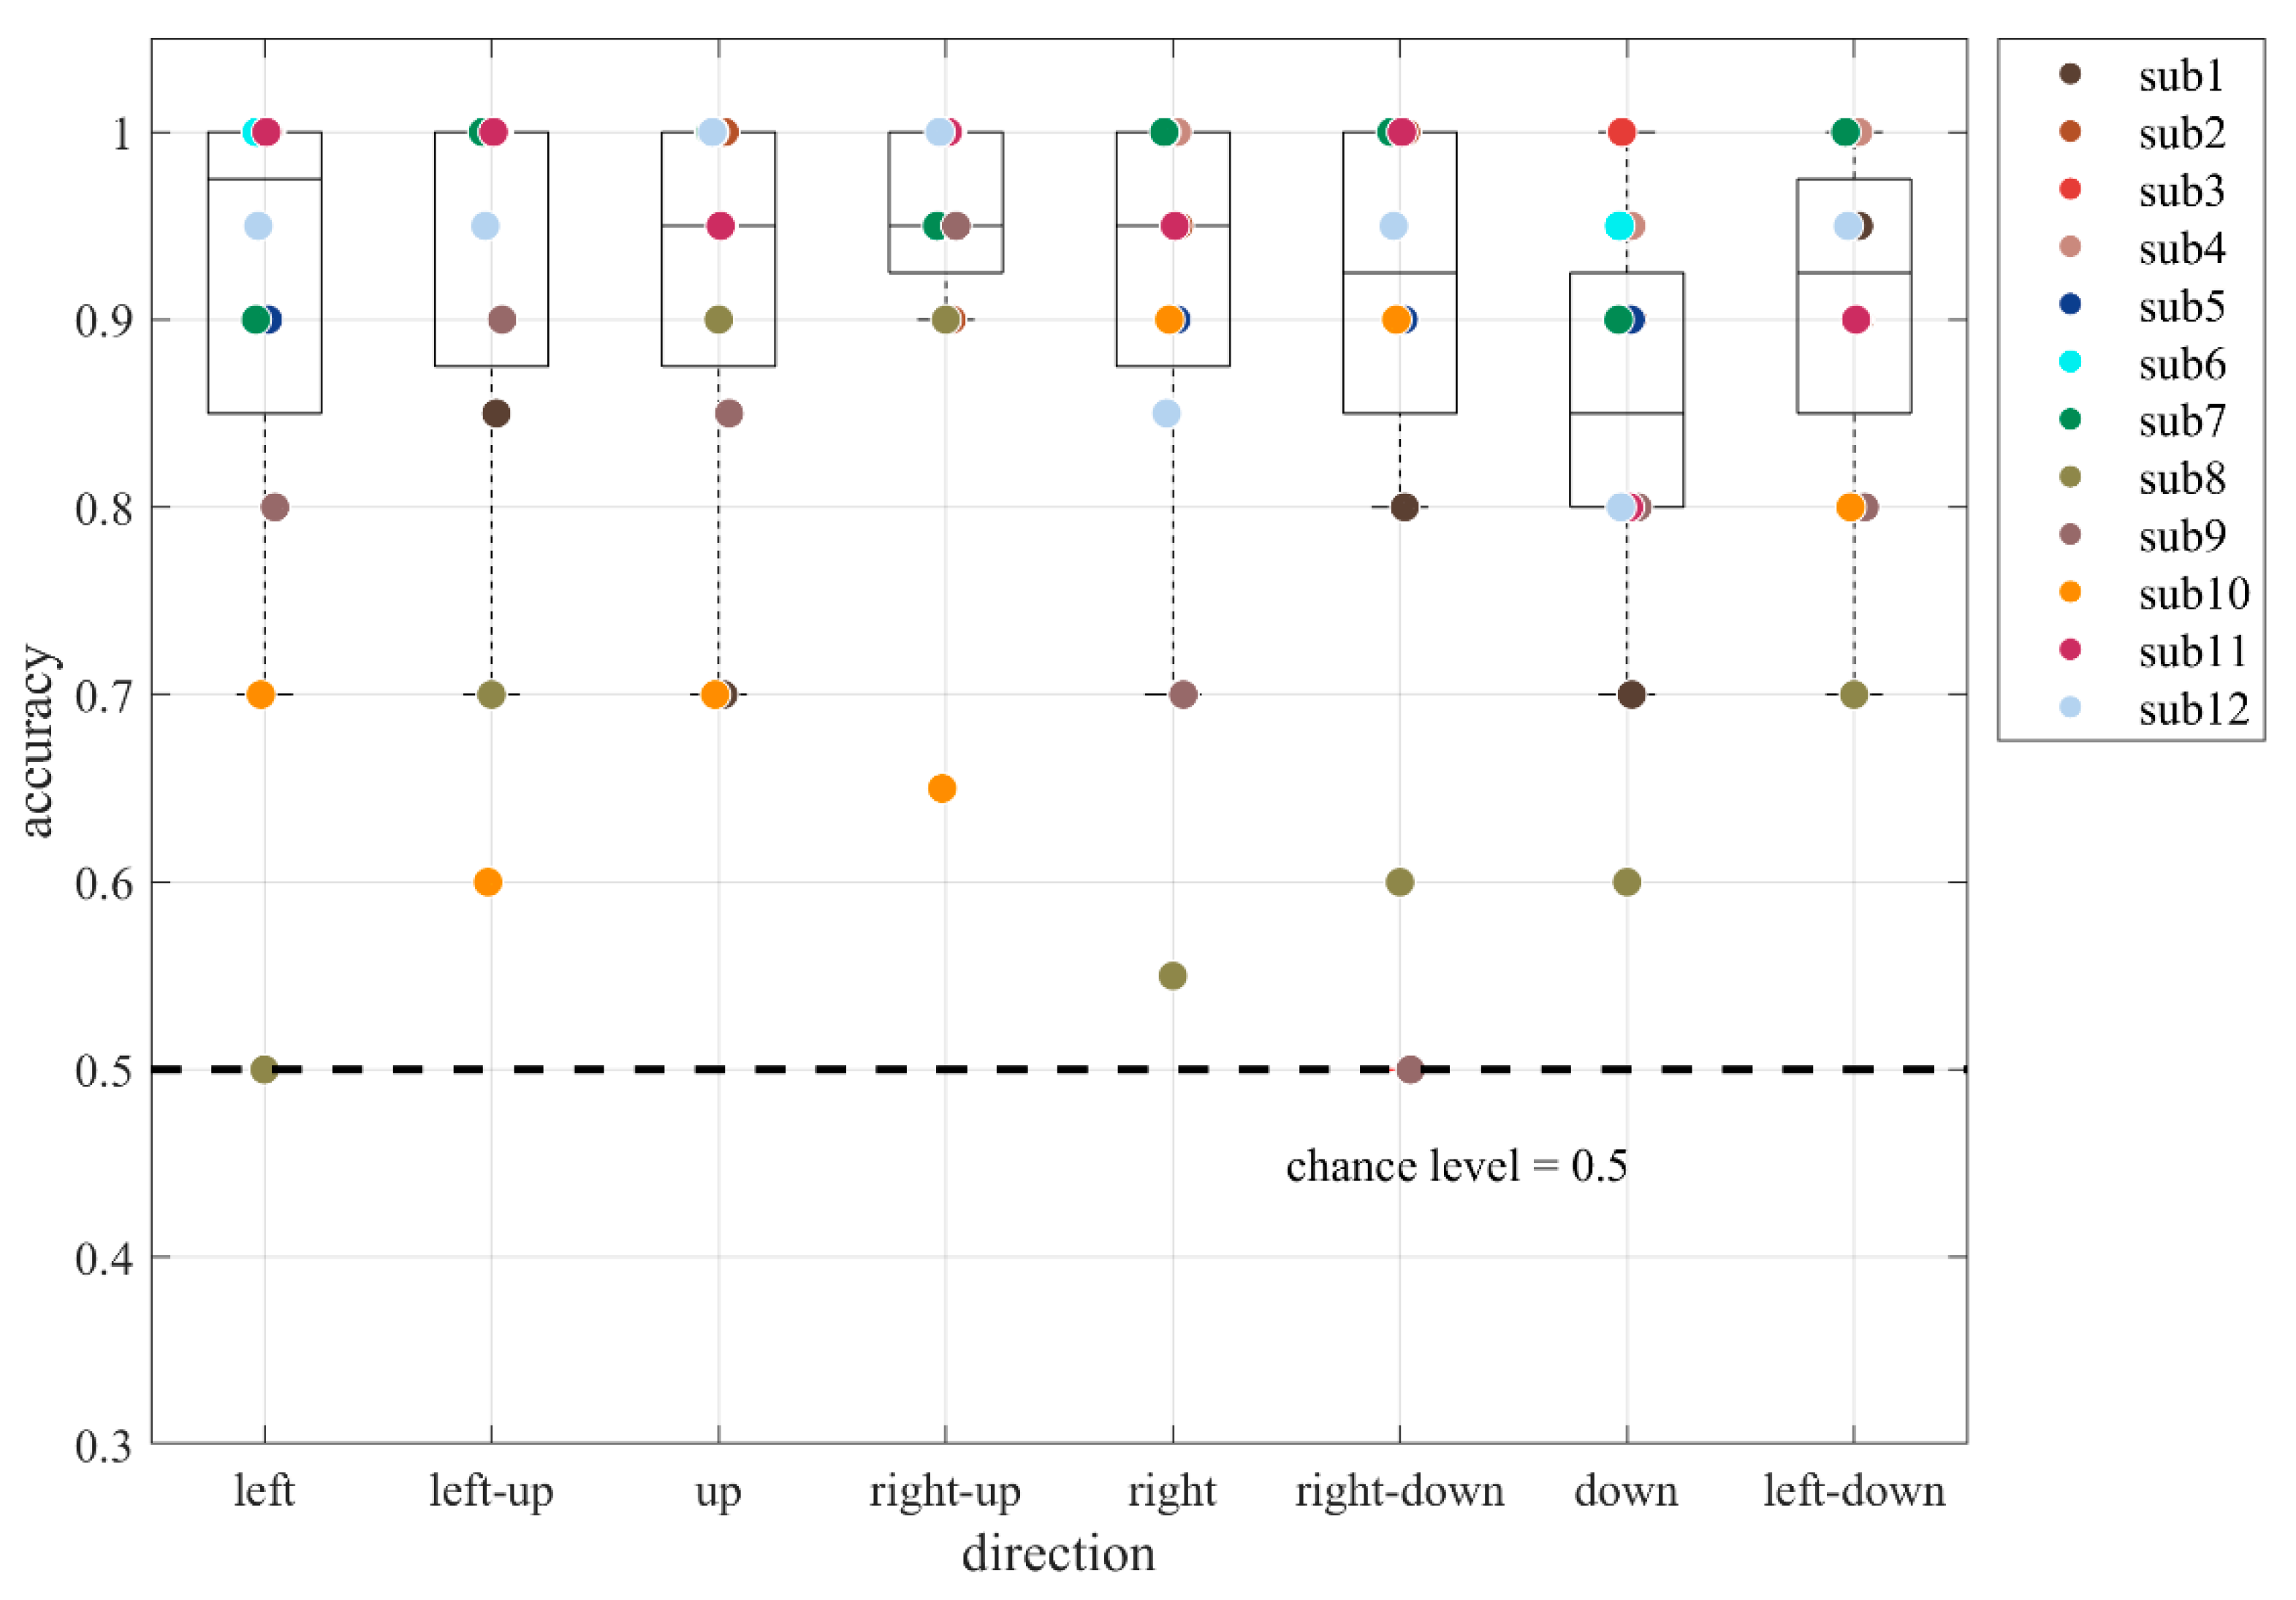
As reflected in
Figure 5, the 2-eccentricity classification achieved an accuracy of 89.6 ± 15.0%, 91.7 ± 10.7%, 89.6 ± 13.3%, 84.2 ± 11.0%, 91.7 ± 13.0%, 93.8 ± 9.38%, 87.9 ± 16.0%, and 90.4 ± 9.00% for left, left-up, up, right-up, right, right-down, down, and left-down, respectively. A RMANOVA was used to conduct a comparison and no significant main effect of the direction was found (F(7, 77) = 1.40,
p = 0.262).
The results so far demonstrated the feasibility of decoding directions and eccentricities separately. Then, the 16-target classification results, which decoded directions and eccentricities at the same time, are summarized in
Table 1. When using a 4-s data, the mean accuracy across participants is 66.8 ± 16.4%, well above chance level for the 16-target classification problem (i.e., 6.25%). Note that an individual difference could be found in classification accuracies, ranging from 38.8% to 90.0%.
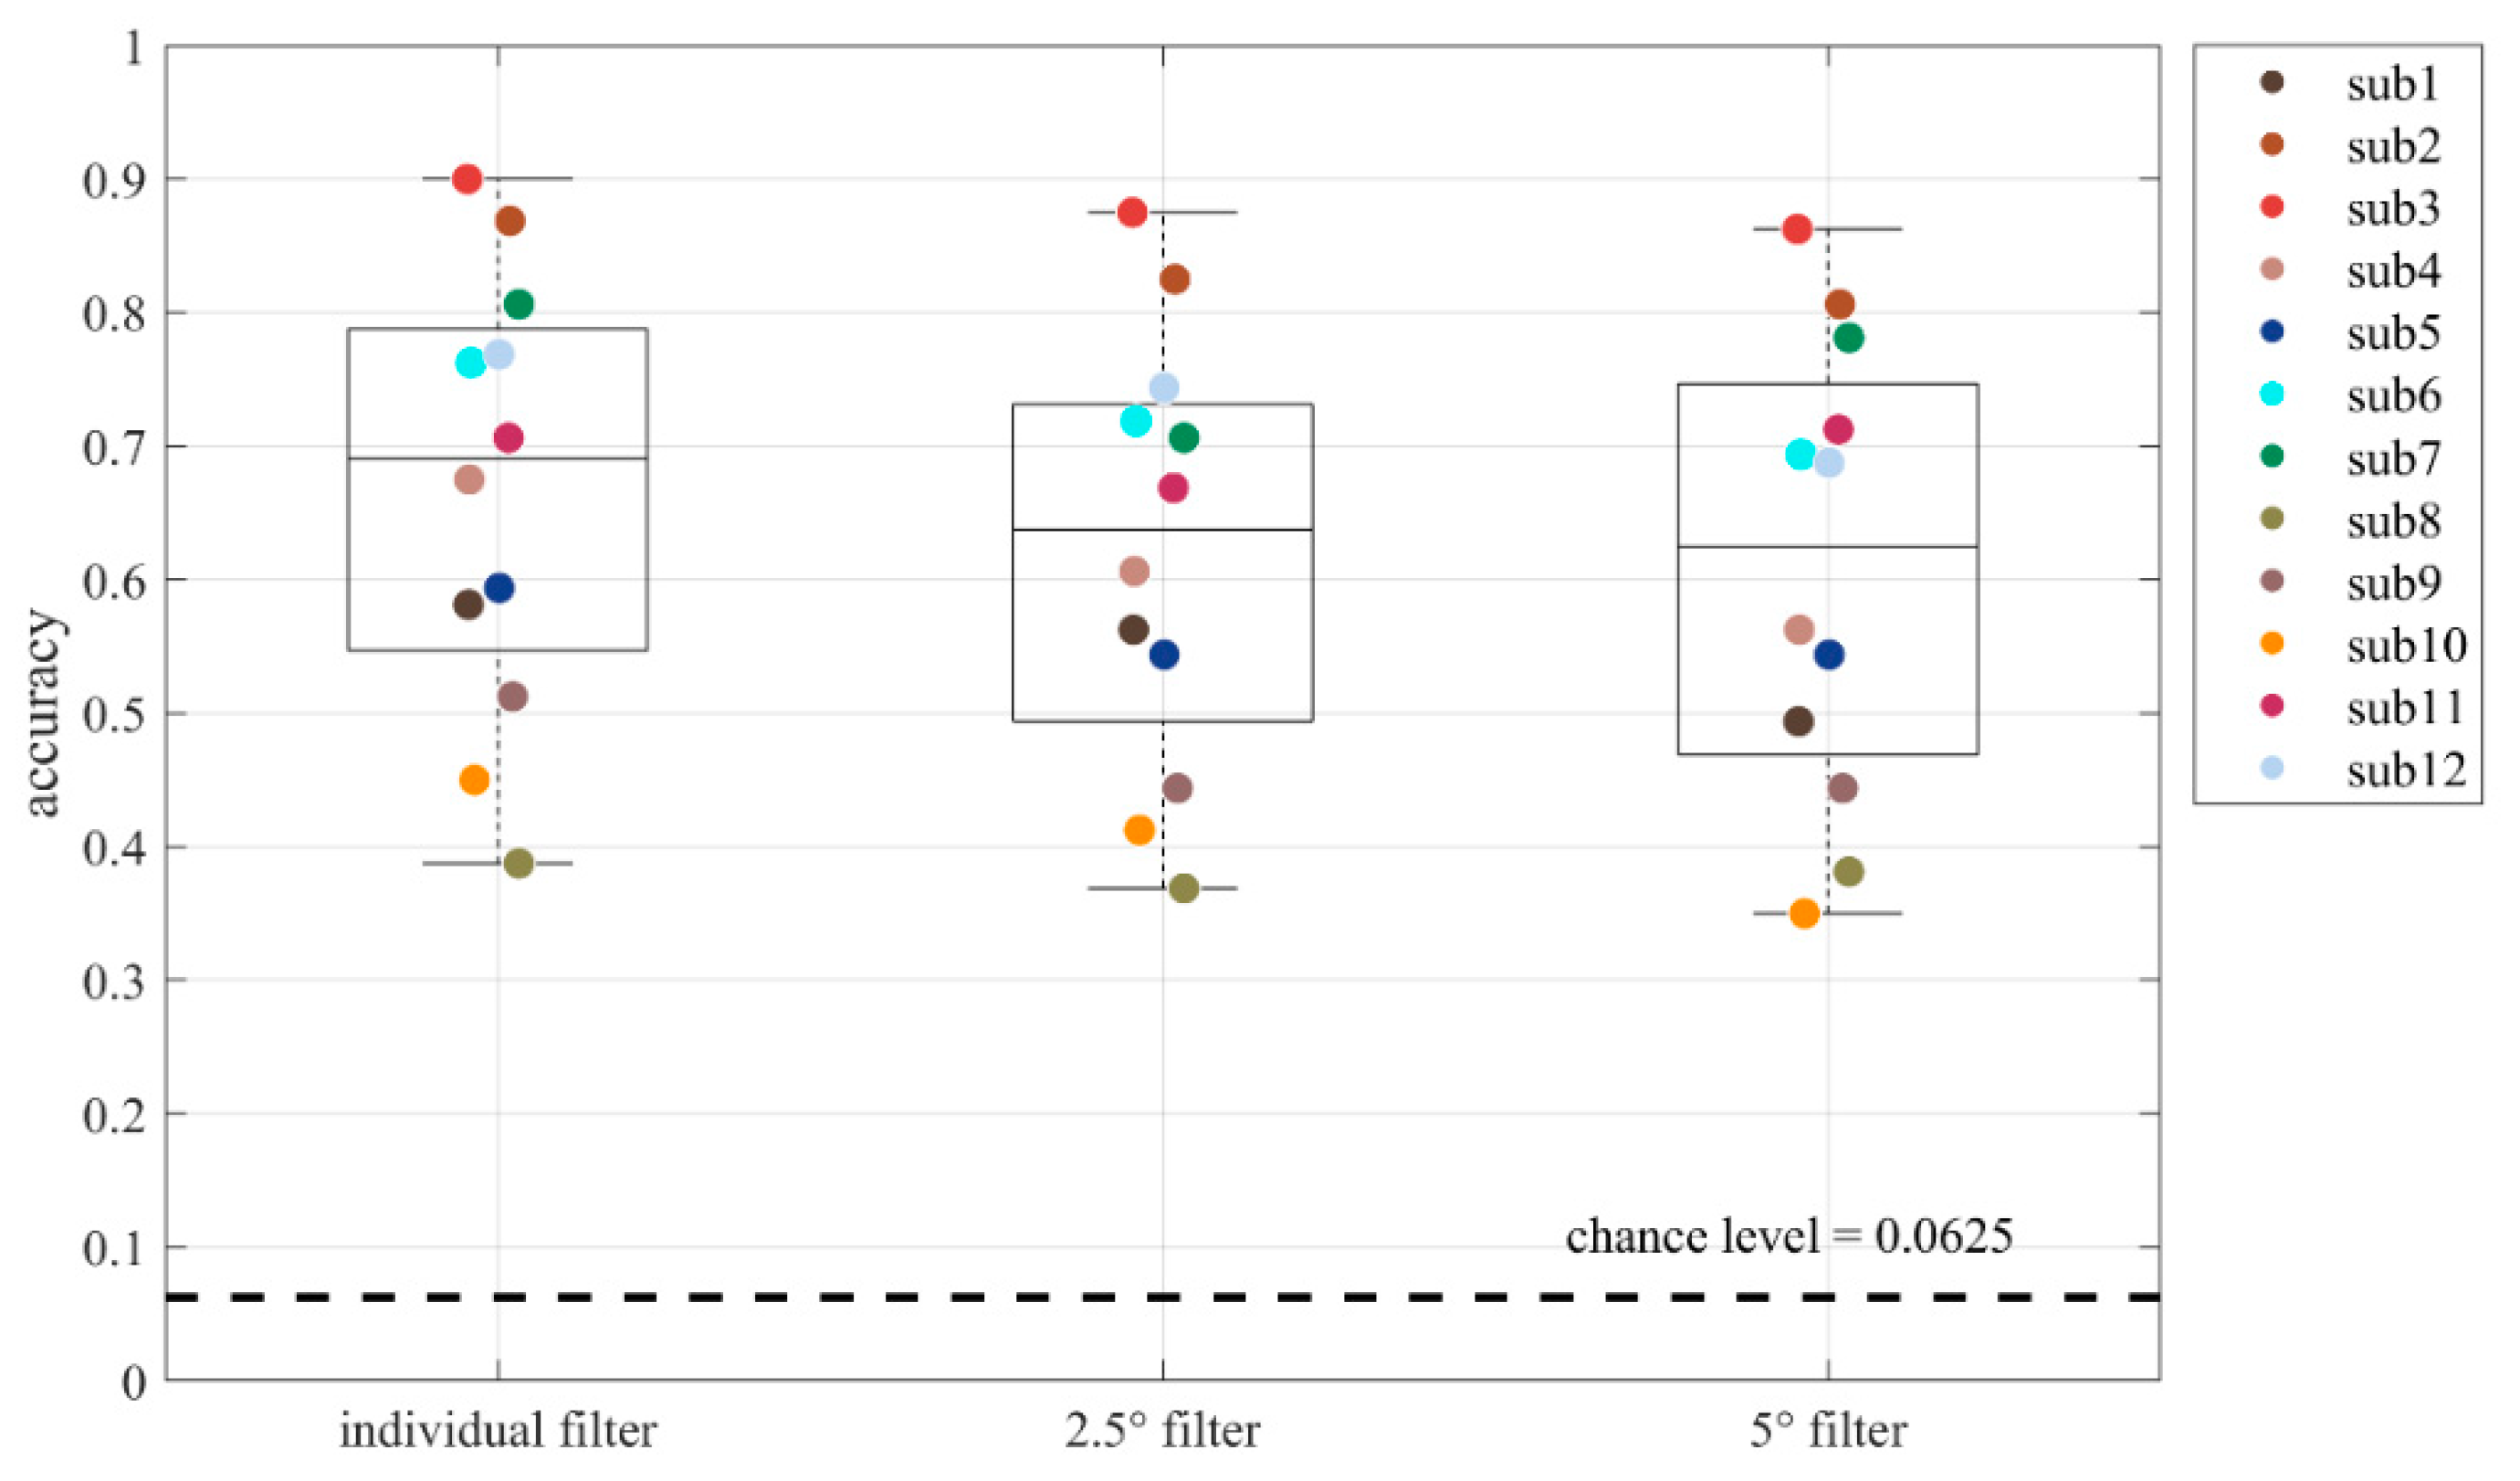
Then, accuracies obtained by using different spatial filters were shown in
Figure 6. The accuracies were 66.8 ± 15.7%, 62.3 ± 15.5%, and 61.0 ± 16.4% for individual filter, 2.5° filter, and 5° filter, respectively. A decreasing trend can be observed in three conditions. A RMANOVA was used to conduct a comparison. A significant main effect of the filter type was found (F(2, 22) = 17.4,
p < 0.001) and post-hoc tests with Bonferroni correction found significant difference between accuracies obtained in the individual filter condition and the 2.5° filter condition (
p < 0.001). Furthermore, although accuracies obtained in both conditions were higher than those from the 5° filter condition (individual filter > 5° filter,
p < 0.001); 2.5° filter > 5° filter,
p = 0.956), it should be noted that the absolute numbers of the accuracies are comparable.
Subsequently, we took a closer look at the classification results as well. First of all, the top panel of
Figure 7 demonstrates the confusion matrix for the 16-target classification (8 directions × 2 eccentricities) with individual filters. As shown, classification achieved better performance at the eccentricity of 2.5° than 5°. Most of the misclassification happened between the adjacent directions and eccentricities. Besides, when using spatial filters trained with data at the eccentricity of 2.5° or 5°, similar but lower performances could be obtained as demonstrated in the bottom panel of
Figure 7. Note that no matter in which filter condition, classifications at the eccentricity of 2.5° always outperformed those at the eccentricity of 5°.
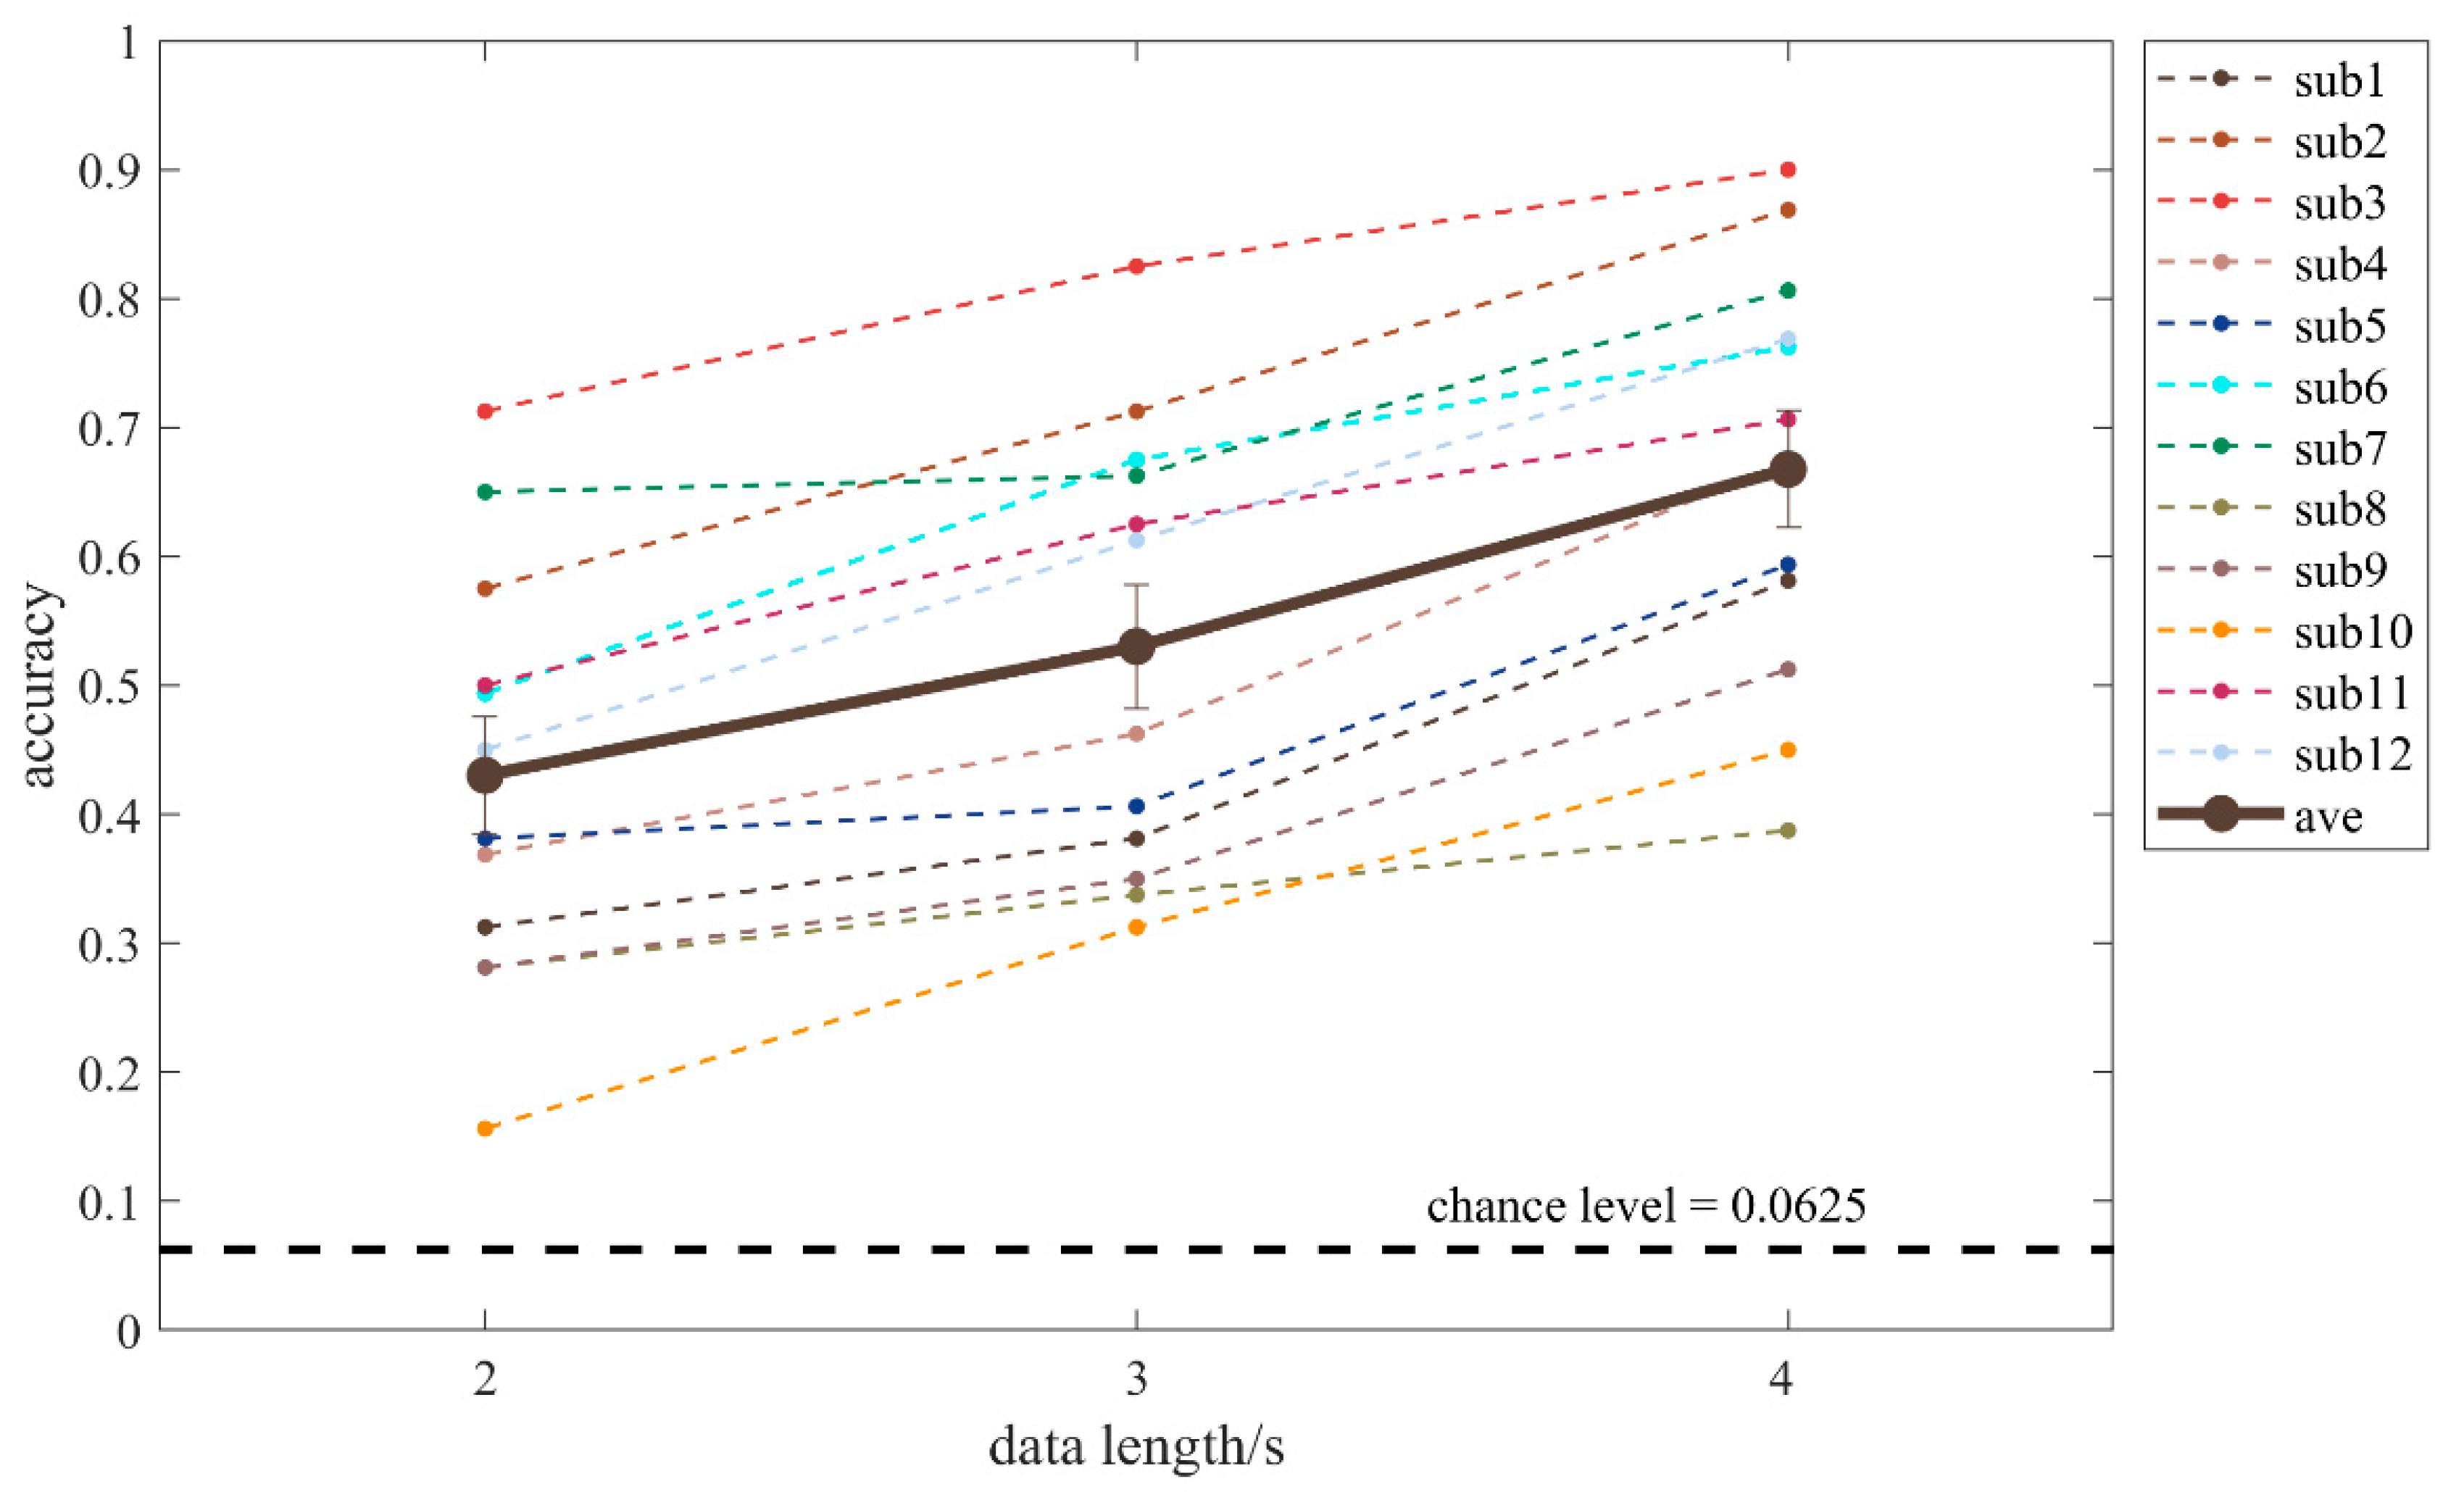
Finally, we also explored the effect of data length on BCI performance. Data from the first N seconds (N = 2, 3, and 4) within one trial were used to keep the number of trials the same among different conditions. As shown in
Figure 8, the accuracies were 48.6 ± 17.2%, 59.3 ± 15.5%, and 66.8 ± 15.7% for using data with a length at 2 s, 3 s, and 4 s, respectively. Although a decreasing trend could be observed, the 2-s data still provided accuracies well above chance level (
t-test, t(11) = 7.74,
p < 0.001).
4. Discussion
By encoding targets with visual direction and eccentricity information simultaneously, a single-stimulus 16-target SSVEP BCI was proposed in the present study. When participants attended to targets at different spatial directions and eccentricities relative to a single-flicker stimulus, distinct SNRs and spatial patterns of SSVEPs could be elicited. For the first time, visual eccentricity is considered as a classification label in SSVEP responses, and the classification results suggested the responses modulated by visual eccentricities can be recognized by a machine-classifier at a single-trial level, implying a possible real-time eccentricity decoding. Moreover, the offline 16-target classification achieved an average accuracy at 66.8% and the best accuracy at 90.0%, suggesting the feasibility of decoding visual direction and eccentricity information at the same time with only one stimulus. By utilizing the visual direction and eccentricity information simultaneously, the proposed single-flicker BCI has increased the number of targets to 16, which is by far the largest number of targets reported in spatially-coded SSVEP BCIs. Unlike the frequency-coded BCI paradigms in which targets have to be combined with stimuli in advance to make commands, this spatially-coded single-stimulus design managed to separate the stimulus and targets so that it is possible to place the targets in a more flexible way and be applied in scenarios where the number and locations of targets could change. Besides, instead of staring at the stimuli, participants only need to focus on the non-flickering targets with our paradigm, which fits the daily interaction habits better. Together with the augmented reality and computer vision technology, this paradigm is expected to achieve visual information decoding in a more natural way. For example, when users are walking on the street with Google Glass, the proposed BCI system is able to find out which store the users are looking at and feedback its discount information.
The present study also investigated how the visual eccentricity information contributed to this spatially-coded paradigm. First of all, when attending to targets at increased eccentricities, the corresponding reduced SNRs and decreased 8-direction classification accuracies suggested a weaker response along with the larger eccentricity. Furthermore, this decrease of SSVEP responses could be a contributing feature for the eccentricity decoding, supported by the 2-eccentricity classification accuracies ranged from 84.2% to 93.8% in 8 directions. Then, the 8-direction classification accuracies at 5° were found to achieve an accuracy of 59.4 ± 15.0%, much higher than chance level. More importantly, compared with those classifications using spatial filters trained from their corresponding eccentricities, the 16-target classification accuracies, though significantly decreased, still remained comparable when using spatial filters from data with an eccentricity of 5°. These classification accuracies provide evidence in support of the weaker yet stable spatial patterns across eccentricities. Taken together, our results suggested that the decreased SSVEP responses and relatively stable spatial patterns provided the neural basis of the joint decoding of visual eccentricity and direction information, supporting the feasibility of the visual eccentricity information as an encoding dimension in spatially-coded BCIs. Besides, it should also be noted that the feasibility of transferring spatial filters across eccentricities bears the potential to reduce training time, since it is possible to train targets at a certain eccentricity, while using targets at multiple eccentricities for online tasks.
We noticed individual differences in the classification performance, which may be explained by the variation of SSVEP signal quality across subjects (see the standard errors in
Figure 3). This phenomenon has been observed in previous SSVEP BCI studies as well [
16,
25,
26]. What is more, it should be noted that the stimulus in this study was not presented in the center of the visual field, leading to a smaller visual burden but relatively weak SSVEP responses [
19,
27]. As suggested in a previous high-frequency SSVEP study about BCI demographics, the relatively weaker response may result in a larger individual difference [
28]. Therefore, the present study provided the extrafoveal evidence of individual differences in SSVEP responses as a supplement for findings based on the central vision stimulation.
Instead of pursuing the boost of communication speed, we proposed a new paradigm to optimize the user interface for applications. However, while participants do not need to stare at the stimuli and are able to control the system with a low visual load, the evoked SSVEP responses are relatively weak, leading to a lower performance when compared with a conventional SSVEP paradigm. In order to achieve an online practical system, it is necessary to find a balance between the user-friendliness and the system performance by improving the average accuracies. As reported in [
29], the signal quality of the dataset will influence the estimate of covariance matrices in the CCA-based methods. Therefore, due to the relatively weak SSVEP responses in the proposed paradigm, the obtained spatial filters in the present study may be not as effective as those from traditional SSVEP studies [
30], where the stimuli were directly attended. Consequently, a relatively longer time is needed to make a reliable classification. Therefore, the improvement of classification performances is expected to be achieved by further optimization of the spatial filters. First of all, by constructing spatial filters to make the neural patterns evoked by stimulus at different locations more distinguishable with methods like common spatial patterns [
31] and DCPM [
32], it is possible to enhance the recognition performance in the proposed paradigm. Furthermore, as an increasing training sample size is expected to boost the classification accuracy in CCA-based methods [
30], using more training trials for each direction or exploiting of the training data from other subjects may also improve the average accuracy.
As the first step to evaluate the feasibility of eccentricity decoding in SSVEP responses, there are other issues needed to be discussed. Firstly, only two eccentricities were included in the present study. As the next step, it would also be worthwhile to evaluate whether more eccentricities could be decoded and whether it is possible to increase the target number further in this paradigm. Moreover, as we only utilize one stimulus frequency, it should be tested whether our finding could be generalized to other frequencies or whether there is an optimal frequency for the classification. Finally, since the proposed SSVEP BCI system demonstrated that only one flicker stimulus is sufficient to encode 16 output channels, it should be studied whether by incorporating multiple stimuli, it might be possible to further increase the target number and cover a larger visual field.

 ,
, 


