Article

High-Level Synthesis of Multiclass SVM Using Code Refactoring to Classify Brain Cancer from Hyperspectral Images

1
Institute for Applied Microelectronics (IUMA), University of Las Palmas de Gran Canaria (ULPGC), 35017 Las Palmas de Gran Canaria, Spain
2
Department of Electrical, Computer and Biomedical Engineering, University of Pavia, 27100 Pavia, Italy
*
Author to whom correspondence should be addressed.
Electronics 2019, 8(12), 1494; https://doi.org/10.3390/electronics8121494
Submission received: 29 October 2019 / Revised: 24 November 2019 / Accepted: 3 December 2019 / Published: 6 December 2019
(This article belongs to the Special Issue Recent Advances in Embedded Computing, Intelligence and Applications)

Abstract

:
Currently, high-level synthesis (HLS) methods and tools are a highly relevant area in the strategy of several leading companies in the field of system-on-chips (SoCs) and field programmable gate arrays (FPGAs). HLS facilitates the work of system developers, who benefit from integrated and automated design workflows, considerably reducing the design time. Although many advances have been made in this research field, there are still some uncertainties about the quality and performance of the designs generated with the use of HLS methodologies. In this paper, we propose an optimization of the HLS methodology by code refactoring using Xilinx SDSoCTM (Software-Defined System-On-Chip). Several options were analyzed for each alternative through code refactoring of a multiclass support vector machine (SVM) classifier written in C, using two different Zynq®-7000 SoC devices from Xilinx, the ZC7020 (ZedBoard) and the ZC7045 (ZC706). The classifier was evaluated using a brain cancer database of hyperspectral images. The proposed methodology not only reduces the required resources using less than 20% of the FPGA, but also reduces the power consumption −23% compared to the full implementation. The speedup obtained of 2.86× (ZC7045) is the highest found in the literature for SVM hardware implementations.

1. Introduction

High-level synthesis (HLS) methodologies allow hardware (HW) designers to increase the abstraction level and accelerate the automation for the synthesis and verification of the design process. The current rise in the complexity of the applications and the increment of the capabilities of silicon technologies, as well as the so called time to market constrain, make HLS methodologies and tools of mandatory use in the near future [1]. Due to the multiple commercial solutions that can be found in the market for multiprocessor system-on-chips (MPSoCs) nowadays, it is strictly necessary to improve its techniques and methodologies [2] so that the technology is able to deal with the multiple implementation possibilities by using high-level design [3,4].
Some implementations of support vector machine (SVM) classifiers in field programmable gate arrays (FPGAs) have been released in different applications, such as image processing [5,6], automotive [7], medical [8,9], and data signal processing [10,11], among others. These implementations use different platforms depending on the application and the desired accuracy and timing. For readers who are interested in different implementations using diverse devices and including not only a training implementation but also a classification one, we recommend [12], where the authors review the state-of-arts of SVM implementations using different types of FPGAs. Another interesting research from the same authors is a SVM classifier for melanoma detection using a Zynq® device (ZC7020) and HLS methodology. The dataset employed is based on traditional RGB (red, green, and blue) images and the generation of a binary SVM model, having an output of the class as 1 (melanoma) and −1 (non-melanoma) [13]. The implementation depended on directives used directly in Vivado HLS without code refactoring. Finally, it is relevant to take into account that, in every implementation, the communication between the software (SW) and the hardware (HW) parts in an embedded system represents a relevant bottleneck to be solved, especially when using data with high storage and data transfer requirements, e.g., hyperspectral image processing. For example, in [14], the different stages of an Least-Squares Support Vector Machine (LS-SVM) implementation using a Zynq device is approached, separating the code of the algorithm into different parts, depending on the communications necessary for each part. In consequence, some parts are more suitable to be computed using the Advanced RISC Machines (ARM) processors than implementing them in the programmable logic (PL) part. For this reason, it is mandatory to know the code in detail, and to identify the parts (loops and sequential code) that are suitable to be accelerated in the embedded system.
Hyperspectral imaging (HSI) integrates conventional imaging and spectroscopy methods to obtain both spatial and spectral information of a scene [15]. While a conventional RGB (red, green, and blue) image only records three spectral bands in the visible spectrum (380–740 nm), HSI is able to obtain spectral information within and beyond the human eye [16]. Hyperspectral (HS) sensors are capable of capturing a very large number of contiguous spectral bands, measuring the radiation reflectance, absorbance, or emission of the material that is being captured. At the end, a vector of radiance values for each pixel of the image (called the spectral signature) is obtained [15], allowing the automatic identification of the materials presented in the scene through image processing algorithms [17]. HSI is a non-invasive and non-ionizing technique that supports the rapid acquisition and analysis of diagnostic information in several fields, such as remote sensing [18,19], drug identification [20,21], forensics [22,23,24], food safety inspection, and control [25,26,27], among many others. In the medical field, several studies can be found in the literature where HSI is applied to different medical applications [28,29,30]. Particularly, many research groups have investigated the use of HSI for surgical applications, especially for cancer analysis [31,32], such as laparoscopic HS imaging [33], the differentiation of breast cancerous and non-cancerous tissue [34], the identification of tongue cancer of in vivo human samples [35], intestinal ischemia identification [36], prostate cancer detection [37], gastric cancer delineation [38], head and neck cancer classification and delineation [39,40], among others.
In this paper, an evaluation of code refactoring and SDSoCTM (Software-Defined System-On-Chip) design methodology and implementation is performed, using both binary and multiclass SVM classifiers for hyperspectral imagery. To test the implementation design flow, the SVM codes were modified to increase the speed up and were tested in two different Zynq devices. Our proposed methodology could provide a reliable solution to accelerate the processing of hyperspectral data in several medical applications, in particular for the intraoperative brain cancer detection application.
This paper is organized as follows. In Section 2, the most relevant specifications of the research work are described, such as the devices (Zynq), the electronic design automation tool (SDSoC), and the basis of the SVM classifiers. In addition, a summary of the hyperspectral dataset employed in this work is detailed. In Section 3, a detailed explanation of the code refactoring of the binary and the multiclass SVM classifiers is provided, together with an explanation of the used methodology. This paper concludes including the experimental results in Section 4 and outlining the conclusions in Section 5.

2. Materials and Methods

This section is intended to briefly describe the tools and platforms employed for the development of this work, as well as the methodology followed for the implementation of the algorithms using HLS. Furthermore, the hyperspectral dataset employed for the experiments is described.

2.1. Zynq-7000 SoC Device from Xilinx

The Zynq is an SoC (system-on-chip) provided by Xilinx [41]. All versions have the same processing system (PS) features, a dual-core ARM Cortex A9 (ARMv7-A architecture), 32 KB Level 1 cache for instructions, and 32 KB Level 1 cache for data. The two cores share a 512 KB L2 cache and a 256 KB on-chip memory (OCM). The basic clock frequency for the PS part of this platform is 667 MHz, but some specific versions can reach 1 GHz. The programmable logic (PL) part can access the DDR memory, the OCM memory, and the L2 cache in the PS via AXI interfaces, with coherency behavior through the Accelerated Coherency Port (ACP). The resources of the PL part depend on the version selected. In this paper, two Zynq versions were selected: a ZC7020 in a ZedBoardTM Evaluation Kit [42] and the ZC7045 in a Xilinx Zynq-7000 SoC ZC706 Evaluation Kit [43]. These devices prevent the designer from wasting excessive HW or SW design time, increasing the communication performance between the two parts by using the provided communication interfaces, but sometimes some modifications are required to get an appropriate HLS implementation. The transactions between the PL and the PS parts suppose a relevant challenge for the designer and dramatically affect the final system performance.
The ZC706 board uses the XC7Z045 SOC and 1 GB DDR3 RAM among other resources. The XC7Z045 includes the standard SW configuration (PS part) for a generic Zynq device, and the PL part contains a Kintex-7 architecture with 350 K logic cells, 218.6 K LUTs (Look Up Tables), 437.2 K FFs (Flip Flops), 19.2 Mb BRAM (Block RAM), and 900 DSPs (Digital Signal Processors) (18 × 25). The ZedBoard uses the XC7Z020 SOC and 512 MB DDR3 RAM. The XC7Z020 contains an Artix-7 architecture with 85 K logic cells, 53.2 K LUTs, 106.4 K FF, 4.9 Mb BRAM, and 220 DSP (18 × 25). Both devices include the same SW part, but do not use the same architecture. In this work, both devices were used to check if it is worth using the most expensive SOC for the application.
In a data-intensive embedded system, the designer needs to deal with the communication bottleneck, not only with the HW implementation but also with the SW communication. The Zynq provides dedicated and well-defined data bus communications between both parts, including SW and HW parts, in one device. Moreover, the design tools created by the manufactures provide the designers with efficient mechanisms to save time in the final implementation. Such tools provide libraries and methods to communicate the two parts and create the final implementation in a reasonable amount of time.

2.2. SDSoC Development Environment by Xilinx

SDSoC is a tool developed by Xilinx that provides the designer with the possibility of creating complete embedded systems from C or C++ code using Zynq devices as the target system. This type of tools provides new features over the traditional HLS tools, which are of high interest in the research community [44,45]. SDSoC includes a system compiler that analyzes the code in order to determine the data flow between the PS and PL parts, and provides the designer with a complete system. SDSoC invokes Vivado to create the system and Vivado HLS to create the IPs for the desired accelerated functions. Then, SDSoC includes the accelerated functions and the Data Movers IP (Intellectual Property) for data transaction. In order to provide an efficient time implementation, the tool generates a thread for each accelerated function, ensuring synchronization between the software and hardware threads. The designer can configure the communication between PL and PS parts in the code with SDSoC pragma directives to meet the application and solution constraints and adds Vivado HLS directives to create the desired accelerated IP. The version used in this work is the 2018.2.
The methodology applied in this paper includes that proposed by Xilinx [46] with some modifications, thus creating a well-defined six-step design flow, as shown in 0. After the code is verified in the ARM, checking the results Figure 1a, the first step in the design flow is the profiling stage Figure 1b. In this step, a profiling tool is needed to detect the functions that must be accelerated. This step can be carried out with different profiling tools, such as Valgrind [47] for memory usage and gprof [48] for timing. This step lets the designer identify the relevant functions in the code for HW acceleration. Since SDSoC uses Vivado HLS, the second step shown in Figure 1c includes the optimization suggested by the Vivado HLS and SDSoC guidelines. The third step of the methodology Figure 1d consists of code refactoring, restructuring the source code for an improvement of the latency. In some cases, this phase is mandatory if a certain speedup is pursued. Moreover, without this code refactoring, the acceleration could not be affordable. The objective is to modify the code in such a way that the final implementation reuses the FPGA resources, makes the most of the FPGA embedded resources, e.g., DSP (digital signal processing) macros, or reflects a particular architecture to achieve the design constrains. Code refactoring for HLS performance improvement is the main contribution of this paper, and it will be further explained in Section 3.
The fourth step of the methodology Figure 1e is to obtain the performance estimation provided by the tool, and check if the results are the expected ones. In this stage, a detailed report of the resources and speedup of accelerated functions is provided, and a new iteration can be done to improve the expected performances. The final iteration of performance estimation depends on the resources of the PL part, and the resources used will be shown in the HLS report obtained in the next step. The constraints, the SDSoC compiler directives, and the code refactoring drive the performance estimation. This step has a high impact on the quality of the final implementation. The designer can also use Vivado HLS directives together with SDSoC directives. The directives provide instructions to the compiler to meet the characteristics of the HW architecture and the desired timing constrains, e.g., the use of pipelines to implement loops, the type of communication channels for data-flow implementations (Data Movers), FPGA resources to be used for variable storage, etc. To improve the results, it is necessary to take into account the inferred implementation of the compiler tool.
The final step of the methodology shown in Figure 1f lets the designer check the estimated performance in the selected board. The estimated performance is obtained during the performance estimation stage (before the synthesis) with the profiling tool included in the SDSoC software. This estimation does not allow the designer to know the critical functions (obtained in the profiling stage), but it shows the estimated speedup that will be achieved with the current implementation. Commonly, these results are different from the real speedup obtained in the final implementation. Here, the speedup can be computed by measuring the clock cycles taken by the accelerated solution compared to those taken by the serial execution in the ARM processors. SDSoC invokes Vivado HLS in order to generate the HDL implementation files for the accelerated functions in HDL (VHDL or Verilog) and provides several comprehensive synthesis reports. The information provided in the synthesis reports helps the designer meet the targeted performance and resource usage requirements for a specific application. SDSoC also generates all the files needed to run the application in the embedded system, the bitstream for the PL part, the connection between the PS and PL parts (Data Movers), and the files of the OS in Linux or FreeRTOS with the executable binary (ELF file) for running the application. This final step is mandatory due to the difference between the real and the estimated performance. The real performance usually is lower than the estimated one. In order to obtain the real performance, it is mandatory to check the clock used in the PS part.

2.3. Support Vector Machine Classifier

The SVM algorithm is a binary classification approach proposed by Vapnik in 1979 [49]. The main goal of this algorithm is to find a hyperplane that separates two classes according to their features with maximum margin. A set of data x i ( x i d ) and labels associated to this data ( y i ) are given. Each label provides information about data x i ; if y i = 1 , the class is positive, and if y i = 1 , the class is assumed to be negative. For example, if we are dealing with a diagnostic test, a positive class could mean ‘disease’ while a negative can represent ‘non-disease’. According to the input data x i , Equation (1) can be written.
  y ^ = x i · w + b
In Equation (1), y ^ is the predicted class for the instance x i , and the parameters w and b define the maximum margin hyperplane ( w d and b ). These parameters, w and b , are learned from a training set, consisting of tuples of data and labels ( x i , y i ) . One of the main features of the SVM algorithm is that it can be easily generalized for non-linear data [50], which is especially useful for complex data where a linear separation hyperplane is not capable of separating the data accurately. Similarly to other binary classifiers, SVM can be extended to a multiclass classifier by combining several binary classifiers [51].
SVMs are kernel-based supervised classifiers that have been widely used in the classification of HS images [52]. In the literature, SVMs achieve good performance for classifying HS data, even when a limited number of training samples are available [53]. Due to its strong theoretical foundation, good generalization capabilities, low sensitivity to the curse of dimensionality, and ability to find global classification solutions, many researchers usually prefer SVMs instead of other classification algorithms for classifying HS images [30].

SVM Multiclass Classifier

In this paper, we address the implementation of the multiclass SVM classification stage. For this purpose, we first employed an implementation of the basic binary SVM classifier to perform the experiments and optimizations. Then, a multiclass SVM classifier implementation based on the one-vs-one method was used to apply and evaluate the optimizations proposed with the binary algorithm. This allowed reusing some parts of the binary code modifications and copying the methodology used in this first implementation. The linear kernel with the hyperparameter cost equal to 1 was employed for the SVM classifier, since it has been demonstrated to produce accurate results for hyperspectral brain cancer detection applications [54].
The first version of binary and multiclass classification were written in C++ language and both final versions were written in plain C following a hardware-friendly way. Both codes were tested comparing results with the SVM implementation of the LIBSVM [55] implementation in MATLAB® 2019a (The MathWorks, Inc., Natick, MA, USA) software. To validate the implementation, gold standard results were obtained from the MATLAB SVM implementation in double precision and saved into binary files. Such data were used to compare the software and hardware implementations.
In this implementation, the multiclass SVM algorithm was split into four different stages:
(1)
Variables declaration and initialization. Here, the inputs that represents the previously trained model of the algorithm (support vectors, the bias, and the sigmoid function parameters) as well as the samples to be classified are declared and initialized.
(2)
Distances computation. In this step, the distances between the samples (i.e., the pixel) and the established hyperplane are computed.
(3)
Binary probability computation. This step has the goal of estimating the binary probability of a certain pixel to belong to the two classes under study in the one-vs-one method, taking into account the distances computed in the previous step.
(4)
Multiclass probability computation. This final step aims to obtain the multiclass probabilities for each pixel performing a for loop that iteratively refines the probabilities for each pixel associated to a certain class obtained in the previous step. The value of each probability is incrementally modified on the assumption that the difference with the value of the previous iteration is under a certain threshold or if the maximum error is reached (the user establishes both parameters). As soon as one of these two situations is confirmed, the multiclass probabilities of the pixel are computed, and the final classification map is generated.
This partition of the algorithm will allow performing two different implementations, one where the entire algorithm is implemented onto the PL part (full version) and another one where the stage with the most computational cost (modular version) is implemented onto the PL part and the remaining stages are executed in the PS part.

2.4. In Vivo HS Human Brain Cancer Database

In this work, the HS data employed to evaluate the performance of the implementations belong to an in vivo HS human brain cancer database [56]. This database was generated intraoperatively using an HS acquisition system developed during the execution of the HELICoiD project [56]. Particularly, three HS images that belonged to three adult patients undergoing craniotomy for resection of intra-axial brain tumors at the University Hospital Doctor Negrin of Las Palmas de Gran Canaria (Spain) were employed for the validation of the implementations. The patients had a grade IV glioblastoma tumor confirmed by histopathology. The study protocol and consent procedures were approved by the Comité Ético de Investigación Clínica-Comité de Ética en la Investigación (CEIC/CEI) of the University Hospital Doctor Negrin, and written informed consent was obtained from all subjects. HS data from these images were labeled into four classes as normal tissue, tumor tissue, hypervascularized tissue, and background, following the method explained in [56]. This method consisted of two main steps. First, the pathologists analyzed the biopsied tissue from the tumor area extracted during the surgical procedure after capturing the intraoperative HS image. Then, the neurosurgeon labeled certain pixels of the image where they were confident that the pixels belonged to one of the four classes. Normal tissue, hypervascularized tissue, and background were labeled according to the surgeon criteria and experience by visual inspection using the labeling tool based on the Spectral Angle Mapper (SAM) algorithm. Tumor tissue pixels were labeled with the same labeling tool, but taking into account the definitive diagnostic information provided by histopathological analysis. Normal and hypervascularized tissue samples were not pathologically analyzed due to ethical reasons. Figure 2a shows the information structure of an HS cube [31]. On one side, each pixel of the HS image contains a full spectral signature of length equal to the number of spectral bands of the HS cube. The reflectance value of a certain pixel in a certain wavelength is called a voxel. On the other side, a gray-scale image of the captured scene can be obtained using any of the spectral bands that display the spatial information provided by the image sensor at such a particular wavelength. The rubber ring markers presented in the image were employed for labeling purposes with the goal of identifying the pathological assessment of the brain tissue (normal or tumor).
The HS data generated by the sensor was preprocessed following the preprocessing chain described in [54]. This chain was based on five main steps: (1) a white and dark calibration employed to perform a radiometric calibration of the HS image using a white tile that reflects 99% of the incident light and a dark reference image that remove the effect of the dark currents produced by the HS sensor; (2) an extreme band removal applied due to the low performance of the HS sensor in these bands; (3) a band averaging process where the redundant information provided by the high spectral resolution of the camera is eliminated; (4) a smooth filter employed to remove the spectral noise in the spectral signatures; and (5) a normalization of the spectral signatures between 0 and 1 to avoid differences in the amplitude of the signatures produced by the non-uniform illumination. Finally, the HS dataset consists of 128 spectral bands, covering the spectral range between 450 and 900 nm (visible and near-infrared spectra). Figure 2b–d show the synthetic RGB representations of the HS cubes selected for this study and their corresponding size. These synthetic RGB images were generated only for visualization purposes using three wavelengths directly extracted from the original HS cube to conform the RGB image (R = 708.97 nm, G = 539.44 nm, B = 479.06 nm).

3. Code Refactoring

The reference code was modified until the final implementation showed clear indications of reaching the performance objectives. After each change or restructuration in the code, a serial verification was performed in order to check the results. These modifications were applied to the binary classifier code. Once the optimal modifications were reached, the same methodology was applied to the multiclass classifier code.

3.1. Use of Directives and Memory Allocation

The first modification in the code was to include the minimal directives in order to avoid dependences of the tool. In this case, only the HLS pragma for pipelining (the number of pragma HLS pipeline) was used. For memory allocation, only the sds_alloc function was used. This function is defined in a SDSoC library (sds_lib.h), and allocates physically contiguous memory, which can affect system performance in the data transfer between the PS and the PL part. Since the accelerated function receives a considerable amount of data, normally more than 8 MB, the AXI DMA scatter gather was selected using the related SDSoC directives (#pragma SDS data zero_copy and #pragma SDS data data_mover (Var1:AXIDMA_SG…)).

3.2. Improvement in Data Transfer

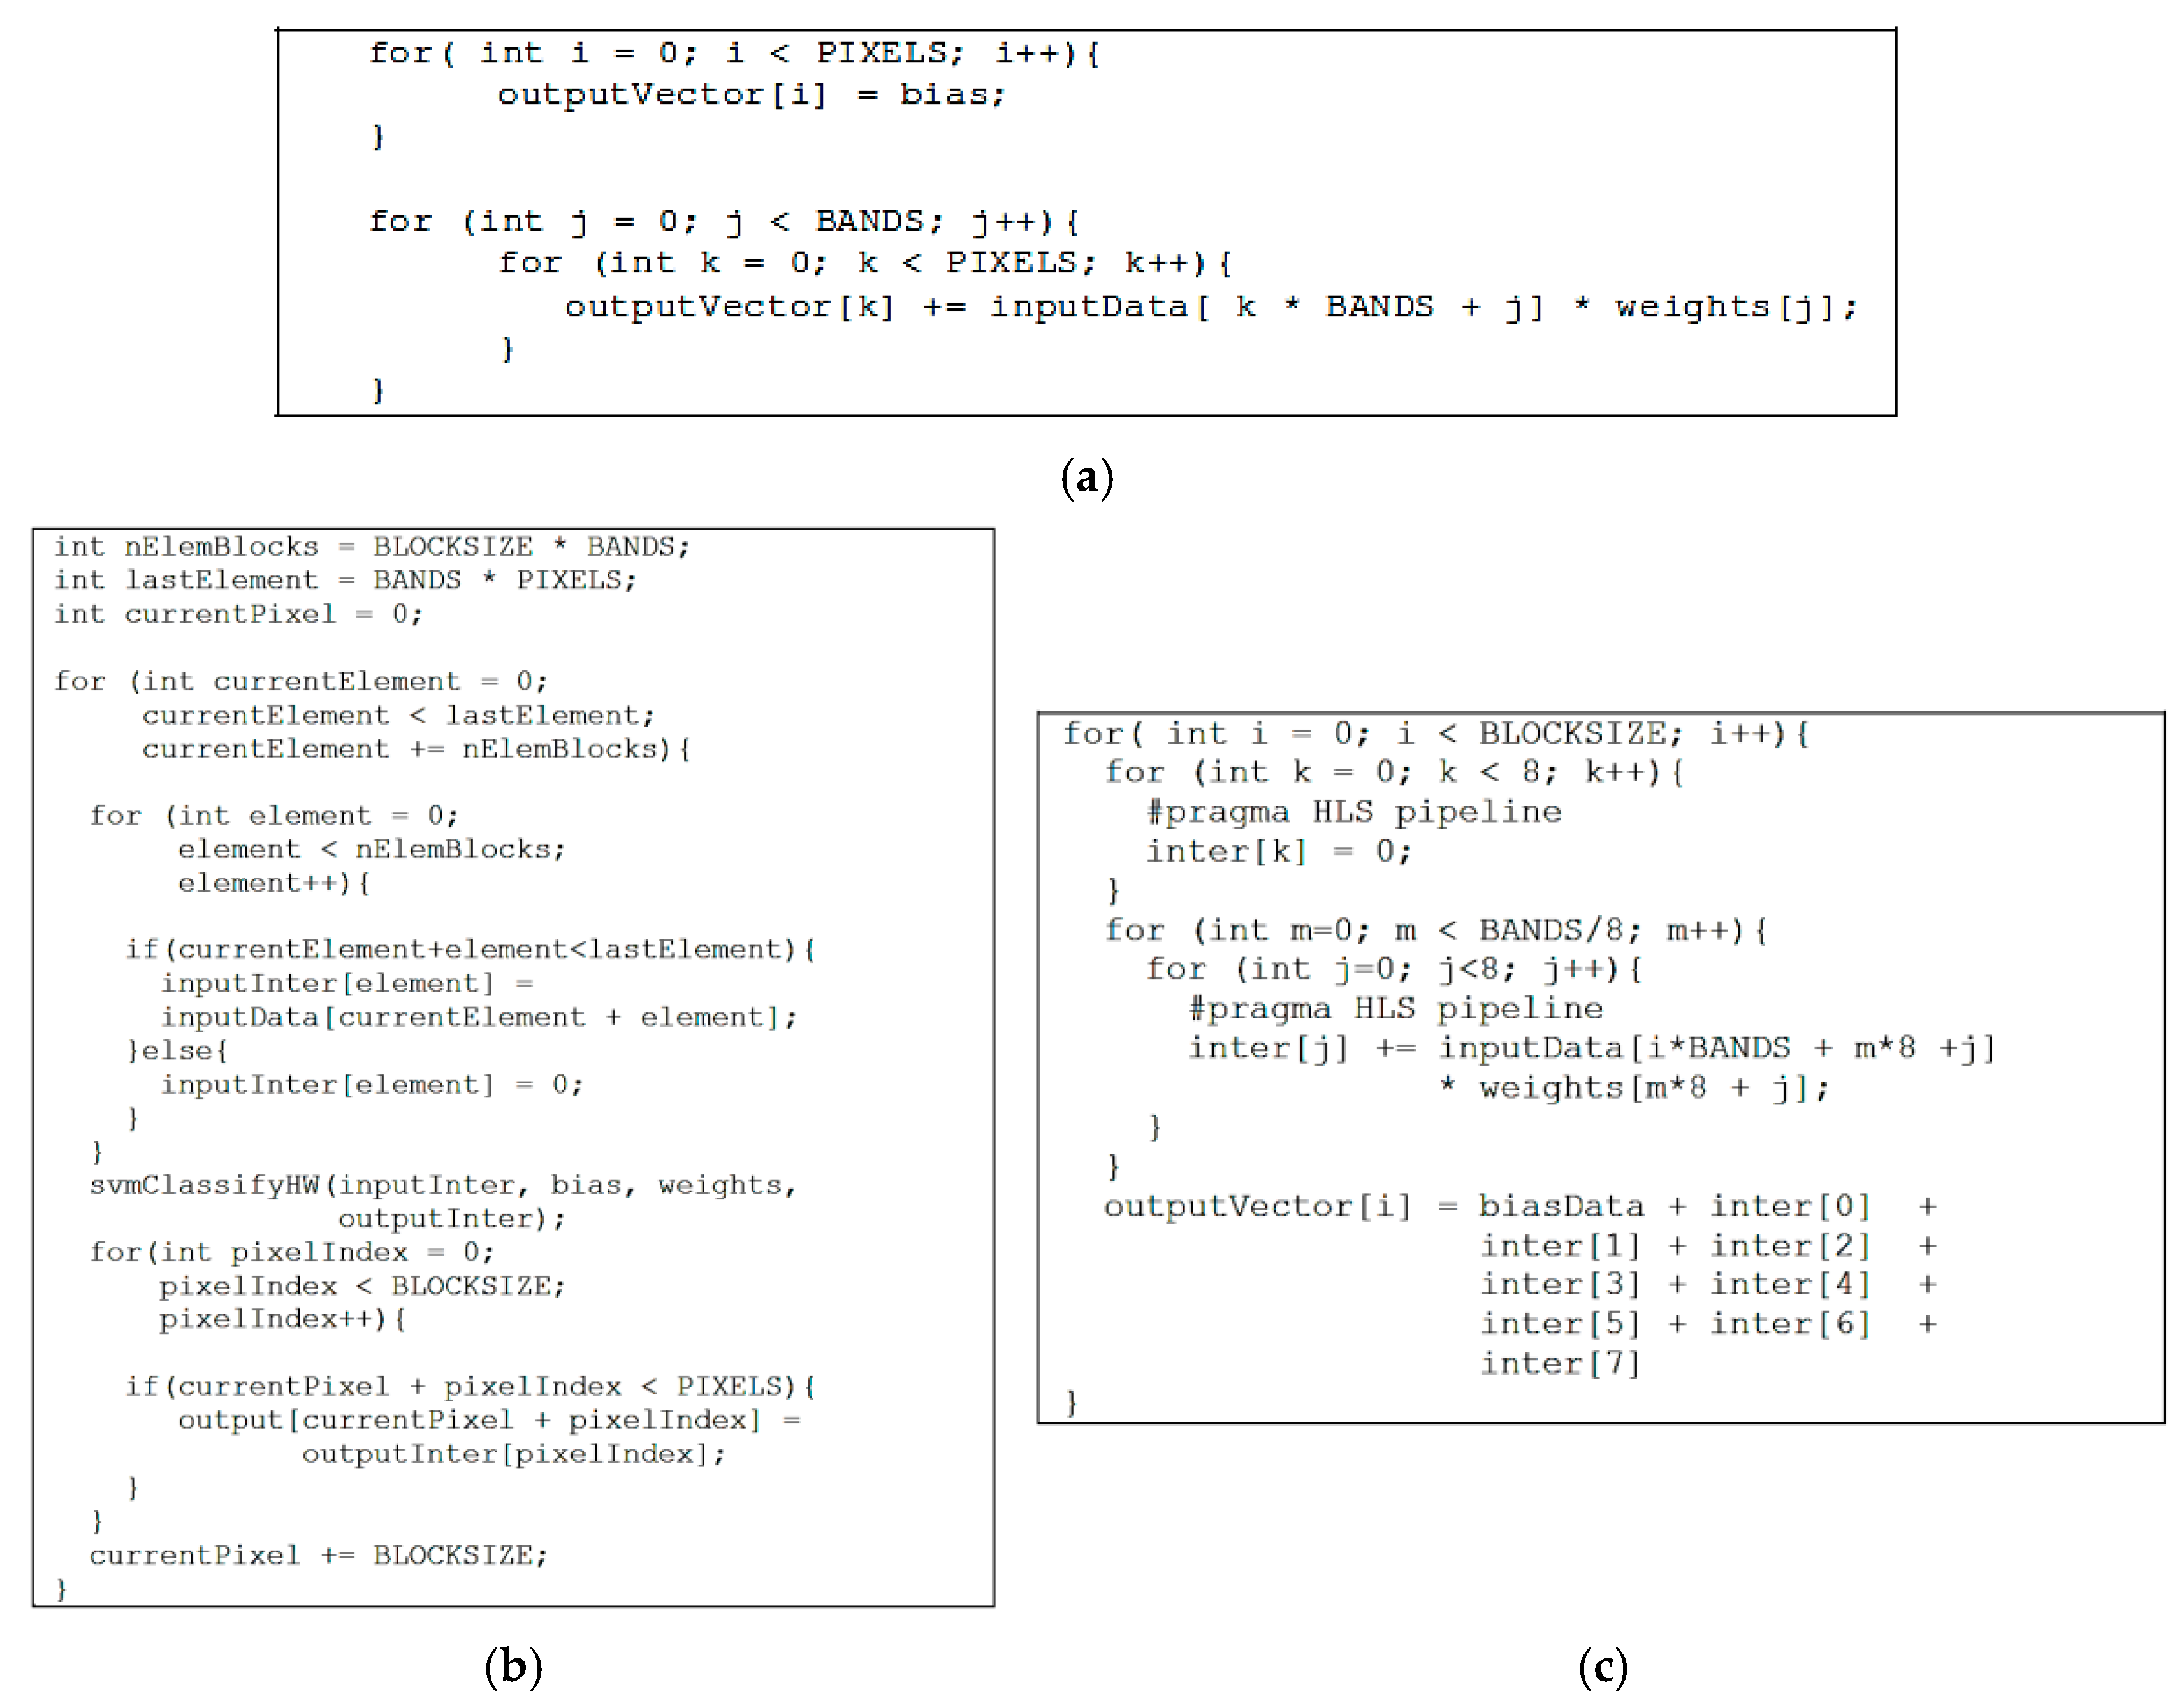
If the accelerated function only processes one pixel at each iteration, no speedup is obtained even with the pragma directives. In order to improve the acceleration of the classification function, several pixels are transferred between the PS and PL parts in the same clock cycle. Due to the 533-MHz DDR3 SODIMM bandwidth constraint, an optimal amount of data must be selected in order to avoid wasted data cycles. Since the implemented system is not always able to reach the entire bandwidth, it is necessary to determine the highest data transfer near the bandwidth constrain. It is necessary to take into account that the amount of pixels is not always an integer multiple of the optimal amount of pixels for a data cycle, so zero padding is a good option to avoid calculating non-existent values. Figure 3a shows the original code of the SVM binary software implementation. Figure 3b shows the re-factored code applied in order to improve the transferred data using the proposed modification, where BLOCKSIZE is the amount of pixels in each data transfer, BANDS is the number of bands values for each pixel, PIXELS is the number of pixels in the image, and inputInter/outputInter are the arrays for intermediate input/output data transfers.

3.3. Improvement in Data Processing

The classification function features a temporal dependency because the actual value on each iteration depends on its value in the previous iteration. Each classification value for a pixel (clValue) is calculated adding the bias data and then accumulating the result of multiplying the weight of every band obtained in the training classification (bandWeight) by the value of the pixel in that band (bandWeight). So pipelining is not possible to be used in the function given in Equation (2).
c l V a l u e + = b a n d V a l u e · b a n d W e i g h t
To improve the execution of this function in order to calculate clValue, instead of using just one accumulator, we propose the use of several intermediate accumulators. At the end, the final value for clValue is the sum of the intermediate accumulators. 0 3c shows the refactored code, where the proposed modification is applied in order to improve the data processing. This refactorization allows the pipelining implementation to use eight accumulators, where BLOCKSIZE is the number of pixels for each data transfer, BANDS is the amount of bands for each pixel, intputData[n] is the array with the pixel values, outputVector[n] is the array with the classification results, weights[n] is the array with the weights for the classification, and inter[m] is the array for intermediate accumulators.
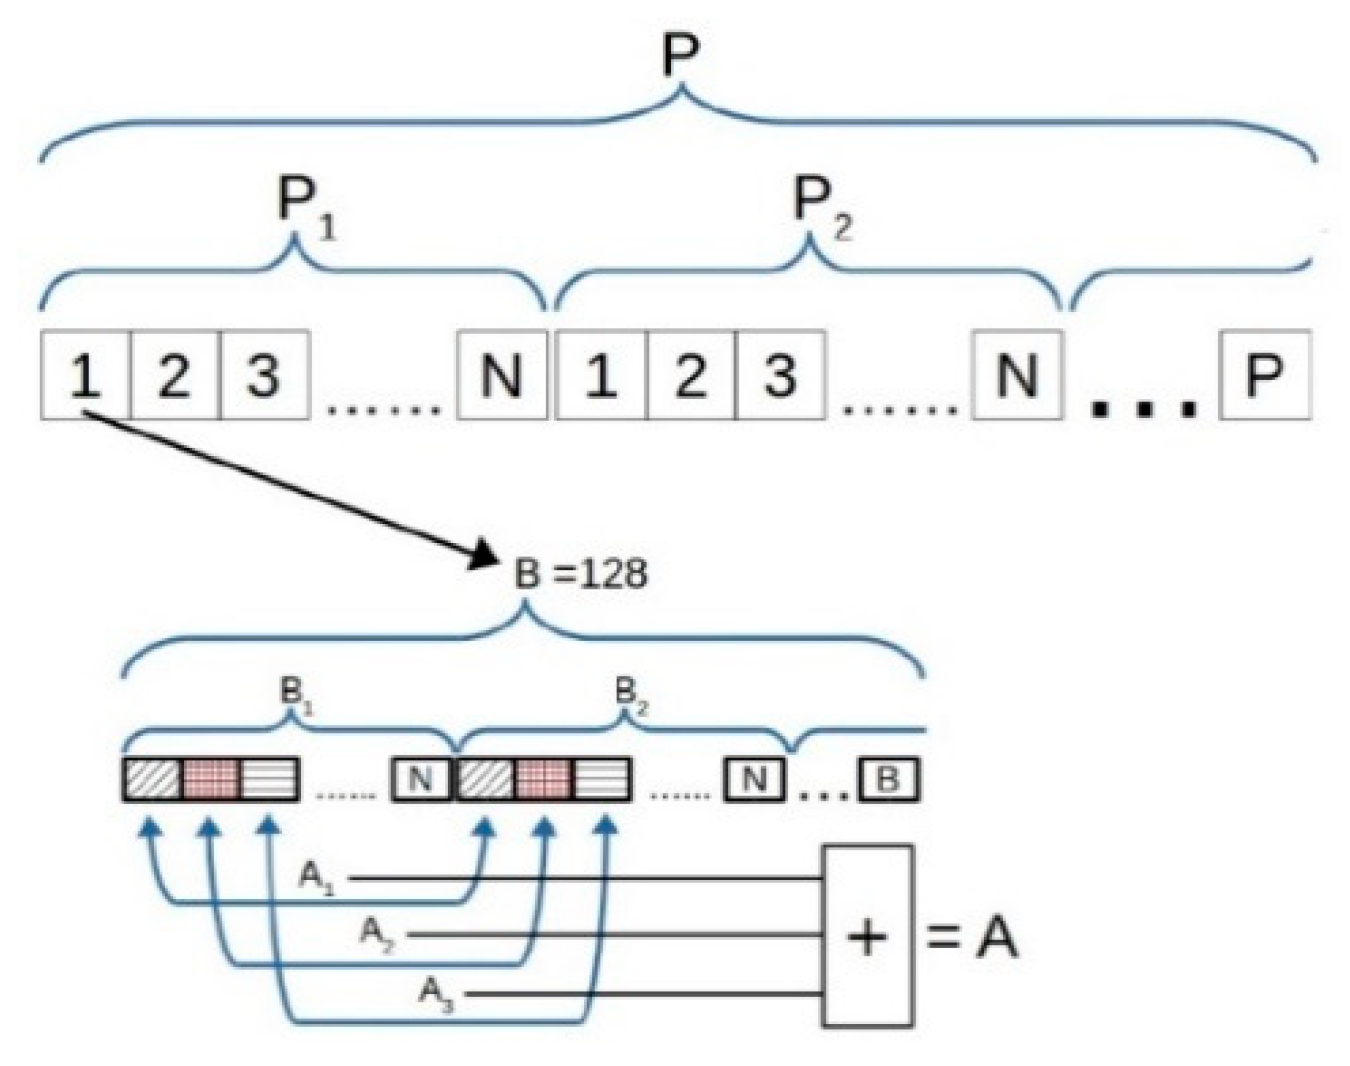
Figure 4 shows a diagram of the improvement in data transferring and processing, where P is the number of pixels, P n is the block of pixels processed in each data transfer, B n is the block of bands in which it is divided into the total bands value for each pixel, A n represent the intermediate accumulators, and A is the final accumulator for that pixel.

3.4. Including Redundant Data inside Accelerated Function

Every time the classification is called, bias and weights values are transferred via the data-mover IP to the accelerated function in the PL part. The classification data type is double (8 bytes, 64 bits); therefore, every time Equation (2) is called, the bias and the corresponding weight need to be transferred for computation. If the SVM training is done before, the weights will not change, hence, weights and bias values can be included in the IP, reducing the data transfer and improving the speedup.

3.5. Data Type Reduction

Reducing the data type from double to float decreases the bus bandwidth required for the data transfer between the PS and PL parts. It is necessary to take into account that it is not possible in every application to change the data type due to the precision needed. In this work, the HS images were processed in double and float precision, comparing the classification results. In this application, it was verified that the precision lost did not change the classification results. This data change reduced the bus bandwidth from 64 bits (8 bytes) to 32 bits (4 bytes).

4. Experimental Results and Discussion

All the results presented in this section were obtained through the elaboration of the designed architecture straight on the boards, i.e., no estimated performance was used in these results. In summary, about 70 implementations were tested in order to obtain accurate results. Each implementation was iterated 100 times per classification on board to obtain a reliable average values. Linux was used as the OS in all the implementations for controlling and verification purposes. The speedup was calculated calling the classification twice, the first one in software without any modification at all, and the second one in hardware, with all the modifications incorporated.
The preliminary results obtained without applying code refactoring shows a speedup factor of 0.67× (in fact, the implementation showed a slowdown situation); this result was the main reason to change the code in order to find a better implementation. Once the code was modified by changing the amount of pixels per clock cycle, parallelizing the processing data with several accumulators and selecting 100 MHz for the Data Movers IP, a speedup factor between 1.15× and 1.41× was obtained, depending on the block size.
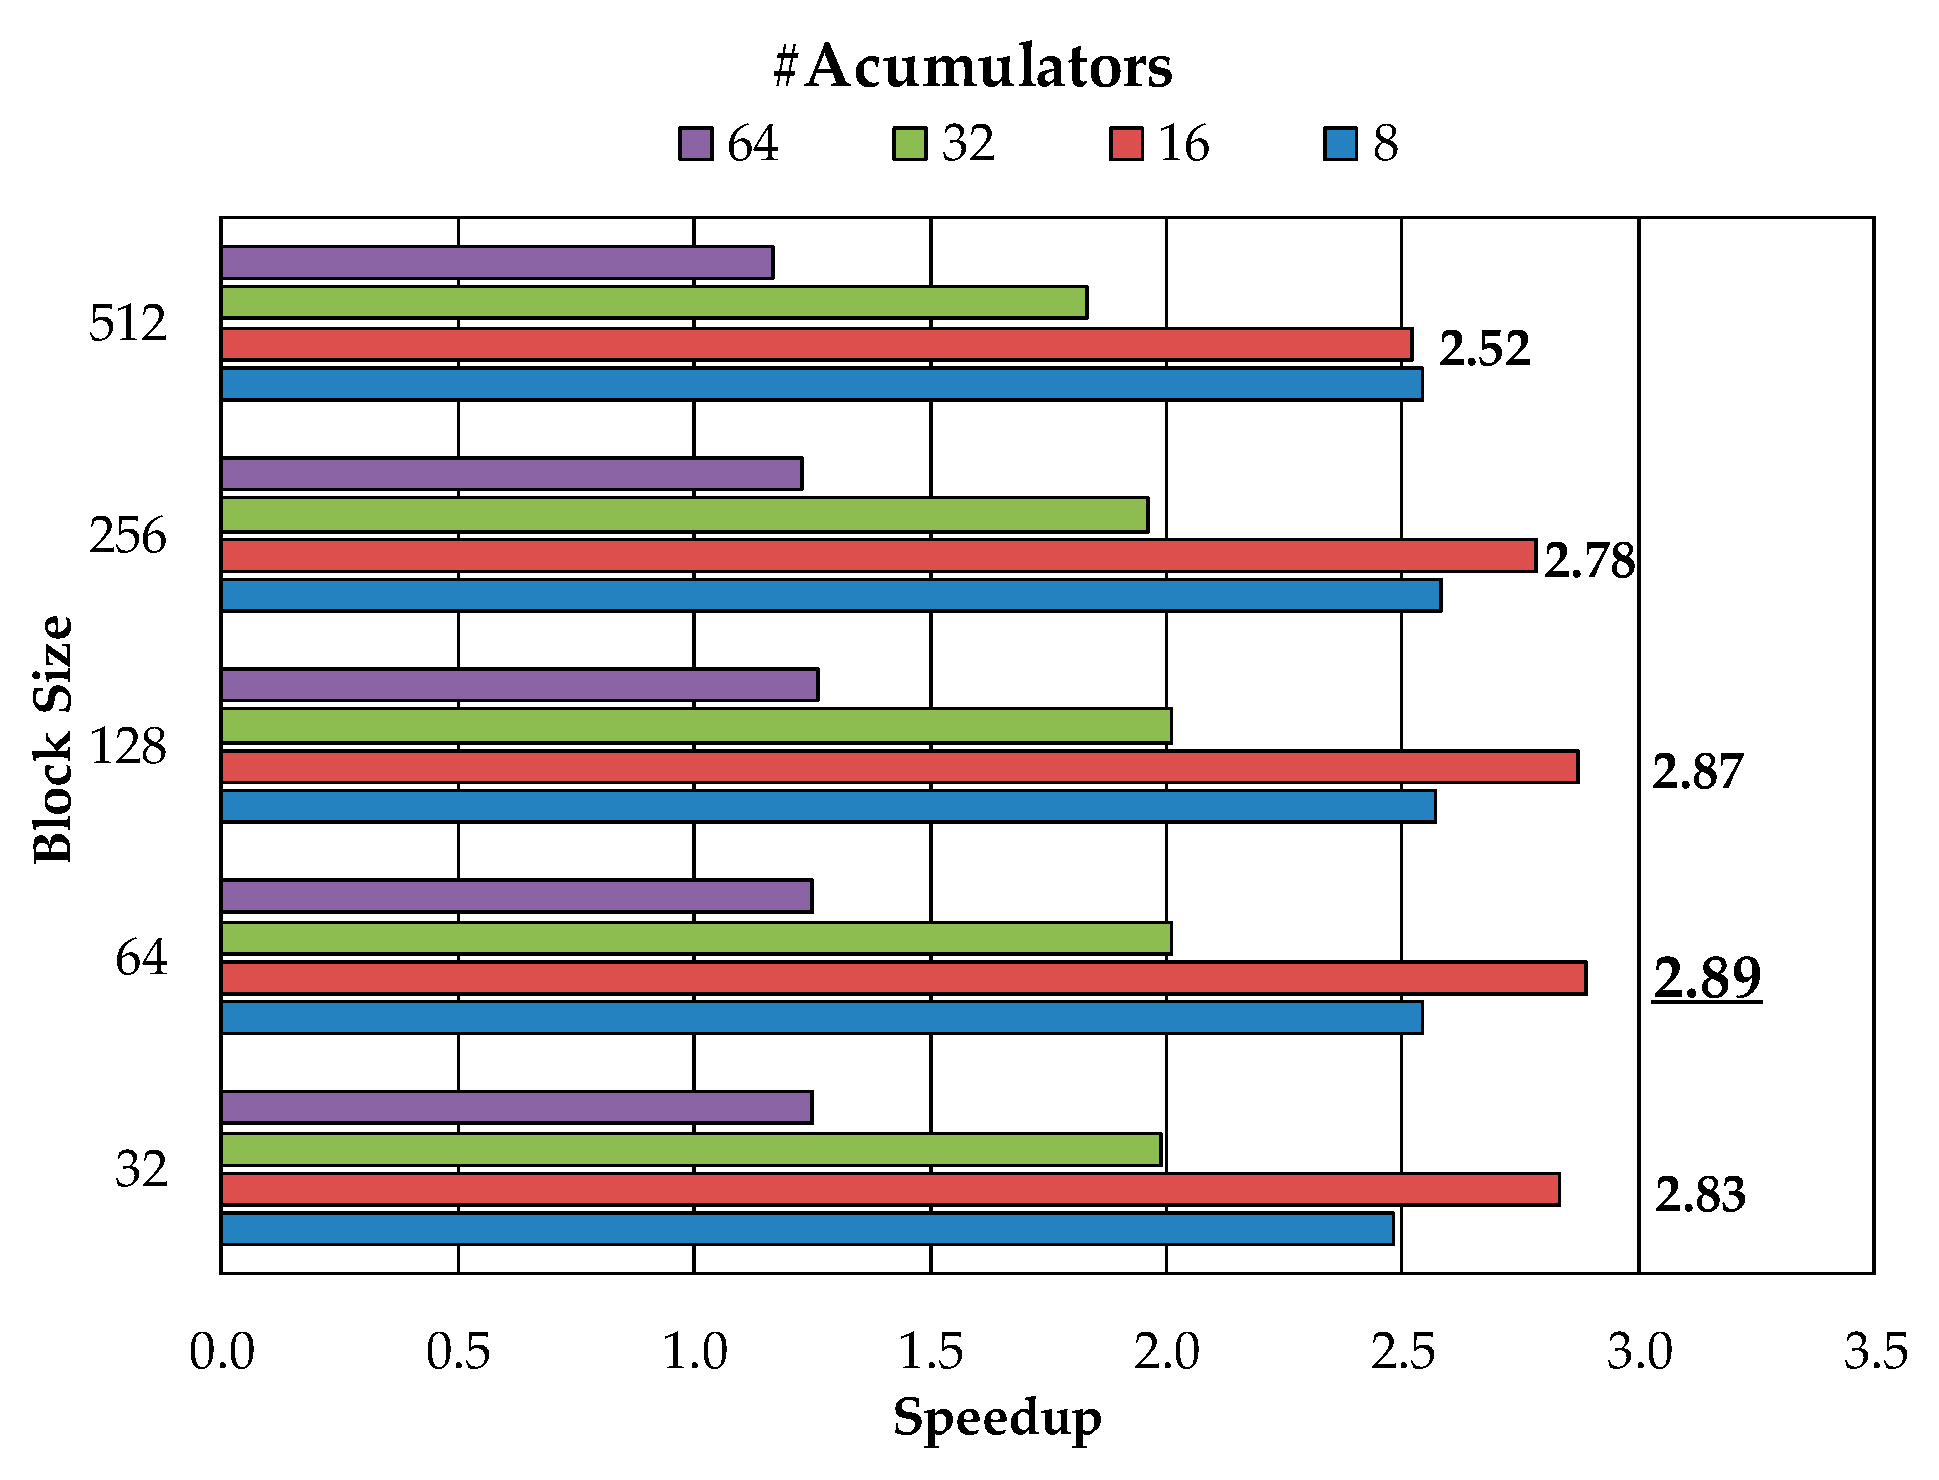
Once the optimal number of pixels per clock cycle was established, we optimized the other parameters of the HS design. First, increasing the frequency for data movers and for the accelerated function to 200 MHz showed a speedup of 1.61×. Second, including weights and bias inside the accelerated function and keeping the 200 MHz for data movers and the accelerated IP showed a speedup of 2.35×. Finally, keeping all the configurations shown in Figure 5, 200 MHz for data movers and accelerated function, including weights and bias in the accelerated function, and changing the data type from double to float showed a speedup of 2.89×. It is worth noticing that the speedup decreases once the block size (number of pixels per clock cycle) increases above 128 pixels. This speedup decrease is due to the wasted space in each transfer to the PL part, since the block size exceeds the amount of data that the PS part can send to the PL part in each clock cycle.
Figure 6 shows a speedup comparison applying all the above modifications, using different pixels per data cycle and different partitions for bands value. In the best case, with the code refactoring and changing the data type, the highest speedup achieved is 2.89× with a block size of 64 pixels per data cycle and partitioning the bands value using 16 accumulators.
Finally, the same methodology was applied to the multiclass SVM classifier. In this case, the code was divided into four stages (see Section 2.3), and once the performance analysis was obtained, two versions were implemented, the full one (including all the stages in the PL part) and the modular one, implementing only the most intensive computational stage (the distance computation, stage number 2) in the PL part. This difference allows us to compare the speedup versus the resources occupied in the PL part and the power consumption. As well as in the binary classification, the classification results obtained were validated with the gold standard results provided by the LIBSVM implementation in MATLAB. In this case, for the multiclass classification, Figure S1 of the supplementary material shows the four-class classification maps obtained for each HS cube employed in this study. The red color indicates tumor pixels, the green color indicates normal pixels, the blue color indicates hypervascularized pixels, and the background pixels are represented in black. These gold standard classification results were previously published in [57] and exactly match with the results obtained by the proposed multiclass SVM implementation.
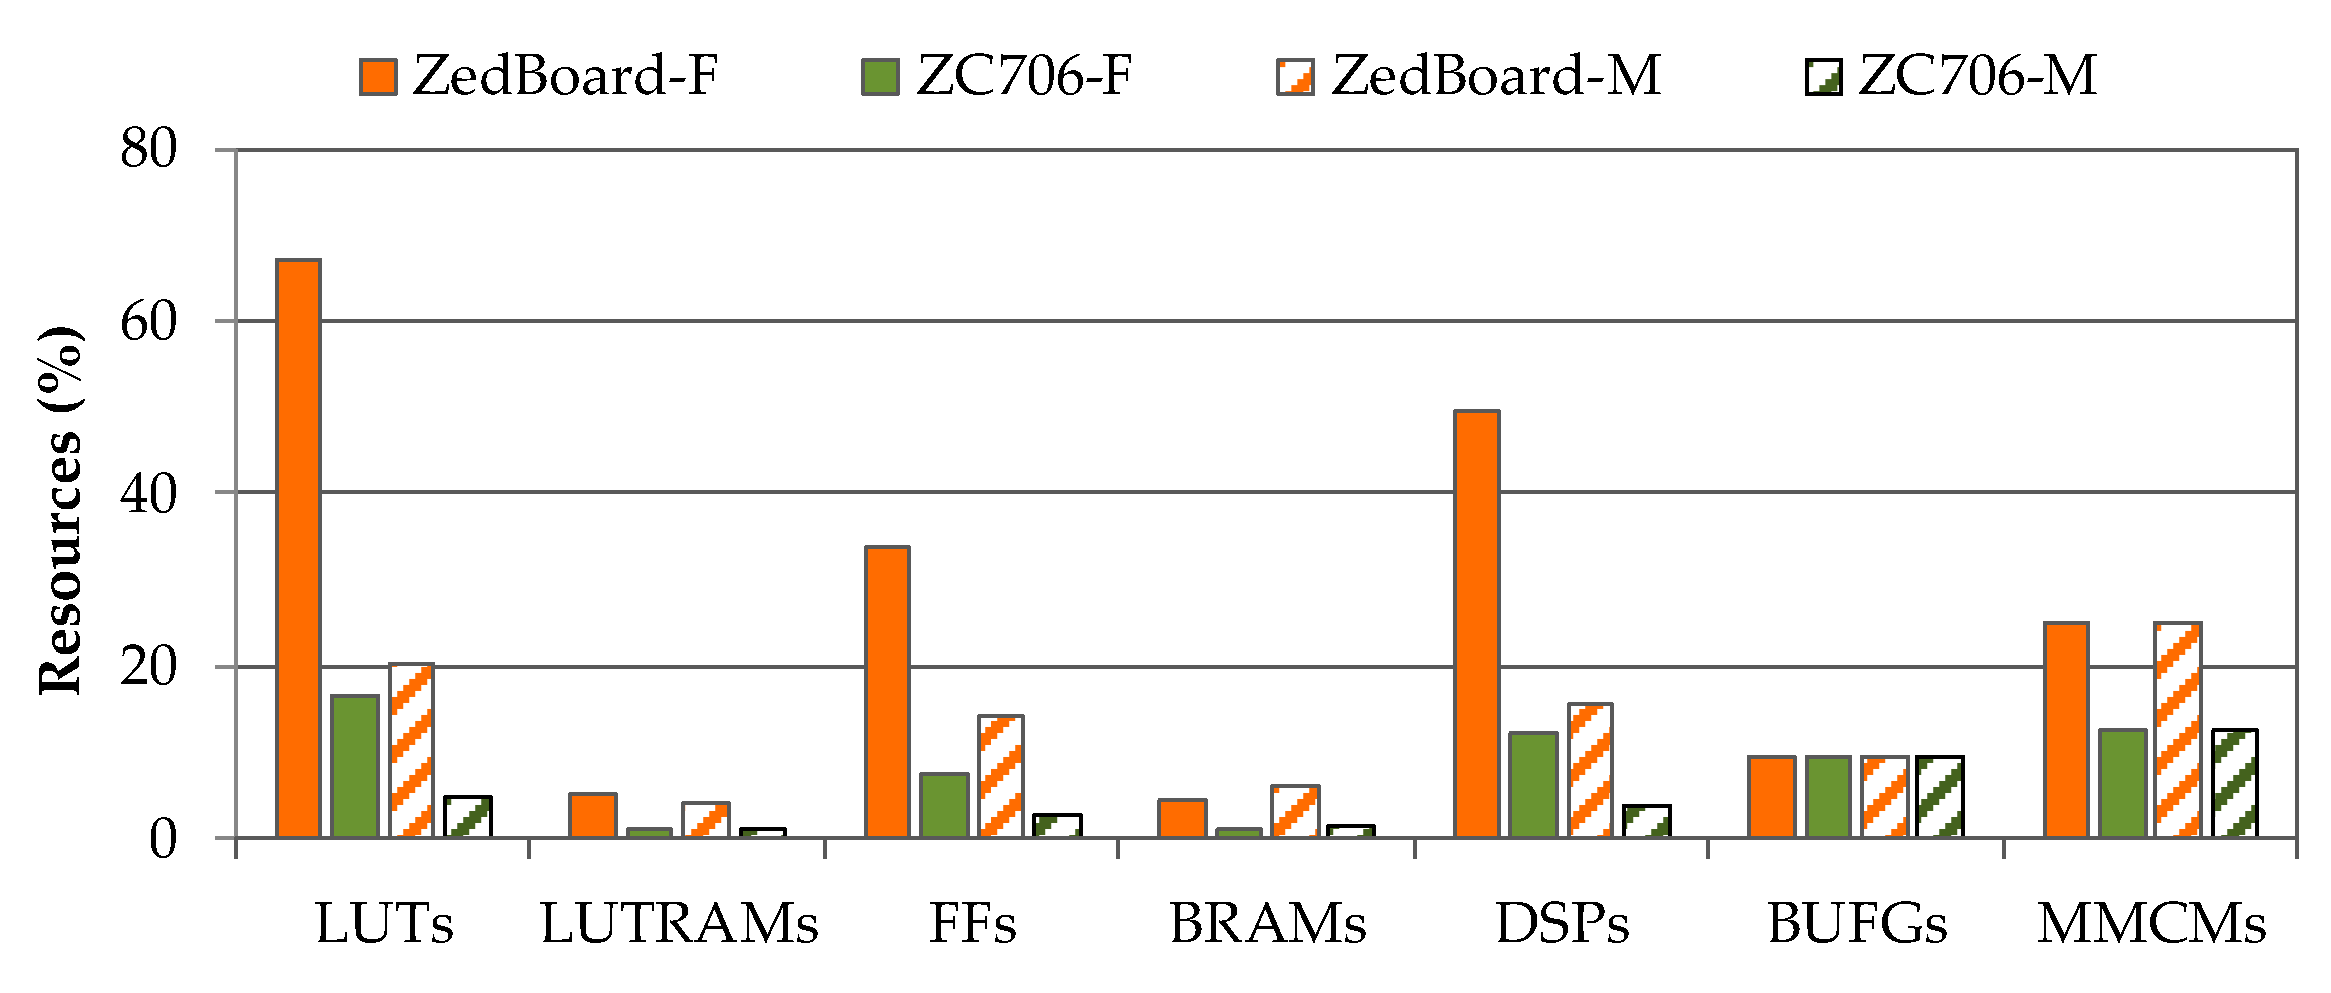
Figure 7 shows the time consumption and speedup obtained using both the ZedBoard (ZC7020) and the ZC706 (ZC7045) for both cases, full (F) and modular (M) implementations, as well as the SW implementation results. These results show that the obtained speedup is the best when the modularization of the SVM stage is performed, considering both platforms. In addition, it is clear that the ZC706 platform outperforms the results obtained with the ZedBoard. In all cases, the selected frequency for the PL part was 100 MHz. On the other hand, Figure 8 shows the resources occupied using both platforms for both implementations, where it is possible to observe that the modular version is more efficient than the full version in terms of resources usage. Finally, Table 1 shows the power consumption for the two platforms using both implementations. As it can be observed, comparing all the results, the separation of the code offers better performance, since it consumes less power than the full one, uses fewer resources, and obtains better latency values.
As it was mentioned in the introduction, other hardware implementations have been performed [12]. In some cases, the implementations have increased the speedup; in other cases, they have reduced the resources needed or they have reduced the power consumption for different types of FPGAs. In all cases, a stand-alone FPGA was used. Only one work used a Zynq device [58], although a binary SVM classifier was implemented, and for that reason it is not included in this comparison. On all cases, the SDSOC was not used in any such implementations. In this comparison, only Xilinx devices have been taken into account for resources assessment, due to the different architectures used between Xilinx and Altera devices. In summary, the implementations used for comparison have been [59,60,61,62]. As different FPGAs have different types of resources, even using only Xilinx devices, some resources cannot be comparable. In those cases, the resources were omitted. Table 2 presents the comparison of the speedup, power consumption, and resources employed among the state-of-the-art implementations and our proposed solution. Notice that some of the articles did not provide all the necessary information for this comparison. In this table, bold values refer to the best result for each feature or resource.
Although all the compared implementations address SVM multiclass classification, to the best of our knowledge, none of the implementations use medical images. Furthermore, none of such works used HSI. In [59], binary images were used for Persian handwritten digits detection [63]. In [60], Patil et al. employed RGB images to develop a facial expression recognition system using the Cohn-Kanade database [64]. In [61], a phoneme recognition system was tested using the DARPA TIMIT Acoustic-Phonetic Continuous Speech Corpus database [65]. Finally, Mandal et al. [62] employed the setosa and non-setosa data of Fisher’s Iris database available in MATLAB®. Furthermore, it is worth noticing that different techniques for data reduction were employed in each work. For example, in [59,60], fixed point and truncation methods were used. In this work, the only data reduction performed was a conversion from double to float data type. For these reasons, a fair comparison is not possible because the types of data used for the SVM classifier are different. However, the superiority of our implementation is demonstrated using HSI data, which imposes relevant challenges due to their high dimensionality and data throughput. As it can be seen in Table 2, our proposed implementation achieved the best speedup factor (2.86×) using the ZC7045 (ZC706 board) device. Regarding the power consumption, the implementation performed in [62] obtained the lower value. However, our proposed solutions provide similar values, having only an increment of 0.34 and 0.43 W in the ZC7020 (ZedBoard) and ZC7045 (ZC706) devices, respectively. In contrast, the use of the FPGA resources is lower than [62], especially in the ZC7045 device. Furthermore, it is worth noticing that in the ZC706, the designer has also extra space for other applications; for example, if the designer wants to use the output of the SVM to another machine learning algorithm, or if extra space is required to execute other algorithms in parallel.

5. Conclusions

The results obtained in this work demonstrate the major benefits of writing efficient code for HLS tools, in this case SDSoC, to accelerate a binary SVM classifier. This methodology can be easily replicated in other HLS tools to validate the inferred system, as only a few specific tool directives have been used. It is recommended to include all the redundant data in the accelerated function in order to decrease the interfaces between PS and PL, thus significantly improving the speedup of the system by reducing the transferred data. Moreover, the modular version (M), the one that only implements the binary probability computation, not only obtains better speedup compared to the full version (F), but also uses less resources, consuming less power. In summary, it is advisable to reduce as much as possible the implemented functions in HLS, taking into account the transferred data between the SW and HW parts, fitting each chunk of data to the bus data-width plus the control data. On the other hand, looking at the resources used in the (ZC7045) ZC706, this implementation allows the designer to add other algorithms in the SOC, for example, to reuse the output of the SVM in other applications, or to parallelize the computation of the inputs in other types of algorithms. Finally, it is worth noticing that the power consumption of the ZC706 is similar to the one obtained with the ZedBoard. However, the speedup achieved by the ZC706 is higher than the one achieved by the ZedBoard. In summary, in this paper, the following methodology is proposed. First, a profiling stage is mandatory in order to identify the functions to accelerate. Second, we make use only of the basic pragmas in the HLS tool. With these two basic steps, we create a basic project in order to check the preliminary results. If the results meet the requirements, it will be necessary to modify the loops to create small arrays instead of passing to the hardware part large amounts of data, trying to fit the data size to the bandwidth of the bus used in the communication. Next, check for the data dependencies inside the loop, trying to remove the dependencies, as the accumulators could be if they suppose additional dependencies. Once all these steps have been committed, the designer should create the final project and check the results. In case it was not possible to avoid the dependencies inside the loop, the obtained speedup will represent the time variations in the transmission stage. Future works will contemplate the automation of code refactoring in order to provide a reliable tool that facilitates the implementation of the original code, obtaining an improved speedup.

Supplementary Materials

The following are available online at https://www.mdpi.com/2079-9292/8/12/1494/s1, Figure S1: Classification results of the SVM multiclass classifier for the employed HS cubes. (a), (c) and (e) are the synthetic RGB representations of the HS images, where the tumor area is surrounded in yellow [34]. (b), (d) and (f) Classification maps generated by the SVM multiclass classifier implementation. Normal, tumor, hypervascularized and background classes are represented in green, red, blue, and black color, respectively.

Author Contributions

Conceptualization, A.B., H.F., S.O., F.L., and G.M.C.; methodology, A.B., G.F., and E.T.; software, A.B., S.O., G.F., and A.H.; validation, A.B., S.O., G.F., and A.H.; formal analysis, A.B., H.F. and G.M.C.; investigation, A.B., H.F., and S.O; resources, F.L., G.D., G.M.C., and R.S.; data curation, H.F. and S.O.; writing—original draft preparation, A.B. and H.F.; writing—review and editing, S.O., G.F., E.T., A.H., F.L., and G.M.C.; supervision, F.L. and G.M.C.; project administration, F.L., G.D., G.M.C., and R.S.; funding acquisition, F.L., G.D., G.M.C., and R.S.

Funding

This work has been supported by the Canary Islands Government through the ACIISI (Canarian Agency for Research, Innovation and the Information Society), ITHACA project “Hyperspectral Identification of Brain Tumors” under Grant Agreement ProID2017010164, and it has been partially supported also by the Spanish Government and European Union (FEDER funds) as part of support program in the context of Distributed HW/SW Platform for Intelligent Processing of Heterogeneous Sensor Data in Large Open Areas Surveillance Applications (PLATINO) project, under contract TEC2017-86722-C4-1-R. This work has been also supported in part by the European Commission through the FP7 FET (Future and Emerging Technologies) Open Programme ICT-2011.9.2, European Project HELICoiD “HypErspectraL Imaging Cancer Detection” under Grant Agreement 618080. This work was completed while Samuel Ortega was beneficiary of a pre-doctoral grant given by the “Agencia Canaria de Investigacion, Innovacion y Sociedad de la Información (ACIISI)” of the “Conserjería de Economía, Industria, Comercio y Conocimiento” of the “Gobierno de Canarias”, which is part-financed by the European Social Fund (FSE) (POC 2014-2020, Eje 3 Tema Prioritario 74 (85%)).

Conflicts of Interest

The authors declare no conflict of interest. The funders had no role in the design of the study; in the collection, analyses, or interpretation of data; in the writing of the manuscript, or in the decision to publish the results.

References

  1. Coussy, P.; Gajski, D.D.; Meredith, M.; Takach, A. An Introduction to High-Level Synthesis. IEEE Des. Test Comput. 2009, 26, 8–17. [Google Scholar] [CrossRef]
  2. Nane, R.; Sima, V.-M.; Pilato, C.; Choi, J.; Fort, B.; Canis, A.; Chen, Y.T.; Hsiao, H.; Brown, S.; Ferrandi, F.; et al. A Survey and Evaluation of FPGA High-Level Synthesis Tools. IEEE Trans. Comput. Des. Integr. Circuits Syst. 2016, 35, 1591–1604. [Google Scholar] [CrossRef] [Green Version]
  3. Saha, R.; Banik, P.P.; Kim, K.-D.D. HLS Based Approach to Develop an Implementable HDR Algorithm. Electronics 2018, 7, 332. [Google Scholar] [CrossRef] [Green Version]
  4. Liu, Z.; Chow, P.; Xu, J.; Jiang, J.; Dou, Y.; Zhou, J. A Uniform Architecture Design for Accelerating 2D and 3D CNNs on FPGAs. Electronics 2019, 8, 65. [Google Scholar] [CrossRef] [Green Version]
  5. Kyrkou, C.; Theocharides, T. A parallel hardware architecture for real-time object detection with support vector machines. IEEE Trans. Comput. 2012, 61, 831–842. [Google Scholar] [CrossRef]
  6. Jallad, A.H.M.; Mohammed, L.B. Hardware support vector machine (SVM) for satellite on-board applications. In Proceedings of the 2014 NASA/ESA Conference on Adaptive Hardware and Systems (AHS 2014), Leicester, UK, 14–18 July 2014; IEEE Computer Society: Washington, DC, USA, 2014; pp. 256–261. [Google Scholar]
  7. Anguita, D.; Carlino, L.; Ghio, A.; Ridella, S. A FPGA core generator for embedded classification systems. J. Circuits Syst. Comput. 2011, 20, 263–282. [Google Scholar] [CrossRef]
  8. Hussain, H.M.; Benkrid, K.; Seker, H. Reconfiguration-based implementation of SVM classifier on FPGA for Classifying Microarray data. In Proceedings of the Annual International Conference of the IEEE Engineering in Medicine and Biology Society EMBS, Osaka, Japan, 3–7 July 2013; pp. 3058–3061. [Google Scholar]
  9. Pan, X.; Yang, H.; Li, L.; Liu, Z.; Hou, L. FPGA implementation of SVM decision function based on hardware-friendly kernel. In Proceedings of the 2013 International Conference on Computational and Information Sciences (ICCIS 2013), Shiyang, China, 21–23 June 2013; pp. 133–136. [Google Scholar]
  10. Papadonikolakis, M.; Bouganis, C.S. A novel FPGA-based SVM classifier. In Proceedings of the 2010 International Conference on Field-Programmable Technology (FPT’10), Beijing, China, 8–10 December 2010; pp. 283–286. [Google Scholar]
  11. Vranjković, V.S.; Struharik, R.J.R.; Novak, L.A. Reconfigurable hardware for machine learning applications. J. Circuits Syst. Comput. 2015, 24, 1550064. [Google Scholar] [CrossRef]
  12. Afifi, S.M.; Gholamhosseini, H.; Sinha, R. Hardware Implementations of SVM on FPGA: A State-of-the-Art Review of Current Practice. Int. J. Innov. Sci. Eng. Technol. 2015, 2, 733–752. [Google Scholar]
  13. Afifi, S.; GholamHosseini, H.; Sinha, R. A low-cost FPGA-based SVM classifier for melanoma detection. In Proceedings of the IECBES 2016-IEEE-EMBS Conference on Biomedical Engineering and Sciences, Kuala Lumpur, Malaysia, 4–8 December 2016; IEEE: Piscataway, NJ, USA, 2016; pp. 631–636. [Google Scholar]
  14. Ning, M.; Shaojun, W.; Yeyong, P.; Yu, P. Implementation of LS-SVM with HLS on Zynq. In Proceedings of the 2014 International Conference on Field-Programmable Technology (FPT), Shanghai, China, 10–12 December 2014; IEEE: Piscataway, NJ, USA, 2014; pp. 346–349. [Google Scholar]
  15. Kamruzzaman, M.; Sun, D.-W. Introduction to Hyperspectral Imaging Technology. In Computer Vision Technology for Food Quality Evaluation, 2nd ed.; Academic Press: Cambridge, MA, USA, 2016; pp. 111–139. [Google Scholar]
  16. Starr, C.; Evers, C.A.; Starr, L. Biology: Concepts and Applications without Physiology; Cengage Learning: Boston, MA, USA, 2010; ISBN 9780538739252. [Google Scholar]
  17. Manolakis, D.; Shaw, G. Detection algorithms for hyperspectral imaging applications. IEEE Signal Process. Mag. 2002, 19, 29–43. [Google Scholar] [CrossRef]
  18. Govender, M.; Chetty, K.; Bulcock, H. A review of hyperspectral remote sensing and its application in vegetation and water resource studies. Water SA 2009, 33, 145–152. [Google Scholar] [CrossRef] [Green Version]
  19. van der Meer, F.D.; van der Werff, H.M.A.; van Ruitenbeek, F.J.A.; Hecker, C.A.; Bakker, W.H.; Noomen, M.F.; van der Meijde, M.; Carranza, E.J.M.; de Smeth, J.B.; Woldai, T. Multi-and hyperspectral geologic remote sensing: A review. Int. J. Appl. Earth Obs. Geoinf. 2012, 14, 112–128. [Google Scholar] [CrossRef]
  20. de Carvalho Rocha, W.F.; Sabin, G.P.; Março, P.H.; Poppi, R.J. Quantitative analysis of piroxicam polymorphs pharmaceutical mixtures by hyperspectral imaging and chemometrics. Chemom. Intell. Lab. Syst. 2011, 106, 198–204. [Google Scholar] [CrossRef]
  21. de Moura França, L.; Pimentel, M.F.; da Silva Simões, S.; Grangeiro, S.; Prats-Montalbán, J.M.; Ferrer, A. NIR hyperspectral imaging to evaluate degradation in captopril commercial tablets. Eur. J. Pharm. Biopharm. 2016, 104, 180–188. [Google Scholar] [CrossRef] [PubMed]
  22. Edelman, G.J.; Gaston, E.; van Leeuwen, T.G.; Cullen, P.J.; Aalders, M.C.G. Hyperspectral imaging for non-contact analysis of forensic traces. Forensic Sci. Int. 2012, 223, 28–39. [Google Scholar] [CrossRef] [PubMed] [Green Version]
  23. Silva, C.S.; Pimentel, M.F.; Honorato, R.S.; Pasquini, C.; Prats-Montalbán, J.M.; Ferrer, A. Near infrared hyperspectral imaging for forensic analysis of document forgery. Analyst 2014, 139, 5176–5184. [Google Scholar] [CrossRef] [PubMed] [Green Version]
  24. Fernández de la Ossa, M.Á.; Amigo, J.M.; García-Ruiz, C. Detection of residues from explosive manipulation by near infrared hyperspectral imaging: A promising forensic tool. Forensic Sci. Int. 2014, 242, 228–235. [Google Scholar] [CrossRef]
  25. Wu, D.; Sun, D.-W. Advanced applications of hyperspectral imaging technology for food quality and safety analysis and assessment: A review—Part II: Applications. Innov. Food Sci. Emerg. Technol. 2013, 19, 15–28. [Google Scholar] [CrossRef]
  26. Feng, Y.-Z.; Sun, D.-W. Application of Hyperspectral Imaging in Food Safety Inspection and Control: A Review. Crit. Rev. Food Sci. Nutr. 2012, 52, 1039–1058. [Google Scholar] [CrossRef]
  27. Lorente, D.; Aleixos, N.; Gomez-Sanchis, J.; Cubero, S.; Garcia-Navarrete, O.L.; Blasco, J.; Gómez-Sanchis, J.; Cubero, S.; García-Navarrete, O.L.; Blasco, J. Recent Advances and Applications of Hyperspectral Imaging for Fruit and Vegetable Quality Assessment. Food Bioprocess Technol. 2011, 5, 1121–1142. [Google Scholar] [CrossRef]
  28. Lu, G.; Fei, B. Medical hyperspectral imaging: A review. J. Biomed. Opt. 2014, 19, 10901. [Google Scholar] [CrossRef]
  29. Calin, M.A.; Parasca, S.V.; Savastru, D.; Manea, D. Hyperspectral imaging in the medical field: Present and future. Appl. Spectrosc. Rev. 2014, 49, 435–447. [Google Scholar] [CrossRef]
  30. Li, Q.; He, X.; Wang, Y.; Liu, H.; Xu, D.; Guo, F. Review of spectral imaging technology in biomedical engineering: Achievements and challenges. J. Biomed. Opt. 2013, 18, 100901. [Google Scholar] [CrossRef] [PubMed] [Green Version]
  31. Halicek, M.; Fabelo, H.; Ortega, S.; Callico, G.M.; Fei, B. In-Vivo and Ex-Vivo Tissue Analysis through Hyperspectral Imaging Techniques: Revealing the Invisible Features of Cancer. Cancers 2019, 11, 756. [Google Scholar] [CrossRef] [PubMed] [Green Version]
  32. Akbari, H.; Kosugi, Y. Hyperspectral imaging: A new modality in surgery. In Recent Advances in Biomedical Engineering; IntechOpen: London, UK, 2009. [Google Scholar]
  33. Baltussen, E.J.M.; Kok, E.N.D.; Brouwer de Koning, S.G.; Sanders, J.; Aalbers, A.G.J.; Kok, N.F.M.; Beets, G.L.; Flohil, C.C.; Bruin, S.C.; Kuhlmann, K.F.D.; et al. Hyperspectral imaging for tissue classification, a way toward smart laparoscopic colorectal surgery. J. Biomed. Opt. 2019, 24, 016002. [Google Scholar] [CrossRef] [PubMed]
  34. Pourreza-Shahri, R.; Saki, F.; Kehtarnavaz, N.; Leboulluec, P.; Liu, H. Classification of ex-vivo breast cancer positive margins measured by hyperspectral imaging. In Proceedings of the 2013 IEEE International Conference on Image Processing (ICIP 2013), Melbourne, VIC, Australia, 15–18 September 2013; pp. 1408–1412. [Google Scholar]
  35. Liu, Z.; Wang, H.; Li, Q. Tongue tumor detection in medical hyperspectral images. Sensors 2012, 12, 162–174. [Google Scholar] [CrossRef] [PubMed] [Green Version]
  36. Akbari, H.; Kosugi, Y.; Kojima, K.; Tanaka, N. Detection and Analysis of the Intestinal Ischemia Using Visible and Invisible Hyperspectral Imaging. IEEE Trans. Biomed. Eng. 2010, 57, 2011–2017. [Google Scholar] [CrossRef] [PubMed]
  37. Akbari, H.; Halig, L.V.; Schuster, D.M.; Osunkoya, A.; Master, V.; Nieh, P.T.; Chen, G.Z.; Fei, B. Hyperspectral imaging and quantitative analysis for prostate cancer detection. J. Biomed. Opt. 2012, 17, 0760051. [Google Scholar] [CrossRef]
  38. Akbari, H.; Uto, K.; Kosugi, Y.; Kojima, K.; Tanaka, N. Cancer detection using infrared hyperspectral imaging. Cancer Sci. 2011, 102, 852–857. [Google Scholar] [CrossRef]
  39. Halicek, M.; Lu, G.; Little, J.V.; Wang, X.; Patel, M.; Griffith, C.C.; El-Deiry, M.W.; Chen, A.Y.; Fei, B. Deep convolutional neural networks for classifying head and neck cancer using hyperspectral imaging. J. Biomed. Opt. 2017, 22, 060503. [Google Scholar] [CrossRef]
  40. Halicek, M.; Fabelo, H.; Ortega, S.; Little, J.V.; Wang, X.; Chen, A.Y.; Callicó, G.M.; Myers, L.; Sumer, B.; Fei, B. Cancer detection using hyperspectral imaging and evaluation of the superficial tumor margin variance with depth. In Medical Imaging 2019: Image-Guided Procedures, Robotic Interventions, and Modeling; Fei, B., Linte, C.A., Eds.; SPIE: Bellingham, WA, USA, 2019; Volume 10951, p. 45. [Google Scholar]
  41. APU, A.P.U. Zynq-7000 All Programmable SoC Overview. Available online: https://cdn.hackaday.io/files/19354828041536/ds190-Zynq-7000-Overview.pdf (accessed on 27 October 2019).
  42. Zedboard.org ZedBoard (Zynq Evaluation and Development) Hardware User’s Guide. Available online: http://www.zedboard.org/sites/default/files/documentations/ZedBoard_HW_UG_v2_2.pdf (accessed on 27 October 2019).
  43. Xilinx Documentation ZC706 Evaluation Board for the Zynq-7000 XC7Z045 SoC-User Guide. Available online: https://www.xilinx.com/support/documentation/boards_and_kits/zc706/ug954-zc706-eval-board-xc7z045-ap-soc.pdf (accessed on 27 October 2019).
  44. Cacciotti, M.; Camus, V.; Schlachter, J.; Pezzotta, A.; Enz, C. Hardware Acceleration of HDR-Image Tone Mapping on an FPGA-CPU Platform Through High-Level Synthesis. In Proceedings of the 2018 31st IEEE International System-on-Chip Conference (SOCC), Arlington, VA, USA, 4–7 September 2018; IEEE: Piscataway, NJ, USA, 2018; pp. 158–162. [Google Scholar]
  45. Kowalczyk, M.; Przewlocka, D.; Krvjak, T. Real-Time Implementation of Contextual Image Processing Operations for 4K Video Stream in Zynq UltraScale+ MPSoC. In Proceedings of the Conference on Design and Architectures for Signal and Image Processing (DASIP), Porto, Portugal, 10–12 October 2018; pp. 37–42. [Google Scholar]
  46. Xilinx Documentation SDSoC Environment User Guide UG1027. Available online: https://www.xilinx.com/support/documentation/sw_manuals/xilinx2017_4/ug1027-sdsoc-user-guide.pdf (accessed on 27 October 2019).
  47. Nethercote, N.; Seward, J. Valgrind: A framework for heavyweight dynamic binary instrumentation. ACM Sigplan Not. 2007, 42, 89–100. [Google Scholar] [CrossRef]
  48. Graham, S.L.; Kessler, P.B.; Mckusick, M.K. Gprof: A call graph execution profiler. ACM Sigplan Not. 1982, 17, 120–126. [Google Scholar] [CrossRef]
  49. VAPNIK, V. Estimation of Dependences Based on Empirical Data; Springer: Cham, Switzerland, 2006; ISBN 9780387342399. [Google Scholar]
  50. Boser, B.E.; Guyon, I.M.; Vapnik, V.N. A training algorithm for optimal margin classifiers. In Proceedings of the Fifth Annual Workshop on Computational Learning Theory, Pittsburgh, PA, USA, 27–29 July 1992; pp. 144–152. [Google Scholar]
  51. Hsu, C.-W.; Lin, C.-J. A comparison of methods for multiclass support vector machines. IEEE Trans. Neural Netw. 2002, 13, 415–425. [Google Scholar] [PubMed] [Green Version]
  52. Mountrakis, G.; Im, J.; Ogole, C. Support vector machines in remote sensing: A review. ISPRS J. Photogramm. Remote Sens. 2011, 66, 247–259. [Google Scholar] [CrossRef]
  53. Camps-Valls, G.; Bruzzone, L. Kernel-based methods for hyperspectral image classification. IEEE Trans. Geosci. Remote Sens. 2005, 43, 1351–1362. [Google Scholar] [CrossRef]
  54. Fabelo, H.; Ortega, S.; Lazcano, R.; Madroñal, D.M.; Callicó, G.; Juárez, E.; Salvador, R.; Bulters, D.; Bulstrode, H.; Szolna, A.; et al. An Intraoperative Visualization System Using Hyperspectral Imaging to Aid in Brain Tumor Delineation. Sensors 2018, 18, 430. [Google Scholar] [CrossRef] [Green Version]
  55. Chang, C.-C.; Lin, C.-J. LIBSVM: A library for support vector machines. ACM Trans. Intell. Syst. Technol. 2011, 2, 1–27. [Google Scholar] [CrossRef]
  56. Fabelo, H.; Ortega, S.; Szolna, A.; Bulters, D.; Pineiro, J.F.; Kabwama, S.; J-O’Shanahan, A.; Bulstrode, H.; Bisshopp, S.; Kiran, B.R.; et al. In-Vivo Hyperspectral Human Brain Image Database for Brain Cancer Detection. IEEE Access 2019, 7, 39098–39116. [Google Scholar] [CrossRef]
  57. Fabelo, H.; Ortega, S.; Ravi, D.; Kiran, B.R.; Sosa, C.; Bulters, D.; Callicó, G.M.; Bulstrode, H.; Szolna, A.; Piñeiro, J.F.; et al. Spatio-spectral classification of hyperspectral images for brain cancer detection during surgical operations. PLoS ONE 2018, 13, e0193721. [Google Scholar] [CrossRef] [Green Version]
  58. Kelly, C.; Siddiqui, F.M.; Bardak, B.; Woods, R. Histogram of oriented gradients front end processing: An FPGA based processor approach. In Proceedings of the IEEE Workshop on Signal Processing Systems (SiPS: Design and Implementation), Belfast, UK, 20–22 October 2014; IEEE: Piscataway, NJ, USA, 2014. [Google Scholar]
  59. Mahmoodi, D.; Soleimani, A.; Khosravi, H.; Taghizadeh, M. FPGA Simulation of Linear and Nonlinear Support Vector Machine. J. Softw. Eng. Appl. 2011, 4, 320–328. [Google Scholar] [CrossRef] [Green Version]
  60. Patil, R.A.; Gupta, G.; Sahula, V.; Mandal, A.S. Power aware hardware prototyping of multiclass SVM classifier through reconfiguration. In Proceedings of the IEEE International Conference on VLSI Design, Hyderabad, India, 7–11 January 2012; pp. 62–67. [Google Scholar]
  61. Cutajar, M.; Gatt, E.; Grech, I.; Casha, O.; Micallef, J. Hardware-based support vector machine for phoneme classification. In Proceedings of the IEEE EuroCon 2013, Zagreb, Croatia, 1–4 July 2013; pp. 1701–1708. [Google Scholar]
  62. Mandal, B.; Sarma, M.P.; Sarma, K.K.; Mastorakis, N. Implementation of Systolic Array Based SVM Classifier Using Multiplierless Kernel. In Proceedings of the 16th International Conference on Automatic Control, Modelling & Simulation (ACMOS’14), Brasov, Romania, 26–28 June 2014; ISBN 9789604743834. [Google Scholar]
  63. Khosravi, H.; Kabir, E. Introducing a very large dataset of handwritten Farsi digits and a study on their varieties. Pattern Recognit. Lett. 2007, 28, 1133–1141. [Google Scholar] [CrossRef]
  64. Lucey, P.; Cohn, J.F.; Kanade, T.; Saragih, J.; Ambadar, Z.; Matthews, I. The extended Cohn-Kanade dataset (CK+): A complete dataset for action unit and emotion-specified expression. In Proceedings of the 2010 IEEE Computer Society Conference on Computer Vision and Pattern Recognition-Workshops (CVPRW 2010), San Francisco, CA, USA, 13–18 June 2010; pp. 94–101. [Google Scholar]
  65. Garofolo, J.S.; Lamel, L.F.; Fisher, W.M.; Fiscus, J.G.; Pallett, D.S. DARPA TIMIT Acoustic-Phonetic Continous Speech Corpus CD-ROM. NIST Speech Disc 1-1.1; NASA STI/Recon Technical Report N: Gaithersburg, MD, USA, 1993; Volume 93.
Figure 1. Proposed modification in the Software-Defined System-On-Chip (SDSoC) Design Flow.
Electronics 08 01494 g001
Figure 2. Hyperspectral (HS) in vivo brain human database. (a) Example of the HS cube basis [31]. (bd) are synthetic red, green, and blue (RGB) representations of the HS images employed in this study for results validation (OP8C1, OP12C1, and OP20C1, respectively), where the tumor area is surrounded in yellow [56]. The size of the HS image in terms of pixels×bands and megabytes is shown below each RGB representation.
Electronics 08 01494 g002
Figure 3. Support vector machine (SVM) binary code refactoring. (a) Original code. (b) Refactorized code for transferring a block of pixels. (c) Refactorized code for parallelizing the data processing in groups of eight elements.
Electronics 08 01494 g003
Figure 4. Diagram of the improving on transferring and processing data.
Electronics 08 01494 g004
Figure 5. Speedup obtained varying the amount of pixels per clock cycle (100 MHz for data movers and accelerated function).
Electronics 08 01494 g005
Figure 6. Speedup obtained varying the amount of pixels per clock cycle and accumulators (200 MHz for data movers and accelerated function).
Electronics 08 01494 g006
Figure 7. Execution time (a) and speedup (b) results respect to the software (SW) implementation of both hardware (HW) implementations (F = full, M = modular) in each processing platform.
Electronics 08 01494 g007
Figure 8. Resources consumption for both implementations (F = full, M = modular) in both platforms.
Electronics 08 01494 g008
Table 1. Power consumption for both implementations (F = full, M = modular).
ZedBoard (ZC7020)ZC706 (ZC7045)
TypeFMFM
Dynamic Power (W)2.421.892.611.91
Static Power (W)0.170.150.220.21
Total (W)2.592.042.842.13
Table 2. Comparison of the speedup, power consumption, and resources employed among the different implementations. Bold values represent the best results for the specific resource or feature.
Reference Method[59][60][61][62]Proposed (M Version)
DeviceXilinx Virtex-4Xilinx Virtex-6Xilinx Virtex-IIXilinx Virtex-7ZC7020 (ZedBoard)ZC7045 (ZC706)
ToolSystem GeneratorXilinx ISEn/aXilinx XPE 14.1SDSOC 2018.2SDSOC 2018.2
Clock rate (MHz)202.84n/a42.012n/a200200
Speedup factorn/an/a2.53n/a2.202.86
Power (W)n/a2.02n/a1.702.042.13
Slice Registers (%)5.000.1521.0011.00n/an/a
Slice LUTs (%)2.000.3520.0011.00n/an/a
LUTs (%)n/an/an/an/a20.224.84
LUTRAM (%)n/an/an/an/a4.301.00
FF (%)4.0032.002.00100.0014.182.76
IOBs (%)37.0037.0020.004.00n/an/a
DSP (%)14.000.91n/a0.0015.453.78
BUFG (%)3.003.00n/an/a9.389.38
BRAM (%)n/an/an/an/a6.071.56
MMCM (%)n/an/an/an/a25.0012.50
n/a: Data not available, LUTs: Look Up Tables, LUTRAM: LUTs used as RAM, FFs: Flip Flops, IOBs: Input/Output Blocks, DSPs: Digital Signal Processors, BUFG: Global Clock Buffer, BRAM: Block RAM, MMCM: Mixed-Mode Clock Manager.