Article

A Method Based on Multi-Sensor Data Fusion for UAV Safety Distance Diagnosis

1
College of Mechanical and Electrical Engineering, Kunming University of Science and Technology, Kunming 650504, China
2
College of Science, Kunming University of Science and Technology, Kunming 650504, China
*
Author to whom correspondence should be addressed.
Electronics 2019, 8(12), 1467; https://doi.org/10.3390/electronics8121467
Submission received: 5 November 2019 / Revised: 26 November 2019 / Accepted: 28 November 2019 / Published: 3 December 2019
(This article belongs to the Special Issue Advanced Control Systems for Electric Drives)

Abstract

:
With the increasing application of unmanned aerial vehicles (UAVs) to the inspection of high-voltage overhead transmission lines, the study of the safety distance between drones and wires has received extensive attention. The determination of the safety distance between the UAV and the transmission line is of great significance to improve the reliability of the inspection operation and ensure the safe and stable operation of the power grid and inspection equipment. Since there is no quantitative data support for the safety distance of overhead transmission lines in UAV patrol, it is impossible to provide accurate navigation information for UAV safe obstacle avoidance. This paper proposes a mathematical model based on a multi-sensor data fusion algorithm. The safety distance of the line drone is diagnosed. In these tasks, firstly, the physical model of the UAV in the complex electromagnetic field is established to determine the influence law of the UAV on the electric field distortion and analyze the maximum electric and magnetic field strength that the UAV can withstand. Then, based on the main factors affecting the UAV such as the maximum wind speed, inspection speed, positioning error, and the size of the drone, the adaptive weighted fusion algorithm is used to perform first-level data fusion on the homogeneous sensor data. Then, based on the improved evidence, the theory performs secondary fusion on the combined heterogeneous sensor data. According to the final processing result and the type of proposition set, we diagnose the current safety status of the drone to achieve an adaptive adjustment of the safety distance threshold. Lastly, actual measurement data is used to verify the mathematical model. The experimental results show that the mathematical model can accurately identify the safety status of the drone and adaptively adjust the safety distance according to the diagnosis result and surrounding environment information.

1. Introduction

With the continuous development of power systems, in order to ensure the safe and stable operation of a power system, the power industry needs to conduct regular inspections on overhead transmission lines, grasp the environment around the transmission line and its operation in a timely manner, and deal with potential problems accordingly [1,2,3]. The traditional transmission line inspections are mostly manual. In this way, the inspection line is very hard, and the operation period is very long. It is difficult to reach some blind spots with complicated or even dangerous terrain [4]. Due to its strong maneuverability, simple operation, various forms, high efficiency, and low cost, the unmanned aerial vehicle (UAV) inspection line has been widely used by domestic and foreign power companies for the inspection of transmission lines [5,6].
In order to accurately and clearly collect the operation and fault information of the power line, the UAV needs to be inspected close to the tower and the transmission line. However, the complex electromagnetic field environment around the high-voltage transmission line has a great influence on the inspection system, the navigation, and the communication system of the UAV. If the distance between the transmission line and the drone is too close, the complex electromagnetic environment will cause interference to the electronic components that make up the control system, resulting in data transmission interruption and equipment failure, affecting the flight performance of the drone, and even causing the drone to crash into the power line or other safety accidents. In such cases, the UAV will not complete the line inspection task. However, if this distance is too far, the drone’s inspection system will not have the best inspection effect [7]. Accurate measurement of the safety distance between the UAV and the transmission line is a key factor restricting the development of the UAV transmission line inspection system. Accurately measuring the safe distance of the drone relative to the overhead transmission line is a challenge in the UAV line-of-sight system. An accurate measurement of the safety distance can not only ensure the safety of the power grid, the equipment, and the drones, but also improve the quality and reliability of the drone’s inspection of long-distance outdoor high-voltage transmission lines.
In order to improve the mobility of the UAV inspection, to enable the UAV to perform inspections under a variety of working conditions, and to improve the safety and reliability of the UAV line inspection operations, accurately determine the safety between the drone and the transmission line distance is very important. Therefore, it is necessary to quantify the safe distance between the UAV and the transmission line. Some researchers have judged the safety distance through the detection and identification of power lines and achieved good research results. There are some more representative methods. Some researchers have used spectrum-space methods to detect power lines in UAV remote sensing images. Using k-means and the expectation maximization (EM) algorithm for spectral clustering, the pixels are divided into power lines and non-power lines. Thereby, the autonomous inspection of the power line by the drone can be further achieved [8]. Other researchers have used lidar, vision sensors, and infrared cameras to detect transmission lines for navigation and obstacle avoidance [9,10,11]. However, these methods have certain limitations. Although the laser ranging has high accuracy and the laser scanning method is used to realize the transmission line detection, it has a significant effect on the inspection of the drone. The load of the aircraft reduces the flying efficiency of the drone. At the same time, the processing of data is complicated because the information of power transmission lines and towers extracted from the pictures taken by laser point clouds and vision sensors is affected by the complex environment. The data collected by these methods mainly depend on manual processing, and the work efficiency is low.
In order to solve the detection errors problem of infrared cameras and lidars due to environmental factors such as temperature differences and the atmosphere, some researchers have used the edge detection method to effectively extract power lines and suppress non-power line features [12]. However this method is easily affected by straight roads and rivers and cannot extract the characteristics of transmission lines well. In [13], Matikainen et al. provided an extensive overview of the possibilities offered by modern remote sensing sensors in power line corridor surveys and discussed the potential and limitations of different approaches. The monitoring of power line components and their surrounding vegetation uses visual, near-infrared, and multispectral images. In [14], the researchers proposed a method to process continuous images with telemetry data sent by the autopilot, identify online vegetation, trees, and building areas near the power line, and calculate the relationship between power lines and vegetation, trees, and buildings the distance. At the same time, the system processes the images captured by the infrared camera to detect the poor conductivity and hot spots of power lines, transformers, and substations. In [15], a method for determining the safe flight area of a UAV patrol inspection based on an electromagnetic field calculation was proposed. The field strength distribution around the transmission line and the maximum electromagnetic field strength of the electronic equipment carried by the UAV were analyzed through simulation to realize the control of the prediction of a safe flight distance for UAV inspection. In [16], a method for avoiding obstacles of overhead transmission lines based on multi-sensor information fusion and cylindrical space inspection was proposed. These methods can better realize the detection and identification of power lines to a certain extent. They can also better solve the inspection of transmission lines by line inspection drones and achieve autonomous obstacle avoidance. However, these methods need to extract the transmission lines from a messy background due to its characteristics, it is difficult to process the data, the real-time performance is poor, and the efficiency of UAV inspection cannot be met.
The accurate measurement of safety distance is a key technology. At present, in the practical application of UAV inspection power line engineering, there is still no stable and reliable method to achieve autonomous line inspection and autonomous obstacle avoidance navigation. Operators still need to judge by subjective experience. Under the premise of ensuring that the drone is in a controllable range, the operator can use the control handle to make the drone is as close to the transmission line as possible to complete the inspection work [17]. This method can effectively avoid the occurrence of line inspection safety accidents; however, when the drone is far away from the control personnel, it is difficult to accurately control it, which limits the performance of the drone operation to a great extent. Relying on the stable electric field and magnetic field information around the transmission line to navigate the UAV can effectively solve the limitations of traditional sensors and the difficulty of data processing. The accurate measurement of the safety distance between the UAV and the transmission line has become a key factor affecting the development of the UAV transmission line inspection system [18]. Therefore, the study of the safety distance threshold can provide data support for the navigation of the UAV inspection operation, and it is of great significance for the navigation of the UAV autonomous obstacle avoidance navigation and the improvement of the safety and reliability of the inspection operation.
Based on the status of the research, this paper proposes an adaptive multi-sensor data fusion algorithm for multi-sensor data fusion on the electromagnetic field strength of the UAV’s safe flight, the performance of the UAV control system, and the size of the UAV. According to the result and the type of proposition set, we judge the current safety status of the drone to realize the UAV’s adaptive adjustment of the safety distance threshold. Finally, the mathematical model was verified by using certain inspection data. The experimental results show that the mathematical model can accurately identify the safety status of drones. UAVs that use this mathematical model for line inspection can be adaptively adjusted according to the surrounding environmental factors’ safe distance. The multi-sensor adaptive fusion has a clear distinction of credibility, which better solves the problem that a single safety threshold adapts to a single condition, which brings about a large cruise error due to the field source positioning error.
The rest of the paper is organized as follows. Section 2 establishes the physical model of the UAV patrol overhead transmission line, analyzes the influence of the UAV on the electric field distribution and the variation law of the maximum distorted electric field on the surface of the UAV, and analyzes the anti-electromagnetic interference performance of the UAV. In Section 3, based on the multi-sensor data fusion algorithm, the mathematical model of autonomous obstacle avoidance navigation is established. The main influencing factors affecting the safety distance of the UAV are considered comprehensively, and the decision of the UAV inspection status based on the fusion result and the set proposition is realized. In Section 4, according to the actual situation of the UAV patrol overhead transmission line, the patrol data is collected to verify the mathematical model in the text, the results are analyzed, and finally, the scientific, practical, limitations, and considerations of the proposed algorithm and mathematical model are discussed in Section 5.

2. Materials and Methods

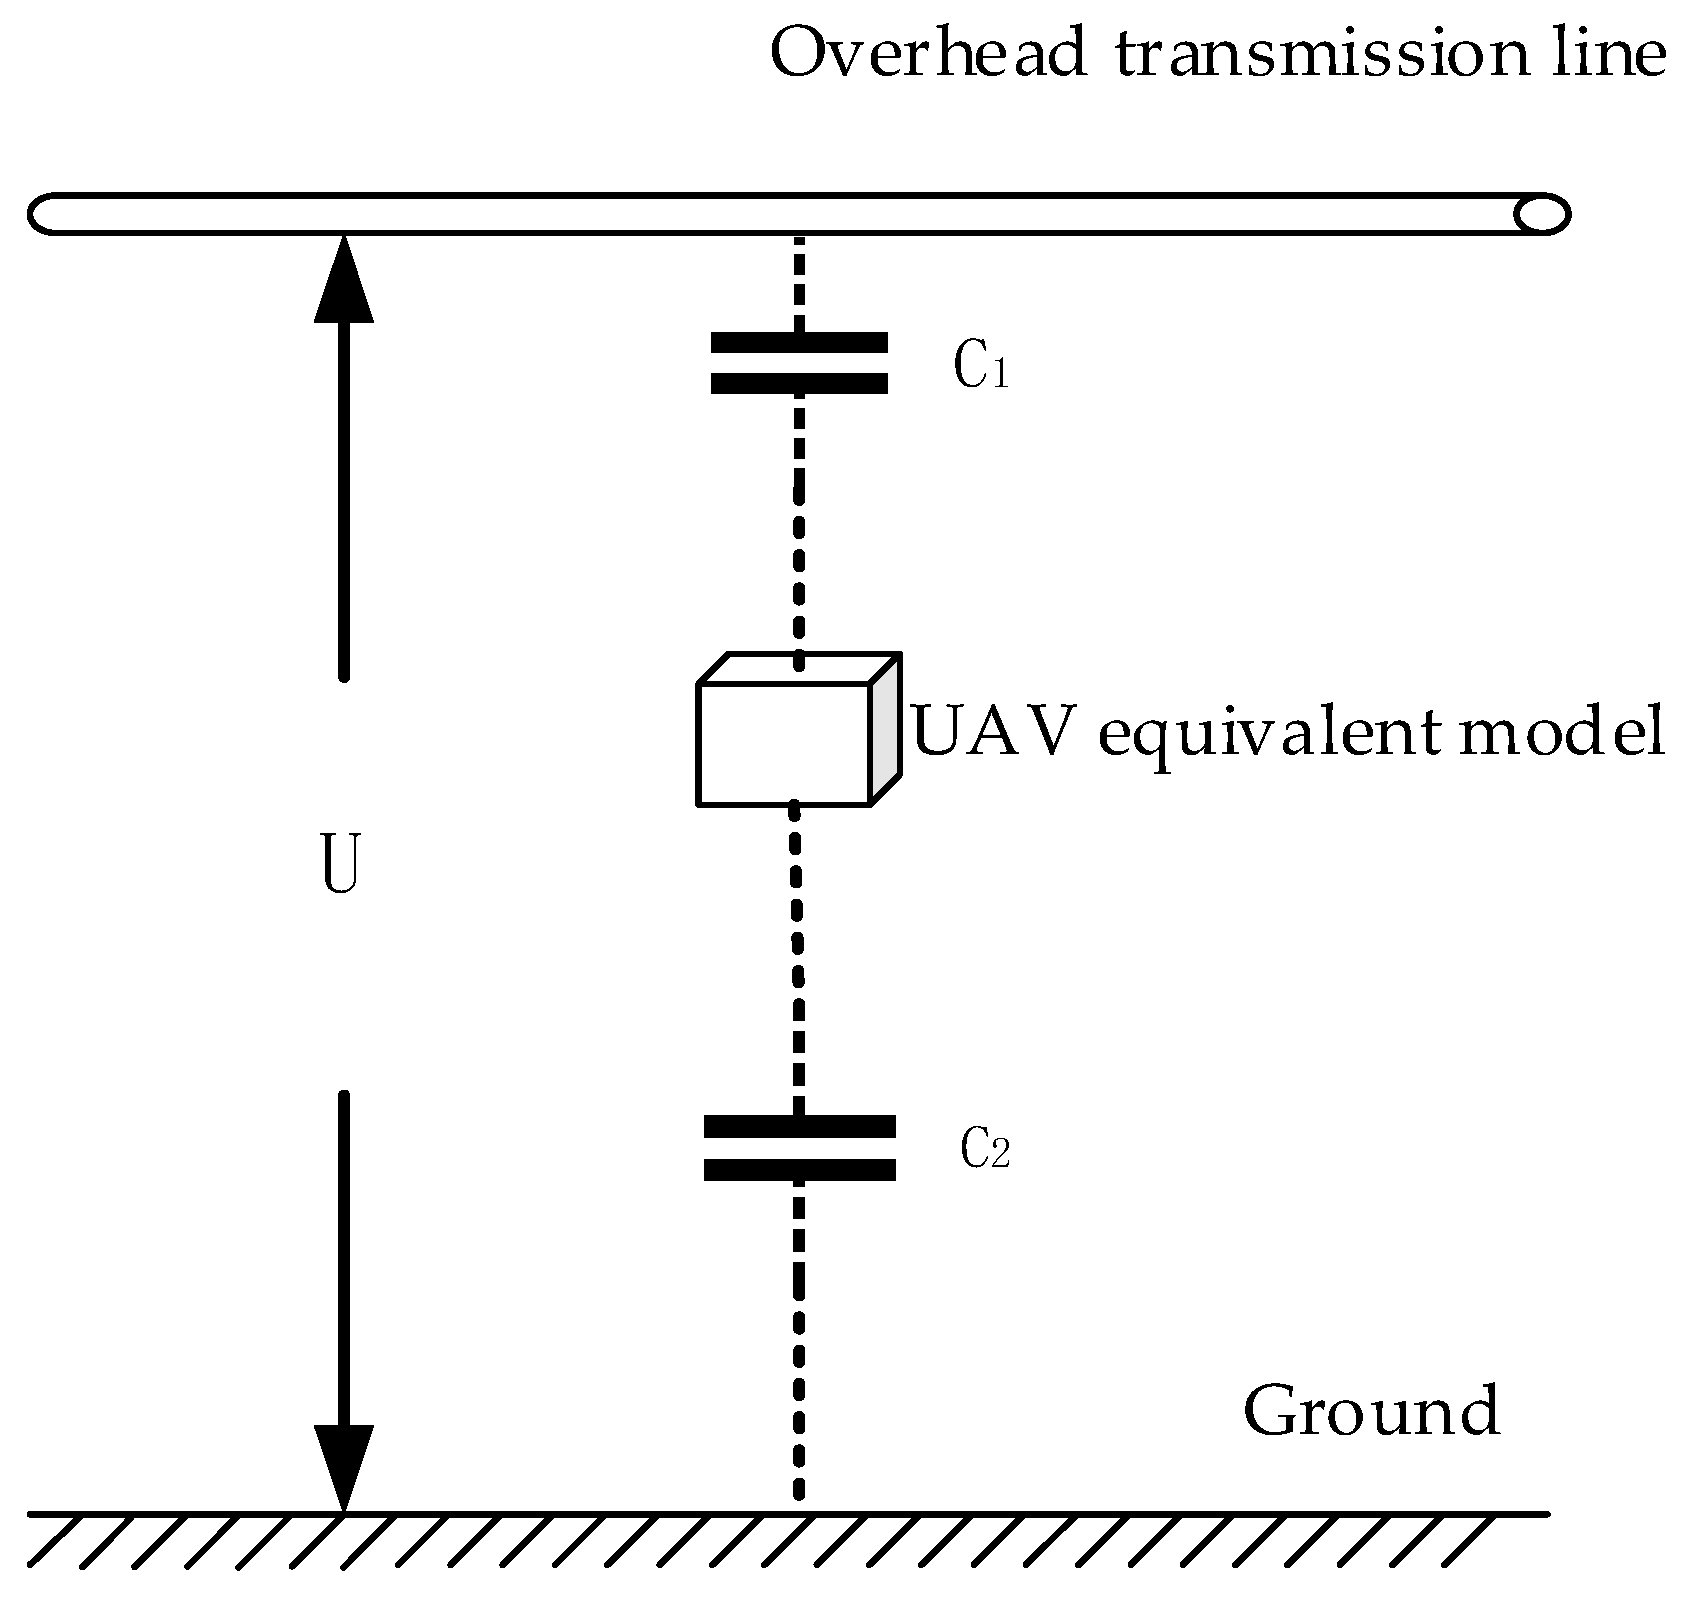
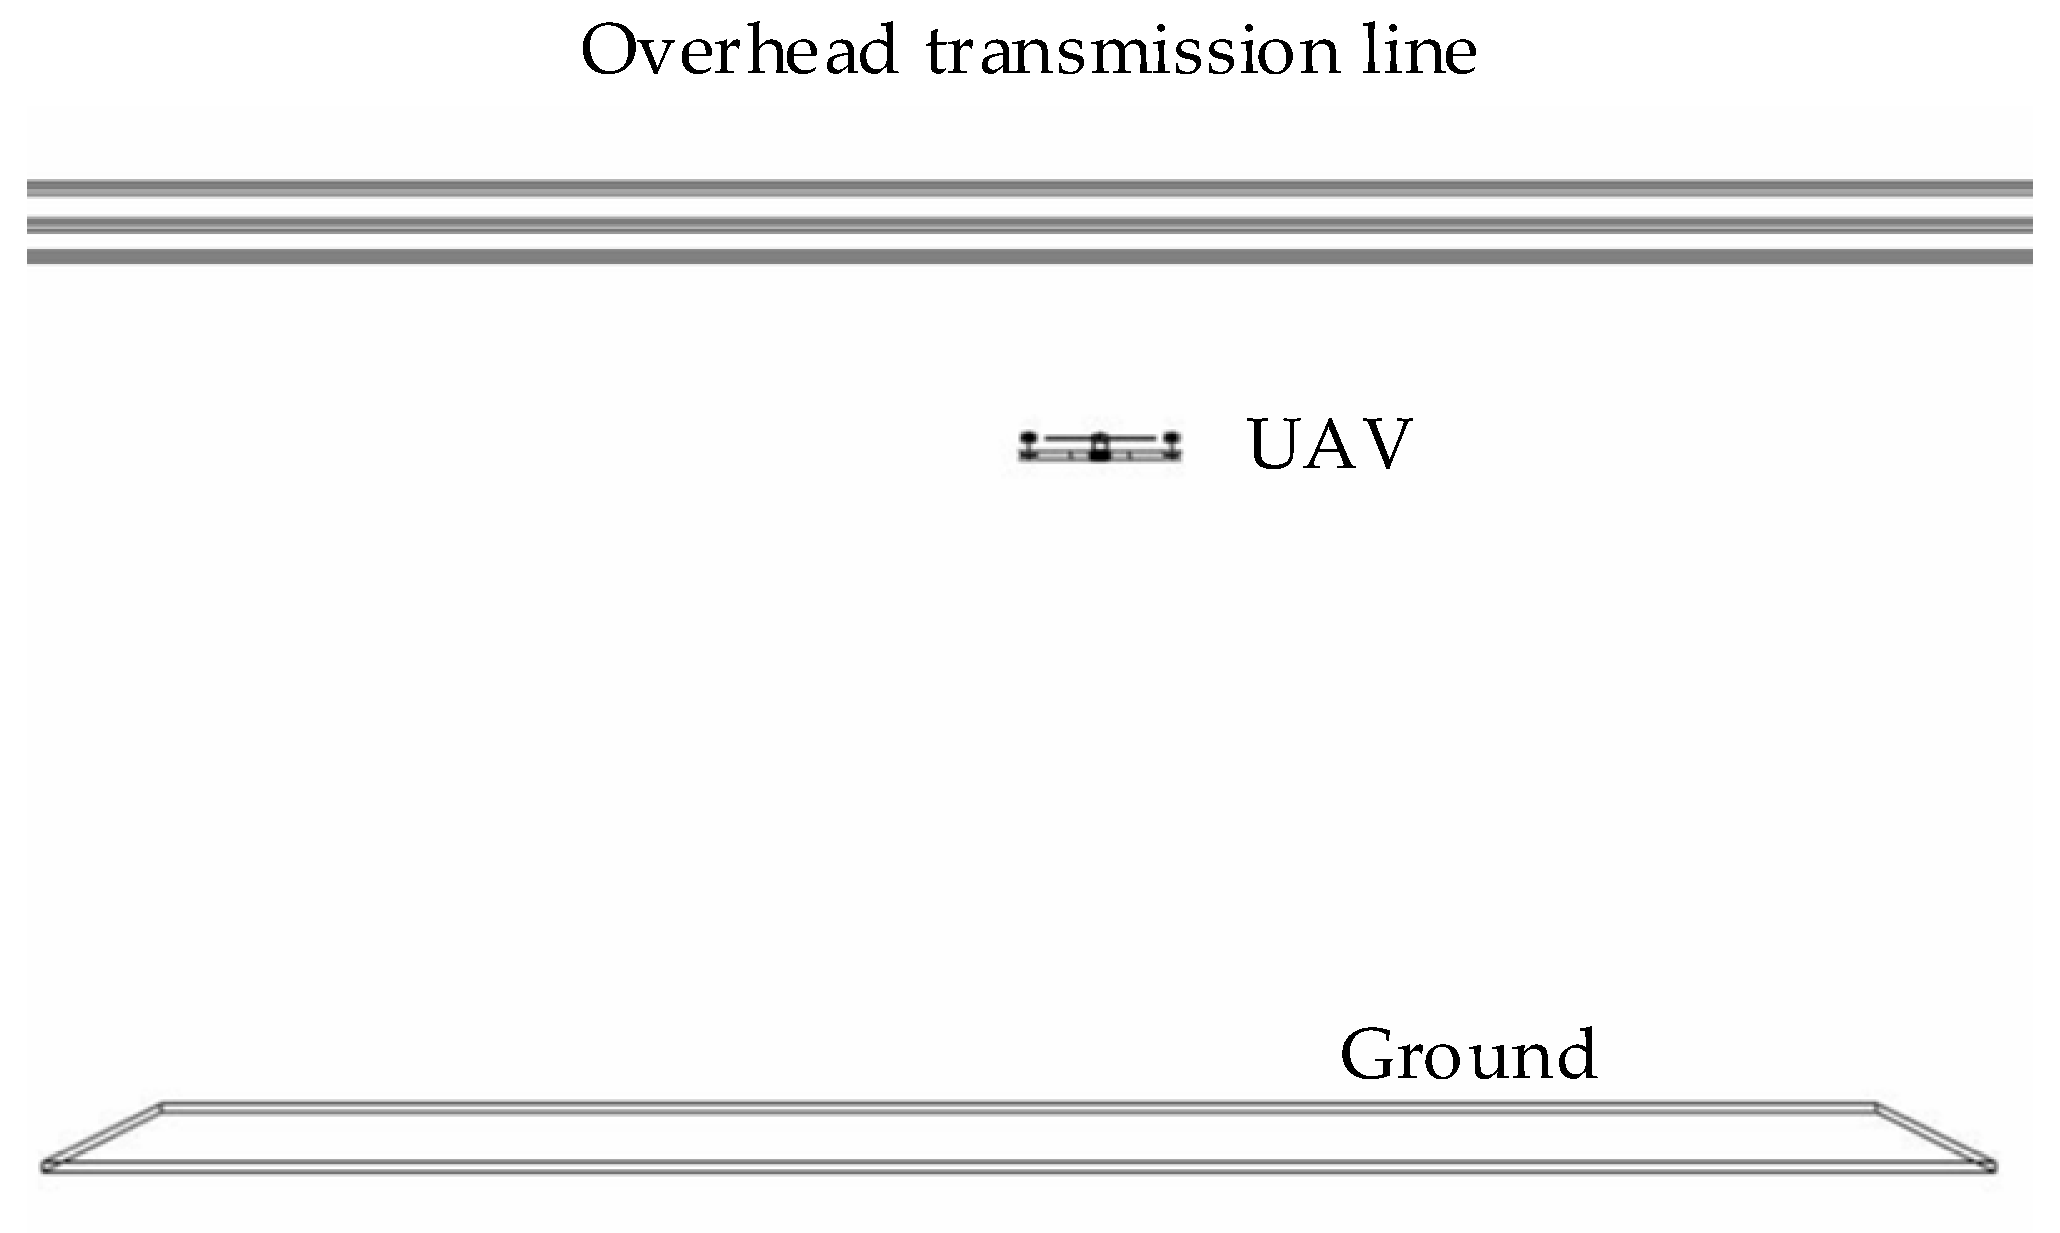
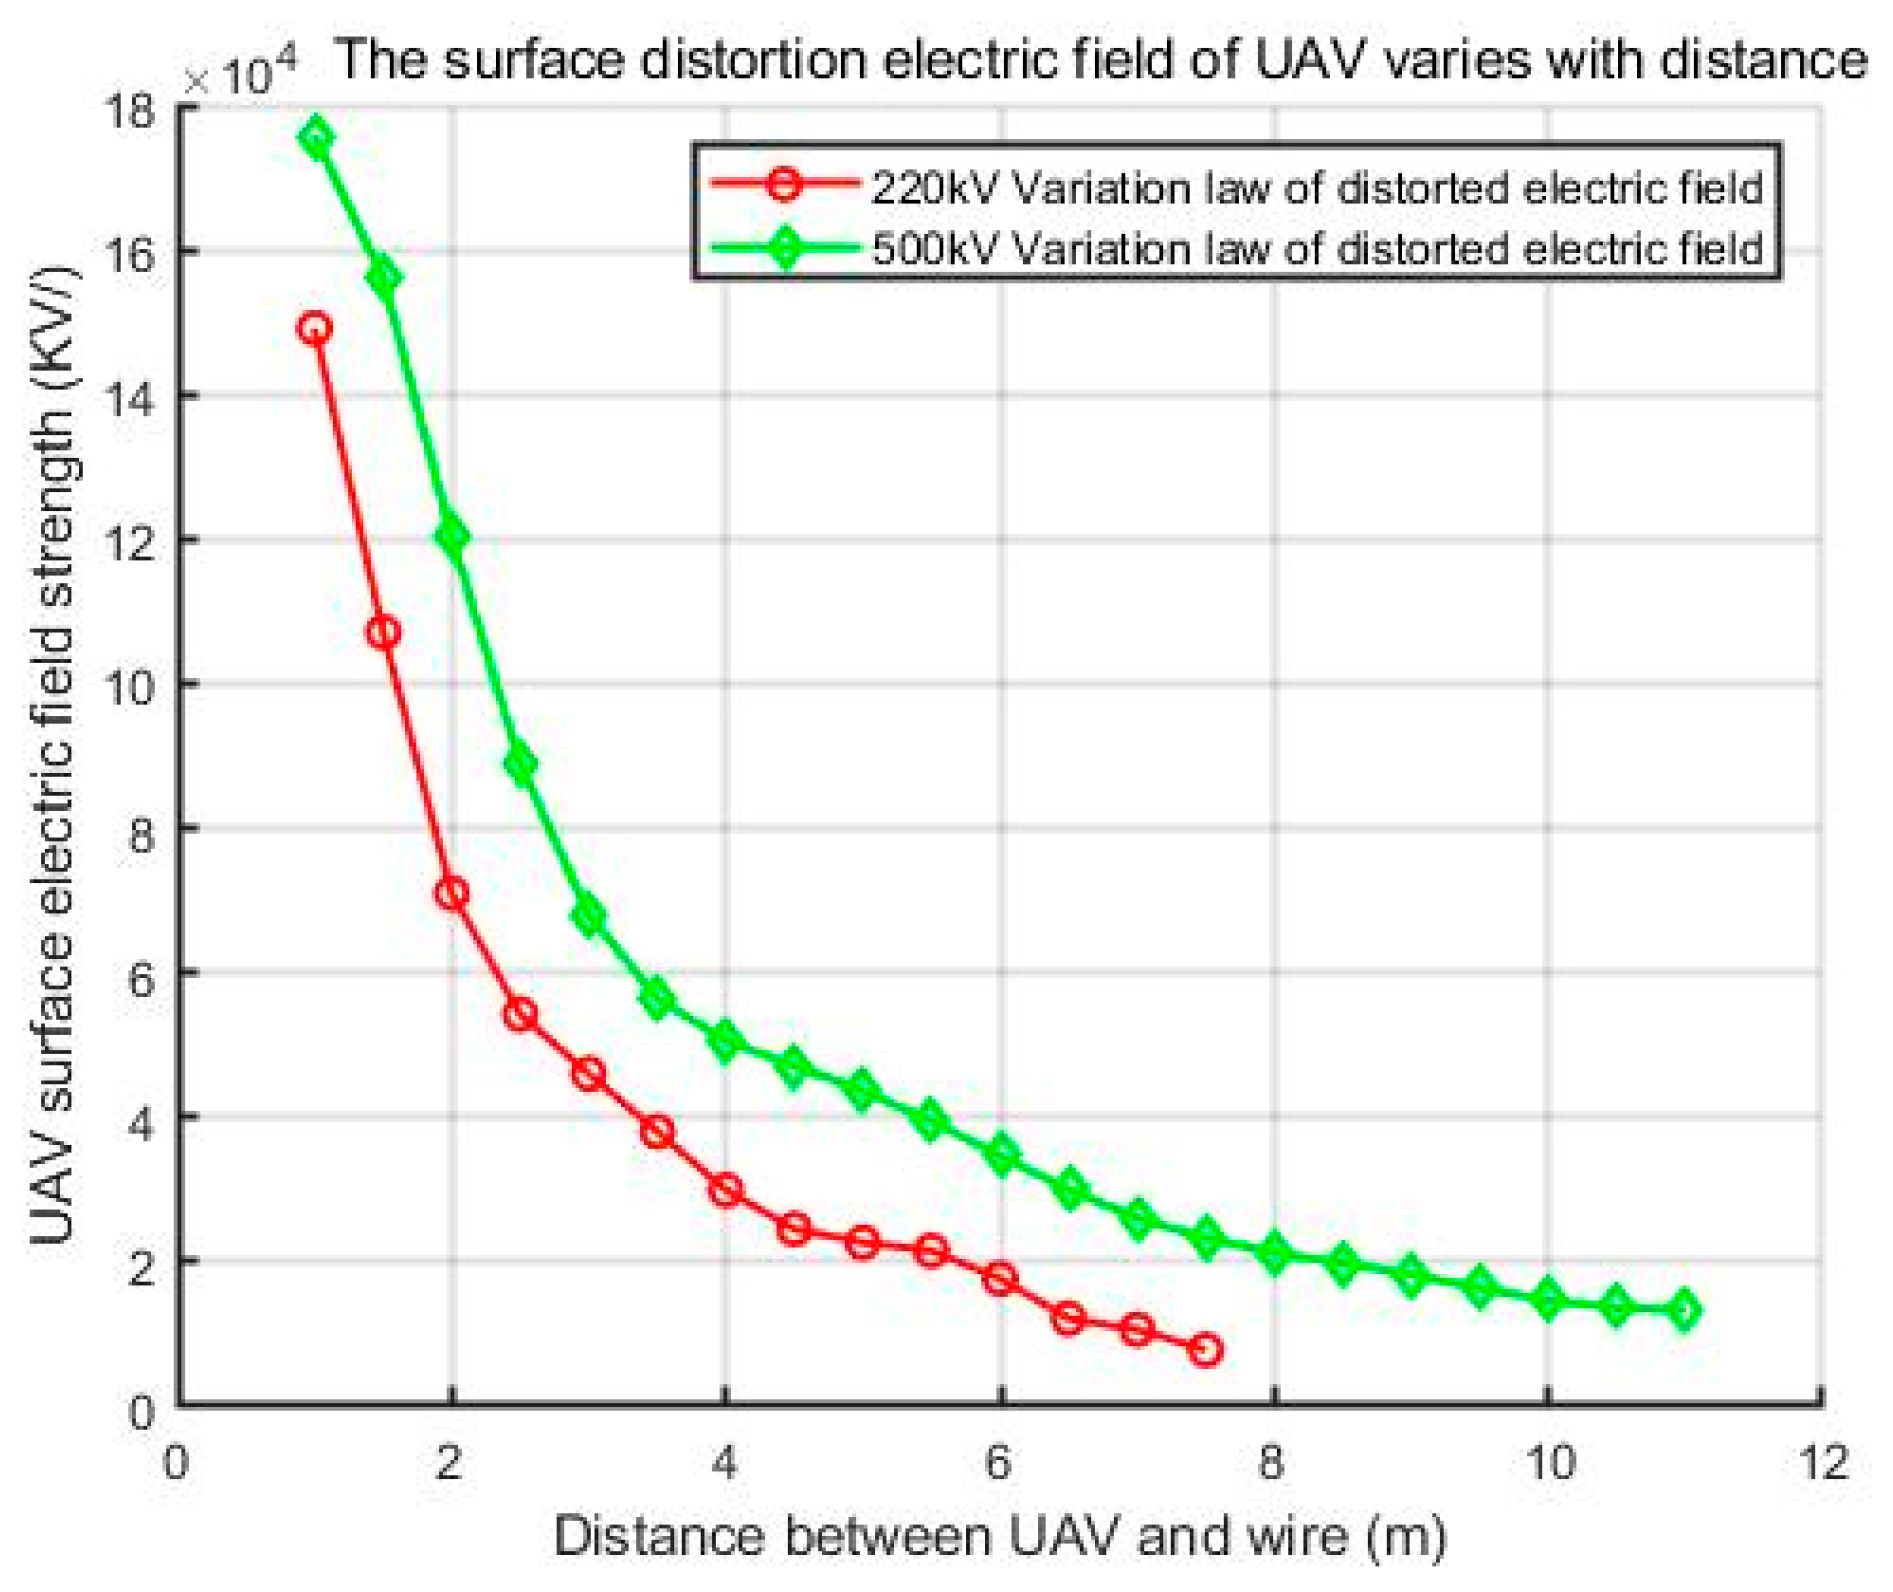
2.1. Analysis of the Influence of Distorted Electric Field on UAV

When a patrol drone is placed as an electric conductor in an electric field, an induced electric charge is generated on its surface to form an induced electric field. The superposition of the induced electric field with the original electric field changes the distribution of the original electric field to form a "distorted electric field" [19]. When the UAV is inspected near the overhead transmission line, the influence of the "distortion field" on the drone is much greater than that of the original field on the drone, the distortion is not linear, and it is difficult to completely eliminate it. Therefore, the analysis of the distortion generated by the UAV in the electric field is of great significance for the accurate identification of the safety distance threshold.
During the inspection of the overhead transmission line with a power frequency voltage, when the UAV is located under the transmission line for inspection, a capacitor series circuit is formed between the UAV, the overhead transmission line, and the ground. Its equivalent physical model is shown in Figure 1.
As shown in Figure 1, where U is the phase voltage of the overhead transmission line, C1 is the equivalent capacitance between the UAV and the transmission line, and C2 is the equivalent capacitance between the UAV and the ground.
It can be seen from the analysis in Figure 1 that when the UAV is near the transmission line for patrol inspection, a capacitor series circuit is formed among the UAV, the overhead transmission line, and the ground, and there will be impedance among the UAV, the transmission line, and the ground.
Here, the impedance between the UAV and the transmission wire can be expressed as:
Z 1 = k D 1
where k is the rate of impedance change, which is related to external environmental factors, and D1 is the distance between the UAV and overhead transmission wire.
Therefore, the physical model of the field strength between the drone and the wire during the inspection process can be expressed as:
E 1 = U k Z 1 + Z 2
where U is the voltage between the conductor and the ground, Z1 is the impedance between the UAV and the transmission conductor, and Z2 is the impedance between the UAV and the ground.
Since the distance between the UAV and the conductor is far less than the distance between the UAV and the ground, the impedance change between the UAV and the ground in the inspection process is much smaller than that between the UAV and the transmission conductor, so the impedance between the UAV and the ground can be regarded as a fixed value [20]. Therefore, the analysis in Formula (2) shows that with the voltage U remaining unchanged, as the distance D1 between the drone and the wire decreases, the field strength E1 between them gradually increases, and if D1 is extremely small, the air between the drone and the transmission line is broken down, causing the phenomenon of induced electrification. The field strength E1 enhancement will interfere with the normal operation of the drone. In order to study the distortion of the electric field by the drone, the drone line is established. The simulation model is shown in Figure 2.
The main components of the patrol drone are modeled, and the finite element analysis method is used to simulate the UAV model placed in the electric field in order to study the effect of electric fields on drones through the inspection of power lines by drones. As shown in Figure 3, the electric field distortion caused by the drone’s patrol operation is on the same horizontal plane as that of the edge conductor.
It can be seen from the analysis in Figure 3 that when the patrol drone is close to the transmission line for patrol inspection, the rotor, the tripod, and the internal electronic components of the fuselage will have distortion effects on the spatial electric field distribution around the line, especially near the motor. At the tip of the wing or at the stand, charge accumulation and field distortion are prone to occur, especially in the electric field distortion around the motor. This kind of distorted electric field will have a great impact on the navigation system and communication system of the drone, even causing the drone to get out of control and cause a safety accident, leading to an inability to complete the safety inspection. The analysis of the distortion field under actual working conditions has an extremely important influence on the accurate identification of the safety distance. Therefore, this paper simulates and analyzes the influence of a distorted electric field on a UAV inspection system in 500 kV and 220 kV common voltage transmission lines.
According to the relevant standards of China’s GB 50545-2010 “110–750 kV overhead transmission line design” and “National Power Transmission and Transformation Engineering Universal Design (2011 Edition)”, the related parameters such as wire type, ground height, and wire diameter of the overhead transmission line are set. Our experiments consider a wire to be a smooth cylinder with infinitely long straight parallel ground and the surface of the wire as an equipotential surface. Ignoring the end effect of the wire and the sag, the earth is approximated as an equipotential body with a potential of 0. After simplifying the high-voltage overhead transmission line, the AC/DC module of the finite element analysis software COMSOL Multiphysics 5.3 multiphysics simulation software is used to analyze the transient transmission lines of 500 kV and 220 kV AC voltage lines. The three-dimensional wire model uses a horizontally distributed four-split wire, the material is taken to be copper, and the wire is added to a three-phase alternating current. The simulation results are shown in Figure 4 and Figure 5.
From the simulation results of Figure 4 and Figure 5, the distribution law of the electric field intensity on the y–z plane perpendicular to the three-phase transmission line is as follows. At the 500 kV voltage level, the highest field strength is on the three transmission lines, and the maximum electric field strength is 6.87 × 10⁵ V/m. At the voltage level of 220 kV, the highest field strength is on the three transmission lines, and the maximum electric field strength is 6.21 × 10⁵ V/m. The maximum electric field strength appears on the wire, and the electric field strength contour intersects between the two transmission lines. The field strength of the electric field is gradually reduced away from the transmission line, and the field strength decreases faster as it moves away from the wire.
Then, we need to further analyze the influence of the UAV on the field strength distortion during the operation of the UAV patrol overhead transmission line and the variation of the distortion field with the distance between the transmission lines. In order to do so, we establish a four-rotor UAV inspection 500 kV, 220 kV high-voltage overhead transmission line simulation model and carry out simulation experiments. In the experiment, the distance from the wire is 0.5–12 m, and the maximum field strength of the surface of the patrol UAV is scanned. The scanning result is shown in Figure 6.
It can be seen from the analysis in Figure 6 that the maximum field strength of the surface of the 220 kV voltage class overhead transmission line is reduced with the increase of the distance from the conductor, and the field strength and distance are roughly inversely proportional. The farther the distance, the smaller the rate of change. The variation of the distortion field strength in relation to the distance between the outer side and the middle line of the edge conductor is similar. The maximum field strength at a distance of 1 m is about 150 kV/m, and when the distance is 3.5 m, the field strength is attenuated to 40 kV/m. When the UAV patrols the 500 kV voltage class overhead transmission line, the maximum field strength and the field strength change rate of the UAV surface gradually decrease with the increase of the distance.
When the UAV is 1 m away from the side conductor, the maximum field strength is 180 kV/m, and when the distance is 5 m, the field strength is attenuated to 50 kV/m. The electric field distortion of the 500 kV voltage level has a greater influence on the surface of the UAV than the voltage level of 220 kV, but the variation of the field strength with the distance and the rate of change of the field strength are similar under the two voltage levels. For the electronic components that make up the UAV flight control system and the inspection system, as well as the conditioning circuit and protection circuit of the sensor, the maximum electric field strength that can resist electromagnetic interference under normal operation is generally 50 kV/m [21,22]. Therefore, in order to operate the UAV and the normal collection of environmental information, the maximum electric field strength of the UAV surface is generally less than 50 kV/m. In this paper, this electric field strength value is used as the safety field strength threshold of the normal inspection operation of the unmanned aerial vehicle.

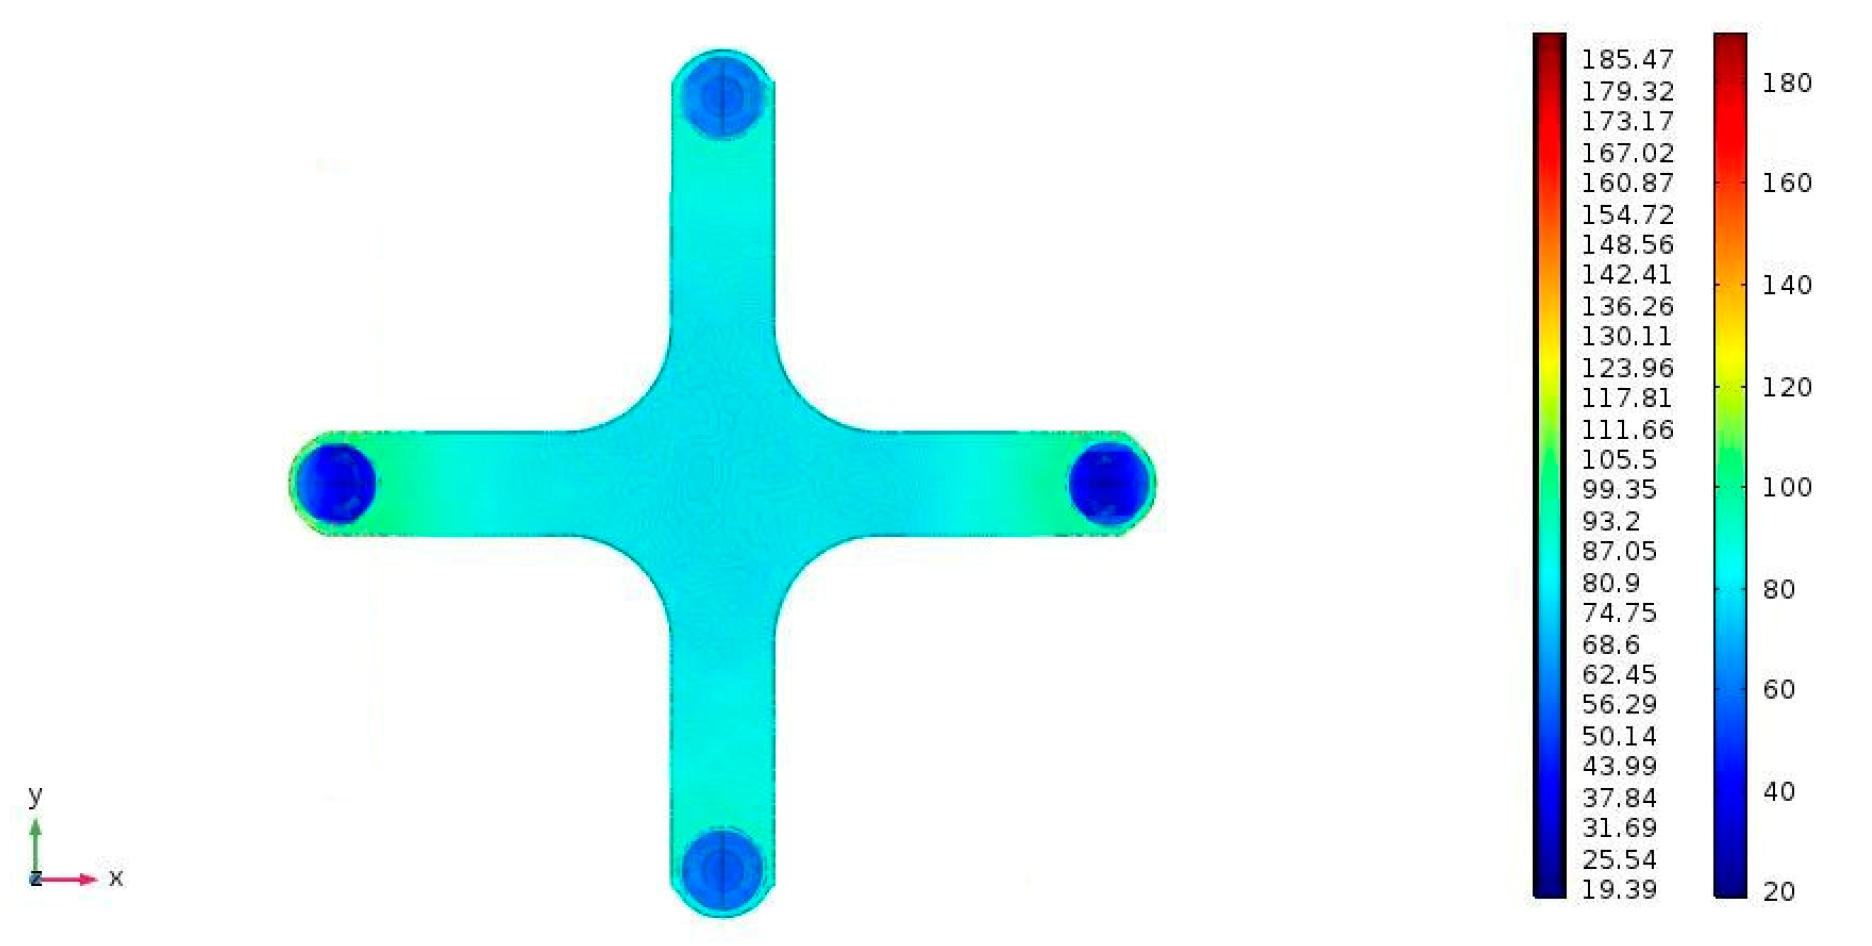
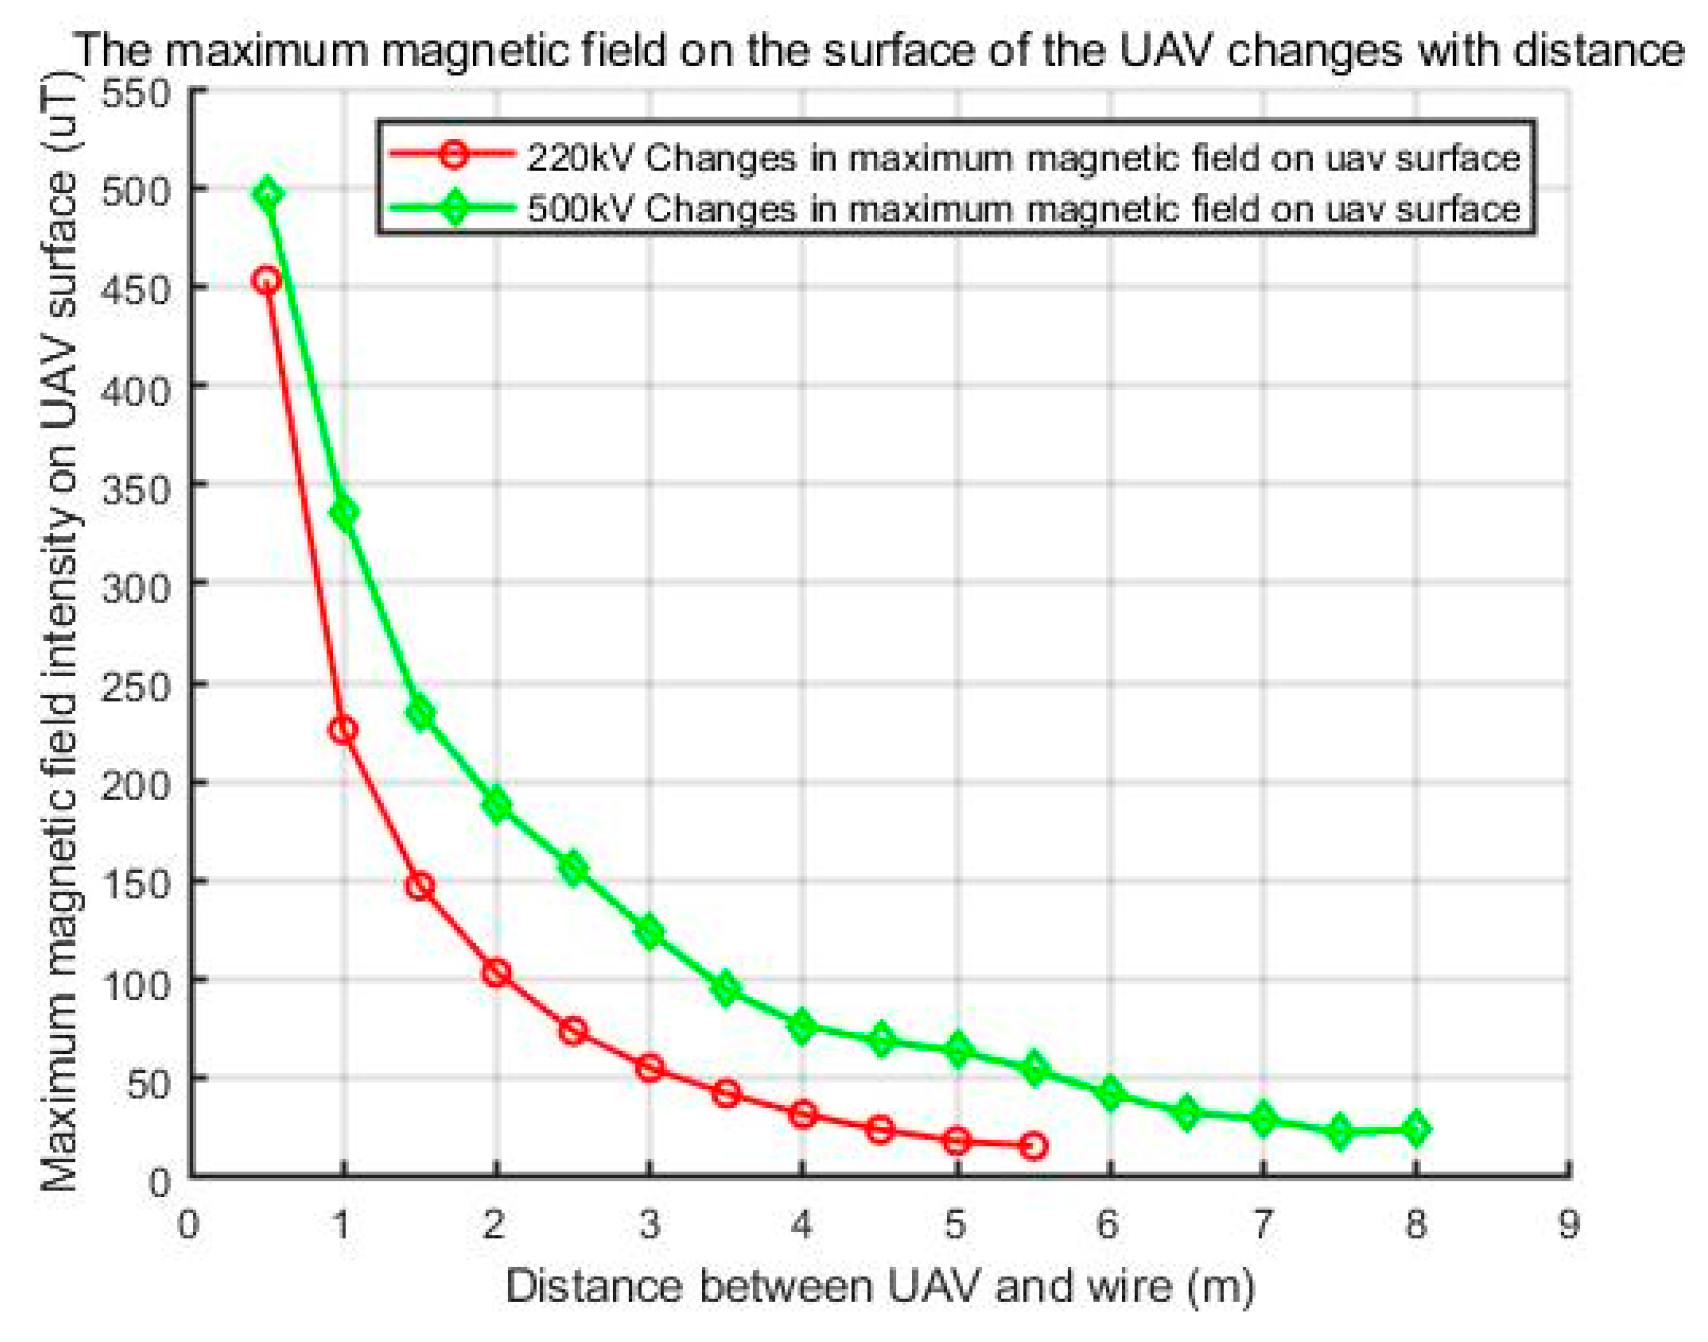
2.2. Analysis of the Influence of Magnetic Field on UAV

The complex electromagnetic environment during the inspection of the unmanned aerial vehicle will cause interference to the electronic components that constitute the UAV patrol system and communication system, affecting the flight performance of the UAV. If the distance between the inspection drone and the transmission line is too close, the electromagnetic field will have a greater impact on the flight performance of the drone. When the electromagnetic interference is serious, the effect is macroscopic: due to the occurrence of clutter, the data transmission is not accurate, causing the equipment to malfunction and the drone to hit the power line. At the same time, according to Biot–Savart Law, the magnetic field strength at a point around the wire through which the current is passed is proportional to the current in the wire and inversely proportional to the distance from the point to the wire. When the UAV moves in a complex magnetic field, it will be attracted by the wire and hit the line; subsequently, it will be unable to complete the line inspection task. A current-carrying wire generates a magnetic field around the space as shown in Equation (3):
B = L μ 0 I 4 π d l × e r r 2
where μ0 = × 10−7 is the vacuum permeability, I is the source current, L is the integral road force, dl is the microfluidic source, and r is the distance between a point in the space and the current-carrying wire.
The patrol UAV is generally composed of a magnetic field sensor, a GPS positioning system, an accelerometer gyroscope, a barometer, a motor, a flight control system, and a digital transmission module [23]. The magnetometer provides patrol navigation for the UAV, which is resistant to a magnetic interference that is three to four times the magnetic field strength. Therefore, during the inspection operation, if the magnetic induction generated by the current in the transmission line is greater than 220 μT, the magnetometer of the unmanned aerial vehicle will be disturbed, which will affect the normal operation.
The GPS receiver contains circuits of various frequencies, and the electronic components that make up the GPS internal circuit system are also subject to interference from electromagnetic fields. The national standard GB/T18314-2001 "Global Positioning System (GPS) Measurement Specifications" stipulates that when GPS observation is performed, the observation instrument should be 50m away from the high-voltage transmission line, affecting the inspection and monitoring of transmission lines using drones that carry GPS. In the literature [24], Silva and Whitney et al. carried out related research on the influence of the power carrier wave on the accuracy of NGPS (National GPS) received signals in the United States. The quality has a certain impact, because NGPRS uses a mid-band modulation signal. However, in [25], Xingfa and Hui et al. analyzed the impact of high-voltage transmission lines on GPS received signals by comparing positioning errors at different distances from the high-voltage transmission lines. Field tests were conducted under AC high-voltage transmission lines. The test results showed that the GPS positioning coordinate accuracy did not significantly decrease at different distances from the transmission lines, and there were no obvious rules for GPS positioning accuracy, distance, or whether the line was live. It proves that the error of the high-voltage transmission line on the GPS receiving signals of nearby operations is not enough to affect the navigation of the line-drone UAV. At the same time, research analysis shows that the carrier signal L1 frequency of the GPS satellite is 1575.42 MHz, and the L2 frequency is 1227.6 MHZ. The frequency used by overhead transmission lines in China is 50 Hz. The radio interference in this frequency band is close to background noise. The impact on GPS is within the range of the UAV positioning and navigation error. Therefore, under normal circumstances, the electromagnetic field radiation around the transmission line will not affect the operation of the GPS positioning system;
The servo motor is an important part of the UAV, and the internal reluctance is easily interfered by the electromagnetic field. The magnetic field required for normal operation is about 600 μT. The UAV used to analyze the distorted electric field was placed in the magnetic field for simulation analysis by finite element analysis. Taking the unmanned aerial vehicle in the same horizontal plane as the side conductor, the simulation results are shown in Figure 7.
From the analysis in Figure 7, it can be seen that in the simulation model, the UAV has a small effect on the spatial magnetic field distribution around the wire; this is mainly because the constituent materials of the UAV inspection system are mainly carbon fibers, which have a small magnetic permeability and are not easy magnetized.
In order to further analyze the relationship between the influence of the magnetic field on the UAV and the distance of the transmission line during the operation of the UAV patrol overhead transmission line, the four-rotor UAV patrols two 500 kV and 220 kV high-voltage overhead transmission lines as examples to carry out simulation experiments. The finite element analysis method is used to simulate the influence of the magnetic field distribution around the high-voltage transmission line on the patrol UAV. The transmission current of China’s 220 kV overhead transmission line is 0.6–1.2 kA. The simulation model established in the paper applies 1.2 kA, the transmission current of the 500 kV transmission line is 2–4 kA, and the current applied to the two poles of this simulation line is 3 kA. The variation law of the maximum magnetic induction intensity on the surface of the drone inspection operation and the distance between the transmission wires is shown in Figure 8.
It can be seen from the analysis of Figure 7 and Figure 8 that the surface magnetic field distortion law of the UAV patrol overhead transmission line is similar to the electric field distribution. Taking the unmanned aerial vehicle in the same horizontal plane as the side-phase conductor as an example, the inspection model of the UAV in the complex electromagnetic field is established, and the rate of change of the magnetic field strength of the UAV surface is simulated and analyzed. The rate of change of the magnetic induction intensity on the surface of the UAV and the distance between the drone and the transmission line changes are shown in Figure 8. When the UAV patrols a 220 kV high-voltage overhead transmission line with a current intensity of 1.2 kA and a 500 kV voltage-grade high-voltage overhead transmission line with a current of 3 kA, the surface magnetic field changes with distance similar to the electric field. The magnetic field at the 500 kV voltage level has a greater impact on the drone, but its rate of change is similar. Generally, the overhead transmission line inspection has polarization effects and performance differences related to its components. In order to ensure the normal operation of the UAV, the magnetic field strength should be less than 220 µT. As can be seen from the analysis of Figure 8, the relationship between the minimum safe distance d and the transmission current I is [17]:
d = I .

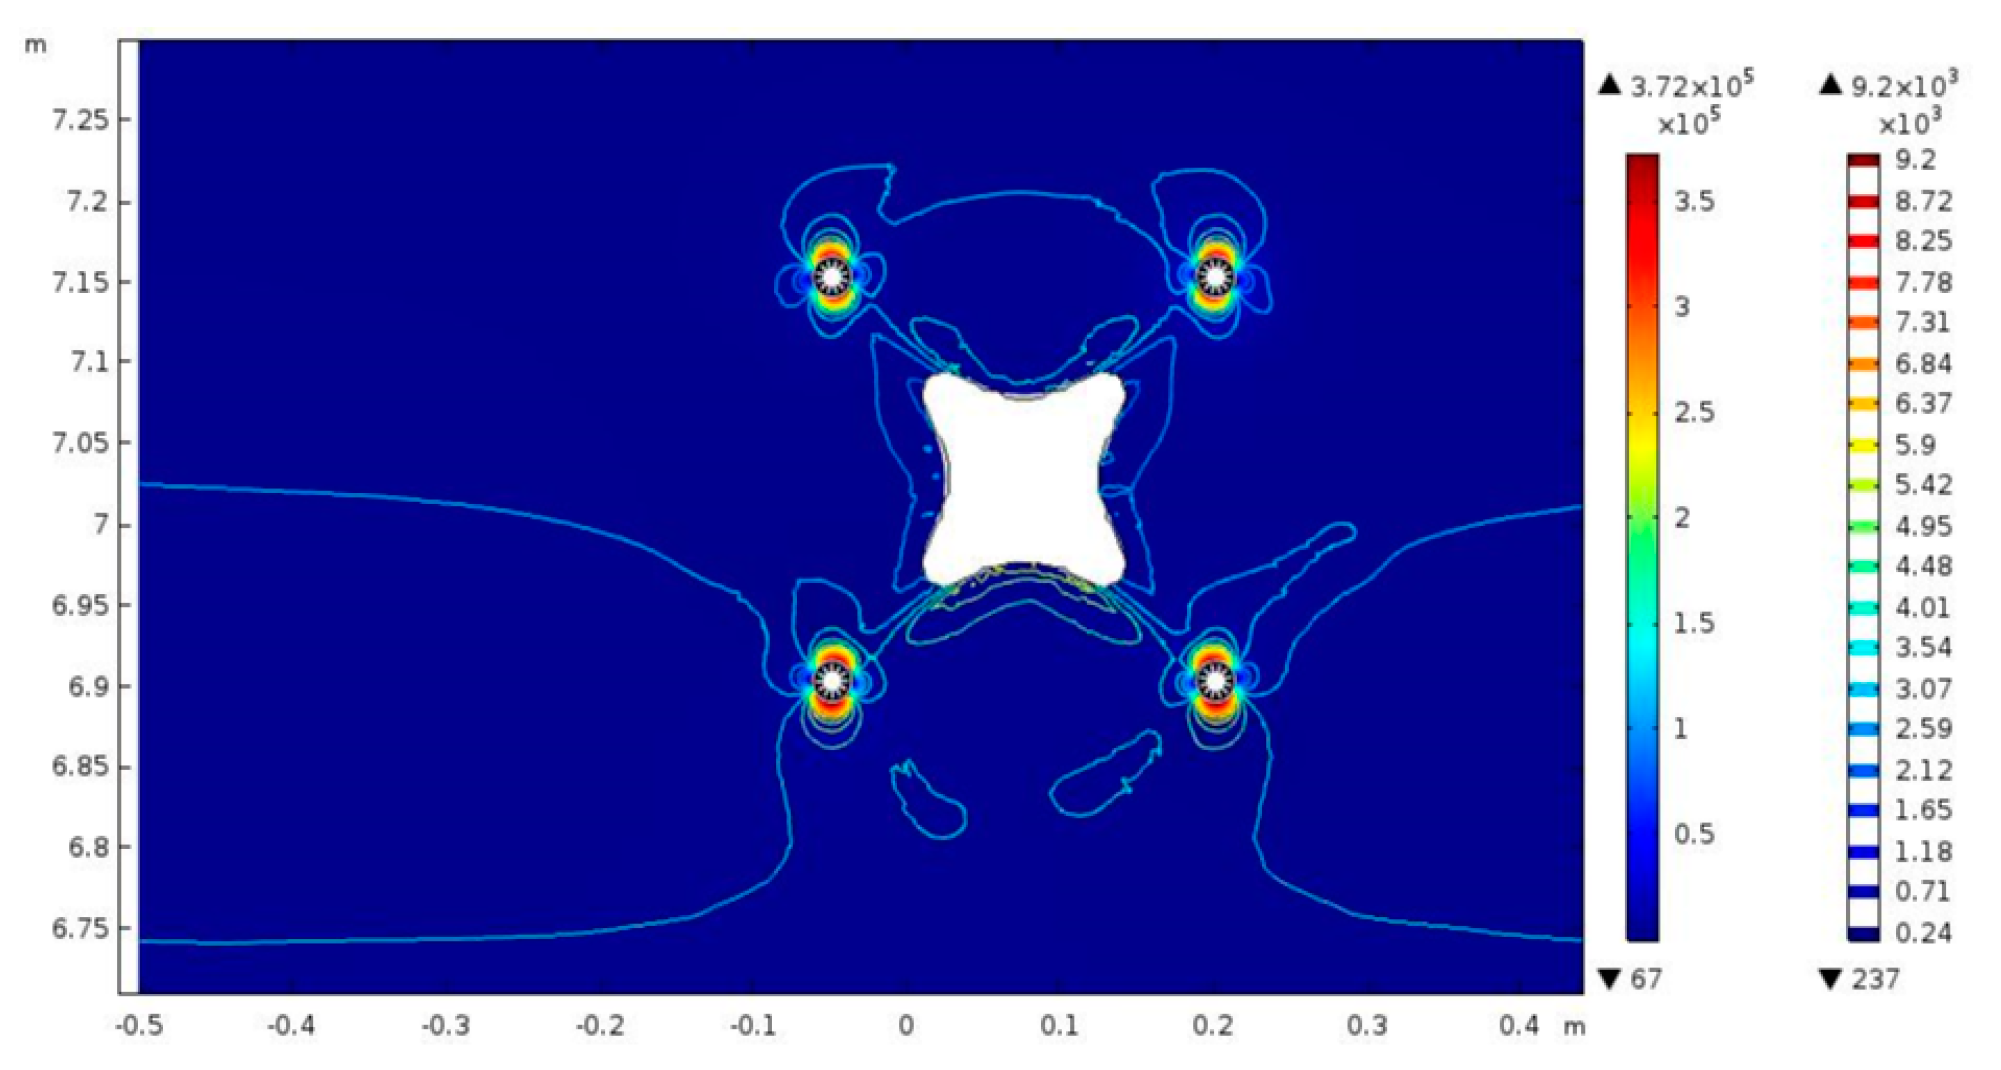
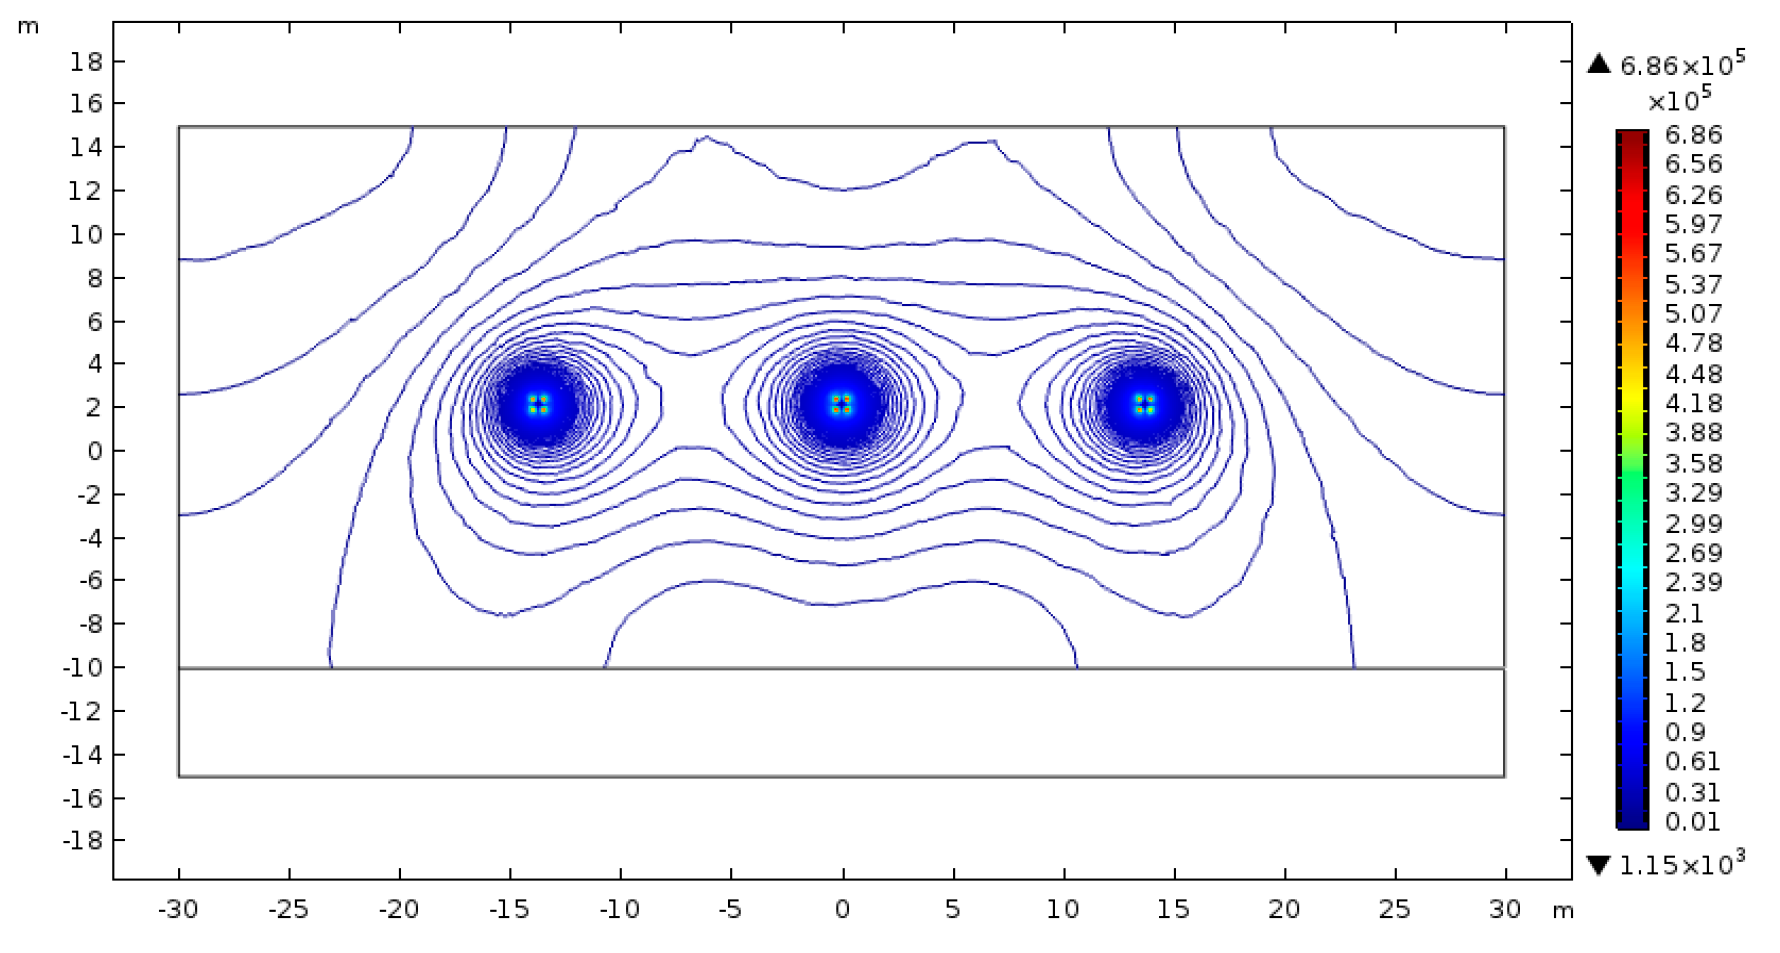
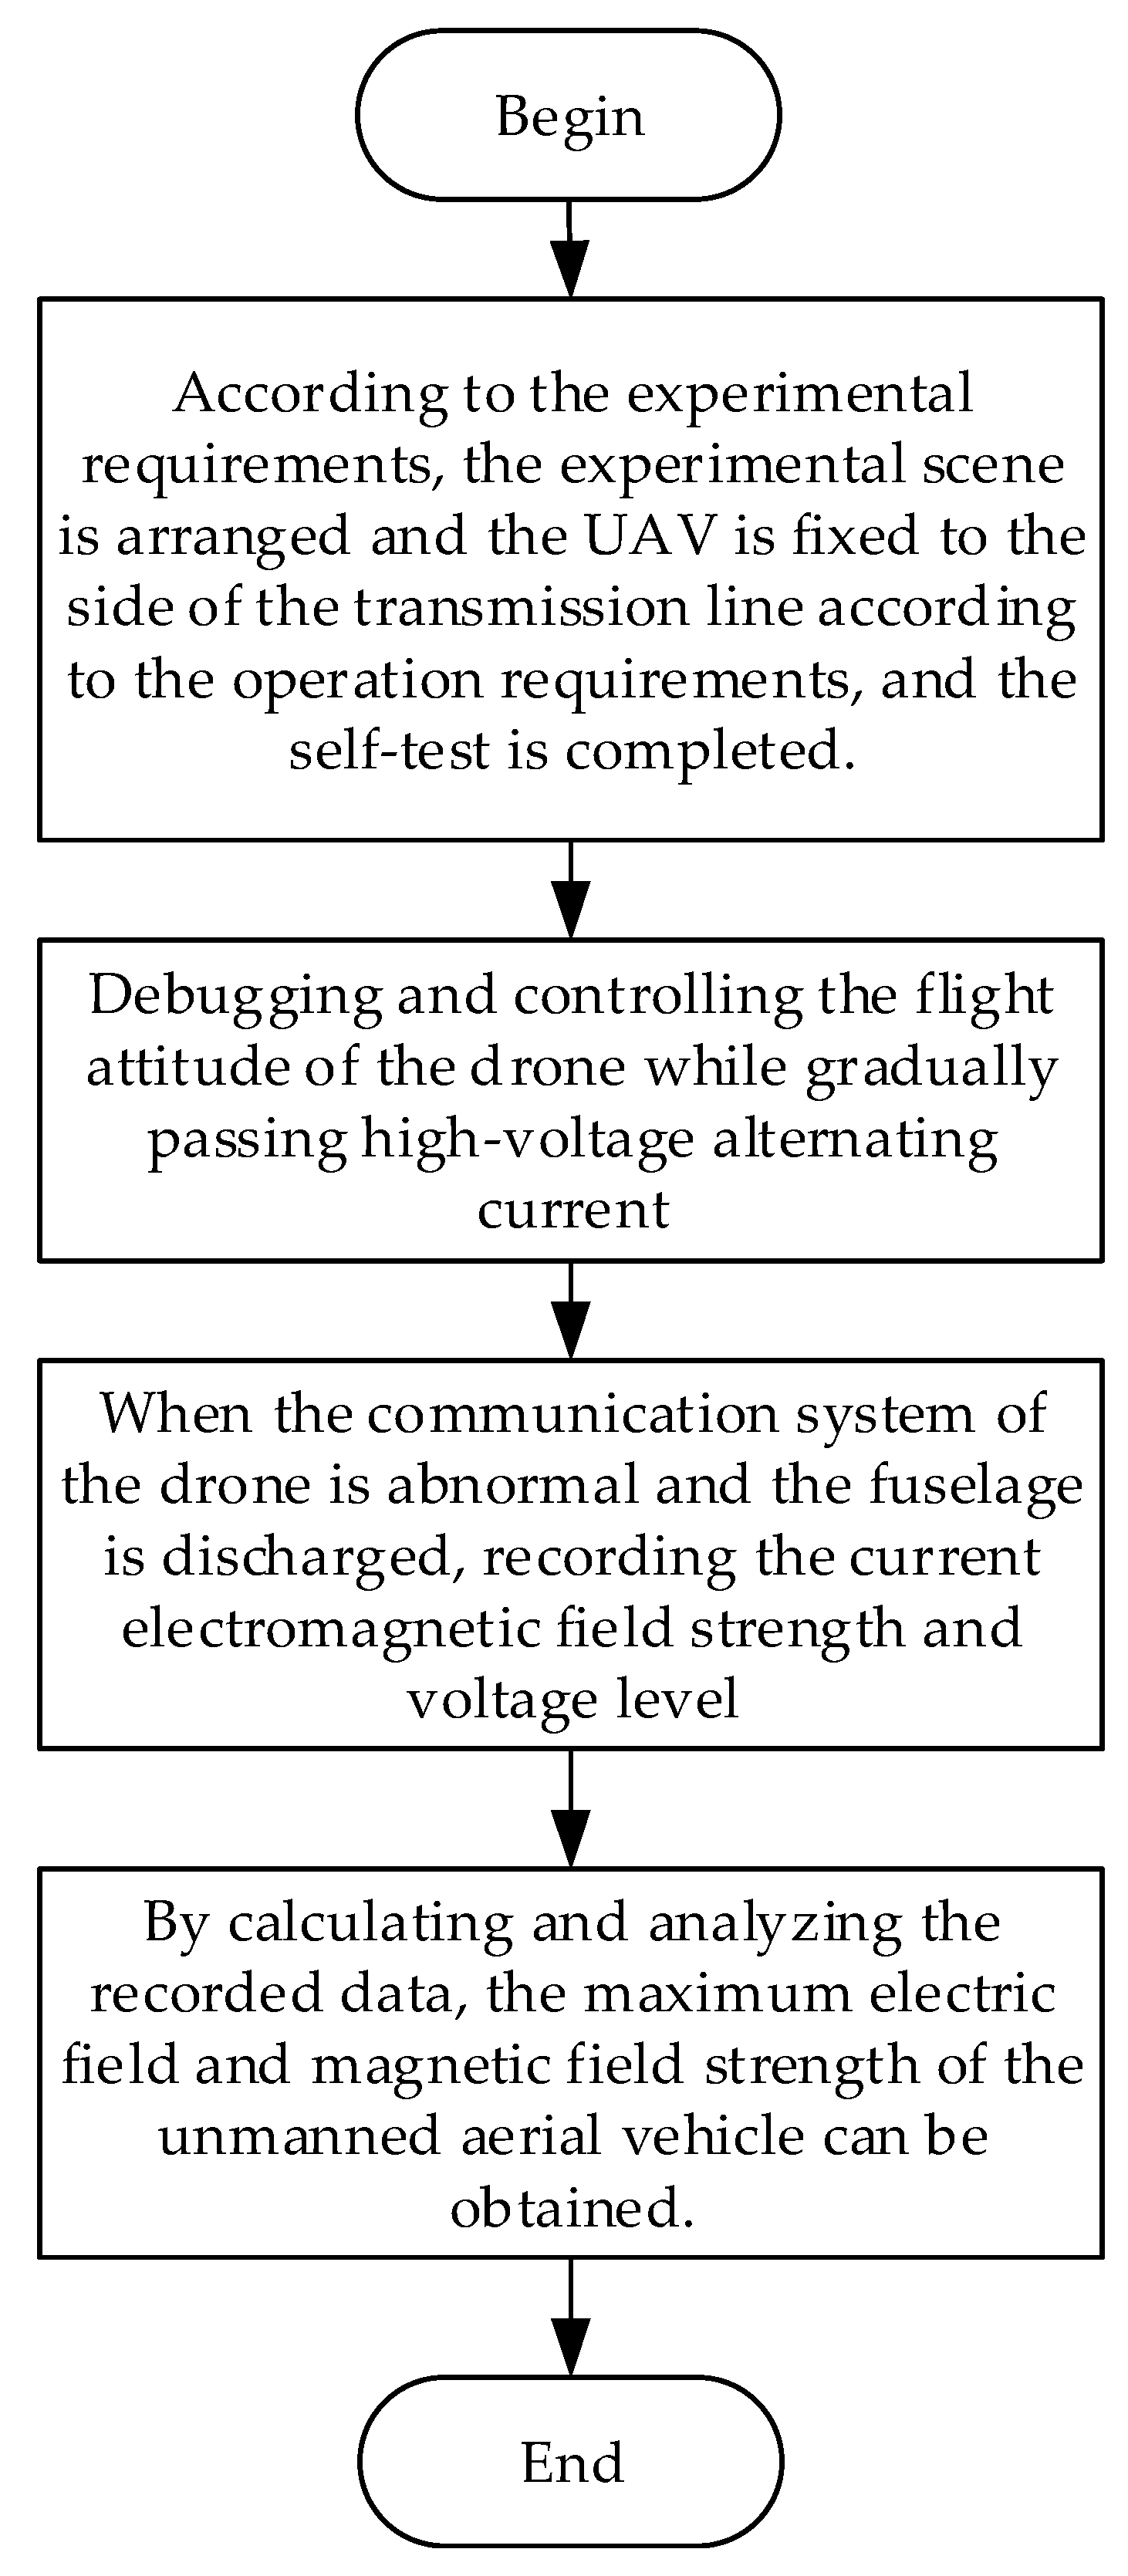
2.3. Electromagnetic Field Experiment Results and Analysis

In the laboratory environment, a high-voltage transmission line simulation experiment platform was built to simulate and analyze the minimum safe distance of the electromagnetic interference caused by the inspection of the UAV. In the high-voltage laboratory, a 100 kV experiment transformer without local power-off frequency was built to generate a power-frequency electromagnetic field to conduct experimental research on the model of UAV being interfered by the electromagnetic field. According to the operation requirements, the UAV is fixed on the side of the transmission wire, and self-inspection is completed. Then, we gradually increase the voltage and current strength according to the experimental requirements, after which we observe the stability and controllability of the UAV. During the test, the model DJI-NAZA quadrotor experimental drone was used. The drone used for the experiment was 0.68 m long, 0.68 m wide, and 0.4 m high. It was made of carbon fiber and had good hover stability. The experimental steps are shown in Figure 9.
The experiment is completed according to the experimental steps shown in Figure 9, where the experimental layout equivalent diagram is shown in Figure 10, and the experimental scene diagram is shown in Figure 11. The UAV is fixed at a distance of 1 m from the conducting wire. During the experiment, the voltage control console is used to control the transformer to generate a high voltage of 0–80 kV. During the voltage regulation process, we observe the drone controllability and the transmission system stability while recording the voltage level and electric and magnetic field strength at each moment.
During the experiment, when the field strength around the UAV is 70–80 kV/m, the UAV platform starts to shake, and the phenomenon of delay occurs when the unmanned aerial vehicle is controlled by the ground control terminal. The image transmission has streaks, snowflake spots, and occasionally the black screen appears; the picture transmission is interrupted, and the UAV communication system and the control system are disturbed, which affects the stability of the data transmission system, and the drone cannot perform normal inspection operations. When the magnetic field strength is 200–210 µT, the UAV platform starts to shake, the magnetometer starts to be disturbed, and the drone slowly drifts toward the wire side; subsequently, abnormal handling performance and abnormal data transmission occur, and the inspection operation cannot be performed normally. In the actual implementation of the inspection operation, in order to ensure the safety inspection of the UAV, a certain safety margin should be left. Experimental research and simulation analysis show that in order to prevent the electromagnetic pulses generated between the UAV and the overhead wires from causing interference to the drone’s communication and control system, and to avoid the electromagnetic field around the power line from affecting the normal inspection operations of the UAV. It is reasonable to set the safety threshold of the field strength to 50 kV/m and the magnetic field strength to 180 µT.

3. Adaptive Security Threshold Data Fusion Algorithm

3.1. Analysis of the Safe Distance of the UAV Patrol Power Line

In order to ensure the stability of the inspection of the unmanned aerial vehicle, in addition to the electronic components to meet certain anti-electromagnetic interference performance, the flight speed, wind speed, navigation positioning error, and the size of the drone structure and these factors have a great influence on the determination of the safe distance of the UAV line [20].
Assume that the positioning error of the navigation system of the patrol drone is D1. In order to indicate the influence of the structure of the unmanned aerial vehicle on the determination of the safety distance, the length of the maximum diagonal of the lined drone is D2. At the maximum wind speed of the allowed flight, the deviation due to the wind speed V1 is D3, the patrol speed of the drone is V2, the communication time is recorded as t, The maximum electric field strength experienced by a UAV equipped with an electronic device during normal operation is E, and the maximum magnetic field strength experienced by the electronic device is B. The analysis in this paper is based on the D-S multi-source data fusion algorithm; the sensor data is collected and processed to give decision results in real time, and the adaptive adjustment of the safety distance threshold is realized. The block diagram of the decision system is shown in Figure 12.

3.2. Homogeneous Multi-Source Data Adaptive Weighted Fusion Algorithm

Each sensor can extract a part of the obstacle-avoiding navigation information, and the extracted part of the information cannot accurately reflect the accurate information of the target or can only extract a certain part of the target information due to interference of other factors. The state of the target object cannot be accurately determined. Multi-sensors are used to detect and fuse various navigation information during the inspection process, and different sensors are used to collect and detect changes of the external environment and extract meaningful information from the collected information. When different sensors distributed in different spatial positions of the unmanned aerial vehicle are used to measure obstacles such as transmission lines, towers, and electromagnetic field strength, the sensors will be different at different times and in different spaces to form a set of observations [26,27]. It is assumed that there are m sensors in the process of patrolling to measure the same variable. In a certain period of time, a single sensor obtains n measurement data, and the set is represented by Z as:
Z = [ Z 1 ( 1 ) Z 1 ( 2 ) Z 1 ( n ) Z 2 ( 1 ) Z 2 ( 2 ) Z 2 ( n ) Z m ( 1 ) Z m ( 2 ) Z m ( n ) ]
where Zm(n) represents the measured value of the n-th sensor at the m-th moment.
Suppose there is an estimated true value X. At the first moment, the estimated mean and variance of the X acquired by the same sensor are:
{ Z i + = Z i ( 1 ) P i + = σ i 2 ( 1 ) .
Based on the time recursive estimation theory, after the sensor collects the information, the estimated mean Z i + and variance P i + are used as the statistical characteristics of the next measurement, and the new measurement data is used to correct the one-time recursive calculation. The time fusion estimation value Z i + ( k ) and variance P i + ( k ) after k measurement of the same sensor can be obtained as follows:
Z i + ( k ) = P i + ( k 2 ) + σ i 2 ( k ) 2 [ P i + ( k 2 ) + P i + ( k 1 ) + σ i 2 ( k ) ] Z i + ( k 1 ) + P i + ( k 1 ) + P i + ( k 2 ) 2 [ P i + ( k 2 ) + P i + ( k 1 ) + σ i 2 ( k ) ] Z i + ( k )
P i + ( k ) = P i + ( k 1 ) σ i 2 ( k ) P i + ( k 1 ) + σ i 2 ( k )
where the measurement variance can be obtained by calculating the auto-covariance factor and cross-covariance factor of a single sensor. For the k-th measurement, the estimation value of m sensors is Z 1 + ( k ) , Z 2 + ( k ) , …, Z m + ( k ) ; the mean square error is P 1 + ( k ) , P 2 + ( k ) , …, P m + ( k ) , the weighting coefficient is W 1 ( k ) , W 2 ( k ) , …, W m ( k ) , and the optimal result of sensor space fusion is Z ( k ) :
Z ( k ) = i = 0 m W i ( k ) Z i + ( k ) , i = 0 m W i ( k ) = 1 .
Since the measured estimates Z 1 + ( k ) , Z 2 + ( k ) , …, Z m + ( k ) are independent of each other, the total mean square error of the k-th multi-sensor measurement spatiotemporal fusion is:
σ 2 ( k ) = E [ ( X Z ( k ) ) 2 ] = i = 0 m W i 2 P i + ( k ) .
From the above formula, σ 2 ( k ) is a quadratic function of W i ( i = 1 ,   2 ,   ,   m ); then, the minimum value of σ 2 ( k ) can be obtained by using the weighting coefficients W 1 ( k ) , W 2 ( k ) , …, W m ( k ) to satisfy the constraint multivariate function extremum. The weighting factor of the total mean square error is shown in Equation (11):
W i ( k ) = 1 / ( P i + ( k ) j = 1 m 1 P j + ( k ) ) ,   i = 1 ,   2 ,   ,   m .
The corresponding total mean square error at this time is as shown in Formula (12):
σ min 2 ( k ) = 1 / ( j = 1 m 1 P j + ( k ) ) .

3.3. Evidence-Based Multi-Source Information Fusion Algorithm

Multi-source information fusion is based on the comprehensive processing of multiple kinds of information to accurately determine the state of the target object. D-S evidence theory is a reasoning method that was first proposed by Dempster and further developed by his student Shafer; it is also known as Dempster–Shafer evidence theory (D-S evidence theory). As a reasoning method, D-S (Dempster–Shafer) evidence theory can combine heterogeneous data information based on Bayes theory. It has outstanding features related to solving the problem of uncertainty, satisfies the conditions weaker than Bayes probability theory, and has the ability to directly express "uncertainty". The core idea is the combination rule of evidence theory. D-S (Dempster–Shafer) evidence theory is widely used in many fields such as medical diagnosis, target recognition, military command, etc., which need to comprehensively consider uncertain information from multiple sources [28]. The three basic elements of D-S (Dempster–Shafer) evidence theory are as follows: the basic probability assignment function m, the reliability function Bel(A), and the likelihood function pl(A). Firstly, the pre-processing of various sensor data is performed to solve the basic probability distribution function m, the belief function Bel(A), and the plausibility function Pl(A). Then, according to the combination rule, each value under the comprehensive evidence is solved. Finally, the reasonable judgment principle is adopted to take the maximum assumption of the belief function and the plausibility function as the final result of the data processing [29,30,31].
Let the set of all possible propositions in the universe be a recognition frame Θ . The basic probability distribution on the recognition frame Θ is a function m of 2 Θ [ 0 , 1 ] , which satisfies:
m ( ϕ ) = 0
A Θ m ( A ) = 1
where Φ represents an empty set; m (A) is a basic probability distribution function, which represents the degree of trust of the focus element A. The belief function Bel (A) and the plausibility function Pl (A) respectively represent the degree of support and possibility for the proposition A, and the expressions are expressed as follows.
Assuming A 2 Θ , then:
B e l ( A ) = B A m ( B )
P l ( A ) = A B ϕ m ( B ) .
The synthetic rules of D-S (Dempster–Shafer) evidence theory provide a synthetic formula that can fuse multiple evidence elements to provide evidence:
K = A i B j = ϕ m 1 ( A i ) m 2 ( B j ) < 1 .
Then:
m ( A ) = { B i C j m 1 ( B i ) m 2 ( C j ) 1 K A ϕ 0 A = ϕ .
K is a collision factor, reflecting the degree of conflict of evidence, and 1/(K − 1) is called a normalization factor. This combination rule is equivalent to assigning an empty set (conflict) to each set in the combination.
In view of the actual working conditions of the UAV while inspecting an overhead transmission line, the various influencing factors of the safety distance are mutually influential, and one of the factors will cause the other factors to change. For example, the inspection speed of the drone will affect the measurement of the relative wind speed and affect the detection of the electric field and magnetic field strength. When the evidence conflict is more serious, the D-S (Dempster–Shafer) algorithm cannot focus according to different weights. Some identification frameworks may have a probability of 0. The combined result will often have a large error with the actual situation, which makes the system unable to make a more accurate judgment on the safe distance of the inspection. Therefore, this paper improves the D-S (Dempster–Shafer) evidence theory synthesis Formula (18), and uses the improved evidence theory synthesis formula as the global fusion algorithm of each environmental factor information data. Assuming the degree of conflict between evidences in the formula is represented by the parameter K, the evidence trust degree is represented by the parameter ε, and the evidence average trust degree function is represented by q(A), then:
m ( ϕ ) = 0
m ( A ) = p ( A ) + K ε q ( A )
p ( A ) = B i C j m 1 ( B i ) m 2 ( C j )
q ( A ) = 1 n i = 1 n m i ( A )
ε = e s
s = K n ( n 1 ) / 2
where s is the sum of each pair of evidence sets in n evidence sets, which reflects the degree of conflict between the two sides of the evidence. Meanwhile, ε is a decreasing function of s, reflecting the credibility of the evidence; when the conflict between the evidences increases, the degree of trust of the evidence will decrease; s is different from K in the D-S (Dempster–Shafer) theory. K can reflect the overall degree of conflict of evidence. When K increases, s does not necessarily increase.
In the D-S (Dempster–Shafer) decision theory to solve the decision process based on multi-objective fusion, the evidence acquisition is very difficult. It embodies the scientific rationality of constructing the basic probability distribution function, and whether the allocation of basic probability numbers is reasonable directly determines whether the conclusions after the combination of evidence are credible [32,33]. The traditional solution is to ask for help in the field, but the credibility of the information given by the authoritativeness of the experts has a certain deviation. In order to avoid unnecessary deviation caused by human subjectivity, this paper uses the typical sample-based method to automatically perform basic probability distribution. This paper also uses the distance between the measured value and the typical value to construct the density function of the normal distribution curve, and then constructs the basic probability distribution function. In this paper, the BPA (Basic Probability Assignment) is obtained by constructing a normal curve from the Hamming distance between each evidence and a typical sample. Based on the above analysis, the specific steps of implementing the adaptive safety threshold algorithm for the overhead transmission line of the UAV are as follows.
It is assumed that there are m sensors in the process of patrolling to measure the same variable. In a certain period of time, a single sensor obtains n measurement data, and the set is represented by Z as:
Z = { Z i ( k ) } ( i = 1 ,   2 ,   ,   m ;   k = 1 ,   2 ,   ,   n ) .
Then, we perform the first-level fusion of the data measured by the same variable according to the homogenous multi-source data adaptive weighting fusion algorithm described in the paper, and obtain the estimation result after the fusion of each parameter variable.
Assuming that the number of target patterns is p, the number of evidence is l, and the construction recognition framework is Θ = { X 1 ,   X 2 ,   ,   X p } , in this framework, the typical value of each target pattern Xj on each evidence is { Z 1 j ,   Z 2 j ,   ,   Z l j } ( j = 1 ,   2 ,   ,   p ), and the results of the adaptive weighted fusion of the measured values of the evidences are {Z1, Z2, …, Zl}.
The average Hamming distance between them is solved based on the measured fusion results and typical sample values:
H i j = | Z i Z i j | ,   H i = 1 p j = 1 p H i j .
Using the normal curve to find the similarity between the evidence Zi and the corresponding typical value Zij in the target pattern Xj:
P i j = e A k 2
where
A = 0.5 ,   k = H i j / H i .
The basic probability of evidence Zi and the corresponding target mode Xj is:
M i ( X j ) = P i j / j = 1 p P i j .
According to the D-S (Dempster–Shafer) evidence fusion algorithm, the target mode A basic probability distribution function m(A) can be calculated and solved, and the decision is made based on this.

4. Results

Data Fusion Algorithm Verification and Analysis

In order to detect the safety distance of the inspection UAV according to the real-time data of each sensor under the current unmanned aerial vehicle inspection condition, judging the security status of the current location according to the matching of the data collected by various heterogeneous sensors and the evaluation rules, the patrol UAV can conduct an autonomous obstacle avoidance navigation control according to the decision result, or transmit the decision result to the ground terminal. Based on the decision result, the operator can make accurate judgment on the real working condition of the patrol inspection of the UAV and carry out a remote control of it. When performing data fusion of heterogeneous sensors, the identification framework should be constructed reasonably. The identification framework constructed in this paper is assumed to be:
Θ = { A ,   B ,   C }
where A = {Farther away}, B = {Suitable distance}, and C = {Dangerous distance}.
According to a large number of experiments and principle analysis, and using the expert knowledge to give the basic probability assignment, the attribute interval of each detection condition is set as shown in Table 1 below.
In the experiment, four power frequency electric field sensors are used to collect the electric field intensity signals around the transmission lines. Four magnetic field sensors collect the magnetic field strength signals around the transmission lines, and the accelerometer is used to measure the speed of the UAV. The measurement of wind speed and direction is realized by the anemometer, and data fusion of various sensors such as the structural size parameters of the drone and the positioning error is used to realize the decision of the safety distance.
First, we select a set of data collected during the inspection process of a drone as the verification of the data fusion algorithm. Then, we select the data collected by each sensor within a certain period of time, according to the adaptive weighted fusion method described in the paper, by firstly merging the same sensor in time, and then adapting the fused data result between homogenous sensors. The result of the weighted fusion data is used as the detection data of this type of sensor. In a certain period of time, the data of each type of sensor after adaptive weighted fusion is selected as the D-S evidence theory algorithm to verify the UAV patrol overhead transmission line conditions.
In this paper, based on the typical sample method, the density function of normal distribution is constructed by elastic Hamming distance [26], and then the basic probability distribution function is constructed. The basic probability assignment of each influencing factor obtained through the processing of the data is shown in Table 2.
The evidences of electric field strength, magnetic field strength, wind speed, inspection speed, and UAV positioning error are m1, m2, m3, m4, and m5, and the value of the obtainable probability assignment function m(A) is calculated according to the DS fusion algorithm. The m(A) obtained by fusing each proposition case is shown in the following table.
From the analysis of the fusion results and propositional hypotheses in Table 3, we can see that the UAV inspection status is proposition A; that is, the UAV is far away from the transmission line, and the inspection sensor carried by the UAV is not optimal. The inspection effect should control the drone to approach the field source to achieve a proper inspection distance, which can ensure the safety of the inspection of the drone, and also enable the detection sensor to reach the optimal detection state.
At the same time, for this theory, we take the 220 kV and 500 kV high-voltage AC transmission lines of the patrol line unmanned aerial vehicle inspection as an example to analyze the safety distance of the inspection. In the case where all error parameters take the maximum value, the positioning error of the navigation system of the UAV inspection system is set to 2.5 m; the maximum wind speed of the patrol UAV that allows the drone to operate during wind-resistant flight under the normal inspection and the standard deviation allowed is 1.5 m. Therefore, the deviation due to the wind speed is 1.5 m, and the distance between the unmanned aerial vehicle and the wire is 3 m under the condition of the AC 220 KV voltage level and the maximum electric field strength required for the normal operation of the electronic equipment of the UAV. When the electronic device is working normally under the maximum magnetic field strength required, the distance between the drone and the wire is 1.2 m; under the condition of an AC 500 KV voltage level and the maximum electric field strength required for the normal operation of the electronic equipment of the drone, the distance between the UAV and the wire is 5 m.
Under the condition of the maximum magnetic field strength required for normal operation of electronic equipment, the distance between the UAV and the conductor is 3 m. In this model, the maximum diagonal length of the unmanned aerial vehicle (taking into account the length of the wing) is 1 m. Here, we assume that the patrol unmanned aerial vehicle speed of the aircraft is v = 5 m/s, and the communication time between the UAV and the ground is t = 0.2 s. Therefore, the safety inspection distance of patrol unmanned aerial vehicle inspection at the 220 kV voltage level is about 8 m; at the 500 kV voltage level, the safety inspection distance of the inspection line drone is about 11 m. However, it is less likely that the error parameters will take the maximum value at the same time during the actual inspection. It is unreasonable to judge the safety status of the high-voltage overhead transmission line of the UAV with a fixed safety threshold as a standard. This method adapts to a single working condition and does not achieve the optimal inspection effect.
The safety distance threshold is different under different environmental factors. If the decision is made with a fixed threshold, in some cases, the safety distance threshold is too close to cause the inspection accident, while in other cases, the fixed safety threshold is larger. The inspection equipment carried by the drone can not exert the best test performance, so that the situation of missed detection and misjudgment will not be achieved, and the expected inspection effect will not be achieved. The multi-sensor data fusion algorithm is used to perform multi-source data fusion on each sensor data and intelligently determine the current safety distance threshold to avoid problems caused by a single safety distance threshold. According to the analysis of the fusion results, the probability assignment of the corresponding propositions is more concentrated after D-S (Dempster–Shafer) evidence theory fusion, and the credibility distinction is more obvious. The adaptive security threshold algorithm has good rationality and scientificity.

5. Discussion and Conclusions

(1) In this paper, we establish a physical model of the UAV in the complex electromagnetic field environment, combined with the anti-electromagnetic interference capability and the influence of the electric field distortion of the electronic components that constitute the UAV inspection system. Finally, the electric field strength of the UAV safety inspection is 50 kV/m, and the magnetic field strength is 180 µT. The comprehensive analysis of the common voltage level of the UAV inspection shows that the relationship between the UAV safety inspection distance d (m) and the through current I (kA) in the wire is approximately:
d = I.
(2) Analysis of the simulation results shows that the electric field distribution on the surface of the UAV is not uniform. The field strength distribution at the tip of the rotating motor and the wing is concentrated, and the electric field distortion is large. Therefore, in the design of the UAV, the installation of the electric field measuring device should be as far as possible. Here, we avoid burrs or tips to prevent electric field distortion from affecting the measurement and determination of safety distance.
(3) This paper adopts a multi-sensor data fusion decision-making method to the data fusion of the main factors affecting UAV flight speed, wind speed, navigation positioning error, and structural size. According to the fusion result and the set proposition, the UAV inspection status is determined, and the UAV is adaptively adjusted according to the inspection operation environment. Then, the algorithm is verified. According to the analysis of the fusion results, the reliability of the multi-sensor adaptive fusion is more obvious, which better solves the single safety threshold adaptation condition and brings about a large cruise error due to the field source positioning error.
By studying the safety distance of overhead transmission lines for unmanned aerial vehicles, it can provide reference for improving the safety and reliability of UAV power inspection operations, and ensure the safe and stable operation of UAVs, power grids, and inspection equipment. The important significance provides a theoretical basis for the next step of studying with UAV.

Author Contributions

Conceptualization, W.Z., Y.N., and C.S.; Methodology, W.Z. and Y.N.; Formal Analysis, C.S.; Data Curation, Y.N.; Writing—Review and Editing, Y.N.; Project Administration, C.S.

Funding

This research was funded by the China Southern Power Grid Corporation Science and Technology Project, grant number (YNKJXM20170180).

Acknowledgments

Authors would also like to thank China Southern Power Grid for project support.

Conflicts of Interest

The authors declare no conflict of interest.

References

  1. Luque-Vega, L.F.; Castillo-Toledo, B.; Loukianov, A. Power line inspection via an unmanned aerial system based on the quadrotor helicopter. In Proceedings of the MELECON 2014–2014 17th IEEE Mediterranean Electrotechnical Conference, Beirut, Lebanon, 13–16 April 2014. [Google Scholar]
  2. Lu, J.; Huang, Q.; Mao, X.; Tan, Y.; Zhu, S.; Zhu, Y. Optimized Design of Modular Multilevel DC De-Icer for High Voltage Transmission Lines. Electronics 2018, 7, 204. [Google Scholar] [CrossRef] [Green Version]
  3. Qayyum, A.; Malik, A.S.; Saad, N.M.; Abdullah, M.F.B.; Jaafar, M.Y.H.; Abdullah, A.R.B.A.; Rasheed, W.; Iqbal, M. Measuring height of high-voltage transmission poles using unmanned aerial vehicle (uav) imagery. Imaging Sci. J. 2017, 65, 1–14. [Google Scholar] [CrossRef]
  4. Zhou, Y.X.; Liu, R.; Zhang, Y.X.; Zhang, X.; Guo, D.W. Corresponding Relation Between Aging Micrographs and Partial Discharge Properties of Electrical Trees in Silicone Rubber. High Volt. Eng. 2015, 41, 159–166. [Google Scholar]
  5. Zhang, X.Q.; Su, J.J. UAV Inspection Technology of Overhead Transmission Line; China Electric Power Press: Beijing, China, 2016. [Google Scholar]
  6. Azevedo, F.; Dias, A.; Almeida, J.; Oliveira, A.; Ferreira, A.; Santos, T.; Martins, A.; Silva, E. LiDAR-Based Real-Time Detection and Modeling of Power Lines for Unmanned Aerial Vehicles. Sensors 2019, 19, 1812. [Google Scholar] [CrossRef] [PubMed] [Green Version]
  7. Nuriev, M.G.; Gizatullin, Z.M.; Gizatullin, R.M. Physical modeling of electromagnetic interferences in the unmanned aerial vehicle in the case of high-voltage transmission line impact. Russ. Aeronaut. 2017, 60, 292–298. [Google Scholar] [CrossRef]
  8. Bhola, R.; Krishna, N.H.; Ramesh, K.N. Detection of the power lines in UAV remote sensed images using spectral-spatial methods. J. Environ. Manag. 2017, 206, 1233–1242. [Google Scholar] [CrossRef]
  9. Qin, X.Y.; Wu, G.P.; Lei, J.; Fan, F.; Ye, X.H.; Mei, Q.J. A Novel Method of Autonomous Inspection for Transmission Line based on Cable Inspection Robot LiDAR Data. Sensors 2018, 18, 596. [Google Scholar] [CrossRef] [Green Version]
  10. Song, B.; Li, X. Power line detection from optical images. Neurocomputing 2014, 129, 350–361. [Google Scholar] [CrossRef]
  11. Chen, C.; Peng, X.Y.; Song, S.; Wang, K.; Qian, J.J.; Yang, B.S. Safety Distance Diagnosis of Large Scale Transmission Line Corridor Inspection Based on LiDAR Point Cloud Collected With UAV. Power Syst. Technol. 2017, 41, 2746–2753. [Google Scholar]
  12. Tian, F.; Wang, Y.; Zhu, L. Power line recognition and tracking method for UAVs inspection. In Proceedings of the 2015 IEEE International Conference on Information and Automation (ICIA), Lijiang, China, 8–10 August 2015. [Google Scholar]
  13. Matikainen, L.; Lehtomäki, M.; Ahokas, E.; Hyyppä, J.; Karjalainen, M.; Jaakkola, A.; Heinonen, T. Remote sensing methods for power line corridor surveys. ISPRS J. Photogramm. Remote Sens. 2016, 119, 10–31. [Google Scholar] [CrossRef] [Green Version]
  14. Larrauri, J.I.; Sorrosal, G.; González, M. Automatic system for overhead power line inspection using an Unmanned Aerial Vehicle. In Proceedings of the International Conference on Unmanned Aircraft Systems, Atlanta, GA, USA, 28–31 May 2013. [Google Scholar]
  15. Zheng, T.R.; Sun, L.M.; Lou, T.T.; Guo, X.; Liu, Q.H. Determination Method of Safe Flight Area for UAV Inspection for Transmission Line Based on the Electromagnetic Field Calculation. Shandong Electr. Power 2018, 45, 27–30. [Google Scholar]
  16. Zhang, J.; Wang, S.Y.; Chen, X.; Xu, H.D.; Yu, D.K.; Yang, Z. Obstacle Avoidance for UAV Power Line Inspection Based on Cylindrical Space and Support Vector Machine. Electr. Power 2015, 66, 56–60. [Google Scholar]
  17. Liu, Z.; Du, Y.; Chen, Y.; Ma, J.G.; Wu, X.D.; Yao, J.S. Simulation and Experiment on the Safety Distance of Typical μ500 kV DC Transmission Lines and Towers for UAV Inspection Gaodianya Jishu. High Volt. Eng. 2019, 45, 426–432. [Google Scholar]
  18. Shen, J.; Liu, W.D.; Liu, H.B.; Wang, J.; Wu, Y. Safety distances of inspections on AC UHV lines of 1000 kV with a helicopter. Electr. Power 2011, 44, 41–45. [Google Scholar]
  19. Wu, X.; Wan, B.Q. Electromagnetic Environment of Transmission and Transformation Engineering; China Electric Power Press: Beijing, China, 2009. [Google Scholar]
  20. Dong, X.C.; Wu, Z.K.; Chen, Z.M.; Qu, F.R.; Li, Y.F.; Liu, G.; Zhu, N.X. Analysis of induction discharge distance between uav and overhead lines. Adv. Technol. Electr. Eng. Energy 2018, 37, P75–P81. [Google Scholar]
  21. Zhang, X.D.; Hao, R.R.; Liu, S.S. Protection Circuit against Strong Electromagnetic Pulse Interference; Southeast University: Nanjing, China, 2010. [Google Scholar]
  22. Qiu, Z.B.; Yan, J.J.; Xu, W.J.; Hang, C.P. Hybrid Prediction of the Breakdown Voltages of Short Air Gaps with Typical Electrodes. High Volt. Eng. 2018, 44, 2012–2018. [Google Scholar]
  23. Peng, X.T.; Qian, J.J.; Wang, K.; Mai, X.M.; Yi, L. Multi-sensor Full-automatic Inspection System for Large Unmanned Helicopter and Its Application in 500 kV Lines. Guangdong Electr. Power 2016, 29, 8–15. [Google Scholar]
  24. Silva, J.M.; Whitney, B. Evaluation of the Potential for Power Line Carrier (PLC) to Interfere with Use of the Nationwide Differential GPS Network. IEEE Power Eng. Rev. 2002, 22, 62. [Google Scholar]
  25. Liu, X.F.; Yin, H.; Wu, X. Test and Analysis on Effect of High Voltage Transmission Lines Corona Radio Interference and Scattering to GPS Signal. High Volt. Eng. 2011, 37, 2937–2944. [Google Scholar]
  26. Guo, L.; Ma, Y.H.; Zhang, X.E. Spatial-temporal estimation algorithm for multisensor data fusion. Syst. Eng. Electron. 2005, 27, 2016–2018. [Google Scholar]
  27. Zhai, Y.L.; Dai, Y.S. Study of Adaptive Weighted Fusion Estimated Algorithm of Multi-sensor Data. Acta Metrol. Sin. 1998, 19, 69–75. [Google Scholar]
  28. Yuan, M.; Wan, C.L.; Wei, L.S. Superiority of empirical Bayes estimator of the mean vector in multivariate normal distribution. Sci. China Math. 2016, 59, 1175–1186. [Google Scholar] [CrossRef]
  29. Shafer, G. A mathematical theory of evidence. Technometrics 1978, 20, 242. [Google Scholar]
  30. Xinyang, D.; Wen, J.; Zhen, W. Zero-sum polymatrix games with link uncertainty: A Dempster-Shafer theory solution. Appl. Math. Comput. 2019, 340, 101–112. [Google Scholar]
  31. Shao, L. The Multi-Sensor Data Fusion Technology Research in Animal Building Environmental Monitoring System. Master’s Thesis, Hebei Agriculture University, Baoding, China, 2013. [Google Scholar]
  32. Wang, J.L.; Zhang, J.Y. Multisensor Target Identification Based on Mass Function of Statistical Evidence and D-S Evidence Theory. Chin. J. Sens. Actuators 2006, 19, 862–864. [Google Scholar]
  33. Luan, C.J.; Wang, X.F.; Zhang, H.Z.; Jin, S.S.; Li, F. Approach for constructing basic probability assignment for evidence theory in problems of ordered propositions. Comput. Eng. Appl. 2012, 48, 217–221. [Google Scholar]
Figure 1. Unmanned aerial vehicle (UAV) patrol transmission line equivalent physical model.
Electronics 08 01467 g001
Figure 2. Modeling of a UAV in an electric field.
Electronics 08 01467 g002
Figure 3. Effect of UAV on electric field distortion.
Electronics 08 01467 g003
Figure 4. 500 kV vertical section electric field strength contour.
Electronics 08 01467 g004
Figure 5. 220 KV vertical section electric field strength contour.
Electronics 08 01467 g005
Figure 6. The relationship between the maximum electric field strength of the surface of the UAV and the distance.
Electronics 08 01467 g006
Figure 7. Magnetic field distribution on the surface of the drone.
Electronics 08 01467 g007
Figure 8. The variation of the surface magnetic field of the UAV with the distance.
Electronics 08 01467 g008
Figure 9. Experimental steps for a safe distance of UAVs against electromagnetic interference.
Electronics 08 01467 g009
Figure 10. Schematic diagram of the electromagnetic field experiment.
Electronics 08 01467 g010
Figure 11. Experimental scene diagram.
Electronics 08 01467 g011
Figure 12. Block diagram of multi-sensor data fusion decision system.
Electronics 08 01467 g012
Table 1. Conditional attribute discrete interval setting.
Conditional AttributeElectric Field Strength
(kV/m)
Magnetic Field Strength
(µT)
Wind Speed (m/s)Navigation Error
(m)
Inspection Speed
(m/s)
UAV Size (m)
Farther away(0, 50)(0, 180)(0, 3)(0, 1.5)(3, 5)(~, 1.5)
Suitable distance(50, 150)(180, 225)(3, 8)(1.5, 3)(5, 10)(1.5, 3)
Dangerous distance(150, ~)(225, ~)(8, ~)(3, ~)(10, ~)(3, ~)
Table 2. Basic probability assignment assignment table.
ABC
Electric field strength0.7520.2030.045
Magnetic field strength0.8760.1130.011
Inspection speed0.6580.2410.101
Wind speed0.3810.5280.091
Positioning error0.2740.4560.27
UAV size0.5250.3730.102
Table 3. Fusion results under various propositional conditions.
Proposition HypothesisABC
Fusion result0.970.0250.005

