1. Introduction
Fiber optic installations are the backbone of the modern internet revolution. Due to the rapid growth of fiber optic networks and demand for higher speeds, the creation of new optical fiber networks along with the upgrading of existing fiber networks is increasing. The installation of modern optical fiber cables is normally done inside high-density polyethylene (HDPE) conduits [
1], referred to as optical fiber microducts. The outer diameter of optical fiber microducts vary in the range of 3.0 mm to 22.0 mm. Optical fiber microducts with outer diameters of 14.0 mm and 3.0 mm are amongst the most commonly used variants. The 14.0 mm optical fiber microducts are commonly used for inner city and intercity installations, while 3.0 mm optical fiber microducts are mostly used for end user installations. Multiple fiber microduct installations are common depending upon the requirement of the number of connections. It is normal practice in industry to install a few extra empty microducts in each new installation allowing for possible future upgrade and repair needs. The normal length of one single fiber microduct roll is approximately 1200 meters. Depending upon the field requirements, the optical fiber microduct can either be extended or cut at the desired length. For the extension of fiber microducts, a mechanical type of joint is used. Mechanical joints are based on a pneumatic push fit type design that can join two fiber microducts together by insertion from each side. Although mechanical joints are quite fast (i.e., approximately one second per joint), they are bulky and have poor water sealing capability under longer periods of operation which can vary from a few years to up to tens of years. After installation of optical fiber microducts, optical fiber cables are then air-blown inside them using pressurized air [
2]. The mechanical joints are designed to withstand a working pressure of 15 bar, but they can leak or in worst case scenarios even explode under increased pressure, i.e., 25 bar during air blown fiber installation. For multiple microduct installations, an employee has to cut each microduct at different lengths to keep the overall multi joint diameter small.
To overcome the limitations of mechanical joints, thermoelectric welding of optical fiber microducts is proposed and investigated. High-density polyethylene is a type of thermoplastic polymer which is considered best for welding through remelting. The welding of two fiber microducts requires the outer surface of the fiber microduct to be remelted to the desired depth without thermal damage to the inner surface. The depth of the melted HDPE layers is vital for the overall strength and water sealing capability of the thermoelectric joint. Electrofusion joints are one such type of thermoelectric joint that work on a similar principle [
3]. Similar to optical fiber microducts, electrofusion joints are also made up of HDPE. In order to replace mechanical joints in optical fiber microduct installations, the proposed thermoelectric welding system should be able to weld one joint within one second and capable of being powered by a rechargeable battery.
To fulfill these requirements, an electro-thermal model of HDPE fiber microducts was developed and validated. The developed electro-thermal model can be utilized to adjust power input and heating time to reach desired temperatures inside the outer surface of the optical fiber microduct while avoiding thermal damage to the inner surface. The heat transfer inside the HDPE was modelled as conduction heat transfer, while heat dissipation to surrounding air was modelled as convection heat transfer. The calculated values of thermal resistance (
) and thermal capacitance (
) were combined together to model conduction heat transfer. Calculated convection resistance (
) was used to model heat convection. The thermal conduction and thermal convection parameters were then converted to electrical equivalents using thermal to electrical analogy [
4]. Thermal resistance and convection resistance were modelled as electrical resistance (R), and thermal capacitance was modelled as electrical capacitance (C). Electrical resistance and capacitance ladder (RC- ladder) type thermal models are very flexible and are used to model 1D [
5], 2D [
6], and 3D thermal problems [
7]. Electrical analogs to thermal parameters can either be connected in a series or parallel to model a thermal system [
8].
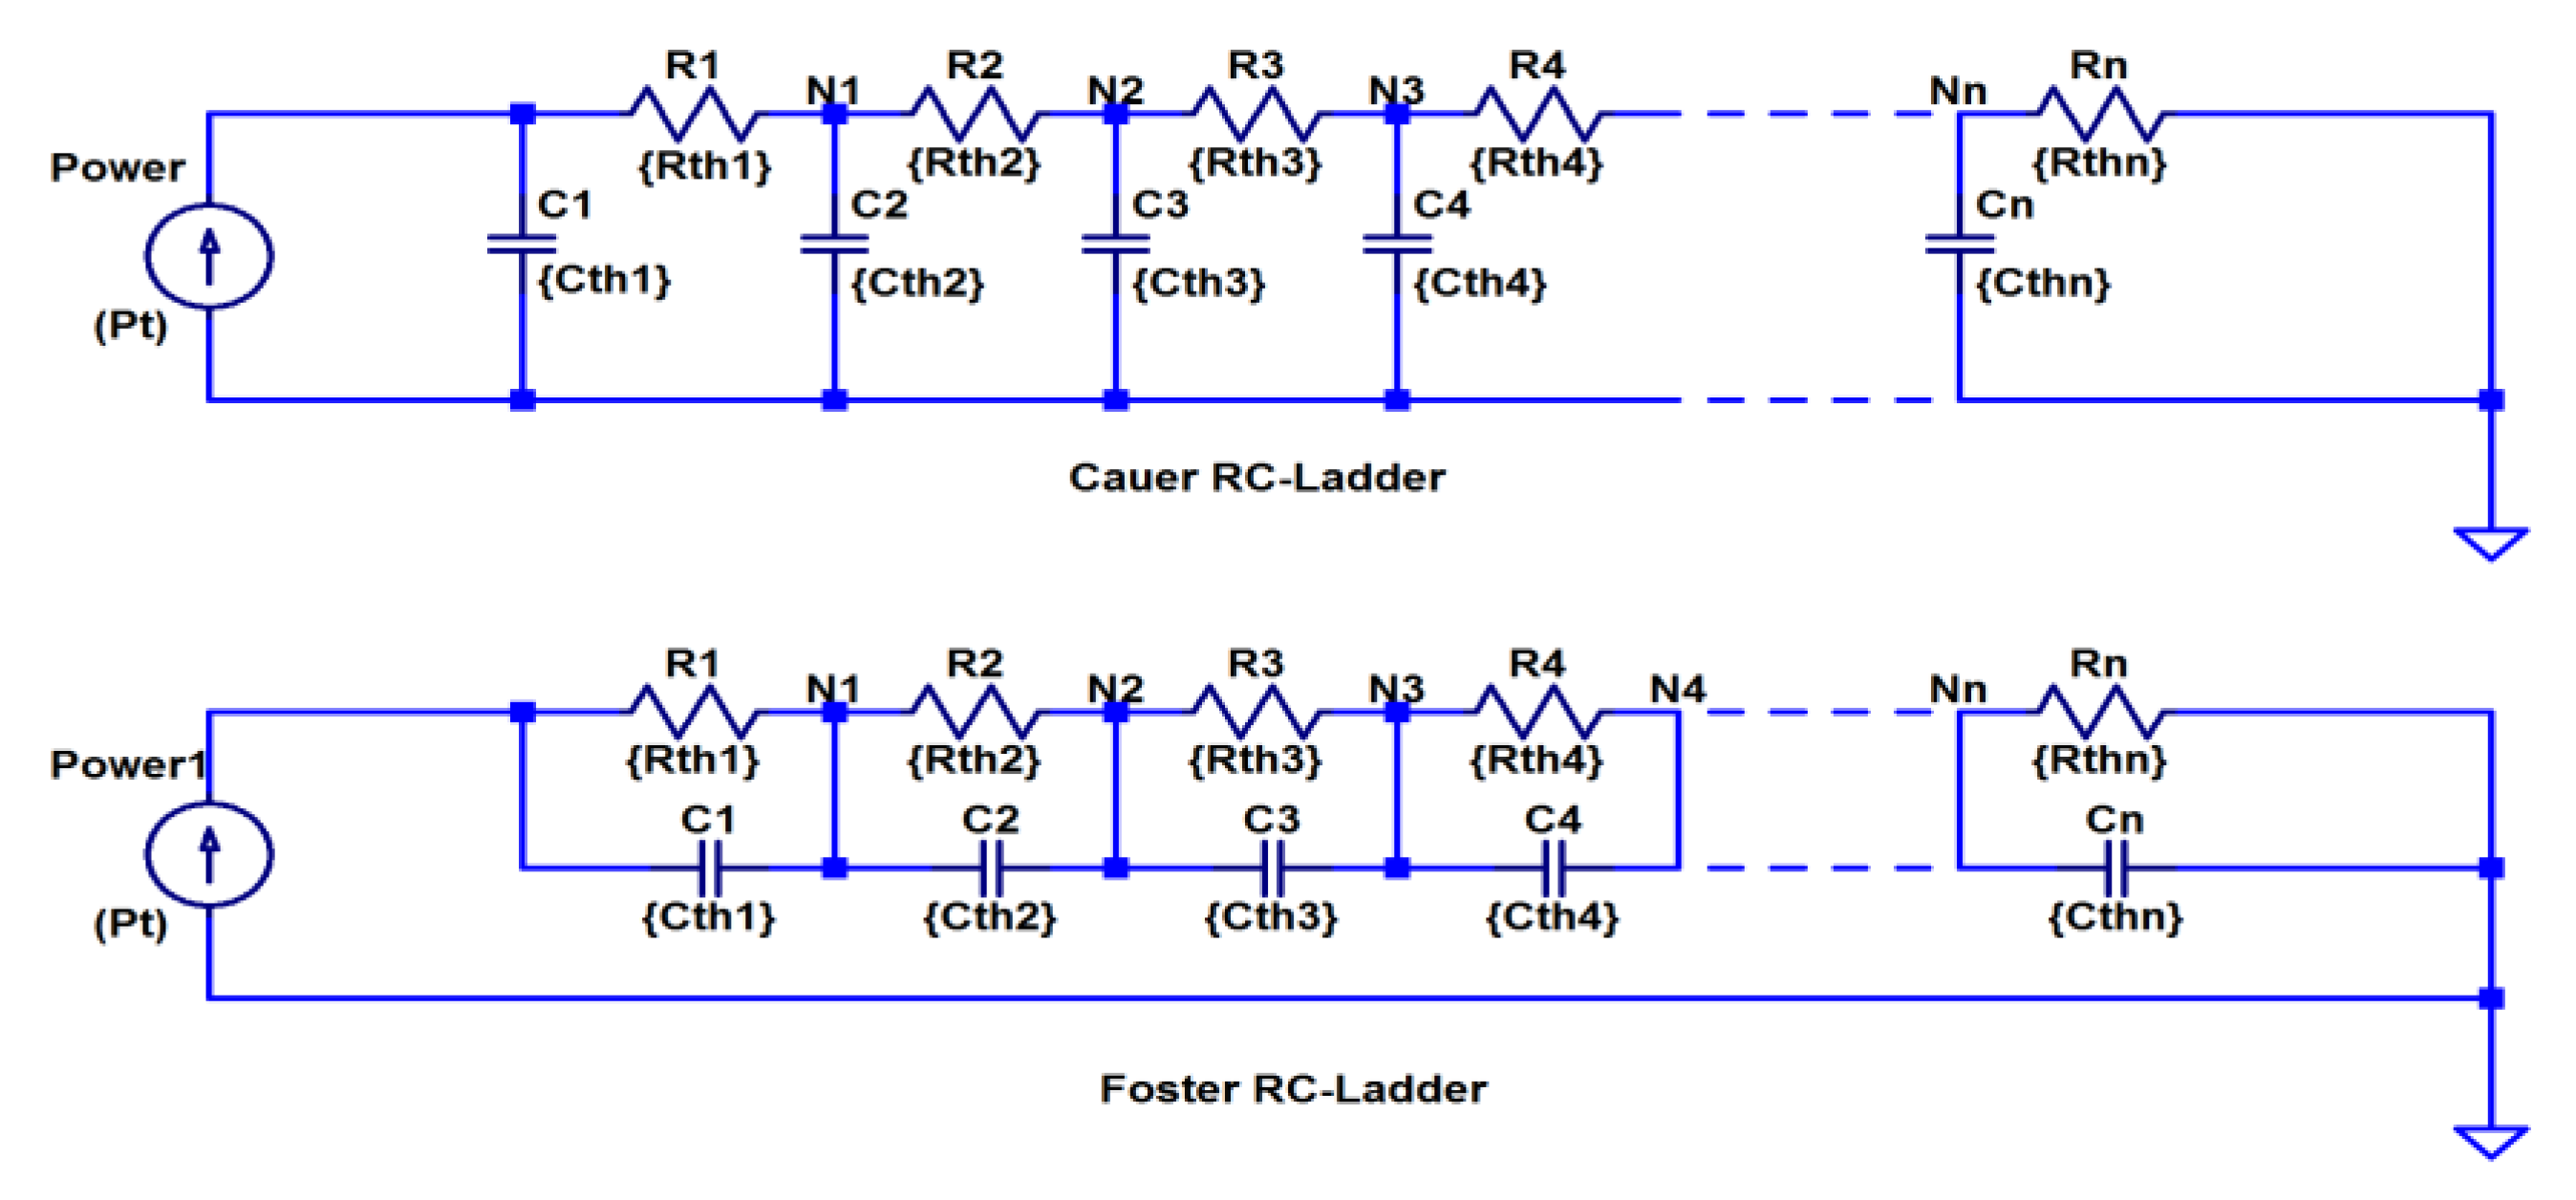
As shown in
Figure 1, Cauer-type RC-ladders and Foster-type RC-ladders are two widely used electrical models analogous to thermal systems [
9]. A Cauer RC-ladder can be transformed into a Foster RC-ladder and vice versa [
10]. A Foster RC-ladder resembles a black-box-type model where the RC nodes (i.e., parallel pairs of resistance and capacitance) have no relation to the physical structure of the material [
11]. A Cauer RC-ladder resembles a white-box-type configuration where each node (i.e., series pair of resistance and capacitance) can show the temperature of that particular node [
12]. Cauer-type RC models can be used for modelling the internal temperature profile of materials [
13]. Cauer RC-ladders for thermal behavior modelling have been used in many different fields of engineering and science, i.e., electronics [
14], building engineering [
15], and biological sciences [
16].
For obtaining thermal parameter values (i.e., thermal resistance and thermal capacitance values), for Cauer- or Foster-type RC-ladders, normally, the thermal response curve of a system is either measured [
9] or simulated using the finite element method (FEM) [
17] or finite difference method [
13]. Then, these measured or simulated thermal response curves are used to estimate the values of thermal resistance and thermal capacitance using either curve fitting [
18] or the deconvolution method [
19]. The mathematical representation of Cauer RC-ladders is very complicated, and it is more difficult to determine thermal parameter values by curve fitting than by Foster RC-ladder representation [
10]. In order to obtain a physical structural relation profile of the layer level temperature, an alternative approach is to determine the Cauer RC-ladder thermal parameters by considering the physical structure and material properties [
8,
18].
Although there exist 3D thermal models utilizing Cauer RC-ladders, their thermal parameters are mostly extracted from 3D FEM simulations [
13]. If the 3D thermal paths are exactly known, then 3D thermal model can be developed directly from the thermophysical properties of the material, but it is not very simple to obtain accurate 3D heat flow paths in materials [
13].
In this article, the values of thermal resistance and thermal capacitance of the HDPE fiber microduct and its outer shell of low-density polyethylene (LDPE) were calculated from their geometric shape and material properties at the layer level. The Cauer RC-ladder was then built and simulated in LTspice to show the transient thermal behavior of heat propagation inside the HDPE and LDPE layers. In the LTspice simulation, the voltage at each node represented the equivalent temperature of the respective layer. The proposed electro-thermal model was validated with three different sets of real measurements taken with K-type thermocouples at different LDPE layers. In order to obtain the best curve fit, the calculated thermal model was then optimized to match the temperature profile of each layer. The optimized thermal model showed very good conformity to the actual measurements at the layer level. This model can be deployed to design and develop a new generation of optical fiber joint welding systems.
2. Electro-Thermal Model
Heat propagation can take place in three different ways: conduction, convection, and radiation [
20]. Conduction is the mode of transfer of heat due to the mutual collision and diffusion of molecules during random motion. Convection is the heat transfer between a surface and the adjacent gas or liquid that is in natural or forced motion. In the absence of forced motion, convection is called natural or free convection; and, in the presence of some external forced motion, convection is called forced convection. Heat transfer in the form of electromagnetic waves is called radiation heat transfer. Radiation heat transfer does not require a medium for heat transfer. All three types of heat transfer modes require temperature difference, and heat always transfers from the higher temperature side to the lower temperature side. For the modelling of heat transfer in optical fiber microducts, heat transfer inside air and HDPE were electro-thermally modeled and only conduction and convection heat transfer modes were modelled.
Kirchhoff [
21], as early as in 1845, stated and proved that the two different forms of energy behave equivalent or analogous to each other if the basic differential equations describing their behavior and their initial and boundary conditions are same [
21,
22]. Assuming one-dimensional heat flow through a small elemental section for simplicity, the one-dimensional Fourier equation of heat flow for transient conduction in homogeneous isotropic material is given by [
21,
23]:
where
is the specific thermal capacitance,
is the density of the material,
is the specific thermal conductivity,
is the coordinate in the direction of heat propagation, and
is temperature. For development of an electrical analogue for Fourier heat conduction equation, the transmission line wave equation can be used, which is described as [
22]:
where
is the capacitance per unit length,
is the inductance per unit length,
is the resistance per unit length, and
is the transconductance per unit length. In heat conduction, there is no direct comparison for electrical inductance (i.e.,
= 0), and if it is considered that the volume cannot cool itself (i.e.,
= 0), the transmission line equation is reduced to [
21,
22]:
As can be seen, Equations (1) and (3) have the same structure. By only changing the symbols of system variables, one system can model the response behavior of the other system. In this way conduction heat flow can thus be modelled as electrical current flow. The analogy between thermal and electrical systems is shown in
Table 1.
2.1. Extraction of Thermal Parameters
Thermal parameters like thermal resistance and thermal capacitance along with DC electrical resistance were extracted using material properties and their geometric shape. The joule heat effect was produced using 0.1 mm diameter polyurethane-insulated copper wire with 14 turns around an optical fiber microduct. The outer diameter of the optical fiber microduct was 14.07 mm. The measured wire resistance was 1.4512 ohm. Steady state heat conduction of a planar wall,
in °C/watt, can be calculated using the relation [
23]:
where
is the thickness of the material along the direction of the heat flow in meters,
is the specific thermal conductivity in W/°C·m, and
is the cross-sectional area in m
2 perpendicular to the direction of the heat flow. For the planar wall shown in
Figure 2, the cross-sectional area
can also be calculated by multiplying the length (
and width
:
For the cylindrical wall shown in
Figure 2, it can be assumed that heat dissipation occurs in the normal direction to the wall surface and that no heat dissipation occurs in other directions [
23]. Cylindrical thermal resistance,
, for one-dimensional steady-state heat conduction through a hollow cylinder or tube can be calculated by the following formula [
23]:
where
is the outer radius and
is the inner radius of a cylindrical wall in meters,
is the specific thermal conductivity in W/°C·m, and
is the length along the axial direction of the tube.
Thermal capacitance in watt·second/°C can be calculated using the relation [
8,
24]:
where
is the specific heat capacity in J/kg·°C,
is the density in kg/m
3, and
is the material volume. For a planar configuration,
can be calculated using:
where
is the thickness of the planar wall. For a cylindrical configuration, volume
can be calculated using:
Convection resistance in °C/watt for a planar and cylindrical wall can be calculated using [
23]:
where
is the convective heat transfer coefficient in W/m
2·°C and
is the cross-sectional area for convection in m
2.
2.2. Computed RC Thermal Model
For thermal model calculation, a copper coil was wound on the surface of the optical fiber microduct, and it was then wrapped inside the LDPE sheet. The geometric shape of a single layer around the Joule heating coil will look like as shown in
Figure 3. The optical fiber microduct was made of HDPE, and the layer around the Joule heating coil was made of LDPE. It can be seen in
Figure 3 that each layer can be divided into three hollow cylinders or tubes.
The outer tube and inner tube represent the inner and outer sections of the layers along the axial direction of the optical fiber microduct, while the third tube represents the section along the circumference of the optical fiber microduct which is, again, divided into two half parts, namely, the left half tube and the right half tube. This first layer had a fixed thickness of 200 µm. The thermal parameters for each of these three tubes in the first layer can be computed by considering the one-dimensional heat flow in the radial direction [
23]. The thermal parameters of these three cylinders were then combined together as a parallel or series network of electrical resistors or electrical capacitors to obtain the complete
and
values for each layer. The complete geometrical layer distribution is shown in
Figure 4 which was used for the thermal model calculations. The total wall thickness of the HDPE optical fiber microduct was 2.0 mm, and the outer LDPE shell was 0.8 mm. The layer thickness of the first five inner HDPE layers (Li200–Li1000) and outer LDPE layers (Lo200–Lo1000) was 200 µm each, and the last two inner (Li1500, Li2000) and outer layers (Lo1500, Lo2000) were 500 µm each. The total thickness of all layers was equal to the total thickness of the optical fiber microduct wall which was 2.0 mm. By splitting the layer geometry into three tubes, the thermal resistance for the inner layers Li200–Li2000 and the outer layers Lo200–Lo800 was calculated using Equation (6), and the thermal capacitance was calculated using Equations (7) and (9). The thermal resistance of the remaining outer three layers, Lo1000–Lo2000, was calculated using Equations (5) and (4), and the thermal capacitance was calculated using Equations (8) and (7). The material properties used for the HDPE layer calculations were
= 950 kg/m
3,
= 0.51 W/°C·m, and
= 2000 J/kg·°C, and for the LDPE layer, they were were
= 900 kg/m
3,
= 0.36 W/°C·m, and
= 2300 J/kg·°C.
For the thermal resistance calculation of the Joule heating coil using Equation (6) and the thermal capacitance using Equations (7) and (9), the material properties were
= 8940 kg/m
3,
= 397.48 W/°C·m, an
= 376.8 J/kg·°C. The convection resistance of the inner layers (Riconv) and the outer layers (Roconv) was calculated using Equation (10). The convective heat transfer coefficient is usually in the range of 4 to 28 for natural convection in air [
25]. The convective heat coefficient was initially chosen to be 28 for the inner layer of the HDPE and the outer layer of the LDPE. The cross-sectional area A for convection was calculated by multiplying the respective circumference and length of the convection area. The heat spreading effect inside the layers was considered in calculating the convection resistance. For the initial approximation, a 45° spread [
12] was considered on both sides of the inner layer (Li2000) and outer layer (Lo2000). By using Equation (10), Riconv and Roconv were initially calculated to be approximately 1/(28 × 9.4 × 31.6 × 10
−6) = 120.2 °C/watt and 1/(28 × 6.0 × 49.82 × 10
−6) = 119.46 °C/watt, respectively.
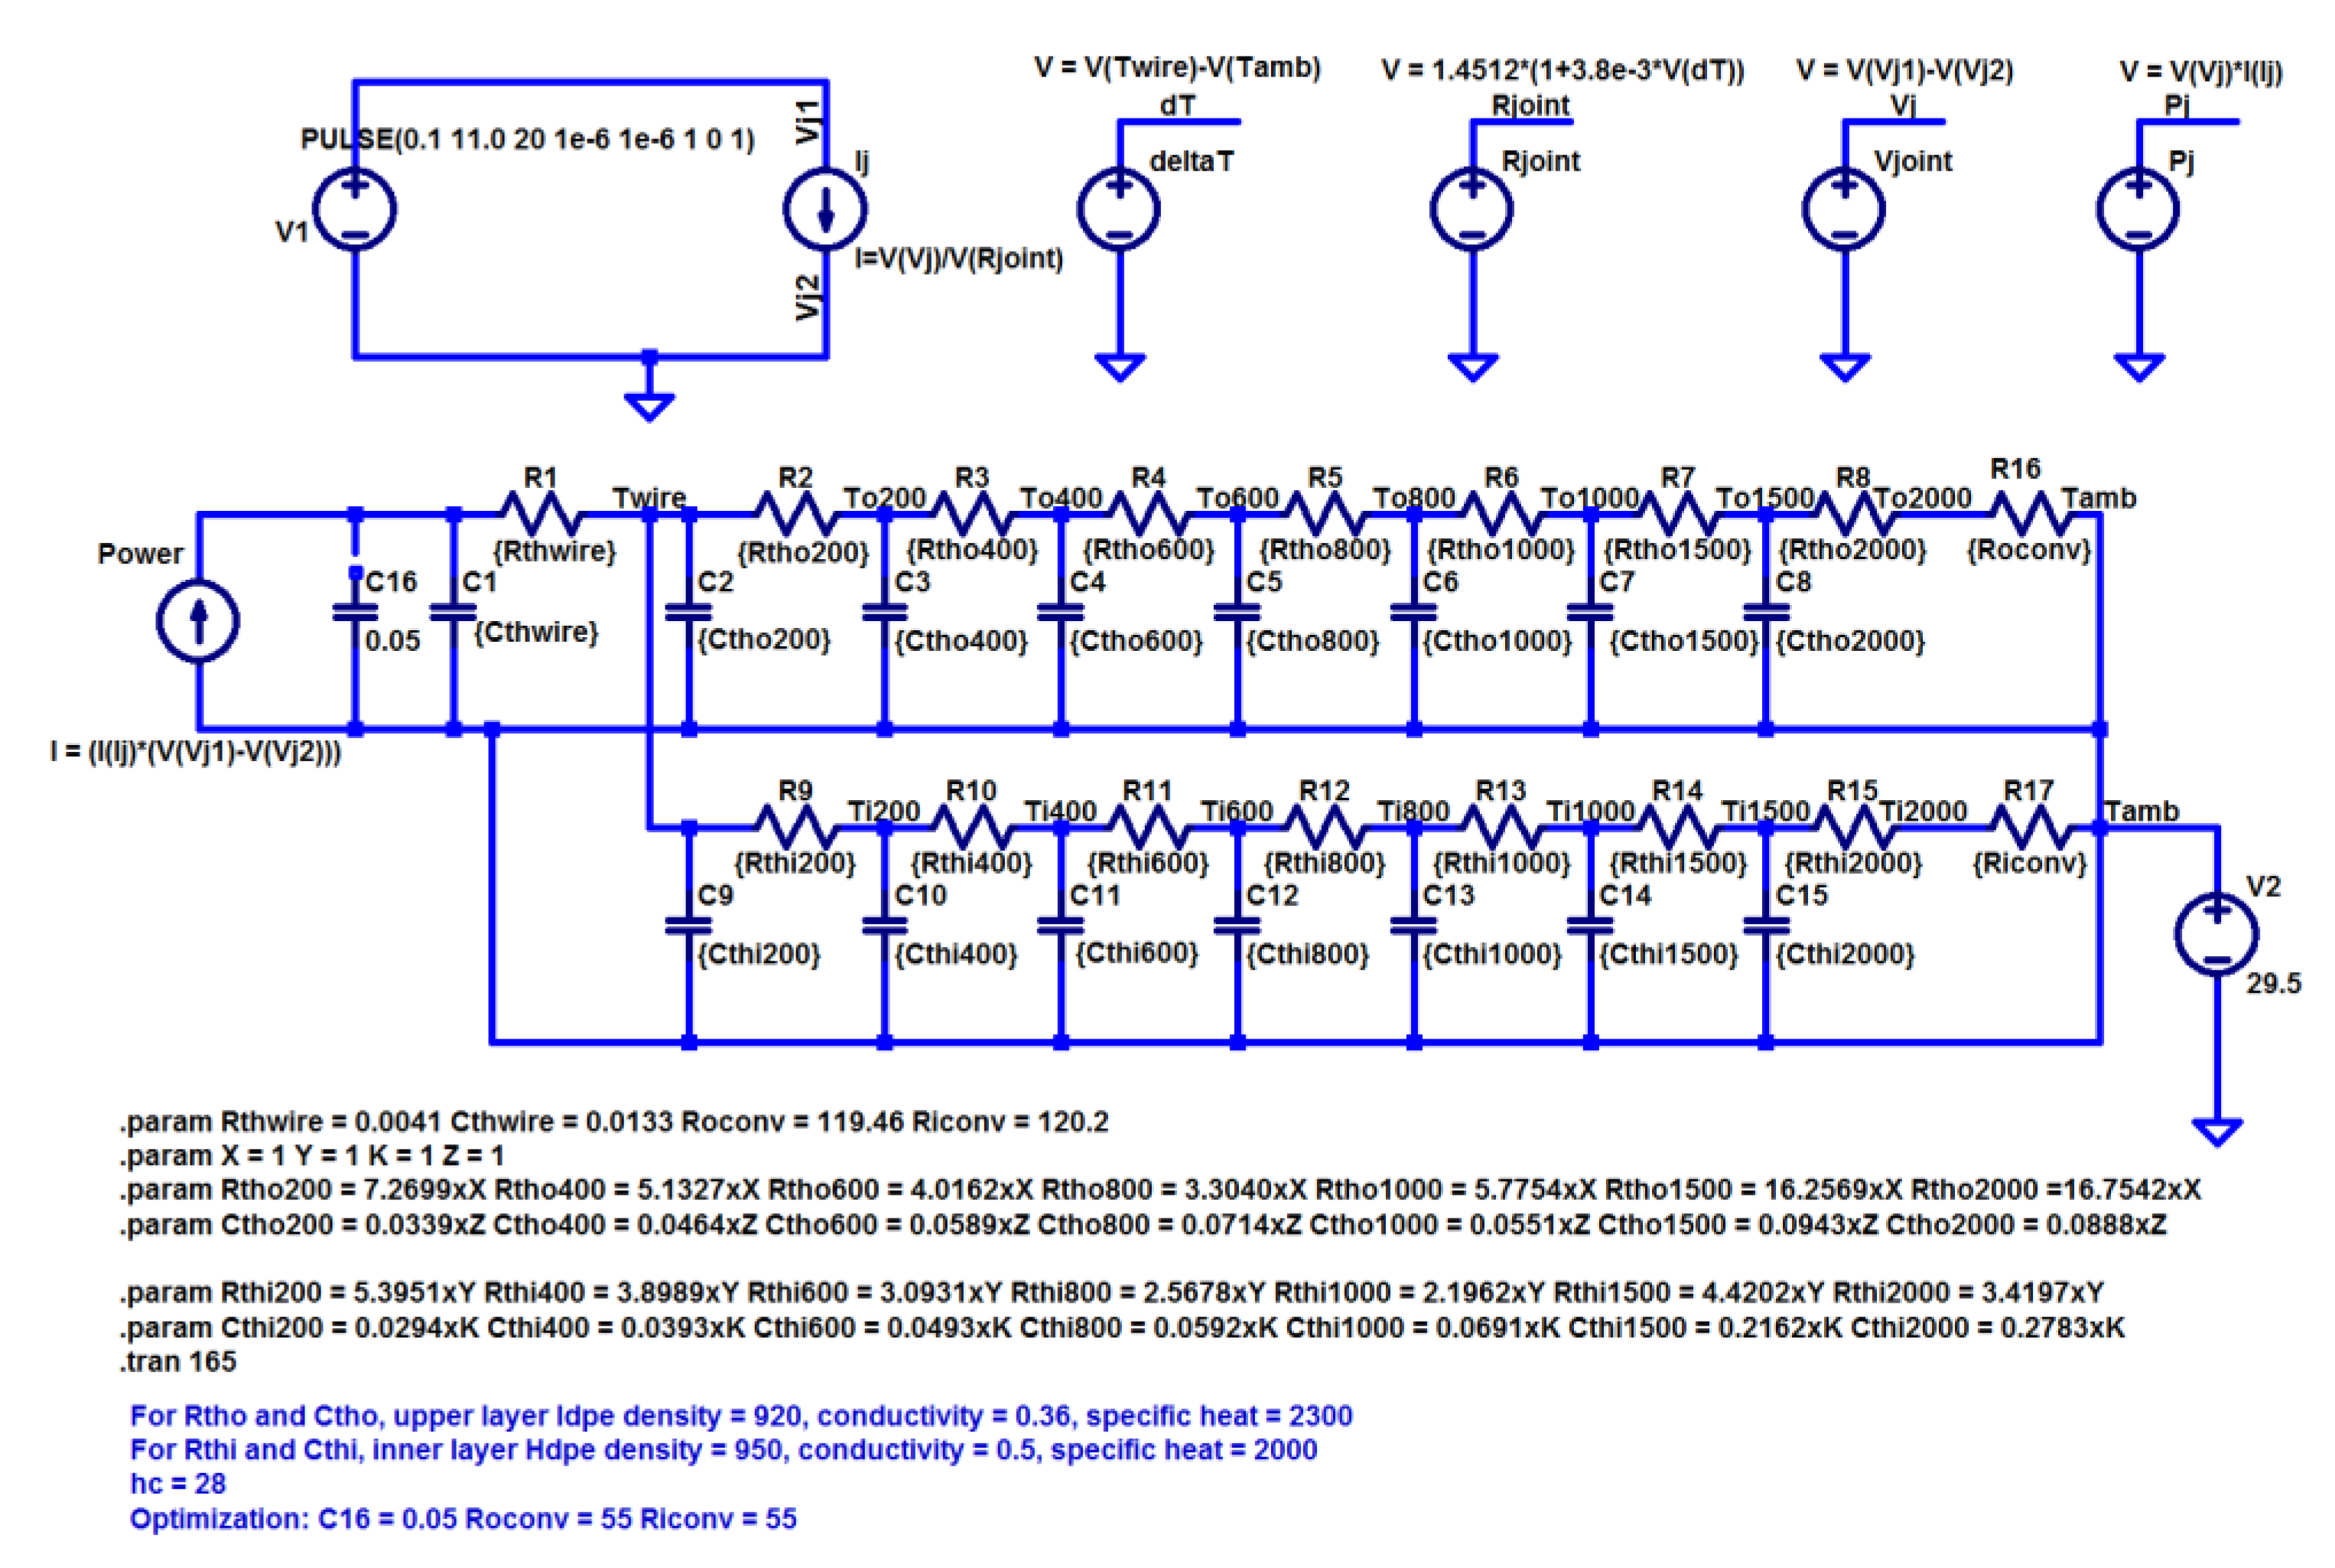
MATLAB code was used to calculate the individual thermal resistance of each outer and inner layer (Rthi200–Rthi2000, Rtho200–Rtho2000) and individual thermal capacitance of each outer and inner layer (Cthi200–Cthi2000, Ctho200–Ctho2000). With each layer’s calculated thermal resistance and thermal capacitance, a Cauer-type thermal network was constructed in LTspice as shown in
Figure 5. In the Cauer-type thermal network, each calculated thermal resistance and each thermal capacitance was replaced by electrical resistance R2–R15 and electrical capacitance C2–C15, respectively, according to
Table 1. Calculated Roconv and Riconv values were also replaced with electrical resistance R16 and R17, respectively. The thermal resistance of wire (Rthwire) and thermal capacitance of wire (Cthwire) of the Joule heating coil was also modelled as electrical resistance R1 and electrical capacitance C1 as can be seen in
Figure 5. The input pulse voltage source V1 generated a single pulse of one second duration. The DC resistance of the Joule heating coil was calculated while taking into account the change in the coil resistance due to the heating effect and was modelled as Rjoint. In the Cauer-type thermal model, the power input source was modelled as an equivalent current source that equals the power input for the Joule heating as shown in
Table 1. The current drawn for the Joule heating was calculated from supply voltage V1 and joint resistance Rjoint. The supplied voltage and current was then multiplied to give the equivalent power input to the thermal model. The input power was then modelled as the current source for the thermal simulation model. The output voltage on each node in the LTspice model (Ti200, To200, etc.) showed the temperature of that particular layer in volts according to
Table 1. The ambient temperature was modelled as V2. In
Figure 5, the non-connected capacitor C16 has no effect on the calculated model, but it will be used later for optimization of the peak temperatures and transient thermal behavior at the layer level.
2.3. Validation of Computed Model
For validation of the computed thermal model, three measurements were taken with a 50 µm thick K-type thermocouple. Three totally new samples were made to measure the temperature profile. In each sample, a new Joule heating wire was wound on a new piece of optical fiber microduct. On the upper side of a Joule heating coil, four layers of 200 µm LDPE sheets were wrapped. In the first sample measurement, four thermocouples were used, and in the second and third samples, two thermocouples were used. In all three measurements, two thermocouples were always inserted at layer Lo200 and Lo400. The K-type thermocouples were connected to a PicoLog TC-08, an eight-channel thermal data logger, using PicoLog 6 software. A PicoLog TC-08 thermal data logger can measure, at a maximum, ten samples per second for single channel measurement, i.e., 100 ms per sample. The PicoLog TC-08 is a multiplexed data logger; therefore, with each extra thermocouple, the data logging time increased.
2.3.1. First Sample Measurement
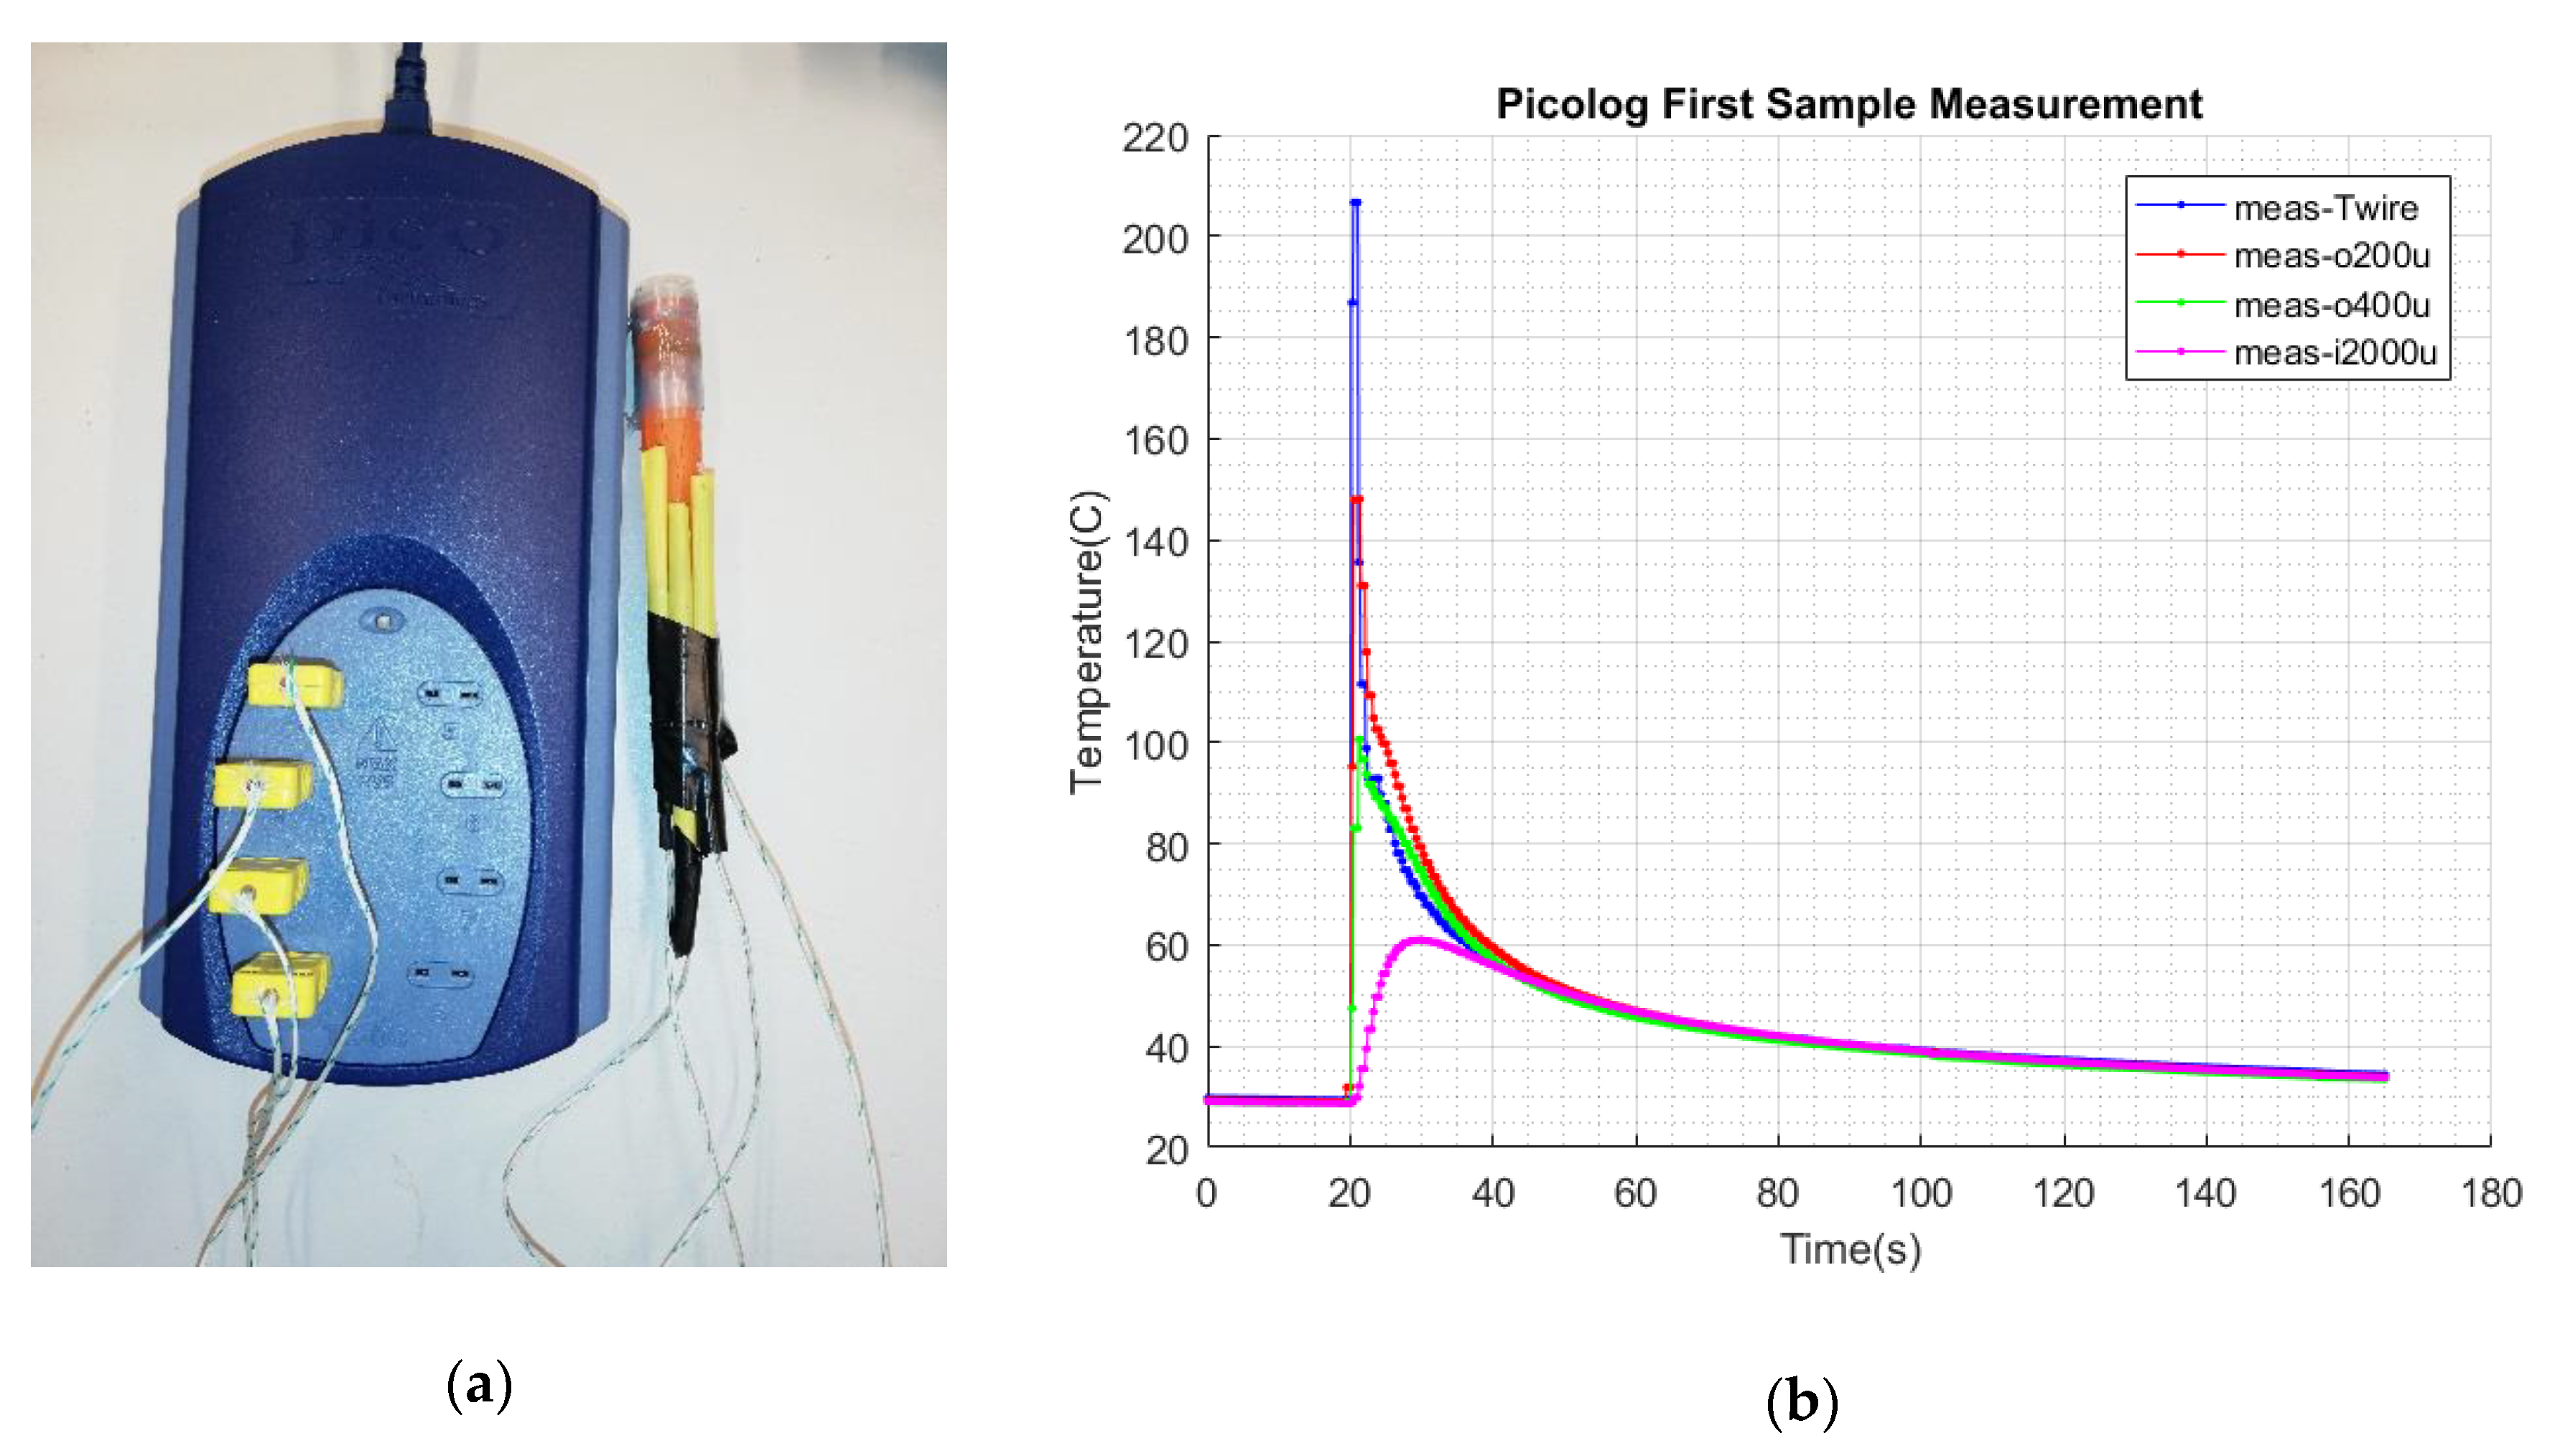
A total of four thermocouples of K-type were used in this measurement, and the data sampling was 2.5 samples per second for each thermocouple channel. A polyurethane-coated copper Joule heating coil with a 0.1 mm diameter was wound 14 times on the HDPE optical fiber microduct surface. The coil was soldered to copper tape at both ends to allow for easy connection to a power supply source. The LDPE sheet, with a 200 µm thickness, was used to measure temperature differences inside the different outer layers. First, the K-type thermocouple was inserted directly above the heating coil. A single turn of the 200 µm thick LDPE sheet was wound first on the thermocouple and copper coil. After the first turn, a second K-type thermocouple was inserted exactly above the heating coil on the first LDPE layer (Lo200). Then, the second LDPE layer (Lo400) was wound. After the second LDPE sheet was wound, the third K-type thermocouple was inserted at layer Lo400, exactly above the heating coil. After the LDPE layer Lo400, two more LDPE layers corresponding to Lo600 and Lo800 were wound. At the end of the fourth, the K-type thermocouple was connected inside the inner layer (Li2000) of the optical fiber microduct. All four thermocouples were connected to the PicoLog TC-08 data logger as shown in
Figure 6a. PicoLog 6 software was run to measure the resulting temperature. Before the actual Joule heating measurement, by carefully monitoring the temperature at Lo200 with PicoLog 6, the layers of the LDPE sheet were heated up to 100 °C with a hot air gun for 2–3 s. In this way, it was made sure that the LDPE layers obtained good thermal contact with each other along with the Joule heating coil and thermocouples. The LDPE layers and HDPE optical fiber microduct were then cooled down to room temperature. A DC power supply, TTi CPX400A, was set at 11.0 volts and connected through a DC current meter (Rohde and Schwarz HMC8012) to one end of the Joule heating coil.
An Arduino UNO was programmed to turn on the connected Infineon MOSFET 023NE7N for precisely one second to connect the power supply ground to the second end of the Joule heating coil. When the Arduino gave the one second pulse, the corresponding temperature rise and fall, measured with 50 µm K-type thermocouples at room temperature, were recorded in graphical form with PicoLog 6 software. The measured input voltage was 11.0 volts, and the average input current was 5.12 amperes, i.e., the average power input was 56.32 watts. The resulting temperature graph is shown in
Figure 6b. The highest temperature peak of 206.5 °C (i.e., meas-Twire (blue waveform)) represents the measured temperature rise and fall in the Joule heating coil. The second highest temperature peak of 147.9 °C (i.e., meas-o200u (red waveform)) represents the measured rise and fall of the temperature at the 200 µm outer layer (Lo200,
Figure 4) of the LDPE. The third highest temperature peak of 100.5 °C (i.e., meas-o400u (green waveform)) represents the measured rise and fall of the temperature at the 400 µm outer layer (Lo400,
Figure 4) of the LDPE. The fourth and last peak of 60.9 °C (i.e., meas-i2000u (magenta waveform)) represents the measured rise and fall of the temperature at the 2000 µm inner layer (Li2000,
Figure 4) of the HDPE optical fiber microduct.
2.3.2. Second Sample Measurement
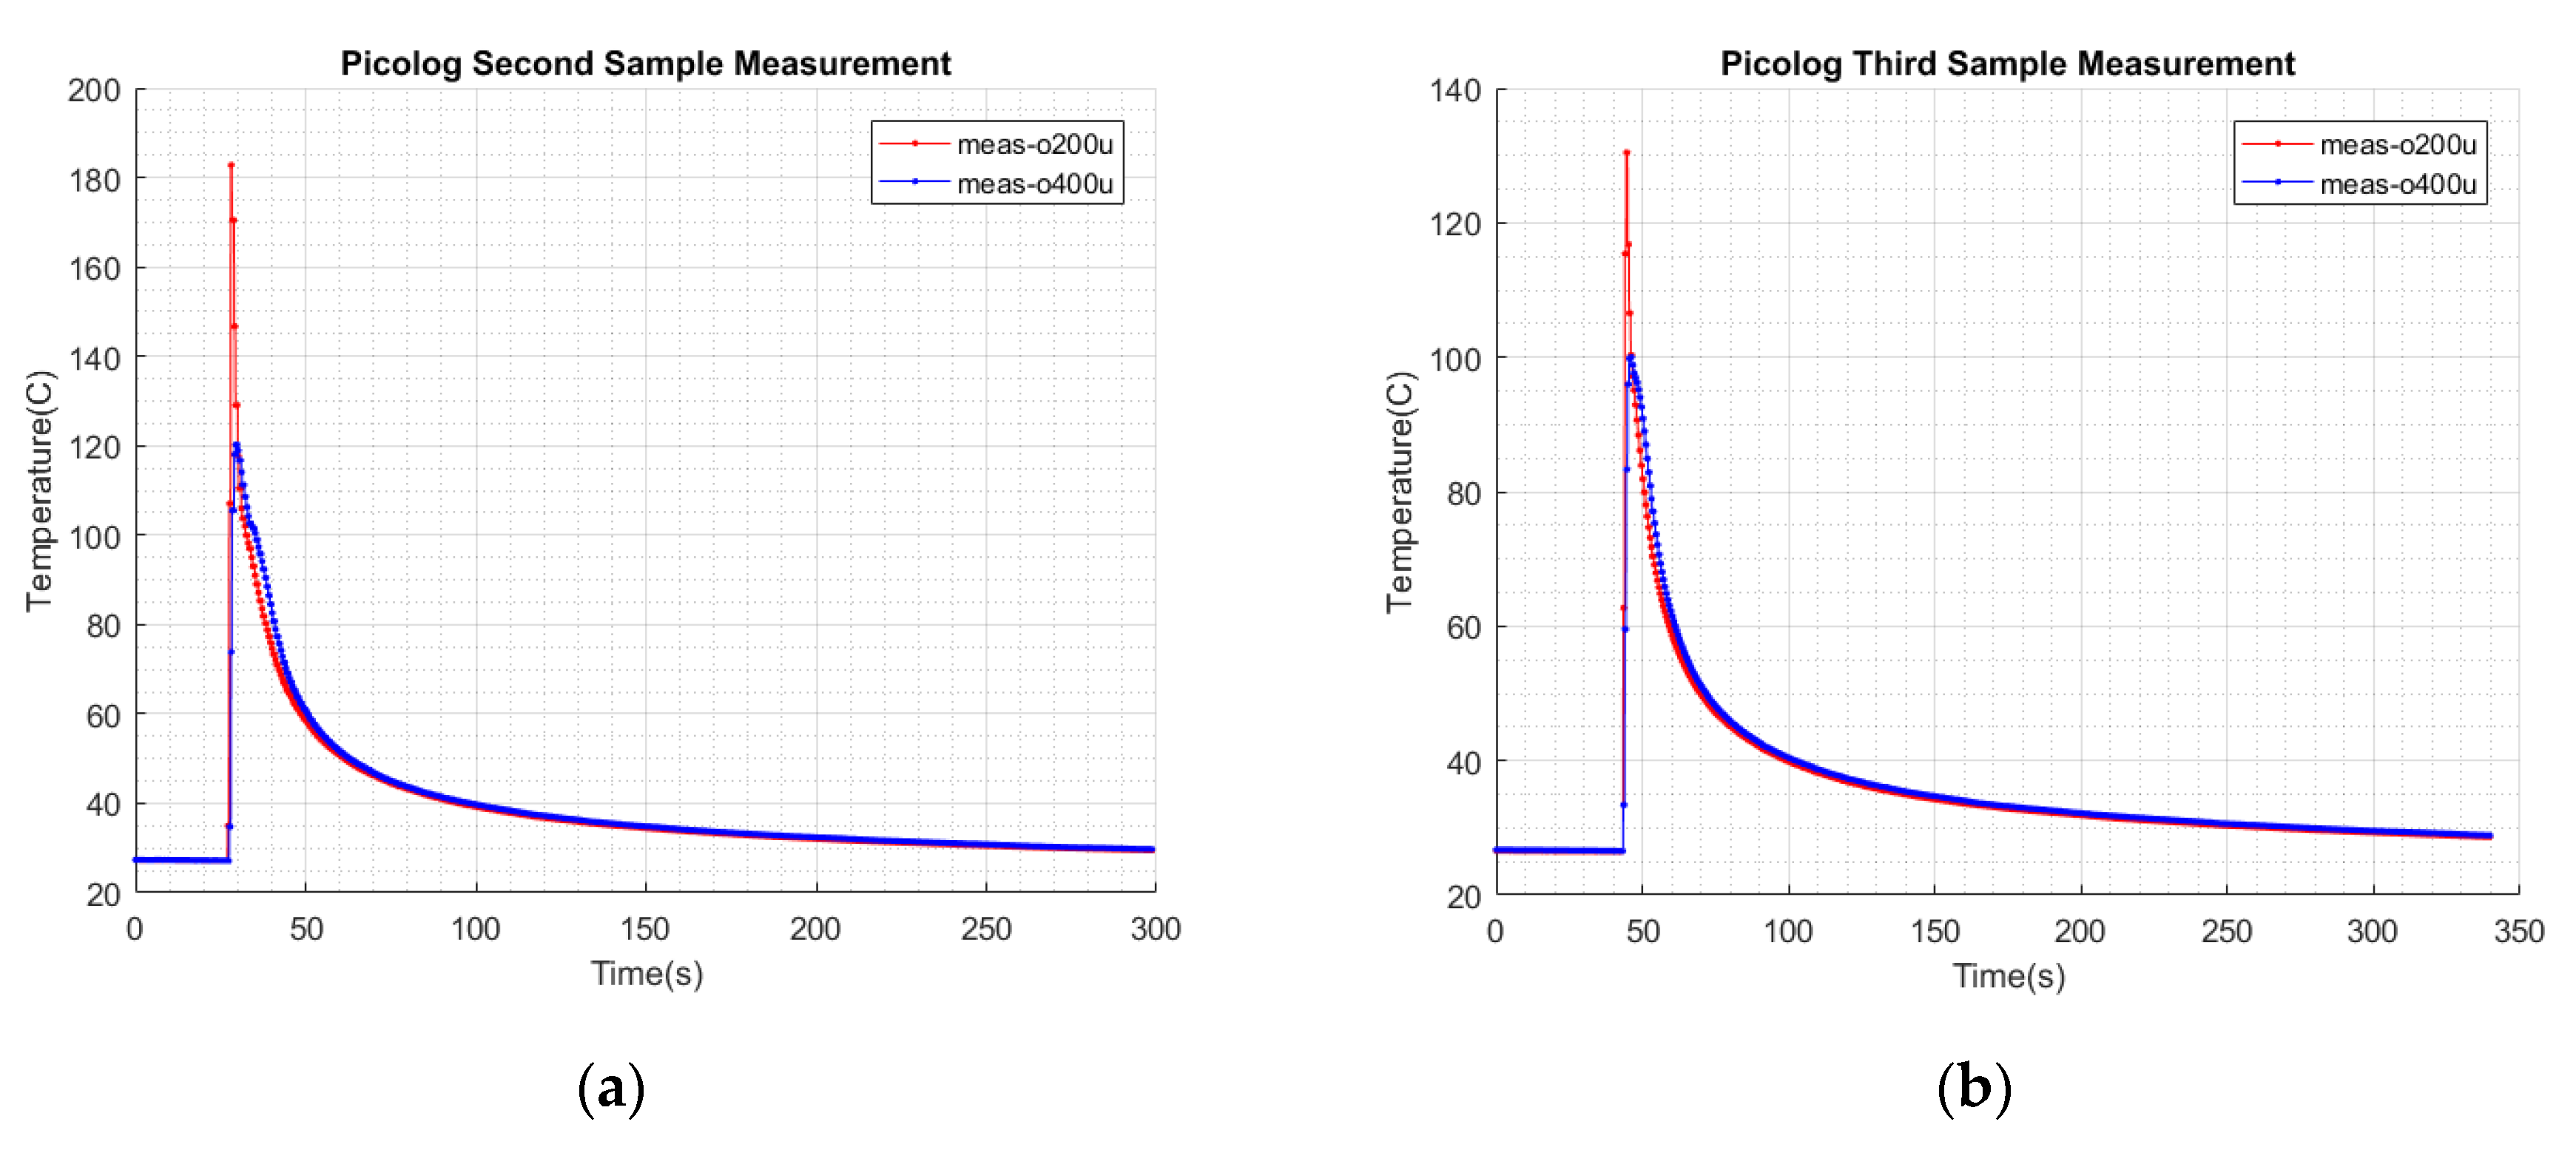
The same method was repeated again on a new Joule heating coil with a 0.1 mm diameter and 14 turns. The temperature was measured on the outer layers Lo200 and Lo400 (
Figure 4) with two 50 µm K-type thermocouples. In total, fours layers of LDPE were wound with two thermocouples. The voltage input was 13.2 volts, and the average current drawn was 5.56 amperes, i.e., the average power input was 73.39 watts. The resulting waveform is shown in
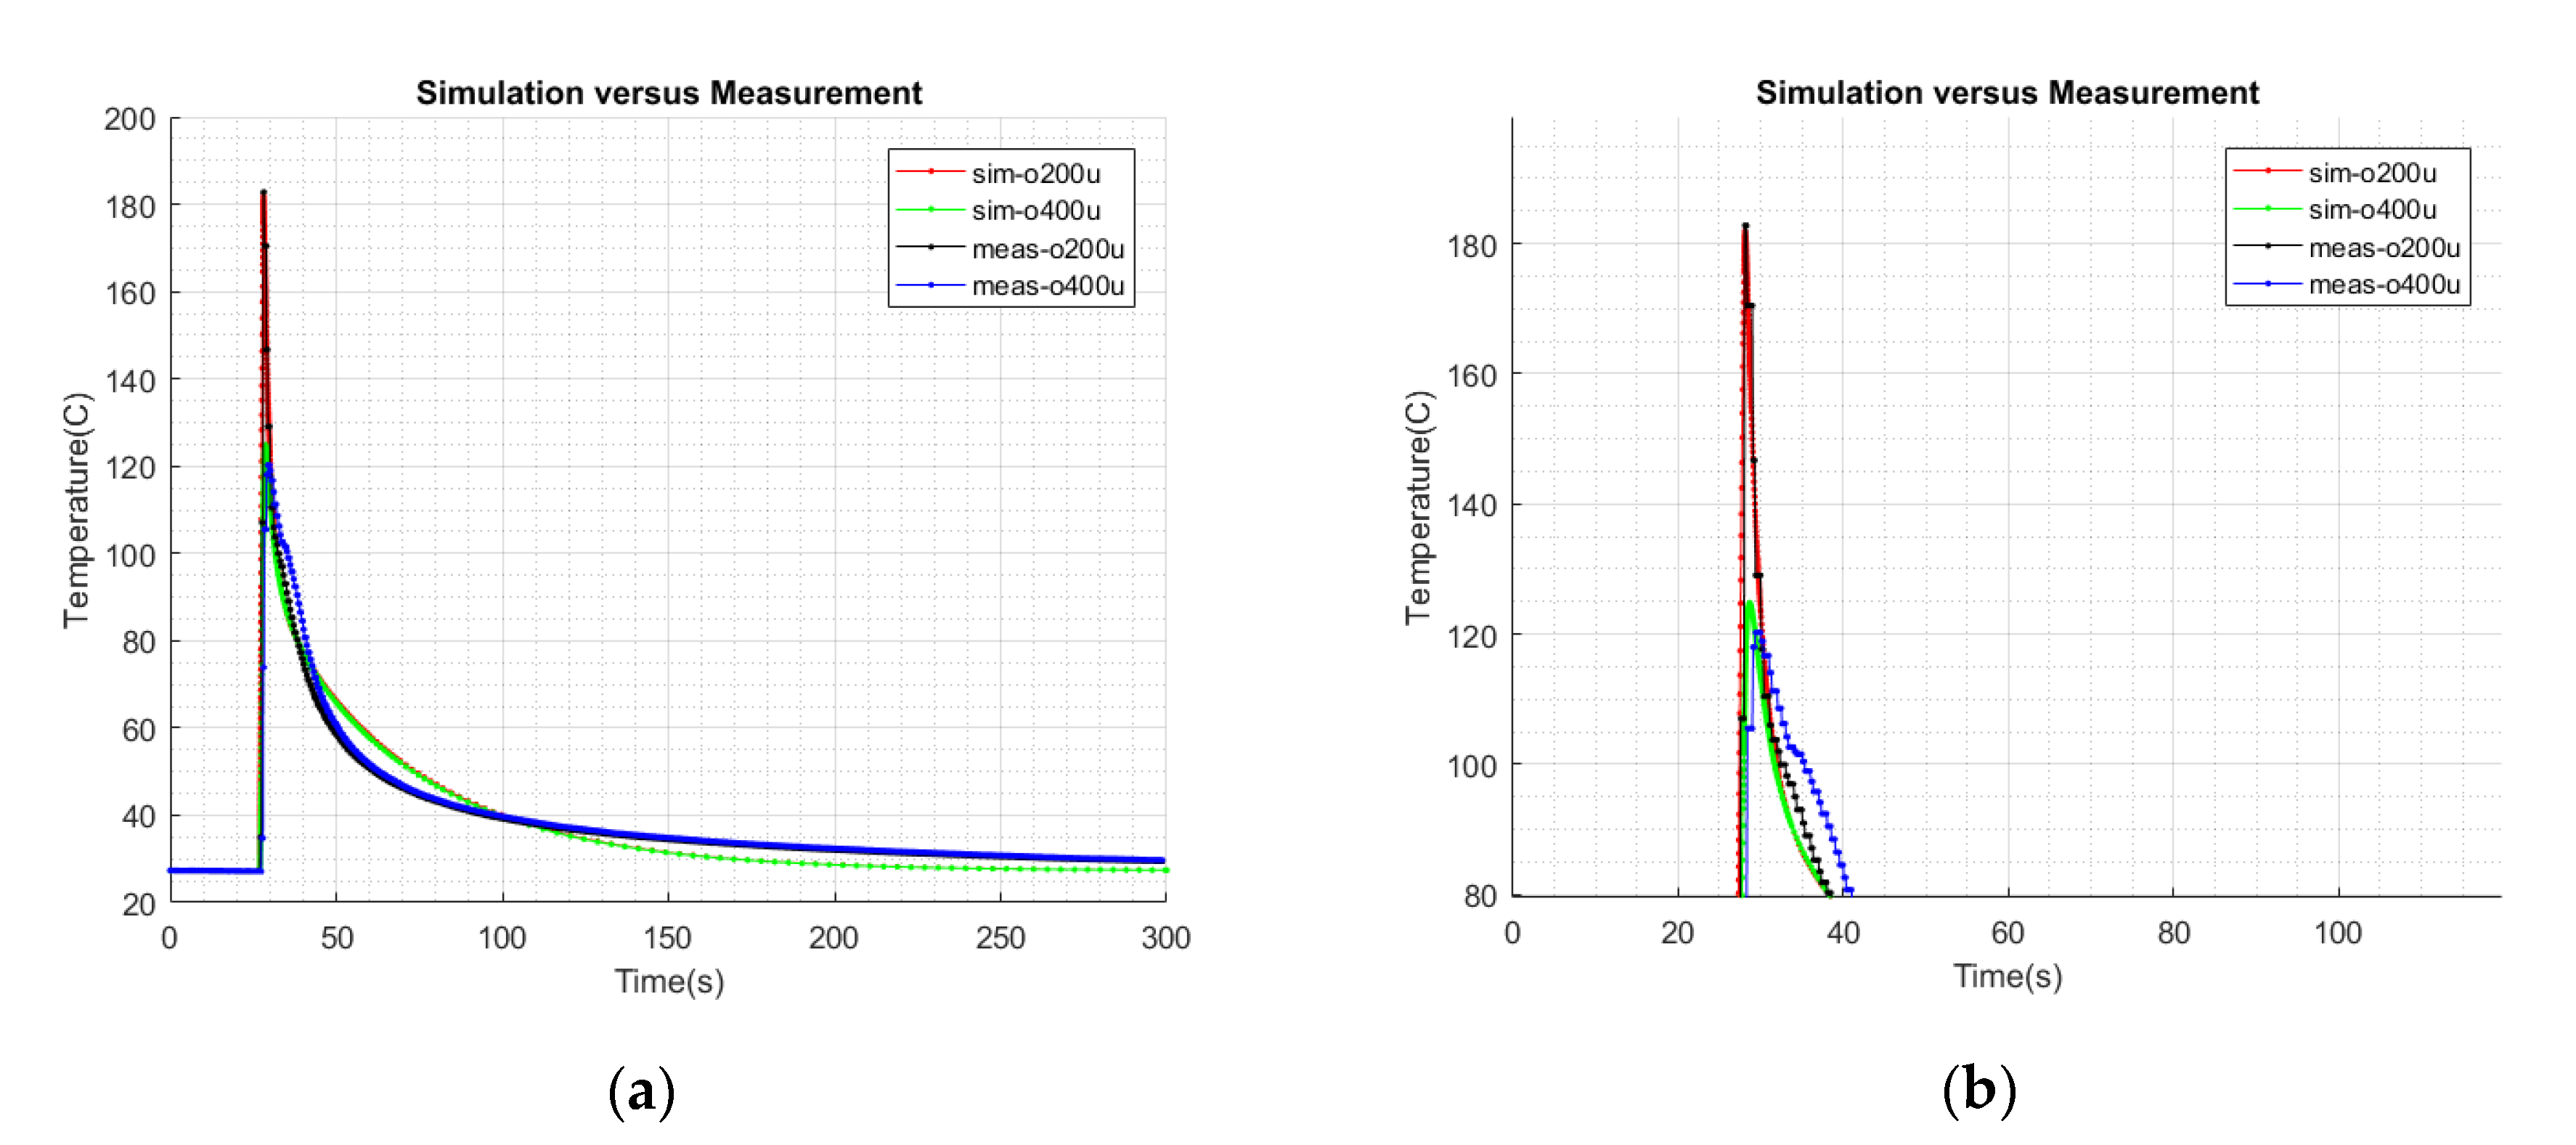
Figure 7a. The first highest temperature peak of 182.8 °C (i.e., meas-o200u (red waveform)) represents the measured rise and fall of the temperature at the 200 µm outer layer (Lo200,
Figure 4) of the LDPE. The second highest temperature peak of 120.3 °C (i.e., meas-o400u (blue waveform)) represents the measured rise and fall of the temperature at the 400 µm outer layer (Lo400,
Figure 4) of the LDPE.
2.3.3. Third Sample Measurement
The same method was repeated on a new Joule heating coil with a 0.1 mm diameter and 14 turns wound on the HDPE optical fiber microduct. Two K-type 50 µm thick thermocouples were used in the measurement. The temperature was measured on the outer layers Lo200 and Lo400 (
Figure 4). In total, fours layers of LDPE were wound with two thermocouples. The voltage input was 10.0 volts, and the average current drawn was 4.89 amperes, i.e., the average power input was 48.9 watts. The resulting waveform is shown in
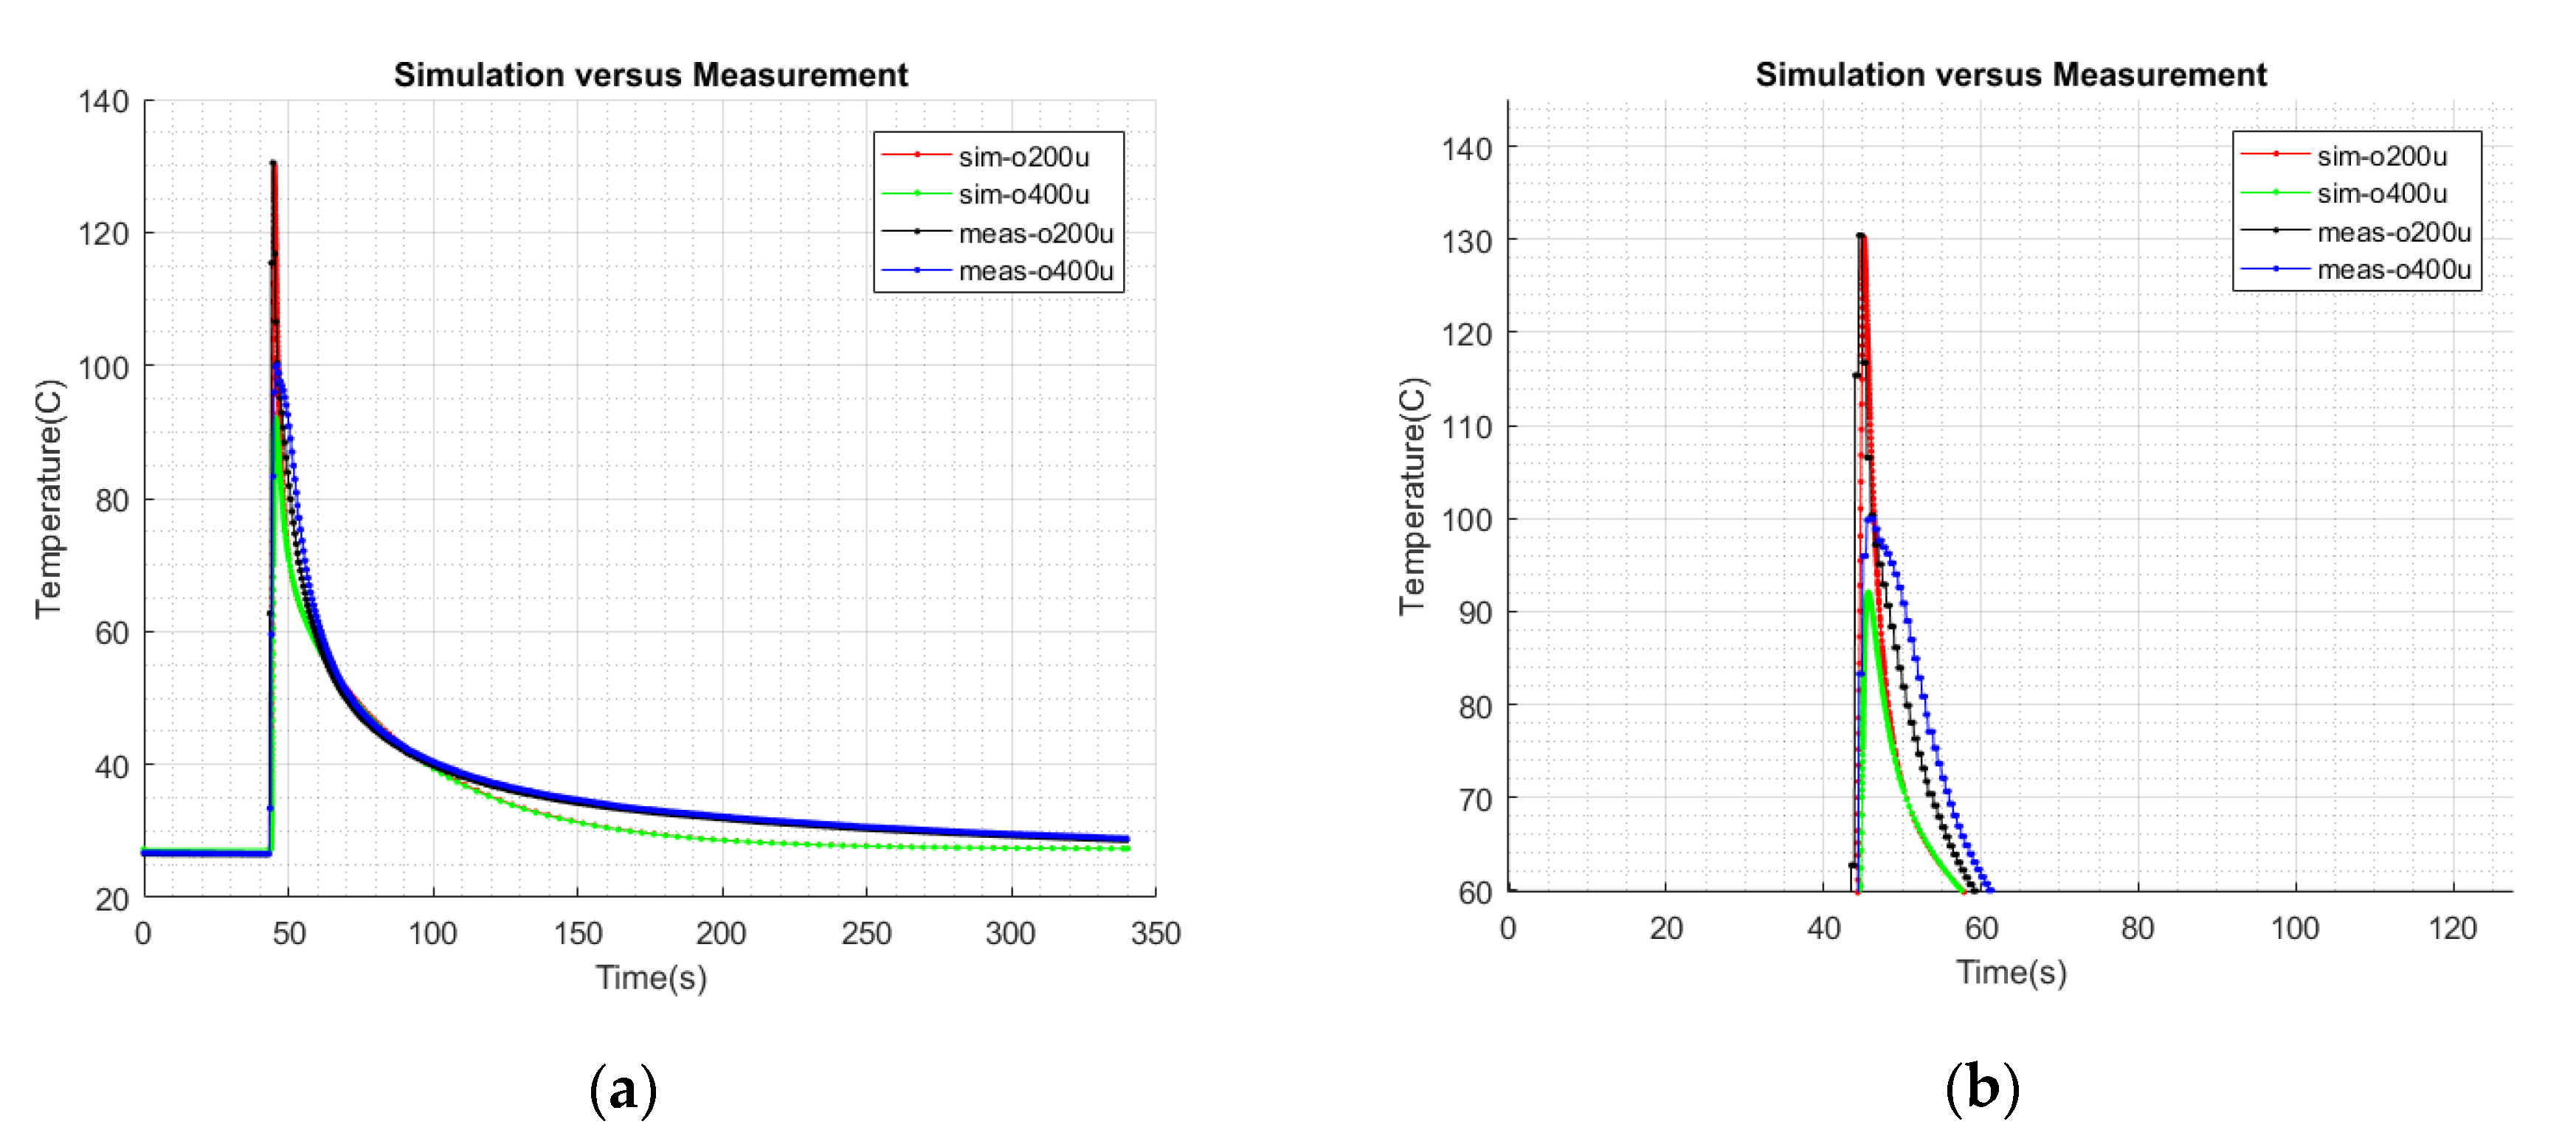
Figure 7b. The highest temperature peak of 130.5 °C (i.e., meas-o200u (red waveform)) represents the measured rise and fall of the temperature at the 200 µm outer layer (Lo200,
Figure 4) of the LDPE.
The second highest temperature peak of 100.0 °C (i.e., meas-o400u (blue waveform)) represents the measured rise and fall of the temperature at the 400 µm outer layer (Lo400,
Figure 4) of the LDPE.
2.4. Optimization of the Computed Model
For comparison of the simulation and measurement results, the calculated thermal model was first optimized for the first sample measurement in the validation experiment. This optimized thermal model was then further compared to the second and third sample measurements. For comparison with the first sample measurement, voltage V1 and V2 in the LTspice model (
Figure 5) were set to 11.0 volts and 29.5 volts, respectively, and simulated. These voltage settings were equal to the voltage used as the supply voltage and ambient temperature for the first sample measurement. The LTspice simulation results for the calculated model are shown in
Figure 8. In the simulation results, for V(to200), the green waveform denotes the node voltage (node voltage To200,
Figure 5) equal to the outer Lo200 (
Figure 4) layer temperature value; for V(to400), the blue waveform denotes the node voltage equal to the outer Lo400 layer temperature value; and V(ti2000) denotes the node voltage equal to the inner Li2000 layer temperature value. For comparison, the temperature measurement of the Joule heating coil (i.e., blue waveform in
Figure 6b) and the respective node voltage of Twire (
Figure 5) in the simulation (
Figure 8) were masked to only show the thermal measurements of the HDPE and LDPE layers. A comparison of the simulation (
Figure 8) and the first measurement in the validation experiment (
Figure 6b) is shown in
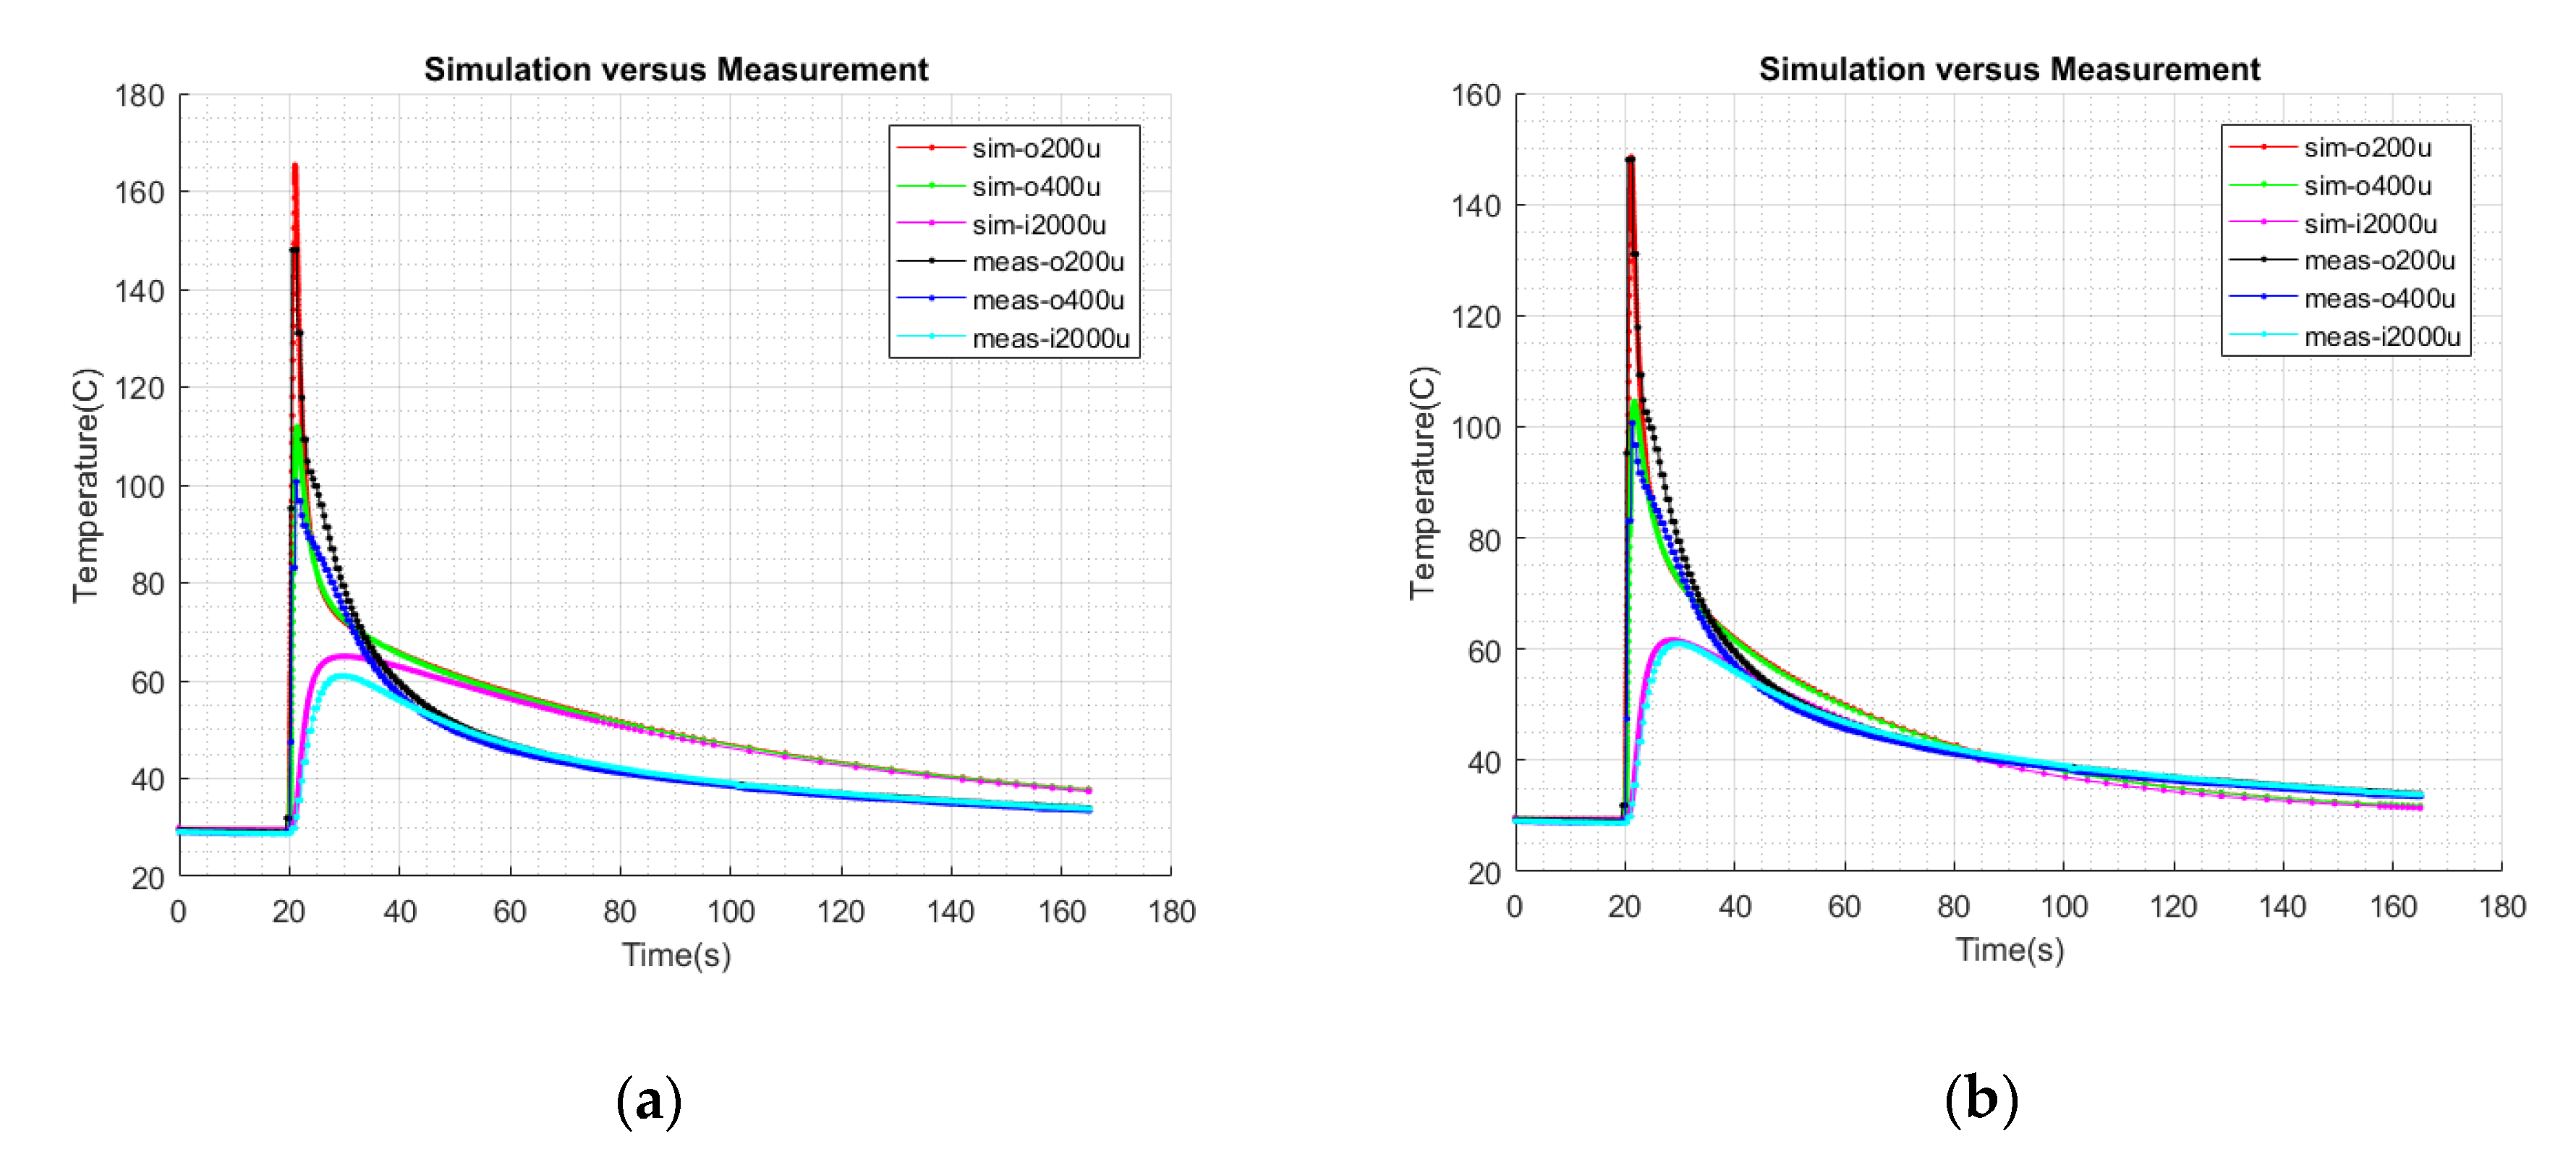
Figure 9a. From analyzing
Figure 9a, it can be seen that the peaks of the two waveforms, sim-o200u and sim-o400u, were approximately 15 °C and 10 °C higher than the actual measurements. The third waveform, sim-i2000u, had a difference of approximately 4 °C at the peak. In
Figure 9a, it can also be seen that the cooling curves in the simulation and validation had different time constants.
For a better optimized model, the output response of the calculated thermal model in
Figure 8 was divided into three regions: A, B, and C. The boundaries of these three regions were not very strict, but they were helpful for finding a solution to the two problems, i.e., peak temperature at each layer and their transient response. Region A was the response of the power input model inside the thermal model in
Figure 5. Region A started rising from a voltage of 29.5 volts to its peak of 165 volts, and then it fell in the first 15 s, i.e.,
Figure 8 responded from 20 s to 35 s. Region B started from 35 s and ended at approximately 80 s. It was the voltage response of the calculated R1–R15 and C1–C15 of the thermal model in
Figure 5. Region C is the voltage response from calculated Roconv and Riconv which started from 80 s to the end of simulation.
A change in one region affected the response in the other two regions. Region B, which had the calculated thermal model parameters of the HDPE and LDPE layers, was excluded in the optimization. It was necessary to keep these layer parameters unchanged in order to show the actual relationship between the temperature measurements on the layers and their respective thermal model responses. To obtain good agreement between the simulation and the measurement results, optimizations of the power input and convection resistance were made solely in region A and C on the calculated LTspice thermal model.
From the comparison shown in
Figure 9a, it is obvious that the cooling curve had a lower rate of change with respect to the first sample measurement. The R16 and R17 (
Figure 5) (i.e., response in region C in
Figure 8) needed to be optimized for room temperature. The values for R16 and R17 of 119.46 ohm and 120.2 ohm were the calculated values of the convection resistance. Since the convection area proved to be larger than initially calculated, for a good optimization result, the calculated values of 119.46 ohm and 120.2 ohm were iteratively reduced to 55 ohm each. A suitable capacitance of 0.05 farad (i.e., C16 in
Figure 5) was connected in parallel to C1 and simulated again for comparison.
The results of the comparison between the first sample measurement and the simulation of the optimized thermal model are shown in
Figure 9b. It can be seen that the peaks were optimized to nearly correct values. The transient response from 20 s to 35 s also improved as compared to the calculated model’s simulation results shown in
Figure 9a.
The second comparison was performed by changing the voltage level to 13.2 volts, i.e., equal to the measured voltage level of the second sample measurement in the validation experiment. By setting V2 to 27 volts and starting the simulation at 27 s with a transient response of 300 s, the simulation results were compared to the second sample measurement and are plotted in
Figure 10a.
Figure 10b shows the peak temperatures for the second comparison.
The third comparison was performed by changing the voltage level to 10.0 volts, i.e., equal to the measured voltage level of the third sample measurement in the validation experiment. By setting V2 to 27 volts and starting the simulation at 44 s with a transient response of 340 s, the simulation results were compared to the third sample measurement and are plotted in
Figure 11a.
Figure 11b shows the peak temperatures of the third comparison.
3. Results and Discussion
From the physical properties of the material, thermal parameters, such as thermal resistance and thermal capacitance, were calculated for each layer of the HDPE, LDPE, and Joule heating coil. Heat generation corresponding to power input and its propagation through different layers was modelled in LTspice and simulated. The melting point of the HDPE was between 120 °C and 180 °C and for the LDPE between 105 °C and 115 °C. For validation of the calculated model, three measurements were made with temperature values of 130.5 °C, 147.9 °C, and 182.8 °C at the outer LDPE layer Lo200 (
Figure 4) at a 200 µm distance from the Joule heating coil. It was ensured that Lo200 of the LDPE and Li200 of the HDPE were completely melted while keeping at least half of the inner layers (i.e., Li1000–Li2000) below their melting point within a one second time period of the heating phase.
In the LTspice thermal model, the thermal resistance and thermal capacitance of different layers were calculated using the generalized common properties of the material. For the HDPE layer calculation,
= 950 kg/m
3,
= 0.51 W/°C·m,
= 2000 J/kg·°C were used. For the LDPE layer,
= 900 kg/m
3,
= 0.36 W/°C·m,
= 2300 J/kg·°C were used. It was considered that these material properties of both the HDPE and the LDPE remained constant during the heating and cooling phases, but, in reality, these material properties changed with a change in temperature. A relative change in the material properties of polyethylene (PE) between 20 °C and 200 °C is reproduced in
Figure 12a [
3]. It can be observed that, with increasing temperature, the thermal conductivity and density of the PE decreases while the specific heat capacity increases until 125 °C (i.e., the melting point of PE), and above this temperature, it becomes nearly constant. This shows that the thermal resistance and thermal capacitance of PE increases with an increase in the temperature from room temperature to 125 °C and then becomes nearly constant afterwards, according to Equations (6) and (7), respectively.
It can be observed that the variation in the material properties of the HDPE and LDPE thermal properties would have resulted in higher than calculated values of R2–R15 and C2–C15 during the heating and cooling phases as compared to their room temperature values used for modelling. It can be deduced that the thermal capacitance variation would be larger as compared to the thermal resistance between 25 °C and 125 °C, mainly due to the larger variation in the specific heat capacity compared to the thermal conductivity of PE. This factor supports the need for optimization with a suitable capacitance. As the cooling phase was much longer than the heating phase, this effect was much more significant in the cooling phase. By utilizing suitable optimization techniques, it was possible to model the peak temperatures reached at each layer and their transient cooling curve response. Optimization was conducted for the power input and convection resistance, i.e., inserting C16 = 0.05 farad and changing R16–R17 = 55 ohm. Optimization provided a good compromise among the peak temperatures reached at each layer during the heating phase and transient response of each layer during the cooling phase. The convection resistance was difficult to model without actual measurement because of the large variation in the input variables. After optimization, the results were plotted in
Figure 9b,
Figure 10a, and
Figure 11a. A good agreement between the optimized simulation and the actual measurements was observed. From
Figure 9b,
Figure 10a, and
Figure 11a, it can be concluded that it is possible to completely melt the outer 200 µm to 400 µm layers to the desired temperatures without melting the inner structure of the optical fiber microduct within a one second time period.
Three different power inputs of 48.9 watts, 56.32 watts, and 73.39 watts were applied to produce the temperature effects of 130.5 °C, 147.9 °C, and 182.8 °C, respectively, at the outer LDPE layer of 200 µm, i.e., Lo200. As can be seen in
Table 2, a maximum difference of 1.85 watts in average power input was observed between the thermal model and its respective sample measurement within three validation experiments. Although all three measurement samples were considered exactly identical, there exist tolerances in the sample preparations for experiments. During the initial heating of the outer LDPE layers, before the actual Joule heating experiments, it was much more likely that the 50 µm thick K-type thermocouple’s distance among consecutive LDPE layers was changed in the range of ±25 µm. Therefore, the measurement readings may vary among two totally new identical samples where the new Joule heating wire and new LDPE layers on the new HDPE optical fiber microduct were wound.
The resolution of the PicoLog TC-08 data logger was not sufficient for data logging of more than four channels per sample in the validation experiment. Inside all three separate validation experiments, there were a maximum three data sample points per channel per second. In the case when the Joule heating time was very short (i.e., one second), the accuracy of the peak temperature reached at each layer was negatively affected and real peaks may have been missed in the measurements. In the LTspice thermal model, the transient cooling curve response was optimized for a 50 µm thick K-type thermocouple. If the temperatures are to be measured with some other thermocouple (e.g., 100 µm K-type), then the transient response would need to be optimized again for that particular thermocouple due to the different thermocouple time constant [
23].
For three validation experiments, the specified tolerance of the K-type thermocouples was ±2.2% between temperature ranges of 0 °C and 275 °C. The measured differences in the temperature between the two thermocouples was approximately 5 °C in the range of 28 °C to 183 °C during the experiments. This factor, in turn, also contributed to the decreased accuracy of the measured temperature to some extent. The measurements were performed only once on each totally new sample. The measurement and simulation results are valid for a new sample only.
In the comparisons of the simulations and actual measurements, the temperature of the Joule heating coil was ignored. In
Figure 6b, the blue waveform (i.e., meas-Twire) showed the temperature’s rise and fall on the Joule heating coil during the first sample measurement. If this temperature is compared with the node voltage Twire in the LTspice thermal model in
Figure 5, with same settings that were used for the results in
Figure 9b, the results will look like as shown in
Figure 12b. Although there is a difference of approximately 50 °C at the peaks, the wire temperature comparison was still useful for considering the fusing effect of the Joule heating coil during the heating phase.
