Article

Simple and Low-Cost Photovoltaic Module Emulator

by
Massimo Merenda
1,2,*,
Demetrio Iero
1,2,
Riccardo Carotenuto
1 and
Francesco G. Della Corte
1,2
1
Department of Information Engineering, Infrastructure and Sustainable Energy (DIIES), University Mediterranea of Reggio Calabria, 89124 Reggio Calabria, Italy
2
HWA srl-Spin Off dell’Università Mediterranea di Reggio Calabria, Via Reggio Campi II tr. 135, 89126 Reggio Calabria, Italy
*
Author to whom correspondence should be addressed.
Electronics 2019, 8(12), 1445; https://doi.org/10.3390/electronics8121445
Submission received: 30 October 2019 / Revised: 21 November 2019 / Accepted: 26 November 2019 / Published: 1 December 2019
(This article belongs to the Special Issue Grid-Connected Renewable Energy Sources)

Abstract

:
The design and testing phase of photovoltaic (PV) power systems requires time-consuming and expensive field-testing activities for the proper operational evaluation of maximum power point trackers (MPPT), battery chargers, DC/AC inverters. Instead, the use of a PV source emulator that accurately reproduces the electrical characteristic of a PV panel or array is highly desirable for in-lab testing and rapid prototyping. In this paper, we present the development of a low-cost microcontroller-based PV source emulator, which allows testing the static and dynamic performance of PV systems considering different PV module types and variable operating and environmental conditions. The novelty of the simple design adopted resides in using a low-cost current generator and a single MOSFET converter to reproduce, from a fixed current source, the exact amount of current predicted by the PV model for the actual load conditions. The I–V characteristic is calculated in real-time using a single diode exponential model under variable and user-selectable operating conditions. The proposed method has the advantage of reducing noise from high-frequency switching, reducing or eliminating ripple and the demand for output filters, and it does not require expensive DC Power source, providing high accuracy results. The fast response of the system allows the testing of very fast MPPTs algorithms, thus overcoming the main limitations of state-of-art PV source emulators that are unable to respond to the quick variation of the load. Experimental results carried on a hardware prototype of the proposed PV source emulator are reported to validate the concept. As a whole result, an average error of ±1% in the reproduction of PV module I–V characteristics have been obtained and reported.

1. Introduction

The design of electronic power converters for photovoltaic (PV) applications requires a stable and repeatable PV source for experimental testing under realistic operating conditions, which can accurately reproduce the relationship between the output voltage and current of a given PV module.
Furthermore, the possibility to test variable conditions of the PV source is crucial as it is part of the validation of the final product, assessing the behavior in the broadest range of operative condition modifications as temperature, irradiation, and shadowing.
PV real installation does not satisfy at all the requirements hereafter: the I–V characteristics are linked to slowly varying operational parameters like temperature and irradiation, they require in-field test systems and apparatus, test conditions are defined by the actual meteorological conditions that should be jointly acquired [1] and which can rapidly change during the test [2].
Therefore, a PV source emulator is required to complete the on-lab assessments under variable operating conditions in a reasonable amount of time.
Typically, a PV source emulator reproduces the I–V curve of an actual PV module starting from a constant DC source, using both different conversion strategies and power sizes.
Commercial PV source emulators are available in the market, enabling the user to select different PV module or PV array emulations with variable power range [3,4,5]. However, commercial PV source emulators present several drawbacks, as high cost and a limitation in the rapidly changing atmospheric conditions emulation [6].
Many researchers tried to overcome the limitation of commercial products or to develop low-cost and affordable PV source emulators. Many possible approaches to performing the task of PV source emulator design were found in the literature.
The simplest model of photovoltaic generator emulator can be obtained by connecting in series a DC voltage generator and a variable resistor [7]. The open-circuit voltage VOC is set by the maximum output voltage of the DC generator, while the short-circuit current ISC depends both on the output voltage of the DC generator and on the value of the resistance of the variable resistor. For a given value of the series resistance RS, if the load resistance is varied from its minimum value to its maximum value, a linear I–V characteristic with a negative slope will be obtained. The main advantage of this technique is the simplicity of implementation, however, the characteristic I–V obtained differs significantly from that of a real photovoltaic source. Moreover, this type of PV source emulator is characterized by a low efficiency (maximum 50%) due to dissipative losses on the series resistance.
A further method is based on the use of an analog amplification technique that allows to independently amplify the low current and voltage values typical of a photodiode operating in the photovoltaic mode so as to make them coincide with those of a standard photovoltaic module [8,9]. Since this type of emulator is made entirely with analog components, it has a high bandwidth, which allows using this circuit to test photovoltaic inverters with maximum power point tracker (MPPT) algorithms operating at high frequency [10,11,12]. On the other hand, the main disadvantage of this circuit is the high power dissipation that involves the use of heat sinks with a large surface area.
In [11] the logarithmic approximation of the ideal single diode model is used, and the power stage consists of a DC power supply feeding a linear voltage regulator.
To overcome the disadvantage of the high power consumption of PV source simulators based on analog electronics, several solutions based on the use of DC/DC static converters (choppers) have been proposed, such as [13,14,15,16,17,18,19,20]. To determine the output voltage and current values of the DC/DC converter, this is controlled by a feedback control where the output current of the chopper is compared with a reference current. The reference current can be determined in real-time by means of a mathematical model of the photovoltaic module (PV-model) [19] or extrapolated from data stored in a look-up-table (LUT). The first approach requires knowledge of the parameters, which is difficult to achieve in some situations. The most commonly used approach is to derive an analytical model to represent the I–V curves from the data available from the datasheet of the photovoltaic panel manufacturer [21]. The choice of whether to use a mathematical model of the photovoltaic module or a LUT must be made considering several factors such as the speed of response of the system, accuracy, and use of hardware resources in terms of both computational and memory. The complexity of the problem increases if there is the necessity to emulate modules with different I–V characteristics since each of them will require its own look-up-table. Another disadvantage of emulators using look-up-tables is that the I–V characteristic of the module, between two successive points stored in the look-up-table, is obtained by linear interpolation, which makes the system less accurate than the mathematical model-based approach. In contrast, emulators based on the resolution of a mathematical model of the PV module are more accurate and do not require a large amount of memory [22]. However, in order to obtain a detailed representation of the I–V characteristic, the mathematical model will contain high order equations, leading to an increase in computational time and thus to a slower system.
In [23] is proposed a solution with a field programmable analog array, characterized by great ease of reconfiguration and programming with respect to field programmable gate array (FPGA) or digital signal processing (DSP) based implementations. No digital to analog converters (DAC) or analog to digital converters (ADC) is needed while the final cost remains quite high due to the need for at least a DC/DC converter.
In [24] is proposed a solution that adopts modular hardware, configurable software, systematic modeling, and design methods, requiring a PC running Matlab/Simulink to determine the controller parameters.
Another method builds an equivalent photovoltaic source using an unlighted photovoltaic panel and a DC current power supply [10]. However, this approach requires the use of an actual PV panel that must be changed if it is necessary to emulate a different panel; also, the temperature effect is not easily simulated.
In [25] a dual-mode regulator consisting of a voltage regulator and a current regulator, connected by two diodes for power hybridization, is proposed. The system switches between voltage and current regulation, thus requiring complex and costly electronics.
In this paper, in order to overcome high realization costs, reduced accuracy and versatility, we present a low-cost, microcontroller-based PV source emulator, which allows for testing the performance of PV systems including different PV module types at user-selectable operating conditions. The I–V characteristic is calculated in real-time using a simple diode model, and it does not use any DC-DC converter, reducing the noise from high-frequency switching, and reducing or eliminating ripple and the demand of output filters. Moreover, it does not require the use of expensive DC power sources and can be used for laboratory tests and rapid prototyping by researchers and students. In addition, the proposed solution provides accurate emulations over the full span of emulated power source, differently from other state-of-art solutions that provide good results only closer to the maximum power point (MPP). The model implemented takes into account fast-changing environmental conditions that can be accurately tracked and/or emulated with the use of actual temperature, humidity and illumination sensors or by software techniques.
The paper is organized as follows. Section 2 introduces the photovoltaic cell model. Section 3 explains the working principle of the proposed PV source emulator and the experimental setup. Section 4 reports the experimental results and compares them with simulations, at different conditions. Section 5 draws the paper conclusions.

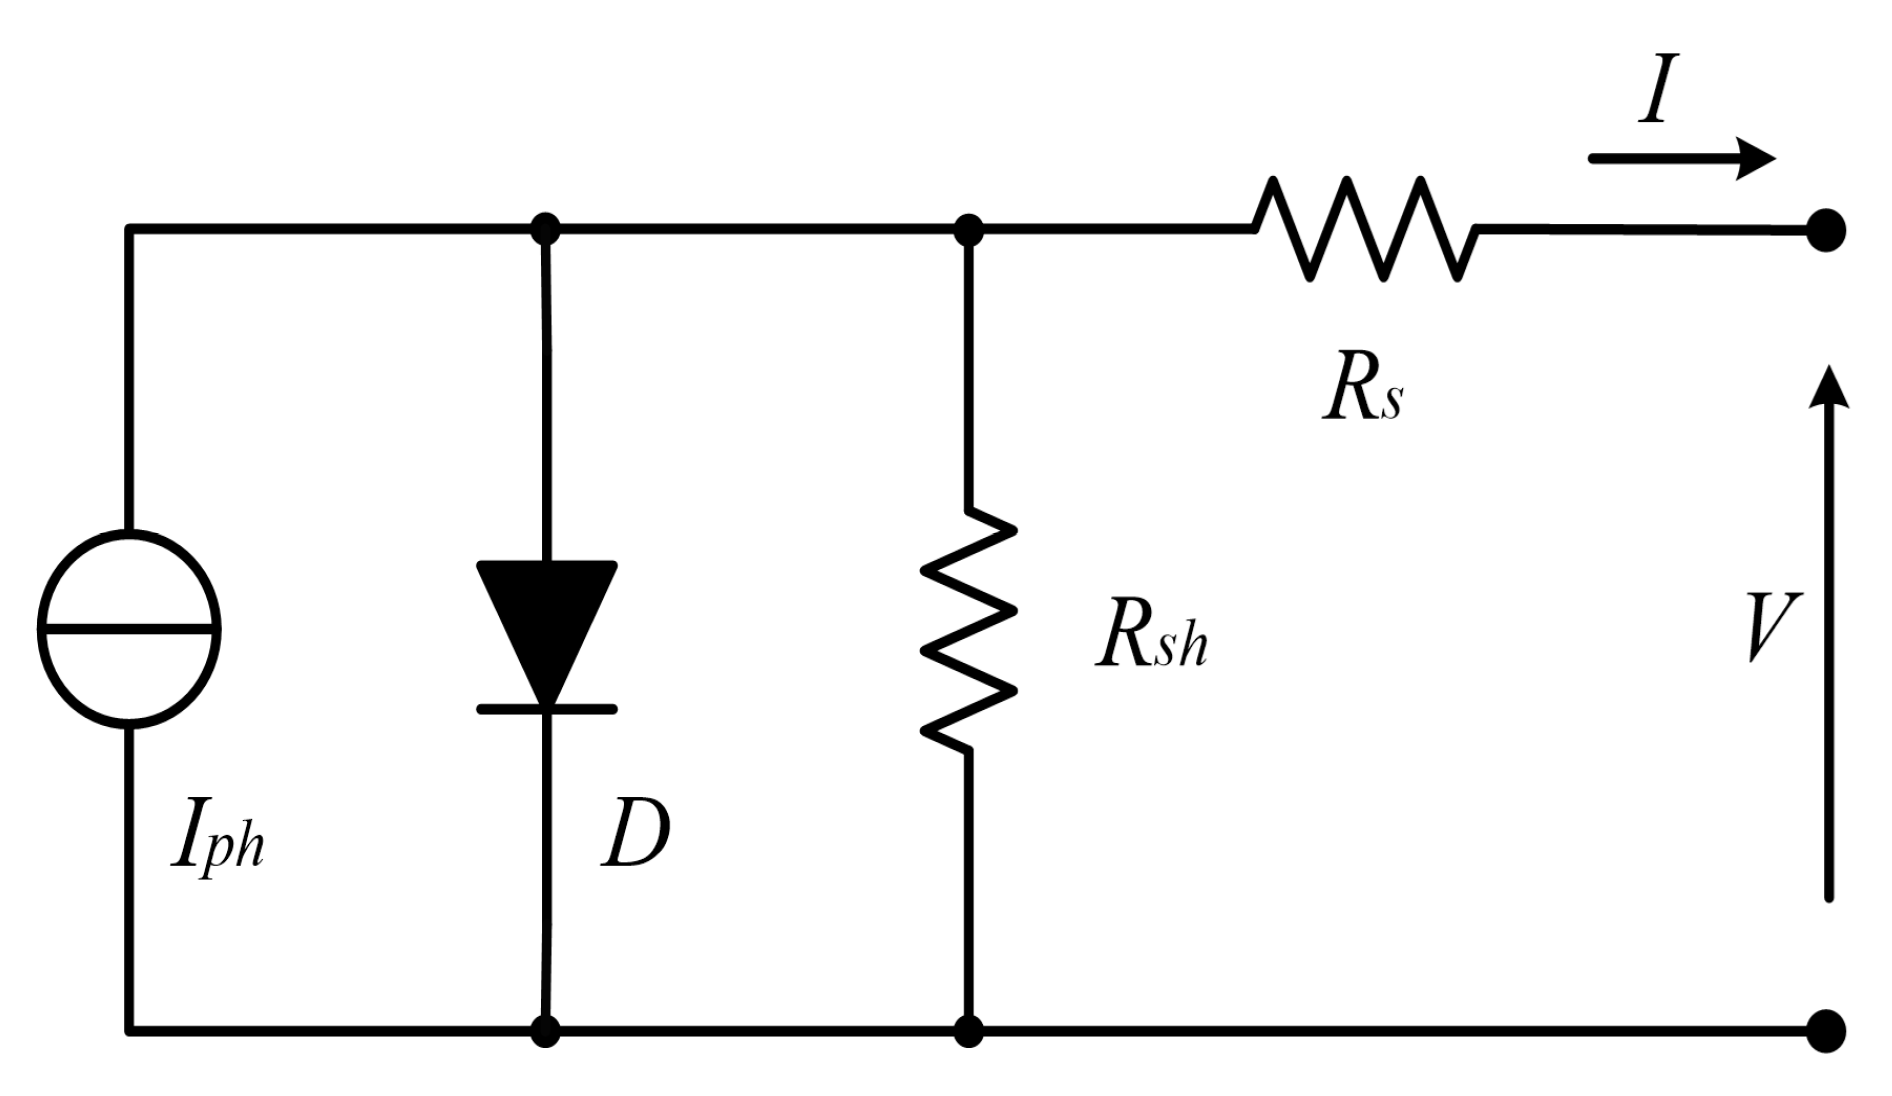
2. PV Cell Model and Characteristics

Each photovoltaic cell is characterized by some basic parameters provided by the manufacturers, referring to the standard test conditions (STC) which specifies an irradiance of 1000 W/m2, a cell temperature of 25 °C and an air mass 1.5 (AM1.5) spectrum:
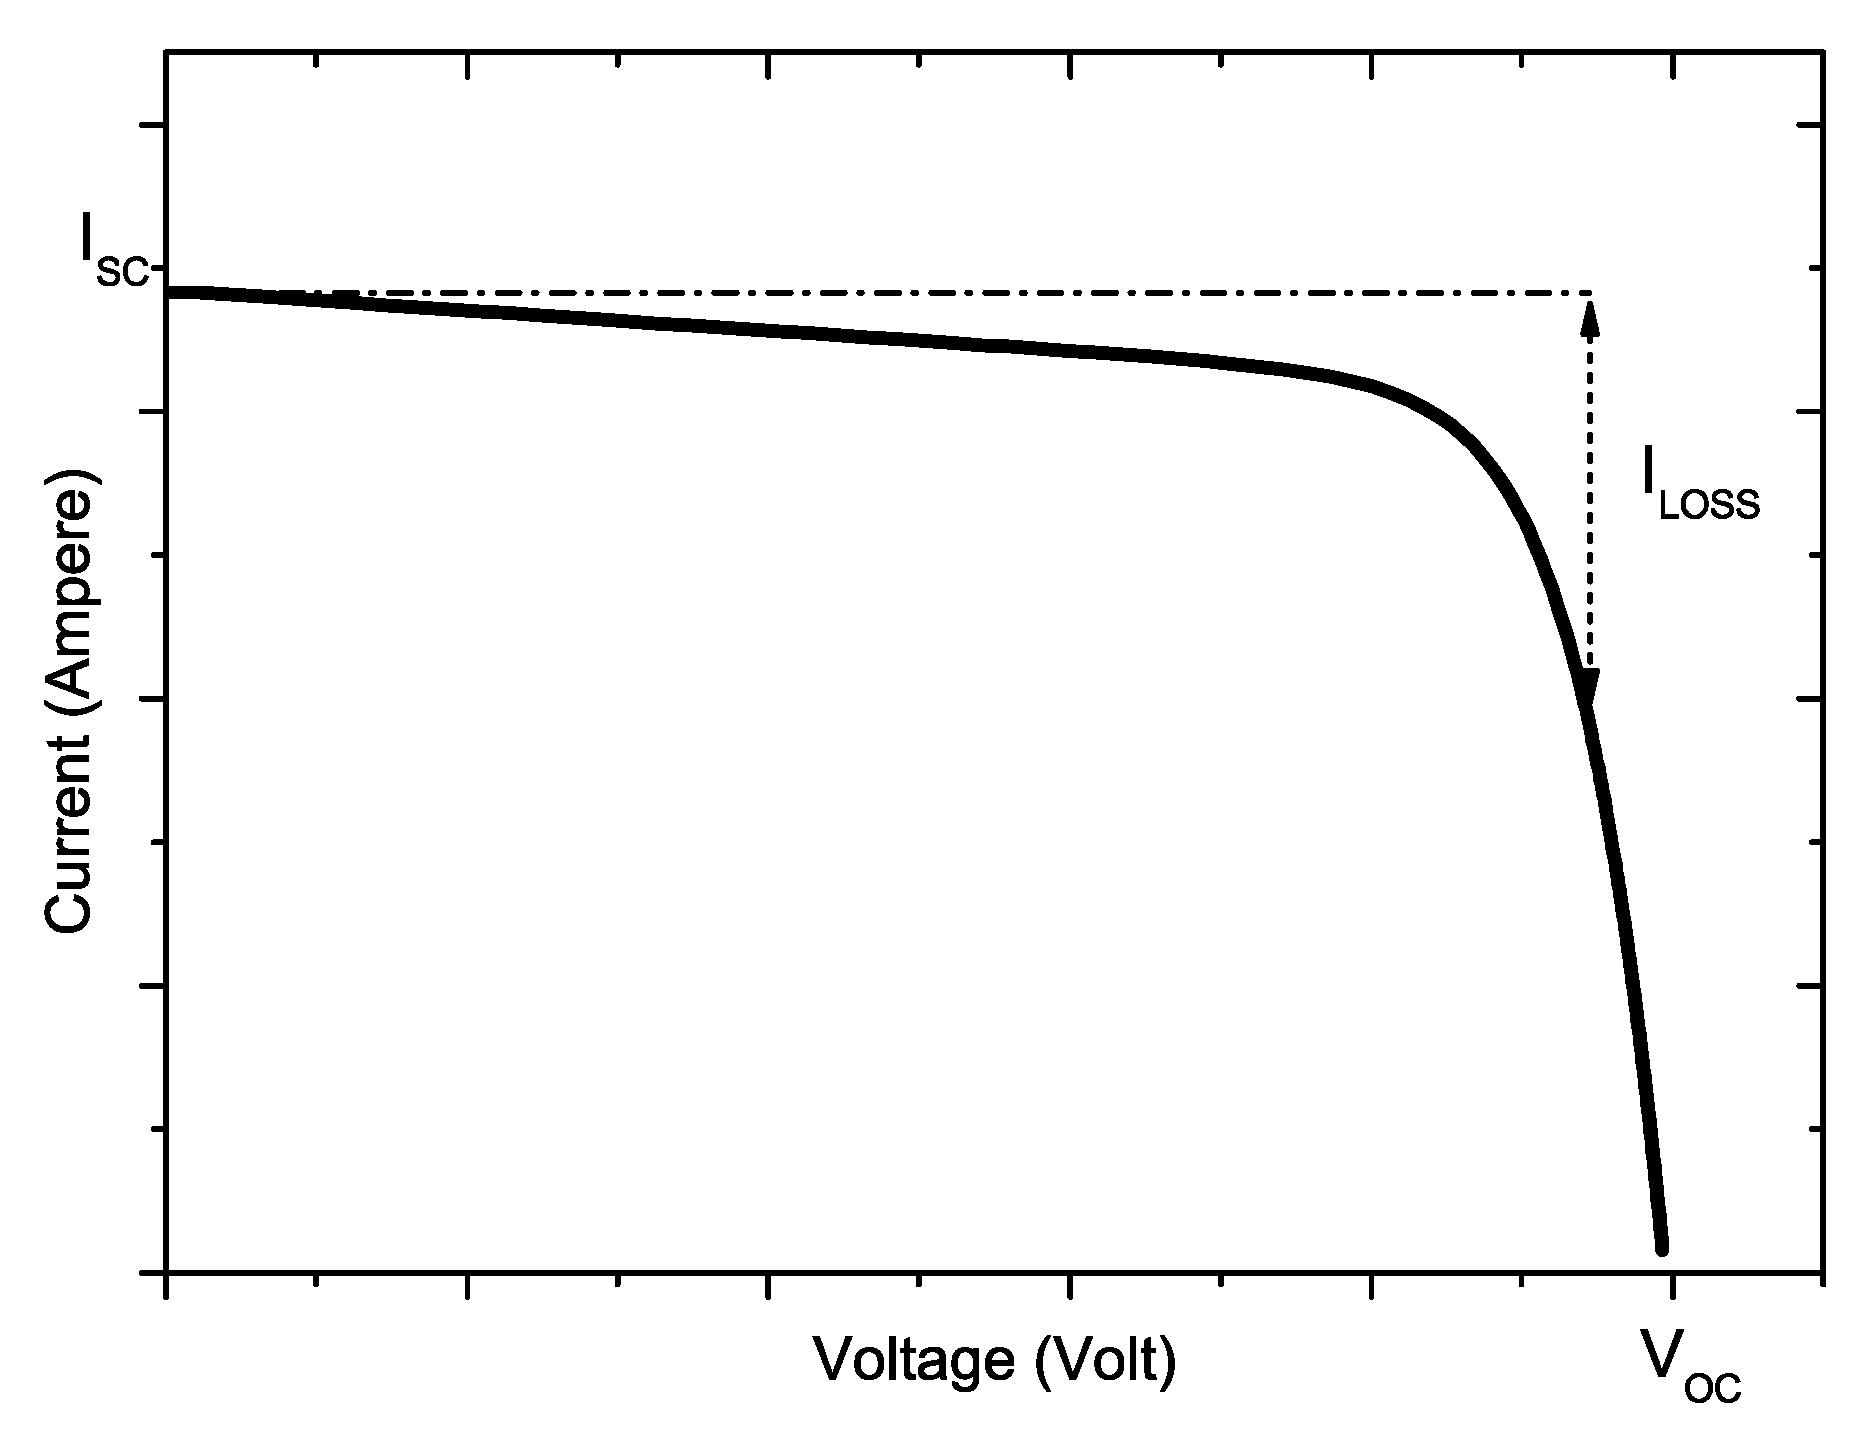
  • Short-circuit current ISC: the maximum current that can be supplied by a photovoltaic cell under short-circuit conditions (V = 0);
  • Open circuit voltage VOC: the maximum voltage drop at the cell terminals when the supplied current is null;
  • Maximum power point MPP: the point of the I–V characteristic (Vmax, Imax) where the power supplied to the load is maximum;
  • Fill Factor FF = (Vmax × Imax)/(VOC × ISC): a parameter that measures the quality of the cell;
  • Conversion efficiency η, defined as the ratio between the maximum power produced by the cell and the total power incident on its surface at STC.
The Short-circuit current depends linearly on the value of the irradiance, whereas the influence of the temperature can be expressed by the coefficient kI (Temperature coefficient of short-circuit current) that indicates the percentage variation of the short circuit current as the temperature changes from the value determined under STC. Contrary to the short-circuit current, the open-circuit voltage remains relatively constant when the radiation changes but is strictly dependent on the cell temperature. The coefficient kV (Temperature coefficient of open-circuit voltage) expresses the variation of the open-circuit voltage as the temperature changes with respect to the reference value calculated under STC. The photovoltaic cell absorbs most of the incident solar radiation but there is a significant portion of the absorbed radiation that is not converted into electricity but generates heat, which causes an increase of the temperature of the cells that affects ISC and VOC, and consequently the conversion efficiency.
In the dark, the I–V characteristic of a photovoltaic cell shows an exponential shape like the I–V characteristic of a diode. As a result, a photovoltaic cell exposed to solar radiation can be assimilated from a circuital point of view to a current generator with a diode in parallel (Figure 1). Various models are available in literature [26,27,28,29,30] and the single diode model is one of the simplest models.
The current generator delivers an IPH current directly proportional to the solar radiation incident on the photovoltaic cell. Two resistors have been added to take into account the internal losses of the photovoltaic cell:
  • RS is the series resistance that models the internal losses of the cell due to the sum of the resistive contributions inside the cell and the contact resistance;
  • RSH is the shunt resistance that models the effects of leakage currents in the p-n junction mainly due to manufacturing defects in the photovoltaic cell.
This model can be extended to model the operation of a photovoltaic module by specifying the number of cells connected in series Ns and in parallel Np.
Various mathematical models are available describing the electrical behavior of a photovoltaic cell, which differs according to the precision of the mathematical model to be obtained and the number of parameters available. Simplified models have been developed taking into account only the parameters that can be measured practically [31]; in this work, the mathematical model follows equations in [32,33,34]. The thermal voltage Vt is defined as
V t   =   k T o p q ,
where q is the charge of an electron, k is the Boltzmann constant, Top is the temperature in K.
VOC depends on the saturation current density of the solar cell IS and the photo-generated current Iph:
V o c   =   l n I p h I s V t ,
The Shockley equation that relates the current and voltage of the cell in zero-illumination condition is adjusted for a photovoltaic module [32] by specifying the number of cells connected in series Ns and in parallel Np:
I d     =   I s ( e V + R S I n V t N S 1 ) N p ,
where n is the ideality factor which is defined as how closely a diode follows the ideal diode equations. The reverse saturation current can be obtained by:
I s   =   I r s ( T o p T r e f ) 3 e q E g n k ( 1 T o p 1 T r e f ) ,
with Eg that is the extrapolated energy bandgap at 0 K. Irs is the value of the saturation current at Top:
I r s   =   I S C e V o c q n k T o p 1 .
The current flowing through the shunt resistance RSH is defined as:
I s h   =   V + R S I R s h ,
and the photo-generated current is defined as:
I p h   =   G k [ I s c + k I ( T o p T r e f ) ] ,
with Gk being the solar irradiance and Isc the short circuit current, kI = (ISC(Top)ISC(Tref))/(TopTref). Finally, the characteristic equation of a photovoltaic panel using the equivalent circuit of Figure 1 is deduced:
I   =   I p h N p I d I s h .

3. Description of the PV Source Emulator

3.1. System Overview

Starting from a circuit model of a photovoltaic module and from the knowledge of the parameters of that model, it is possible to create a MATLAB Simulink model useful to test the behavior of a generic photovoltaic module and to trace its I–V and P–V characteristics when the load conditions or the environmental parameters to which the module is subjected, such as temperature and radiation, vary. The Simulink model of the photovoltaic module used in this work is based on the single diode circuit model of the Solarex MSX-60 photovoltaic module model available on [35].
It is worth noting that the novelty proposed in this work resides in the accurate emulation and curve-fitting of the characteristic of a real PV module by the proposed PV source emulator, and not in the model itself.
The model parameters have been adapted to simulate the output characteristic of a 12 W photovoltaic module with the parameters reported in Table 1. The block diagram of the proposed photovoltaic source emulator is shown in Figure 2.

3.2. Emulation Technique

The I–V characteristic of a photovoltaic module is a monotonous decreasing function, in fact, the current supplied by the photovoltaic module is maximum I = ISC when it is in a short circuit condition, and decreases as the voltage across the module increases. Referring to the I–V characteristic in Figure 3, it can be seen that, for each voltage value, the current supplied by the photovoltaic module can be determined as the difference between the short circuit current ISC and a loss current ILOSS:
V ( 0 , V o c ) I ( V )   =   I s c I l o s s ( V ) .
The technique proposed in this paper is based on the use of:
  • A current generator capable of delivering a constant current equal to ISC in the voltage range from 0 to VOC;
  • A control system capable of determining, for each voltage, the value of the current ILOSS required to subtract to the load;
  • A power MOSFET that drain ILOSS from the branch in which the ISC flows.
Based on the data returned by the mathematical model of the photovoltaic module, the control system determines the value of the current ILOSS and generates a control signal that is applied to the gate of the MOSFET in order to modulate the drain current so that it results in IDRAIN = ILOSS. The current circulating in the MOSFET is sensed by the control system that aims to minimize the error between the target ILOSS and the one that actually flows on the MOSFET. A proportional-integral-derivative (PID) controller allows generating the suitable control signal to achieve the required current regulation.

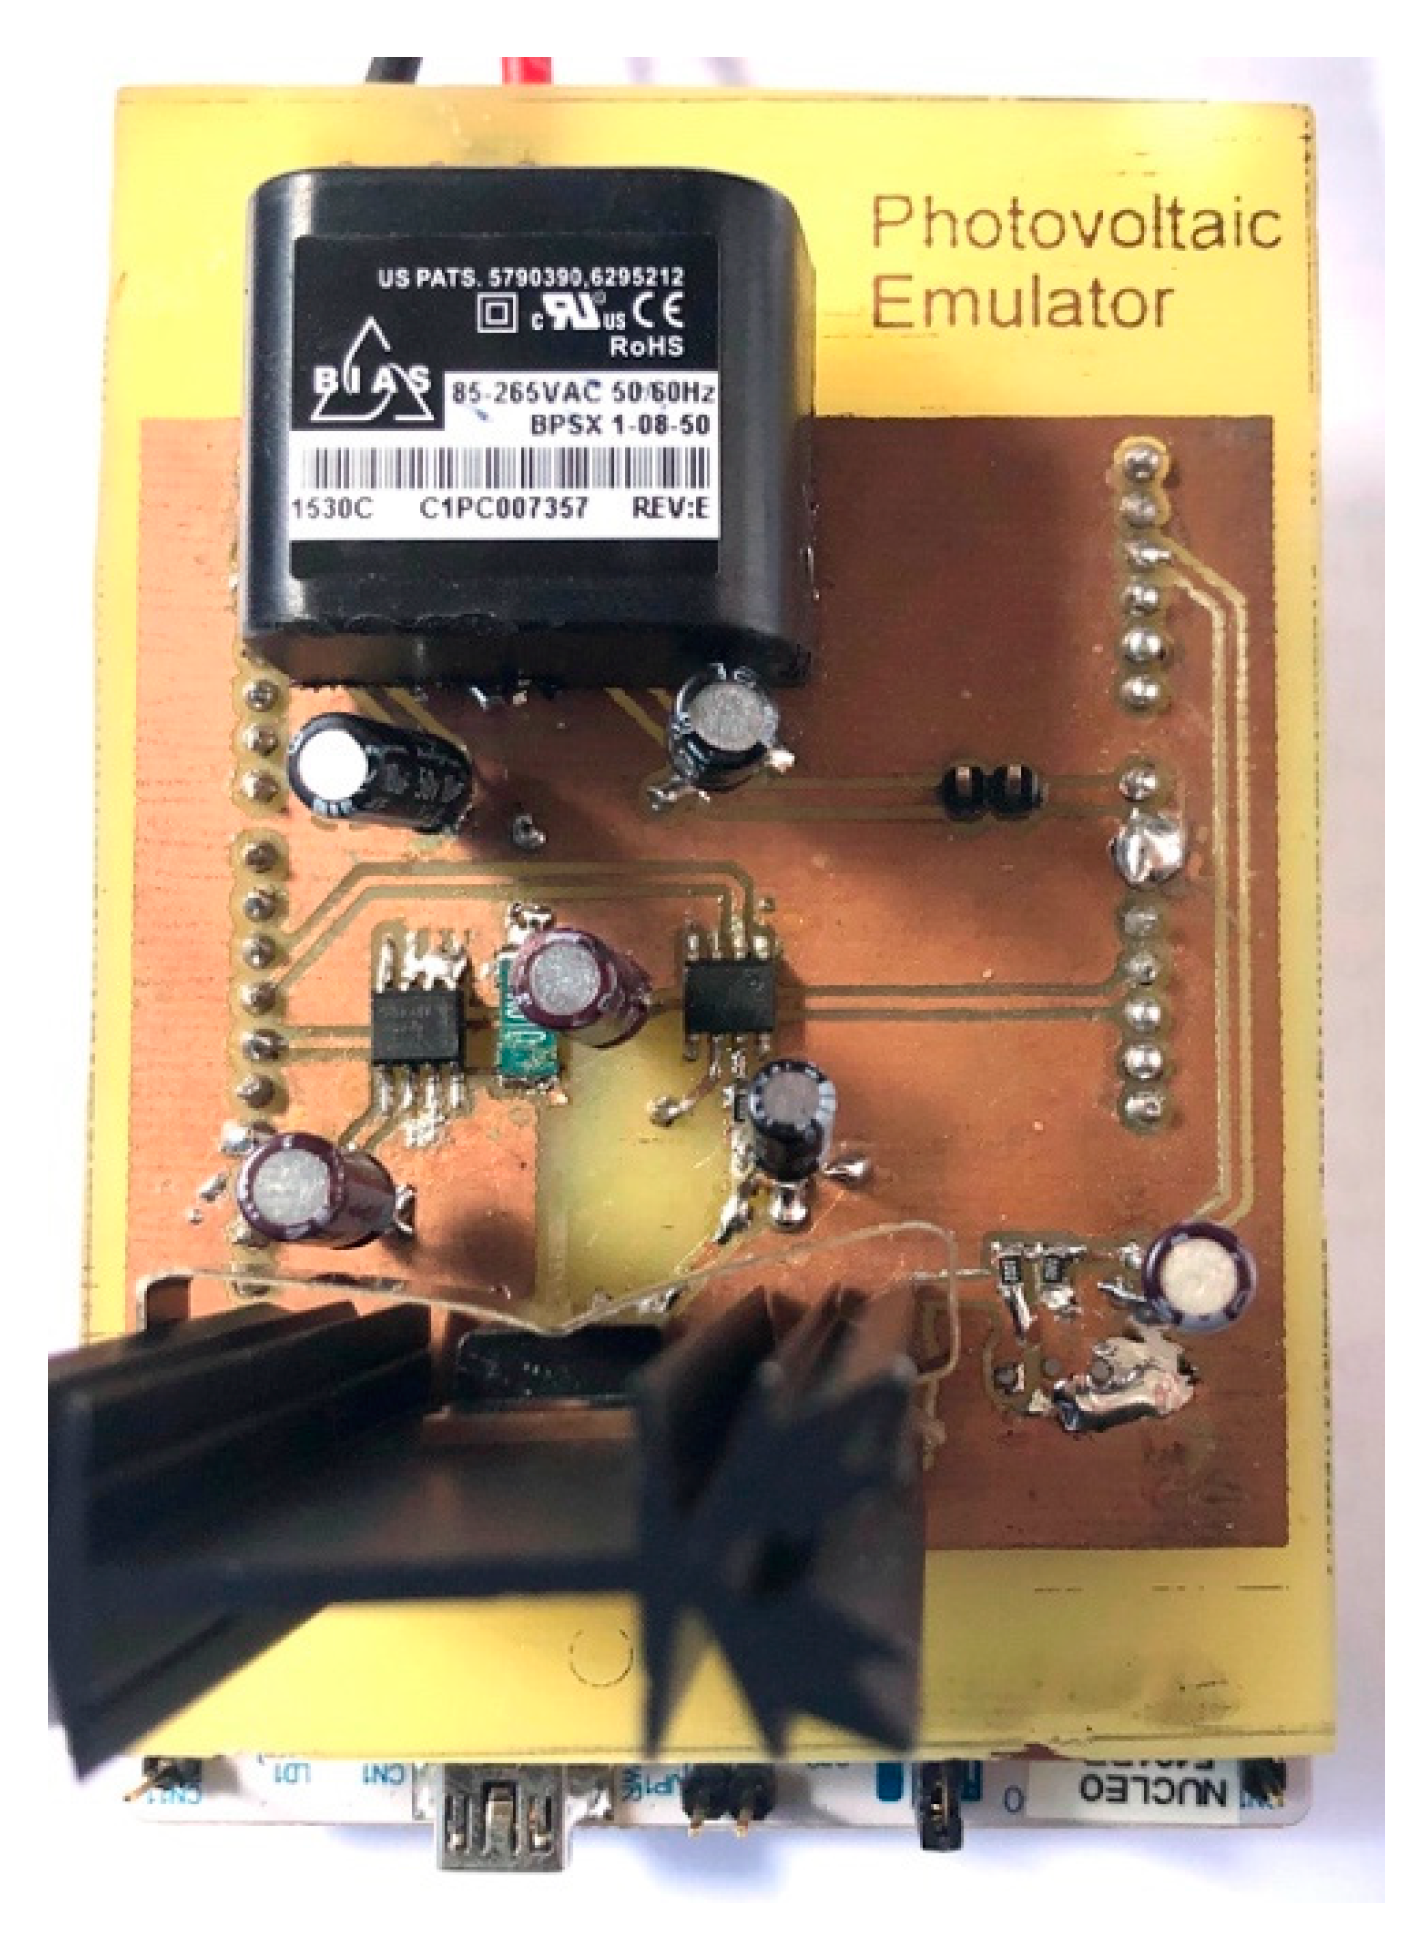
3.3. Experimental Setup

The control logic and the mathematical model of the photovoltaic module have been implemented on an STM32F401RE microcontroller (STMicroelectronics), mounted on the STM32 Nucleo board. A specifically made shield board attached on the Nucleo board implements the necessary hardware that allows to control the MOSFET and sense current and voltage (Figure 4).
The microcontroller implements the PID controller that allows modulating the control signal to achieve the required current regulation. It generates a 3.3 V PWM control signal and a TC4424A (Microchip, Chandler, AZ, USA) driver produces a PWM signal between 0 V and 8 V, which is filtered by a low-pass RC filter to extract the average value and used to control an IRF820 MOSFET (International Rectifier Semiconductors) in linear mode. The average value of the PWM signal depends on the duty cycle D = Ton/T of the signal, defined as the ratio between the pulse active time Ton and the period T of the signal. The average value of the gate signal can, therefore, be adjusted by acting on the duty cycle according to the relationship:
V o u t   =   V H D ,
where VH is the maximum voltage of the PWM signal.
The PWM frequency of the control signal is 50 kHz and the RC filter is set with a resistance R = 150 kΩ and a capacitance C = 10 μF for a cut-off frequency of 0.106 Hz to minimize the control signal high-frequency components.
The microcontroller firmware configures and initializes the microcontroller peripherals needed to interact with the PV source emulator hardware, and implements the photovoltaic emulator code. The internal 12-bit ADC is used to measure the voltage on the load through a voltage divider, and the current through a shunt resistor of 10 mΩ and a current sense amplifier INA283 (Texas Instruments, Dallas, TX, USA) with a gain of 200 V/V; this configuration allows to measure up to 1.65 A of current with very low power dissipation.
After the initialization, the firmware cyclically: (1) reads the voltage on the load and current ILOSS passing through the MOSFET, (2) calculates the target ILOAD,ref by using the PV model equations and Equation (9), and (3) determines, by mean of a digital PID controller, the variation of duty cycle of the PWM control signal required to produce the desired ILOSS,ref current.
The constant current generator is chosen such that the voltage and current ratings are higher than the ISC and VOC of the panel to be emulated reported in Table 1. A Jolight KL824-04 power supply that delivers 700 mA with a voltage range up to 30 V and its output has been connected to a variable resistive load of a maximum of 110 Ω. The system is supplied by an AC-DC miniature switching power supply (Bias Power BPSX 1-08-50) that converts 230 V AC main voltage to 8 V and 5 V DC voltage to supply the boards.
The digital multimeter Agilent U1272A and the LeCroy WaveSurfer 343 oscilloscope were used to monitor and acquire the signals.

4. Results

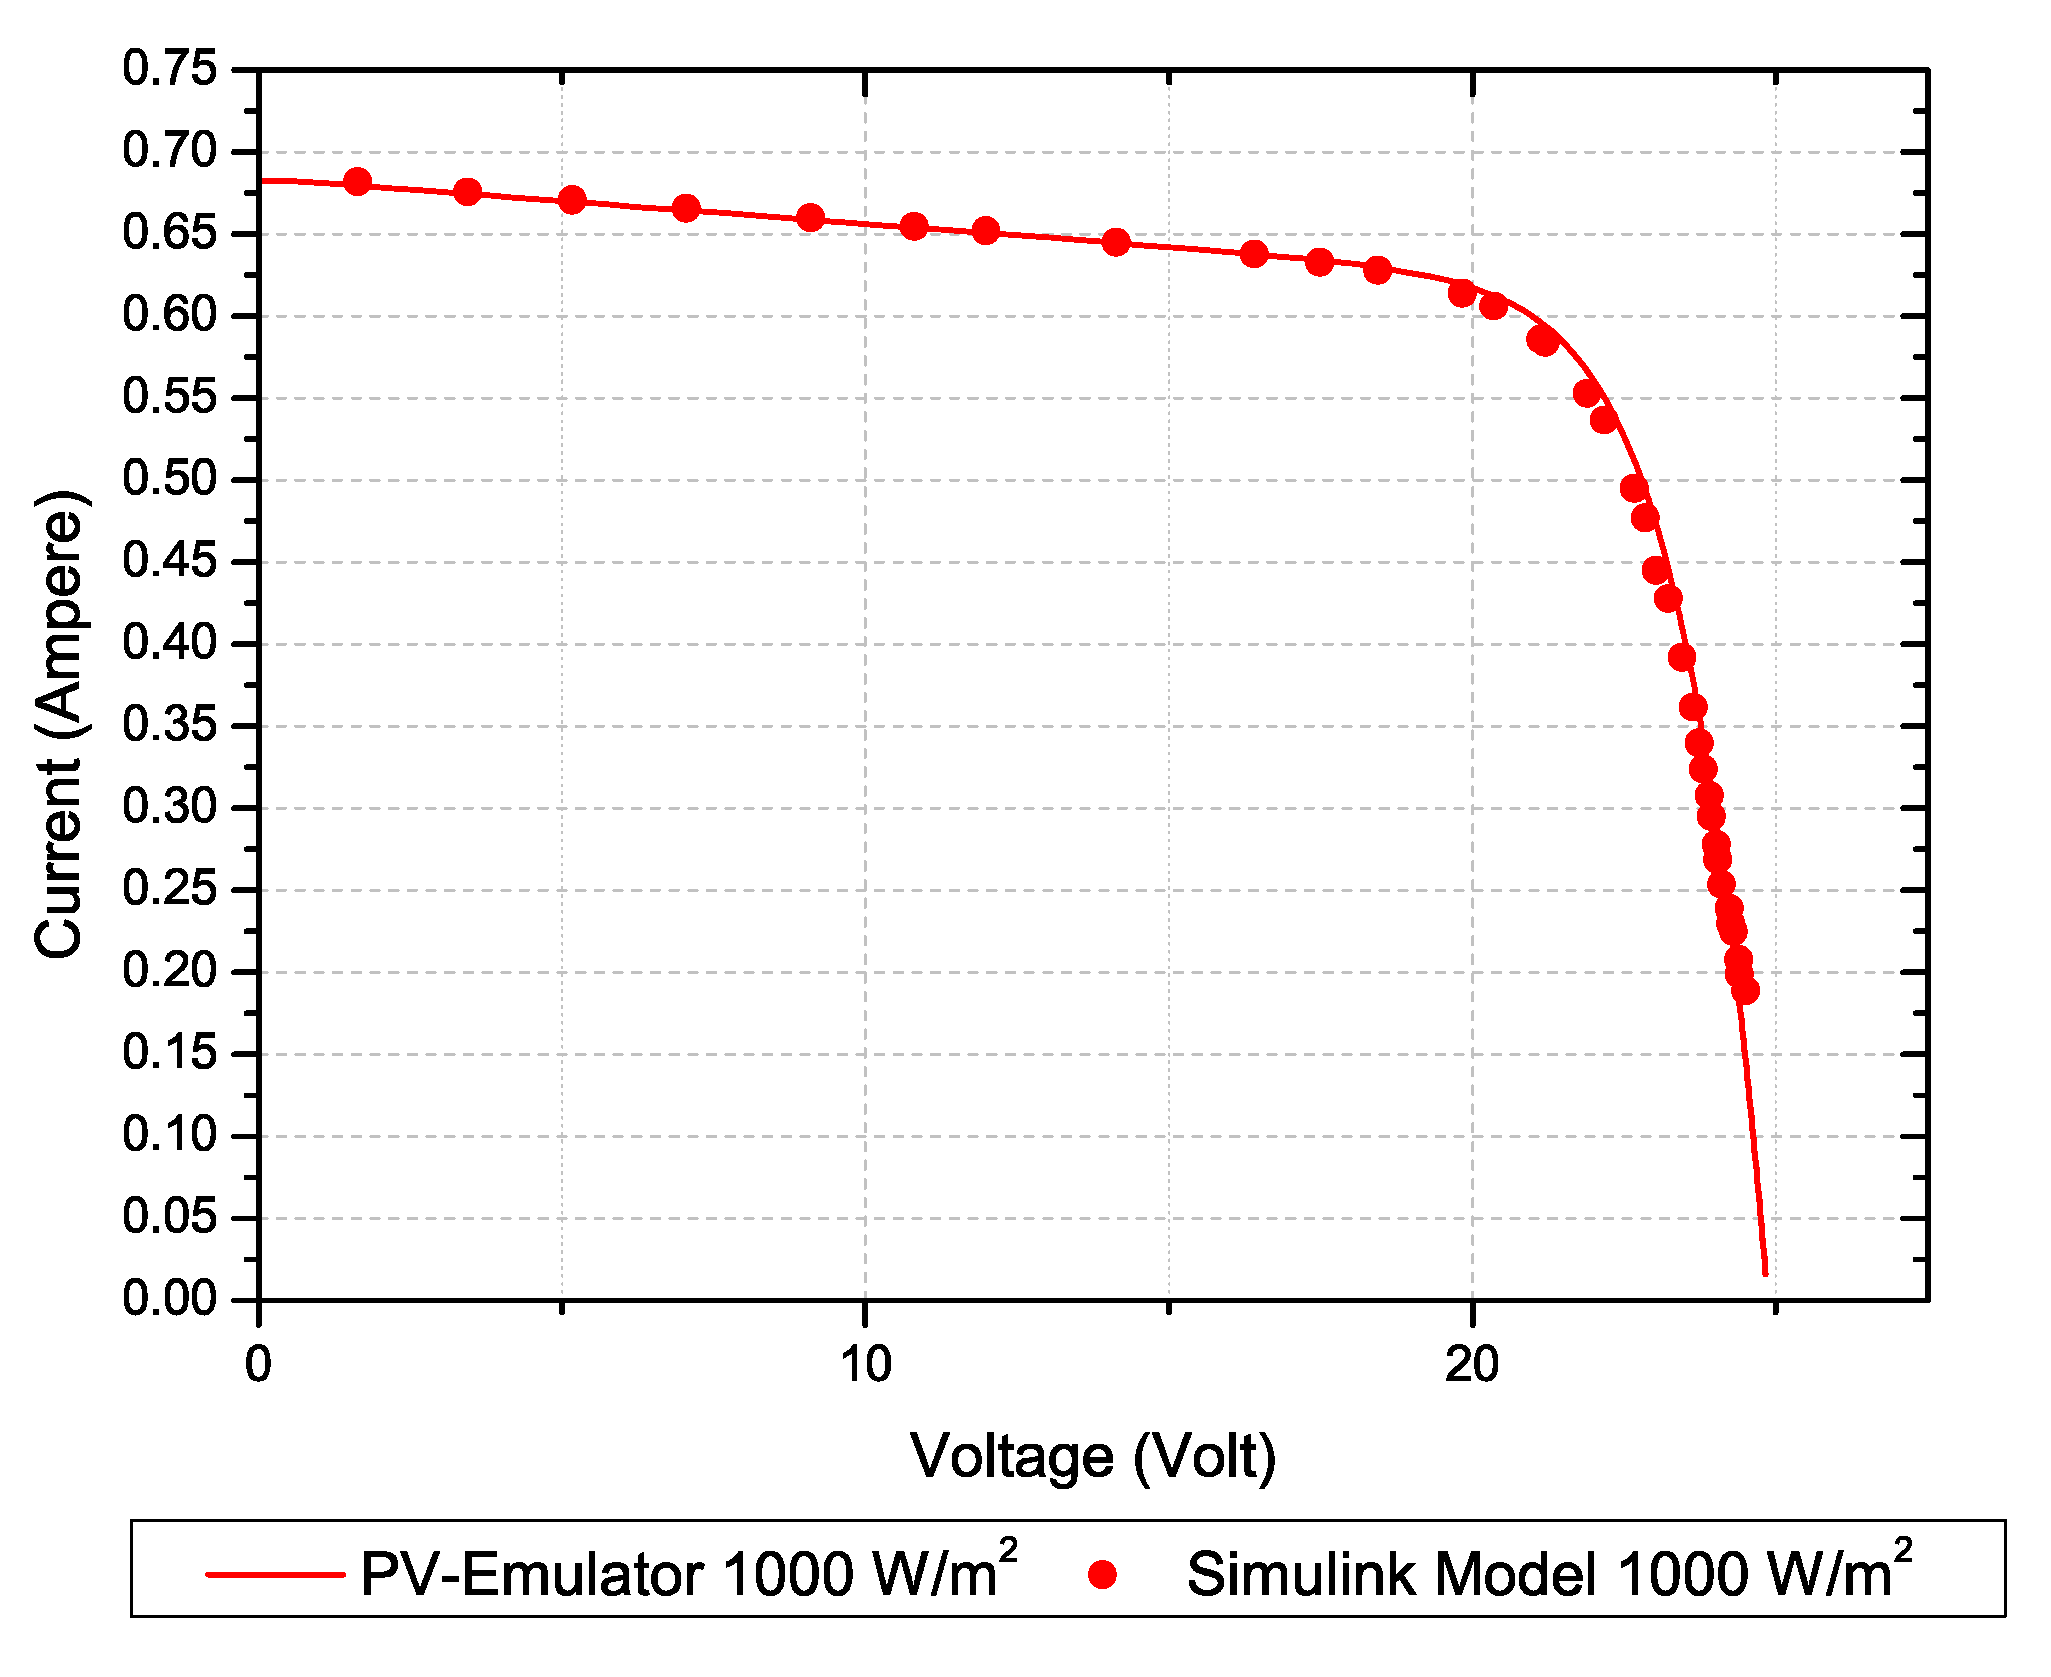
4.1. Simulation Results

In order to test the Simulink model of the photovoltaic module, simulations have been carried out at different solar irradiances and operating temperatures. Figure 5 shows the I–V and P–V characteristics generated by the model for different values of irradiance and temperature.

4.2. Experimental Results

The first test conducted aims to verify the ability of the photovoltaic emulator to follow the I–V characteristic of the simulated photovoltaic module in the Simulink environment under STC conditions. For the test, the photovoltaic source emulator has been programmed to VOC = 25 V and ISC = 0.7 A. Figure 6 shows the comparison of the I–V characteristics generated by the Simulink model and that of the proposed photovoltaic source emulator. It is possible to note that the emulator faithfully reproduces the characteristic of the simulated photovoltaic module. The right terminal part of the I–V characteristic cannot be reproduced by the emulator because the value of the power resistor used as a load in the tests could not assume sufficiently high resistance values, being limited to 110 Ω.
The absolute deviation value between the simulated I–V characteristic and the one reproduced by the photovoltaic emulator has been calculated, according to:
A b s ( E r r o r ) %   =   A b s ( I l o a d M o d e l I l o a d P V E m u l a t o r ) 100 ,
and the results are shown in Figure 7. The deviation for a large part of the characteristic is less than 1% and overall is below 5%. The maximum error is reported very close to VOC where a slight variation of the voltage causes a sudden and large current variation. The accuracy of the system demonstrates the effectiveness of the proposed PV source emulator in reproducing the I–V characteristic.

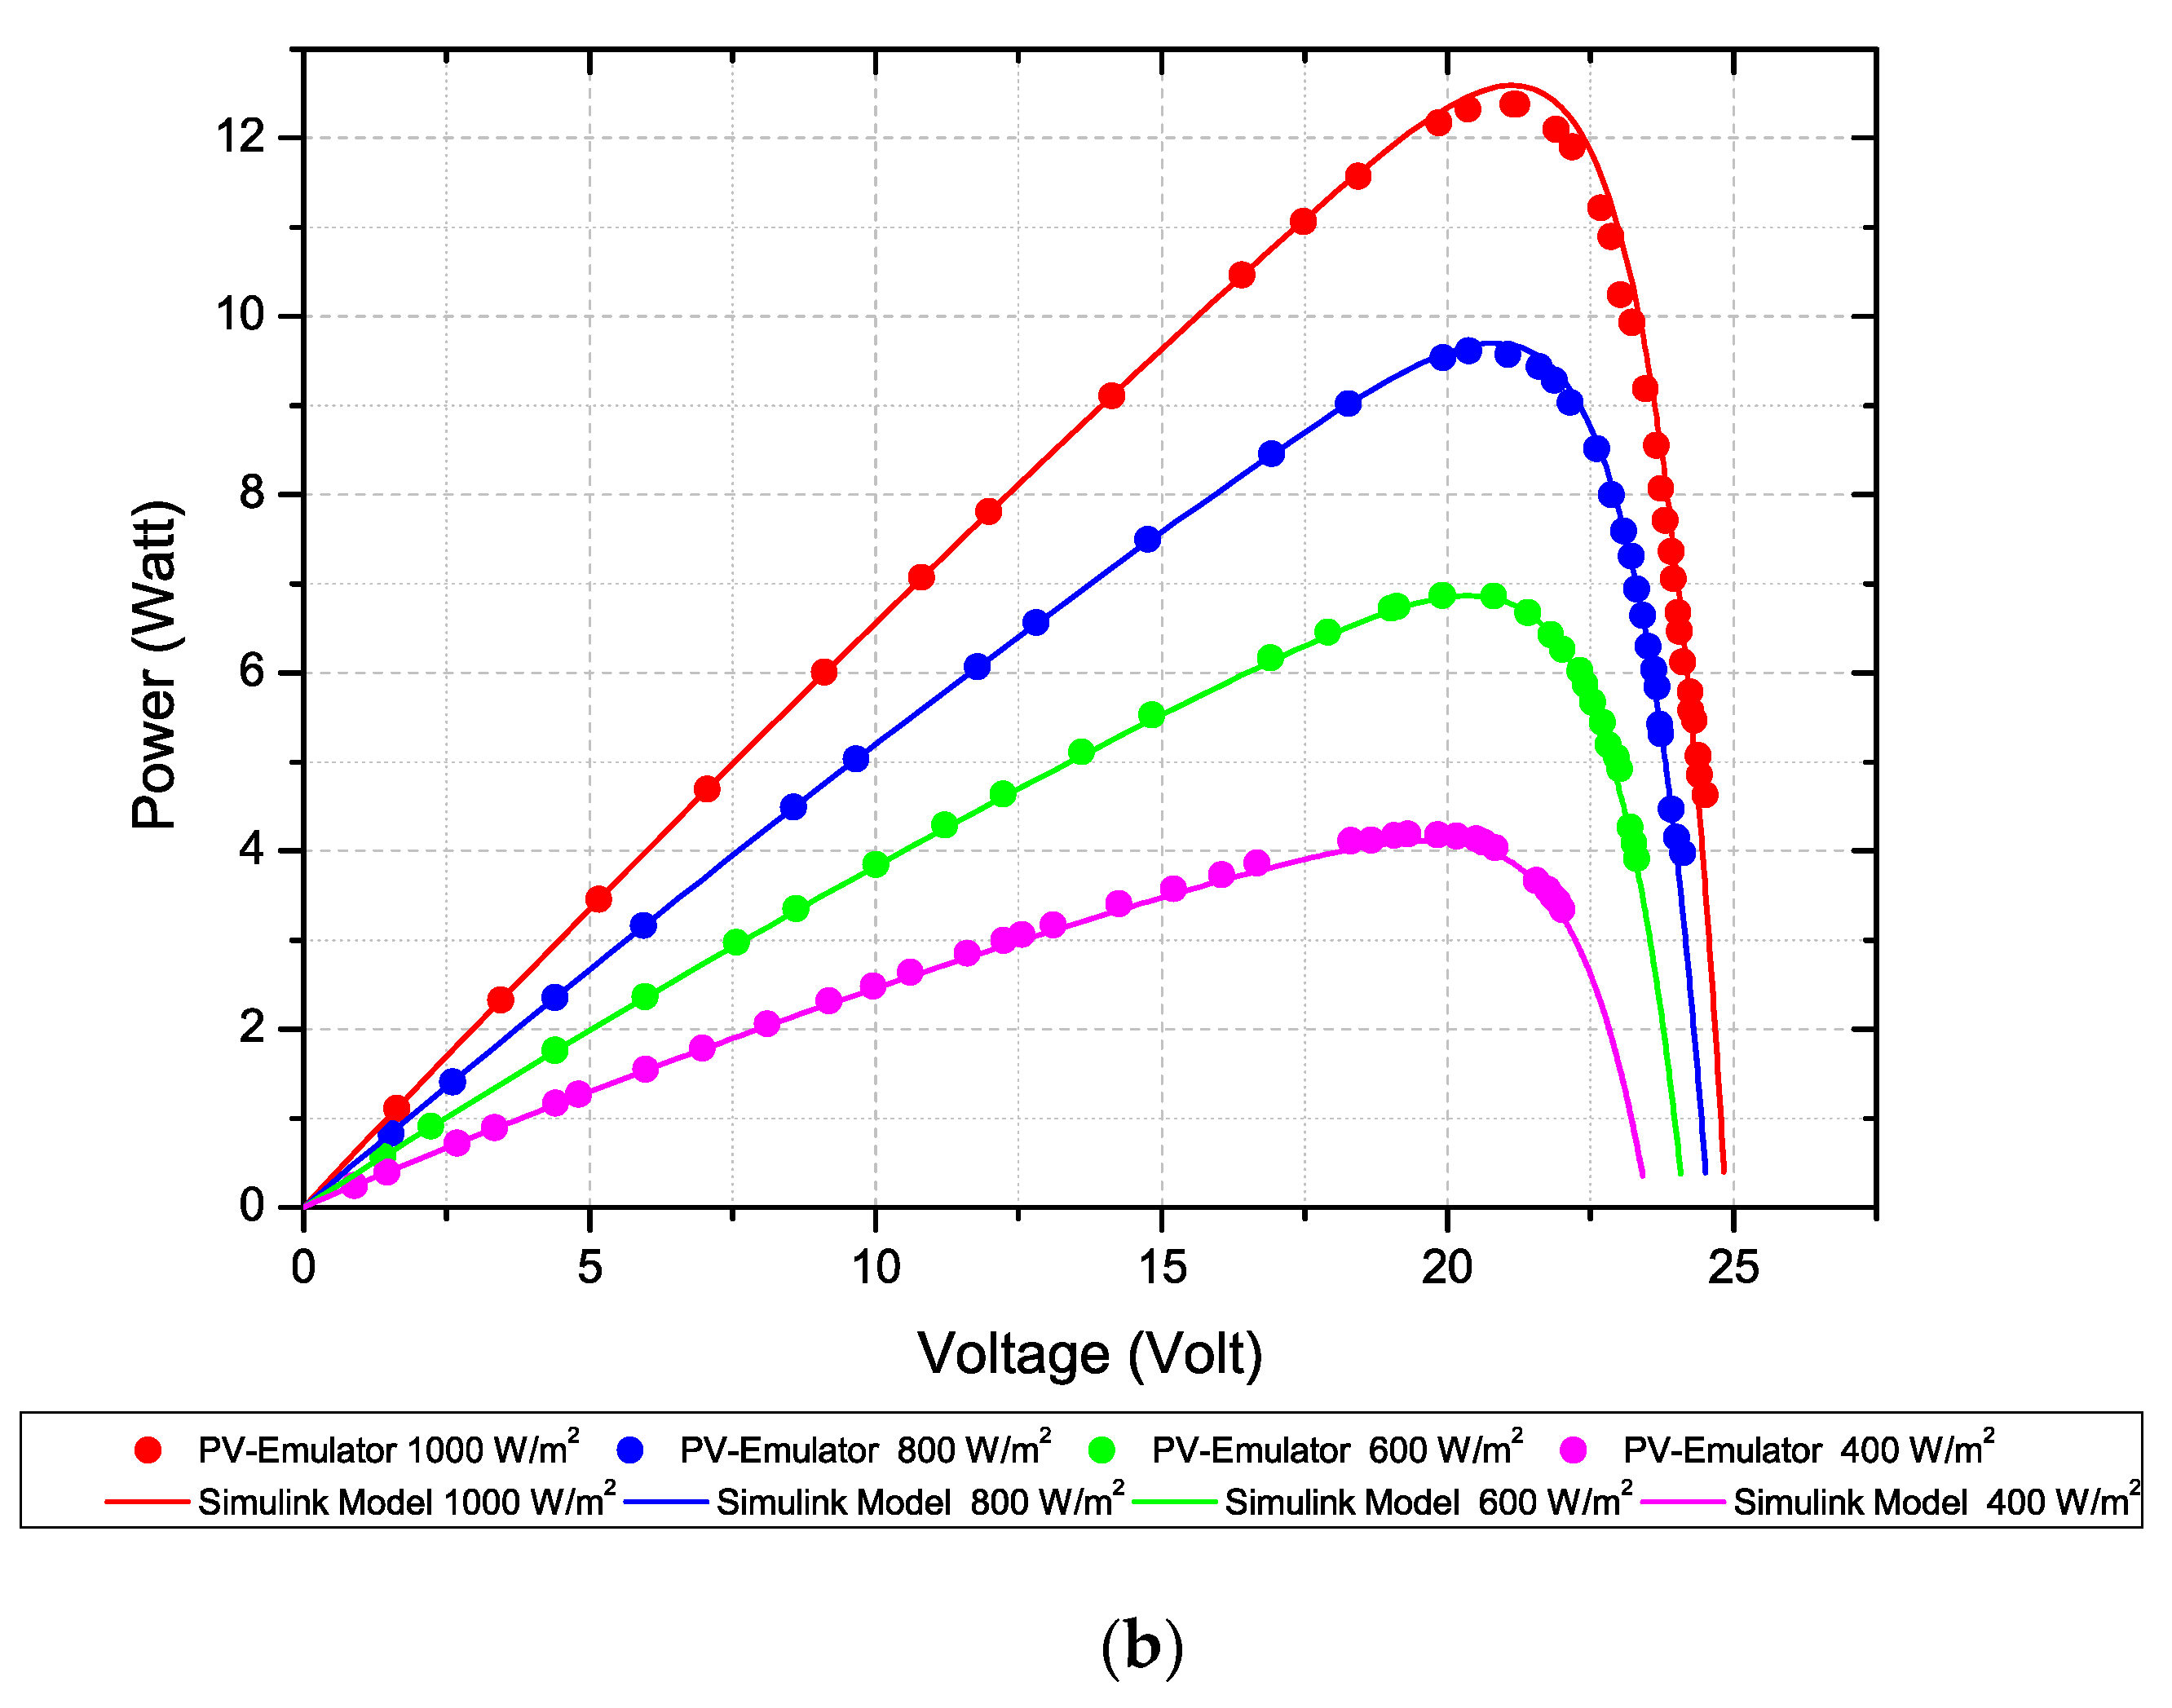
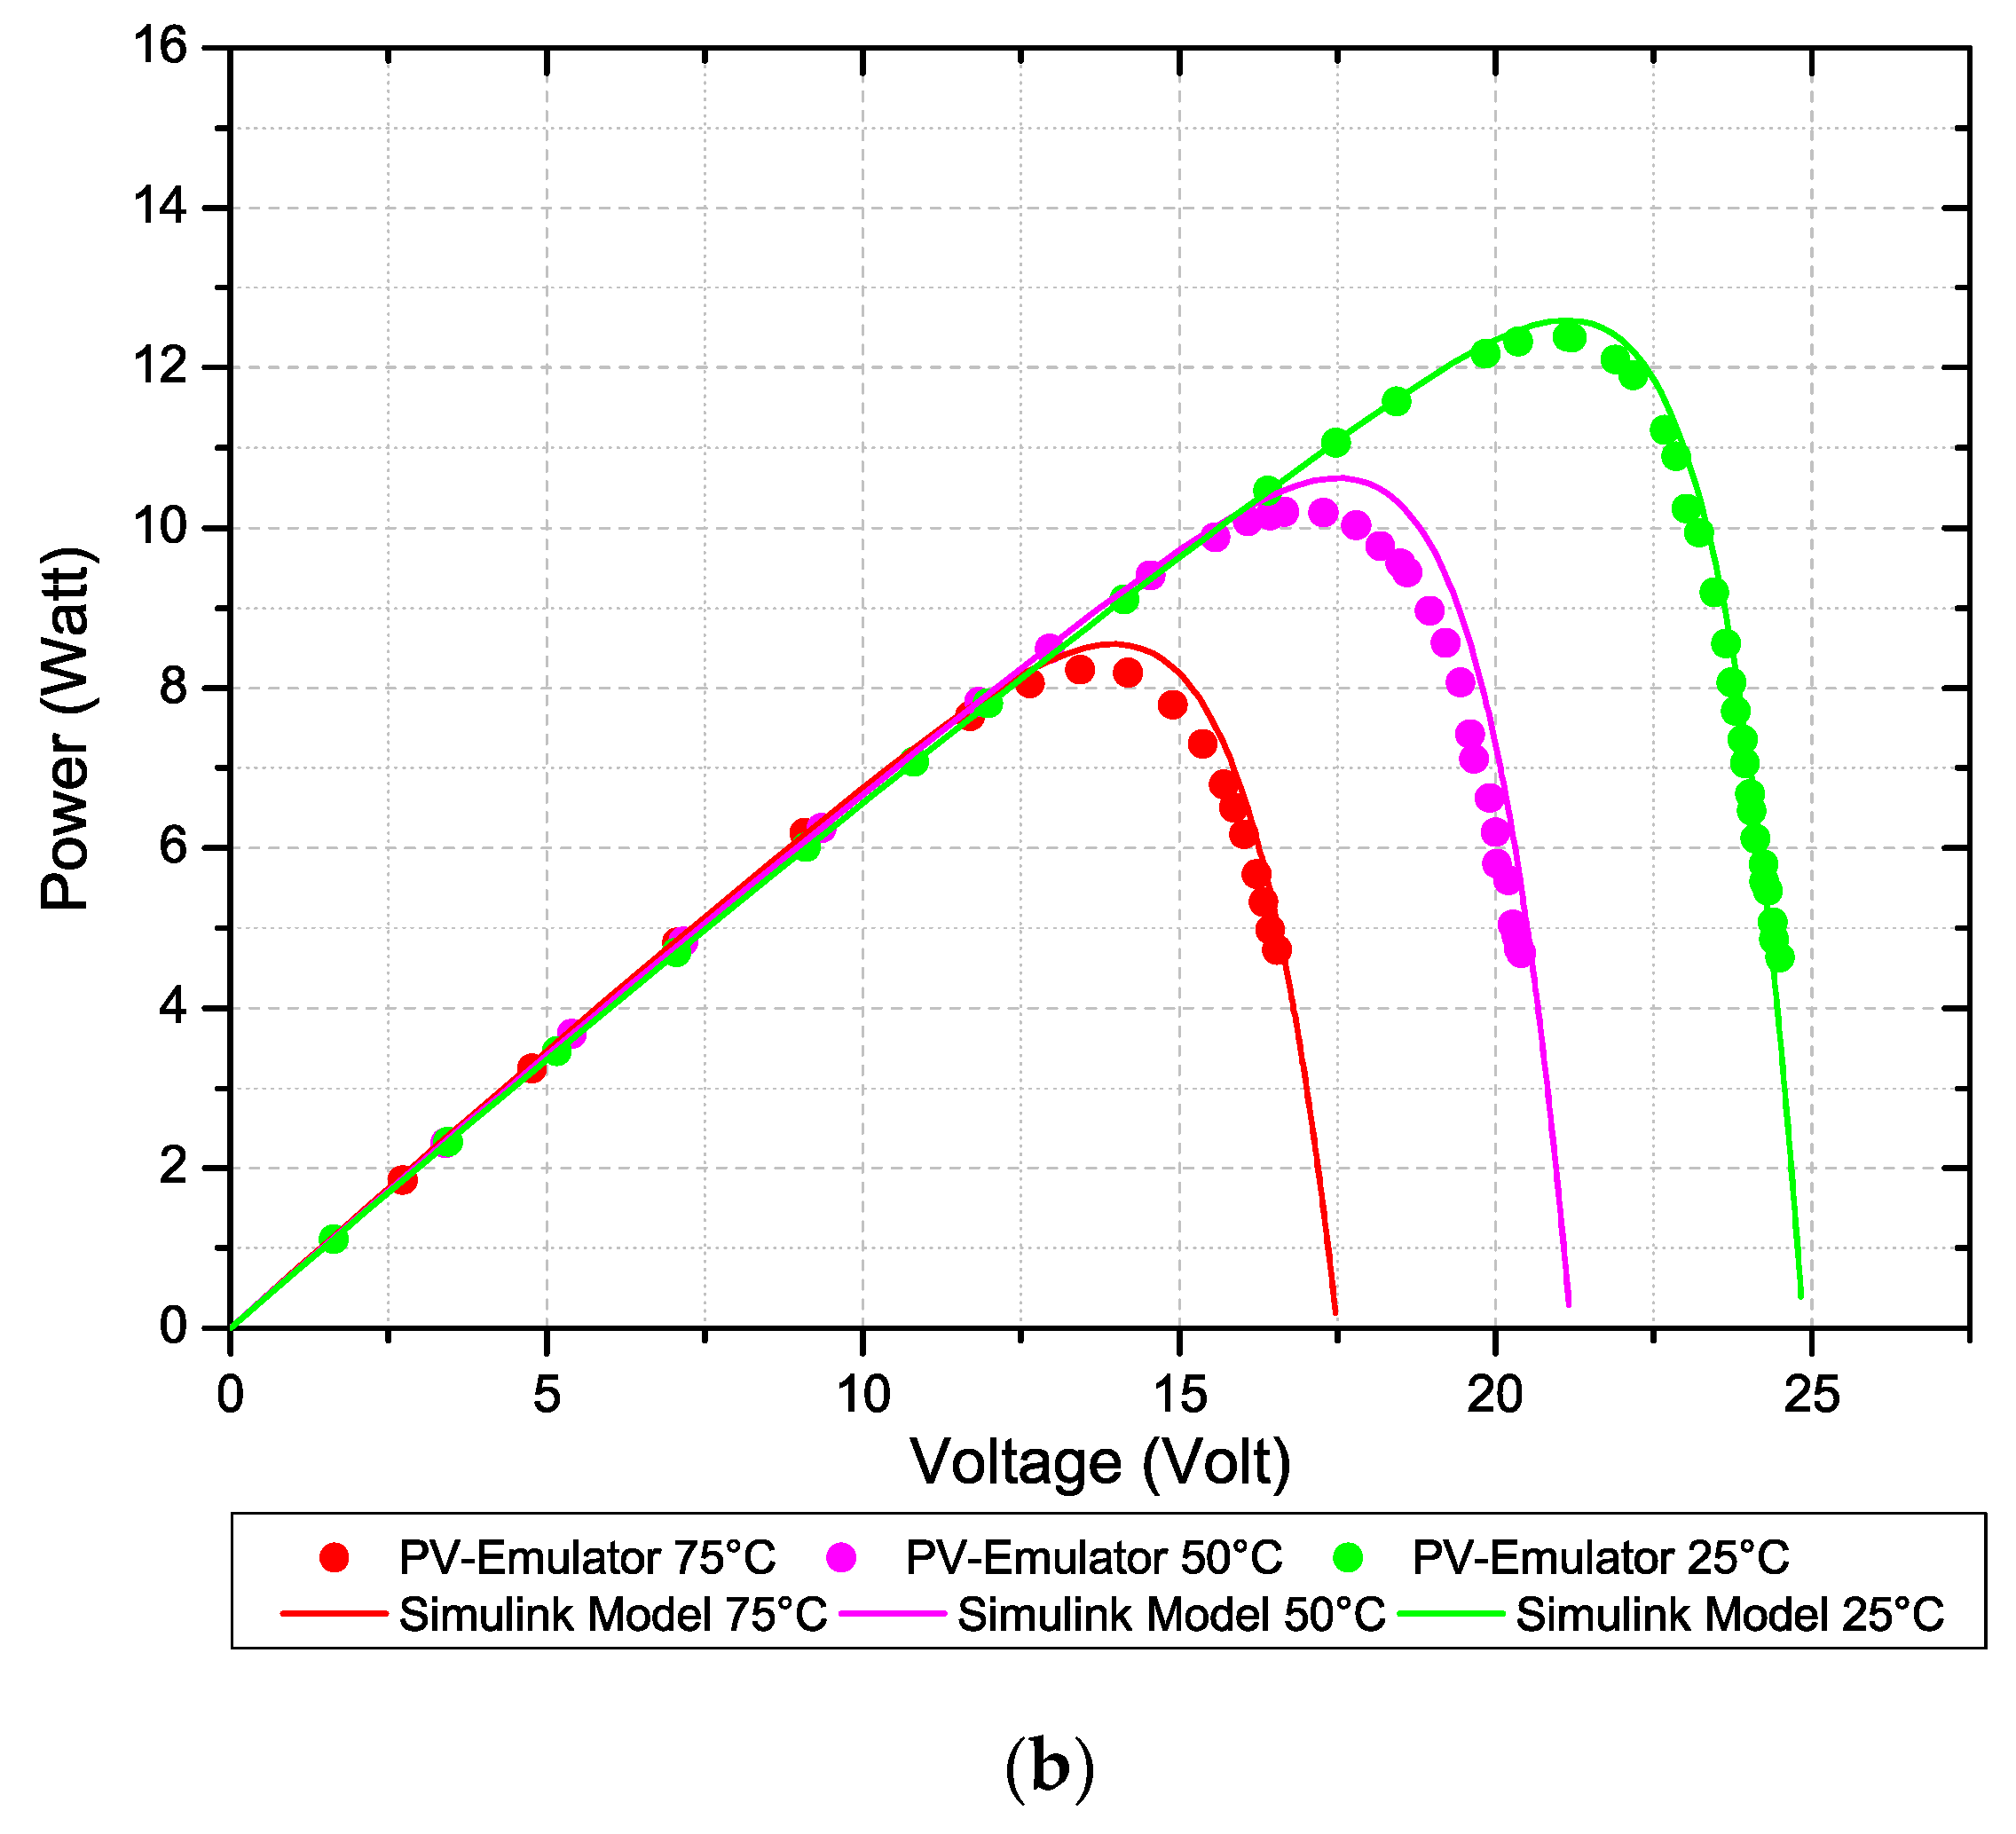
4.1.1. Results at Different Environmental Conditions

Other tests have been carried out to verify that the photovoltaic source emulator is able to follow the characteristics of I–V and P–V at different values of the environmental parameters. From the graphs shown in Figure 8 and Figure 9, it can be seen that even when irradiation and temperature conditions vary, the photovoltaic source emulator can fit the target I–V and P–V characteristics.

4.1.2. Dynamic Performance

In previous paragraphs, the ability of the photovoltaic source emulator to reproduce the I–V and P–V characteristics under very slowly varying load and fixed environmental conditions has been shown. On the other hand, a photovoltaic emulator must also be characterized by a dynamic point of view, evaluating the time necessary to track the sudden changes in load resistance.
To test the settling time of the control signal, the filter has been set to a cut-off frequency of 10.6 Hz and the value of the load resistance was changed using a rheostat to increase the load resistance from 5 Ω to 30 Ω. The results are reported in Figure 10 and show a response time of less than 150 ms. The system has also been tested as a power source with two different MPPTs, a commercial SolarEdge Power Optimizer and an experimental MPPT [36], showing a correct behavior within the limits of its power range.

5. Conclusions

In this paper, we presented the design, test, and results of the development of a low-cost microcontroller-based PV source emulator, which allows testing the static and dynamic performance of PV systems considering different PV module types and variable operating and environmental conditions. The photovoltaic source emulator is based on a completely new technique, which consists in subtracting an adequate amount of current from a fixed direct current source so as to reproduce the desired I–V characteristic. Direct current sources can be found on the market at a very low price, in comparison with systems based on expensive DC voltage sources. Moreover, the proposed method has the advantage of reducing noise from high-frequency switching, reducing or eliminating ripple and the demand of output filters, and it does not require expensive DC Power source, providing high accuracy results. In fact, very good accuracy in the reproduction of PV module I–V characteristics has been obtained and reported with an average and maximum error of, respectively ±1% and ±5%. Experimental results on a hardware prototype of the proposed PV source emulator validate the concept, showing a very good adherence to the simulation.
The fast dynamic response of the system (150 ms) allows the testing of very fast MPPTs algorithms, thus overcoming the main limitations of state-of-art PV source emulator that is unable to respond to the quick variation of the load. The system has been tested as a power source with two different MPPTs showing a correct behavior within the limited power range.
A drawback of the proposed system is mostly the heat dissipation over the transistor used in linear region, which in fact reduces the efficiency of the system. However, for the purpose of this work, such drawback is considered acceptable, allowing the reduction of the Bill of Material of the board cost to less than 20 dollars and providing, at the same time, an accurate yet simple method for emulating photovoltaic sources.

Author Contributions

Conceptualization, M.M.; Data curation, M.M. and D.I.; Formal analysis, M.M.; Investigation, M.M., D.I., R.C. and F.G.D.C.; Methodology, M.M., R.C.; Software, M.M. and D.I.; Supervision, M.M.; Writing—original draft, M.M.; Writing—review & editing, M.M., D.I., R.C. and F.G.D.C.

Funding

This research received no external funding.

Acknowledgments

PAC Calabria 2014–2020 Asse Prioritario 12, Azione 10.5.12, is gratefully acknowledged by one of the authors (D.I.).

Conflicts of Interest

The authors declare no conflict of interest.

References

  1. Piliougine, M.; Carretero, J.; Mora-López, L.; Sidrach-De-Cardona, M. Experimental system for current-voltage curve measurement of photovoltaic modules under outdoor conditions. Prog. Photovolt. 2011, 19, 591–602. [Google Scholar] [CrossRef]
  2. Camino-Villacorta, M.; Egido-Aguilera, M.A.; Díaz, P. Test procedures for maximum power point tracking charge controllers characterization. Prog. Photovolt. Res. Appl. 2012, 20, 310–320. [Google Scholar] [CrossRef]
  3. Elgar TerraSAS ETS Series. Available online: https://www.powerandtest.com (accessed on 24 October 2019).
  4. Keysight E4368A Solar Array Simulator. Available online: https://www.keysight.com (accessed on 24 October 2019).
  5. Magna-Power Programmable DC Power Supply. Available online: http://www.magna-power.com (accessed on 24 October 2019).
  6. Sanchis, P.; López, J.; Ursúa, A.; Gubía, E.; Marroyo, L. On the testing, characterization, and evaluation of PV inverters and dynamic MPPT performance under real varying operating conditions. Prog. Photovolt. 2007, 15, 541–556. [Google Scholar] [CrossRef]
  7. Mukerjee, A.; Dasgupta, N. DC power supply used as photovoltaic simulator for testing MPPT algorithms. Renew. Energy 2007, 32, 587–592. [Google Scholar] [CrossRef]
  8. Nagayoshi, H. I–V curve simulation by multi-module simulator using I–V magnifier circuit. Sol. Energy Mater. Sol. Cells 2004, 82, 159–167. [Google Scholar] [CrossRef]
  9. Midtgard, O.-M. A simple photovoltaic simulator for testing of power electronics. In Proceedings of the 2007 European Conference on Power Electronics and Applications, Aalborg, Denmark, 2–5 September 2007; pp. 1–10. [Google Scholar]
  10. Zhou, Z.; Macaulay, J. An Emulated PV Source Based on an Unilluminated Solar Panel and DC Power Supply. Energies 2017, 10, 2075. [Google Scholar] [CrossRef]
  11. Moussa, I.; Khedher, A.; Bouallegue, A. Design of a Low-Cost PV Emulator Applied for PVECS. Electronics 2019, 8, 232. [Google Scholar] [CrossRef]
  12. Sanaullah, A.; Khan, H.A. Design and implementation of a low cost Solar Panel emulator. In Proceedings of the 2015 IEEE 42nd Photovoltaic Specialist Conference (PVSC), New Orleans, LA, USA, 14–19 June 2015. [Google Scholar]
  13. Koutroulis, E.; Kalaitzakis, K.; Tzitzilonis, V. Development of an FPGA-based system for real-time simulation of photovoltaic modules. Microelectron. J. 2009, 40, 1094–1102. [Google Scholar] [CrossRef]
  14. Rana, A.V.; Patel, H.H. Current Controlled Buck Converter based Photovoltaic Emulator. J. Ind. Intell. Inf. 2013, 1, 91–96. [Google Scholar] [CrossRef]
  15. Walker, D.; Fisher, T.; Liu, J.; Schrimpf, R. Thermal modeling of single event burnout failure in semiconductor power devices. Microelectron. Reliab. 2001, 41, 571–578. [Google Scholar] [CrossRef]
  16. González-Medina, R.; Patrao, I.; Garcerá, G.; Figueres, E. A low-cost photovoltaic emulator for static and dynamic evaluation of photovoltaic power converters and facilities. Prog. Photovolt. Res. Appl. 2014, 22, 227–241. [Google Scholar] [CrossRef]
  17. Di Piazza, M.C.; Vitale, G. Photovoltaic field emulation including dynamic and partial shadow conditions. Appl. Energy 2010, 87, 814–823. [Google Scholar] [CrossRef]
  18. Koran, A.; LaBella, T.; Lai, J.S. High Efficiency Photovoltaic Source Simulator with Fast Response Time for Solar Power Conditioning Systems Evaluation. IEEE Trans. Power Electron. 2014, 29, 1285–1297. [Google Scholar] [CrossRef]
  19. Khouzam, K.; Hoffman, K. Real-time simulation of photovoltaic modules. Sol. Energy 1996, 56, 521–526. [Google Scholar] [CrossRef]
  20. Chang, C.-H.; Chang, E.-C.; Cheng, H.-L. A High-Efficiency Solar Array Simulator Implemented by an LLC Resonant DC–DC Converter. IEEE Trans. Power Electron. 2013, 28, 3039–3046. [Google Scholar] [CrossRef]
  21. Ortiz-Rivera, E.I.; Peng, F.Z. Analytical model for a photovoltaic module using the electrical characteristics provided by the manufacturer data sheet. In Proceedings of the IEEE 36th Power Electronics Specialists Conference, Recife, Brazil, 16 June 2005; pp. 2087–2091. [Google Scholar] [CrossRef]
  22. Zhang, H.; Zhao, Y. Research on a novel digital photovoltaic array simulator. In Proceedings of the International Conference on Intelligent Computation Technology and Automation, Changsha, China, 11–12 May 2010; Volume 2, pp. 1077–1080. [Google Scholar] [CrossRef]
  23. Balato, M.; Costanzo, L.; Gallo, D.; Landi, C.; Luiso, M.; Vitelli, M. Design and implementation of a dynamic FPAA based photovoltaic emulator. Sol. Energy 2016, 123, 102–115. [Google Scholar] [CrossRef]
  24. Zhang, J.; Wang, S.; Wang, Z.; Tian, L. Design and Realization of a Digital PV Simulator with a Push-Pull Forward Circuit. J. Power Electron. 2014, 14, 444–457. [Google Scholar] [CrossRef]
  25. Kim, Y.; Lee, W.; Pedram, M.; Chang, N. Dual-mode power regulator for photovoltaic module emulation. Appl. Energy 2013, 101, 730–739. [Google Scholar] [CrossRef]
  26. Iero, D.; Carbone, R.; Carotenuto, R.; Felini, C.; Merenda, M.; Pangallo, G.; Della Corte, F.G. SPICE modelling of a complete photovoltaic system including modules, energy storage elements and a multilevel inverter. Sol. Energy 2014, 107, 338–350. [Google Scholar] [CrossRef]
  27. Protogeropoulos, C.; Brinkworth, B.J.; Marshall, R.H.; Cross, B.M.; Santos, G. Evaluation of Two Theoretical Models in Simulating the Performance of Amorphous—Silicon Solar Cells. In Proceedings of the International Conference, Lisbon, Portugal, 8–12 April 1991; Springer Science and Business Media LLC.: Berlin, Germany, 1991; pp. 412–415. [Google Scholar]
  28. Chan, D.; Phang, J. Analytical methods for the extraction of solar-cell single- and double-diode model parameters from I-V characteristics. IEEE Trans. Electron Devices 1987, 34, 286–293. [Google Scholar] [CrossRef]
  29. Gow, J.; Manning, C. Development of a photovoltaic array model for use in power-electronics simulation studies. IEE Proc. Electr. Power Appl. 1999, 146, 193. [Google Scholar] [CrossRef]
  30. Iero, D.; Carbone, R.; Carotenuto, R.; Felini, C.; Merenda, M.; Pangallo, G.; Della Corte, F.G. One-shot SPICE simulation of photovoltaic modules, storage elements, inverter and load. In Proceedings of the 2015 AEIT International Annual Conference (AEIT), Naples, Italy, 14–16 October 2015; pp. 1–4. [Google Scholar]
  31. Bellia, H.; Youcef, R.; Fatima, M. A detailed modeling of photovoltaic module using MATLAB. NRIAG J. Astron. Geophys. 2014, 3, 53–61. [Google Scholar] [CrossRef]
  32. Ramos-Hernanz, J.; Campayo, J.; Larranaga, J.; Zulueta, E.; Barambones, O.; Motrico, J.; Gamiz, U.; Zamora, I. Two photovoltaic cell simulation models in Matlab/Simulink. Int. J. Tech. Phys. Probl. Eng. 2012, 4, 45–51. [Google Scholar]
  33. Walker, G. Evaluating MPPT converter topologies using a matlab PV model. J. Electr. Electron. Eng. Aust. 2001, 21, 49–55. [Google Scholar]
  34. Izadian, A.; Pourtaherian, A.; Motahari, S. Basic model and governing equation of solar cells used in power and control applications. In Proceedings of the IEEE Energy Conversion Congress and Exposition (ECCE), Raleigh, NC, USA, 15–20 September 2012; pp. 1483–1488. [Google Scholar]
  35. Pukhrem, S. A Photovoltaic Panel Model in Matlab/Simulink; The MathWorks, Inc.: Natick, MA, USA, 2013; pp. 20–23. [Google Scholar] [CrossRef]
  36. Merenda, M.; Iero, D.; Pangallo, G.; Falduto, P.; Adinolfi, G.; Merola, A.; Graditi, G.; Della Corte, F.G. Open-Source Hardware Platforms for Smart Converters with Cloud Connectivity. Electronics 2019, 8, 367. [Google Scholar] [CrossRef] [Green Version]
Figure 1. Photovoltaic cell: equivalent circuit of the single diode model.
Electronics 08 01445 g001
Figure 2. Block diagram of the PV source emulator.
Electronics 08 01445 g002
Figure 3. Graphic representation of the emulation technique; the current on the load is obtained as the difference between the ISC and the ILOSS.
Electronics 08 01445 g003
Figure 4. A picture of the realized photovoltaic source emulator prototype: the custom made shield is mounted on top of an STM32 Nucleo board by STMicroelectronics.
Electronics 08 01445 g004
Figure 5. I–V and P–V characteristics generated by the model: (a) I–V characteristic at 25 °C, AM1.5, at different irradiance values; (b) P–V characteristic at 25 °C, AM1.5, at different irradiance values; (c) I–V characteristic at different temperatures, G = 1000 W/m2, AM1.5; (d) P–V characteristic at different temperatures, G = 1000 W/m2, AM1.5.
Electronics 08 01445 g005
Figure 6. Comparison between the simulated I–V characteristic and the output I–V characteristic of the photovoltaic source emulator under STC conditions (1000 W/m2, 25 °C).
Electronics 08 01445 g006
Figure 7. Maximum absolute deviation between the simulated I–V characteristic and the one reproduced by the proposed photovoltaic source emulator.
Electronics 08 01445 g007
Figure 8. Comparison of simulated and emulated characteristics at different irradiation conditions: (a) I–V characteristic; (b) P–V characteristic.
Electronics 08 01445 g008aElectronics 08 01445 g008b
Figure 9. Comparison of simulated and emulated characteristics at different temperatures: (a) I–V characteristic; (b) P–V characteristic.
Electronics 08 01445 g009aElectronics 08 01445 g009b
Figure 10. Transient response of the control signal following an instantaneous increase of the load resistance from 5 Ω to 30 Ω.
Electronics 08 01445 g010
Table 1. Basic Parameter of the Simulated PV module at Standard Test Conditions (STC).
ParameterValue
Typical Peak Power (PMPP)12 W
Short circuit Current (ISC)0.683 A
Open circuit Voltage (VOC)25 V
Temperature coefficient of Open-Circuit Voltage (kV)−(80 ± 10) mV/°C
Temperature coefficient of Short circuit Current (kI)(0.065 ± 0.015) %/°C
Temperature coefficient of Power(0.5 ± 0.05) %/°C
Nominal Operating Cell Temperature (NOCT)47 ± 2 °C

