Article

Performance Analysis of IEEE 802.11p for Continuous Backoff Freezing in IoV

1
Department of Electronic Engineering, The Beijing National Research Center for Information Science and Technology, Tsinghua University, Beijing 100084, China
2
Jiangsu Provincial Engineering Laboratory for Pattern Recognition and Computational Intelligence, Jiangnan University, Wuxi 214122, China
3
Advanced Networking Lab., Department of Electrical and Computer Engineering, New Jersey Institute of Technology, Newark, NJ 07102, USA
*
Author to whom correspondence should be addressed.
These authors contributed equally to this work.
Electronics 2019, 8(12), 1404; https://doi.org/10.3390/electronics8121404
Submission received: 10 October 2019 / Revised: 20 November 2019 / Accepted: 21 November 2019 / Published: 25 November 2019

Abstract

:
With the rapid development of cloud computing and big data, traditional Vehicular Ad hoc Networks (VANETs) are evolving into the Internet of Vehicles (IoV). As an important communication technology in IoV, IEEE 802.11p protocols have been studied by many experts and scholars. In IEEE 802.11p, a node’s backoff counter will be frozen when the channel is detected as busy. However, most studies did not consider the possibility of continuous backoff freezing when calculating delay. Thus, in this paper, we focus on the performance analysis of IEEE 802.11p for continuous backoff freezing. Specifically, we establish an analytical model to analyze the broadcast performance in the highway scene where vehicles can obtain traffic density from roadside units through Vehicle to Infrastructure (V2I) communications. We first calculate the relationship between vehicle density and the number of vehicles. Then, we derive the relationship between the number of vehicles and packet delay according to Markov chains. Next, we utilize the probability generating function (PGF) to transform traditional Markov chains into z domain under the situation of non-saturation. Finally, we employ the Mason formula to derive packet delay. As compared with the performance without considering the continuous backoff freezing, the simulation results have demonstrated that our analytical model is more reasonable.

1. Introduction

In recent years, with the rapid development of technologies such as cloud computing and big data in Internet of Things (IoT) [1,2,3], the potential application of cloud computing in traditional Vehicular Ad-hoc Networks (VANETs) has attracted the attention of many experts and scholars [4]. In traditional VANETs, data among vehicles and infrastructures are transmitted through Vehicle-to-Vehicle (V2V) communications and Vehicle-to-Infrastructure (V2I) communications [5,6]. However, the vehicle traffic is increasing rapidly and is expected to reach 300,000 exabytes by 2020, resulting in the fact that VANETs are incapable of handling such huge amounts of data [7,8]. Moreover, with the advent of autonomous vehicles, there are more stringent requirements for Quality of Service (QoS) in VANETs, e.g., low latency and high delivery rate. Therefore, traditional VANETs are evolving to Internet of Vehicles (IoV) [9], which provisions the storage and computing capability to VANETs for big data processing.
The IoV big data are collected by various types of on-board sensors, e.g., cameras, radar, and Global Positioning System (GPS). These raw data contain a lot of unwanted information. Thus, the vehicle itself processes part of the data and uploads most of the data to the cloud for storage and computing [10,11]. Then, vehicles download the result information from the cloud and generate a 3D map by utilizing a High-Definition map (HD map) and LiDAR that launches a laser beam to detect the surrounding environment [12]. Vehicles transmit these pieces of information between each other for safe driving through V2V communications. However, the characteristics of IoV like high-speed mobility will cause the dynamic change of network topology and the unstable communication link, resulting in frequent traffic accidents and serious traffic jams [13,14,15,16,17,18]. To avoid these situations, vehicles use vehicle-to-vehicle (V2V) communications to exchange dynamic parameters and other security messages, e.g., collision warning, blind spot warning and emergency brake warning [19]. These safety-related messages need to be transmitted to nearby vehicles in a short period of time, which means that these messages have strict requirements on low latency and high packet delivery ratio [20,21,22]. Since all vehicles in the surrounding area should react in real time when an emergency occurs, broadcast is more practical than unicast [23].
In order to successfully and timely transfer the safety-related information, vehicles communicate with each other using the IEEE 802.11p standards [24,25,26]. In IEEE 802.11p, the enhanced distributed coordination function (EDCF) medium access control (MAC) defines the safety-related messages as the event-driven (emergency) messages and other messages as the periodic (routine) messages that contain vehicle status information, e.g., speed and position. In the enhanced distributed channel access (EDCA) mechanism adopted by IEEE 802.11p, access categories (ACs) are defined and the emergency messages have the highest transmission priority (AC0) while the routine messages also have a high transmission priority (AC1). Since both messages have high transmission priority, the strict requirements of the packet delay should be guaranteed [27].
In this paper, we focus on performance analysis of IEEE 802.11p for continuous backoff freezing in IoV. The broadcast mechanism is considered to transmit information in the case of non-saturation. References [28,29] have studied the delay performance of Dedicated Short Range Communications (DSRC) in IEEE 802.11p. However, they calculated the average time of the backoff counter decreasing one without considering the situation of continuous backoff counter freezing, which aroused our research interest. When continuous backoff freezing occurs, the vehicle needs more time to transfer the packet. For example, when a traffic accident occurs, nearby vehicles need to broadcast this information to other vehicles in a timely manner. If the sensors on a vehicle are designed without considering the continuous backoff freezing, the related information may not be broadcast timely and completely, thus incurring more traffic accidents. In order to accurately study the performance of the 802.11p protocols impacted by continuous backoff freezing, we then use the probability generating function (PGF) method [30] to develop a mathematical model and analyze the packet delay and packet delivery ratio in this situation. The simulation results demonstrate that the proposed model satisfies the delay requirements of vehicles in IoV. Our contributions can be summarized as follows:
  • We have modeled the MAC service process based on the PGF method to transform traditional Markov chains into z domain under the situation of non-saturation.
  • Considering continuous backoff freezing, we have employed the Mason formula to derive the mean and deviation of the MAC access delay.
  • As compared with the model presented in [28], which did not consider the situation of continuous backoff freezing, the performance of our analytical model in terms of packet delay and packet delivery ratio has been verified.
The rest of the paper is organized as follows. Section 2 reviews the related research of IEEE 802.11p performance analysis in the past few years. Section 3 overviews the IEEE 802.11p EDCA mechanism and depicts the scenario model of IoV on the highway. Section 4 models the probability generating function of the MAC access delay and derives the packet delay. Section 5 presents the simulation results. Section 6 summarizes our work.

2. Related Work

In this section, we briefly review the recent works on performance analysis in IEEE 802.11p.
In [31], Li et al. proposed a two-dimensional Markov chain model to describe the IEEE 802.11p broadcast scheme. In their model, the 1st dimension Markov chain described the backoff process and the 2nd dimension described the queueing process. The EDCA mechanism in IEEE 802.11p is not considered in their paper. In [32], Peng et al. developed a multiplatooning communication model for both intra-platoon and inter-platoon communications on highways by adopting IEEE 802.11 distributed coordination function (DCF) mechanism. Unlike EDCA, DCF does not prioritize information. All information is sent and received based on the same rule. In [33], Bazzi et al. compared the advantages and disadvantages of 802.11p and long-term evolution (LTE) technologies, and pointed out that devices with 802.11p have higher capacity when the vehicle density is high. In [34], Yang et al. proposed an inter-vehicle cooperation channel estimation (IVC-CE) method at the IEEE 802.11p physical layer for the support of safety related information. This paper considered the physical layer of V2I communications, instead of the MAC layer. In [35], Qiu et al. proposed a new research method to analyze the performance of 802.11p for the uneven distribution of vehicles in urban traffic. This paper also did not consider the multi-priority situation of information. In [36], the authors analyzed the performance of the 802.11p EDCA mechanism in an intersection environment and used relay nodes to increase packet delivery rates. However, this paper only calculated the average time delay for backoff, and did not consider the case of continuous backoff freezing. In [29], the authors analyzed the real-time performance of IEEE 802.11p on highway. Similar with [36], this paper used the method of [28] to calculate the average backoff delay, without considering the continuous backoff freezing. Since none of the above papers consider the case of continuous backoff freezing, in this paper, we will analyze the performance of IEEE 802.11p EDCA mechanism where continuous backoff freezing is taken into account. In order to clearly describe the difference between our model and other models, we list the differences in Table 1. Note that B/U represents Broadcast/Unicast and BF/CBF represents Backoff Freezing/Continuous Backoff Freezing.

3. IEEE 802.11p EDCA Mechanism and Scenario Description

3.1. An Overview of IEEE 802.11p EDCA Mechanism

To ensure different QoS requirements for different services, the IEEE 802.11p EDCA mechanism defined four different access categories (ACs) for each channel. Access categories can be expressed as A C 0 - A C 3 in the order of decreasing priority, and each access category has a separate transmission queue [24]. These access categories are distinguished by different contention parameters. The contention parameters are listed as follows:
  • C W m i n : the minimum contention window;
  • C W m a x : the maximum contention window;
  • T X O P : transmission opportunity;
  • A I F S : Arbitration Inter Frame Space, which indicates the channel idle time that must be waited for to obtain a transmission opportunity.
As far as we know, A C 0 queue mainly transmits safety information such as position, speed, and acceleration. A C 1 , A C 2 , and A C 3 queues mainly transmit some non-secure information such as entertainment information. In order to avoid accidents, the emergency messages need to be broadcast quickly through the A C 0 queue. The routine messages including calling, gaming, and surfing can be transmitted through A C 1 , A C 2 , and A C 3 queues instead of A C 0 queue because this type of message is less important than an emergency message, and the delivery of an emergency message should take precedence over a routine message when an emergency occurs. Since A C 1 , A C 2 , and A C 3 queues transmit the same message type, in order to distinguish and compare emergency messages and routine messages, we only use A C 1 queue to transmit routine messages, similarly to [19,29,38].
The standard specified the calculation formula for AIFS as
A I F S i = A I F S N i × σ + S I F S ,
where A I F S N i is the Arbitration Inter Frame Space Number of A C i . S I F S represents the Short Inter Frame Space and σ denotes one time slot. As shown in Figure 1, the difference between A I F S N 0 and A I F S N 1 can be expressed as
A d = A I F S N 1 A I F S N 0 .
The detailed values of each contention parameter are shown in Table 2.
The backoff process of EDCA mechanism is shown in Figure 1. The backoff counter of A C i is initiated to be a random value within [ 0 , W i , 0 1 ] , where W i , j is the contention window size of A C i in the backoff stage j and W i , 0 = C W i , m i n + 1 . The backoff counter decreases by one when the channel is detected as idle for a time slot σ , while it will be frozen when the channel is detected as busy until the channel remains idle during A I F S i . Once the backoff counter of A C i becomes zero, A C i broadcasts the packet. If the packet is transmitted successfully, the backoff counter of A C i is reset to a random value in [ 0 , W i , 0 1 ] . However, if multiple nodes broadcast simultaneously, A C 0 will have a collision, and the backoff counter of A C 0 will be reset to be a random value in [ 0 , W i , 0 1 ] . If A C 0 and A C 1 of a node transmit simultaneously, A C 1 cannot transmit the data successfully, and its backoff counter will be reset to be a random value in [ 0 , W i , j + 1 1 ] . After each transfer failure, the contention window size W 1 , j is doubled until it reaches C W 1 , m a x + 1 . At this time, the maximum backoff stage is denoted as M and can be expressed as
M = log 2 C W 1 , max + 1 C W 1 , min + 1 .
In this paper, we set M l as the retransmission limit of A C 1 , which means that W 1 , j = C W 1 , m a x + 1 when M j M l . Once j > M l , the packet will be dropped.

3.2. Scenario Description

As shown in Figure 2, we focus on the performance of IEEE 802.11p in the scenario of IoV on highway. A vehicle moving on highway can broadcast packets to other vehicles in its transmission coverage. When other vehicles outside its coverage broadcast packets to the same receivers, the hidden terminal problem happens. In this paper, we ignore the impact of vehicle mobility on communication links and network topologies. According to research in [28], when the speed reaches 120 mile/h, the link outage probability is almost zero. Therefore, the vehicle can be regarded as steady state in one packet transmission duration. In other words, the characteristics of vehicle mobility such as speed and inter-vehicle spacing can be ignored in one packet transmission duration. In addition, vehicles can obtain traffic density from roadside units through Vehicle to Infrastructure (V2I) communications. Thus, considering the situation of one-hop communications, we have
N c s = N v L l a n e × N l a n e × ρ d ,
where N c s represents the number of vehicles in the target vehicle’s transmission coverage; N v represents the maximum number of vehicles in the system; L l a n e represents the length of the road; N l a n e represents the number of lanes in the system, and ρ d represents the vehicle density in the system.
In this paper, the packet arrival rate of emergency messages in the A C 0 queue is denoted as λ 0 while the packet arrival rate of periodical routine messages in the A C 1 queue is λ 1 . We consider that λ 0 follows the Poisson distribution [37]. Thus, we have
p a 0 = k = 1 ( λ 0 σ ) k k ! e λ 0 σ = 1 e λ 0 σ , p a 1 = λ 1 σ ,
where p a i represents the packet arrival probability of A C i .

4. Analytical Model for Continuous Backoff Freezing

In this section, we will analyze in detail the performance of the IEEE 802.11p EDCA mechanism when considering continuous backoff freezing. The packet processing in the MAC layer consists of two parts: queuing process and service process. In other words, the packet delay consists of both queuing time and service time. The duration of queuing process is the time from a packet arriving in the queue to the packet being the head of the queue. The duration of service process is the time from the packet being the head of the queue to a successful transmission or being discarded, which is called MAC access delay. Here, MAC access delay is defined as
1 μ i = ρ i λ i ,
where we denote μ i as the service rate of A C i and ρ i as the utilization of A C i .
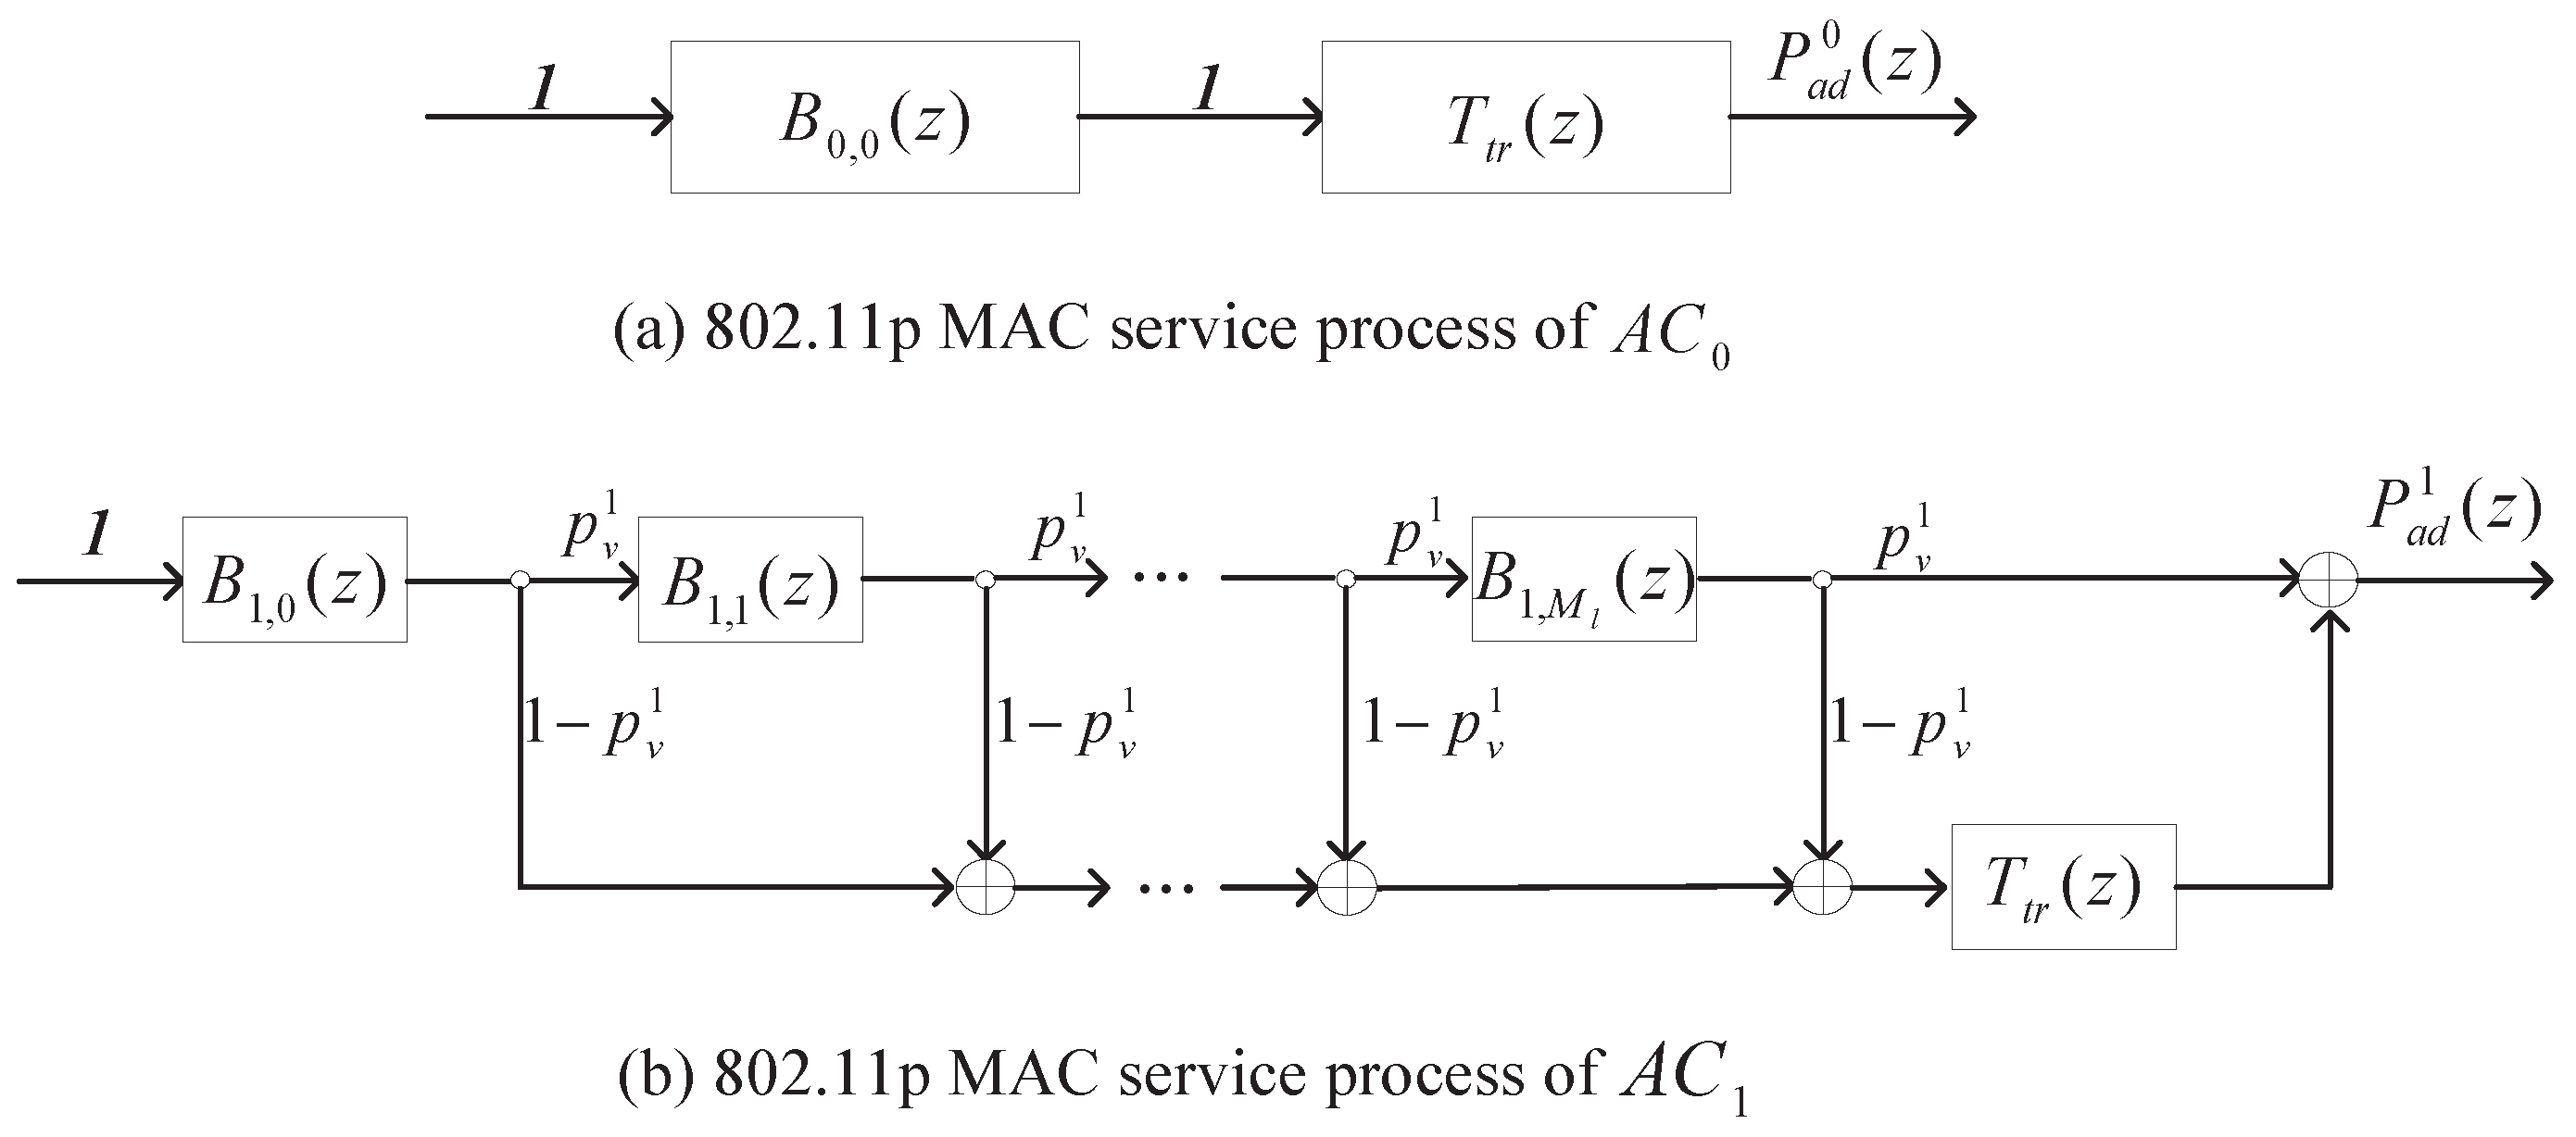
The MAC access delay is composed of backoff time and transmission time. Since the MAC service process can be seen as a Z-transmission domain linear system, we employ the probability generating function (PGF) to calculate the MAC access delay, similarly to [28]. As shown in Figure 3, we denote P ad i ( z ) as the PGF of MAC access delay in A C i . Note that P ad i ( z ) consists of the backoff time at stage j B i , j ( z ) and the transmission time T t r ( z ) . In particular, for A C 0 , the backoff stage j is only equal to 0, and thus the PGF of the transmission time T t r ( z ) can be expressed as
T t r ( z ) = z T t r .
In this paper, we assume that all packets have the same size E [ P ] . Thus, the transmission time can be calculated as
T t r = P H Y H R b + M A C H + E [ P ] R d + δ ,
where P H Y H is the header length in physical layer; M A C H is the header length in MAC layer; R b is the basic rate; R d is the data rate, and δ is the propagation delay.
From Figure 3, we can apply Mason formula to derive P ad i ( z ) of A C i as follows:
P ad 0 ( z ) = B 0 , 0 ( z ) T t r ( z ) , P ad 1 ( z ) = ( 1 p v 1 ) T t r ( z ) n = 0 M l ( p v 1 ) n j = 0 n B 1 , j ( z ) + ( p v 1 ) M l + 1 j = 0 M l B 1 , j ( z ) ,
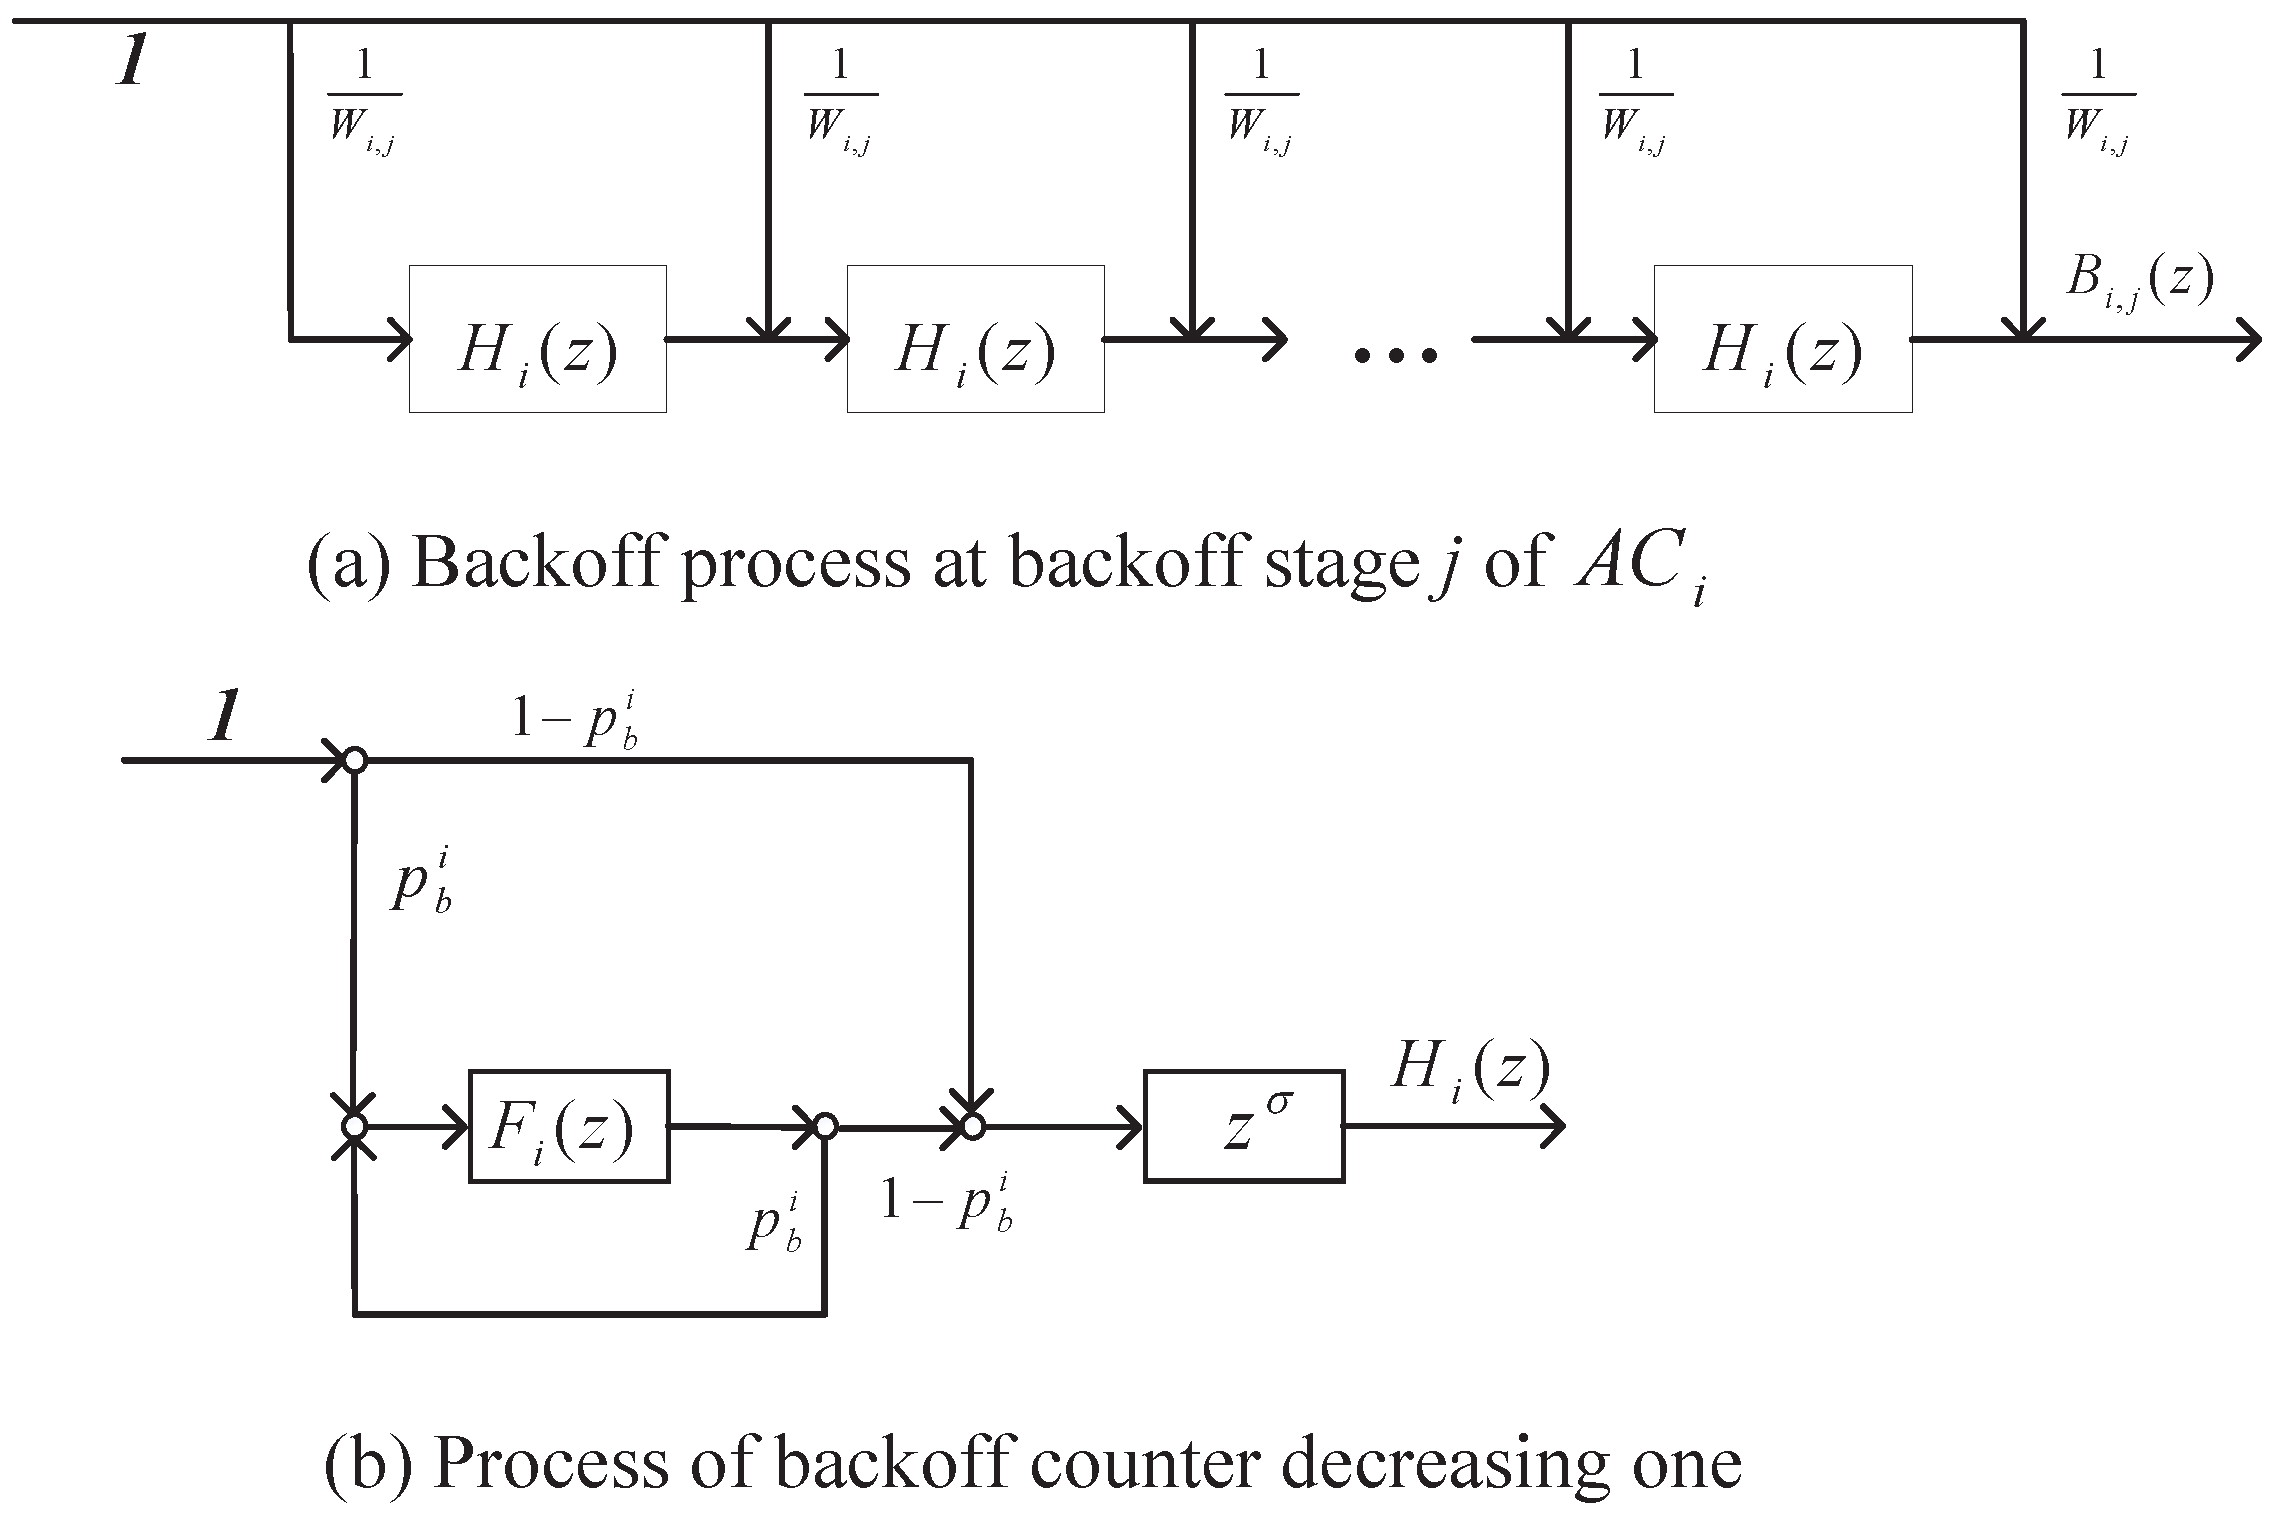
where p v 1 represents the internal collision probability of A C 1 , and B i , j ( z ) of A C i can be derived from Figure 4 through the Mason formula when continuous backoff counter freezing is considered. We denote H i ( z ) as the total time that the backoff counter costs to be decreased by one, i.e., the time that backoff counter is frozen F i ( z ) and one slot time σ that the backoff counter needs to decrease by one. Once a packet of other nodes or other A C s with higher priorities in the same node are being transmitted, the backoff counter freezing occurs and keeps a duration of T t r + A I F S i . The probability that the backoff counter of A C i is frozen is denoted as p b i . Thus, we have
F i ( z ) = z T t r + A I F S i .
Then, the PGF H i ( z ) can be obtained according to the Mason formula [39] as follows:
P = 1 Δ k = 1 N p k Δ k ,
where N represents the total number of forward paths; p k represents the gain of the kth forward path; Δ represents the system characteristic equation, and Δ k represents the cofactor of the kth forward path. From Figure 4b, we can obtain these parameters as follows:
N = 2 , p 1 = ( 1 p b i ) z σ , p 2 = p b i F i ( z ) ( 1 p b i ) z σ , Δ = 1 p b i F i ( z ) , Δ 1 = 1 p b i F i ( z ) , Δ 2 = 1 .
Thus, we can derive H i ( z ) according to Equation (11) as follows:
H i ( z ) = 1 1 p b i F i ( z ) ( 1 p b i ) z σ [ 1 p b i F i ( z ) ] + p b i F i ( z ) ( 1 p b i ) z σ = ( 1 p b i ) z σ 1 p b i F i ( z ) .
From Figure 4a, we can obtain B i , j ( z ) according to the Mason formula similarly as follows:
B i , j ( z ) = 1 W 0 , 0 k = 0 W 0 , 0 1 H 0 ( z ) k , i = 0 , 1 W 1 , j k = 0 W 1 , j 1 H 1 ( z ) k , i = 1 , j [ 0 , M 1 ] , 1 W 1 , M k = 0 W 1 , M 1 H 1 ( z ) k , i = 1 , j [ M , M l ] .
Substituting (13) into (12) and (14) into (9), we can find that P ad 0 ( z ) is related to p b 0 , and P ad 1 ( z ) is related to p b 1 and p v 1 .
p b i is the backoff freezing probability of A C i , (i.e., p b i is equal to the probability that the channel is detected as busy for A C i ). Thus, for A C 0 , p b 0 is the probability that the channel is detected as busy in the time slot following A I F S 0 . For A C 1 , A C 1 needs to wait for A d more slots than A C 0 to check the channel as shown in Figure 1. Therefore, we have
p b 0 = 1 ( 1 τ 0 ) N c s 1 ( 1 τ 1 ) N c s , p b 1 = 1 [ ( 1 τ 0 ) N c s ( 1 τ 1 ) N c s 1 ] A d + 1 ,
where N c s represents the number of vehicles in the transmission coverage of the target vehicle as shown in Figure 2. τ i represents the transmission probability of A C i , which can be derived as [19]
τ 0 = W 0 + 1 2 1 p b 0 + 1 ρ 0 p a 0 1 τ 1 = 1 τ 0 M l + 1 1 τ 0 1 τ 0 M l + 1 1 τ 0 + W 1 , 0 1 2 1 p b 1 + W 1 , 0 τ 0 1 2 τ 0 M 1 p b 1 1 2 τ 0 + 2 M 1 W 1 , 0 τ 0 M + 1 ( 1 τ 0 M l M ) 1 p b 1 1 τ 0 + 1 ρ 1 p a 1 1 .
In particular, when A C 0 and A C 1 in the same node transmit simultaneously, A C 0 will successfully transmit the packet, while a collision will occur in A C 1 . In other words, the internal collision probability of A C 1 p v 1 is equal to τ 0 .
According to (15) and (16), p b 0 , p b 1 , and p v 1 can be calculated by initializing the value of ρ i . Then, according to (9), (13), and (14), substituting p b 0 , p b 1 and p v 1 into (9), P ad i ( z ) of A C i can be obtained.
Note that the mean of the MAC access delay T a d is calculated as
T a d i = 1 μ i = d P a d i ( z ) d z z = 1 , i = 0 , 1 ,
and the variance of the MAC access delay D a d i is calculated as
D a d i = d 2 P a d i ( z ) d z 2 + d P a d i ( z ) d z ( d P a d i ( z ) d z ) 2 z = 1 , i = 0 , 1 .
Substituting the calculated value of 1 μ i into (6), we can derive a new value of ρ i . We then check the difference between the updated value of ρ i and the initial value. If the difference is smaller than the predefined error bound ε , we assume the corresponding desirable MAC access delay is achieved. Otherwise, the current ρ i becomes an initial value, and we will repeat the above iteration until the difference of ρ i satisfies the predefined error bound ε .
In this way, we have derived the mean of the MAC access delay T a d i and the variance of the MAC access delay D a d i . As mentioned at the beginning of Section 4, the packet delay consists of queuing time and service time. We have already obtained the mean value of service time T a d i . To derive the whole packet delay, we then calculate the queuing time.
In this paper, the packet arrival rate λ 0 of A C 0 follows Poisson distribution, while packets arrive at A C 1 periodically with the arrival rate λ 1 . Thus, we can model A C 0 queue as an M / G / 1 queue, and A C 1 queue as an D / G / 1 queue [29].
For an M / G / 1 queue, we can derive the average number of packets in A C 0 queue according to the Pollaczek–Khintchine (P–K) formula [40]:
N q 0 = ρ 0 + ρ 0 2 ( 1 + c 0 2 ) 2 ( 1 ρ 0 ) ,
where c 0 2 = D a d 0 ( T a d 0 ) 2 is the squared coefficient variation of 1/μ0.
For a D / G / 1 queue, since it is challenging to derive the closed-form solution of the average number of packets, we employ the Kramer and Lagbenbach–Belz (KLB) formula [41] to obtain N q 1 approximately:
N q 1 ρ 1 + ρ 1 2 c 1 2 e 2 ( 1 ρ 1 ) 3 ρ 1 c 1 2 2 ( 1 ρ 1 ) ,
where c 1 2 = D a d 1 ( T a d 1 ) 2 is the squared coefficient variation of 1/μ1, similarly.
Finally, the packet delay of A C i can be derived as
P D i = N q i λ i , i = 0 , 1 .
In order to ensure that packets can be completely broadcast within the packet delay, the 802.11p protocols also have strict requirements on packet delivery ratio (PDR). Similar to [38], P D R i in this paper can be calculated as
P D R 0 = i = 0 ( 1 τ 0 τ 1 ) ( N c s 1 ) i i ! e ( N c s 1 ) = e ( N c s 1 ) ( τ 0 + τ 1 ) , P D R 1 = i = 0 ( 1 τ 1 ) ( N c s 1 ) i i ! e ( N c s 1 ) = e ( N c s 1 ) τ 1 .

5. Simulation Results

In this section, we have employed the simulation based on the environment of MATLAB (R2014b-academic use, 64 bit, MathWorks, Natick, MA, USA) to validate the performance of our proposed model. For comparison, we have selected the model proposed by Yao et al. as a baseline, where the continuous backoff freezing is not taken into account. In order to fit the reality scene, we first model a highway scenario with four two-way lanes. We then set 2000 m as the length of each lane and 200 as the maximum number of vehicles of the system. Next, we randomly distribute vehicles at different densities on four 2000-meter-long lanes according to (4). In order to verify the correctness of our model, the simulation parameters are set to be consistent with [28]. The detailed parameter values can be found in Table 3.
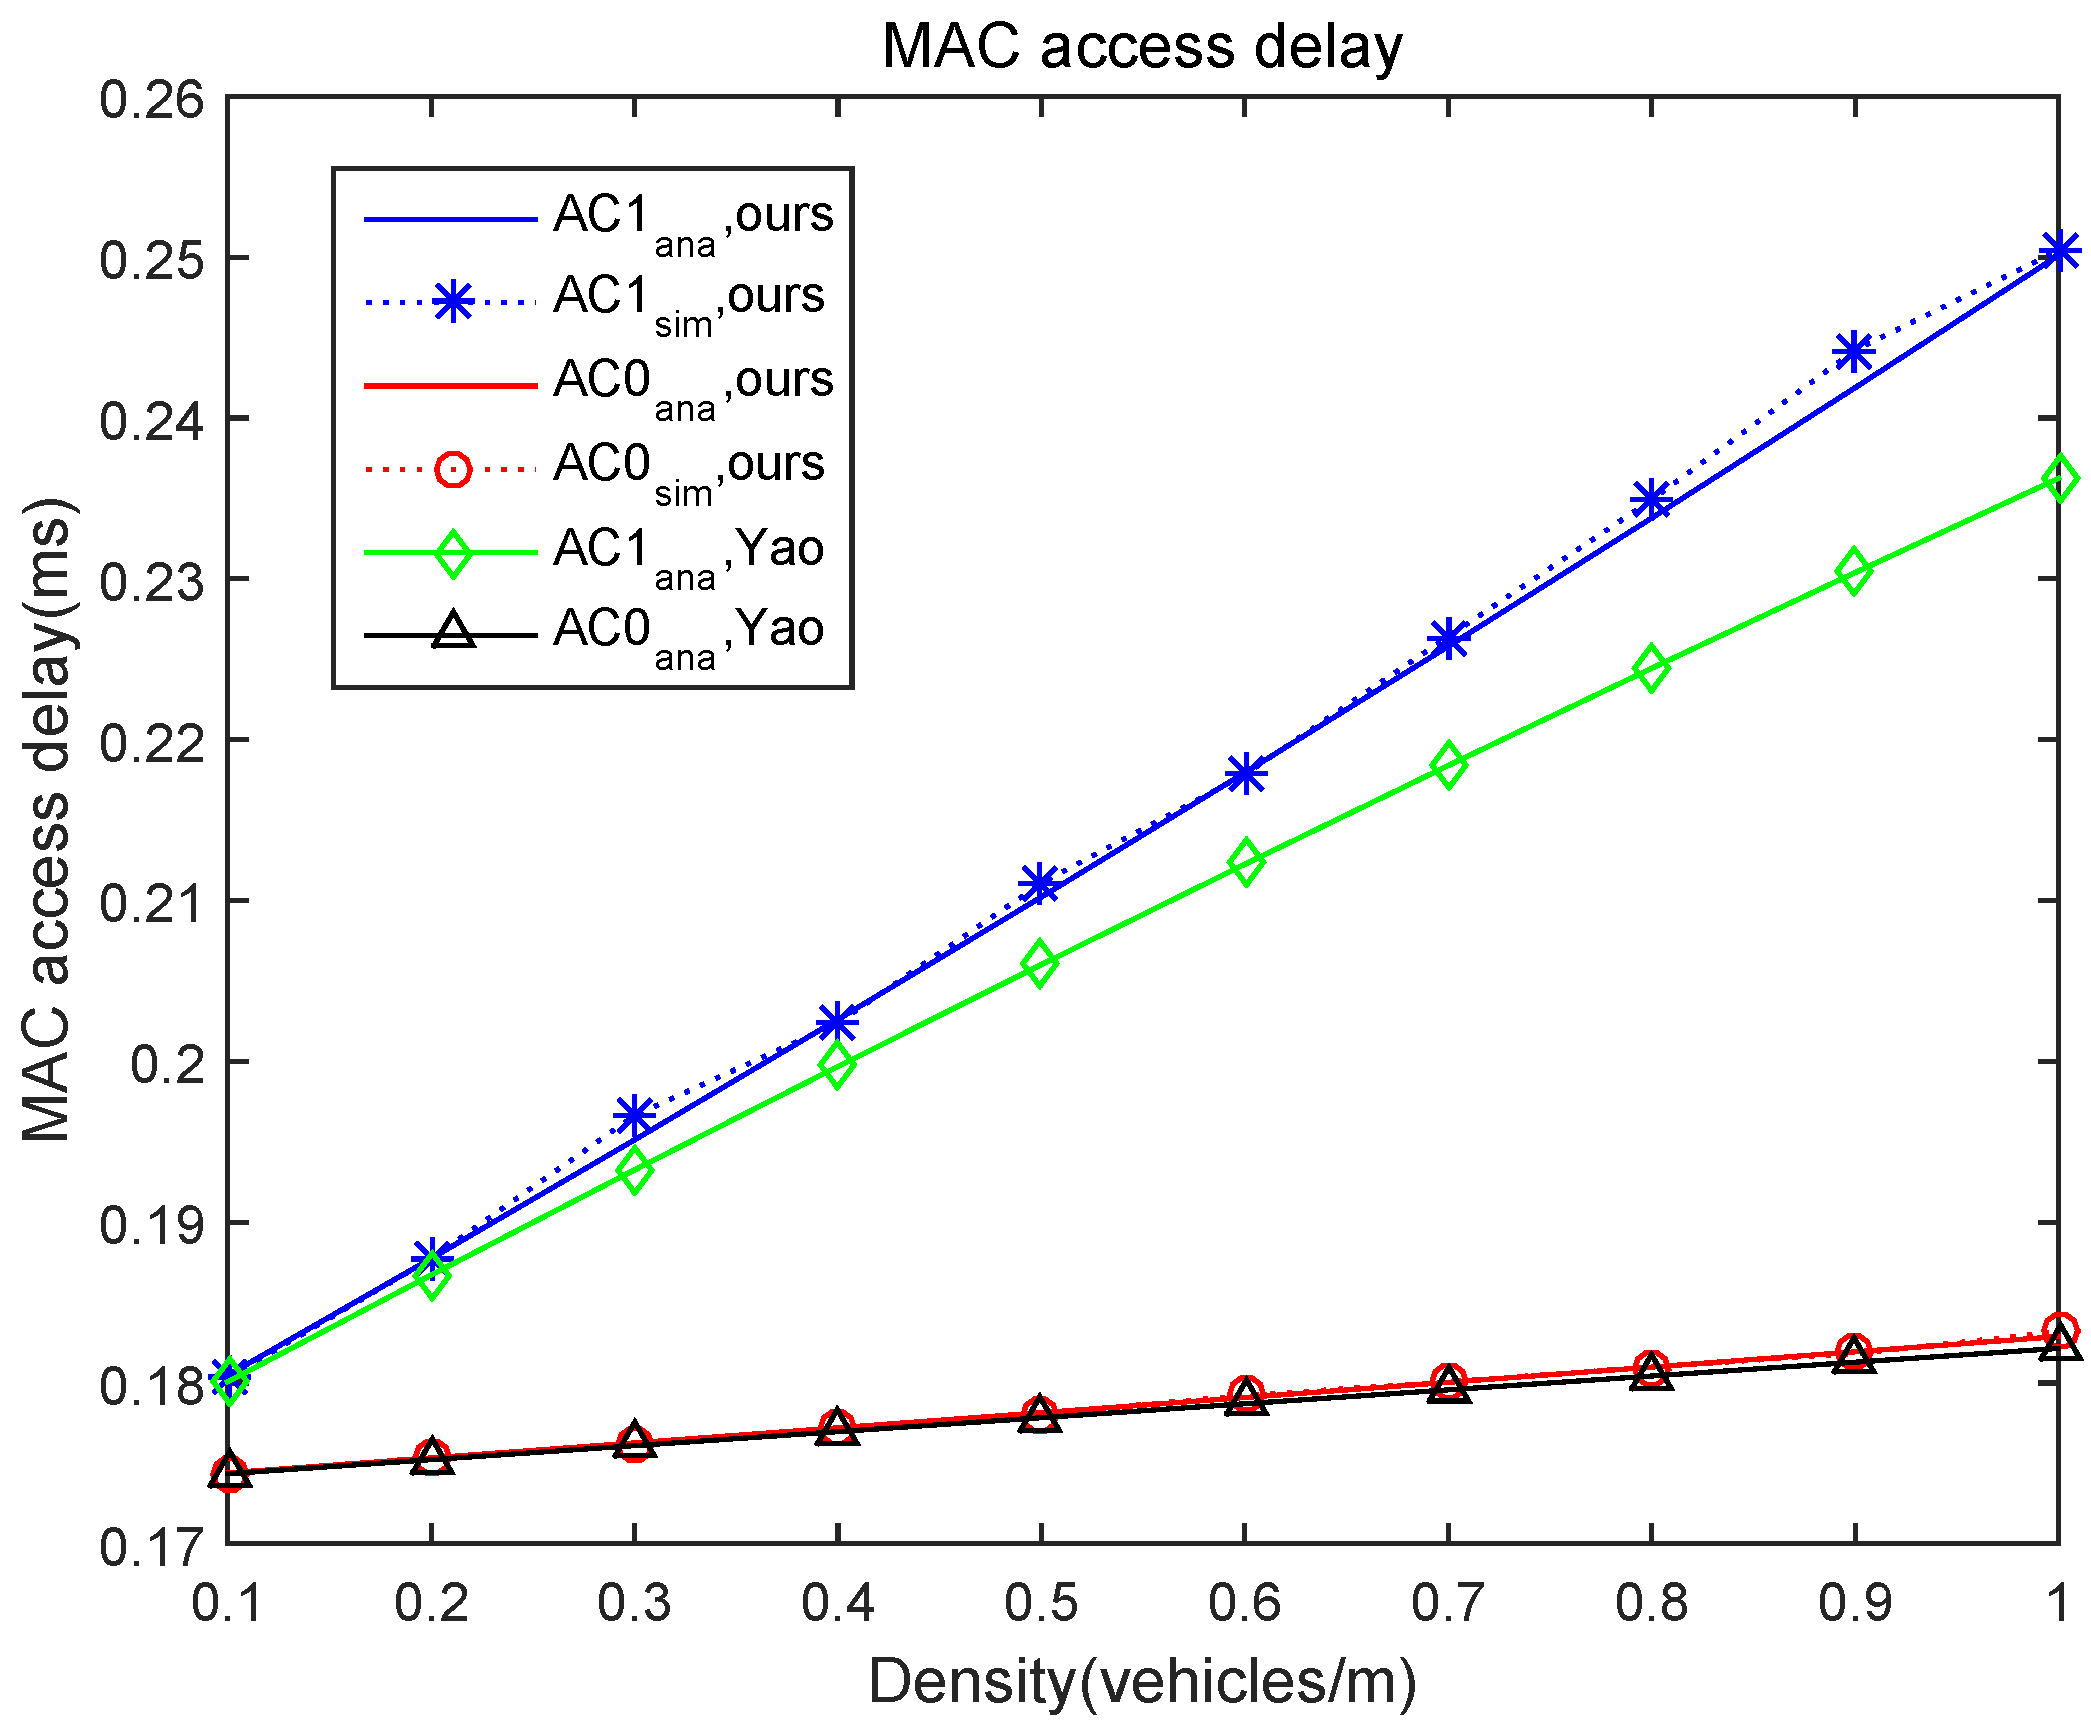
Figure 5 shows the mean MAC access delay as the vehicle density changes. It can be seen that A C 1 has a larger MAC access delay than A C 0 for both the proposed model and Yao et al.’s model. As A C 0 has a higher priority than A C 1 , its collision probability is lower than that of A C 1 queue, and thus incurs a lower MAC access delay of A C 0 as compared to A C 1 . As the density of vehicles increases, the MAC access delay of both queues increases. This is because, when the number of vehicles participating in the V2V communications increases, the collision probability in both queues will also increase, thus deteriorating the packet delay. Comparing our model with Yao et al.’s model, we can find that the MAC access delay of our model is slightly higher than their model. This is because our model considers the continuous backoff freezing, which means that our model will take into account more time for backoff freezing. The trend of the mean MAC access delay is consistent with (17).
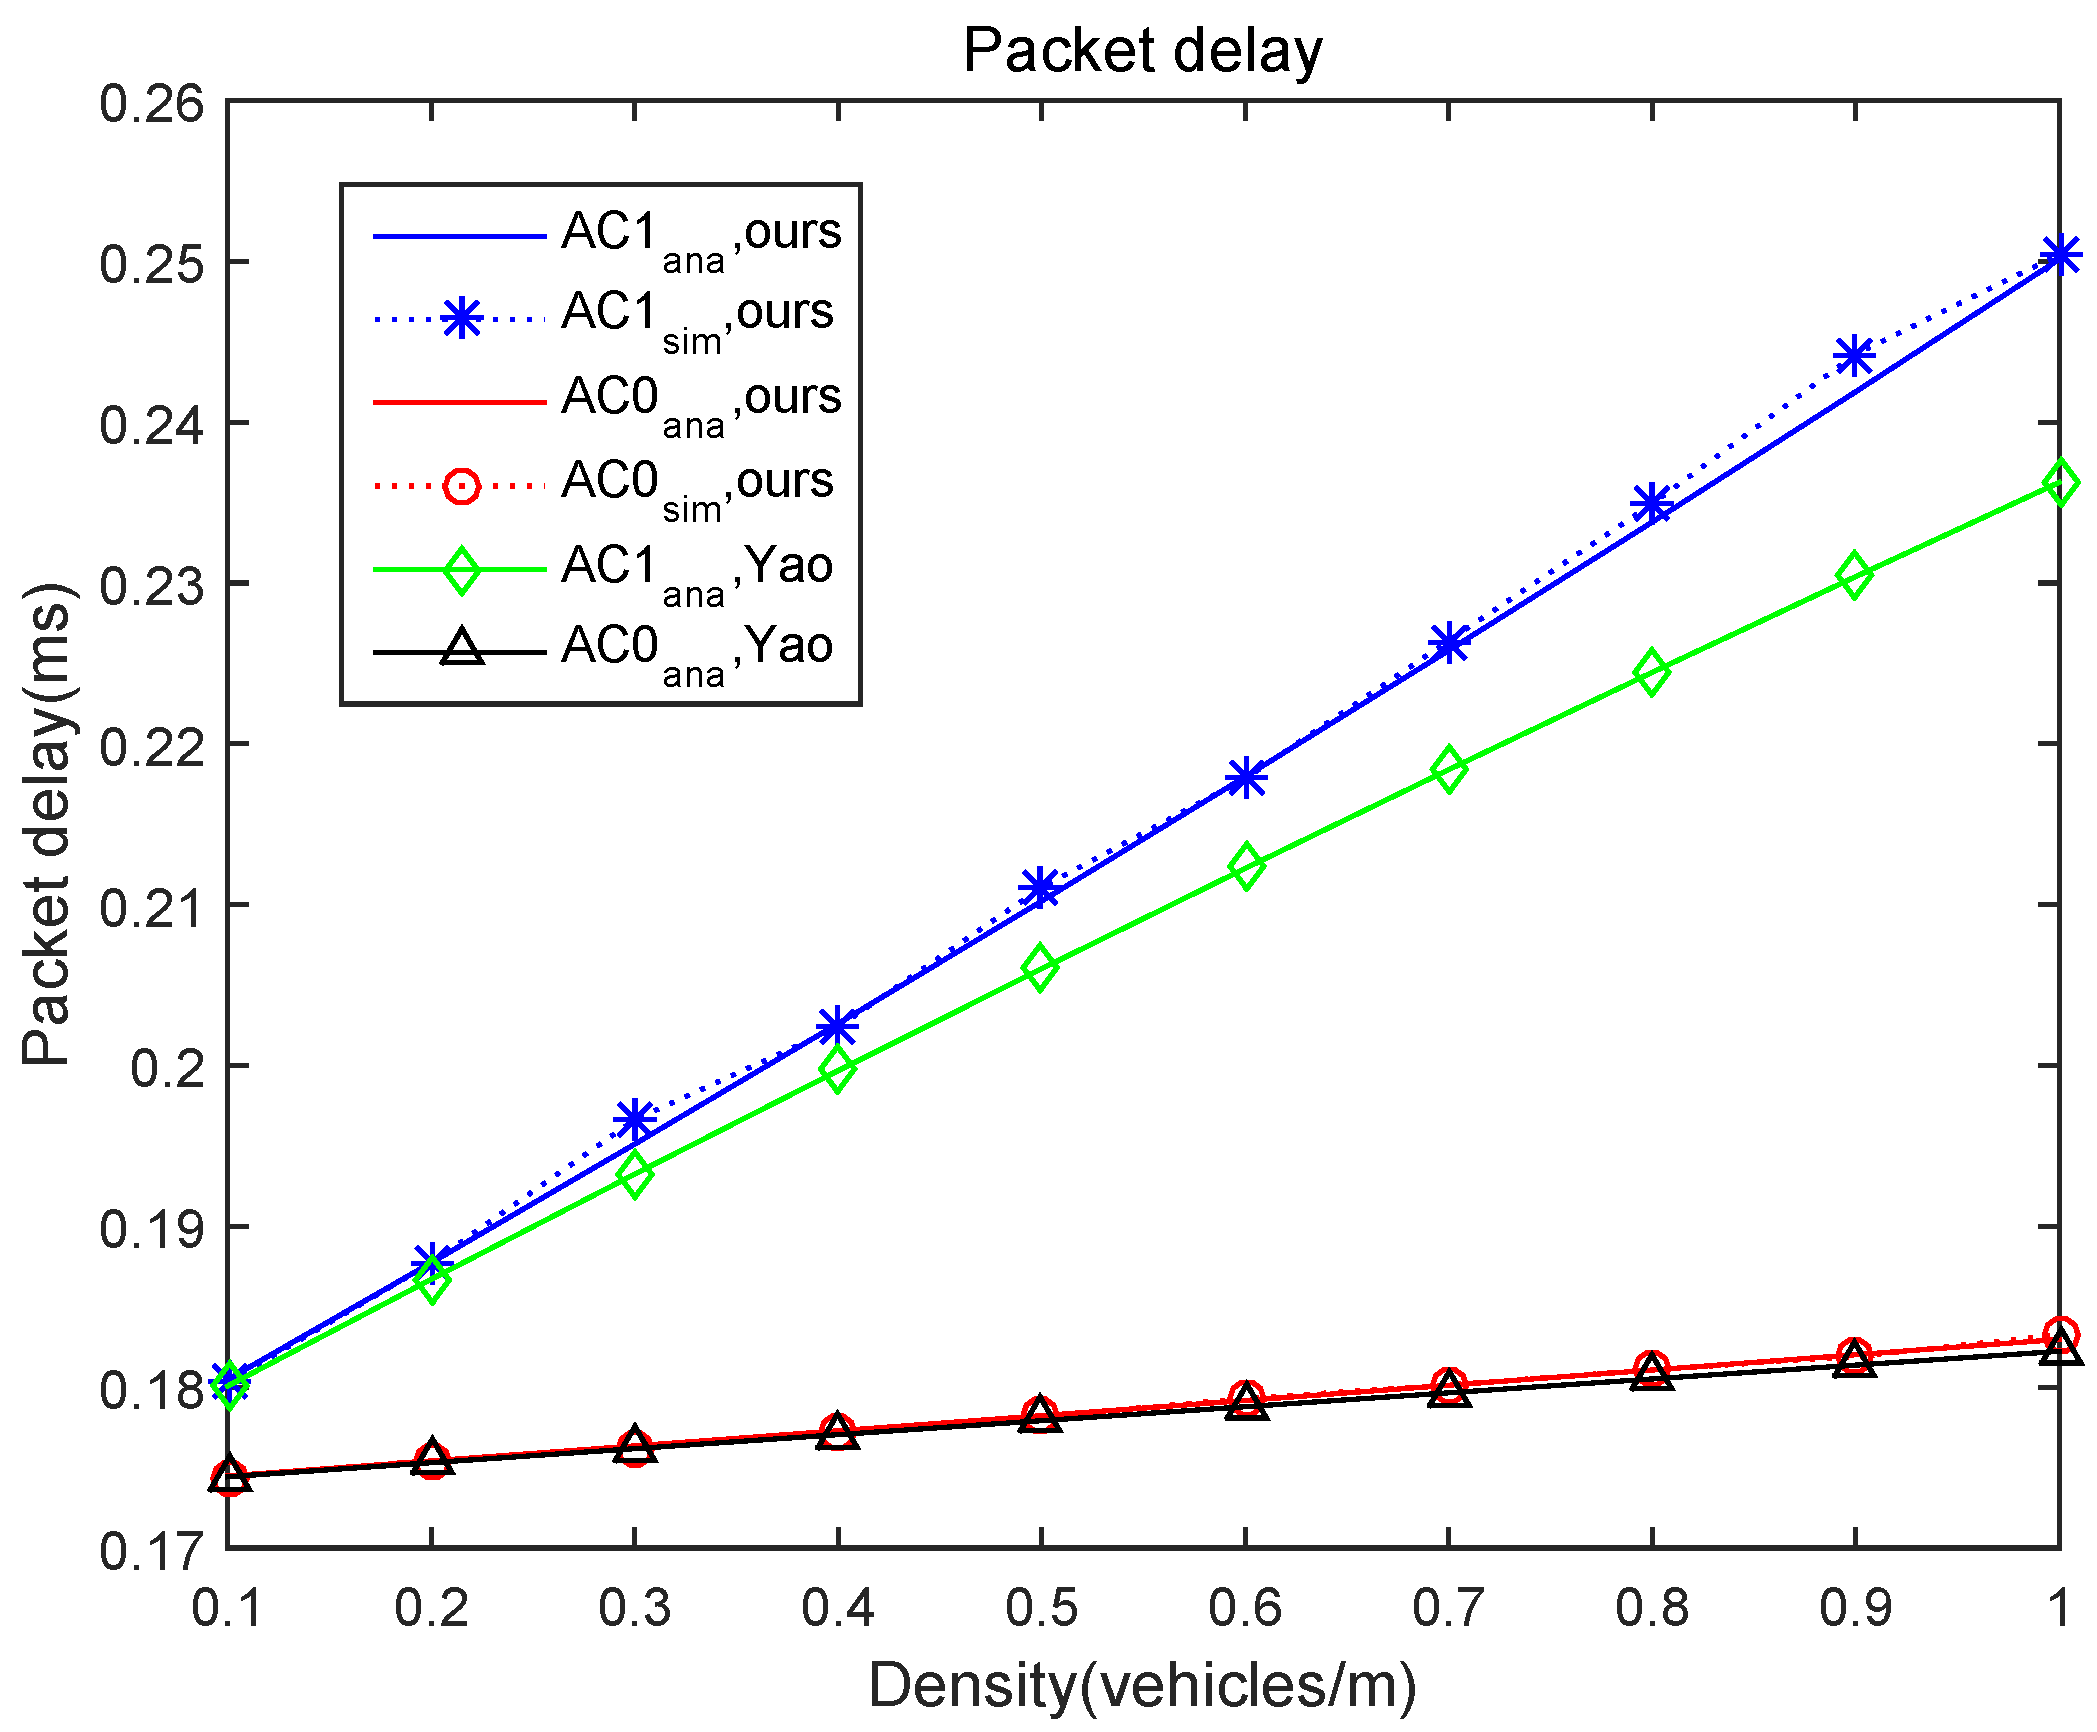
Figure 6 shows the performance of the packet delay as the vehicle density changes. Compared with Figure 5, we can find that the packet delay is only about 0.00005 ms higher than the MAC access delay. As mentioned in Section 4, the packet delay contains two parts, queuing time and service time. In this paper, service time is much larger than queuing time, and thus the increment of the packet delay is less obvious than that of MAC access delay. In addition, the trend of packet delay in each A C queue is consistent with that of MAC access delay, and the maximum packet delay is far less than 100 ms specified by the IEEE 802.11p standard. Therefore, the validation and correctness of our proposed model for continuous backoff freezing are verified.
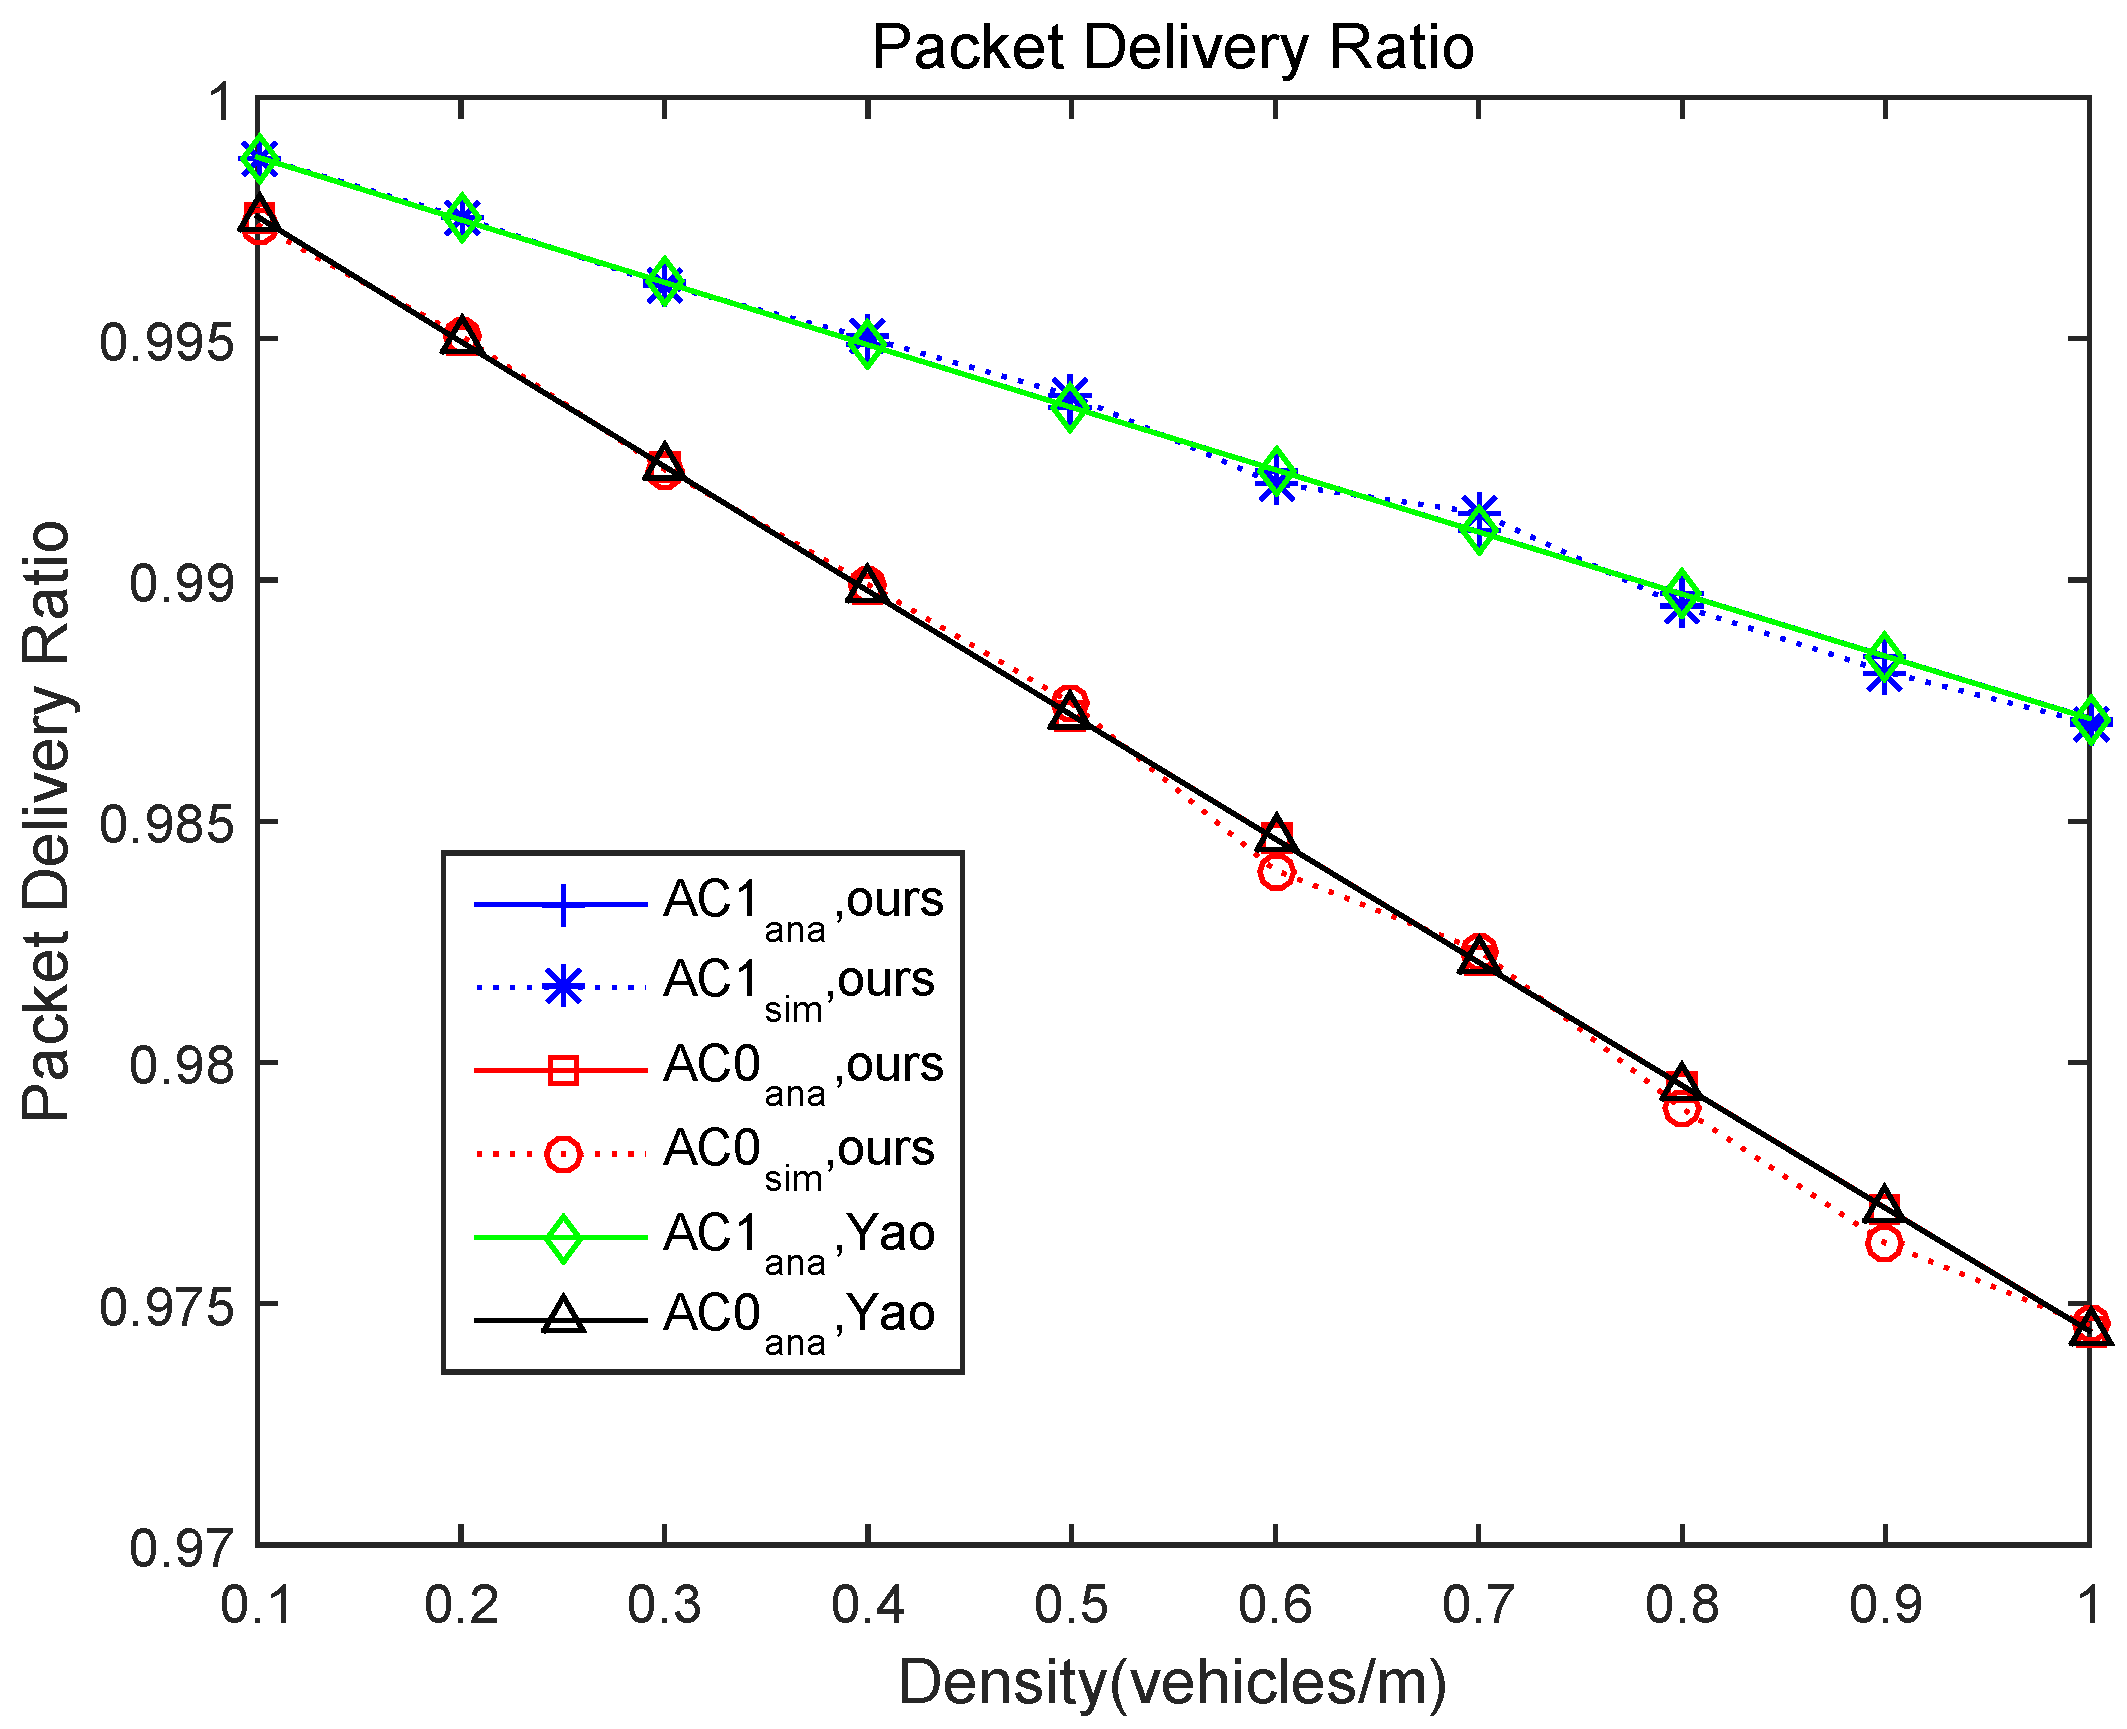
Figure 7 shows the performance of the packet delivery ratio as the vehicle density changes. It can be seen that, with the vehicle density increasing, the number of vehicles in the target vehicle’s transmission coverage increases, resulting in the collision probability increasing and thus the packet delivery ratio decreasing. Note that, even when the vehicle density reaches the highest point, the packet delivery ratio still exceeds 0.97, which ensures that both emergency messages and routine messages can be completely transmitted.

6. Conclusions

In this paper, we focused on the performance analysis of IEEE 802.11p for continuous backoff freezing. We established an analytical model to analyze the broadcast performance and utilized the probability generating function (PGF) to transform traditional Markov chains into z domain under the situation of non-saturation. The performance of packet delay was derived by applying the Mason formula. Compared with the existing models without considering the continuous backoff freezing, the simulation results show that our analytical model is more reasonable. This is because, although the packet delay is increased after considering the continuous backoff freezing, the packet delay is still much lower than the communication delay 100 ms specified by the 802.11p protocols. In addition, the packet delivery ratio is hardly reduced after considering the continuous backoff freezing.

Author Contributions

Conceptualization, Q.W. and S.X.; Methodology, Q.W. and S.X.; Software, S.X.; Writing—Original Draft Preparation, S.X.; Writing—Review and Editing, Q.F. and Z.L.

Funding

This work was supported by the National Natural Science Foundation of China under Grant Nos. 61701197 and 61571108, the Project funded by China Postdoctoral Science Foundation under Grant No. 2018M641354 and 2019M650677, the 111 Project under Grant No. B12018 and the Wuxi Science and Technology Development Fund under Grant No. H20191001.

Conflicts of Interest

The authors declare no conflict of interest.

References

  1. Wu, Q.; Liu, H.; Zhang, C.; Fan, Q.; Li, Z.; Wang, K. Trajectory Protection Schemes Based on a Gravity Mobility Model in IoT. Electronics 2019, 8, 148. [Google Scholar] [CrossRef]
  2. Bu, Z.; Li, H.; Zhang, C.; Cao, J.; Li, A.; Shi, Y. Graph K-means based on Leader Identification, Dynamic Game and Opinion Dynamics. IEEE Trans. Knowl. Data Eng. 2019. [Google Scholar] [CrossRef]
  3. Cao, J.; Bu, Z.; Wang, Y.; Yang, H.; Jiang, J.; Li, H. Detecting Prosumer-Community Groups in Smart Grids From the Multiagent Perspective. IEEE Trans. Syst. Man Cybern. Syst. 2019, 49, 1652–1664. [Google Scholar] [CrossRef]
  4. Fan, Q.; Ansari, N. Towards Traffic Load Balancing in Drone-Assisted Communications for IoT. IEEE IoT-J. 2019, 6, 3633–3640. [Google Scholar] [CrossRef]
  5. Wu, Q.; Zhang, H.; Li, Z.; Liu, Y.; Zhang, C. Performance Evaluation of the V2I Fair Access with a Finite Retry Limit. EURASIP J. Wirel. Commun. Netw. 2018, 2018, 20. [Google Scholar] [CrossRef]
  6. Wu, Q.; Nie, S.; Fan, P.; Liu, H.; Fan, Q.; Li, Z. A Swarming Approach to Optimize the One-Hop Delay in Smart Driving Inter-Platoon Communications. Sensors 2018, 18, 3307. [Google Scholar] [CrossRef]
  7. Xu, W.; Zhou, H.; Cheng, N.; Lyu, F.; Shi, W.; Chen, J.; Shen, X. Internet of vehicles in big data era. IEEE/CAA J. Autom. Sin. 2018, 5, 19–35. [Google Scholar] [CrossRef]
  8. Cao, J.; Wu, Z.; Wu, J.; Xiong, H. SAIL: Summation-bAsed Incremental Learning for Information-Theoretic Text Clustering. IEEE Trans. Cybern. 2013, 43, 570–584. [Google Scholar] [CrossRef]
  9. Lyu, F.; Cheng, N.; Zhu, H.; Zhou, H.; Xu, W.; Li, M.; Shen, X. Intelligent Context-Aware Communication Paradigm Design for IoVs Based on Data Analytics. IEEE Netw. 2018, 32, 74–82. [Google Scholar] [CrossRef]
  10. Fan, Q.; Ansari, N. Workload Allocation in Hierarchical Cloudlet Networks. IEEE Commun. Lett. 2018, 22, 820–823. [Google Scholar] [CrossRef]
  11. Fan, Q.; Ansari, N. Application Aware Workload Allocation for Edge Computing-Based IoT. IEEE IoT-J. 2018, 5, 2146–2153. [Google Scholar] [CrossRef]
  12. Seif, H.G.; Hu, X. Autonomous Driving in the iCity-HD Maps as a Key Challenge of the Automotive Industry. Engineering 2016, 2, 159–162. [Google Scholar] [CrossRef]
  13. Xiong, K.; Chen, C.; Qu, G.; Fan, P.; Letaief, K. Group Cooperation with Optimal Resource Allocation in Wireless Powered Communication Networks. IEEE Trans. Wirel. Commun. 2017, 16, 3840–3853. [Google Scholar] [CrossRef]
  14. Lu, Y.; Xiong, K.; Fan, P.; Zhong, Z.; Letaief, K. Robust Transmit Beamforming With Artificial Redundant Signals for Secure SWIPT System Under Non-Linear EH Model. IEEE Trans. Wirel. Commun. 2018, 17, 2218–2232. [Google Scholar] [CrossRef]
  15. Xiong, K.; Zhang, Y.; Fan, P.; Yang, H.; Zhou, X. Mobile Service Amount Based Link Scheduling for High-Mobility Cooperative Vehicular Networks. IEEE Trans. Veh. Technol. 2017, 66, 9521–9533. [Google Scholar] [CrossRef]
  16. Xiong, K.; Wang, B.; Jiang, C.; Liu, K. A Broad Beamforming Approach for High-Mobility Communications. IEEE Trans. Veh. Technol. 2017, 66, 10546–10550. [Google Scholar] [CrossRef]
  17. Xiong, K.; Fan, P.; Zhang, Y.; Letaief, K. Towards 5G High Mobility: A Fairness-Adjustable Time-Domain Power Allocation Approach. IEEE Access 2017, 5, 11817–11831. [Google Scholar] [CrossRef]
  18. Li, T.; Xiong, K.; Fan, P.; Letaief, K. Service-oriented power allocation for high-speed railway wireless communications. IEEE Access 2017, 5, 8343–8356. [Google Scholar] [CrossRef]
  19. Yao, Y.; Rao, L.; Liu, X.; Zhou, X. Delay analysis and study of IEEE 802.11p based DSRC safety communication in a highway environment. In Proceedings of the 2013 IEEE INFOCOM, Turin, Italy, 14–19 April 2013. [Google Scholar]
  20. Awad, M.; Seddik, K.; Elezabi, A. Low-Complexity Semi-Blind Channel Estimation Algorithms for Vehicular Communications Using the IEEE 802.11p Standard. IEEE Trans. Intell. Transp. Syst. 2019, 20, 1739–1748. [Google Scholar] [CrossRef]
  21. Shah, A.; Ilhan, H.; Tureli, U. RECV-MAC: A novel reliable and efficient cooperative MAC protocol for VANETs. IET Commun. 2019, 13, 2541–2549. [Google Scholar] [CrossRef]
  22. Wu, Q.; Liu, H.; Wang, R.; Fan, P.; Fan, Q.; Li, Z. Delay Sensitive Task Offloading in the 802.11p Based Vehicular Fog Computing Systems. IEEE IoT-J. 2019. [Google Scholar] [CrossRef]
  23. Nguyen, V.; Khanh, T.; Oo, T.; Tran, N.; Huh, E.; Hong, C. A Cooperative and Reliable RSU-Assisted IEEE 802.11P-Based Multi-Channel MAC Protocol for VANETs. IEEE Access 2019, 7, 107576–107590. [Google Scholar] [CrossRef]
  24. IEEE Standard for Information Technology– Local and Metropolitan Area Networks—Specific Requirements—Part 11: Wireless LAN Medium Access Control (MAC) and Physical Layer (PHY) Specifications Amendment 6: Wireless Access in Vehicular Environments; 2010. Available online: https://ieeexplore.ieee.org/document/5514475?section=abstract (accessed on 20 November 2019).
  25. Wu, Q.; Zheng, J. Performance Modeling and Analysis of IEEE 802.11 DCF Based Fair Channel Access for Vehicle-to-Roadside Communication in a Non-Saturated State. Wirel. Netw. 2015, 21, 1–11. [Google Scholar] [CrossRef]
  26. Wu, Q.; Zheng, J. Performance Modeling and Analysis of the ADHOC MAC Protocol for Vehicular Networks. Wirel. Netw. 2016, 22, 799–812. [Google Scholar] [CrossRef]
  27. Zheng, J.; Wu, Q. Performance modeling and analysis of the IEEE 802.11p EDCA mechanism for VANET. IEEE Trans. Veh. Technol. 2015, 65, 2673–2687. [Google Scholar] [CrossRef]
  28. Yao, Y.; Rao, L.; Liu, X. Performance and Reliability Analysis of IEEE 802.11p Safety Communication in a Highway Environment. IEEE Trans. Veh. Technol. 2013, 62, 4198–4212. [Google Scholar] [CrossRef]
  29. Xu, K.; Tipper, D.; Qian, Y.; Krishnamurthy, P. Time-Dependent Performance Analysis of IEEE 802.11p Vehicular Networks. IEEE Trans. Veh. Technol. 2016, 65, 5637–5651. [Google Scholar] [CrossRef]
  30. Shmerling, E. Algorithms for generating random variables with a rational probability-generating function. Int. J. Comput. Math. 2015, 92, 2001–2010. [Google Scholar] [CrossRef]
  31. Li, B.; Sutton, G.; Hu, B.; Liu, R.; Chen, S. Modeling and QoS analysis of the IEEE 802.11p broadcast scheme in vehicular ad hoc networks. J. Commun. Netw. 2017, 19, 169–179. [Google Scholar] [CrossRef]
  32. Peng, H.; Li, D.; Abboud, K.; Zhou, H.; Zhao, H.; Zhuang, W.; Shen, X. Performance analysis of IEEE 802.11p DCF for multiplatooning communications with autonomous vehicles. IEEE Trans. Veh. Technol. 2017, 66, 2485–2498. [Google Scholar] [CrossRef]
  33. Bazzi, A.; Masini, B.; Zanella, A.; Thibault, I. On the Performance of IEEE 802.11p and LTE-V2V for the Cooperative Awareness of Connected Vehicles. IEEE Trans. Veh. Technol. 2017, 66, 10419–10432. [Google Scholar] [CrossRef]
  34. Yang, Y.; Fei, D.; Dang, S. Inter-vehicle cooperation channel estimation for IEEE 802.11p V2I communications. J. Commun. Netw. 2017, 19, 227–238. [Google Scholar] [CrossRef]
  35. Qiu, H.J.F.; Ho, I.; Tse, C.K.; Xie, Y. A Methodology for Studying 802.11p VANET Broadcasting Performance With Practical Vehicle Distribution. IEEE Trans. Veh. Technol. 2015, 64, 4756–4769. [Google Scholar] [CrossRef]
  36. Noor-A-Rahim, M.; Ali, G.M.; Nguyen, H.; Guan, Y.L. Performance Analysis of IEEE 802.11p Safety Message Broadcast With and Without Relaying at Road Intersection. IEEE Access 2018, 6, 23786–23799. [Google Scholar] [CrossRef]
  37. Wu, Q.; Xia, S.; Fan, P.; Fan, Q.; Li, Z. Velocity-Adaptive V2I Fair-Access Scheme Based on IEEE 802.11 DCF for Platooning Vehicles. Sensors 2018, 18, 4198. [Google Scholar] [CrossRef] [Green Version]
  38. Wang, P.; Wang, F.; Ji, Y.; Liu, F.; Wang, X. Performance analysis of EDCA with strict priorities broadcast in IEEE802.11p VANETs. In Proceedings of the 2014 International Conference on Computing, Networking and Communications (ICNC), Honolulu, HI, USA, 3–6 February 2014. [Google Scholar] [CrossRef]
  39. Xu, S. Study on uncertain decision factors of logistics distribution using Mason theory. In Proceedings of the 2011 International Conference on Electric Information and Control Engineering, Wuhan, China, 15–17 April 2011. [Google Scholar] [CrossRef]
  40. Meighem, P.V. Performance Analysis of Communications Networks and Systems; Cambridge University Press: London, UK, 2006. [Google Scholar]
  41. Kramer, W.; Langenbach-Belz, M. Approximate formulae for the delay in the queuing system GI/G/1. In Proceedings of the International Teletraffic Congress, Melbourne, Australia, 10–17 November 1976. [Google Scholar]
Figure 1. IEEE 802.11p EDCA mechanism backoff process.
Electronics 08 01404 g001
Figure 2. Scenario model on the highway for IoV.
Electronics 08 01404 g002
Figure 3. 802.11p MAC service process in the Z-transmission domain.
Electronics 08 01404 g003
Figure 4. Backoff instance in 802.11p MAC service process.
Electronics 08 01404 g004
Figure 5. Mean MAC access delay versus density of vehicles.
Electronics 08 01404 g005
Figure 6. Packet delay versus density of vehicles.
Electronics 08 01404 g006
Figure 7. PDR versus density of vehicles.
Electronics 08 01404 g007
Table 1. Comparison of different models.
ModelProtocolMAC TypeQueue LengthACsTransmission TypeBF/CBF
Li et al. [31]802.11pDCFfiniteB
Peng et al. [32]802.11pDCFU
Wu et al. [37]802.11eDCFinfiniteUBF
Qiu et al. [35]802.11pEDCA4BBF
Noor-A-Rahim et al. [36]802.11pEDCA4BBF
Yao et al. [19]802.11pEDCA2BBF
Yao et al. [28]802.11pEDCAfinite4BBF
Xu et al. [29]802.11pEDCAinfinite2BBF
Proposed Model802.11pEDCAinfinite2BCBF
Note that B/U represents Broadcast/Unicast and BF/CBF represents Backoff Freezing/Continuous Backoff Freezing.
Table 2. EDCA contention parameters.
AC CW min CW max AIFSNTXOP Limit
1 ( a C W m i n + 1 ) / 2 1 a C W m i n 30
0 ( a C W m i n + 1 ) / 4 1 ( a C W m i n + 1 ) / 2 1 20
Table 3. Simulation parameters.
ParameterValue
A I F S N 0 2
A I F S N 1 3
Basic rate1 Mbps
Data rate3 Mbps
Length of each lane2000 m
Maximum number of vehicles200
Minimum contention window of A C 0 3
Minimum contention window of A C 1 3
MAC header112 bits
Number of lanes4
PHY header48 bits
Packet size200 bits
Packet arrival rate of A C 0 5 pkts/s
Packet arrival rate of A C 1 5 pkts/s
Propagation delay2 μ s
Retransmission limit1
Slot time13 μ s
SIFS32 μ s