Article

Semi-Supervised Deep Time-Delay Embedded Clustering for Stress Speech Analysis

by
Barlian Henryranu Prasetio
1,*,
Hiroki Tamura
2 and
Koichi Tanno
2
1
Interdisciplinary Graduate School of Agriculture and Engineering, University of Miyazaki, Miyazaki 889-2192, Japan
2
Faculty of Engineering, University of Miyazaki, Miyazaki 889-2192, Japan
*
Author to whom correspondence should be addressed.
Electronics 2019, 8(11), 1263; https://doi.org/10.3390/electronics8111263
Submission received: 23 September 2019 / Revised: 25 October 2019 / Accepted: 28 October 2019 / Published: 1 November 2019
(This article belongs to the Section Artificial Intelligence)

Abstract

:
Real stressed speech is affected by various aspects (individual characteristics and environment) so that the stress patterns are diverse and different on each individual. To this end, in our previous work, we performed an unsupervised clustering method that able to self-learning manner by mapping the feature representations of the stress speech and clustering tasks simultaneously, called deep time-delay embedded clustering (DTEC). However, DTEC has not confirmed yet the compatibility between the output class and informational classes. Therefore, we proposed semi-supervised time-delay embedded clustering (SDTEC) as a new framework of semi-supervised in DTEC. SDTEC incorporates the prior information of pairwise constraints in the embedding layer and simultaneously learns the feature representation and the clustering assignments. The prior information was used to guide the clustering procedure so that the points that belong to the incorrect cluster can be corrected. The effectiveness of the proposed SDTEC was evaluated by comparing it with some baseline methods in terms of the clustering error rate (CER). Moreover, to demonstrate SDTEC’s capabilities, we conducted a comprehensive ablation study. Based on experiment results, SDTEC outperformed the baseline methods and achieves state-of-the-art results in semi-supervised clustering.

Graphical Abstract

1. Introduction

In psychological sciences, stress is an unconscious emotion caused by environmental stimuli [1]. The human body responds to stress by releasing hormones that increase heart rates, breathing rates, and muscle tension [2]. These responses make the articulatory movements, airflow from the respiratory system, and timing of the vocal system physiology [3] change [4]. Thus, stress can be identified using the stress speech recognition (SSR) system by analyzing the change of speech patterns [5]. SSR uses the architecture of an automatic speech recognition (ASR) system that was trained using labeled short stressed utterances to recognize the stress patterns [6]. One of the challenges in SSR is the use of relevant stress speech data to train the model so that the model can adapt to all real-world stress conditions. However, in real situations, stress characteristics are diverse and have different patterns for each individual due to various aspects such as characteristics, gender, experience background, and emotional tendencies [7].
In this decade, unsupervised clustering has been explored by defining an effective objective in a self-learning manner to categorize stress speech data [8,9,10]. These methods use a distance or dissimilarity algorithm to cluster the data points. The performance of this algorithm was explored by [9,11,12,13,14]. However, for high-dimensional data, this algorithm generally deteriorates. This problem is known as the curse of dimensionality [15].
Recently, the deep clustering methods were introduced to learn complex nonlinear functions into good representations that directly learn the feature representation using the deep neural network (DNN) [16]. Typically, a deep clustering consisted of two phases i.e., DNN-based autoencoder and parameter optimization (clustering). The autoencoder was used to address the curse of dimensionality issue by compacting the original feature on each hidden layer to obtain a new low-dimensional feature representation (embedding feature). Then, the DNN simultaneously learns feature representation and clustering assignments that are supervised by its objective loss functions.
In deep speech clustering, the autoencoder is used to map the nonlinear input parameters on each small temporal context window in a short region of the speech segment [17,18]. However, the stress information is distributed nonlinearly and has dependencies at a long and short temporal contexts [19]. Thus, the DNN-based autoencoder becomes not as effective as before. To address this, in our previous work [20], we proposed a new deep clustering architecture that uses the time-delay neural network (TDNN) structure to built the autoencoder. We named it the deep time-delay embedded clustering (DTEC). The TDNN-based autoencoder learns a long-range temporal dependency by creating more large networks of the sub-components at across time-step to capture stress information in all temporal contexts. The joint supervisions of discriminative loss, reconstruction loss, and clustering loss were used to optimize the feature representation and clustering assignment. DTEC demonstrated its effectiveness by outperforming several deep clustering algorithms in terms of accuracy (ACC) and normalized mutual information (NMI). However, despite its success in clustering the stress speech, the effectiveness of DTEC’s objective cannot be confirmed yet whether the output class corresponds to informational classes because no measured outcome variable and information about the relationship between the observed clusters.
In many machine learning applications, prior information (annotations) is used to improve learning abilities to give a significant impact on the clustering task [21]. Some works defined the prior information (pairwise constraints) present a relationship between a pair of instances [22]. Typically, the pairwise constraint is divided into two types, the must-link and cannot-link constraints [23]. Must-link constraints are used to associate that two instances are known in the same cluster, while cannot-link constraints specify that two instances belong to different clusters. Thus, in addition, to enhance the learning ability, these constraints can be leveraged as a guide to finding the corresponding clusters [24].
Since DTEC did not use prior information yet to lead to a clustering procedure that is able to enhance the clustering process, we propose a semi-supervised framework of DTEC. We named it semi-supervised deep time-delay embedded clustering (SDTEC). SDTEC improves the effectiveness of DTEC by incorporating semi-supervised information. Specifically, the prior information of pairwise constraints is attached to SDTEC’s learning process so that the distance of inter-clusters centroid is farther and the intra-cluster variations are closer. Thus, the state-of-the-art DTEC clustering performance significantly improved by using this prior information of pairwise constraints.
We organized the rest of this paper as follows. In Section 1, we present the story of the clustering method and review the related works. Section 3 describes the proposed SDTEC on each part. The experimental setup such as the use of the dataset, network settings, and baseline systems are discussed in Section 4. Section 5 demonstrates the evaluation results of the SDTEC’s and its ablation studies. Finally, Section 6 provides a conclusion and our future work.

2. Related Works

The clustering method has been widely explored in machine learning and the big data field. For more than two decades, K-means become the most popular clustering method due to its fastness to find the similarities between data points. However, K-means has a limitation in the term of distance metrics for high dimensionality data.
In the past decade, subspace clustering-based methods showed their robustness in the curse of dimensionality issues by applying clustering assignments in a low-dimensional subspace. These methods use a shallow linear model to seek implicitly corresponded groups. However, subspace clustering is not effective to handle a nonlinear structure. Therefore, spectral clustering (a deep subspace clustering [25]) was proposed to address this issue. This method transforms input into latent space that adaptive to the local and global structure by incorporating prior sparsity information.
According to Yang, et al. [26], the discriminant information is not exploited enough by the traditional spectral clustering. Hence, they used both manifold information and discriminant information to improve the clustering performance. In many cases, spectral clustering could outperform the k-means to exhibit a clear manifold structure. However, this assumption not always applicable to all high dimensional problems. Therefore, Nie, et al. [27] proposed to explicitly add a linear regulation into their clustering objective function since they assumed that true cluster assignment always could be embedded in the linear space of the data.
A new deep subspace clustering method was proposed by Peng, et al. [28] to improve substantially their previous work [25]. A deep neural network (DNN) is used to obtain a low-dimensional representation and applying reconstruction error to guarantee the global term. However, this method requires a specialized machine with large memory to compute a full graph Laplacian matrix that has super massive complexities.
The self-organizing method and its variants were popular to cluster a huge data, self organizing map (SOM) and self-organizing tree algorithm (SOTA). SOTA is a type of unsupervised neural network that combine a binary tree topology and SOM [29]. Comparing between SOM and SOTA was explored in [30,31]. These methods use DNN to visualize input data into two-dimensional structure so that all data are forced to spread on two-dimensional space.
Recently, a deep clustering method is introduced to revisit the clustering analysis. This method focused on learning representation due to assume that the choice of feature space is very important [32], referred to as deep embedded clustering (DEC). DEC uses DNN to parameterize nonlinear mapping from input space into embedding space. DEC is unlike the previous methods that operate in data space (shallow linear model), it applies the stochastic gradient descent (SGD) on the clustering objective to learn the mapping.
DEC uses a DNN-based autoencoder to transform the input into embedding space and simultaneously optimize feature representation and the clustering objective. The DNN-based autoencoder capture the data information in a short region of the small temporal context. In our case (stress speech clustering), due to the most important and beneficial information are distributed non-linearly at short and long temporal contexts [33], DNN-based autoencoder becomes less effective in terms of memory and computation. Therefore, a one-dimension model of a fixed-size convolution network that allows applying the sub-sampled method is proposed to build an autoencoder, known as a time-delay neural network (TDNN) [34]. The sub-sampled method makes the autoencoder has fewer numbers of connections and weights. Therefore, TDNN becomes relatively more efficient than the original DNN in terms of memory and computation.
Our previous work [20] proposed an unsupervised framework called deep time-delay embedded clustering (DTEC) that transforms the stress speech data into low-dimensional embedding space using TDNN-based autoencoder. DTEC jointly learns feature representation and clustering assignments by supervision of losses. Since DTEC’s objective cannot be confirmed yet, we propose to incorporate the prior information into the embedding layer to lead the clustering procedures. Specifically, we evolve a semi-supervised framework of the DTEC that aims to enhance the clustering performance. We then assess the effectiveness of SDTEC in categorizing the stress speech data and compare its performance with state-of-the-art clustering methods such as K-means, SOTA and DEC.
At the end of this section, we summarize the relations and differences between state-of-the-art clustering methods and proposed SDTEC as follows:
  • K-means is the fastest clustering method but becomes ineffective in high dimensional data. Thus, to overcome this limitedness, most clustering methods reduce the data dimension before performing a clustering assignment.
  • Spectral and self-organizing clustering methods reduce a high-dimensional input into a lower-dimensional space using DNN, and then applying the clustering assignment on this space.
  • Unlike the previous methods, a deep clustering (DEC, DTEC, and SDTEC) uses a DNN-based autoencoder to parameterize the input with nonlinear mapping to embedding space that simultaneously optimizes the feature representation and the clustering assignment.
  • The main difference between DEC and our methods (DTEC and SDTEC) is the type of DNN used in the autoencoder structure. DEC uses original DNN while our methods use TDNN. Moreover, our methods added a discriminatory approach to the clustering objective.
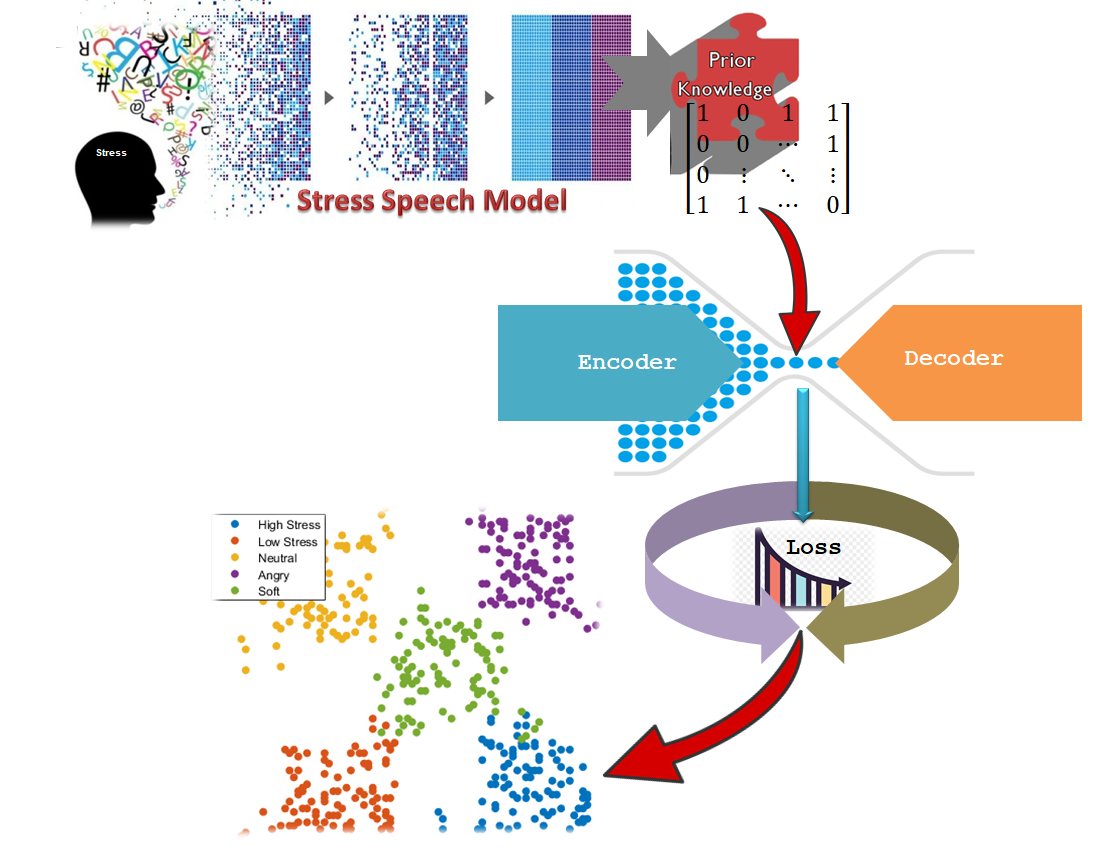
  • Since DTEC’s clustering objective cannot be confirmed yet as to whether the output class corresponds to informational classes, a semi-supervised framework of DTEC is proposed by incorporating prior information from model-based pairwise constraints to guide the clustering procedures.

3. Semi-Supervised Deep Time-Delay Embedded Clustering

The proposed SDTEC consisted of the nonlinear transformation via TDNN-based autoencoder and the stress speech recognition (SSR) model-based pairwise constraints, as shown in Figure 1.
The TDNN-based autoencoder transforms a high-dimensional input data X into a low-dimensional embedding space Z. On the other side, we generated a pairwise constraints matrix from the SSR model, then incorporate it into the embedding feature Z and directly learns the feature representation. The soft assignment (probability of assigning) of each data point W is used to computed the clustering objective functions.

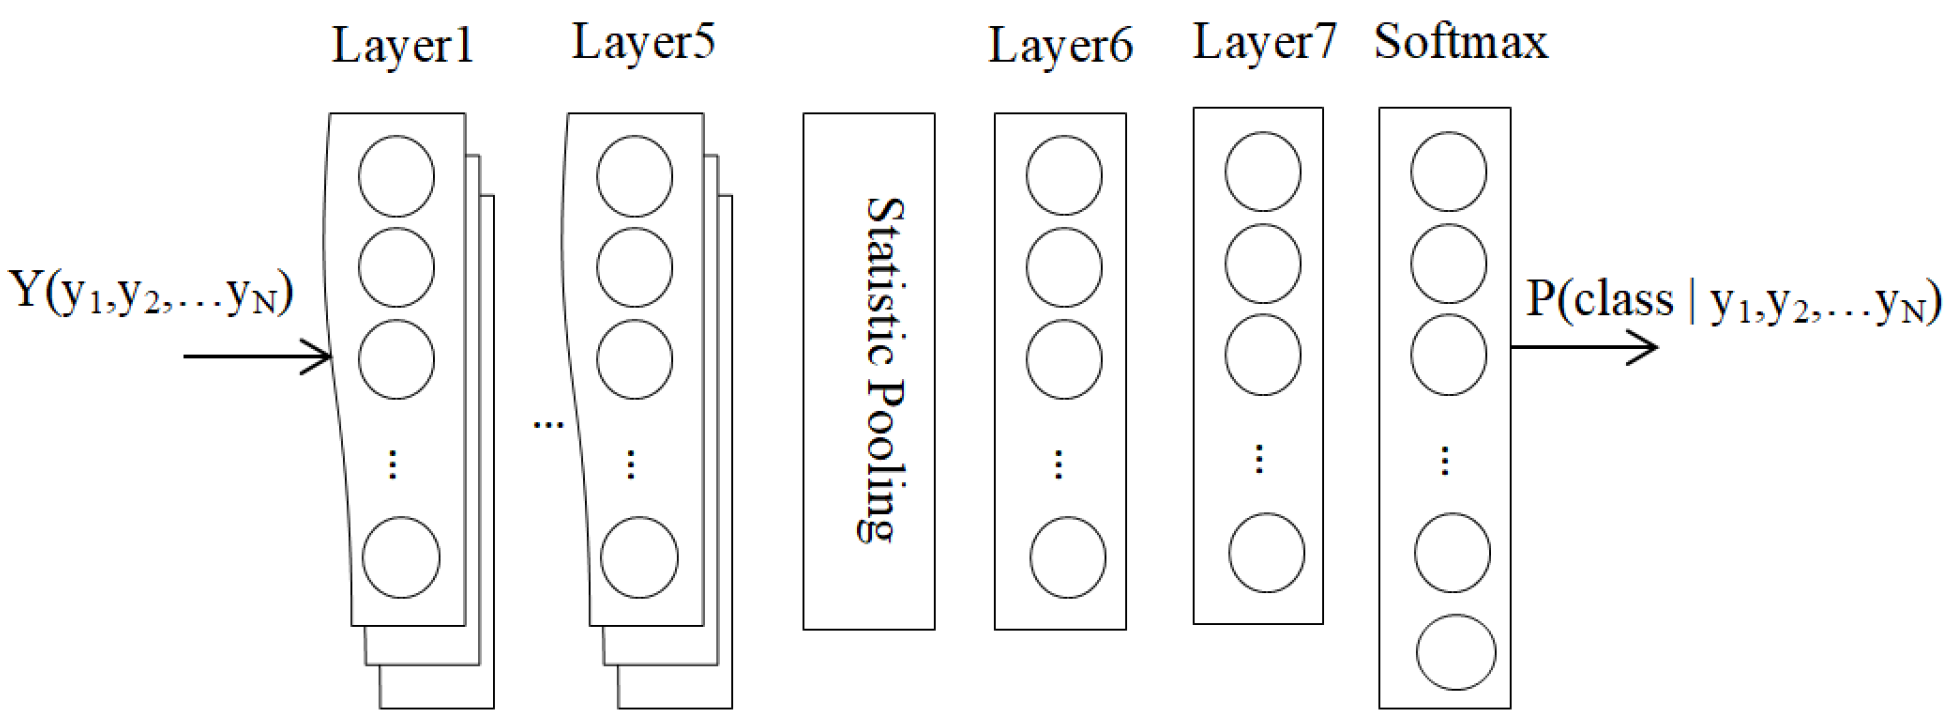
3.1. Nonlinear Transformation

We use the TDNN-based autoencoder structure of [20] to transform the data with a nonlinear mapping f θ : X Z , where θ is the model parameters representation, for representing a low-dimensional stress speech feature in embedding space.
The autoencoder composed a pair of encoder/decoder. The encoder layer is enabled to map the original feature space X into embedding space Z. Embedding data points z i in space Z is a valid representation of the original feature sample x i in space X. The decoder layer reconstructs the embedding features Z into reconstruction feature space X that has the same dimension size as the input. The autoencoder contained three hidden layers on each encoder/decoder pairs. We perform a sub-sampled TDNN in the encoder side and under-sampled reverse TDNN in the decoder side to make an efficient computation. The autoencoder covers the total input temporal context from [t − 13] to [t + 9] [35], as present in Table 1.

3.2. Stress Speech Recognition Model Based Pairwise Constraints

We have built a stress speech recognition (SSR) system [36] to models the stress speech. This SSR model was trained using labeled stress speech utterances Y ( y 1 , y 2 , y N ) to recognize the stress patterns. The SSR model contained the TDNN structure which composed of 5 frame-processing layers, a statistical pooling layer, 2 segment layers, and a softmax layer, as shown in Figure 2.
During the training process, the softmax loss was used to optimize the network parameters. The parameters were defined via a linear transformation with weight and bias vectors that are followed by the softmax function and the multiclass cross-entropy loss. After training phase, the softmax layer represents the probability of a sample belongs to the class labels P ( c l a s s | y 1 , y 2 , y N ) . The whole softmax layer outputs are the distribution of possible clusters given a sample.
The pair of initial instances must-link and cannot-link constraints of the softmax output distributions are defined by M = { ( y i , y j ) : y i and y j belong to the same cluster} and C = { ( y i , y j ) : y i and y j belong to the different clusters}, respectively. Each cluster is presented by a center μ j , j = 1 , , K where k is the number of clusters. Then, a matrix that present the prior information of pairwise constraints (must-link M and cannot-link C) is incorporated into embedding feature Z. The pairwise constraints matrix is defined as follows:
A y i , y j = y 11 y 12 y 1 n y 21 y 22 y 2 n y n 1 y n 2 y n n
where y i k = 1 if y i and y k are assigned to the same cluster, y i k = 1 if y i and y k are assigned to the different clusters, and y i k = 0 if other entities.

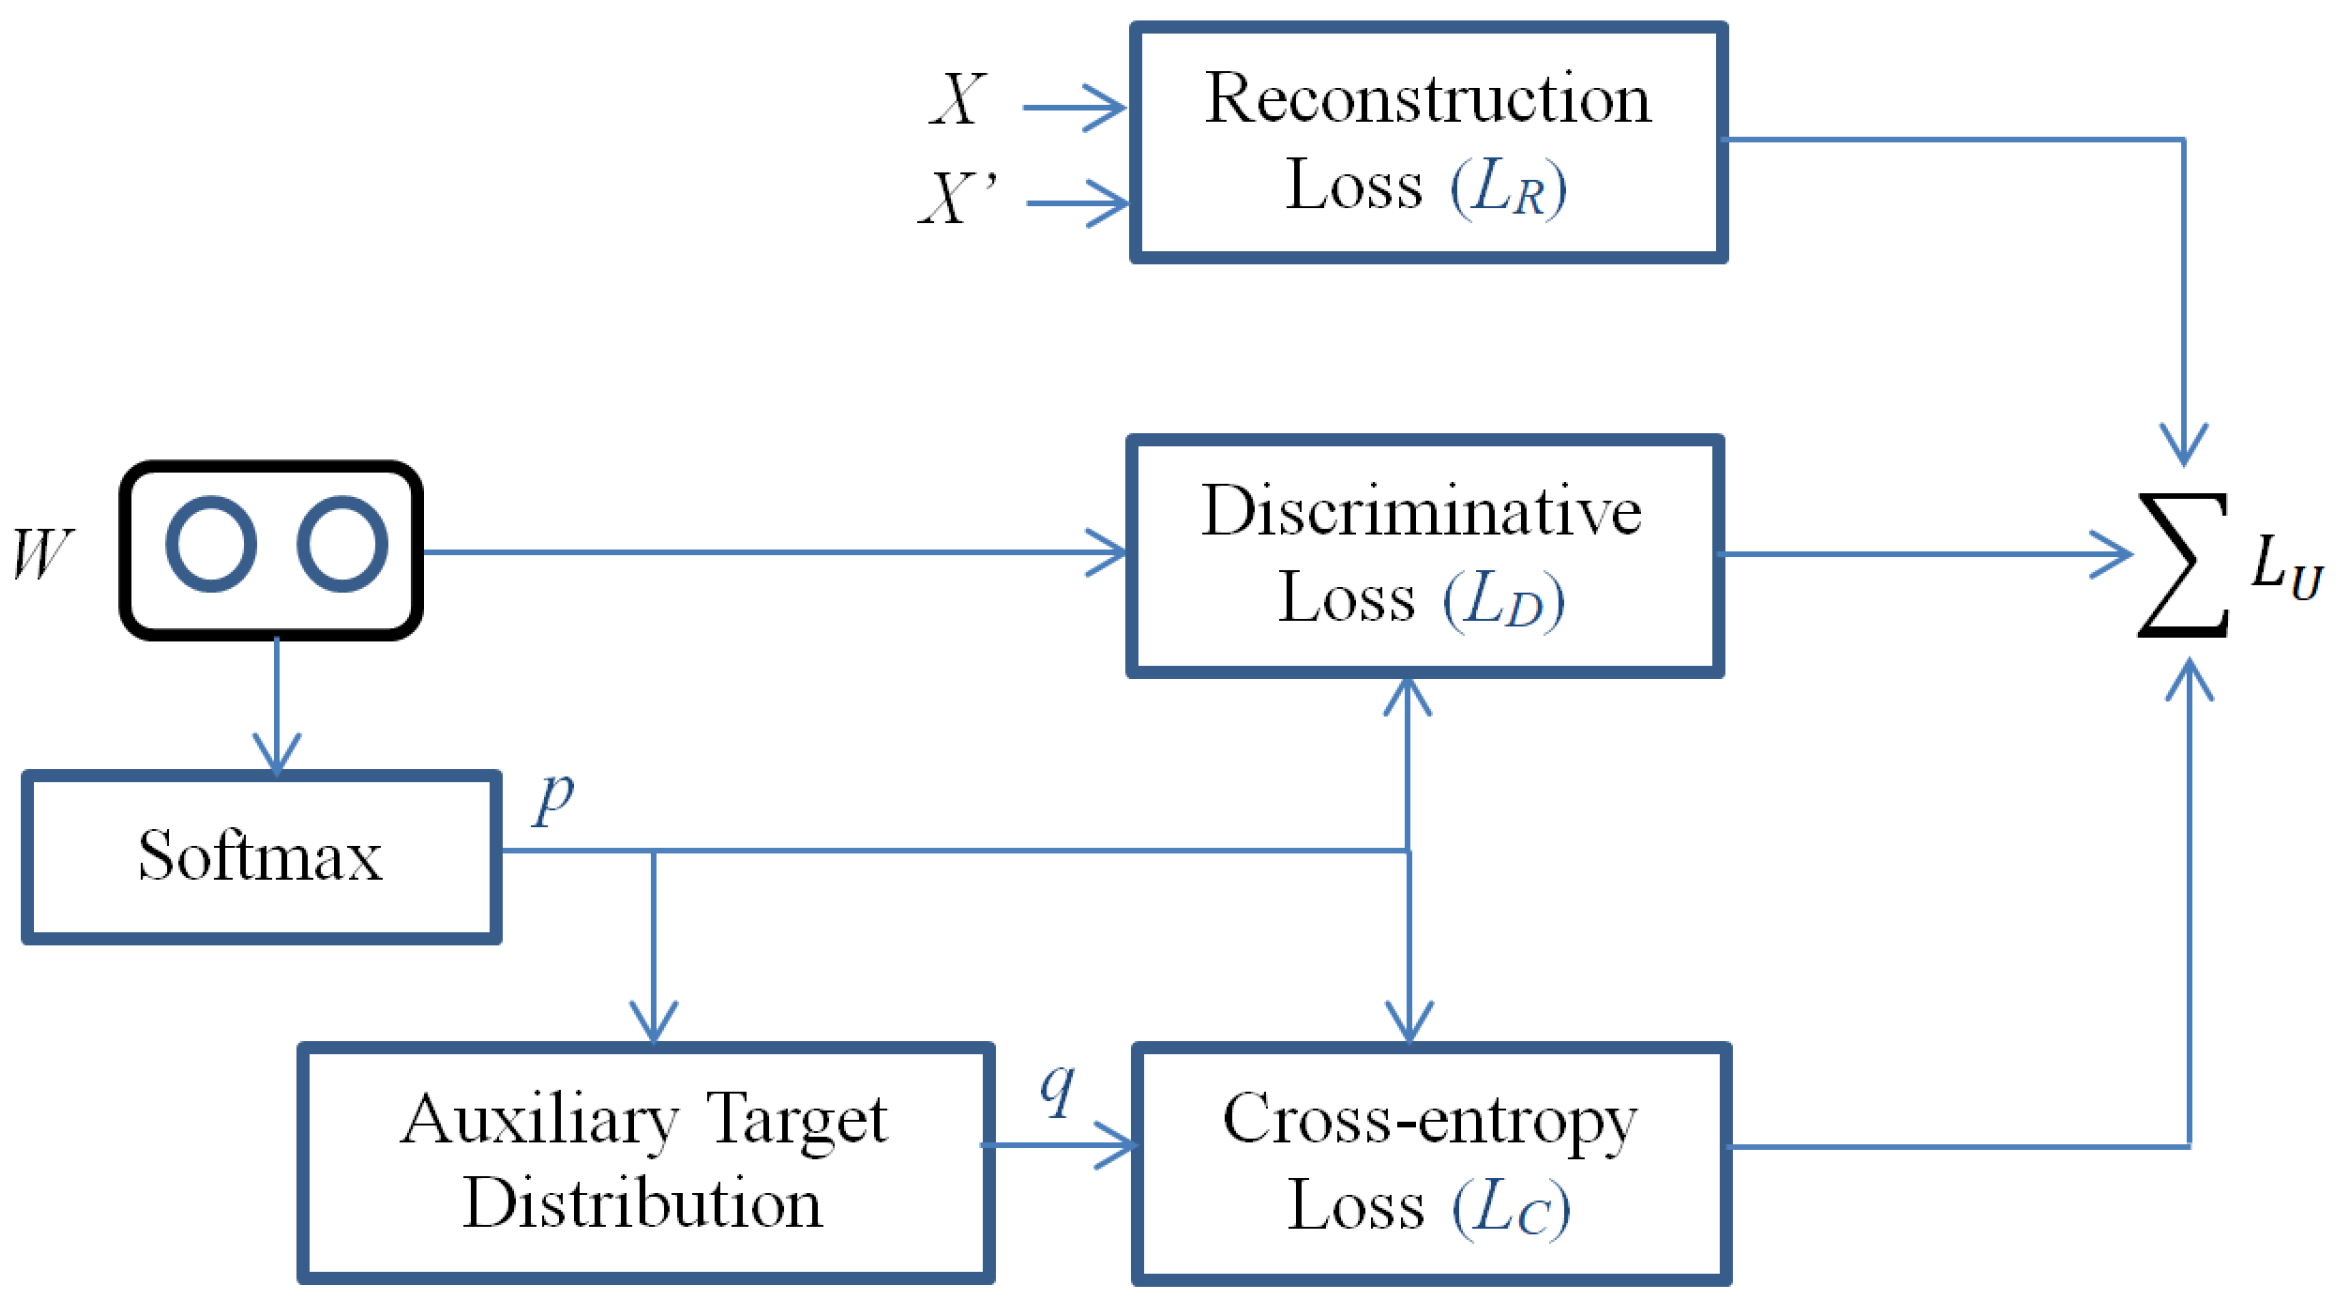
3.3. Objective Function of the Network

The DTEC took advantage by jointly supervision of the discriminative loss, reconstruction loss, and cross-entropy loss. The main novel of DTEC is the use of discriminative loss that able to increase the distance of inter-cluster centroid and reducing the intra-cluster variations. Therefore, the inter-cluster margin becomes farther while the intra-cluster distance becomes closer.
However, DTEC did not have information that can be used to guide the clustering procedure. Therefore, we consider incorporating the prior information of pairwise constraints in DTEC’s objective function for leading the clustering assignment and feature representation. By providing pairwise constraints, we expect that it can specify whether a pair of data examples should be associated in the same class (must-link constraints) or should not be associated (cannot-link constraints). Thus, the same label points become closer and the different label points are away from each other. We define the objective of SDTEC as follows:
L = L u + γ L s
where L u is unsupervised loss and L s is semi-supervised constraint loss. γ is the hyper parameter that is used to balance both functions. If γ = 0, SDTEC would be dropped to DTEC.
Equation (2) shows that the objective function of SDTEC was composed of the semi-supervised constraint loss L s and the unsupervised loss L u . L s indicates the conformity between the embedding feature { z i } i = 1 n with the pairwise constraints matrix A y i , y j , defined as follows:
L s = 1 n i = 1 n k = 1 n y i k z i z k 2
where n is the number of data points. L u was obtained by summing the discriminative loss, reconstruction loss, and cross-entropy loss [20]. The objective function of SDTEC is shown in Figure 3 and formulated in Equation (4).
L u = L D + α L R + β L C
where α and β are reconstruction and clustering weight parameter, respectively.
The soft assignment of each data point w is used to compute the discriminative loss and the cross-entropy loss, while the reconstruction loss is obtained by computing the mean squared error (MSE) between original feature x and the reconstructed feature x .

4. Experimental Setup

4.1. Dataset

We used the stress speech data from the Speech Under Simulated and Actual Stress (SUSAS) database that was collected by the Linguistic Data Consortium (LCD) [37]. The SUSAS database consisted of short utterances labeled data and the long speech unlabeled data. The labeled data consisted of 1377 males and 1323 females [38]. This data was used to train the SSR model and used for generating the must-link and cannot-link pairwise constraints, while the unlabeled data consisted of the conversations between two speakers with various length duration. This data was used to evaluate the proposed SDTEC.

4.2. Experiment Settings

The acoustic feature was extracted using Mel-frequency cepstral coefficients (MFCCs) into a 13-dimensional vector with 25 ms frame length that was normalized for each sliding window. On each frame, we append a 200-dimensional i-vector with 32 Universal Background Model (UBM) size [39] to the MFCC input.
Each autoencoder layer was set to 4000-dimensions in pair of encoder/decoder side and 400-dimensions for embedding layer [40]. The Rectified Linear Unit (ReLU) activation function was used in all layers of encoder/decoder pairs [35] with a 256 batch size [41].
In the initial state, the pairs of data points were selected to generate A y i , y j matrix based SSR’s softmax output distribution and ground truth distribution. If selected data point relating to the same label with ground truth, it would obtain a must-link constraint. Otherwise, it is a cannot-link constraint. We specify the convergence threshold is 0.1% with 0.01 learning rate. The number of ground truth is used to set the number of clusters K. In this experiment, we set K to 5.

4.3. Baseline Clustering Methods

The proposed method (SDTEC) effectiveness is evaluated by comparing it with some baseline clustering methods as follows:
Km:apply k-means clustering [8] in X space
Km+PC:apply k-means with pairwise constraints from SSR model (Equation (1)) in X space
Km+AE:perform TDNN-based autoencoder [20] then apply k-means in Z space
Km+AE+PC:perform TDNN-based autoencoder [20] then apply k-means with pairwise constraints from SSR model (Equation (1)) in Z space
SOTA:perform a full system of SOTA [29]
DEC:perform a full system of DEC [32]
DTEC:apply a full system of DTEC [20]

5. Results and Discussion

In this section, we assess the effectiveness of the proposed SDTEC in categorizing the stress speech data of SUSAS dataset in term of clustering error rate (CER). The clustering performance comparison between proposed SDTEC and baseline methods are presented in Section 5.1. In order to demonstrate SDTEC’s capabilities, an ablation study and its advanced analysis are provided in Section 5.2.

5.1. Evaluation Result

The proposed SDTEC was evaluated its effectiveness in term of CER. In this experiment, we set the SDTEC’s hyper parameter γ to 10 4 and the number of constraints n p c to 1 × n , while the weight parameter of reconstruction loss α and cross-entropy loss β were set to 0.97 and 0.98, respectively [20]. Each method was run independently 10 times and the average of them is presented in Table 2.
The evaluation result showed that the embedding space is better to represent the feature than the original space, as shown in the performance gap between Km and Km+AE. This indication shows that the DNN offers a robust feature representation in favor of the clustering assignments. The DNN-based techniques (SOTA, DEC, DTEC, and SDTEC) outperform the k-means and its variants because the DNN was able to represent complicated patterns. SOTA achieves a higher error than other DNN-based techniques since all data were forced to spread on a two-dimensional space so that some important information are ignored. It shows that the updated feature representation based on clustering assignments learning is better feature representations for clustering. As shown in Km+PC and Km+AE+PC compared with Km and Km+AE, the clustering performance is improved by incorporating the pairwise constraints. It indicate that the prior information is an important factor to enhance the clustering performance. SDTEC is a state-of-the-art deep clustering method that outperforms the baseline methods and decrease the error rate of DTEC by 19%. Generally, prior information usage can improve significantly the clustering performance.
The advantage of the SDTEC is its ability to fix the points that belong to incorrect cluster by using the prior information of pairwise constraints. However, we also needed to identify the error rate on each cluster. Each cluster error rate identification for the DTEC and SDTEC are reported in Table 3.
SDTEC demonstrated a lower error rate than DTEC in all clusters. In DTEC, there are two clusters that have lower errors than others, while in SDTEC, each cluster indicated has an almost similar error rate. It proves that is true by incorporating the prior information of pairwise constraints, the points that are spread in the sidelines of clusters area can be pull-forced belong to the correct cluster and the incorrect ones can be guided to find the correct cluster.

5.2. Ablation Study

To analyze in advanced of the proposed SDTEC, we conducted an ablation study to explore the effect of the parameter involvement on the clustering result. We analyze whether the parameter involvement of the loss and the number of pairwise constraints are related to model performance. Therefore, it is possible to investigate the SDTEC reasonably quite well in terms of the clustering error rate.

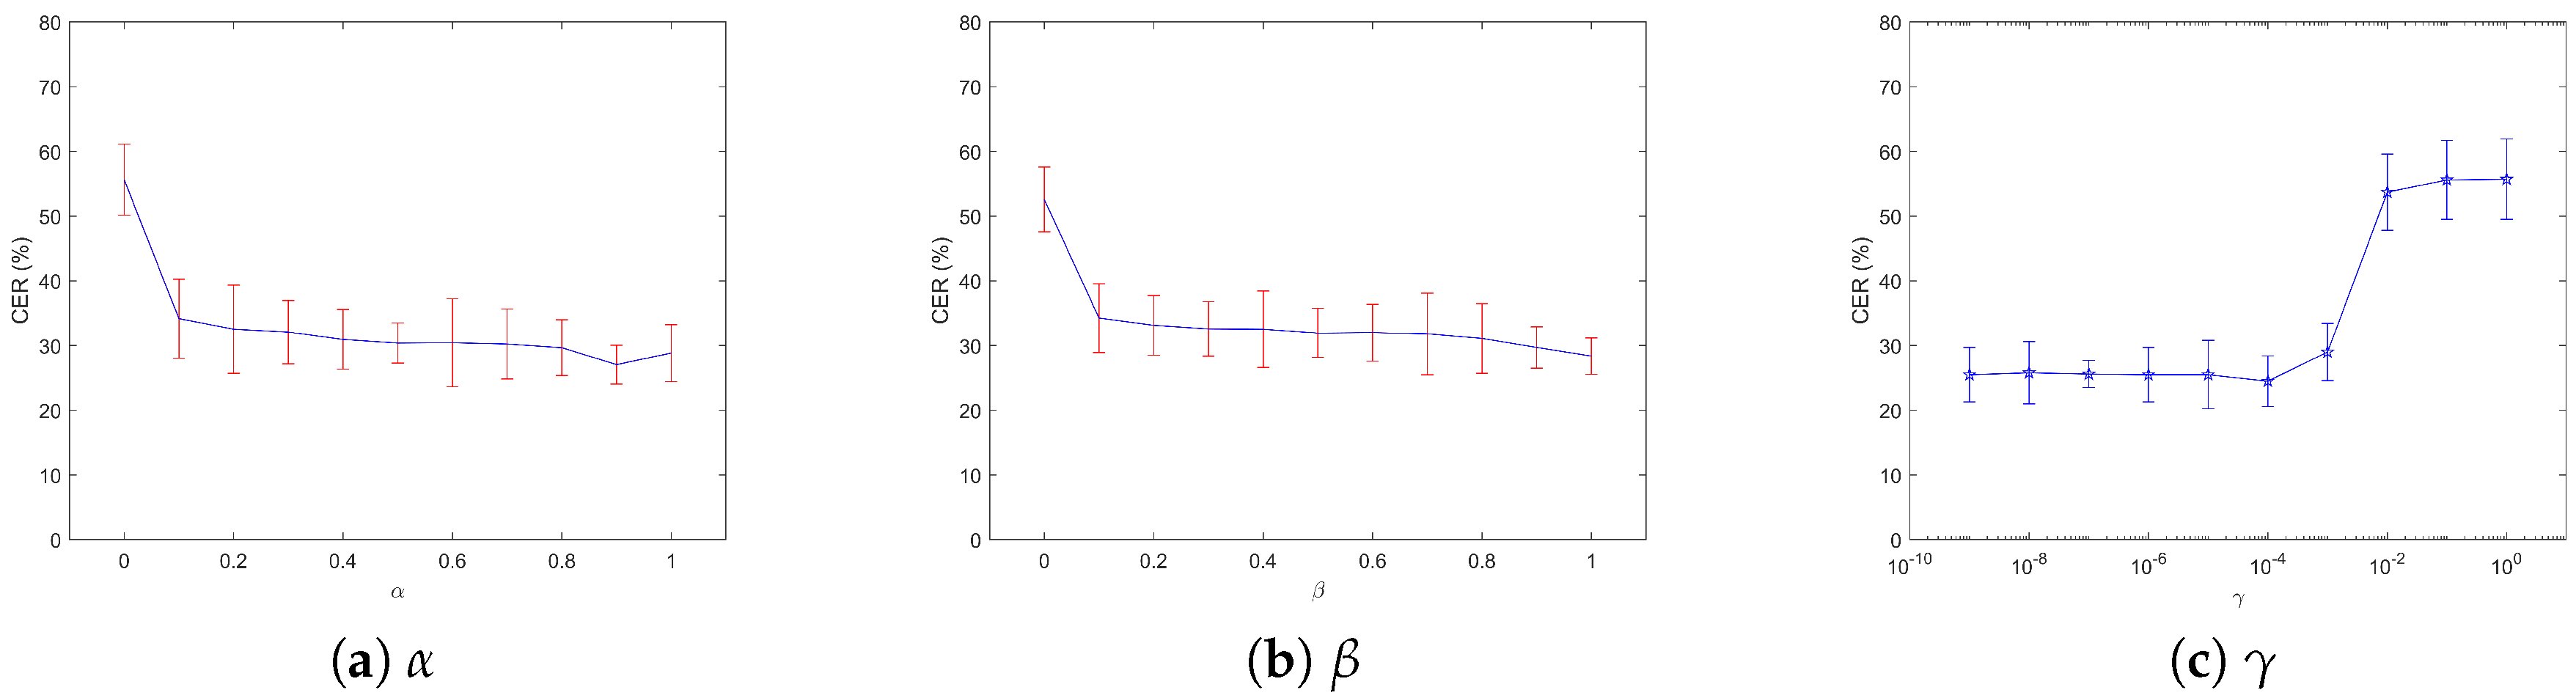
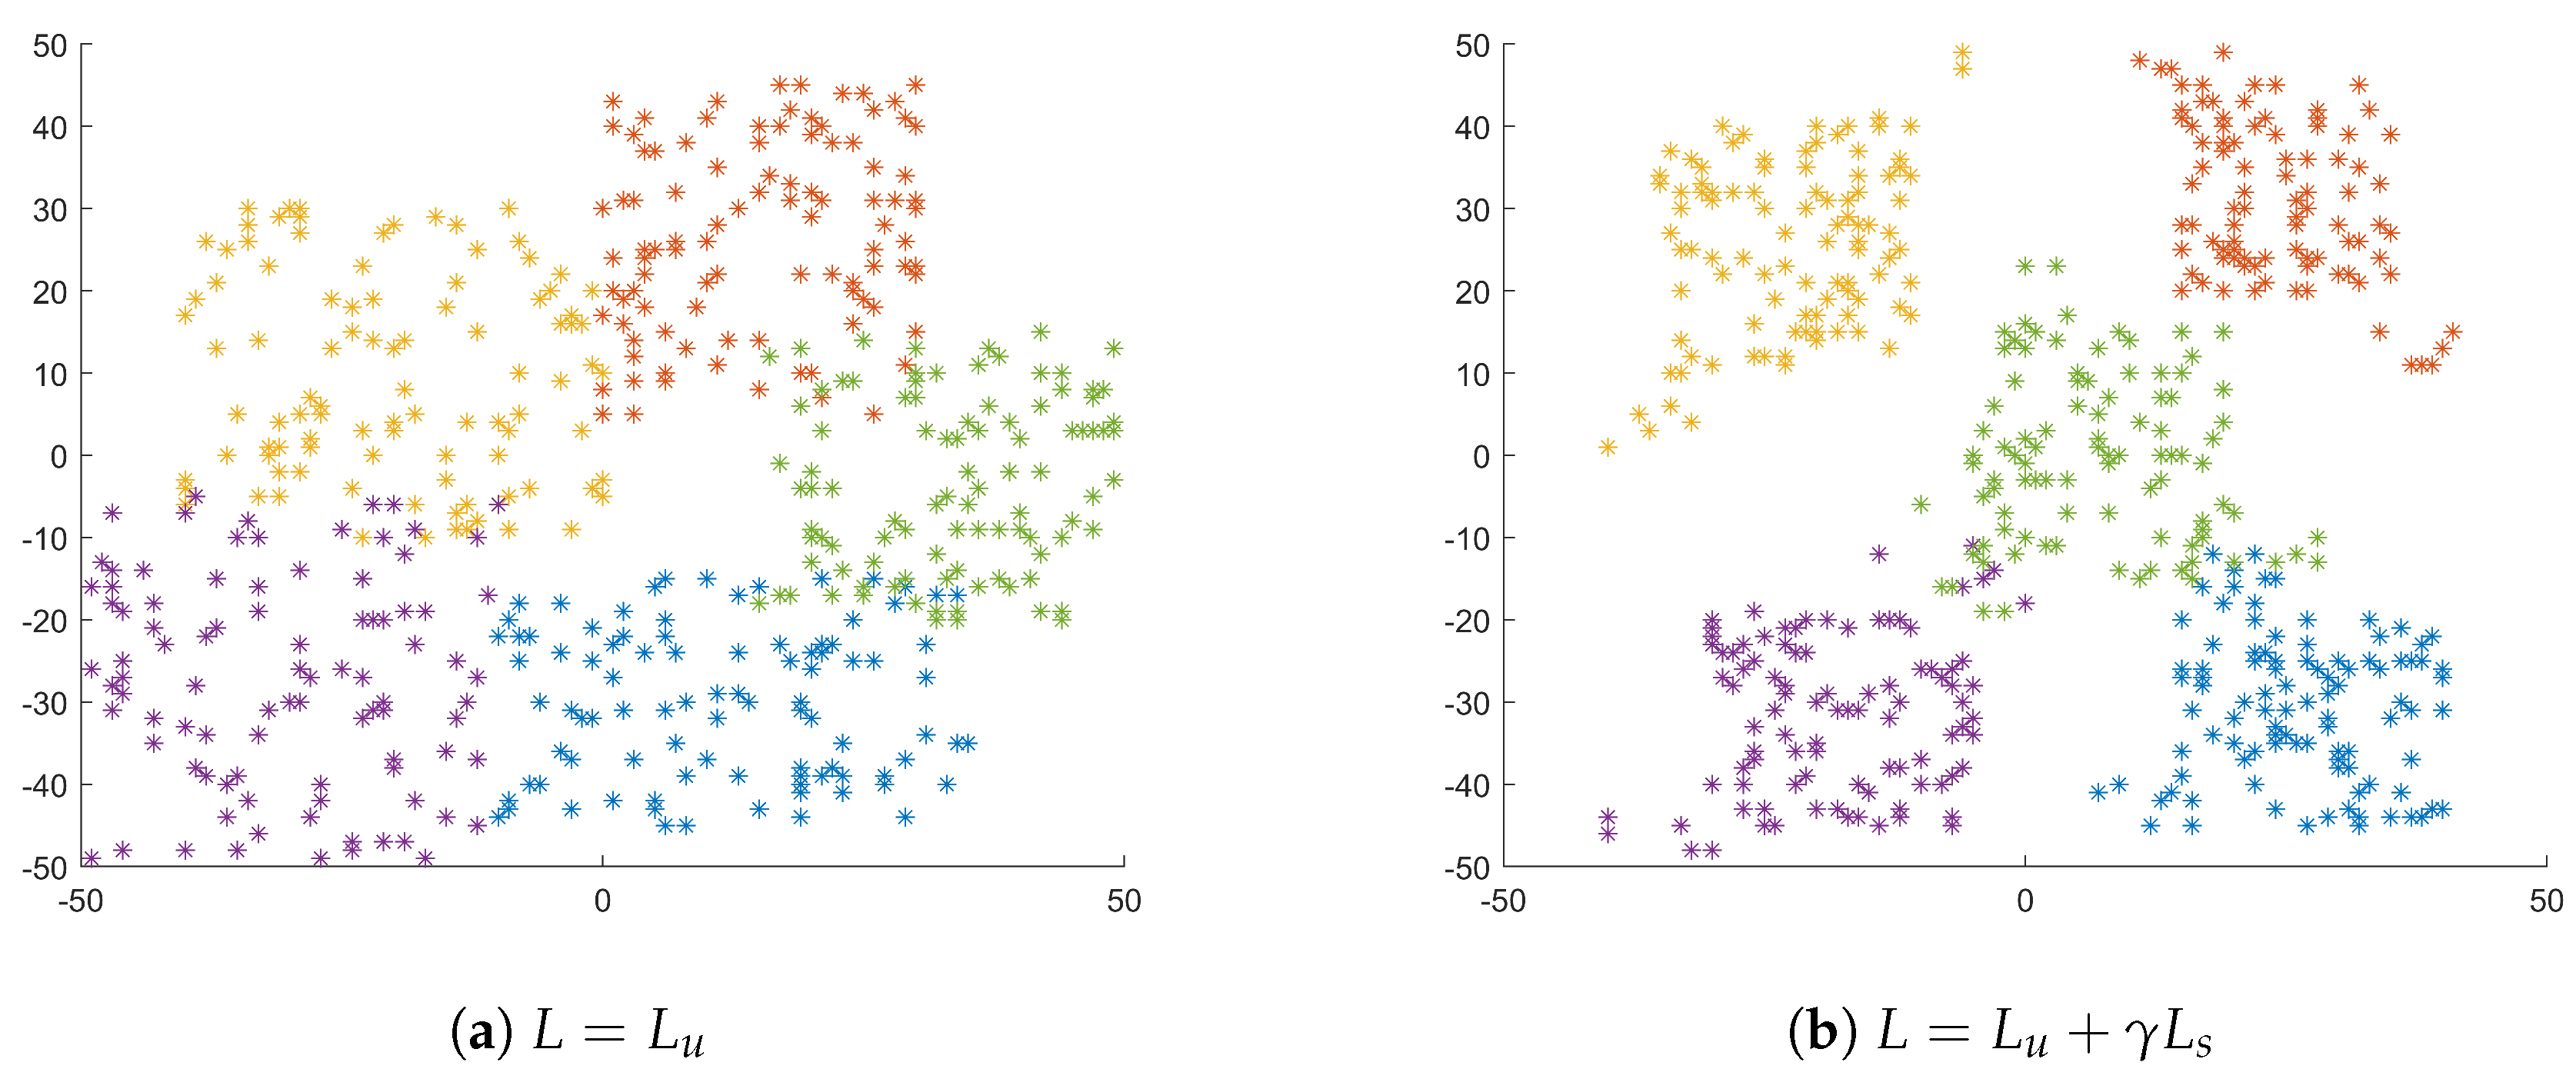
5.2.1. The Effect of Losses

As shown in Equation (2), the proposed loss function consists of unsupervised loss and semi-supervised constraint loss. The hyper parameter γ is used to balance both loss functions, while in Equation (4), the unsupervised loss is defined as the sums of discriminative loss, reconstruction loss, and cross-entropy loss. The parameter α and β denotes the hyper parameters of reconstruction and cross-entropy loss. Thus, there are three terms of loss that are related to model performance. Therefore, we analyze whether the different terms of the loss ( α , β , and γ ) are related to model performance.
In this experiment, we randomly sampled all hyper parameters in range (0 to 1) for parameter α and β , and ( 10 9 to 10 0 ) for parameter γ . Afterward, we used the SDTEC model to assign classes of the SUSAS data set. The permutation of class labels was used to reflect the best true class labels. This experiment was run five times (20 runs each) and the respective performance terms of loss are summarized in Figure 4. We detain one fixed parameter and run all compatible procedures on each experiment.
Figure 4 showed that each loss gives an important contribution to minimize the clustering error rate. All parameters performed in the best state and were stably in a wide area. The smallest error was achieved on each loss with α = 0.9 , β = 1 , and γ = 10 4 .
Figure 4 and Table 3 showed the semi-supervised constraint loss gives a significant contribution to clustering performance. To investigate the points that belong to the incorrect cluster, we explore the data class distribution using t-Distributed Stochastic Neighbor Embedding (t-SNE). We visualized randomly 100 points on each class for DTEC and SDTEC, as shown in Figure 5.
Figure 5 showed the difference in class distribution between single and joint supervision of loss. In SDTEC, each cluster’s centroid is away from each other and the points belong to the same cluster are closer. It is obvious that SDTEC is not just able to present a good feature representation for the clustering assignment but also makes the cluster centroid become more detached and the intra-cluster points become closer (the unsupervised loss effect). Moreover, the points that spread in the sidelines of clusters area can be pull-forced belong to the correct cluster and the incorrect ones can be guided to find the correct cluster by using the prior information of pairwise constraints (the semi-supervised constraints loss effect).

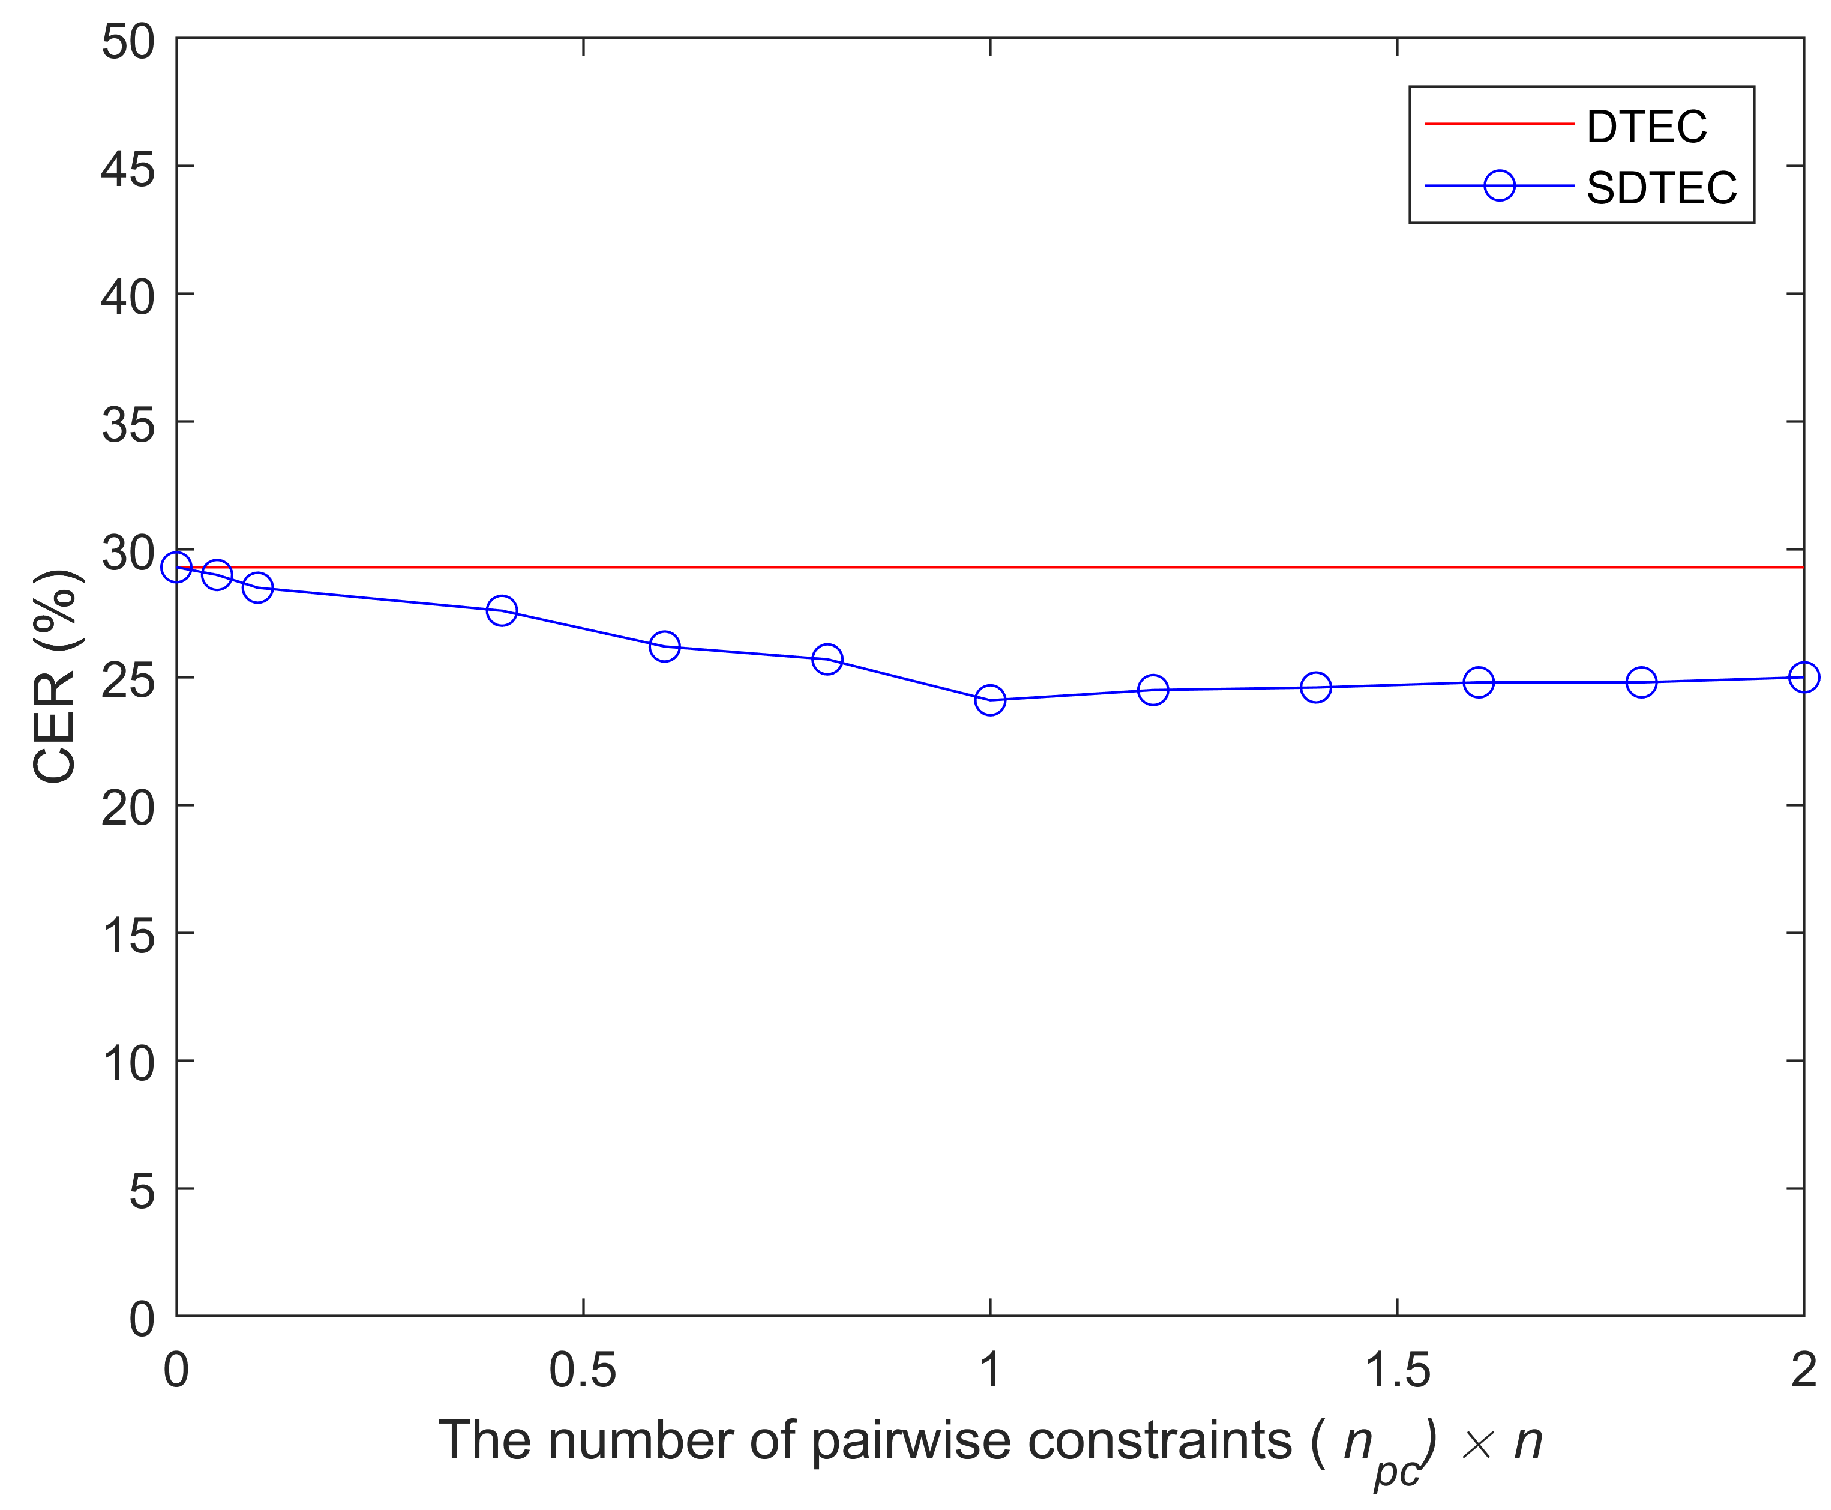
5.2.2. The Effect of the Number of Constraints

In Equation (3), the semi-supervised constraint loss indicates the conformity between the embedding feature with prior information of pairwise constraint. It showed that the number of pairwise constraints are an important term to enhance the clustering performance. Therefore, we also explore the effect of the number of pairwise constraints in the SDTEC model.
In this experiment, the hyper parameter α , β , and γ were set to 0.9 , 1, and 10 4 , respectively (Section 5.2.1). We sampled a wide number of pairwise constraints n p c (from 0 to 2 × n ) in the SDTEC model. Then, we presented the performance of SDTEC in Figure 6.
The SDTEC performance improves and relatively stable in n p c 1 . It shows that by incorporating the pairwise constraints, the clustering performance increased significantly and become stable when achieving enough number of pairwise constraints.

6. Conclusions

In this paper, a new stress speech clustering method was proposed, called semi-supervised deep time-delay embedded clustering (SDTEC). The proposed SDTEC able to improve the effectiveness of DTEC by incorporating semi-supervised information that used to guide the clustering procedure. SDTEC consisted of the TDNN-based autoencoder and SSR model-based pairwise constraints. The autoencoder was used to transform the data with nonlinear mapping for representing more informative stress speech features in embedding space. Then, the SSR model-based pairwise constraints matrix is incorporated into embedding space and directly learn of feature representation. The semi-supervised constraint loss and the unsupervised loss were used simultaneously to supervise the feature representation and the clustering assignment. The effectiveness of proposed SDTEC was evaluated by comparing it with state-of-the-art clustering methods such as K-means and its variants, SOTA, DEC, and DTEC in term of clustering error rate (CER). Based on experiment results, the proposed SDTEC gave its best performance by outperforming all baseline methods and able to reduce the clustering error rate of DTEC by 19%. For further evaluation, we conducted an ablation study to analyze the effect of the applied terms (the loss hyper parameters and the number of pairwise constraints) on the clustering result. Based on the ablation study, incorporating the semi-supervised constraint loss was able to make the points that are spread in the sidelines of clusters area can be pull-forced belong to the correct cluster and the incorrect ones can be guided to find the correct cluster.
On the other hand, some works were shows that the change rate of prosodic features between the target and the prior utterance able to deal with larger sets of contextual information. Hence, to enhance the clustering performance, we interest to use the emotional transition modeling approach using state model an interesting future direction is using the Markov model to improve as a future direction.

Author Contributions

Theory and conceptualization, B.H.P. and H.T.; data requirement, B.H.P. and H.T.; methodology, B.H.P. and H.T.; software design and development, B.H.P.; validation, B.H.P., H.T. and K.T.; formal analysis, B.H.P. and H.T.; investigation, B.H.P.; writing–original draft preparation, B.H.P.; writing–review and editing, B.H.P., H.T. and K.T.; visualization, B.H.P. and H.T.; supervision, H.T. and K.T.

Funding

This research received no external funding.

Acknowledgments

I would like to thank Tamura Laboratory that supported us in this works. Thank you to LDC for allowing us access to the SUSAS database.

Conflicts of Interest

All authors have no conflict of interest to report.

Abbreviations

The following abbreviations are used in this manuscript:
ACCAccuracy
ASRAutomatic Speech Recognition
CERClustering Error Rate
DECDeep Embedded Clustering
DNNDeep Neural Network
DTECDeep Time-delay Embedded Clustering
LDCLinguistic Data Consortium
MFCCMel-Frequency Cepstral Coefficient
MSEMean Squared Error
NMINormalized Mutual Information
ReLURectified Linear Unit
SDTECSemi-supervised Deep Time-delay Embedded Clustering
SGDStochastic Gradient Descent
SOMSelf-Organizing Map
SOTASelf-Organizing Tree Algorithm
SSRStress Speech Recognition
SUSASSpeech Under Simulated and Actual Stress
TDNNTime-delay Neural Network
t-SNEt-Distributed Stochastic Neighbor Embedding
UBMUniversal Background Model

References

  1. Smith, R.; Lane, R.D. Unconscious emotion: A cognitive neuroscientific perspective. Neurosci. Biobehav. Rev. 2016, 69, 216–238. [Google Scholar] [CrossRef] [PubMed]
  2. Gordan, R.; Gwathmey, J.K.; Xie, L.-H. Autonomic and endocrine control of cardiovascular function. World J. Cardiol. 2015, 7, 204–214. [Google Scholar] [CrossRef] [PubMed]
  3. Hansen, J.H.L.; Patil, S. Speech Under Stress: Analysis, Modeling and Recognition. In Speaker Classification I. Lecture Notes in Computer Science; Müller, C., Ed.; Springer: Berlin, Germany, 2007; Volume 4343, pp. 108–137. [Google Scholar]
  4. Zhang, Z. Mechanics of human voice production and control. J. Acoust. Soc. Am. 2016, 140, 2614–2635. [Google Scholar] [CrossRef] [PubMed]
  5. Tomba, K.; Dumoulin, J.; Mugellini, E.; Khaled, O.A.; Hawila, S. Stress Detection Through Speech Analysis. In Proceedings of the International Joint Conference on e-Business and Telecommunications (ICETE), Porto, Portugal, 26–28 July 2018; pp. 394–398. [Google Scholar]
  6. Prasetio, B.H.; Tamura, H.; Tanno, K. Ensemble Support Vector Machine and Neural Network Method for Speech Stress Recognition. In Proceedings of the International Workshop on Big Data and Information Security (IWBIS), Jakarta, Indonesia, 12–13 May 2018; pp. 57–62. [Google Scholar]
  7. Joels, M.; Baram, T.Z. The neuro-symphony of stress. Nat. Rev. Neurosci. 2009, 10, 459–466. [Google Scholar] [CrossRef] [PubMed]
  8. Moungsri, D.; Koriyama, T.; Kobayashi, T. HMM-based Thai speech synthesis using unsupervised stress context labeling. In Proceedings of the Signal and Information Processing Association Annual Summit and Conference (APSIPA), Siem Reap, Cambodia, 9–12 December 2014; pp. 1–4. [Google Scholar]
  9. Moungsri, D.; Koriyama, T.; Kobayashi, T. Unsupervised Stress Information Labeling Using Gaussian Process Latent Variable Model for Statistical Speech Synthesis. In Proceedings of the Annual Conference of the International Speech Communication Association (INTERSPEECH), San Francisco, CA, USA, 8–12 September 2016; pp. 1517–1521. [Google Scholar]
  10. Morales, M.R.; Levitan, R. Mitigating Confounding Factors in Depression Detection Using an Unsupervised Clustering Approach. In Proceedings of the Computing and Mental Health Workshop (CHI), San Jose, CA, USA, 7–12 May 2016; pp. 1–4. [Google Scholar]
  11. Kamper, H.; Livescu, K.; Goldwater, S. An embedded segmental K-means model for unsupervised segmentation and clustering of speech. In Proceedings of the IEEE Automatic Speech Recognition and Understanding Workshop (ASRU), Okinawa, Japan, 16–20 December 2017; pp. 719–726. [Google Scholar]
  12. Xu, D.; Tian, Y. A Comprehensive Survey of Clustering Algorithms. Ann. Data Sci. 2015, 2, 165–193. [Google Scholar] [CrossRef] [Green Version]
  13. Wong, K. A Short Survey on Data Clustering Algorithms. In Proceedings of the International Conference on Soft Computing and Machine Intelligence (ISCMI), Hong Kong, China, 23–24 November 2015; pp. 64–68. [Google Scholar]
  14. Shirkhorshidi, A.S.; Aghabozorgi, S.; Wah, T.Y. A Comparison Study on Similarity and Dissimilarity Measures in Clustering Continuous Data. PLoS ONE 2015, 10, e0144059. [Google Scholar] [CrossRef] [PubMed]
  15. Bouveyron, C.; Girard, S.; Schimid, C. High-Dimensional Data Clustering. Elsevier Comput. Stat. Data Anal. 2007, 52, 502–519. [Google Scholar] [CrossRef]
  16. Min, E.; Guo, X.; Liu, Q.; Zhang, G.; Cui, J.; Long, J. A Survey of Clustering With Deep Learning: From the Perspective of Network Architecture. IEEE Access 2018, 6, 39501–39512. [Google Scholar] [CrossRef]
  17. Jang, G.; Kim, H.; Oh, Y. Audio Source Separation Using a Deep Autoencoder. arXiv 2014, arXiv:1412.7193. [Google Scholar]
  18. Chorowski, J.; Weiss, R.J.; Bengio, S.; Oord, A. Unsupervised speech representation learning using WaveNet autoencoders. arXiv 2019, arXiv:1901.08810. [Google Scholar] [CrossRef]
  19. Zion Golumbic, E.M.; Poeppel, D.; Schroeder, C.E. Temporal context in speech processing and attentional stream selection: A behavioral and neural perspective. Brain Lang 2012, 122, 151–161. [Google Scholar] [CrossRef] [PubMed] [Green Version]
  20. Prasetio, B.H.; Tamura, H.; Tanno, K. A Deep Time-delay Embedded Algorithm for Unsupervised Stress Speech Clustering. In Proceedings of the IEEE International Conference on Systems, Man, and Cybernetics (SMC), Bari, Italy, 6–9 October 2019. [Google Scholar]
  21. Chapelle, O.; Scholkopf, B.; Sien, A. Semi-Supervised Learning; The MIT Press: London, UK, 2007. [Google Scholar]
  22. Davidson, I.; Basu, S. A Survey of Clustering with Instance Level Constraints. ACM Trans. Knowl. Discov. Data 2007, 1, 1–41. [Google Scholar]
  23. Wagstaff, K.; Cardie, C. Clustering with Instance-level Constraints. In Proceedings of the 17th International Conference on Machine Learning (ICML), Stanford, CA, USA, 29 June–2 July 2000; pp. 1103–1110. [Google Scholar]
  24. Xu, G.; Zong, Y.; Yang, Z. Constraint-based Clustering Algorithm. In Applied Data Mining; CRC Press: Boca Raton, FL, USA, 2013; pp. 89–92. [Google Scholar]
  25. Peng, X.; Xiao, S.; Feng, J.; Yau, W.; Yi, Z. Deep Subspace Clustering with Sparsity Prior. In Proceedings of the Twenty-Fifth International Joint Conference on Artificial Intelligence (IJCAI), New York, NY, USA, 9–15 July 2016. [Google Scholar]
  26. Yang, Y.; Xu, D.; Nie, F.; Yan, S.; Zhuang, Y. Image clustering using local discriminant models and global integration. IEEE Trans. Image Process. 2010, 19, 2761–2773. [Google Scholar] [CrossRef] [PubMed]
  27. Nie, F.; Zeng, Z.; Tsang, I.W.; Xu, D.; Zhang, C. Spectral embedded clustering: A framework for in-sample and out-of-sample spectral clustering. IEEE Trans. Neural Netw. 2011, 22, 1796–1808. [Google Scholar]
  28. Peng, X.; Feng, J.; Xiao, S.; Yau, W.; Zhou, J.T.; Yang, S. Structured AutoEncoders for Subspace Clustering. IEEE Trans. Image Process. 2018, 27, 5076–5086. [Google Scholar] [CrossRef] [PubMed]
  29. Suarez Gomez, S.L.; Santos Rodriguez, J.D.; Iglesias Rodriguez, F.J.; De Cos Juez, F. Analysis of the Temporal Structure Evolution of Physical Systems with the Self-Organising Tree Algorithm (SOTA): Application for Validating Neural Network Systems on Adaptive Optics Data before On-Sky Implementation. Entropy 2017, 19, 103. [Google Scholar] [CrossRef]
  30. Yin, L.; Huang, C.; Ni, J. Clustering of gene expression data: Performance and similarity analysis. BMC Bioinformat. 2006, 7, S19. [Google Scholar] [CrossRef] [PubMed]
  31. Mateos, A.; Herrero, J.; Tamames, J.; Dopazo, J. Supervised Neural Networks for Clustering Conditions in DNA Array Data After Reducing Noise by Clustering Gene Expression Profiles. In Methods of Microarray Data Analysis II; Lin, S.M., Johnson, K.F., Eds.; Springer: Boston, MA, USA, 2002; pp. 91–103. [Google Scholar]
  32. Xie, J.; Girshick, R.; Farhadi, A. Unsupervised deep embedding for clustering analysis. In Proceedings of the 33rd International Conference on Machine Learning (ICML), New York, NY, USA, 19–24 June 2016. [Google Scholar]
  33. Graf, S.; Herbig, T.; Buck, M.; Schmidt, G. Features for voice activity detection: A comparative analysis. EURASIP J. Adv. Signal Process. 2015, 91, 1–15. [Google Scholar] [CrossRef]
  34. LeCun, Y.; Bengio, Y. Convolutional networks for images, speech, and time series. In The Handbook of Brain Theory and Neural Networks, 2nd ed.; Arbib, M.A., Ed.; The MIT Press: Cambridge, MA, USA, 1995; pp. 276–278. [Google Scholar]
  35. Peddinti, V.; Povey, D.; Khudanpur, S. A Time Delay Neural Network Architecture for Efficient Modeling of Long Temporal Contexts. In Proceedings of the Annual Conference of the International Speech Communication Association (INTERSPEECH), Dresden, Germany, 6–10 September 2015. [Google Scholar]
  36. Prasetio, B.H.; Tamura, H.; Tanno, K. Generalized Discriminant Methods for Improved X-Vector Back-end Based Speech Stress Recognition. IEEJ Trans. Electron. Inf. Syst. 2019, 139, 1341–1347. [Google Scholar] [CrossRef]
  37. Hansen, J.H.L. Composer. SUSAS LDC99S78. Web Download. In Sound Recording; Linguistic Data Consortium: Philadelphia, PA, USA, 1999. [Google Scholar]
  38. Hansen, J.H.L. Composer. SUSAS Transcript LDC99T33. In Sound Recording; Linguistic Data Consortium: Philadelphia, PA, USA, 1999. [Google Scholar]
  39. Ibrahim, N.S.; Ramli, D.A. I-vector Extraction for Speaker Recognition Based on Dimensionality Reduction. In Proceedings of the International Conference on Knowledge-Based and Intelligent Information & Engineering Systems (KES), Belgrade, Serbia, 3–5 September 2018. [Google Scholar]
  40. Peddinti, V.; Chen, G.; Povey, D.; Khudanpur, S. Reverberation robust acoustic modeling using i-vectors with time delay neural networks. In Proceedings of the Annual Conference of the International Speech Communication Association (INTERSPEECH), Dresden, Germany, 6–10 September 2015. [Google Scholar]
  41. Feng, X.; Zhang, Y.; Glass, J. Speech Feature Denoising and Dereverberation via Deep Autoencoders for Noisy Reverberant Speech Recognition. In Proceedings of the IEEE International Conference on Acoustic, Speech and Signal Processing (ICASSP), Florence, Italy, 4–9 May 2014. [Google Scholar]
Figure 1. The Proposed SDETC’s framework.
Electronics 08 01263 g001
Figure 2. The stress speech recognition (SSR) system structure.
Electronics 08 01263 g002
Figure 3. The objective function of SDTEC.
Electronics 08 01263 g003
Figure 4. Ablation study in different hyper parameters. (ac) shows model performance in different value of α , β , and γ , respectively. For each value of the parameter in a plot, the horizontal line denotes the error means and the vertical bars indicate their error variances.
Electronics 08 01263 g004
Figure 5. The visualization of class distribution in different objective loss performed. (a) shows the class distribution for single supervision of unsupervised loss L u , as DTEC performed. (b) shows the class distribution for joint supervision of unsupervised L u and semi-supervised loss L s , as SDTEC performed.
Electronics 08 01263 g005
Figure 6. Ablation study in different number of constraints.
Electronics 08 01263 g006
Table 1. The TDNN-based autoencoder structure.
FunctionHidden LayerContext
Layer-1{−4,+4}
EncoderLayer-2{−3,+3}
Layer-3{−6,+2}
Feature spaceEmbedding{0}
Layer- 3 ^ {−6,+2}
DecoderLayer- 2 ^ {−3,+3}
Layer- 1 ^ {−4,+4}
Table 2. The clustering performance comparison.
MethodClustering Error Rate (% CER)
Km55.79
Km+PC58.95
Km+AE36.17
Km+AE+PC34.55
SOTA31.28
DEC30.14
DTEC29.93
Proposed SDTEC24.22
Table 3. The SDTEC and DTEC identification error rate (%).
ClusterDTECSDTEC
126.0823.91
234.3723.43
325.5122.44
436.4323.51
527.2724.79

