Article

LDMOS versus GaN RF Power Amplifier Comparison Based on the Computing Complexity Needed to Linearize the Output

by
Raúl Gracia Sáez
1 and
Nicolás Medrano Marqués
2,*
1
Research and Development Department, Teltronic S.A.U., Malpica Industrial Area, 50016 Zaragoza, Spain
2
Electronics and Communication Department, University of Zaragoza, Faculty of Physics, 50009 Zaragoza, Spain
*
Author to whom correspondence should be addressed.
Electronics 2019, 8(11), 1260; https://doi.org/10.3390/electronics8111260
Submission received: 13 September 2019 / Revised: 29 October 2019 / Accepted: 30 October 2019 / Published: 1 November 2019
(This article belongs to the Section Semiconductor Devices)

Abstract

:
In order to maximize the efficiency of telecommunications equipment, it is necessary that the radio frequency (RF) power amplifier is situated as closely as possible to its compression point. This makes its response nonlinear, and therefore it is necessary to linearize it, in order to minimize the interference that nonlinearities cause outside the useful band (adjacent channel). The system used for this linearization occupies a high percentage of the hardware and software resources of the telecommunication equipment, so it is interesting to minimize its complexity in order to make it as simple as possible. This paper analyzes the differences between the laterally diffused MOSFET (LDMOS) and gallium nitride (GaN) power amplifiers, in terms of their nonlinearity graphs, and in terms of the greater or lesser difficulty of linearization. A correct choice of power amplifier will allow for minimization of the linearization system, greatly simplifying the complexity of the final design.

1. Introduction

In order to increase efficiency and to meet the telecommunications standards, many different techniques [1] have been proposed and employed to extend the linear range of the power amplifier (PA) response in radiofrequency (RF) communications: crest factor reduction (CFR), feedback linearization, feedforward linearization, predistortion techniques, envelope elimination and restoration (EER), linear amplification using nonlinear components (LINC), and combined Analog Locked Loop Universal Modulator (CALLUM).
The most commonly used linearization systems are those that use predistortion techniques to linearize the power amplifier (Figure 1).
The objective of the predistorter is to correct the nonlinearity that is introduced by the amplifier by distorting the input signal x(t) to be amplified, so that the PA output presents a behavior that is proportional to the input signal x(t) (Figure 1), minimizing the nonlinear distortion and hence improving the corresponding adjacent channel power (ACP). The ACP is the part of the frequency spectrum of the signal generated in our channel that interferes with the adjacent frequency channels [1]. The reduction of the ACP allows for transmissions at higher RF power levels using the same amplifier, therefore increasing its efficiency.
Many techniques have been developed to implement the predistorter: Volterra series [2], Memory Polynomials [3], Wiener and Hammerstein models [4], Lookup Tables (LUTs) [5], Neural Networks [6], Neural–Fuzzy systems [7], Genetic Algorithms [8], etc.
A lot of engineers face every day the problem of having to linearize a power amplifier, employing a limited number of computational resources, and discovering that not all of the amplifiers can be linearized using the same techniques. The aim of this work is to show how to simplify the design of the linearization system by means of the correct choice of power amplifier. It will be shown that the variation of the output power versus the input power must be deeply analyzed before the amplifier selection. This will decrease the number of computational resources required to linearize the system and to meet the telecommunication standards.
This paper is structured as follows. Section 2 presents the materials and methods that were used in the elaboration of this work. Section 3.1 describes how a predistorter works. Section 3.2 shows a comparison between laterally diffused MOSFET (LDMOS) and gallium nitride (GaN) power amplifiers. Section 3.3 presents a comparison of the required hardware and software resources to implement predistorters for LDMOS and GaN power amplifiers. Section 3.4 shows the obtained results of linearizing an LDMOS and a GaN amplifier using a Multilayer Perceptron Neural Network Digital Predistorter (DPD). Finally, Section 4 presents the conclusions of this work.

2. Materials and Methods

The following power amplifiers were considered in this paper:
-
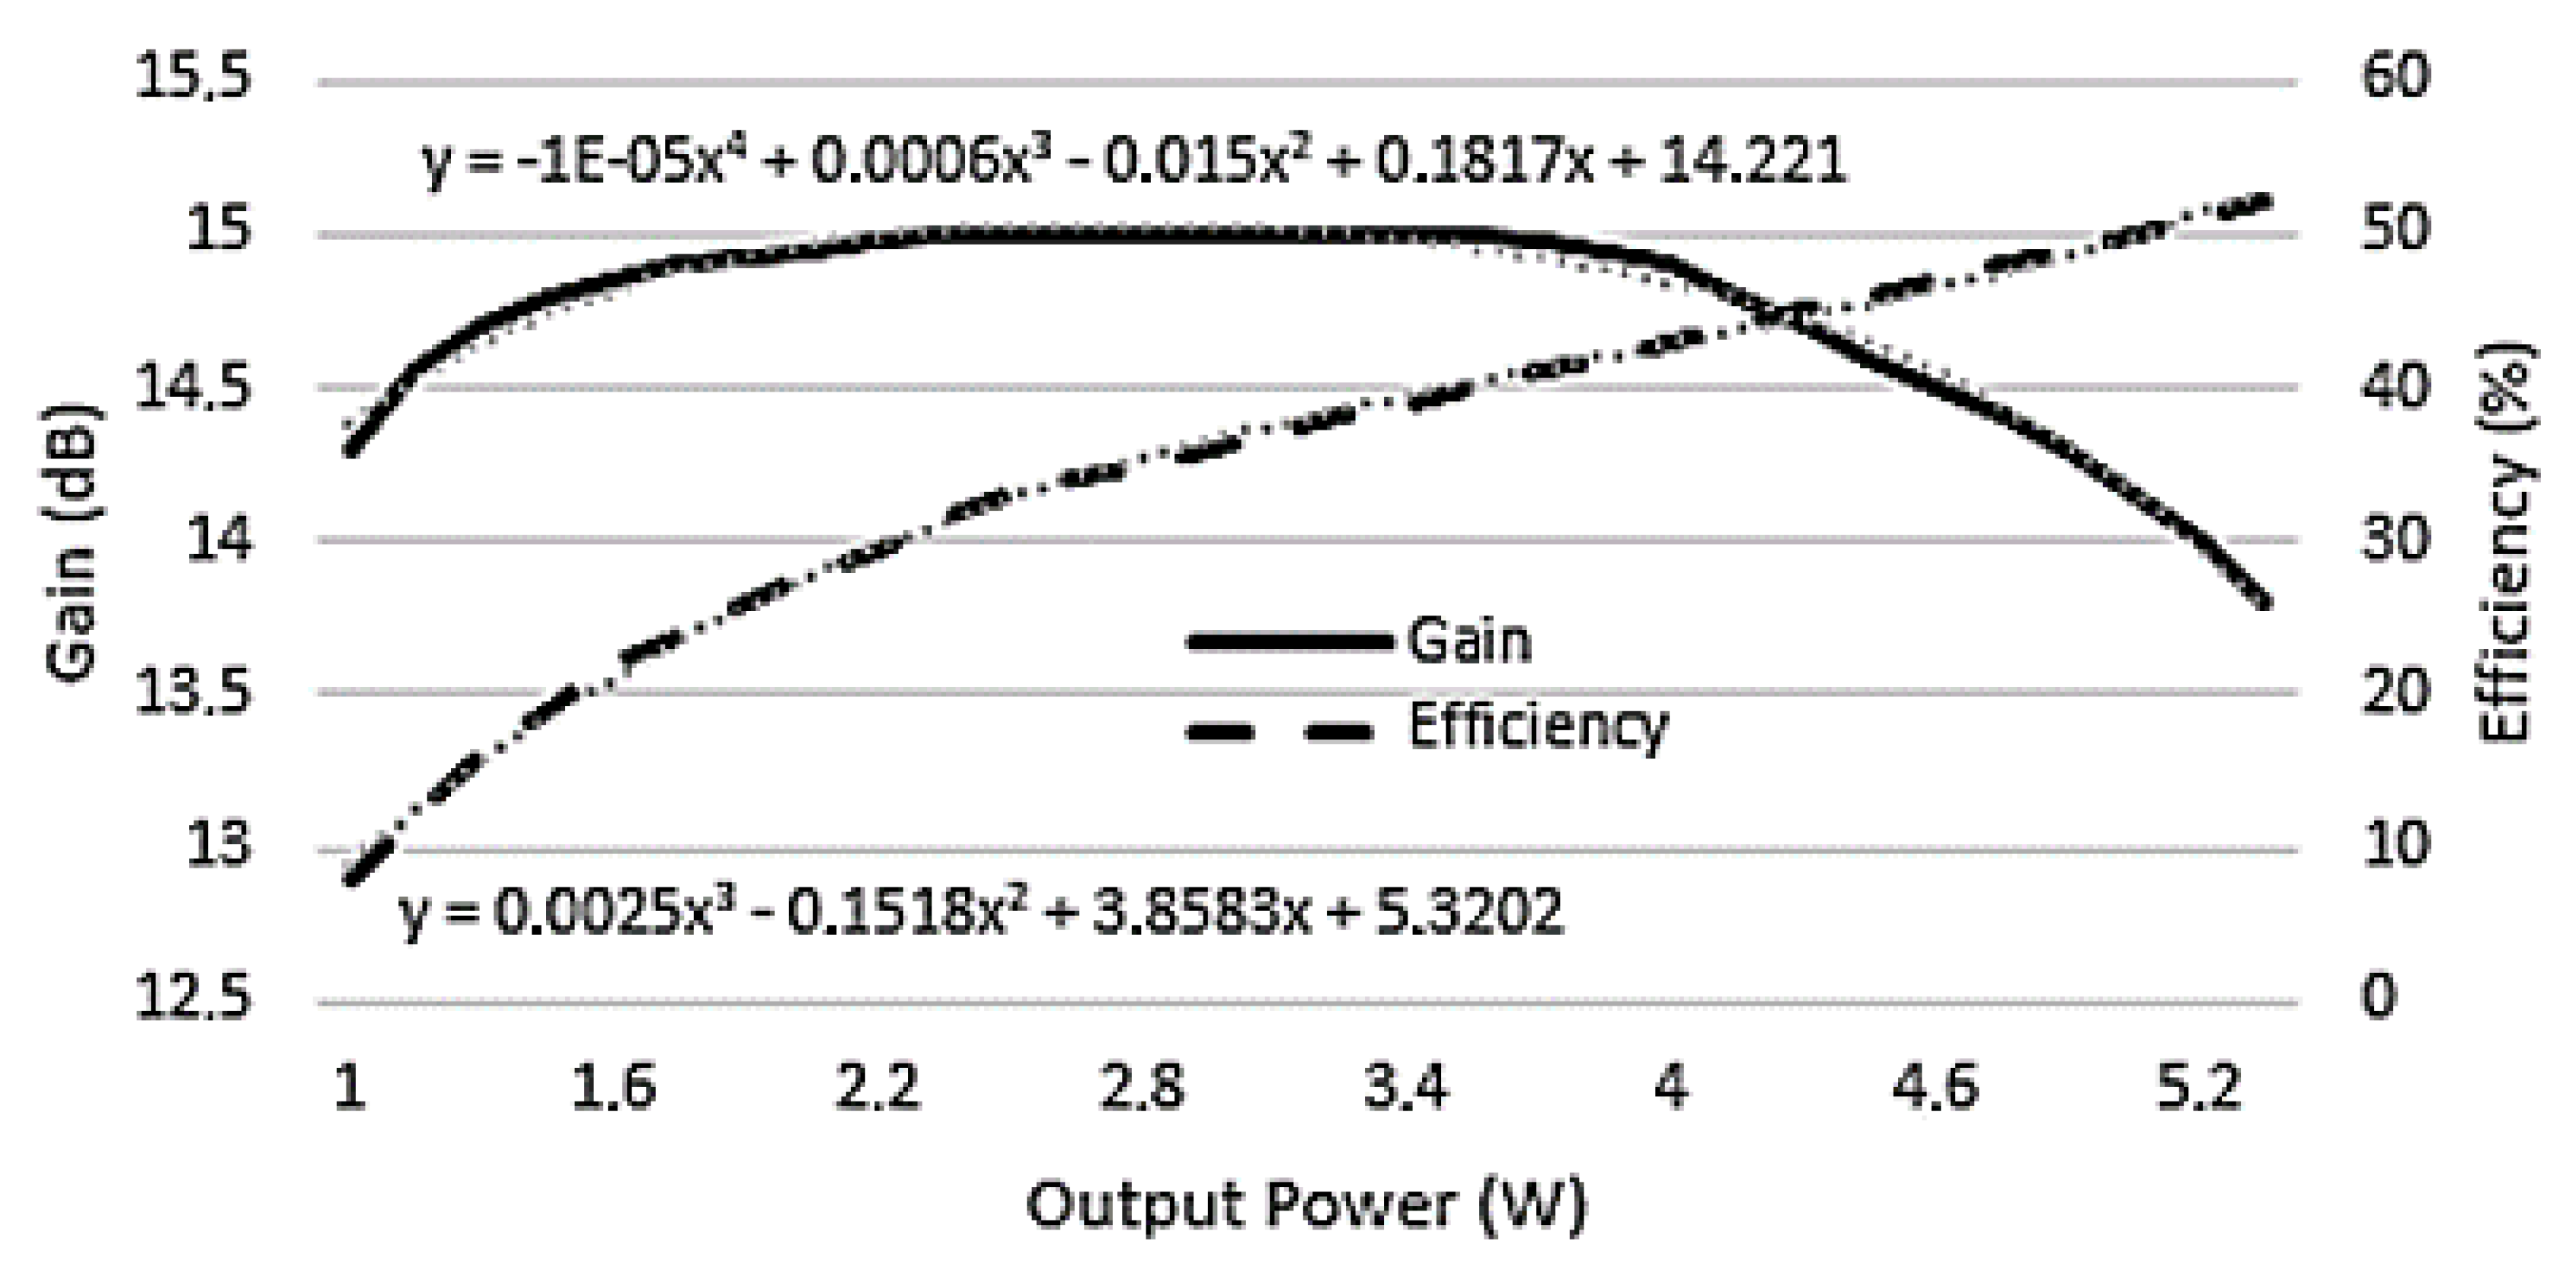
PD57006S-E: an LDMOS amplifier manufactured by ST Microelectronics, with the following characteristics:
-
Output power: 5 W
-
Power supply: 28 V
-
Gain: 14.8 dB
-
Efficiency: 50%
-
NPTB00004A: a GaN amplifier manufactured by MACOM, with the following characteristics:
-
Output power: 6 W
-
Power supply: 28 V
-
Gain: 15 dB
-
Efficiency: 62%
The OMAP-L138, manufactured by Texas Instruments, was used to implement the predistortion techniques. It is a low-power DSP (Digital Signal Processor) + ARM (Advanced RISC Machine) processor capable of working at a clock frequency of 456 MHz.
The neural networks that we used in this paper were trained using the Matlab Neural Network Toolkit.
TETRA was selected as the telecommunication standard to modulate the input signal of the power amplifiers. TETRA is a 25 KHz bandwidth digital standard designed for professional radio communications.

3. Results

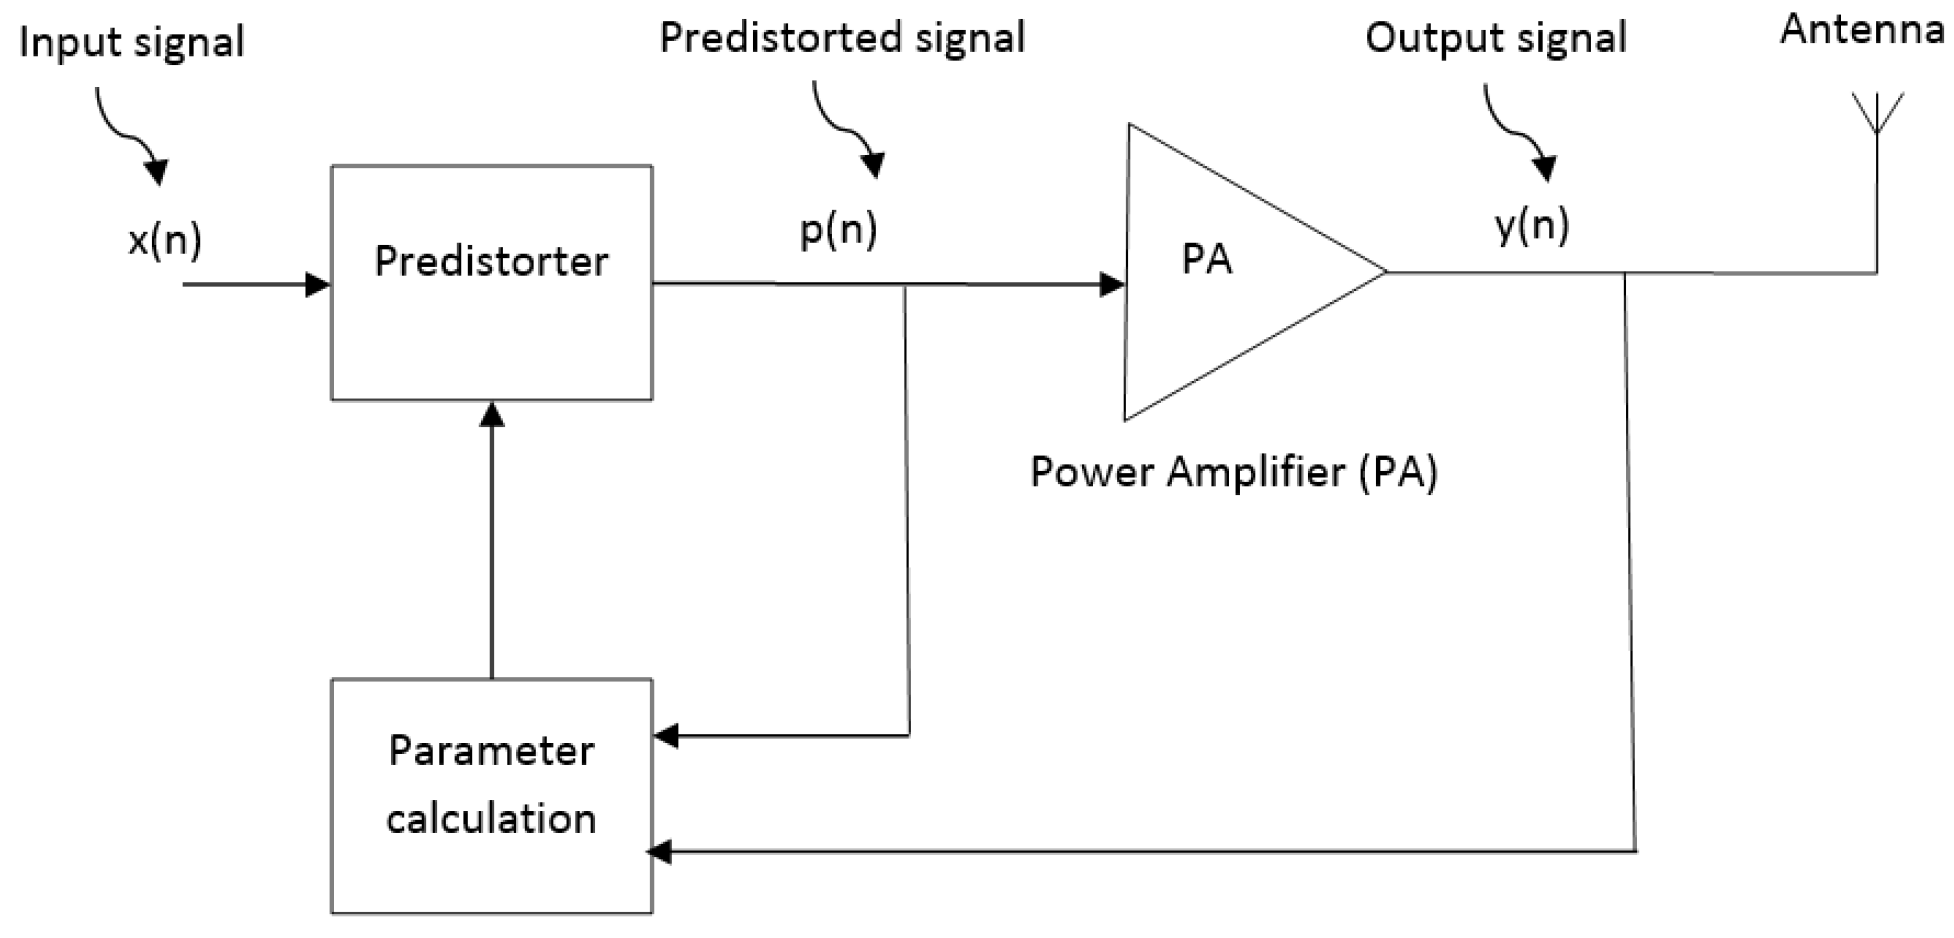
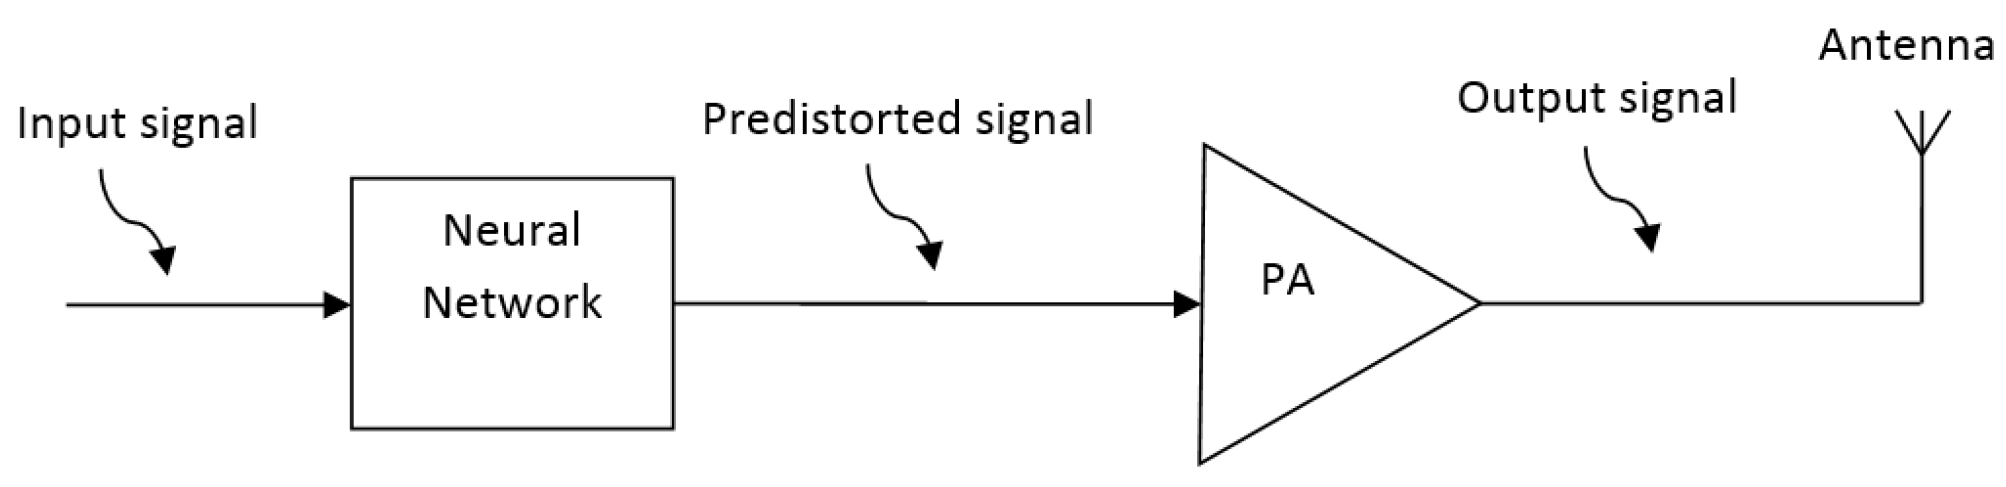
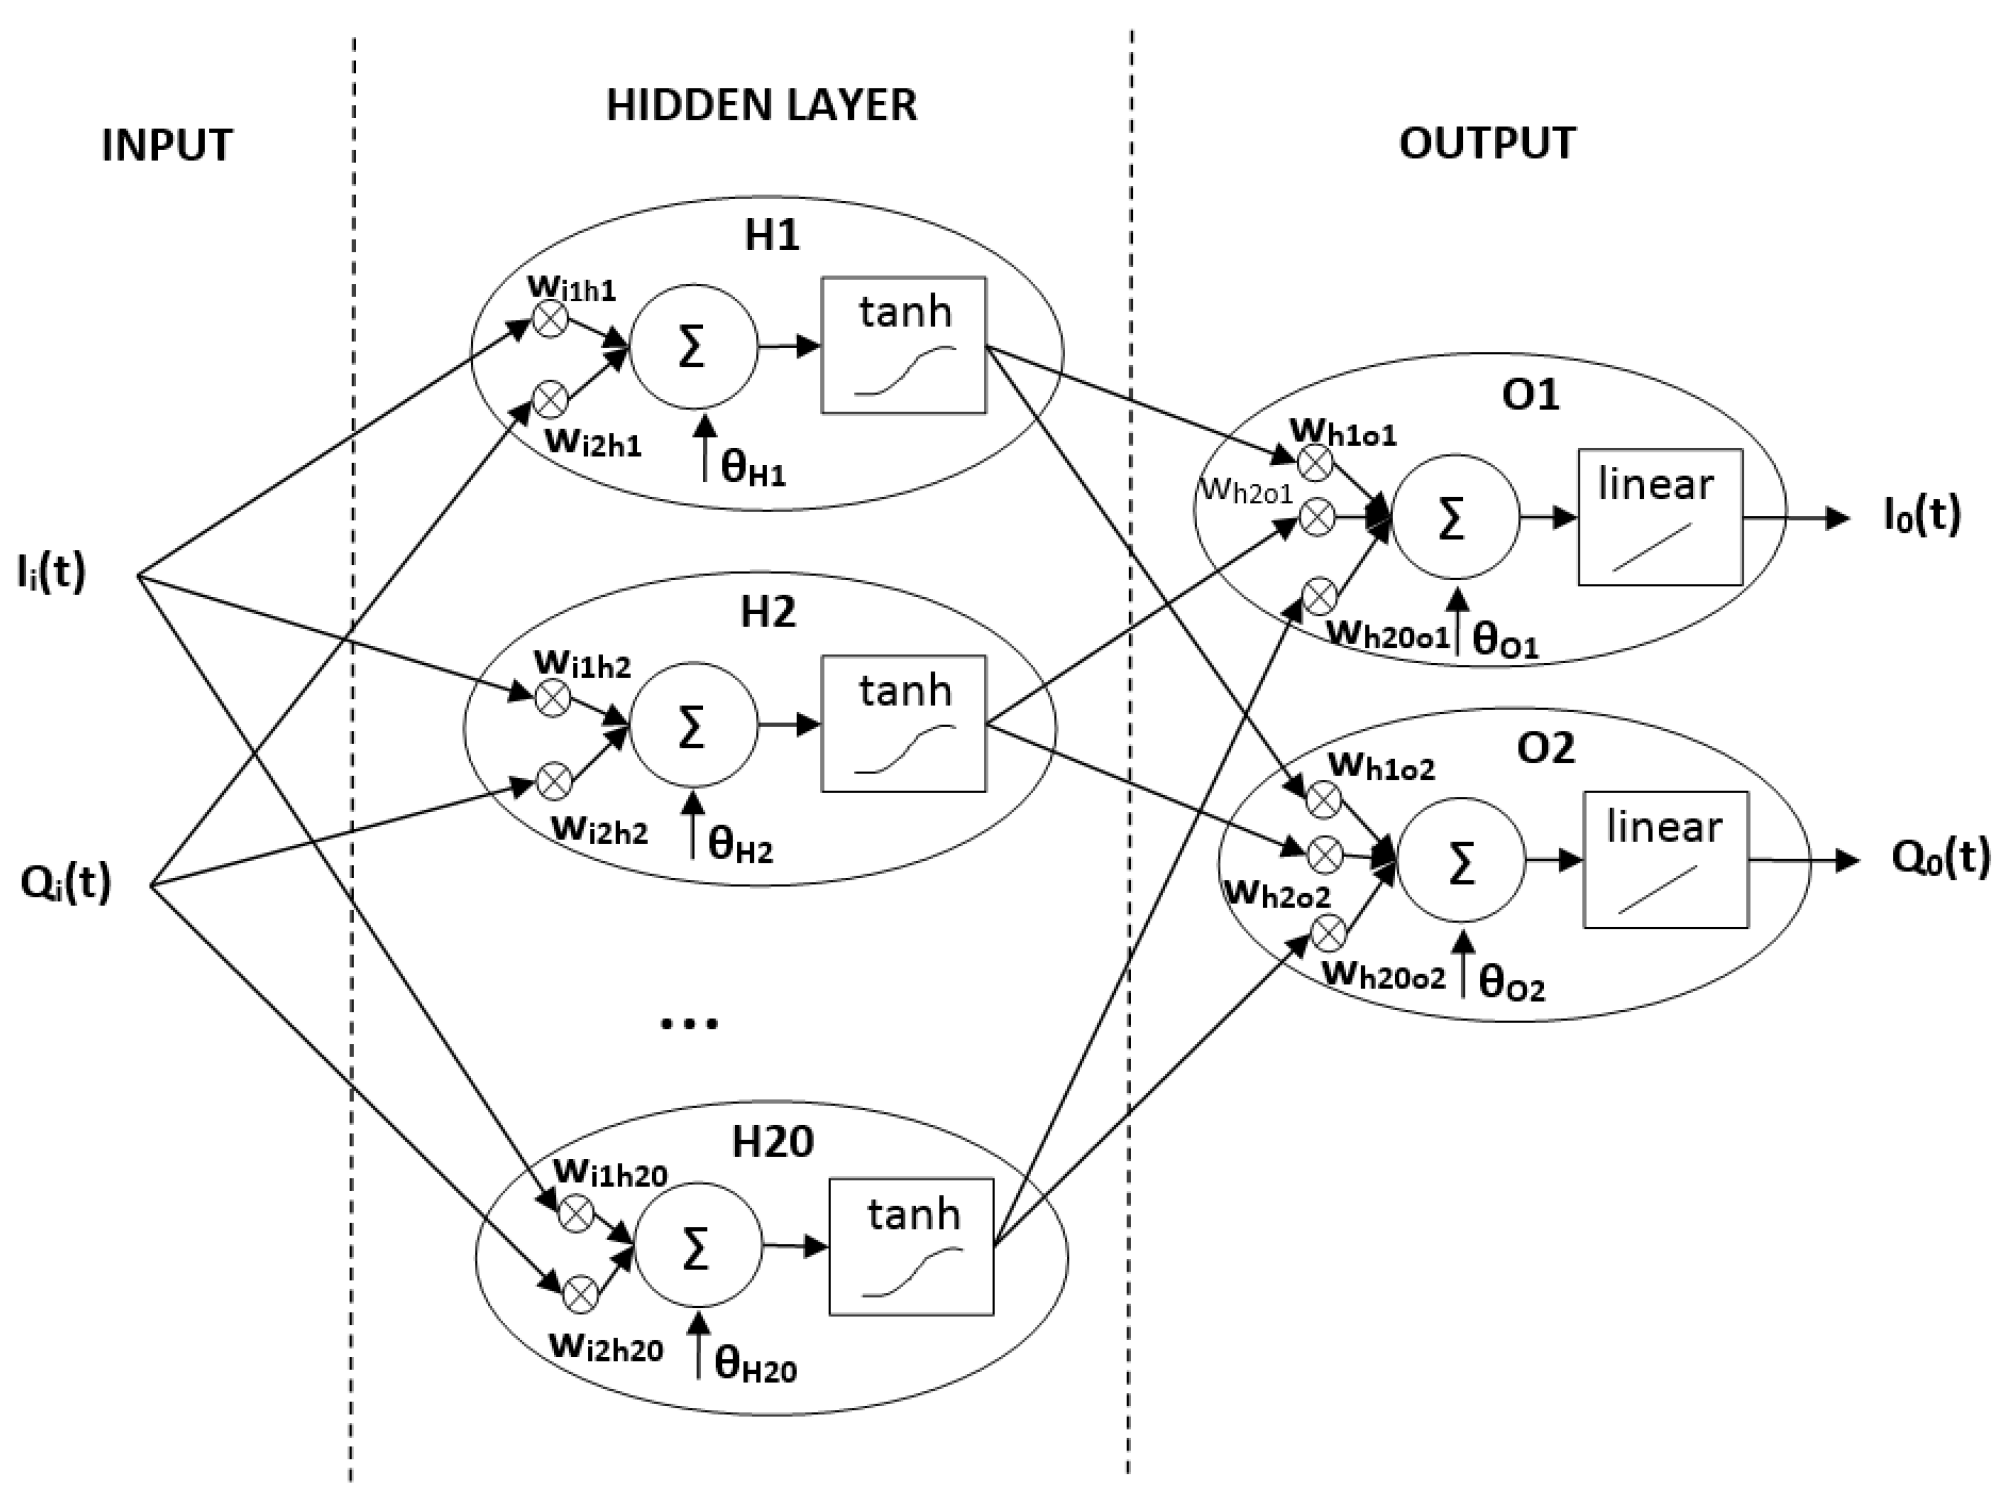
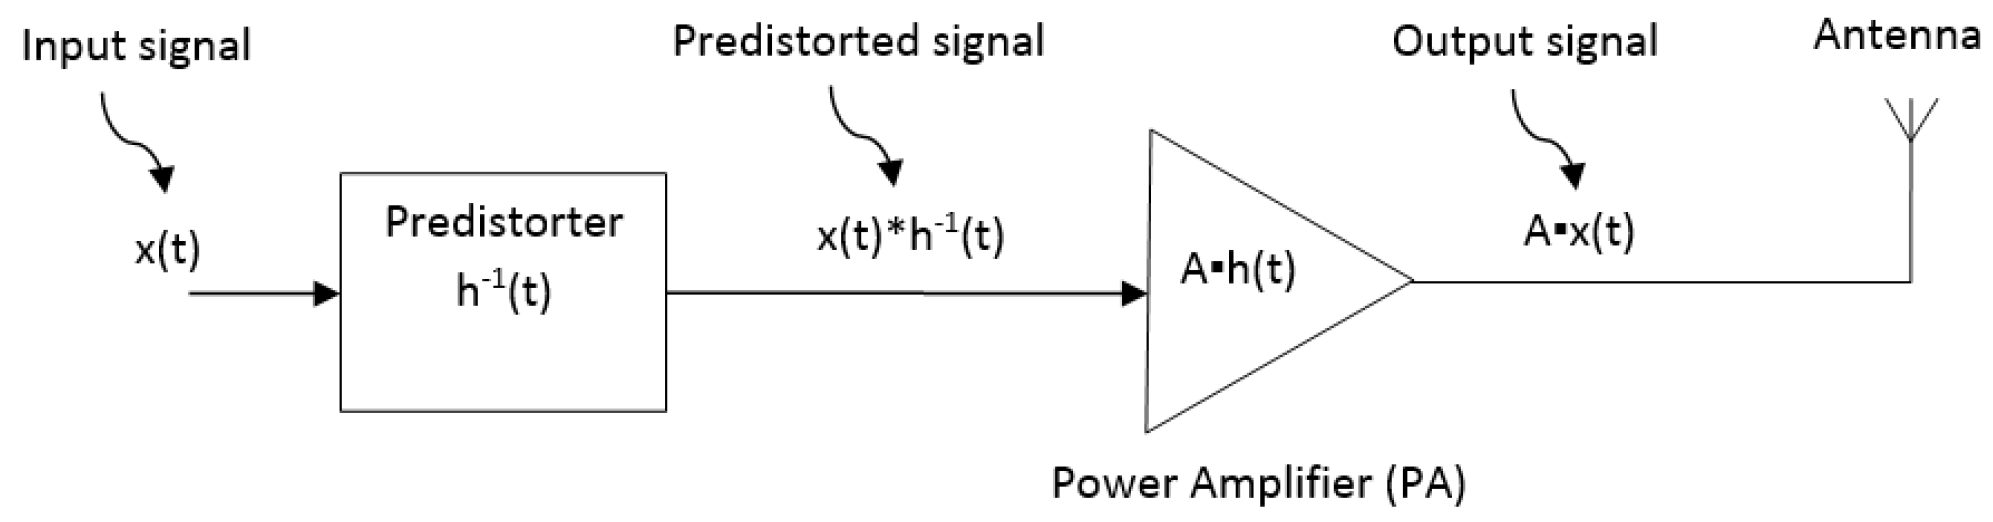
3.1. Predistortion Technique

Figure 2 shows the typical Gain (G) and Efficiency (η) curves for an LDMOS power amplifier (model PD57006S-E manufactured by ST Microelectronics).
As Figure 2 shows, as the output power increases, the efficiency of the amplifier also increases, up to a maximum value from which the gain begins to fall. The power output compression point (P1dB) is the output power that generates a gain compression of 1 dB in the amplifier. As the output power of the amplifier approaches the P1dB, the amplifier enters into the nonlinear operation region, distorting the output signal. Since the device must be as efficient as possible, the PA is configured to work near the P1dB of the amplifier, and therefore it will be necessary to apply a linearization technique in order to minimize the nonlinear distortion.
One of these linearization techniques is predistortion. As can be seen in Figure 1, the predistorter module modifies the input signal of the PA in order to pre-correct its nonlinearity. For this, the predistorter operation should be as similar as possible to the inverse function of the PA transfer function. There are different techniques to estimate the PA transfer function (Figure 3), and one of the most commonly used is the Memory Polynomial method.
The Memory Polynomial model consists of:
y ( n ) = k = 0 K 1 m = 0 M 1 a k m p ( n m ) | p ( n m ) | k
where K is the order of the polynomial model and M is the memory depth.
When the signal bandwidth is wide (hundreds of kHz), the memory effect of the PA becomes relevant, requiring it to be taken into account. Otherwise, when the signal bandwidth is narrow (<100 kHz), the memory effect is negligible (M = 1) and therefore (1) can be reduced to:
y ( n ) = k = 0 K 1 a k p ( n ) | p ( n ) | k .
Thus, the transfer function of the PA is modeled as a polynomial, and its inverse function is used as the transfer function of the predistorter module.
The feedback path in Figure 3 provides memory compensation (if necessary) and allows for a continuous compensation loop against changes in the PA transfer function due to temperature, frequency, or power supply variations.
This predistortion technique requires the transfer function to be recalculated periodically, adding complexity to the design, due to the required hardware and software resources. Therefore, reducing the degree of the polynomial model of the PA becomes mandatory to minimize the used resources to obtain the transfer function, for which correct selection of the PA will be pivotal, as will be seen in the next sections.

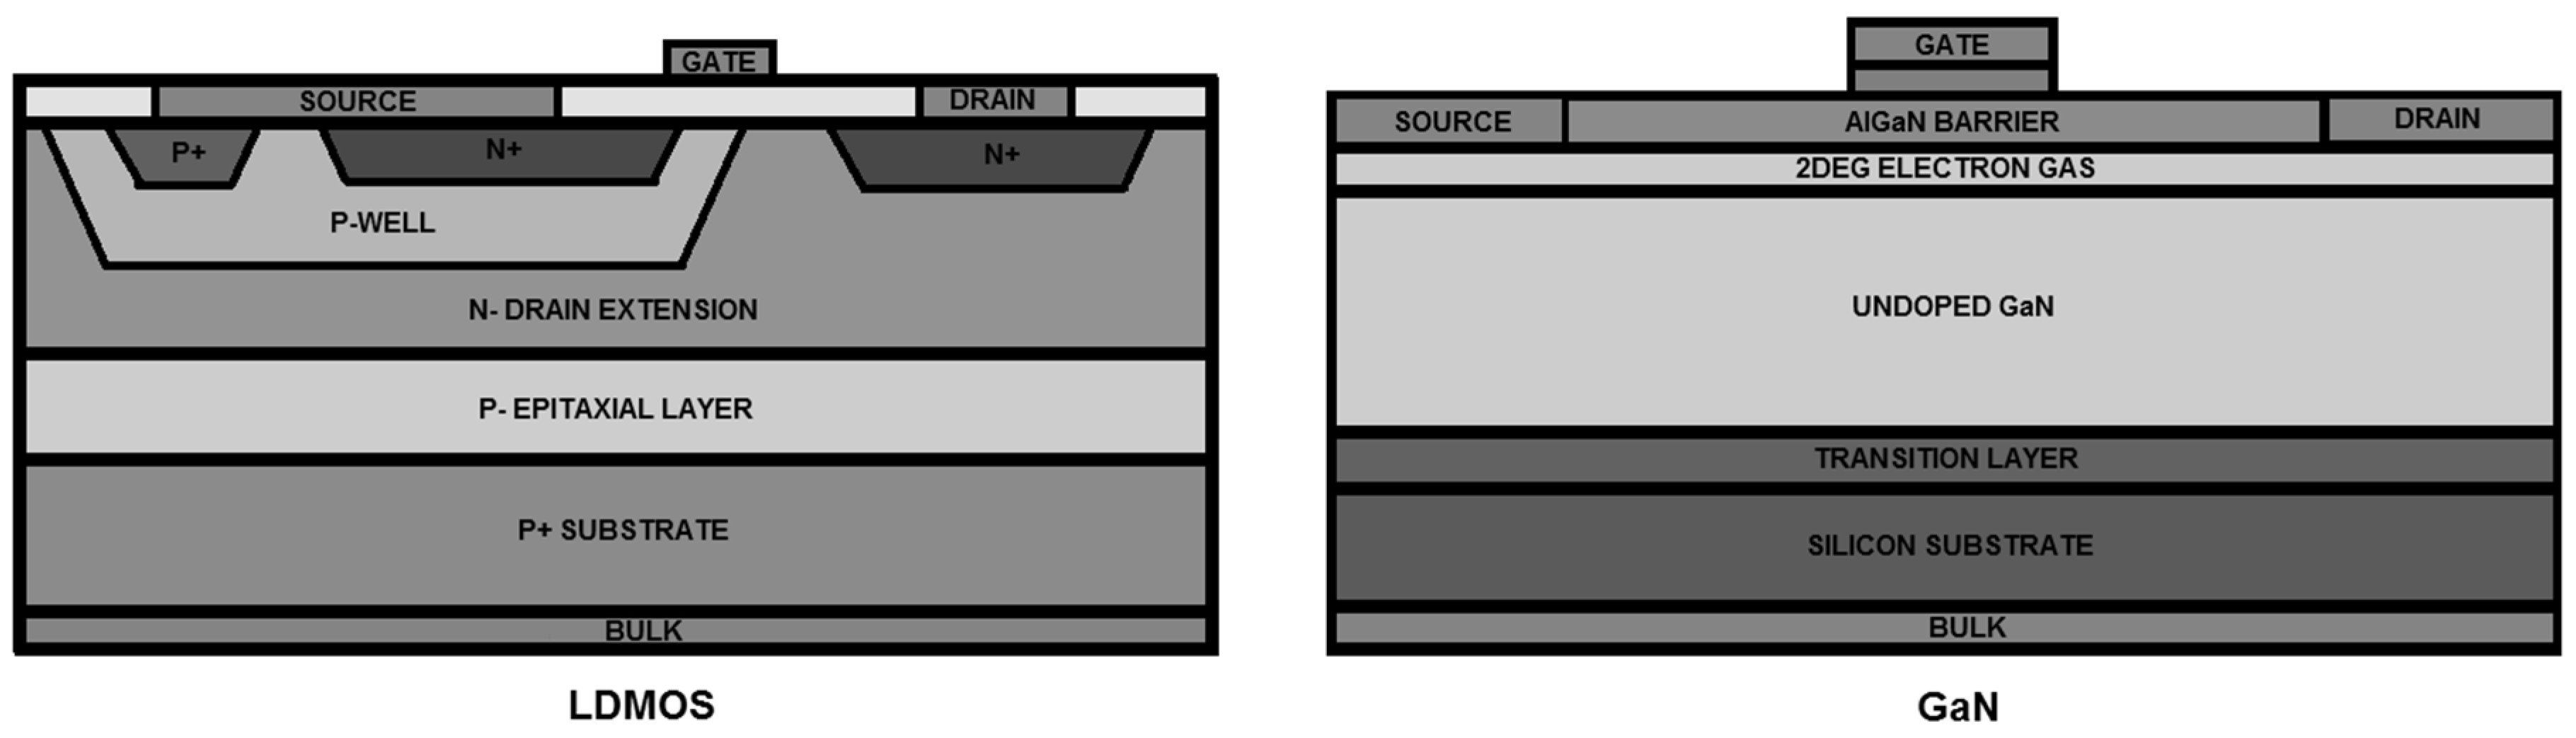
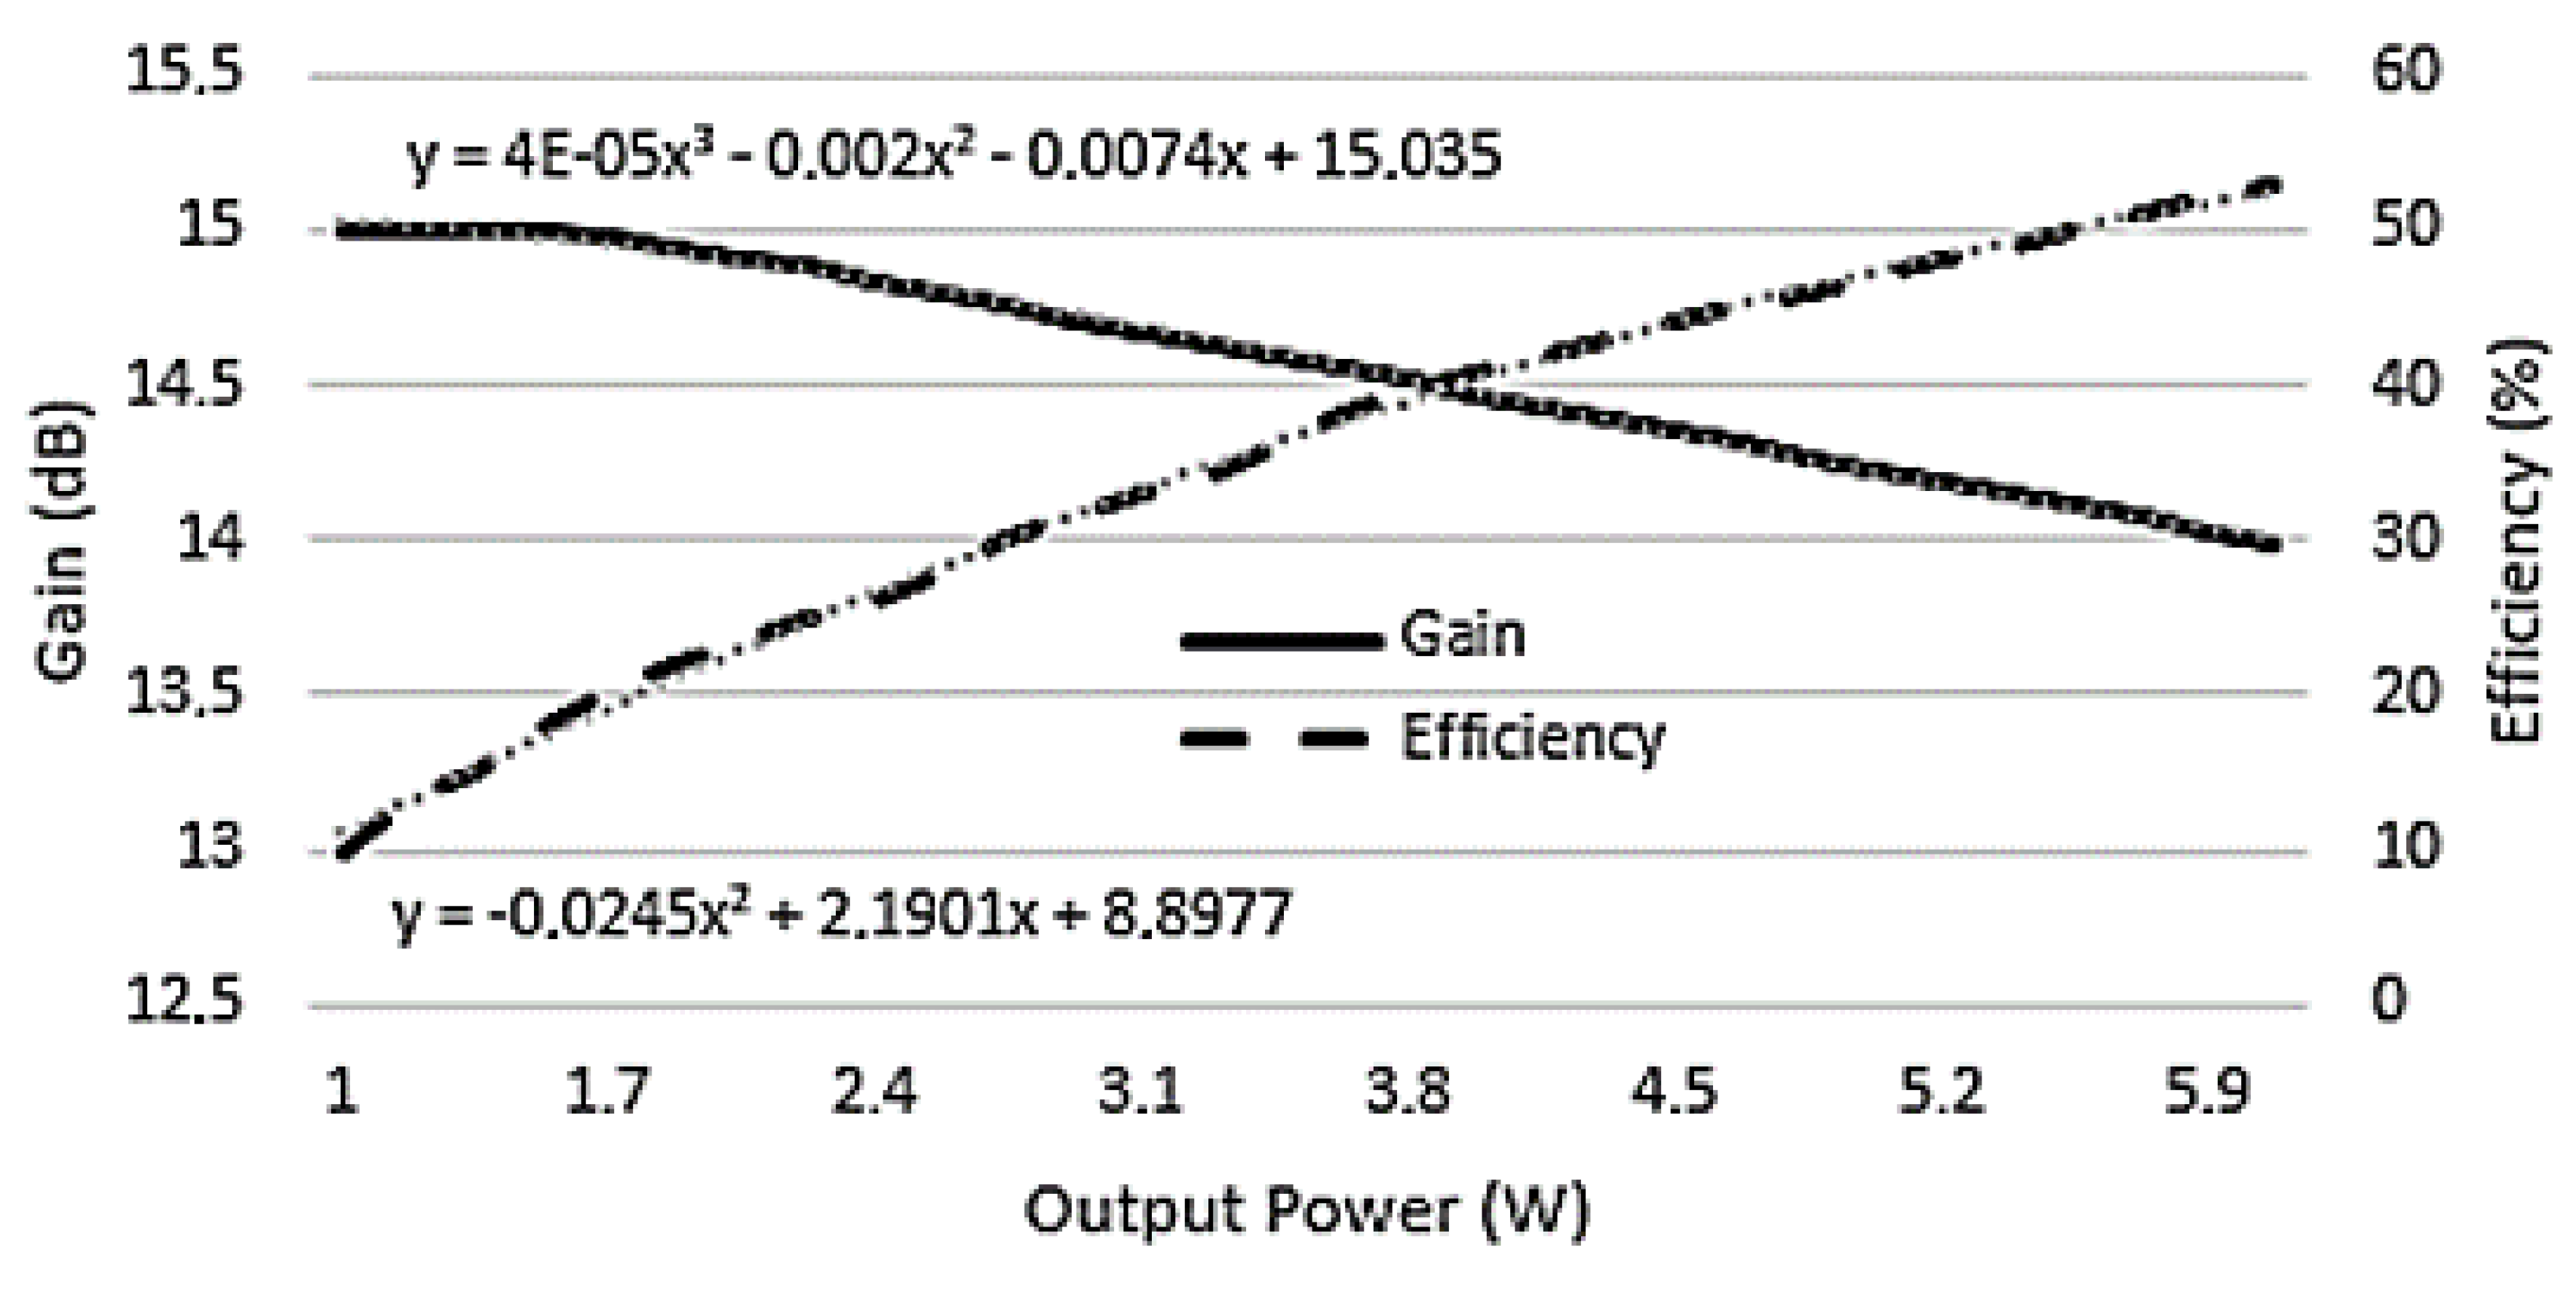
3.2. LDMOS versus GaN Power Amplifiers

Until the appearance of GaN amplifiers (around 2005), LDMOS amplifiers had dominated the market of high-power RF transmissions at frequencies below 2 GHz due to their low cost. The only competitors were the gallium arsenide (GaAs) amplifiers that allowed for higher frequencies, but at low power-transmission levels and with higher cost.
Currently, although the improvements in LDMOS amplifier characteristics allow for frequency ranges up to 22 GHz, GaN-based amplifiers [9] achieve frequencies up to 30 GHz at power densities up to five times higher, although at higher prices than LDMOS devices. Figure 4 shows the LDMOS and GaN transistor structures.
The main advantage of GaN is its higher power density. This is due to a band gap between the conduction and valence bands (Figure 5) that is higher than in LDMOS technologies, which provides both high breakdown voltages and power densities.
A comparison between LDMOS and GaN technologies is shown in Table 1.
Higher power density allows for GaN power amplifiers to operate at higher temperatures, therefore simplifying heat-sink and cooling requirements.
The lower input capacitance (gate-source capacitance, Cgs) of GaN power amplifiers results in lower amplitude modulation to phase modulation (AM-PM) distortion values [10] than LDMOS. This, together with a lower output capacitance (drain-source capacitance, Cds) and the higher input and output resistances (Rin and Rout), makes input and output impedances for the GaN power amplifiers higher, therefore allowing for simpler and lower loss circuits and wide bandwidth matching networks. Currently, this makes the GaN PAs more widely used than the LDMOS devices for broadband applications.
Nevertheless, LDMOS transistors are still more widely used than GaN PAs in some specific applications, such as wireless infrastructures, low-power battery-operated transceivers, small cells, and some microwave links, mainly because LDMOS devices can use plastic packaging—significantly reducing their cost. In addition, LDMOS transistors are more robust against impedance mismatching, which makes them preferable in the aforementioned application fields.
If we analyze the typical characteristics of a GaN PA, model NPTB00004A manufactured by MACOM (Figure 6), we observe that it has a smoother transition into the saturated region than a LDMOS PA (Figure 2).
As will be seen in Section 3.3, this smoother transition can be critical in order to determine the linearization system complexity.
Since there are not generic equations for the Gain and for the Efficiency of LDMOS and GaN transistors, we can approximate these equations for the transistor models selected in this paper (Table 2).

3.3. Complexity Analysis of the Linearization System (LDMOS vs. GaN)

In order to compare the linearization complexity of GaN and LDMOS power amplifiers [11], we can draw their output power versus input power. Figure 7 and Figure 8 show the experimental input–output transfer functions and polynomial approximations for LDMOS and GaN, respectively, for different polynomial orders.
As can be seen in Figure 8, a third-order polynomial is enough to model GaN PAs with an error level below 0.1%, while a fourth-order polynomial is required for LDMOS amplifiers (Figure 7), achieving an error of 0.6%. Therefore, it can be assumed that GaN amplifiers will require a lower number of coefficients and computing resources to implement a predistortion linearization technique than LDMOS devices will.
This higher complexity needed to linearize the LDMOS amplifiers is due mainly to the hump the LDMOS characteristically presents before the power output saturation (Figure 2), compared to the GaN PA’s smoother shape. This difference can be also observed when comparing Figure 2 and Figure 6.
Furthermore, the GaN PA’s smoother behavior near the transition into saturation means that GaN amplifiers can operate closer to the saturated region, where efficiency is higher and distortion slowly increases as the device approaches saturation. This allows GaN amplifiers to operate nearer to the P1dB point.

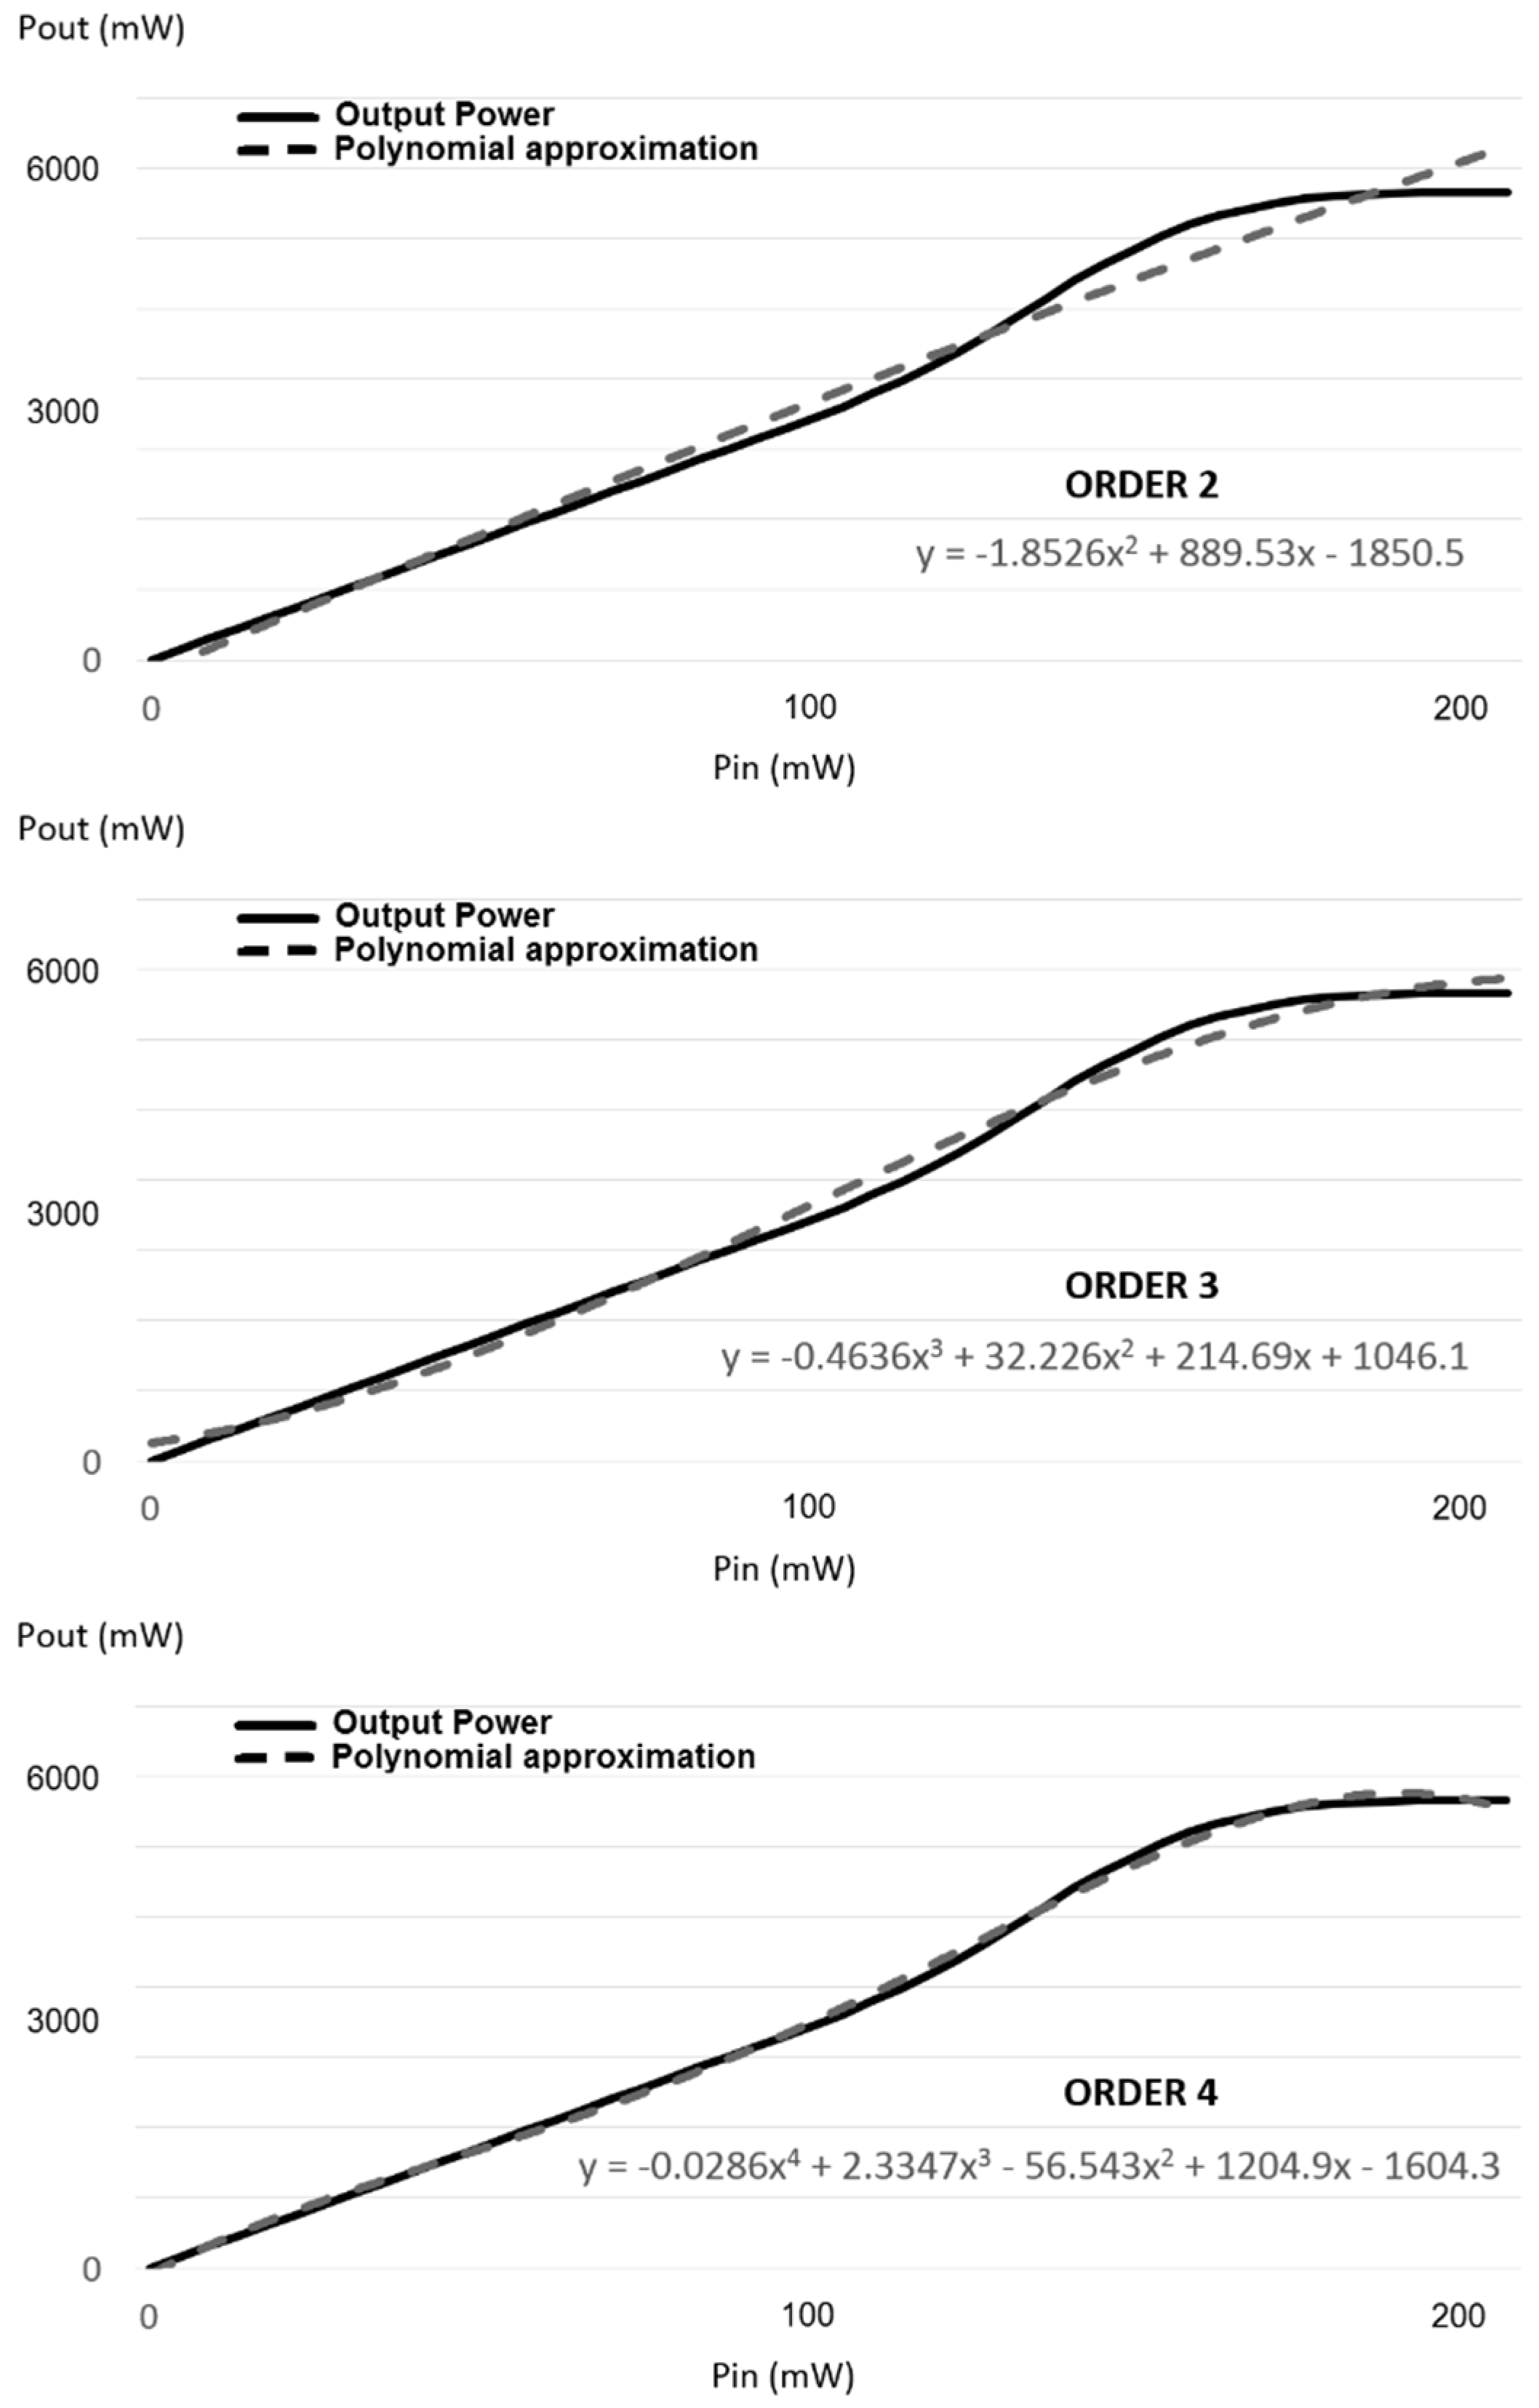
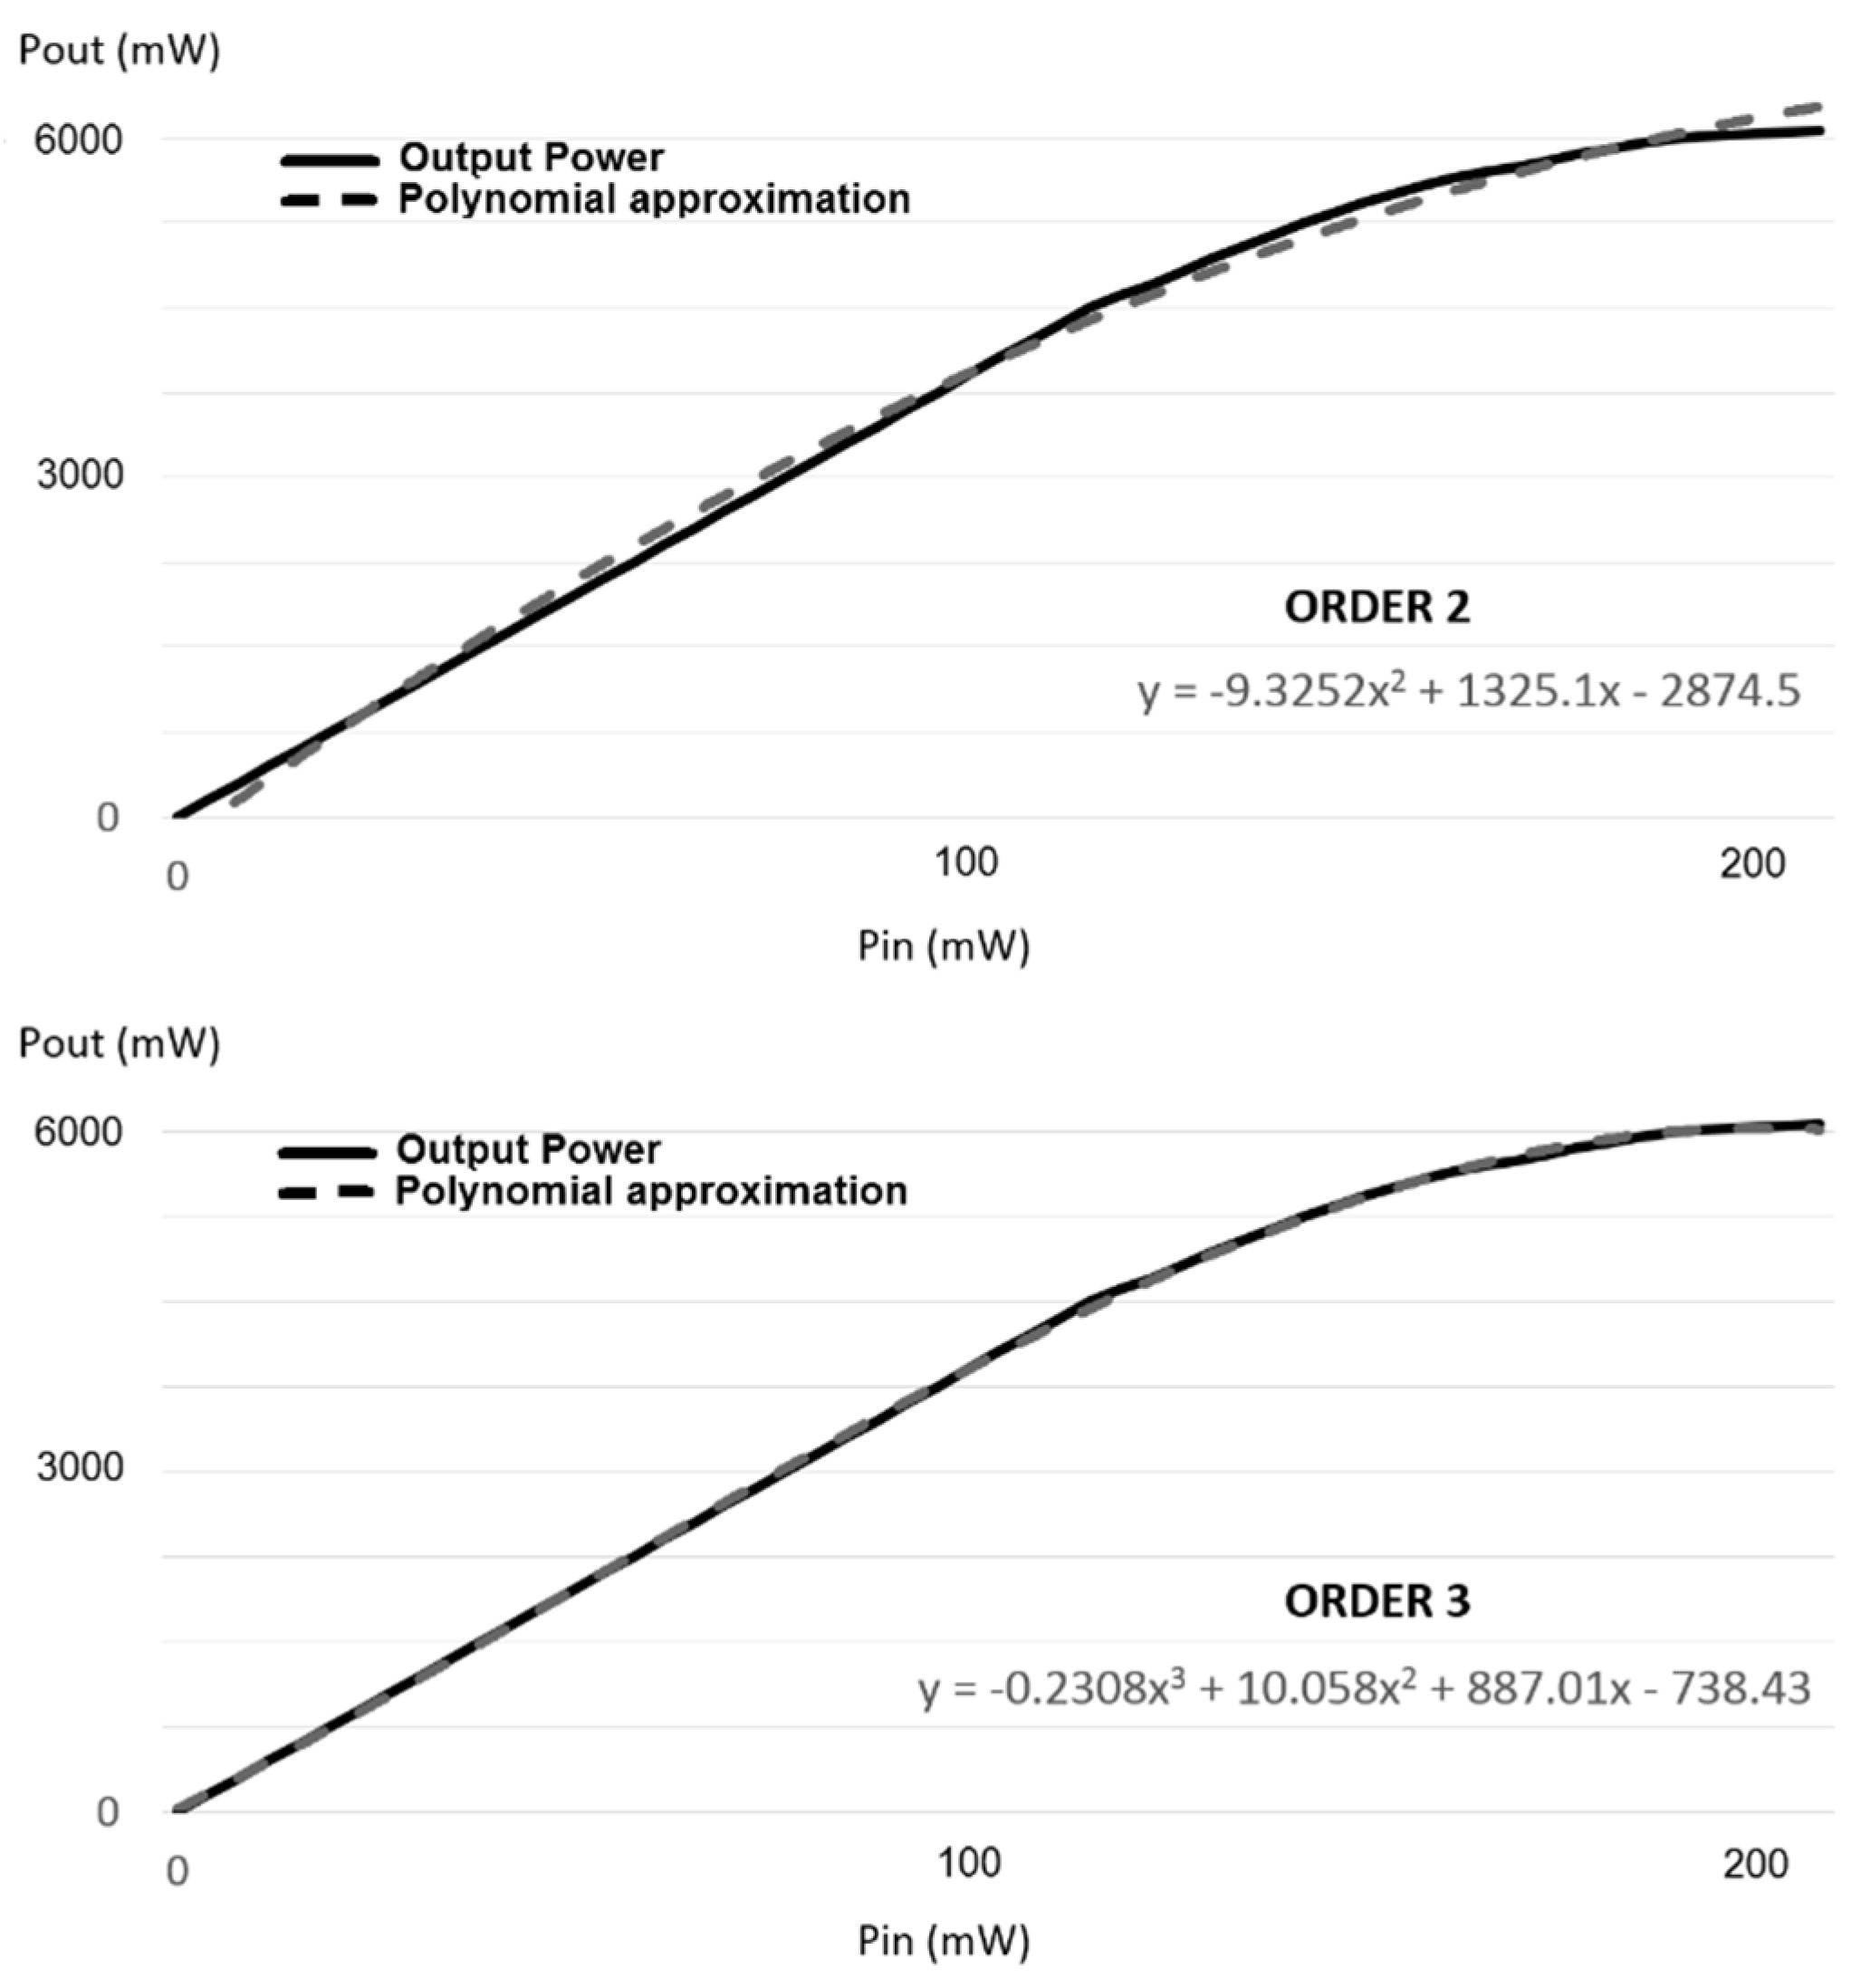
3.4. Power Amplifier Complexity Comparison

A comparison of the complexity required in the linearization of the output power between LDMOS and GaN PAs was carried out by analyzing the resources necessary to meet the standard TETRA specifications [12]. For this, a multilayer perceptron (MLP) neural network DPD was selected as predistorter technique. This technique has previously shown its advantages compared to classical predistortion techniques [13]. The MLP DPD distorts the PA input signal, providing a correction to the amplifier output nonlinearities (Figure 9), thus improving the ACP of the output signal.
The MLP consists of nonlinear output processors arranged in layers, whose interconnections are reinforced or weakened through a training process to attain a configuration that achieves the suitable nonlinearity compensation.
To perform the comparison, two PAs with similar features were selected for their linearization: a MACOM NPTB00004A (GaN technology) and an ST PD57006S-E (LDMOS technology).
An MLP consisting of one hidden layer with 20 processors using the hyperbolic tangent output function was trained to provide the predistortion values required to extend the linear range of the power amplifier output [13]. The single processors in input and output layers both provide linear transfer functions. Neural network training is performed using the Levenberg–Marquardt algorithm [14]. The neural network configuration can be seen in Figure 10. The results can be seen in Table 3, where a TETRA signal has been used as input signal, and the output power of both amplifiers has been obtained, increasing the input power to obtain at the output a power 1.5 dB less than the P1dB.
According to the results shown in Table 3, the proposed MLP architecture does not sufficiently improve the linear behavior of the LDMOS PA output power. So, the number of processors in the hidden layer should be increased to achieve the required ACP improvement, similar to that of the GaN amplifier. The corresponding results are shown in Table 4. As can be seen, a single hidden-layer neural network is not capable of achieving a suitable linearization for an LDMOS PA. Therefore, an additional hidden layer is defined in the MLP structure to obtain the expected ACP improvement. (Table 5).
The increment in the number of hidden layers and processors drastically increases the complexity of the solution, which can be compared to the increase in the order of the polynomial model previously shown in Section 3.3.
Predistorting the input signal using the MLP-based technique adds a time delay in the signal output. In the case of the selected GaN, the proposed architecture using 20 neurons in a single hidden layer running in an L138 OMAP (Open Multimedia Applications Platform) at a clock frequency of 456 MHz supposes a delay in the output signal of 15 ms (6500 clock cycles). In the case of the selected LDMOS, for the proposed architecture using 18 neurons in the first hidden layer and six neurons in the second hidden layer, the number of clock cycles required to calculate the neural network output under the same aforementioned conditions is 8500, corresponding to a time delay of 20 ms. Therefore, we could conclude that to achieve a similar timing delay, in the case of the LDMOS PA the DSP frequency should be increased to over 610 MHz. Table 6 shows these results.

4. Discussion

This paper shows the need to select the technology of the amplifier in order to correctly linearize its output through the available resources. We will have to evaluate whether the available resources are capable of linearizing the power amplifier, taking into account that a GaN amplifier is easier to linearize than an LDMOS amplifier, due basically to the smoother transition into saturation of the GaN amplifiers.

Author Contributions

Conceptualization, R.G.S.; methodology, R.G.S., N.M.M.; software, R.G.S.; validation, R.G.S., N.M.M.; formal analysis, R.G.S., N.M.M.; investigation, R.G.S., N.M.M.; resources, R.G.S., N.M.M.; data curation, R.G.S., N.M.M.; writing—original draft preparation, R.G.S.; writing—review and editing, R.G.S., N.M.M.; Visualization, R.G.S., N.M.M.; supervision, R.G.S., N.M.M.; project administration, R.G.S., N.M.M.; funding acquisition, N.M.M.

Funding

This work was supported by the MINECO-FEDER, UE (TEC2015-65750-R) Research Project.

Acknowledgments

The authors would like to thank the firm Teltronic SAU for the collaboration in the development of the tests that have been described in this article. The authors would also like to thank the Aragon Institute for Engineering Research (I3A) of the University of Zaragoza for providing technical support.

Conflicts of Interest

The authors declare no conflicts of interest. The founding sponsors had no role in the design of the study; in the collection, analyses, or interpretation of data; in the writing of the manuscript; and in the decision to publish the results.

References

  1. Kenington, P.B. High-Linearity RF Amplifier Design; Artech House: Norwood, MA, USA, 2000. [Google Scholar]
  2. Yu, H.; El-Sankary, K.; El-Masry, E.I. Distortion Analysis Using Volterra Series and Linearization Technique of Nano-Scale Bulk-Driven CMOS RF Amplifier. IEEE Trans. Circuits Syst. Regul. Pap. 2015, 62, 19–28. [Google Scholar] [CrossRef]
  3. Morgan, D.R.; Ma, Z.; Kim, J.; Zierdt, M.G.; Pastalan, J. A Generalized Memory Polynomial Model for Digital Predistortion of RF Power Amplifiers. IEEE Trans. Signal Process. 2006, 54, 3852–3860. [Google Scholar] [CrossRef]
  4. Gilabert, P.; Montoro, G.; Bertran, E. On the Wiener and Hammerstein models for power amplifier predistortion. In Proceedings of the 2005 Asia-Pacific Microwave Conference Proceedings, Suzhou, China, 4–7 December 2005. [Google Scholar] [CrossRef]
  5. Ai, B.; Yang, Z.-X.; Pan, C.-Y.; Tang, S.-G.; Zhang, T.-T. Analysis on LUT Based Predistortion Method for HPA with Memory. IEEE Trans. Broadcast. 2007, 53, 127–131. [Google Scholar] [CrossRef]
  6. Mkadem, F.; Boumaiza, S. Physically Inspired Neural Network Model for RF Power Amplifier Behavioral Modeling and Digital Predistortion. IEEE Trans. Microwave Theory Tech. 2011, 59, 913–923. [Google Scholar] [CrossRef]
  7. Jiménez, V.P.G.; Jabrane, Y.; Armada, A.G.; Said, B.A.E.; Ouahman, A.A. High Power Amplifier Pre-Distorter Based on Neural-Fuzzy Systems for OFDM Signals. IEEE Trans. Broadcast. 2011, 57, 149–158. [Google Scholar] [CrossRef]
  8. Moritz, R.; Leung, H.; Huang, X. Nonlinear Compensation for High Power Amplifiers using Genetic Programming. In Proceedings of the 2007 IEEE International Symposium on Circuits and Systems, New Orleans, LA, USA, 27–30 May 2007; pp. 2323–2326. [Google Scholar]
  9. Nuttinck, S.; Gebara, E.; Laskar, J.; Rorsman, N.; Olsson, J.; Zirath, H.; Eklund, K.; Harris, M. Comparison between Si-LDMOS and GaN-based microwave power transistors. In Proceedings of the IEEE Lester Eastman Conference on High Performance Devices, Newark, DE, USA, 8 August 2002; pp. 149–154. [Google Scholar]
  10. Nunes, L.C.; Cabral, P.M.; Pedro, J.C. Am/am and am/pm distortion generation mechanisms in si ldmos and gan hemt based rf power amplifiers. IEEE Trans. Microwave Theory Tech. 2014, 62, 799–809. [Google Scholar] [CrossRef]
  11. Yusoff, Z.; Akmal, M.; Carrubba, V.; Lees, J.; Benedikt, J.; Tasker, P.J.; Cripps, S.C. The benefit of GaN characteristics over LDMOS for linearity improvement using drain modulation in power amplifier system. In Proceedings of the IEEE 2011 Workshop on Integrated Nonlinear Microwave and Millimetre-Wave Circuits, Vienna, Austria, 18–19 April 2011; pp. 1–4. [Google Scholar]
  12. ETSI EN 300 394-1 V3.3.1 (2015-04). Terrestrial Trunked Radio (TETRA); Conformance Testing Specification; Part1: Radio. Available online: https://www.etsi.org/deliver/etsi_en/300300_300399/30039401/03.03.01_60/en_30039401v030301p.pdf (accessed on 15 April 2015).
  13. Sáez, R.G.; Marqués, N.M. RF Power Amplifier Linearization in Professional Mobile Radio Communications Using Artificial Neural Networks. IEEE Trans. Ind. Electron. 2019, 66, 3060–3070. [Google Scholar] [CrossRef]
  14. Haykin, S. Neural Networks and Learning Machines, 3rd ed.; Prentice-Hall: Upper Saddle River, NJ, USA, 2009. [Google Scholar]
Figure 1. Basis of Predistortion Techniques.
Electronics 08 01260 g001
Figure 2. Measured characteristics of a LDMOS power amplifier (PA) (model PD57006S-E, ST Microelectronics) and the polynomial approximations.
Electronics 08 01260 g002
Figure 3. Generic predistortion scheme.
Electronics 08 01260 g003
Figure 4. LDMOS and gallium nitride (GaN) transistor structures.
Electronics 08 01260 g004
Figure 5. Band gap for LDMOS and GaN.
Electronics 08 01260 g005
Figure 6. Measured characteristics of a GaN PA (model NPTB00004A, MACOM) and the polynomial approximations.
Electronics 08 01260 g006
Figure 7. Output power versus input power for an LDMOS PD57006S-E amplifier (continuous line) and the polynomial approximation (dash line) when the polynomial order is changed (top: order 2, middle: order 3, bottom: order 4).
Electronics 08 01260 g007
Figure 8. Output power versus input power for a GaN NPTB00004A amplifier (continuous line) and the polynomial approximation (dash line) when the polynomial order is changed (top: order 2, bottom: order 3).
Electronics 08 01260 g008
Figure 9. Digital predistorter (DPD) technique using a neural network.
Electronics 08 01260 g009
Figure 10. Neural network configuration.
Electronics 08 01260 g010
Table 1. Comparison between LDMOS and GaN technologies.
LDMOSGaN
Maximum frequency22 GHz30 GHz
Power density2 W/mm10 W/mm
Efficiency at P1dB60%70%
Bandwidth500 MHz2500 MHz
Maximum temperatureLowerHigher
Breakdown voltageLowerHigher
Maximum operating voltageLowerHigher
CgsHigherLower
CdsHigherLower
RinLowerHigher
RoutLowerHigher
Maximum RF power1.5 kW1 kW
PriceLowerHigher
Robustness against impedance mismatchesHigher (65:1)Lower (20:1)
Table 2. Approximated equations for the selected LDMOS and GaN transistors. Gain is expressed in dB, Efficiency is expressed in percentage, and Pout (Output Power) is expressed in Watts.
LDMOS (PD57006S-E)GaN (NPTB00004A)
G a i n = 0.00001 P o u t 4 + 0.0006 P o u t 3 0.015 P o u t 2 + 0.1817 P o u t + 14.221 G a i n = 0.00004 P o u t 3 0.002 P o u t 2 0.0074 P o u t + 15.035
E f f i c i e n c y = 0.0025 P o u t 3 0.1518 P o u t 2 + 3.8583 P o u t + 5.3202 E f f i c i e n c y = 0.0245 P o u t 2 + 2.1901 P o u t + 8.8977
Table 3. Adjacent channel power (ACP) improvement using a 20 neuron neural network.
NTPB00004APD57006S-E
Output 1dB compression point (P1dB)36.5 dBm37.5 dBm
Output Power @ 925 MHz35 dBm36 dBm
Efficiency @ Output Power50%40%
ACP improvement12 dB10.5 dB
Table 4. ACP improvement when varying the number of neurons of the neural network in the selected LDMOS amplifier.
Number of NeuronsACP Improvement
2010.5 dB
3011 dB
40 or more11.2 dB
Table 5. Neural network structures required to obtain the same ACP improvement for the selected LDMOS and GaN amplifiers.
Neurons in 1st Hidden LayerNeurons in 2nd Hidden LayerACP Improvement
NTPB00004A20-12 dB
PD57006S-E18612 dB
Table 6. Required resources to linearize with a neural network.
GaNLDMOS
Number of cycles to linearize with the neural network65008500
Necessary DSP frequency to linearize in 15 ms456 MHz608 MHz

