LED Arrays of Laser Printers as Valuable Sources of Electromagnetic Waves for Acquisition of Graphic Data


Abstract
1. Introduction
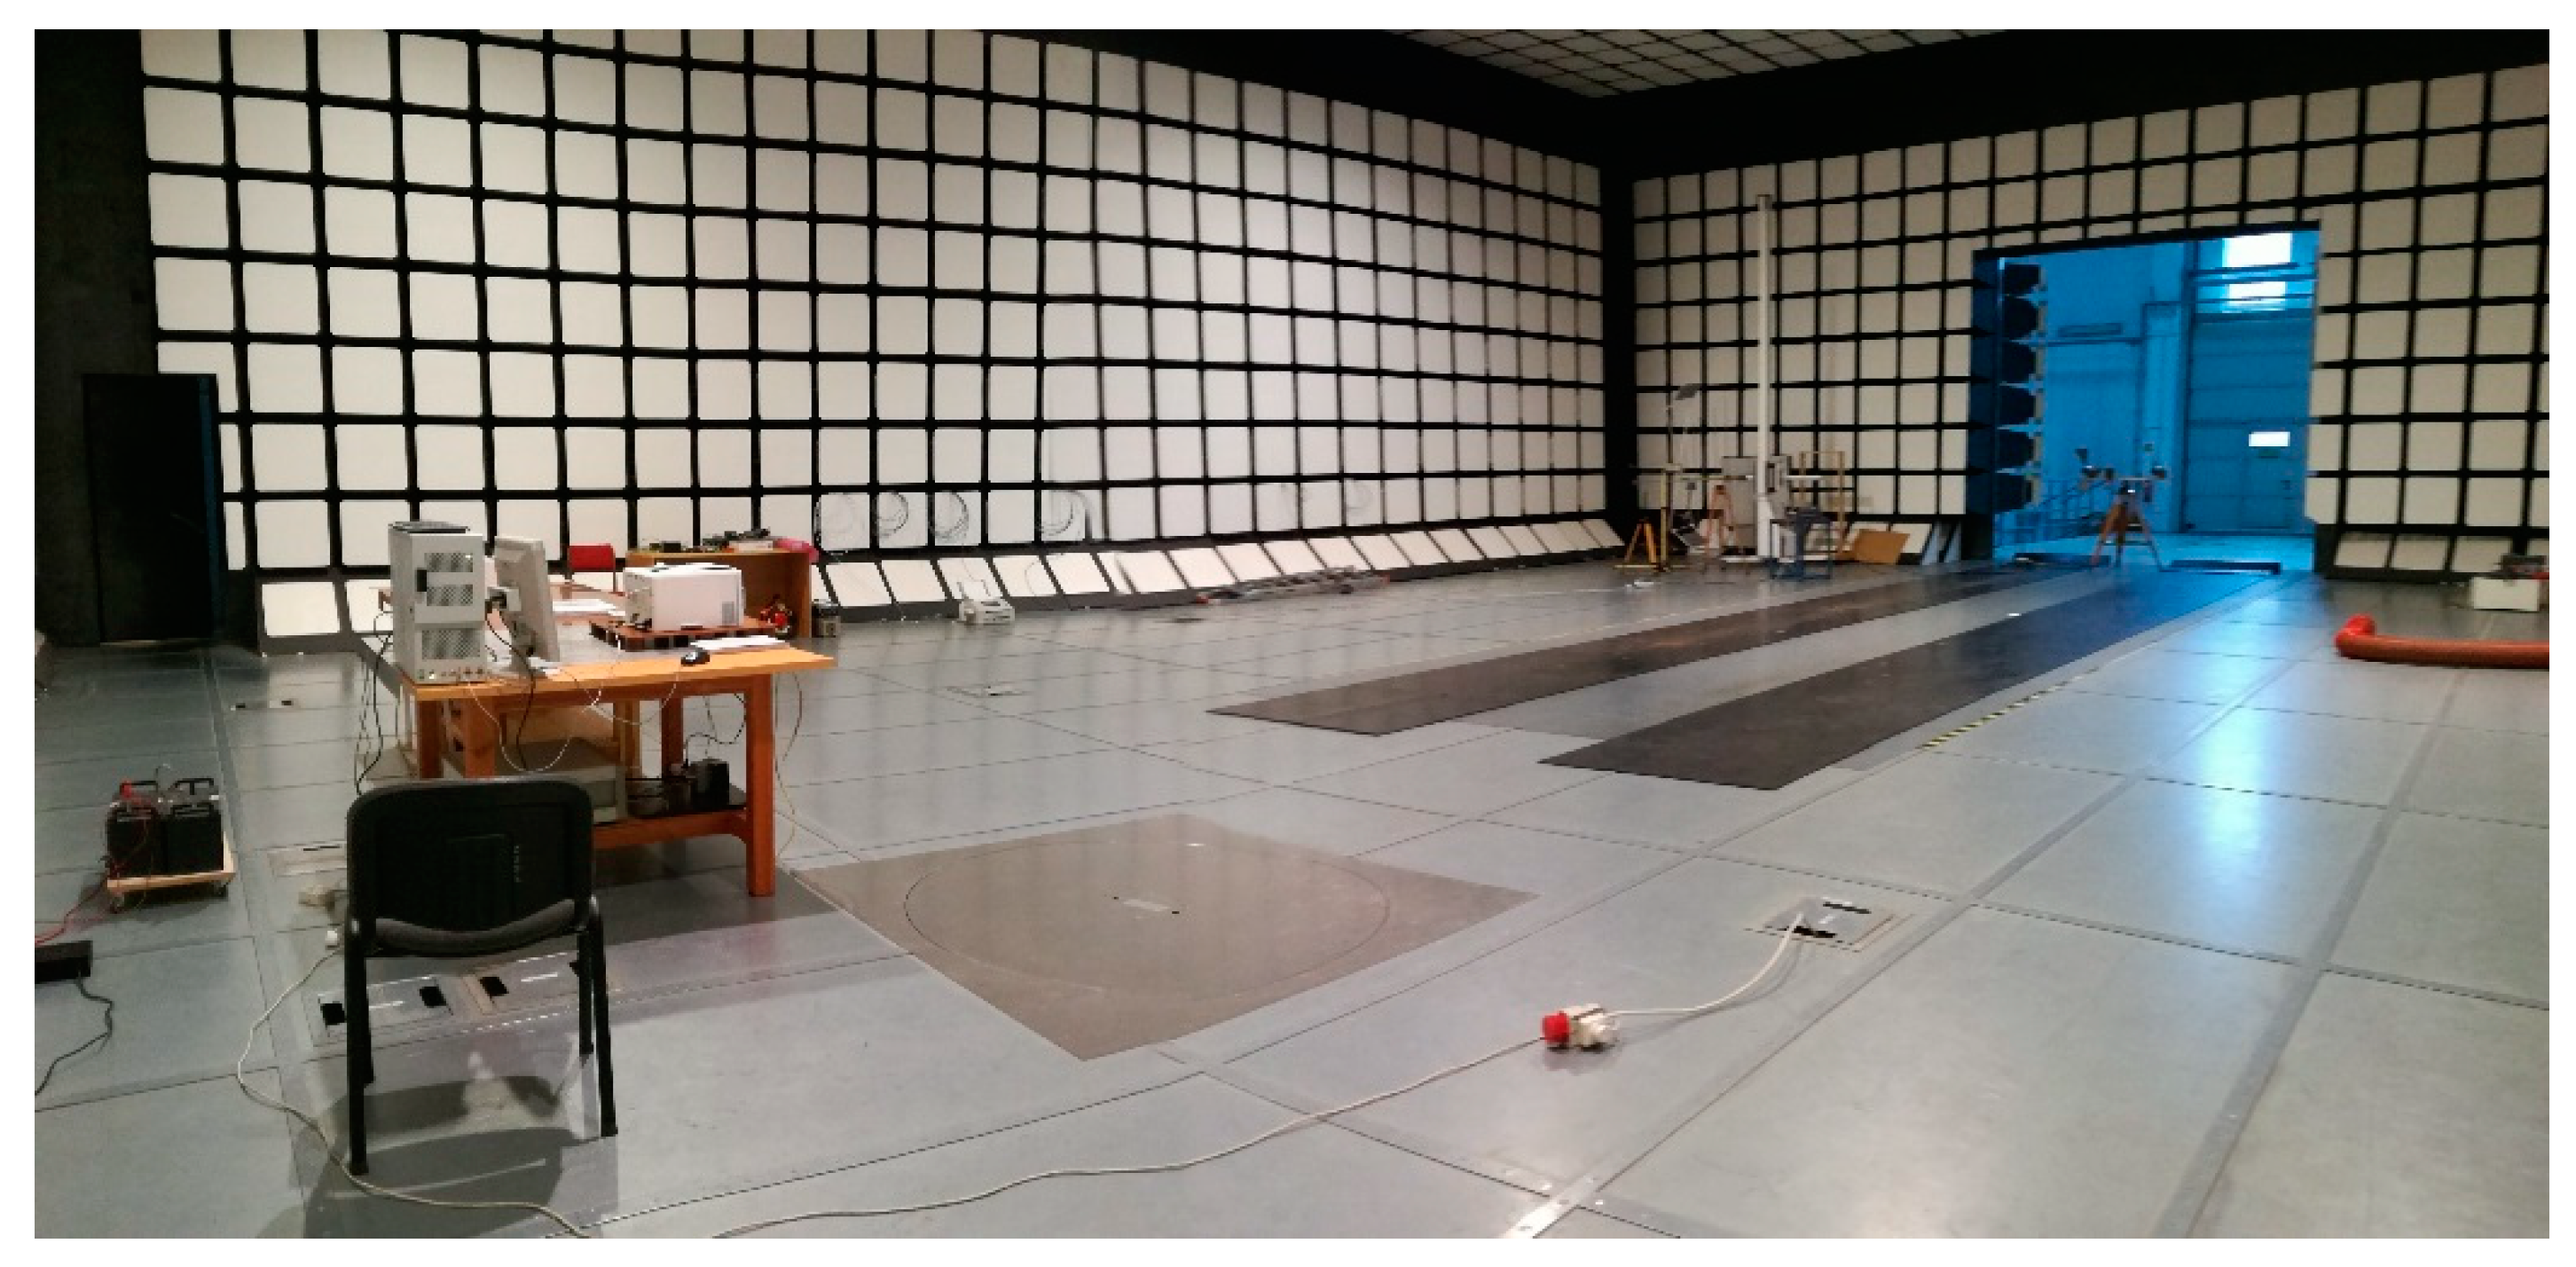
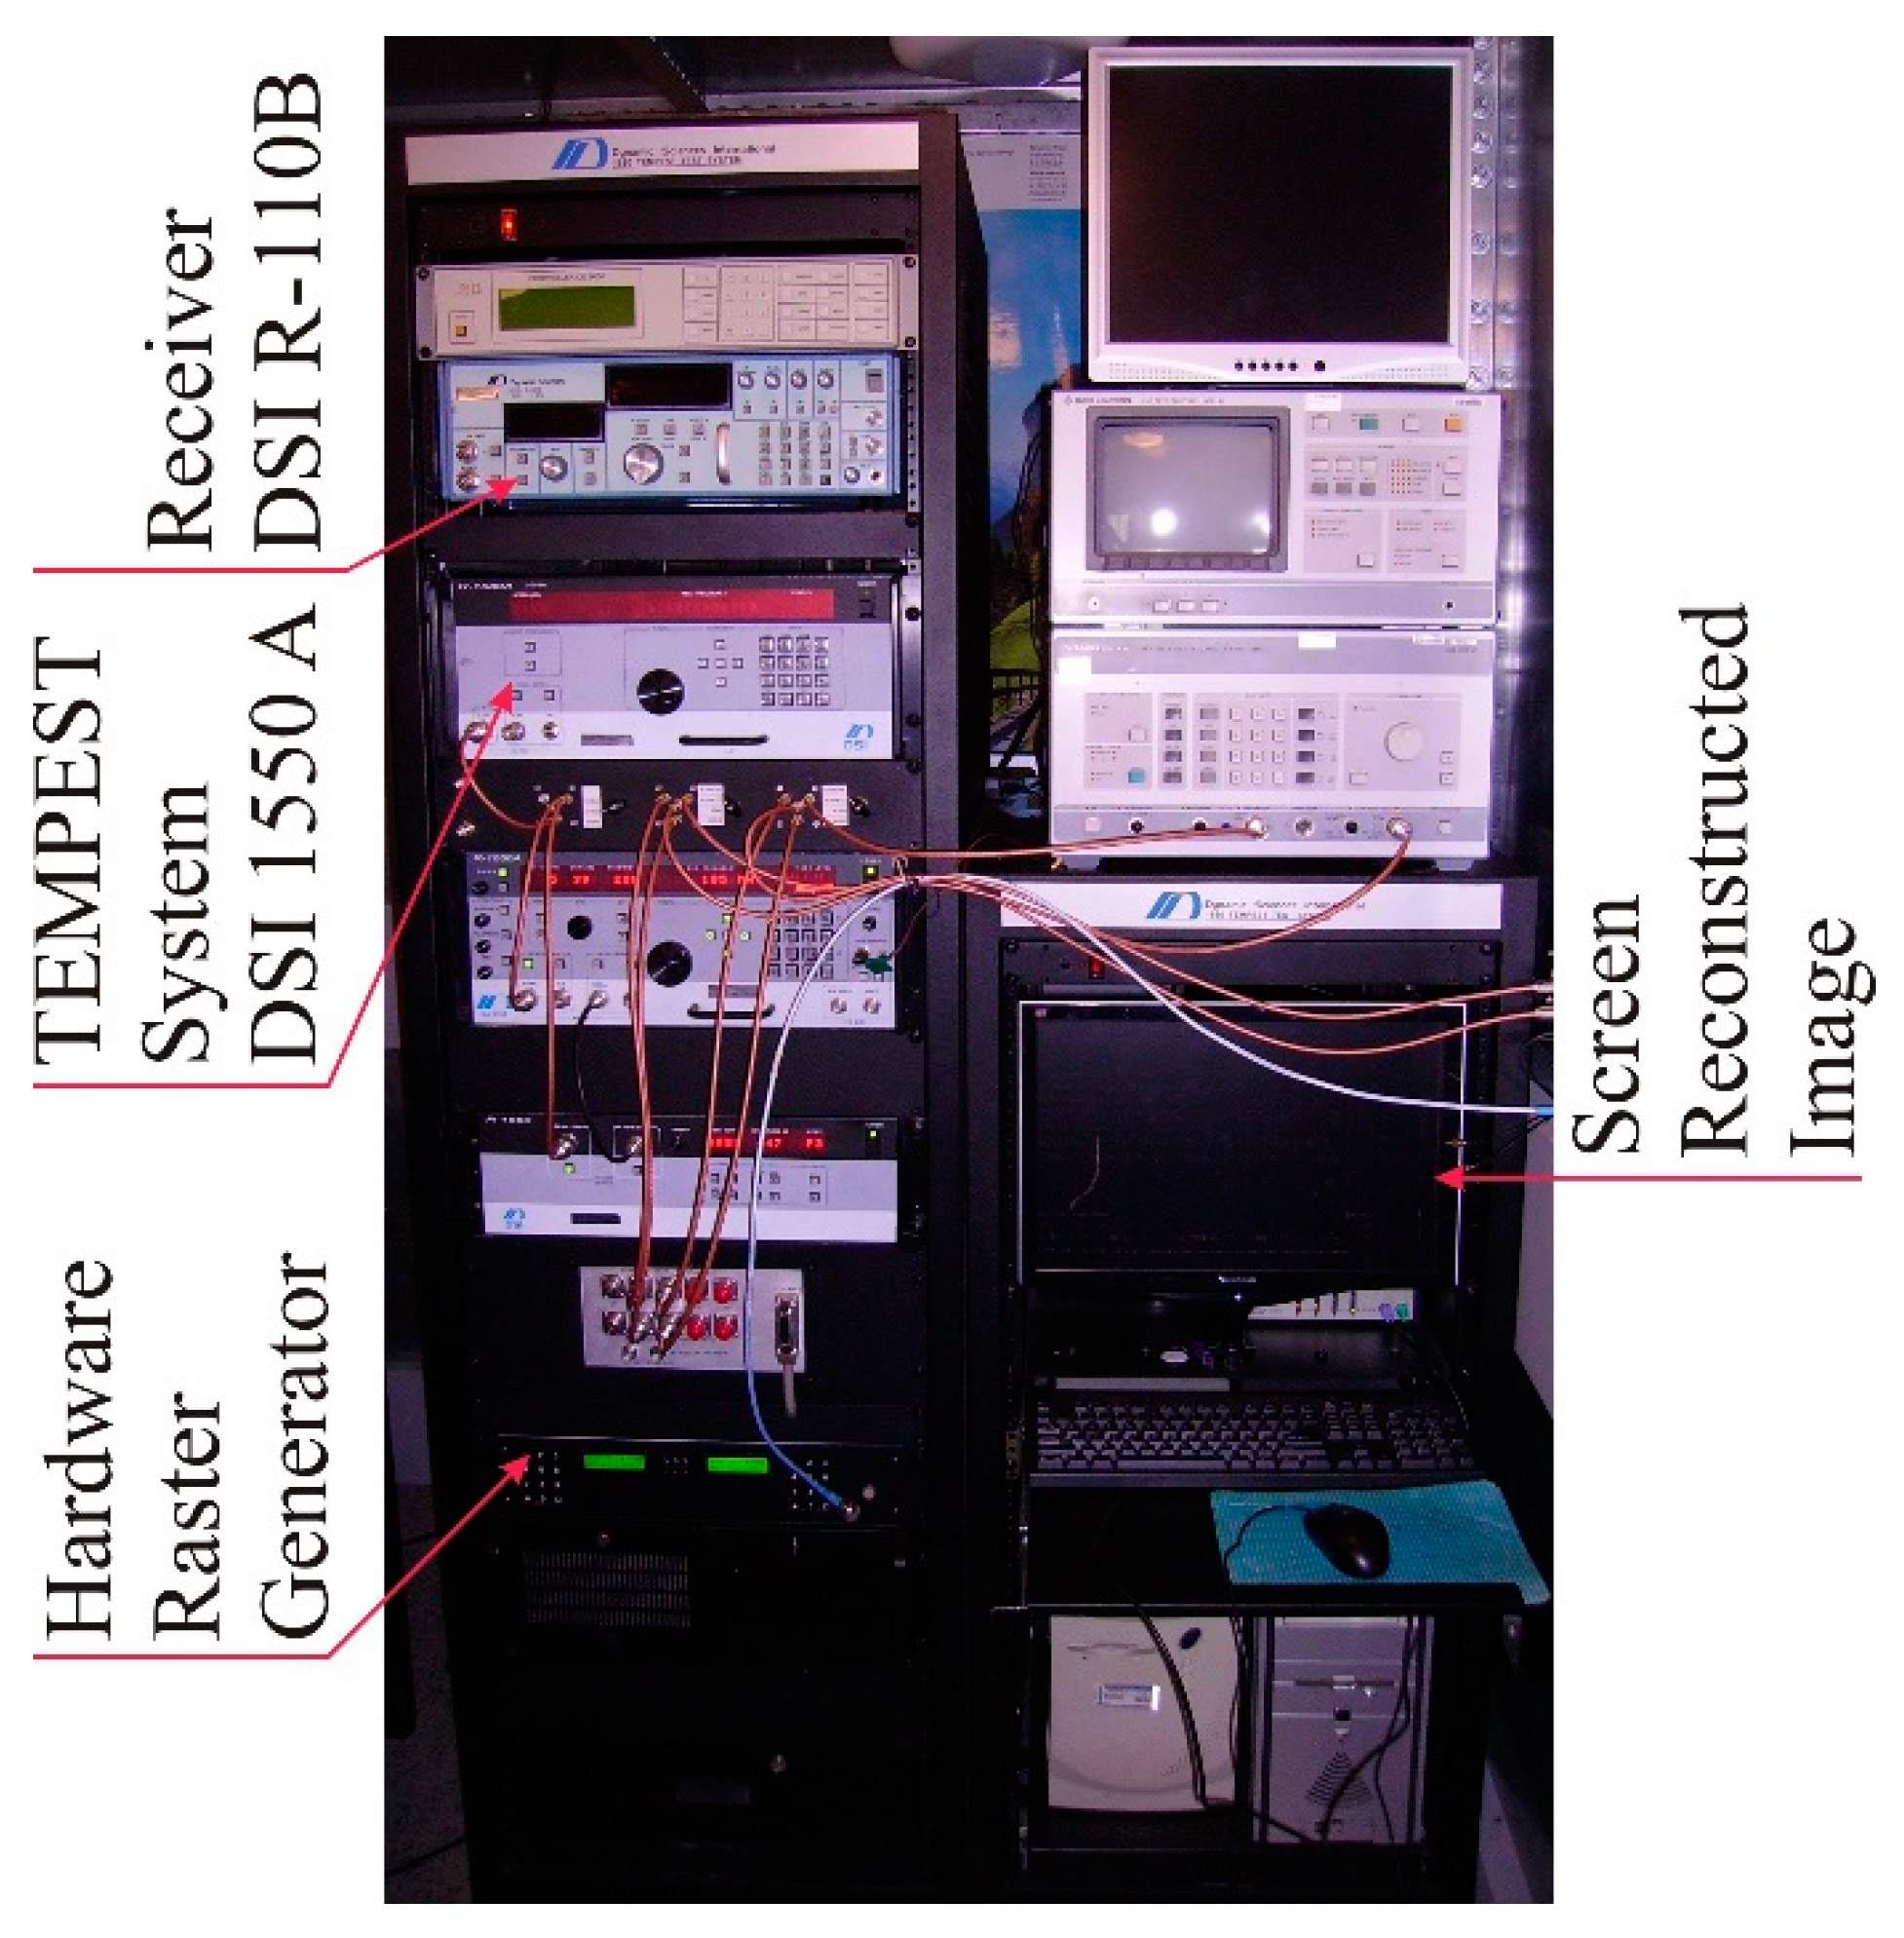
2. Materials and Methods
3. Results
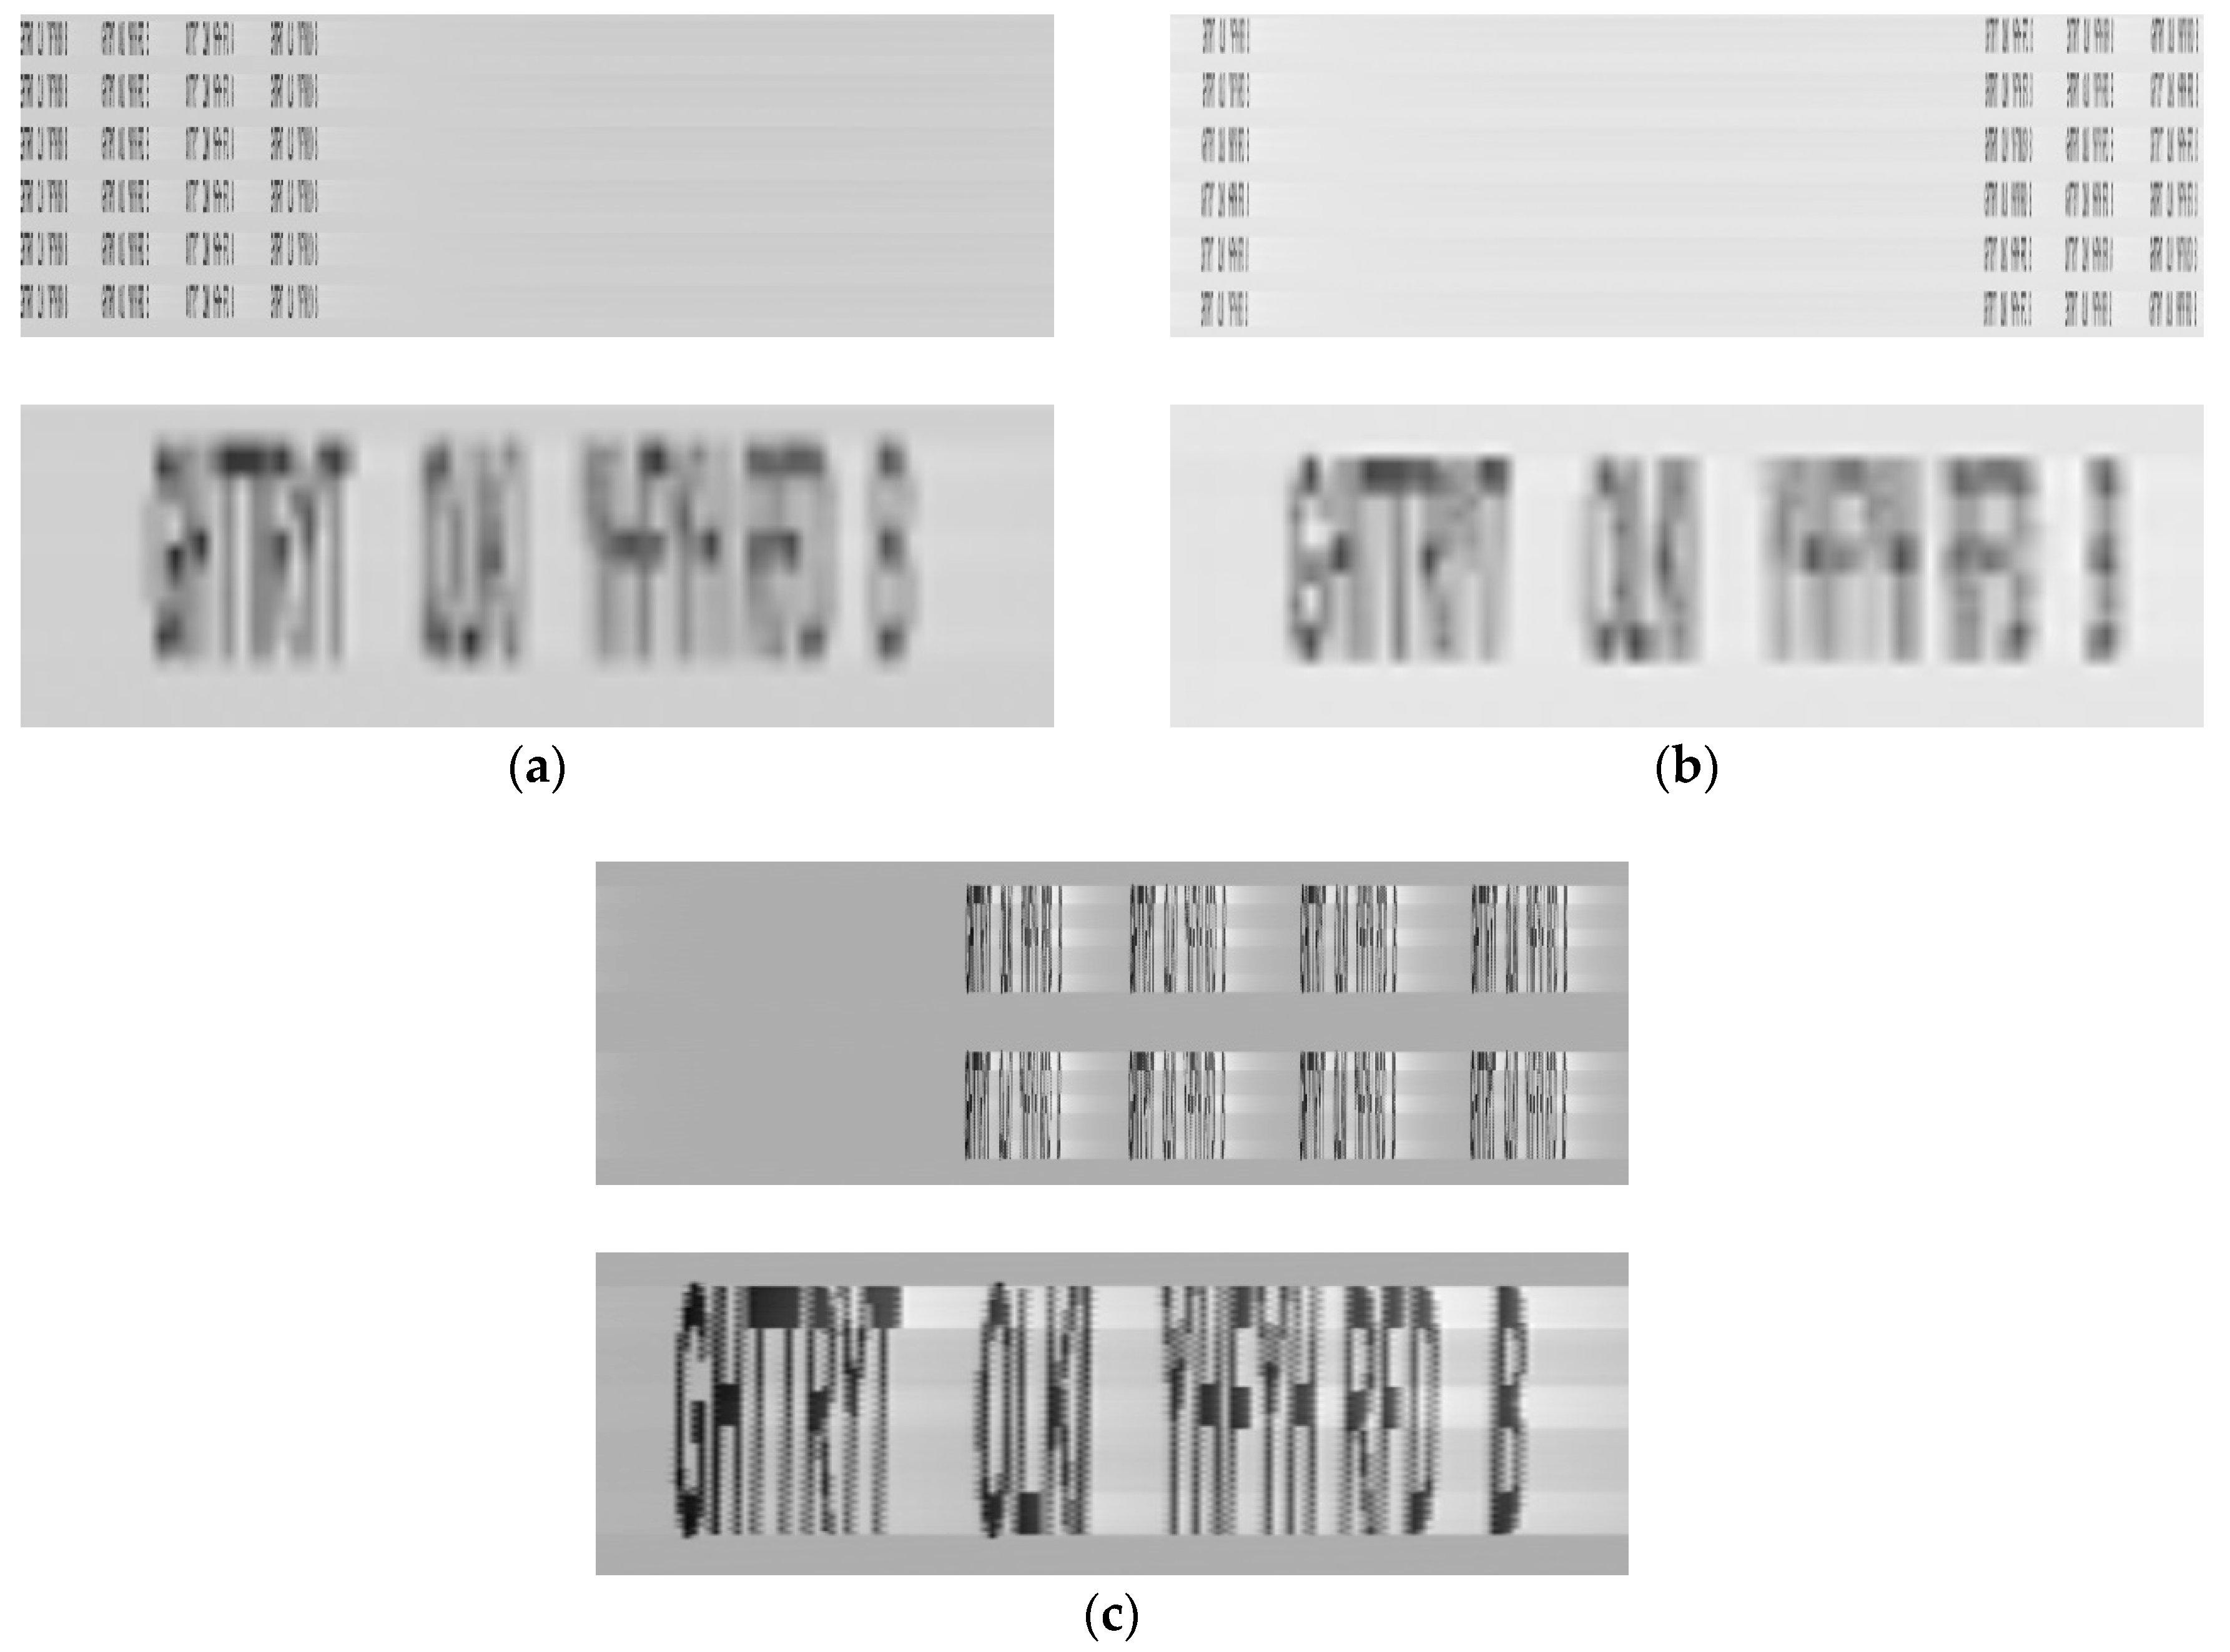
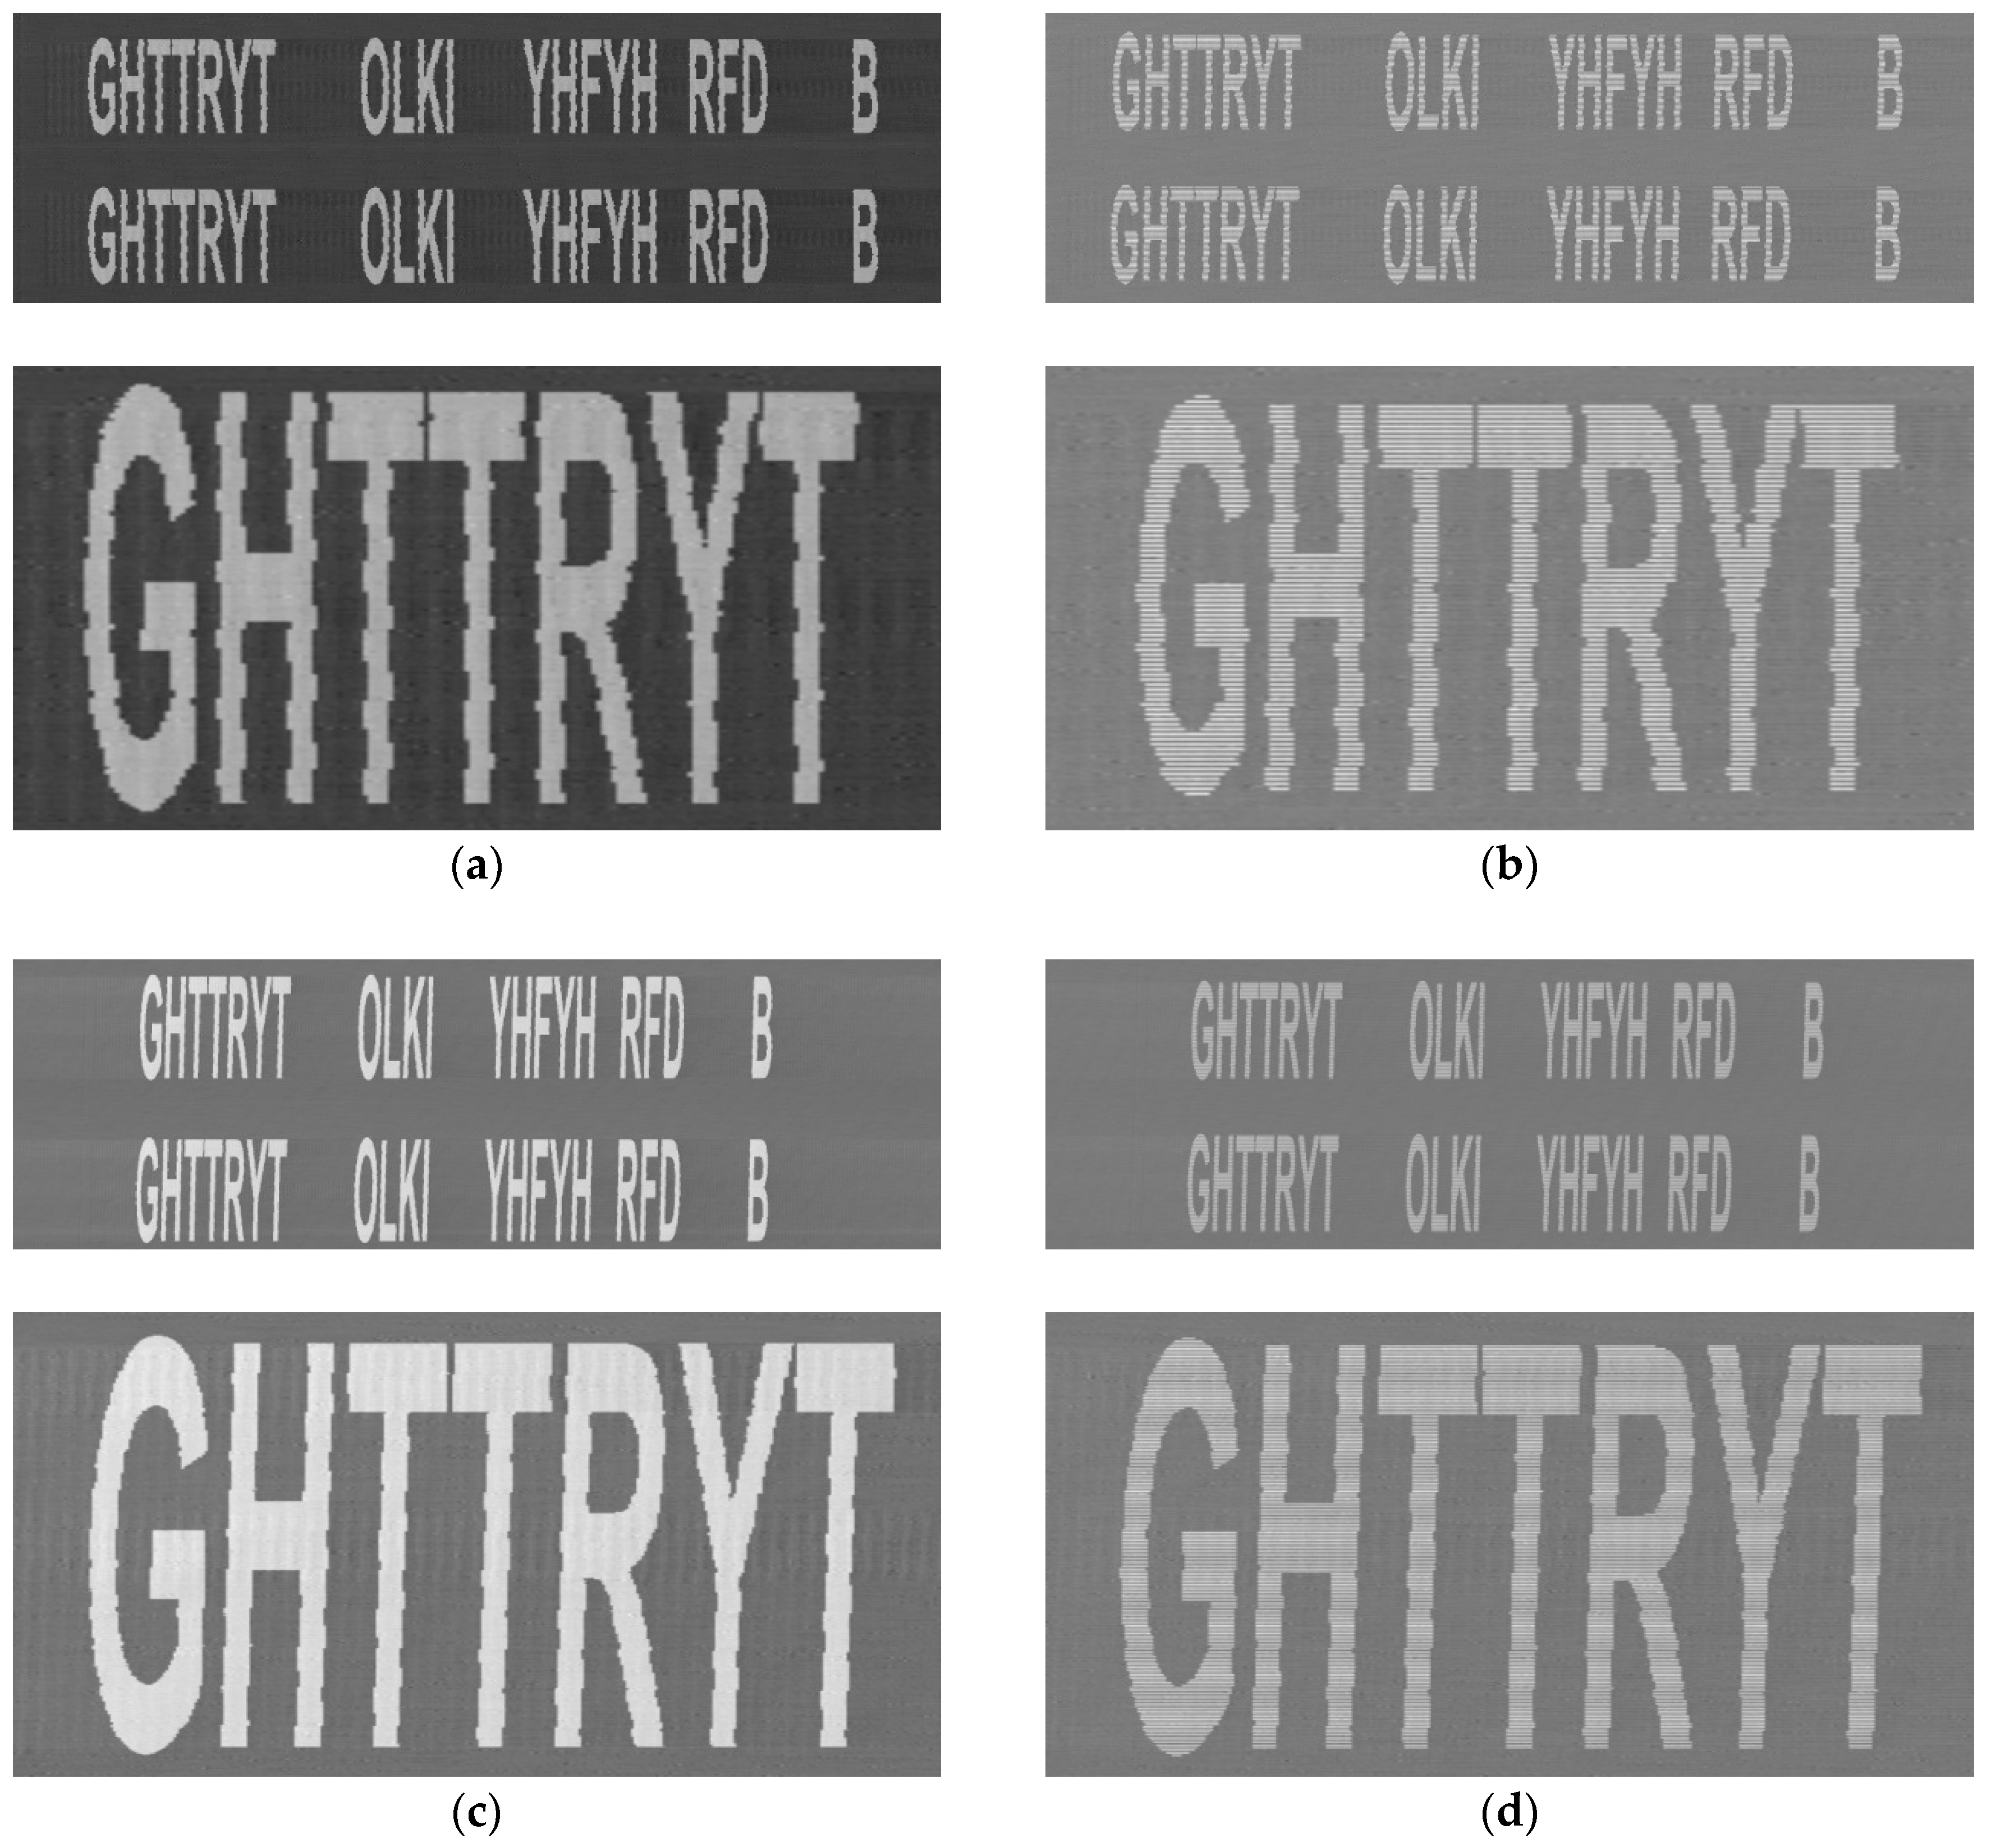
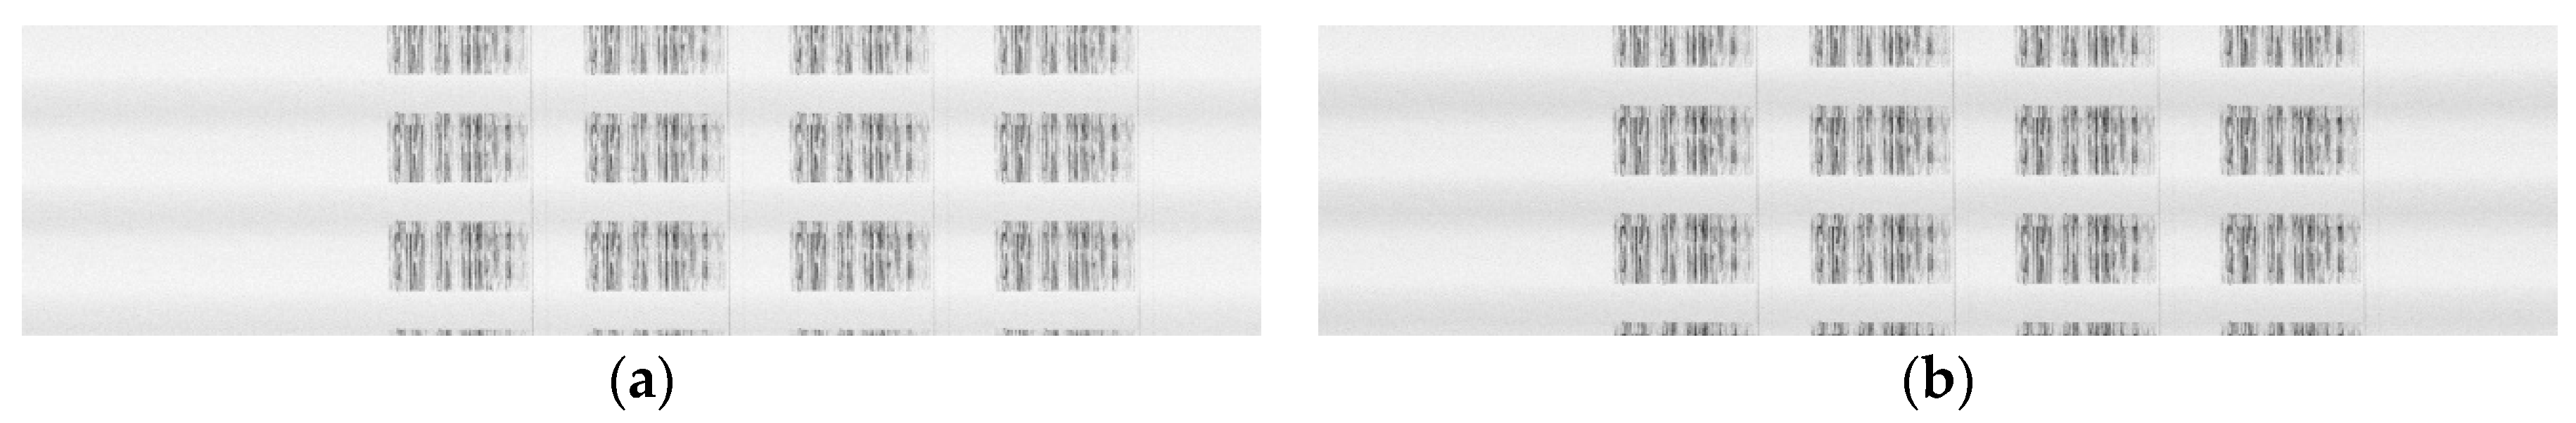
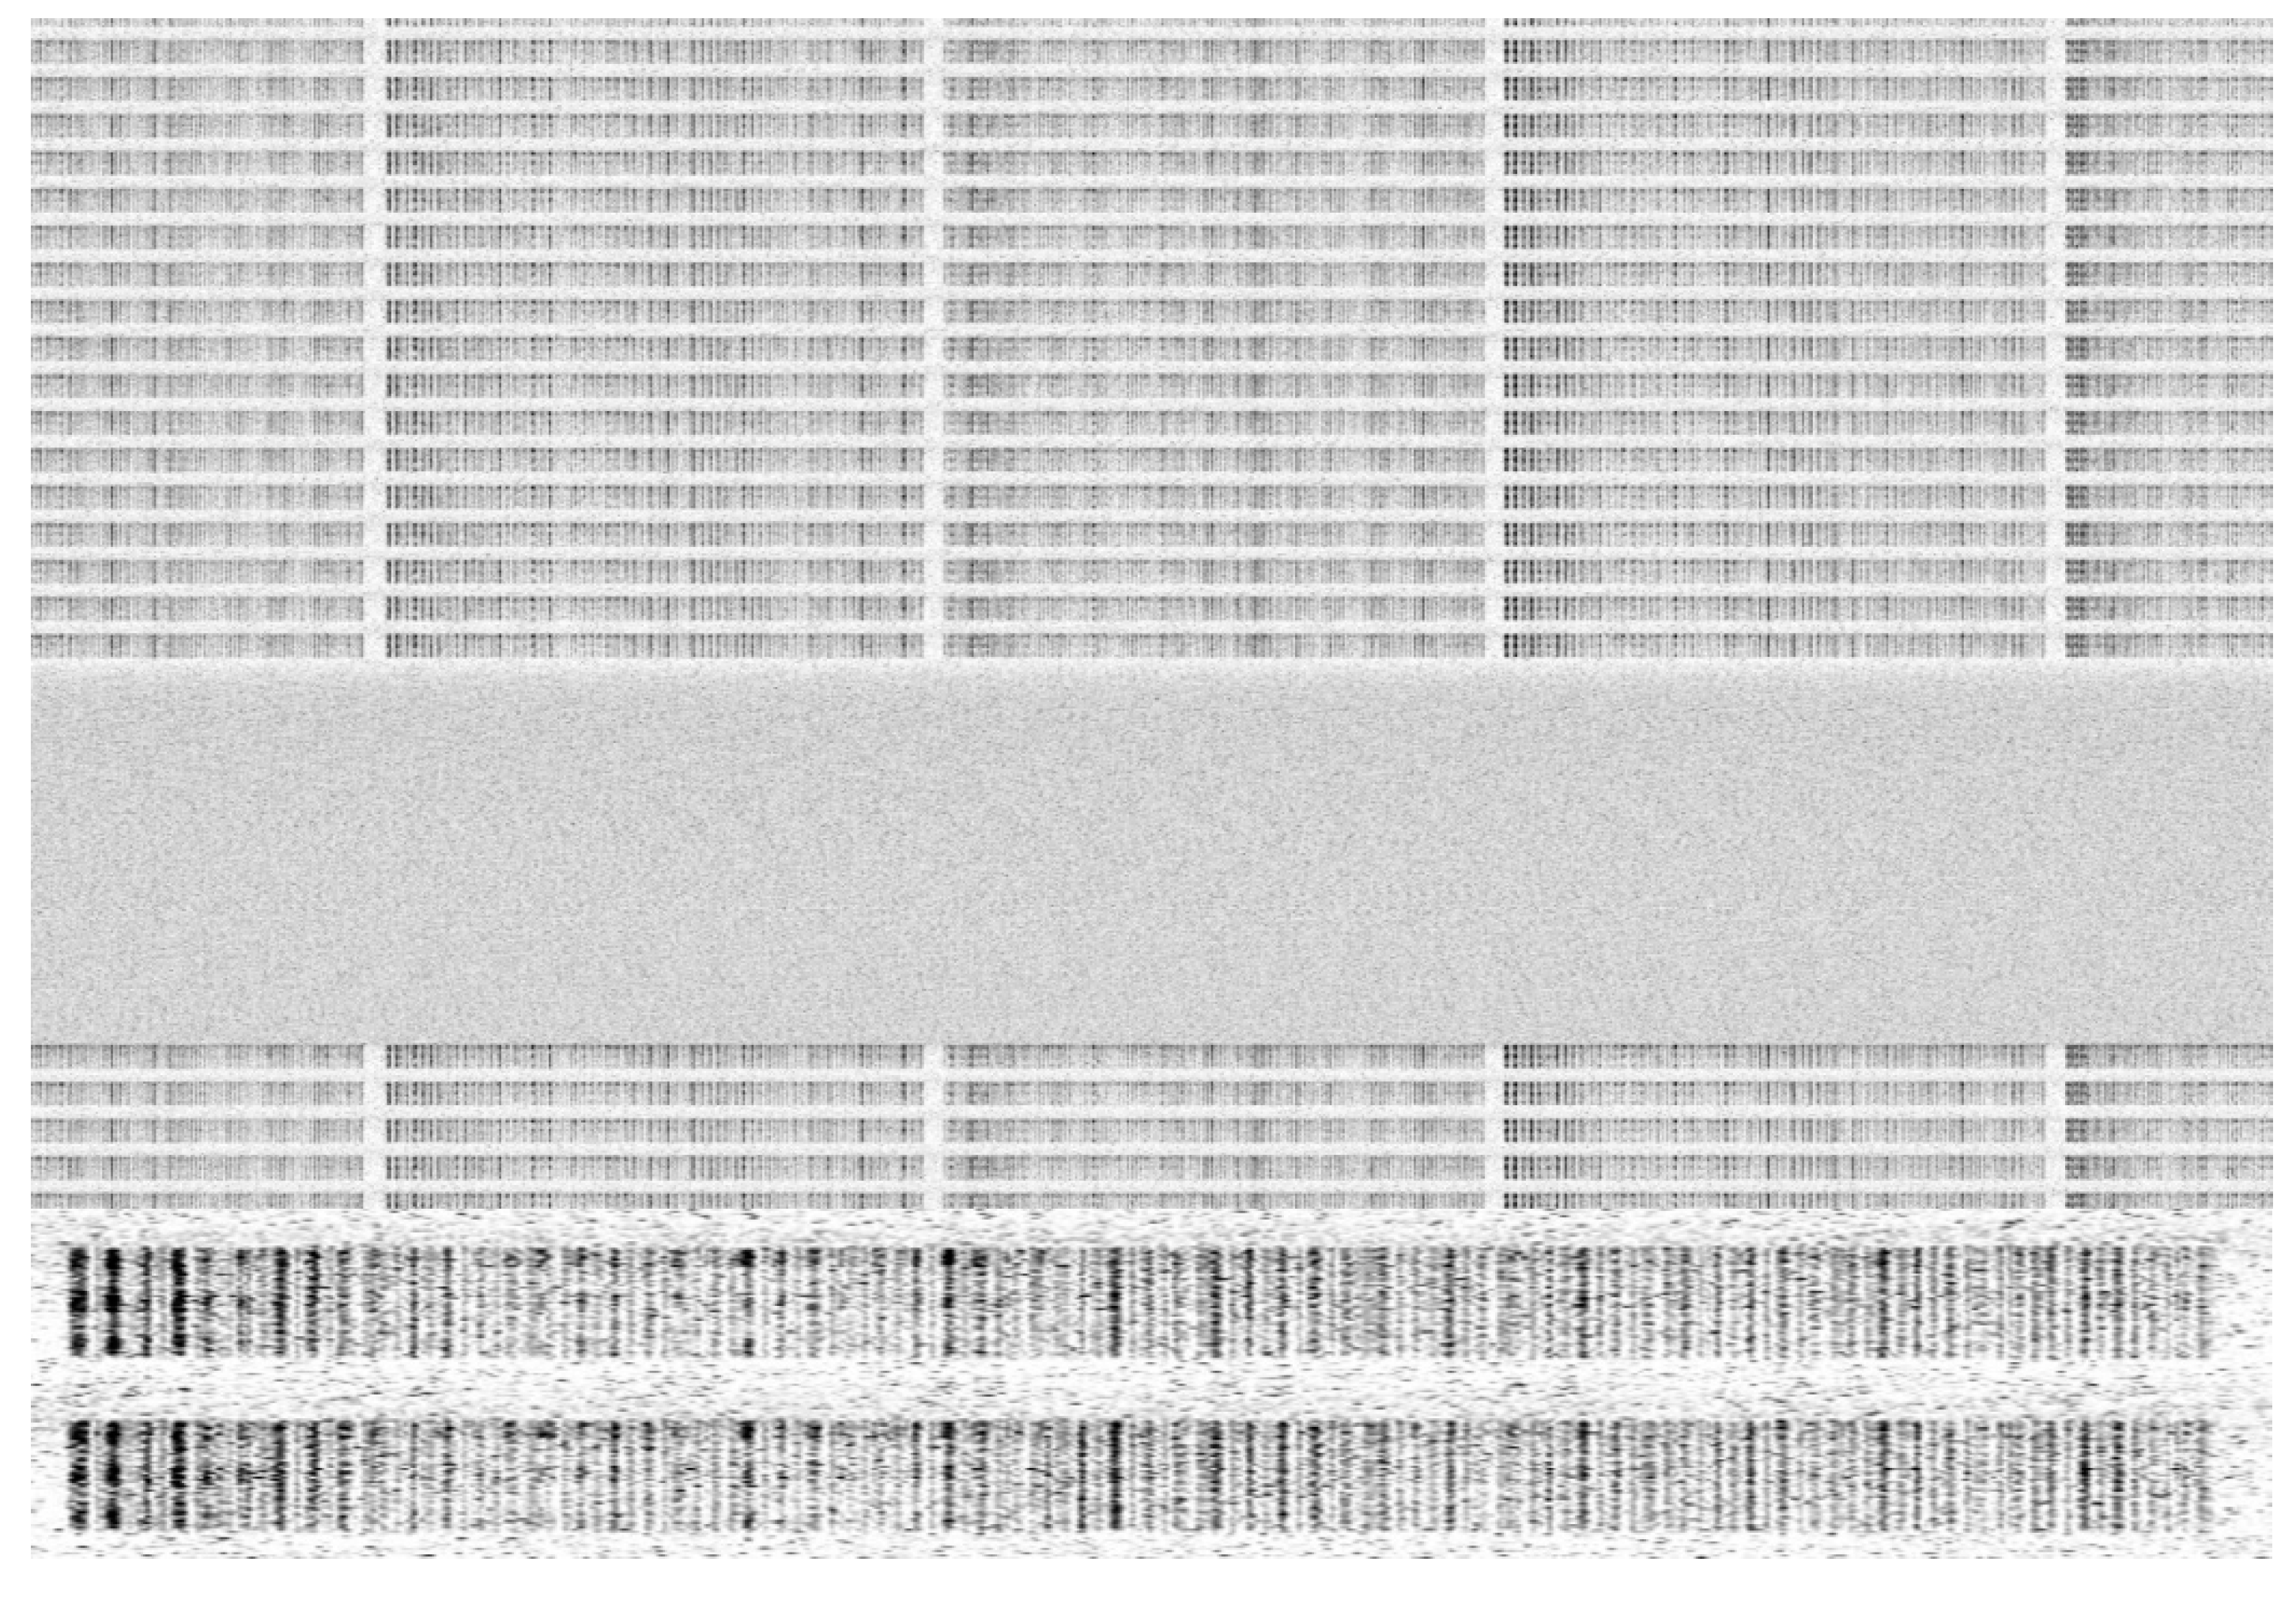
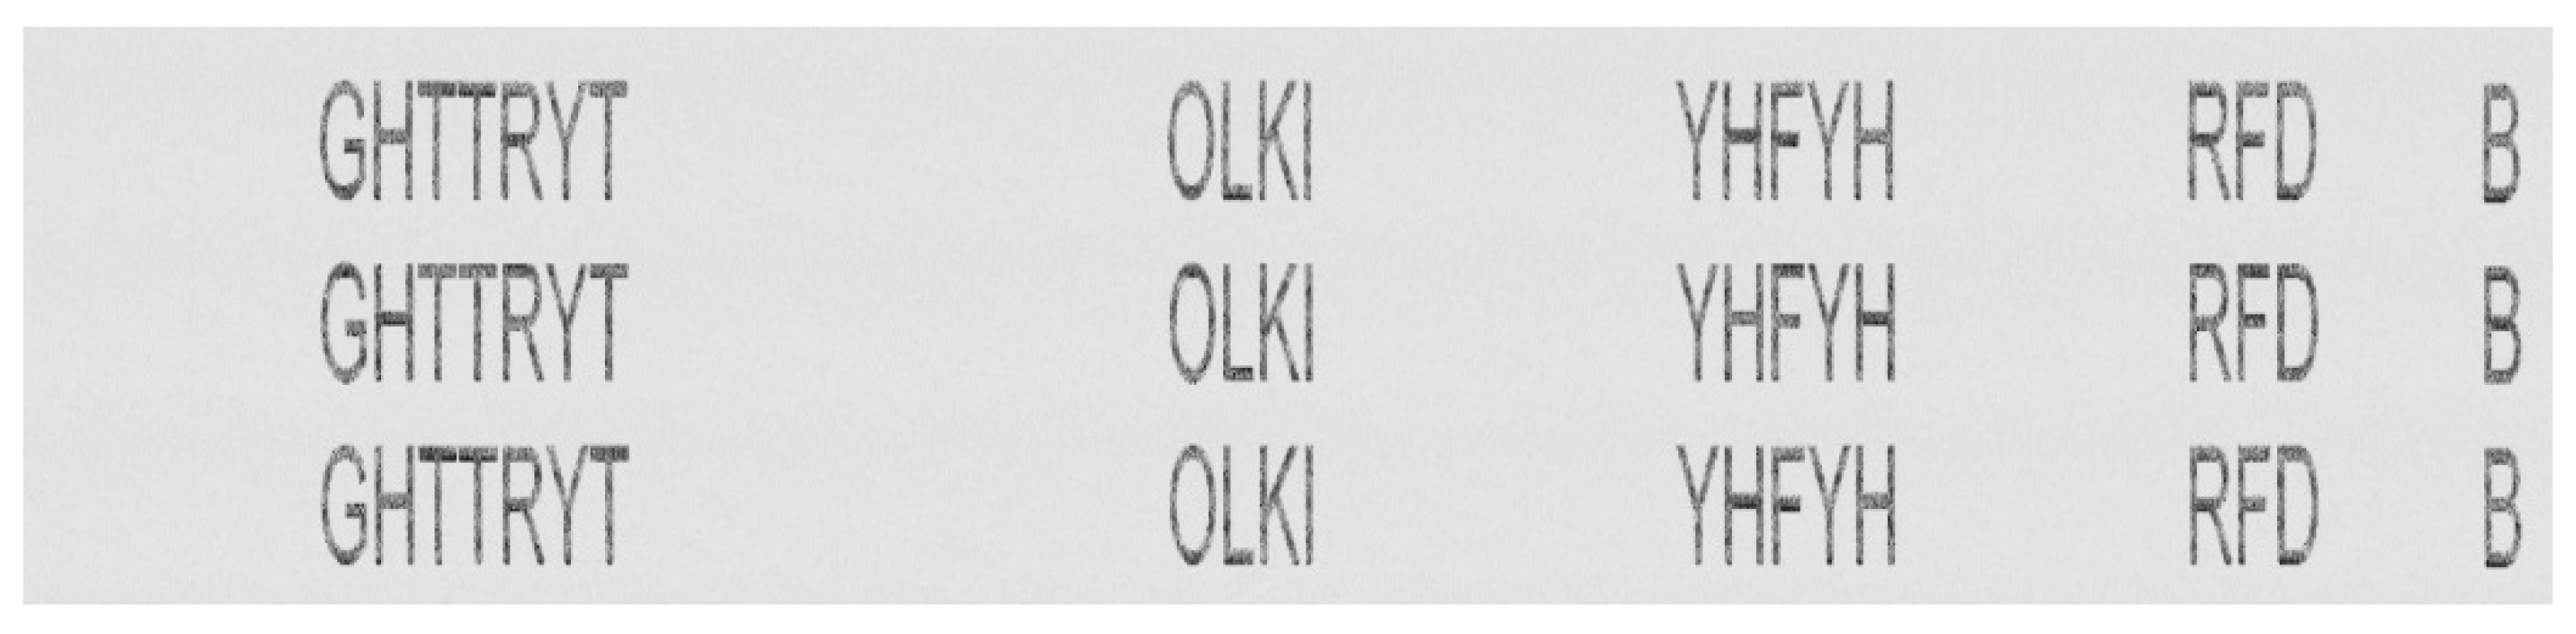
3.1. Reconstructed Images from Sensitive Emissions
- B—is the signal bandwidth for printing one pixel;
- W—is the width of the printing area in inches;
- L—is the length of the printing area in inches;
- dpi—is the printing resolution in dots per inch, and
- t—is the time to print one page.
- resolution of 1200 × 1200 dpi,
- printing speed of 30 pages per minute,
- paper size of A4 (about 8.27 by 11.69 inches, that is 9924 × 14 028 pixels), and
- three samples per pixel collected,
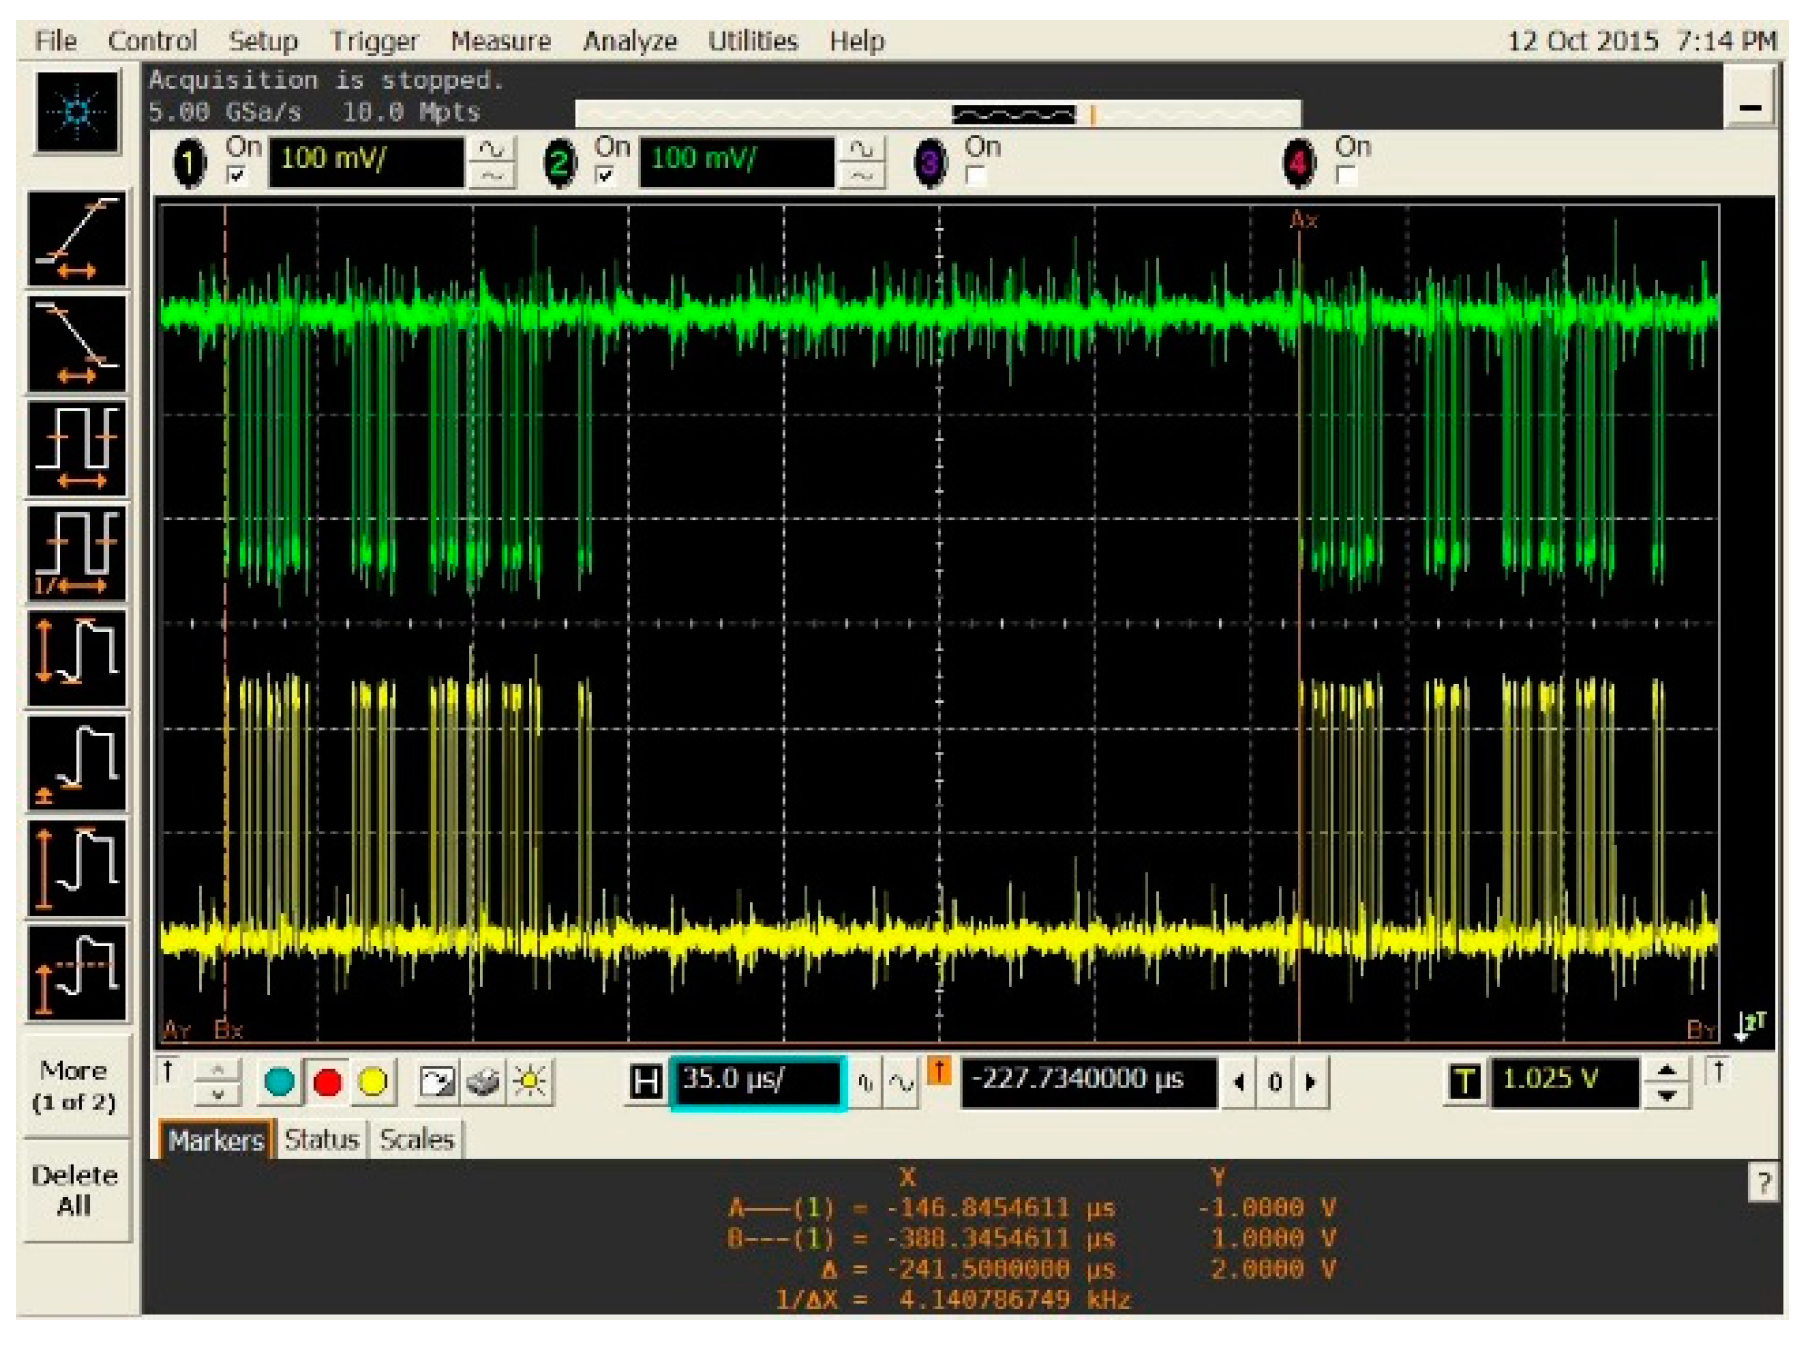
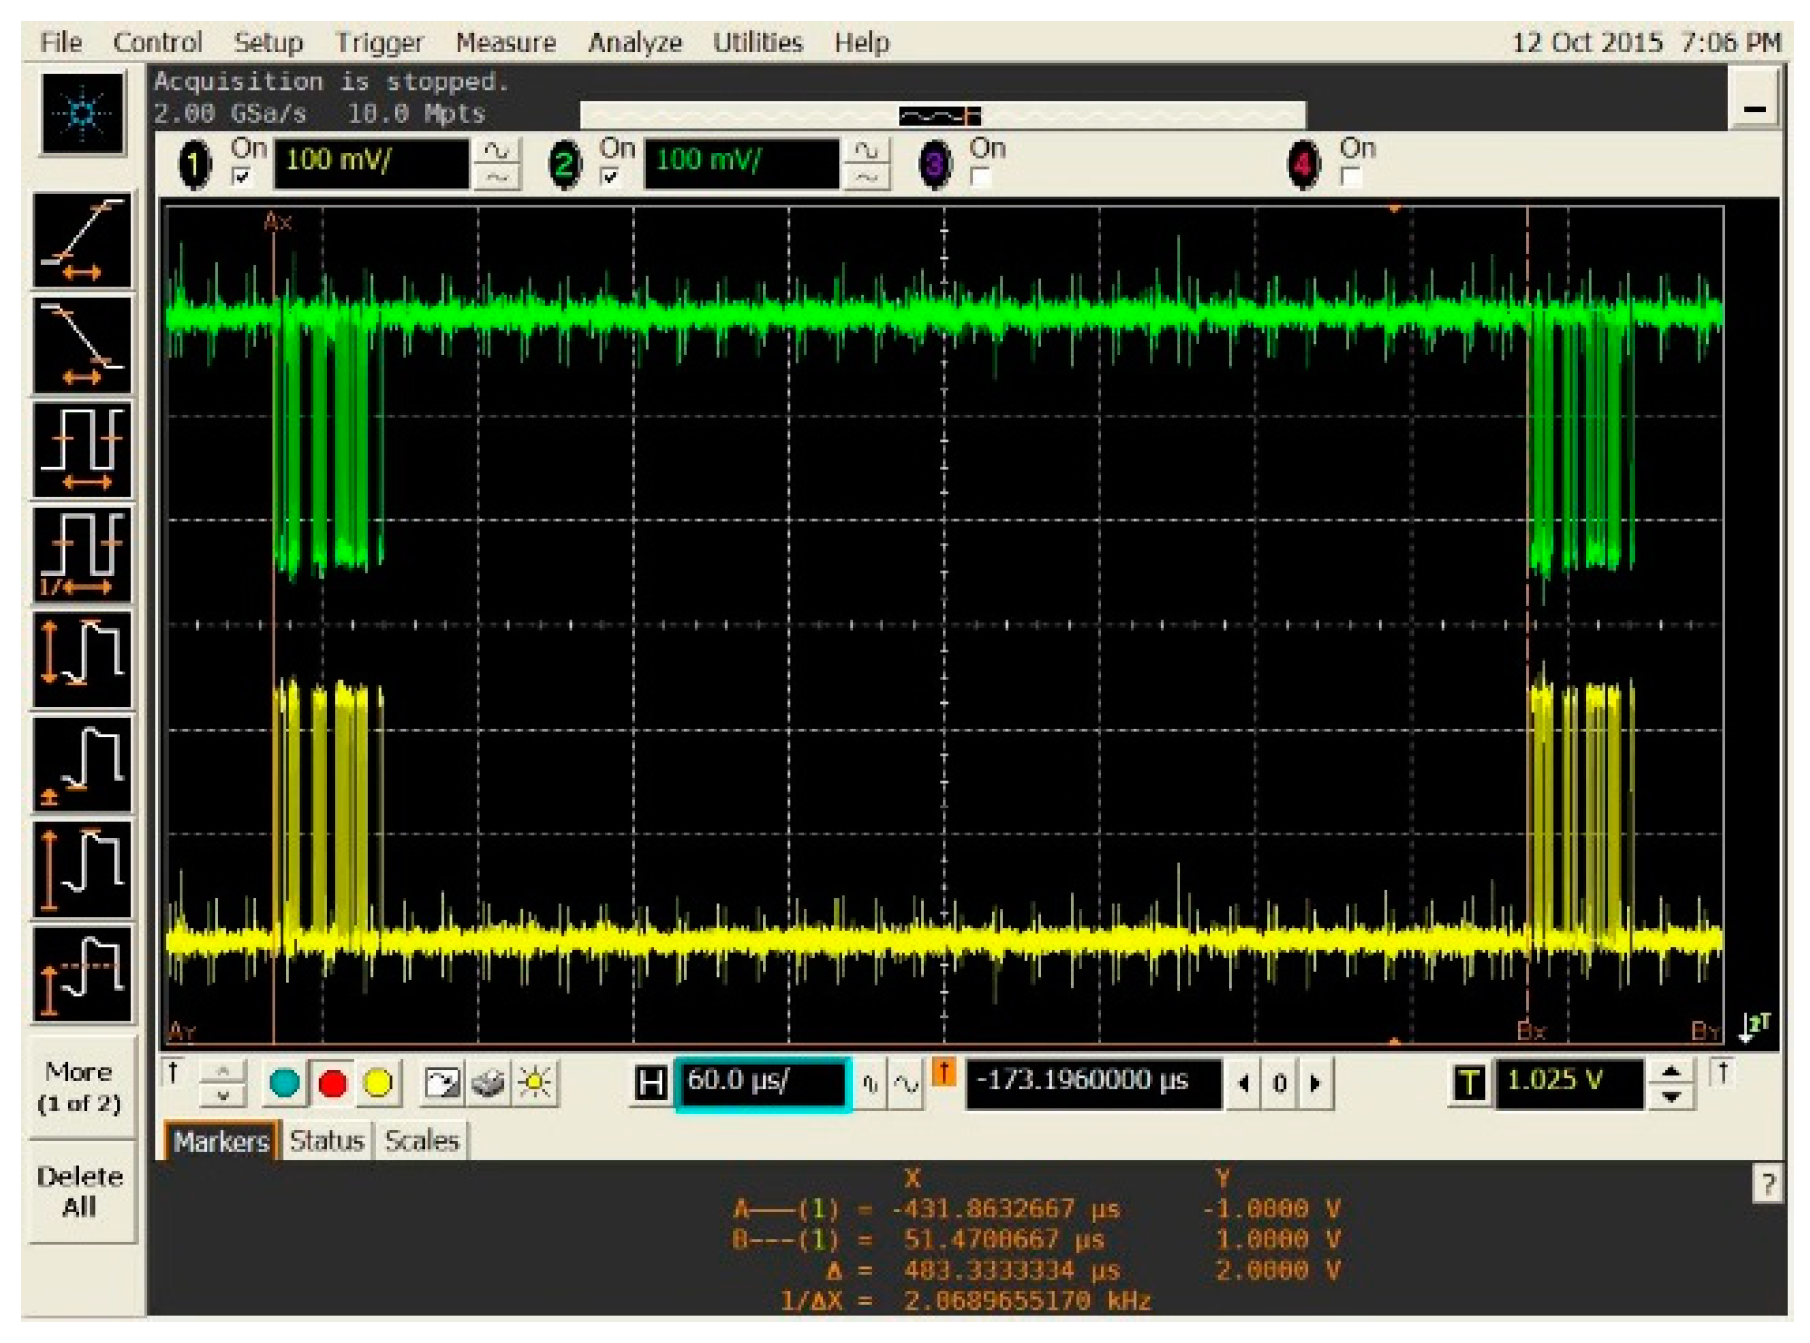
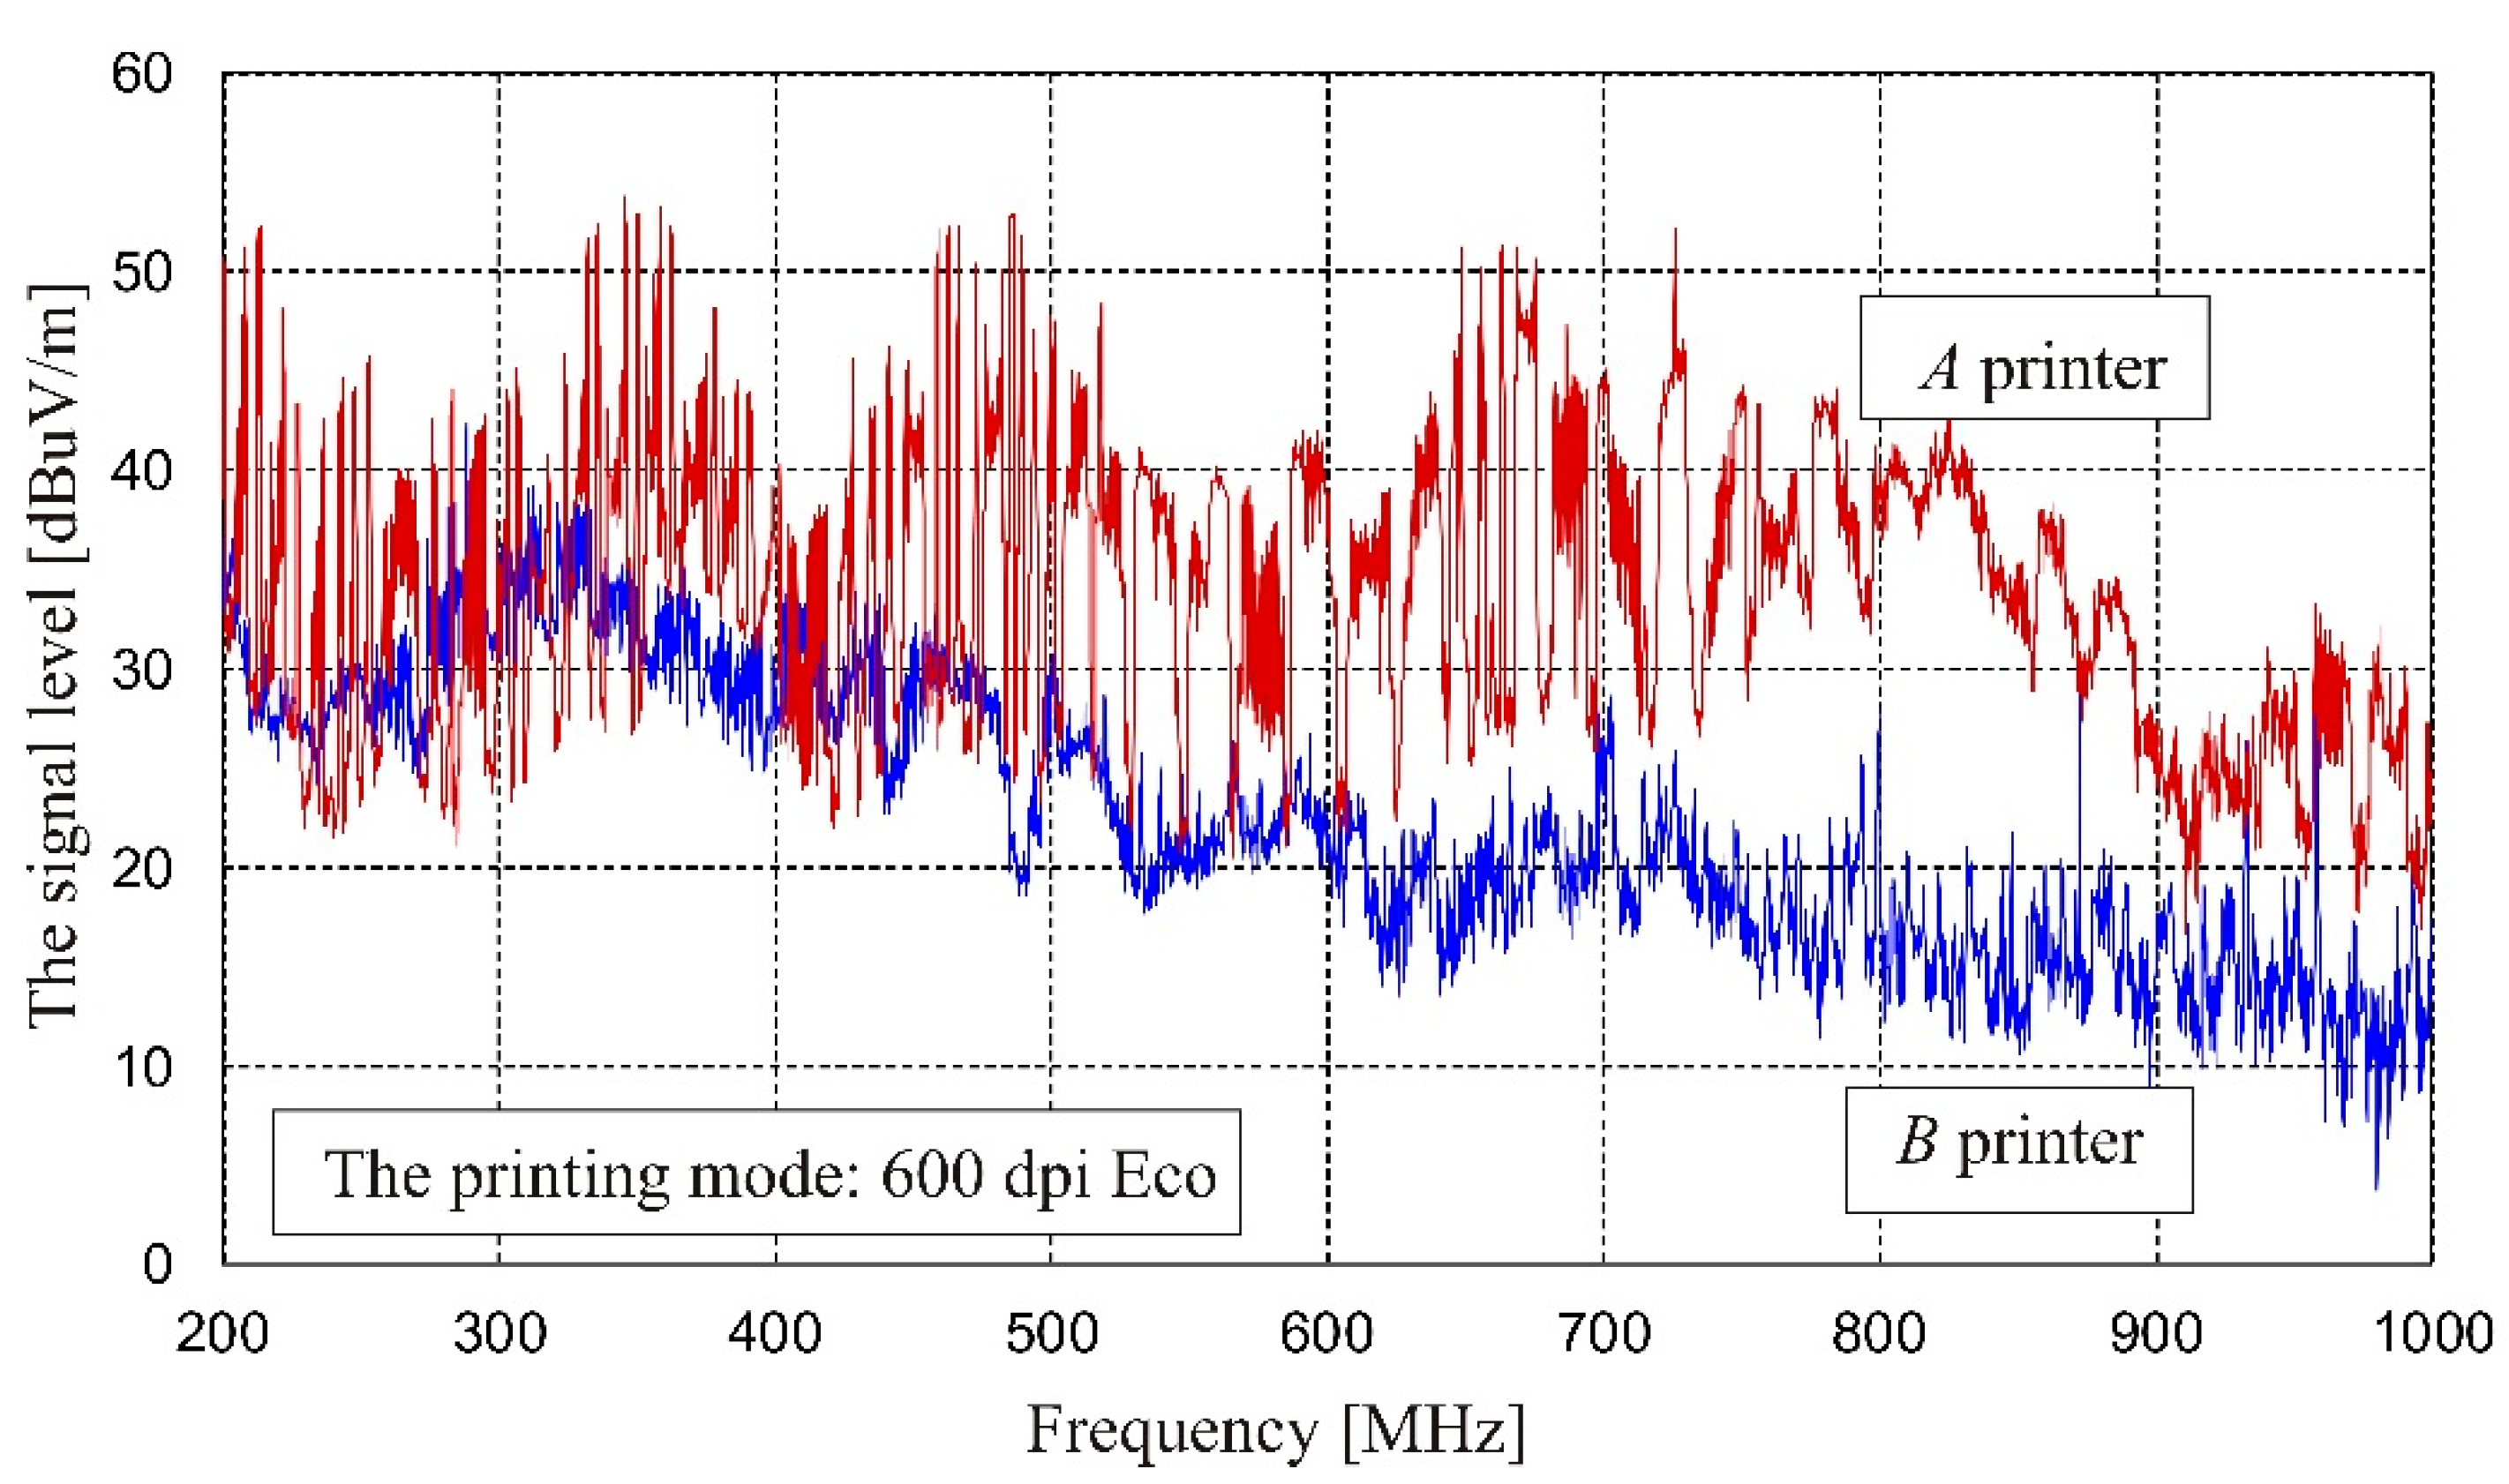
3.2. Levels of Electromagnetic Emissions
4. Discussions
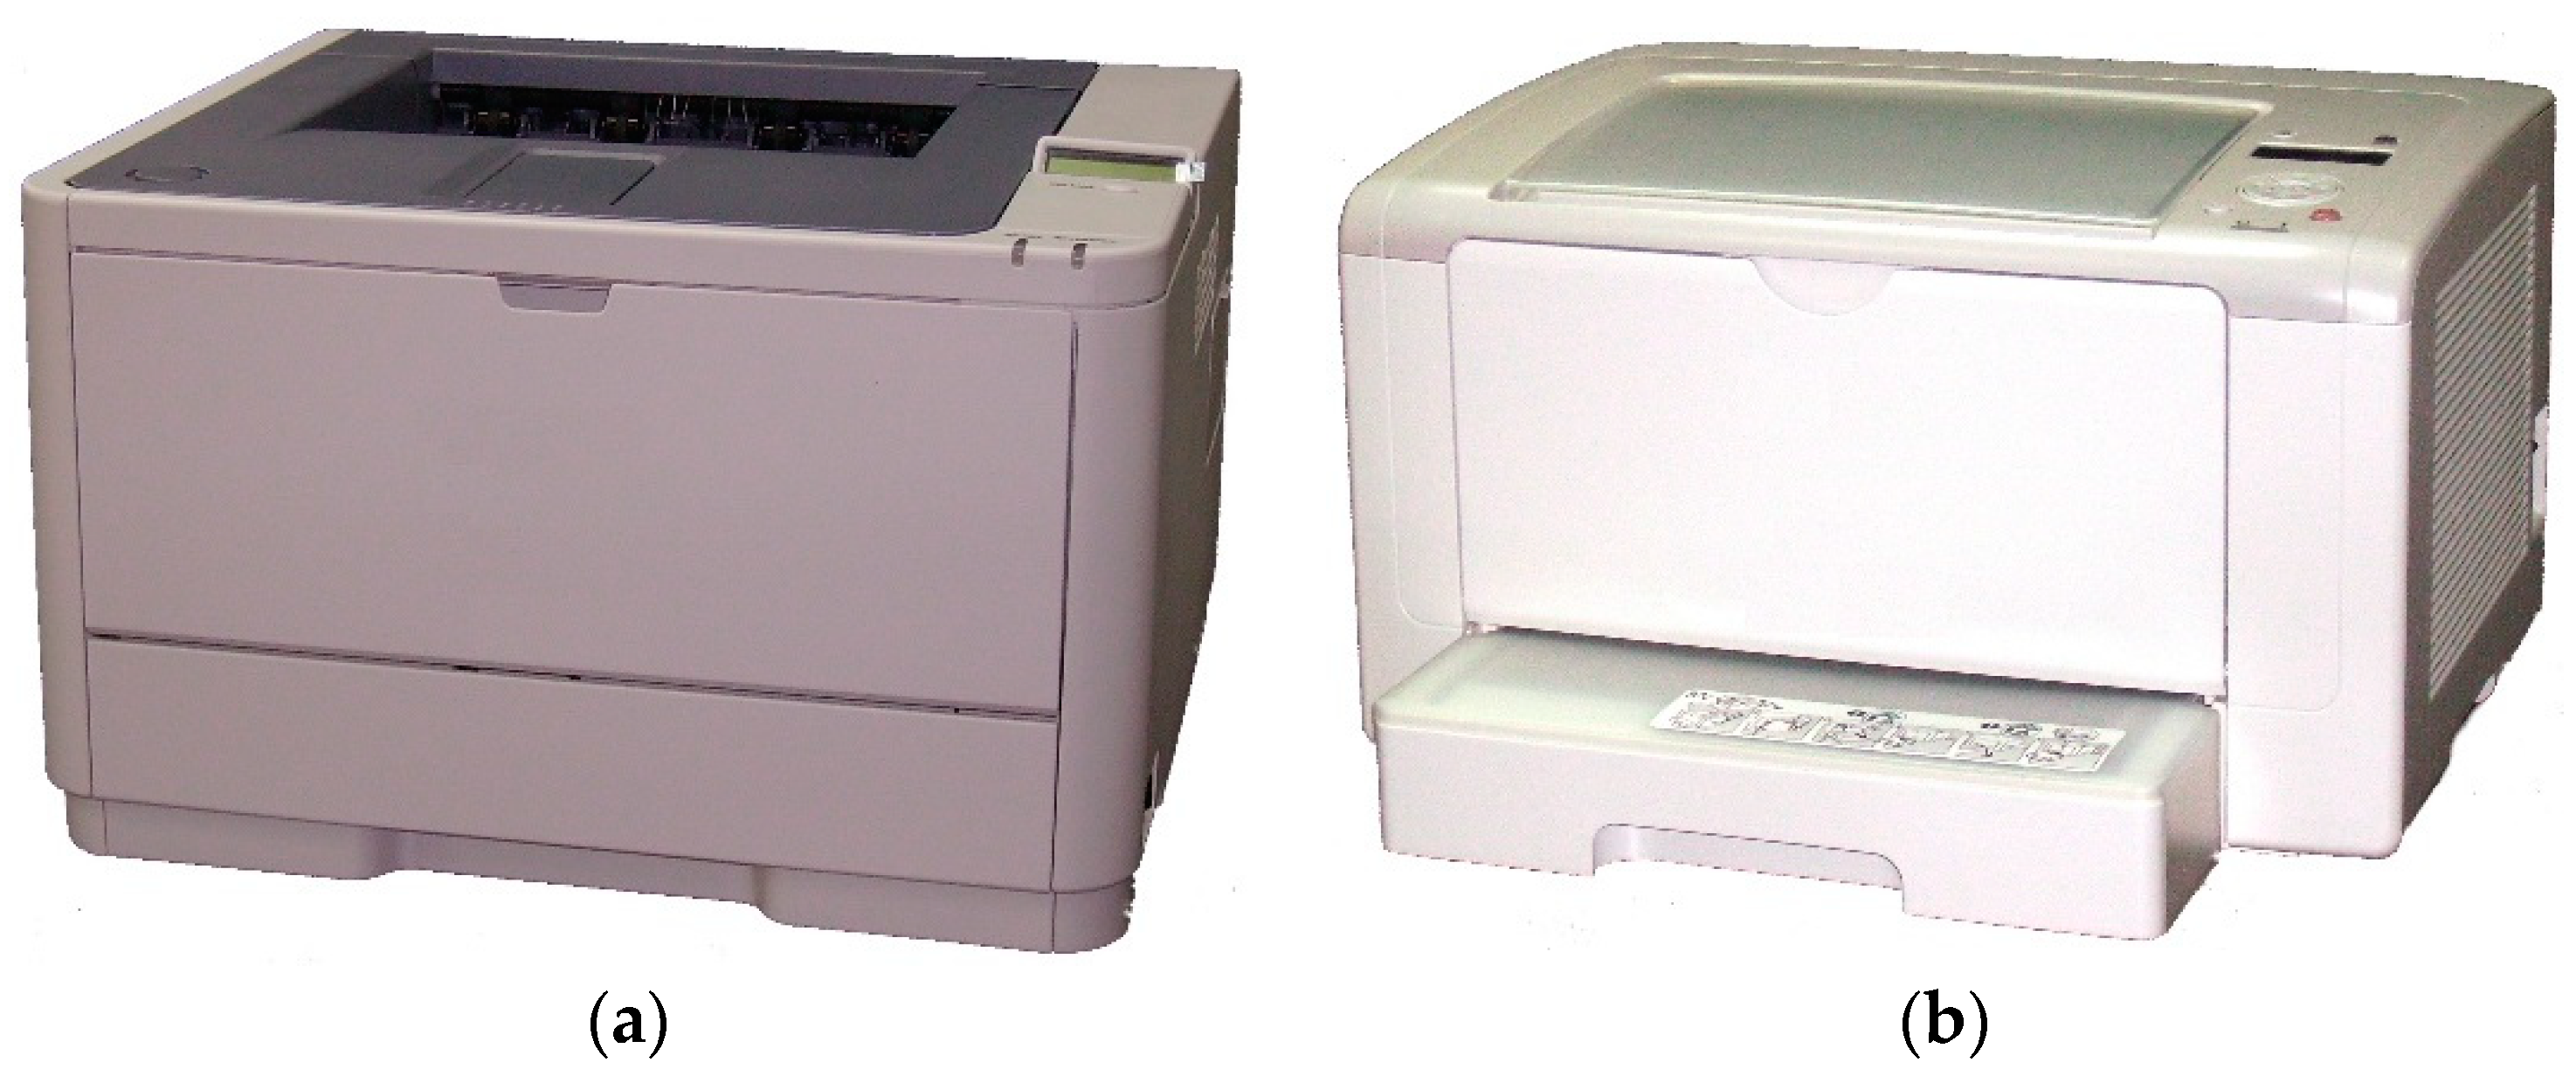
4.1. Printer A
4.2. Printer B
4.3. Generality
4.4. Further Exploration
5. Conclusions
Author Contributions
Acknowledgments
Conflicts of Interest
References
- Kuhn, M.M. Optical time-domain eavesdropping risks of CRT displays. In Proceedings of the 2002 IEEE Symposium on Security and Privacy, Berkeley, CA, USA, 12–15 May 2002; pp. 3–18. [Google Scholar]
- Kubiak, I. Video signal level (colour intensity) and effectiveness of electromagnetic infiltration. Bull. Pol. Acad. Sci. 2016, 64, 207–218. [Google Scholar] [CrossRef][Green Version]
- Ketenci, S.; Kayikcioglu, T.; Gangal, A. Recognition of sign language numbers via electromyography signals. In Proceedings of the Signal Processing and Communications Applications Conference (SIU), Malatya, Turkey, 16–19 May 2015; pp. 2593–2596. [Google Scholar]
- Huzurbazar, S.; Kuang, D.; Lee, L. Landmark-based algorithms for group average and pattern recognition. Pattern Recognit. 2019, 86, 172–187. [Google Scholar] [CrossRef]
- Toledo, I.; Carbonell, M.; Fornés, A.; Lladós, J. Information extraction from historical handwritten document images with a context-aware neural model. Pattern Recognit. 2019, 86, 27–36. [Google Scholar] [CrossRef]
- Wasfy, W.; Zheng, H. Dual image processing algorithms and parameter optimization. In Proceedings of the Seventh International Conference on Natural Computation (ICNC), Shanghai, China, 26–28 July 2011; Volume 2, p. 946. [Google Scholar]
- Goel, A.; Chandra, N. A technique for image encryption with combination of pixel rearrangement scheme based on sorting group wise of RGB values and explosive inter-pixel displacement. Int. J. Image Graph. Signal Process. 2012, 4, 16–22. [Google Scholar] [CrossRef]
- Kubiak, I. LED printers and safe fonts as an effective protection against the formation of unwanted emission. Turk. J. Electr. Eng. Comput. Sci. 2017, 25, 4268–4279. [Google Scholar] [CrossRef]
- Nguyen, K.; Fookes, C.; Raghavender, J.; Sridharan, S.; Ross, A. Long range iris recognition: A survey. Pattern Recognit. 2017, 72, 123–143. [Google Scholar] [CrossRef]
- Xie, S.; Wang, T.; Hao, X.; Yang, M.; Zhu, Y.; Li, Y. Localization and Frequency Identification of Large-Range Wide-Band Electromagnetic Interference Sources in Electromagnetic Imaging System. Electronics 2019, 8, 499. [Google Scholar] [CrossRef]
- Wu, C.; Gao, F.; Dai, H.; Wang, Z. A Topology-Based Approach to Improve Vehicle-Level Electromagnetic Radiation. Electronics 2019, 8, 364. [Google Scholar] [CrossRef]
- Li, L.; Wang, Y.; Suen, Y.; Tang, Z.; Liu, D. A tree conditional random field model for panel detection in comic images. Pattern Recognit. 2015, 48, 2129–2140. [Google Scholar] [CrossRef]
- Kuhn, M.M. Electromagnetic eavesdropping risks of flat-panel displays. In Proceedings of the 4th Workshop on Privacy Enhancing Technologies, Toronto, ON, Canada, 26–28 May 2004; LNCS 3424. p. 88. [Google Scholar]
- Ulas, C.; Asik, U.; Karadeniz, C. Analysis and reconstruction of laser printer information leakages in the media of electromagnetic radiation, power, and signal lines. Comput. Secur. 2016, 58, 250–267. [Google Scholar] [CrossRef]
- Yong, S.; Biao, L.; Wang, B.; Qi, Z.; Liu, J. Unsupervised Single-Image Super-Resolution with Multi-Gram Loss. Electronics 2019, 8, 833. [Google Scholar] [CrossRef]
- Loughry, J.; Umphress, D.D. Information leakage from optical emanations. Acm Trans. Inf. Syst. Secur. 2002, 5, 262–289. [Google Scholar] [CrossRef]
- Kim, J.; Park, N.; Kim, G.; Jin, S. CCTV Video Processing Metadata Security Scheme Using Character Order Preserving-Transformation in the Emerging Multimedia. Electronics 2019, 8, 412. [Google Scholar] [CrossRef]
- Sadri, J.; Yeganehzad, M.M.; Saghi, J. A novel comprehensive database for offline Persian handwriting recognition. Pattern Recognit. 2016, 60, 378–393. [Google Scholar] [CrossRef]
- Kubiak, I. Computer font resistant to electromagnetic infiltration process. Prz. Elektrotechniczny 2014, 90, 207–215. [Google Scholar]
- Ketenci, S.; Gangal, A. Automatic reduction of periodic noise in images using adaptive Gaussian star filter. Turk. J. Electr. Eng. Comput. Sci. 2016, 25, 2336–2348. [Google Scholar] [CrossRef]
- Song, T.T.; Jeong, Y.Y.; Yook, J.J. Modeling of leaked digital video signal and information recovery rate as a function of SNR. IEEE Trans. Electromagn. Compat. 2015, 57, 164–172. [Google Scholar] [CrossRef]
- Kubiak, I.; Musial, S. Hardware raster generator as a tool that supports electromagnetic infiltration. Telecommun. Rev. Telecommun. News 2011, 11, 1601–1607. [Google Scholar]
- Kubiak, I.; Przybysz, A. Printing technology and electromagnetic protection of information. Prz. Elektrotechniczny 2016, 1, 177–181. [Google Scholar]
- Pishchulin, L.; Gass, T.; Dreuw, P.; Ney, H. Image warping for face recognition: From local optimality towards global optimization. Pattern Recognit. 2012, 45, 3131–3140. [Google Scholar] [CrossRef]
- Jalilian, B.; Chalechale, A. Persian sign language recognition using radial distance and Fourier transform. Int. J. Image Graph. Signal Process. 2014, 6, 40–46. [Google Scholar] [CrossRef][Green Version]
- Kubiak, I. The influence of the structure of useful signal on the efficacy of sensitive emission of laser printers. Measurement 2018, 119, 63–76. [Google Scholar] [CrossRef]
- Fortuna, L.; Arena, P.; Balya, D.; Zarandy, A. Cellular neural networks: A paradigm for nonlinear spatio-temporal processing. IEEE Circuits Syst. Mag. 2001, 1, 6–21. [Google Scholar] [CrossRef]


| Operating Mode | Parameters of Useful Signal | |
|---|---|---|
| Frequency [kHz] | Amplitude [V] | |
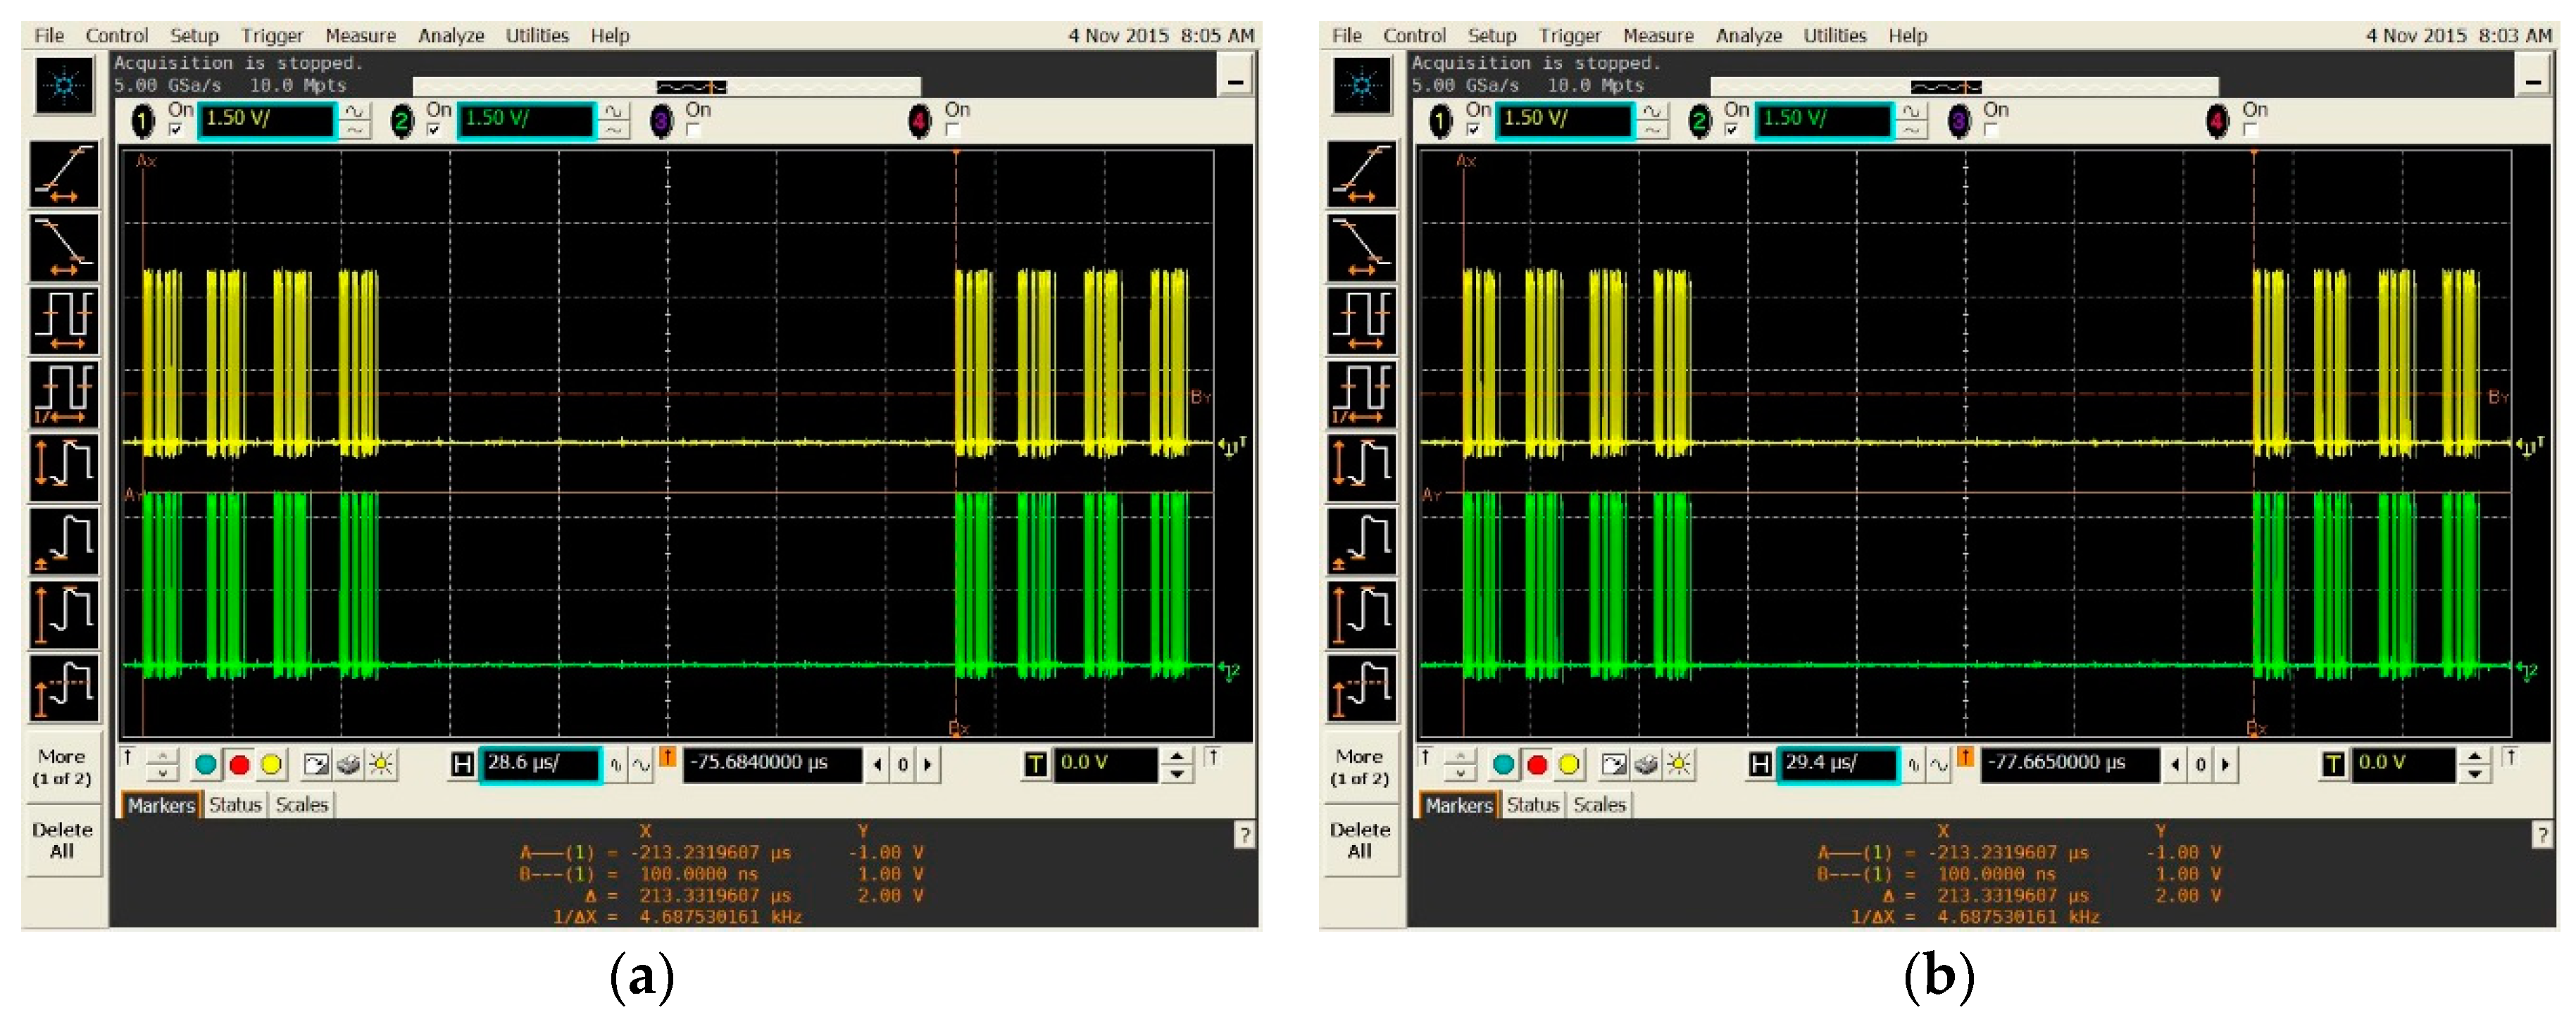
| 300 dpi, Eco | ~4.7 | 3.5 |
| 300 dpi, Best | ~4.7 | 3.5 |
| 600 dpi, Eco | ~4.7 | 3.5 |
| 600 dpi, Best | ~4.7 | 3.5 |
| 1200 dpi, Eco | ~9.4 | 3.5 |
| 1200 dpi, Best | ~9.4 | 3.5 |
| Operating Mode | Signal Parameters | ||
|---|---|---|---|
| Amplitude (mV) | |||
| PRF of Differential Signals (kHz) | First Differential Pair (1, 3, 5, 7) | Second Differential Pair (2, 4, 6, 8) | |
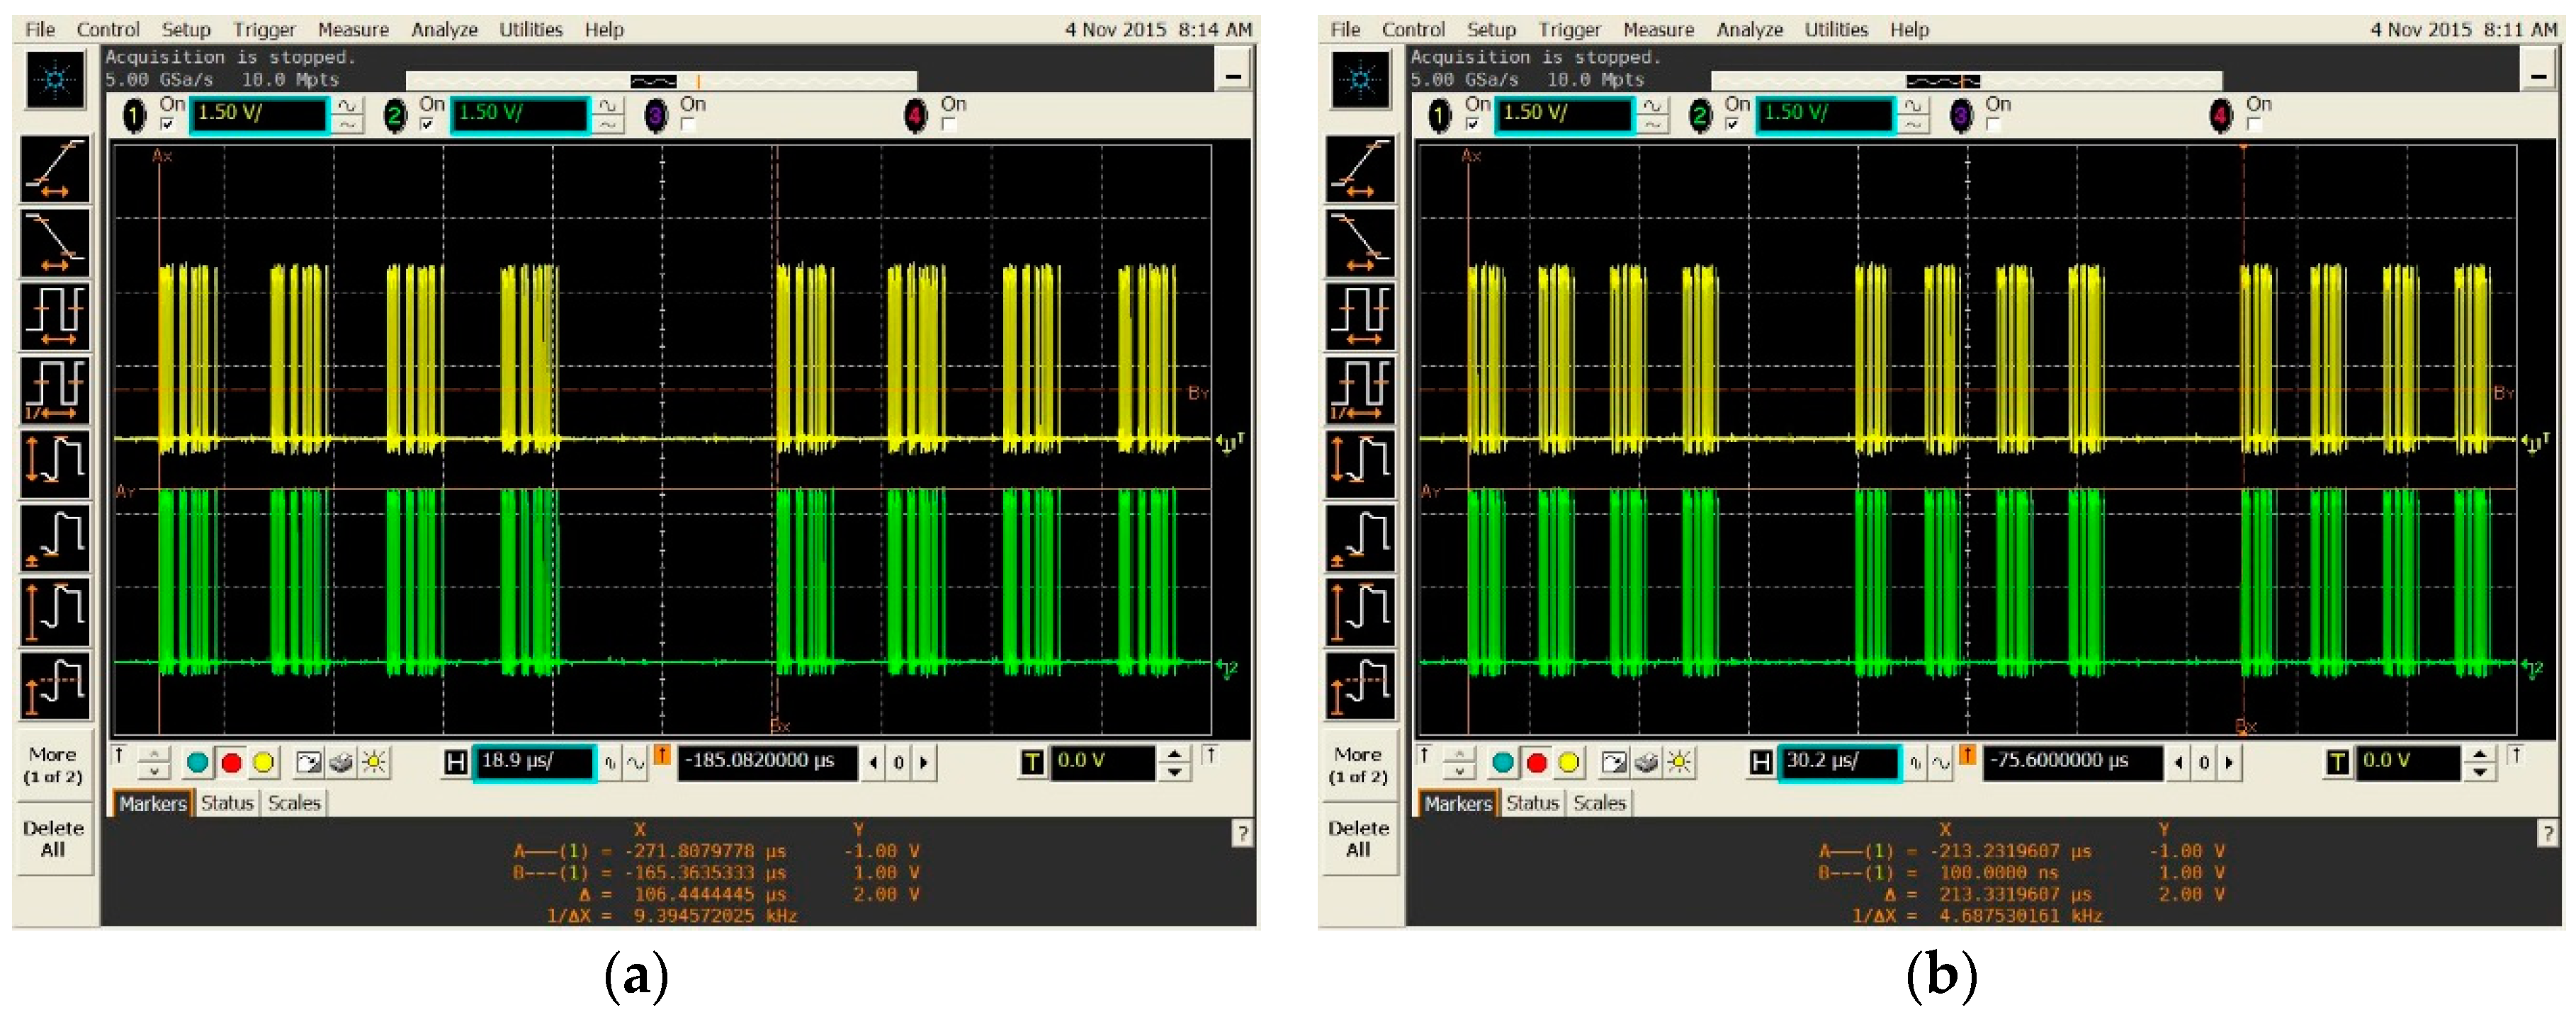
| 600 dpi Eco | 2.07 | −250 | +250 |
| 600 dpi Best | 4.14 | −250 | +250 |
| 1200 dpi Eco | 4.14 | −250 | +250 |
| 1200 dpi Best | 8.28 | −250 | +250 |
| Type of Printer | 600 dpi | 1200 dpi | ||
|---|---|---|---|---|
| Best | Eco | Best | Eco | |
| Dual diode printer * | W1 | K1 | W1 | K1 |
| Dual diode printer ** | W1 | W1 | K1 | W1 |
| Dual diode printer *** | W1 | W1 | W1 | W1 |
| LED array printer A | K2 | K2 | K2 | K2 |
| LED array printer B | W2 | W2 | W2 | W2 |
© 2019 by the authors. Licensee MDPI, Basel, Switzerland. This article is an open access article distributed under the terms and conditions of the Creative Commons Attribution (CC BY) license (http://creativecommons.org/licenses/by/4.0/).
Share and Cite
Kubiak, I.; Loughry, J. LED Arrays of Laser Printers as Valuable Sources of Electromagnetic Waves for Acquisition of Graphic Data. Electronics 2019, 8, 1078. https://doi.org/10.3390/electronics8101078
Kubiak I, Loughry J. LED Arrays of Laser Printers as Valuable Sources of Electromagnetic Waves for Acquisition of Graphic Data. Electronics. 2019; 8(10):1078. https://doi.org/10.3390/electronics8101078
Chicago/Turabian StyleKubiak, Ireneusz, and Joe Loughry. 2019. "LED Arrays of Laser Printers as Valuable Sources of Electromagnetic Waves for Acquisition of Graphic Data" Electronics 8, no. 10: 1078. https://doi.org/10.3390/electronics8101078
APA StyleKubiak, I., & Loughry, J. (2019). LED Arrays of Laser Printers as Valuable Sources of Electromagnetic Waves for Acquisition of Graphic Data. Electronics, 8(10), 1078. https://doi.org/10.3390/electronics8101078