A Study on the Improved Capacitor Voltage Balancing Method for Modular Multilevel Converter Based on Hardware-In-the-Loop Simulation


Abstract
:1. Introduction
2. Modular Multilevel Converter
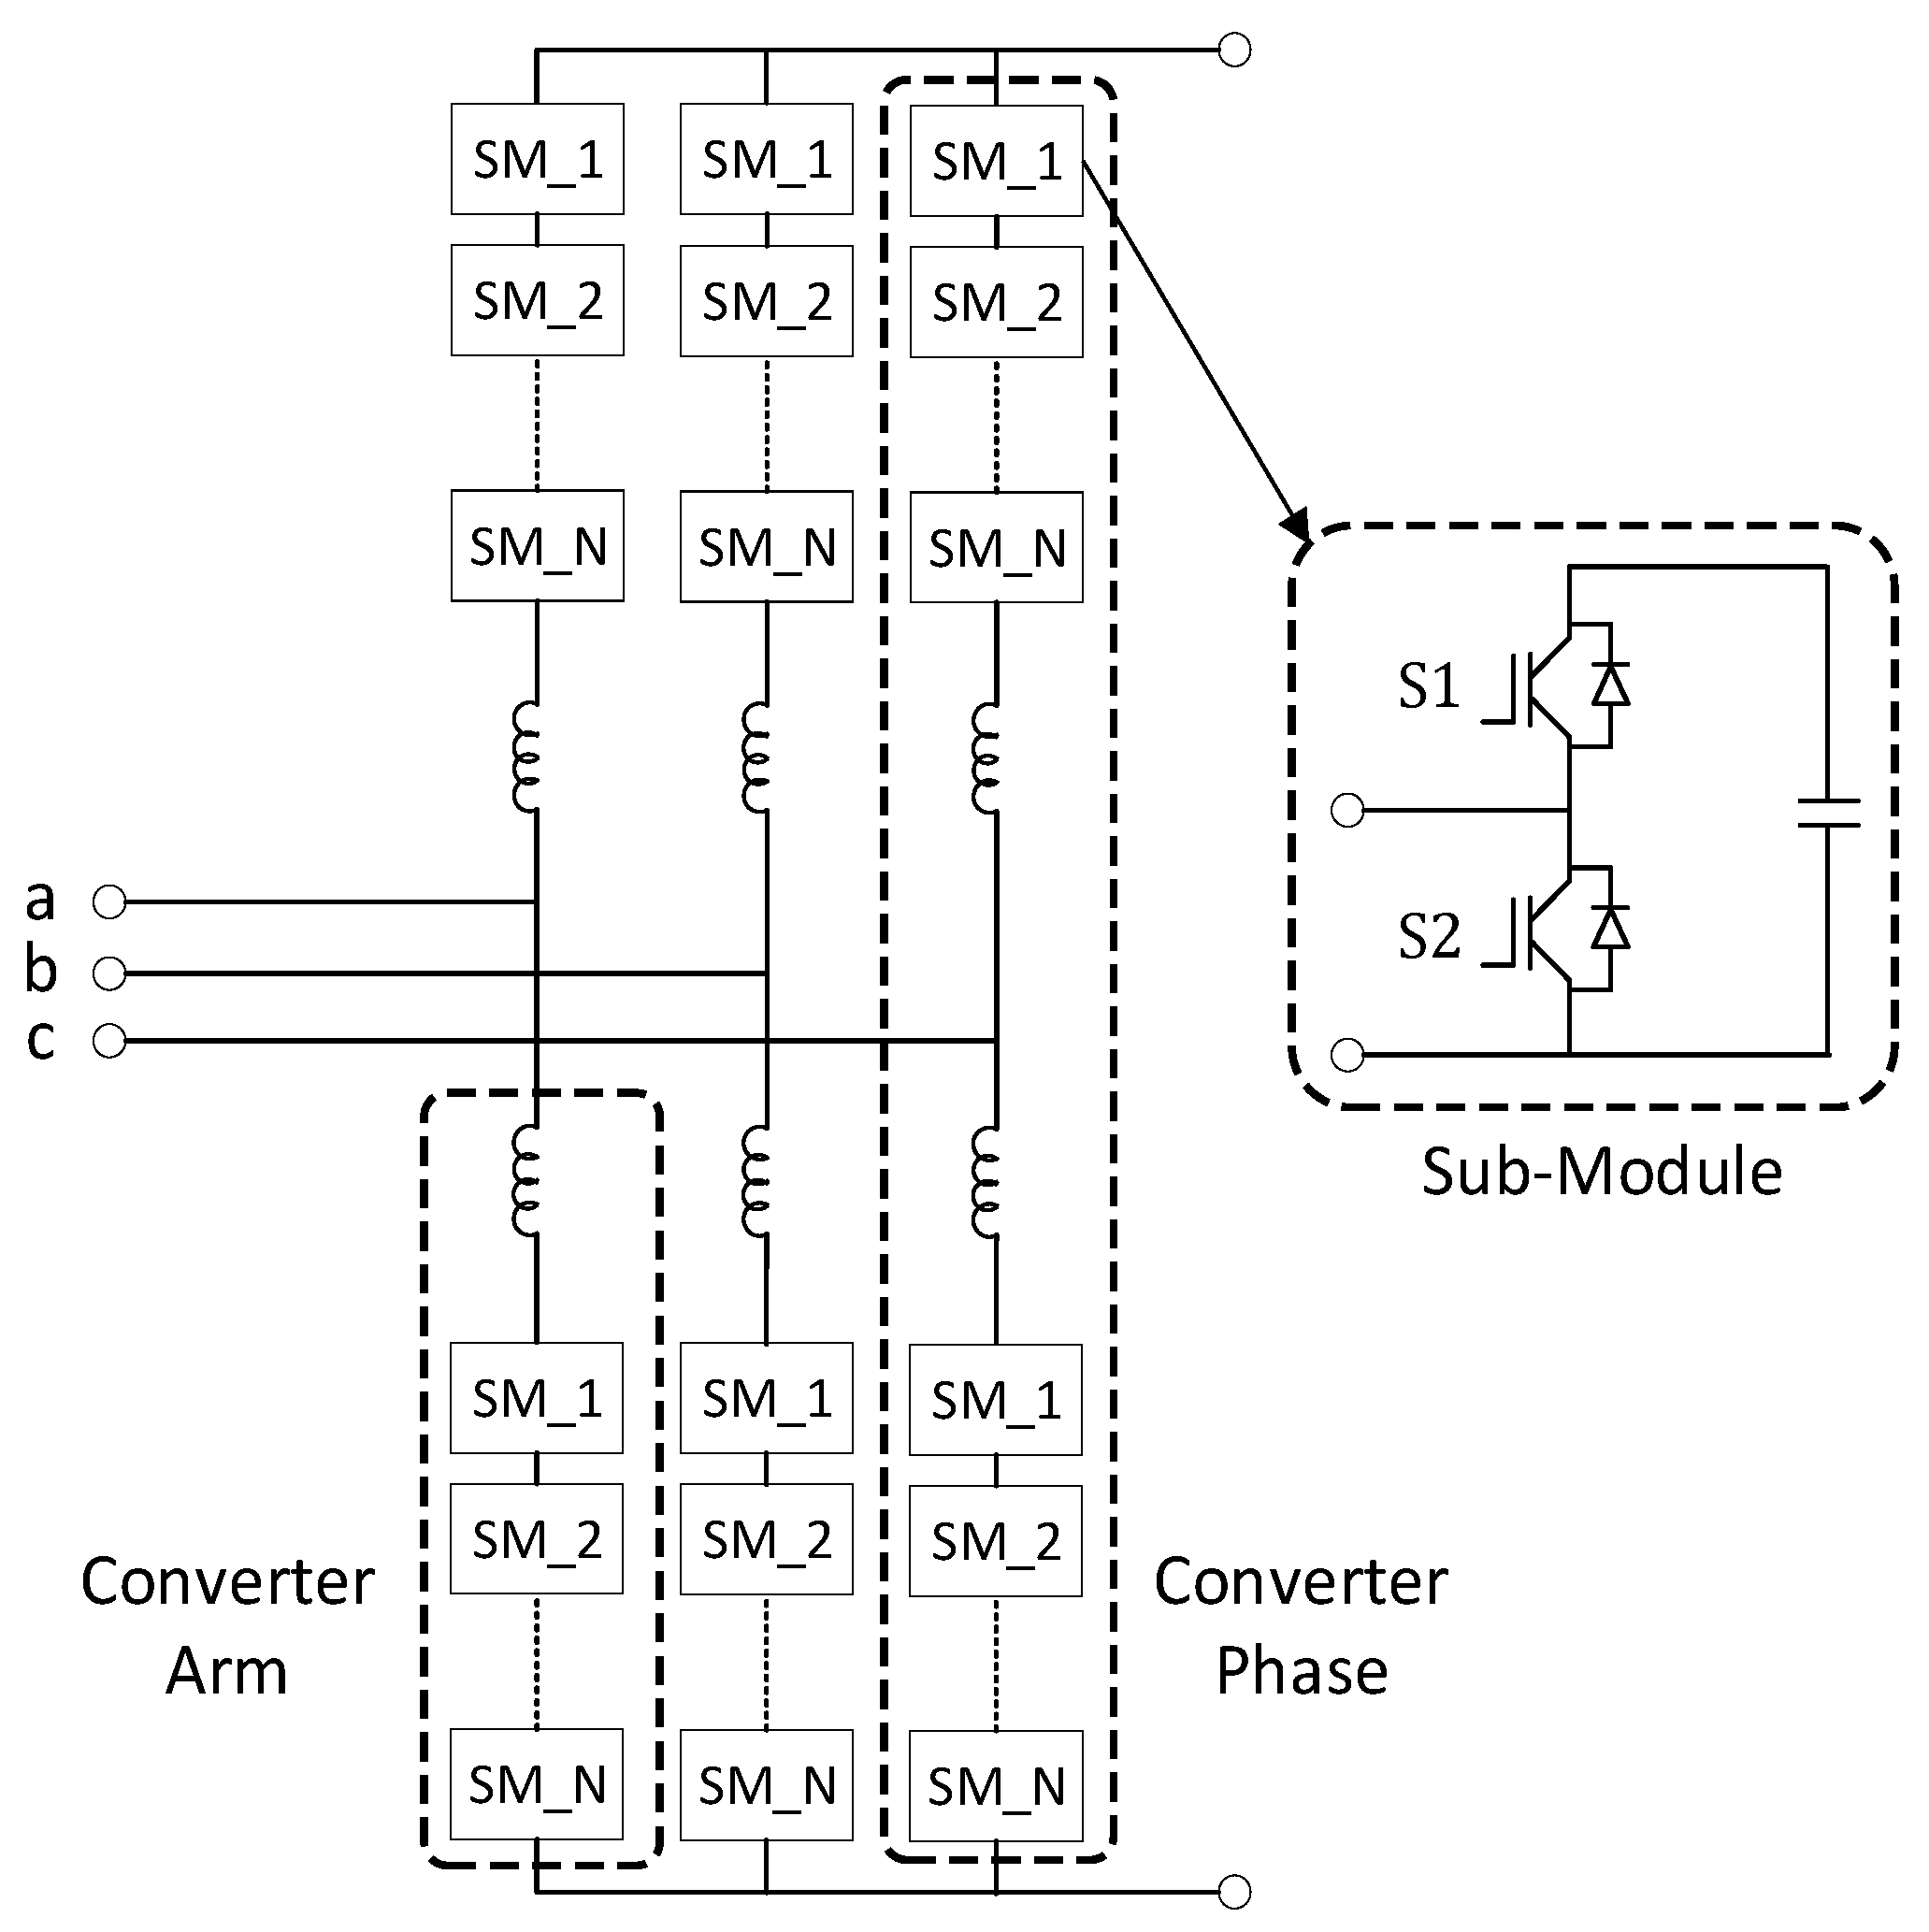
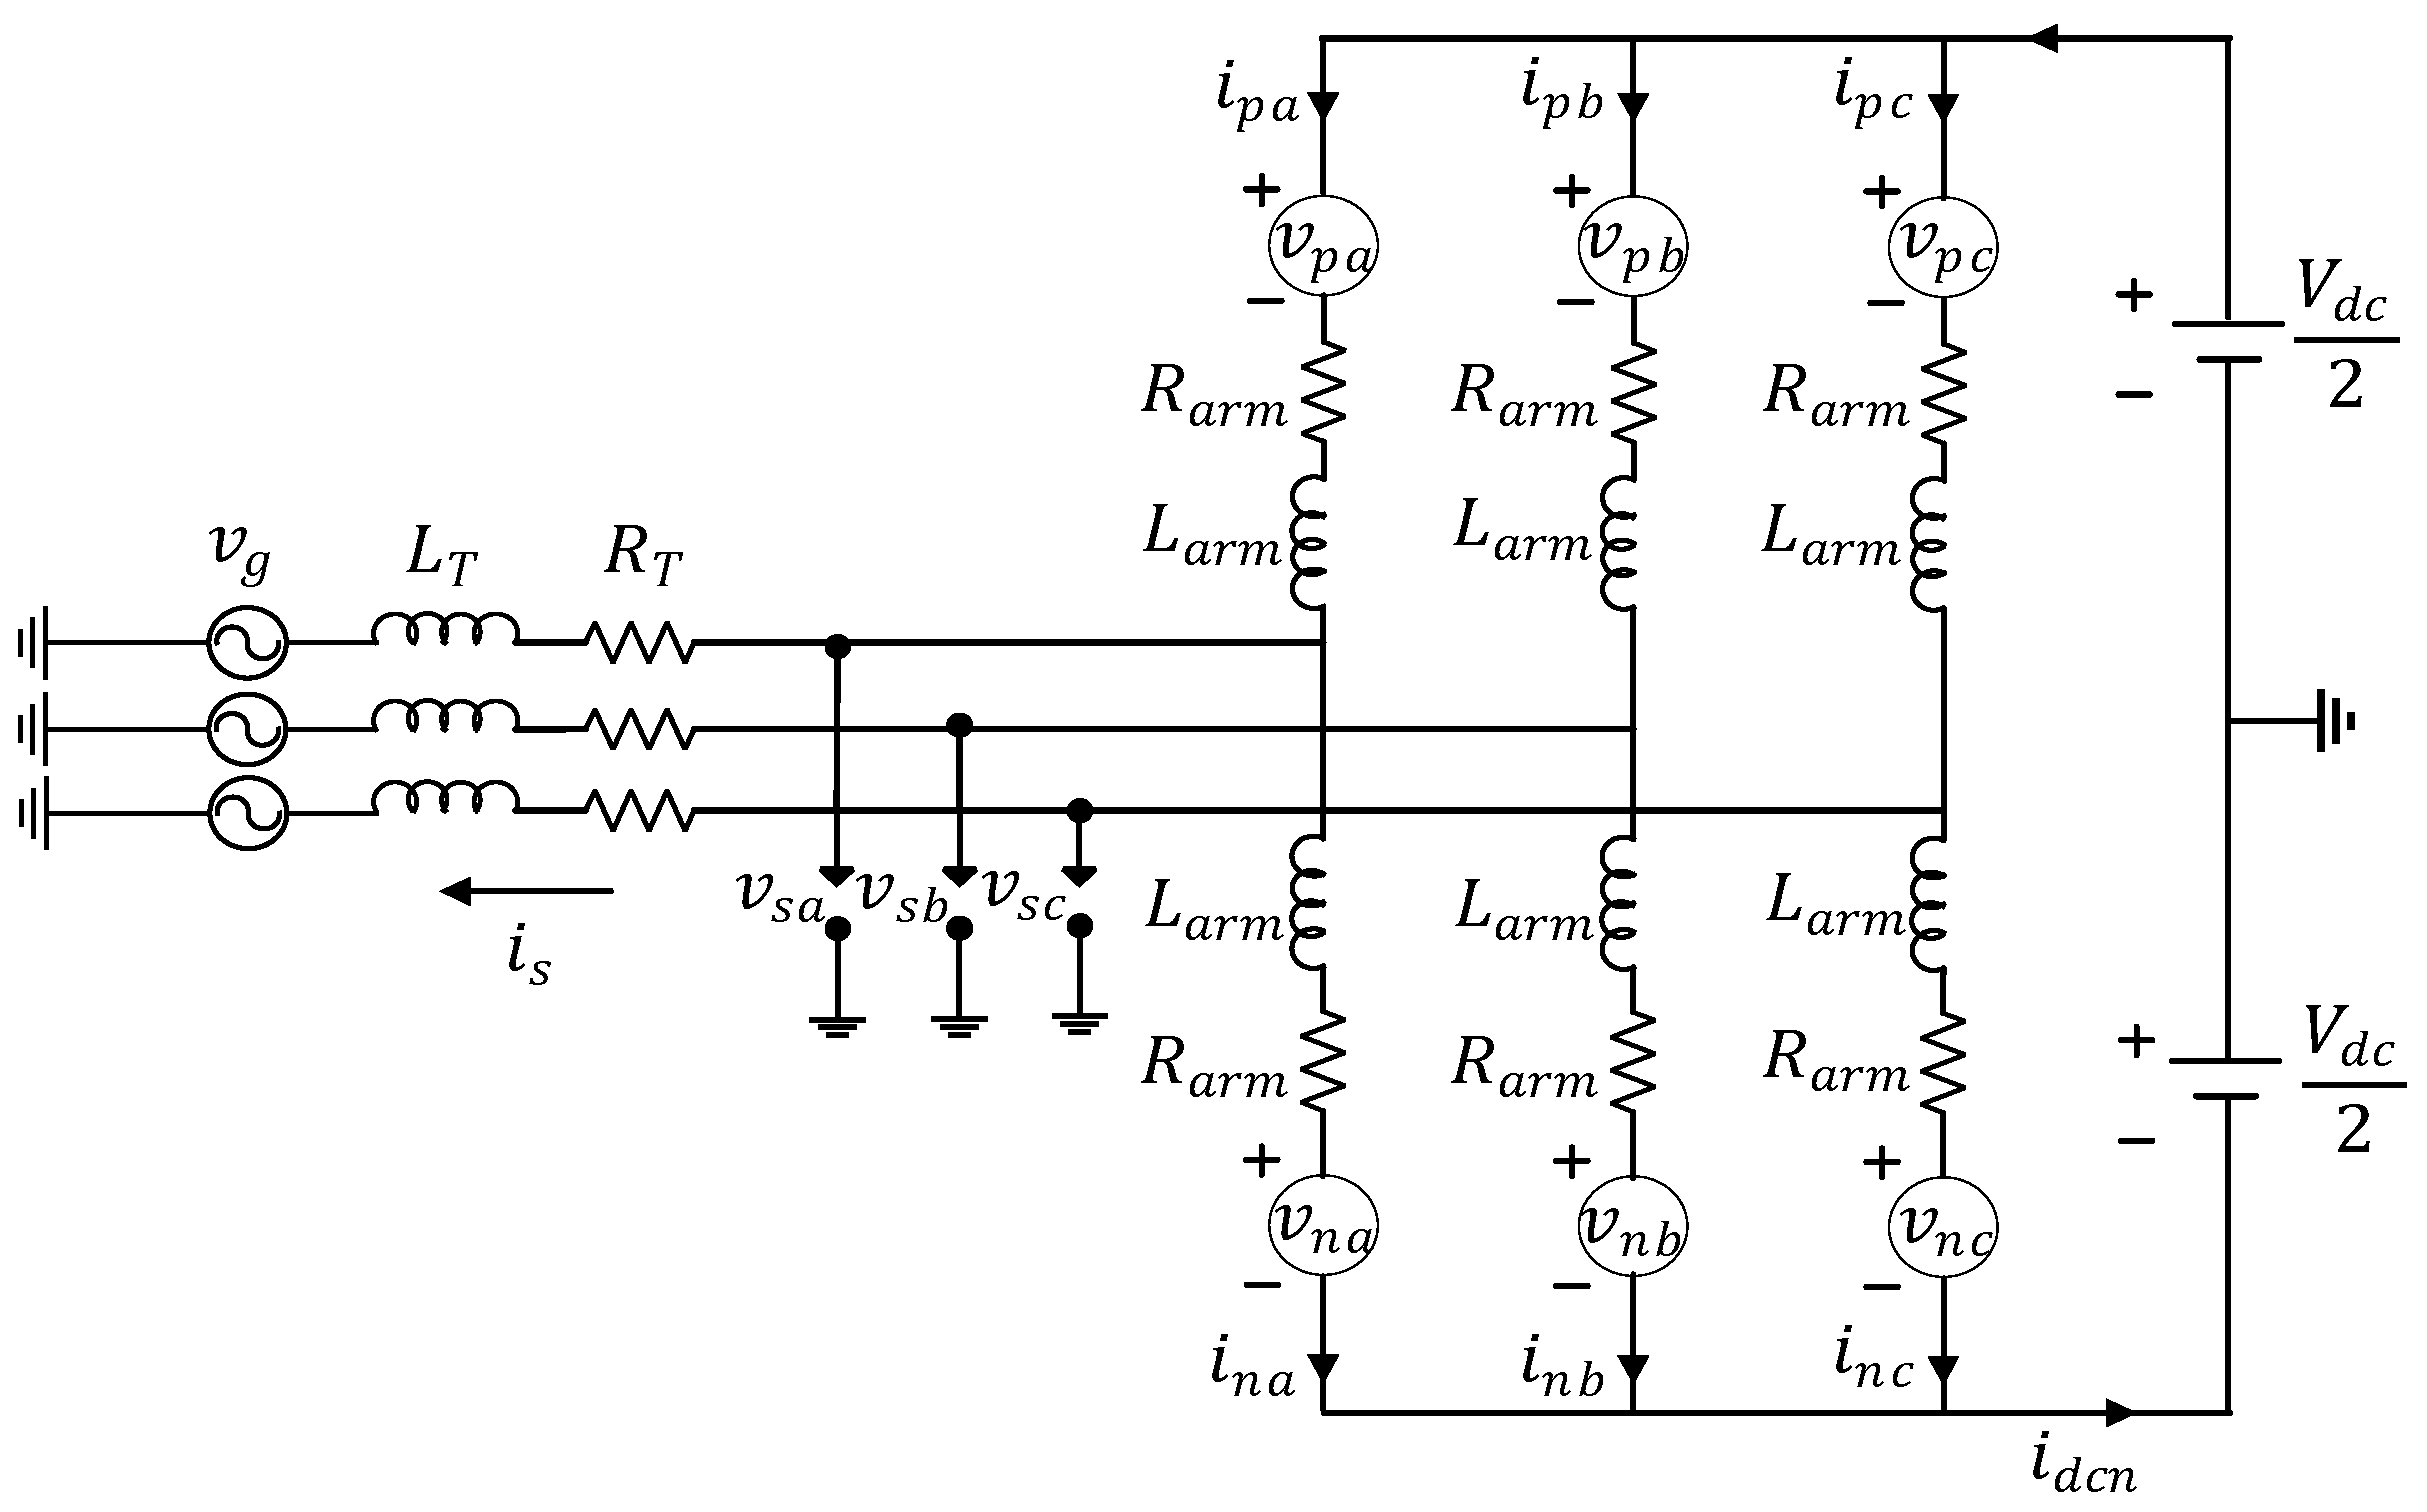
2.1. Topology of Modular Multilevel Converter
2.2. Specification Design of MMC
3. Hardware In-the-Loop Simulation
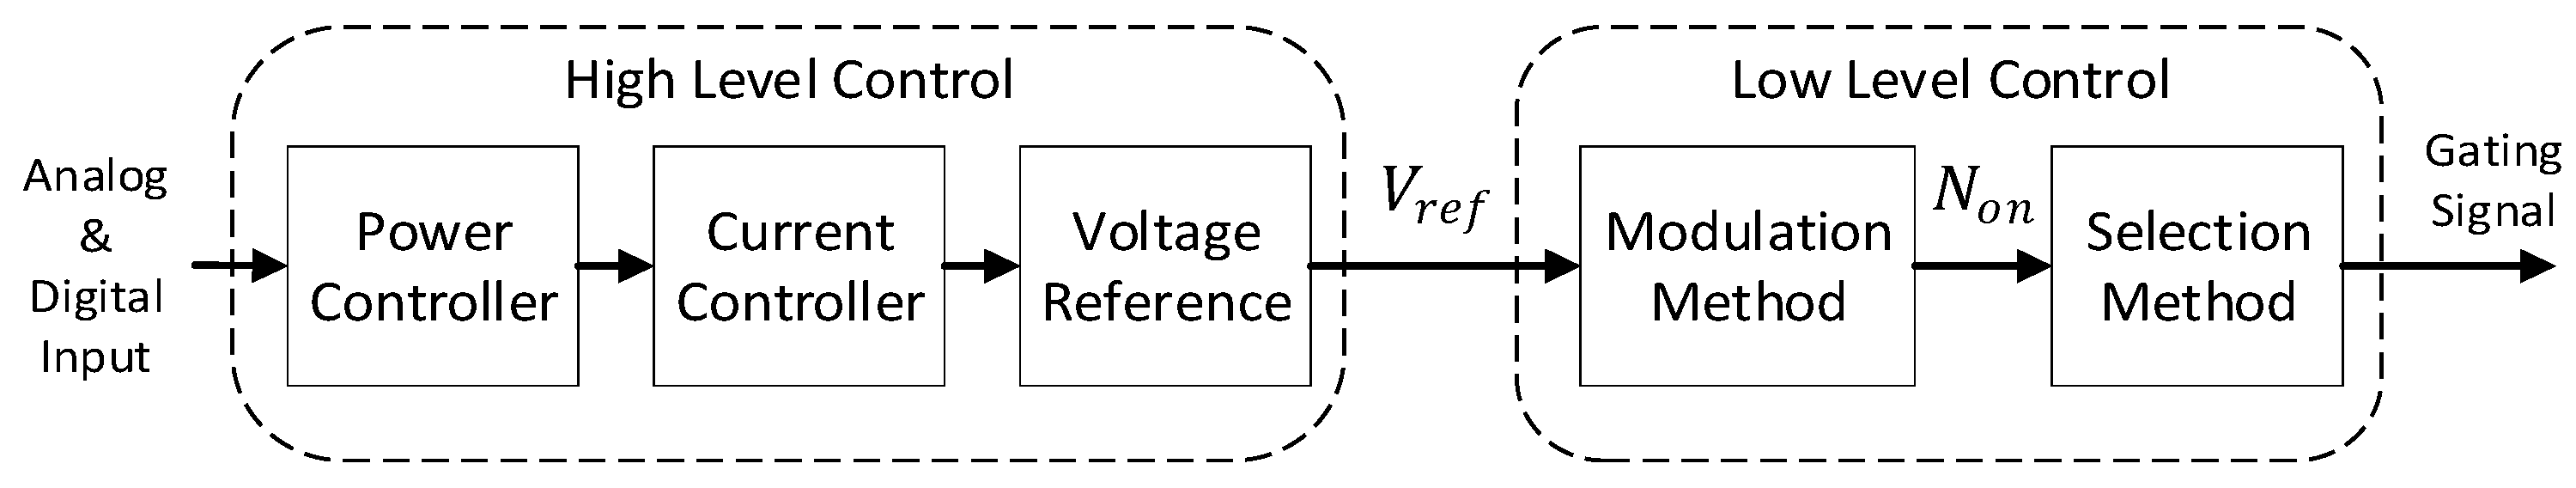
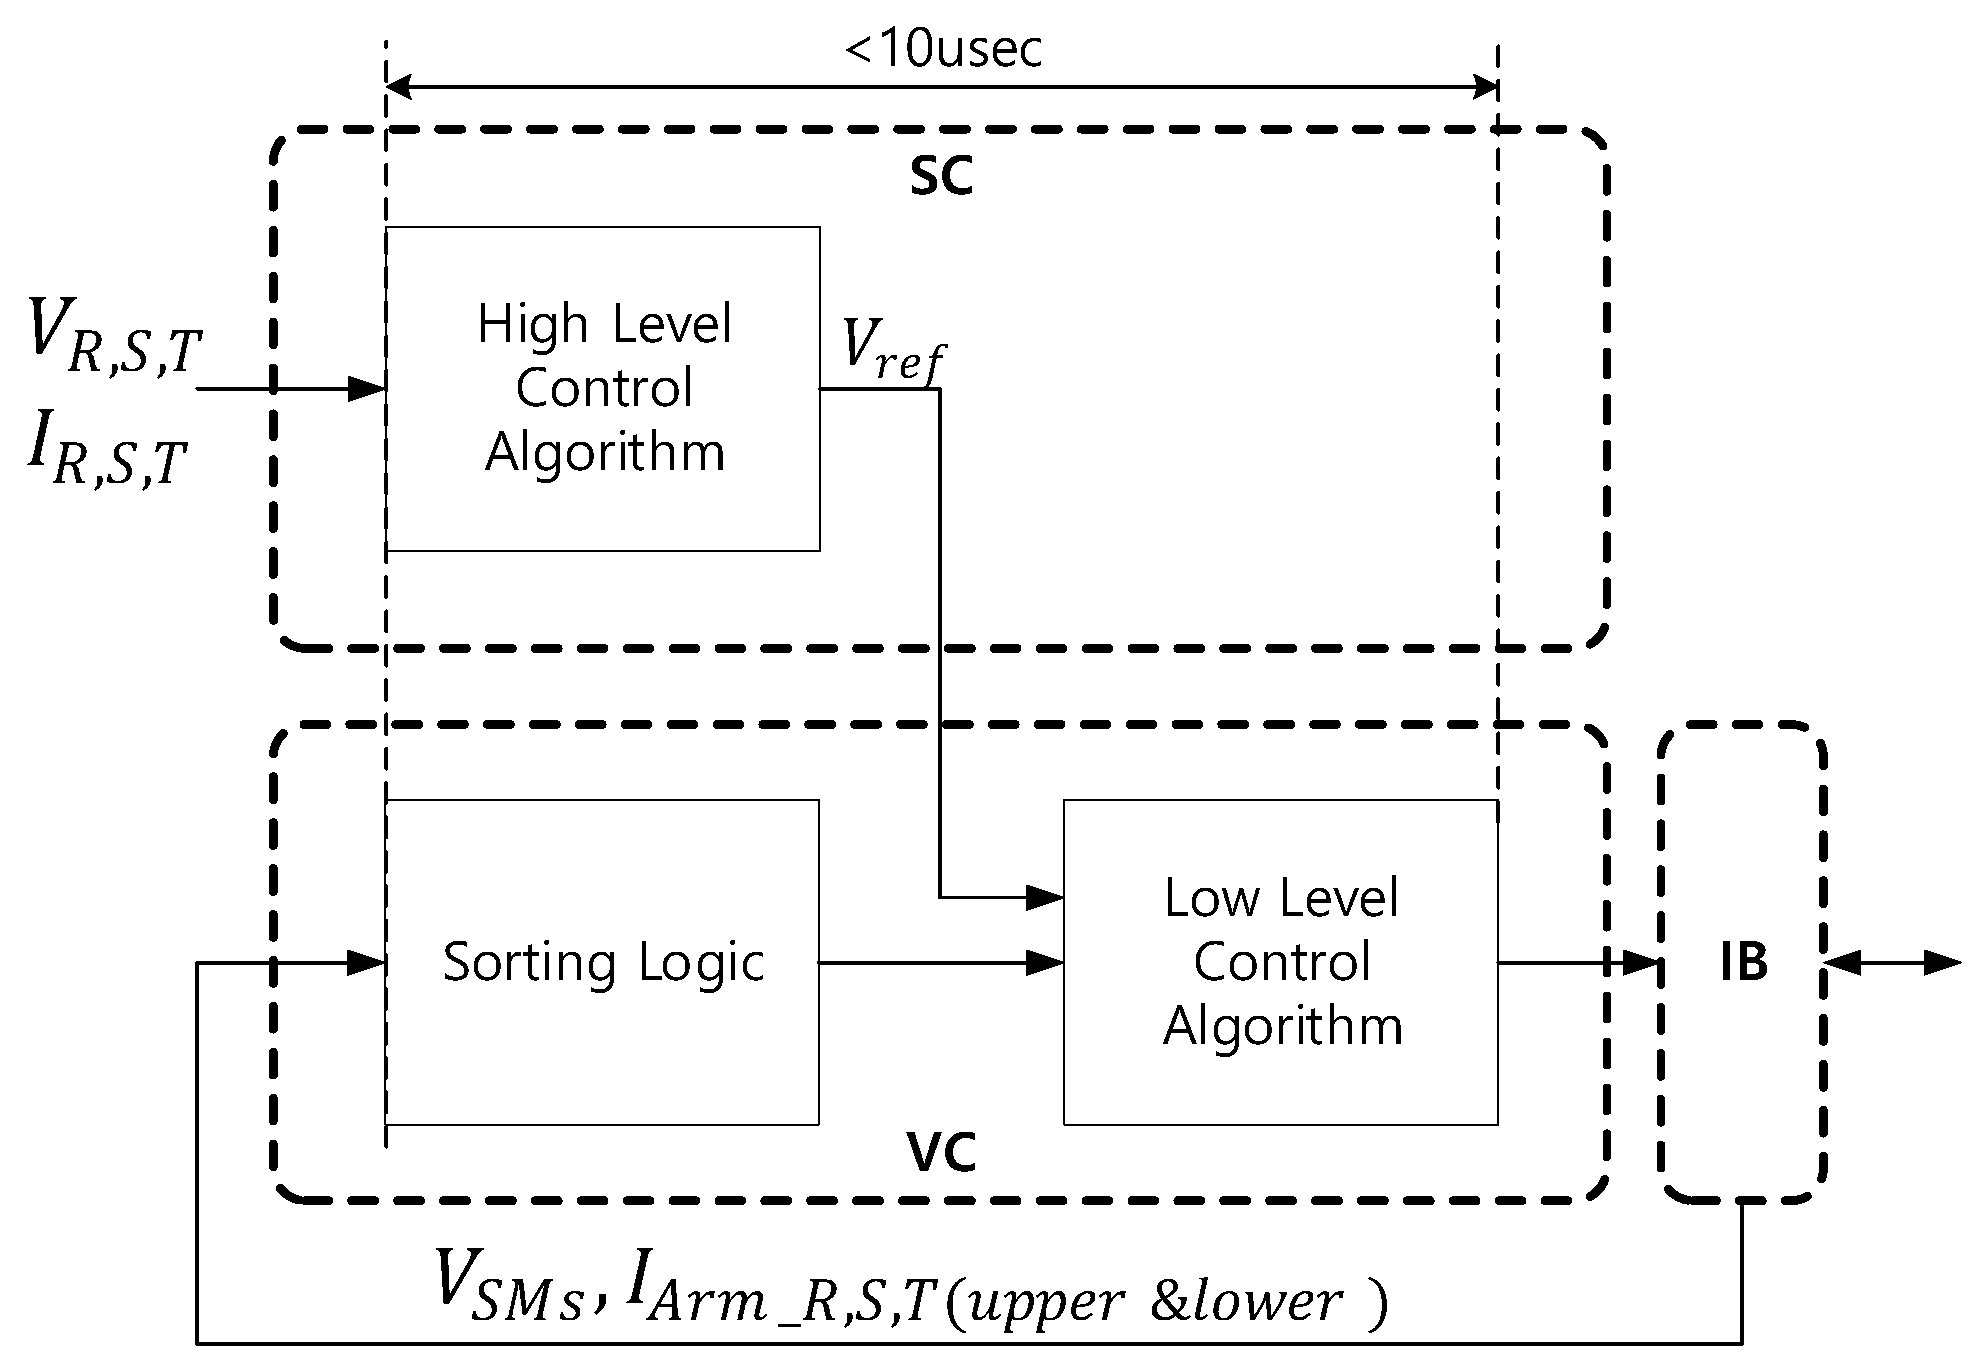
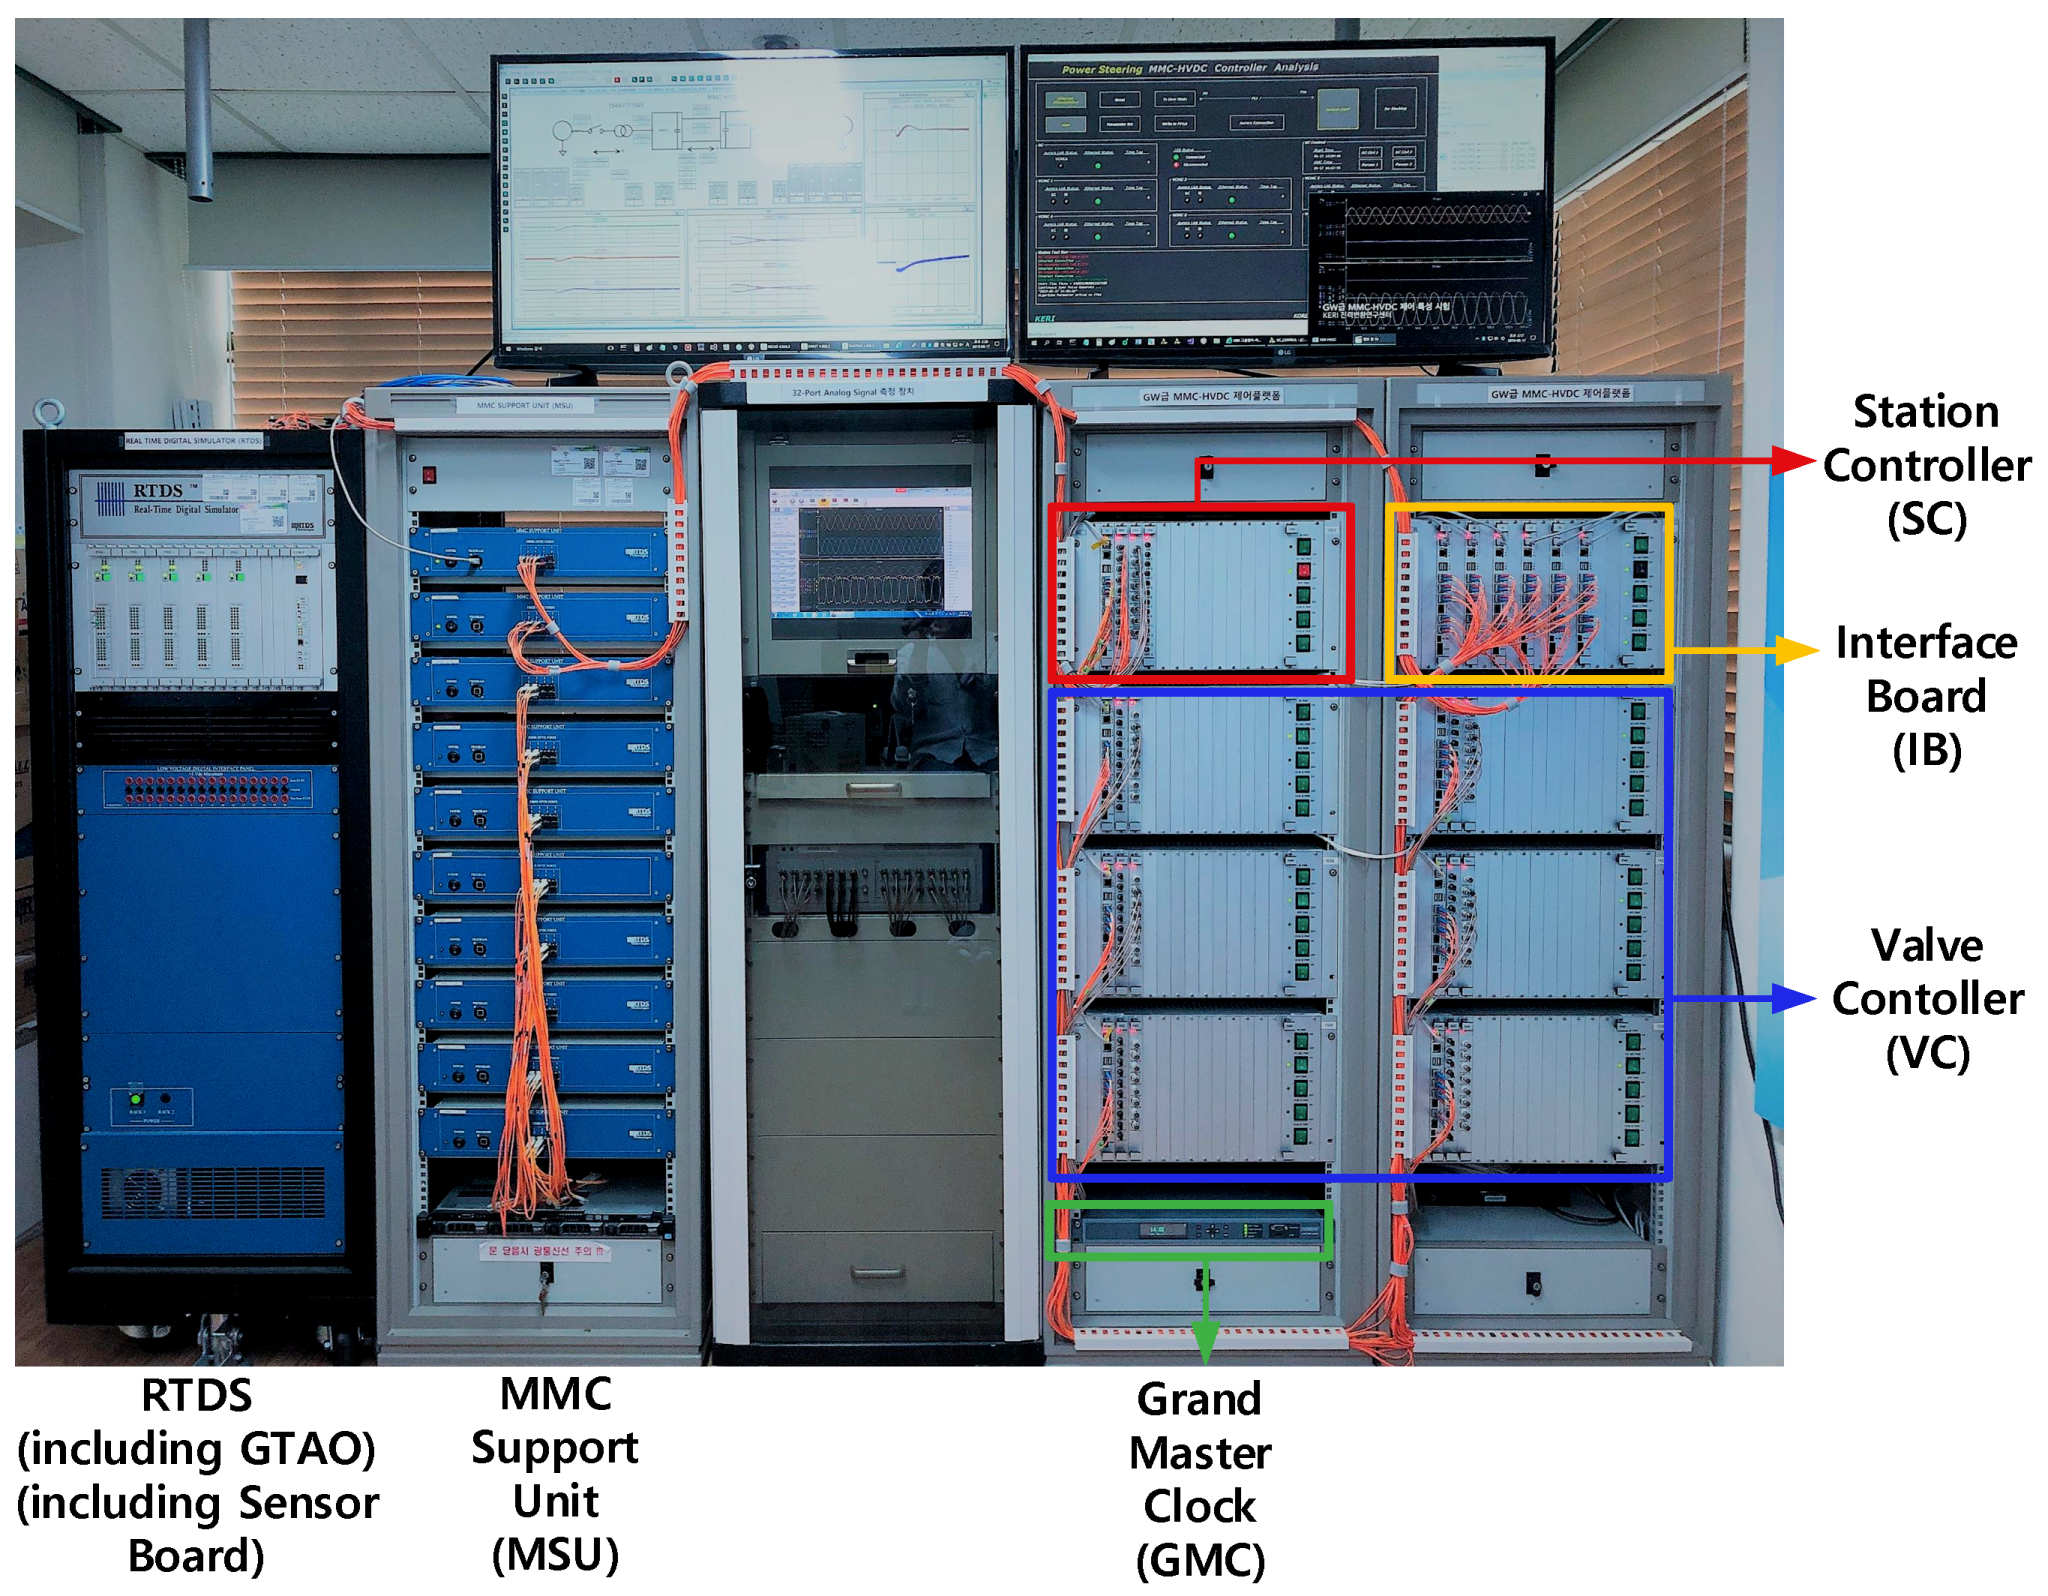
3.1. Implementation of a Physical MMC Controller
3.2. RTDS Design
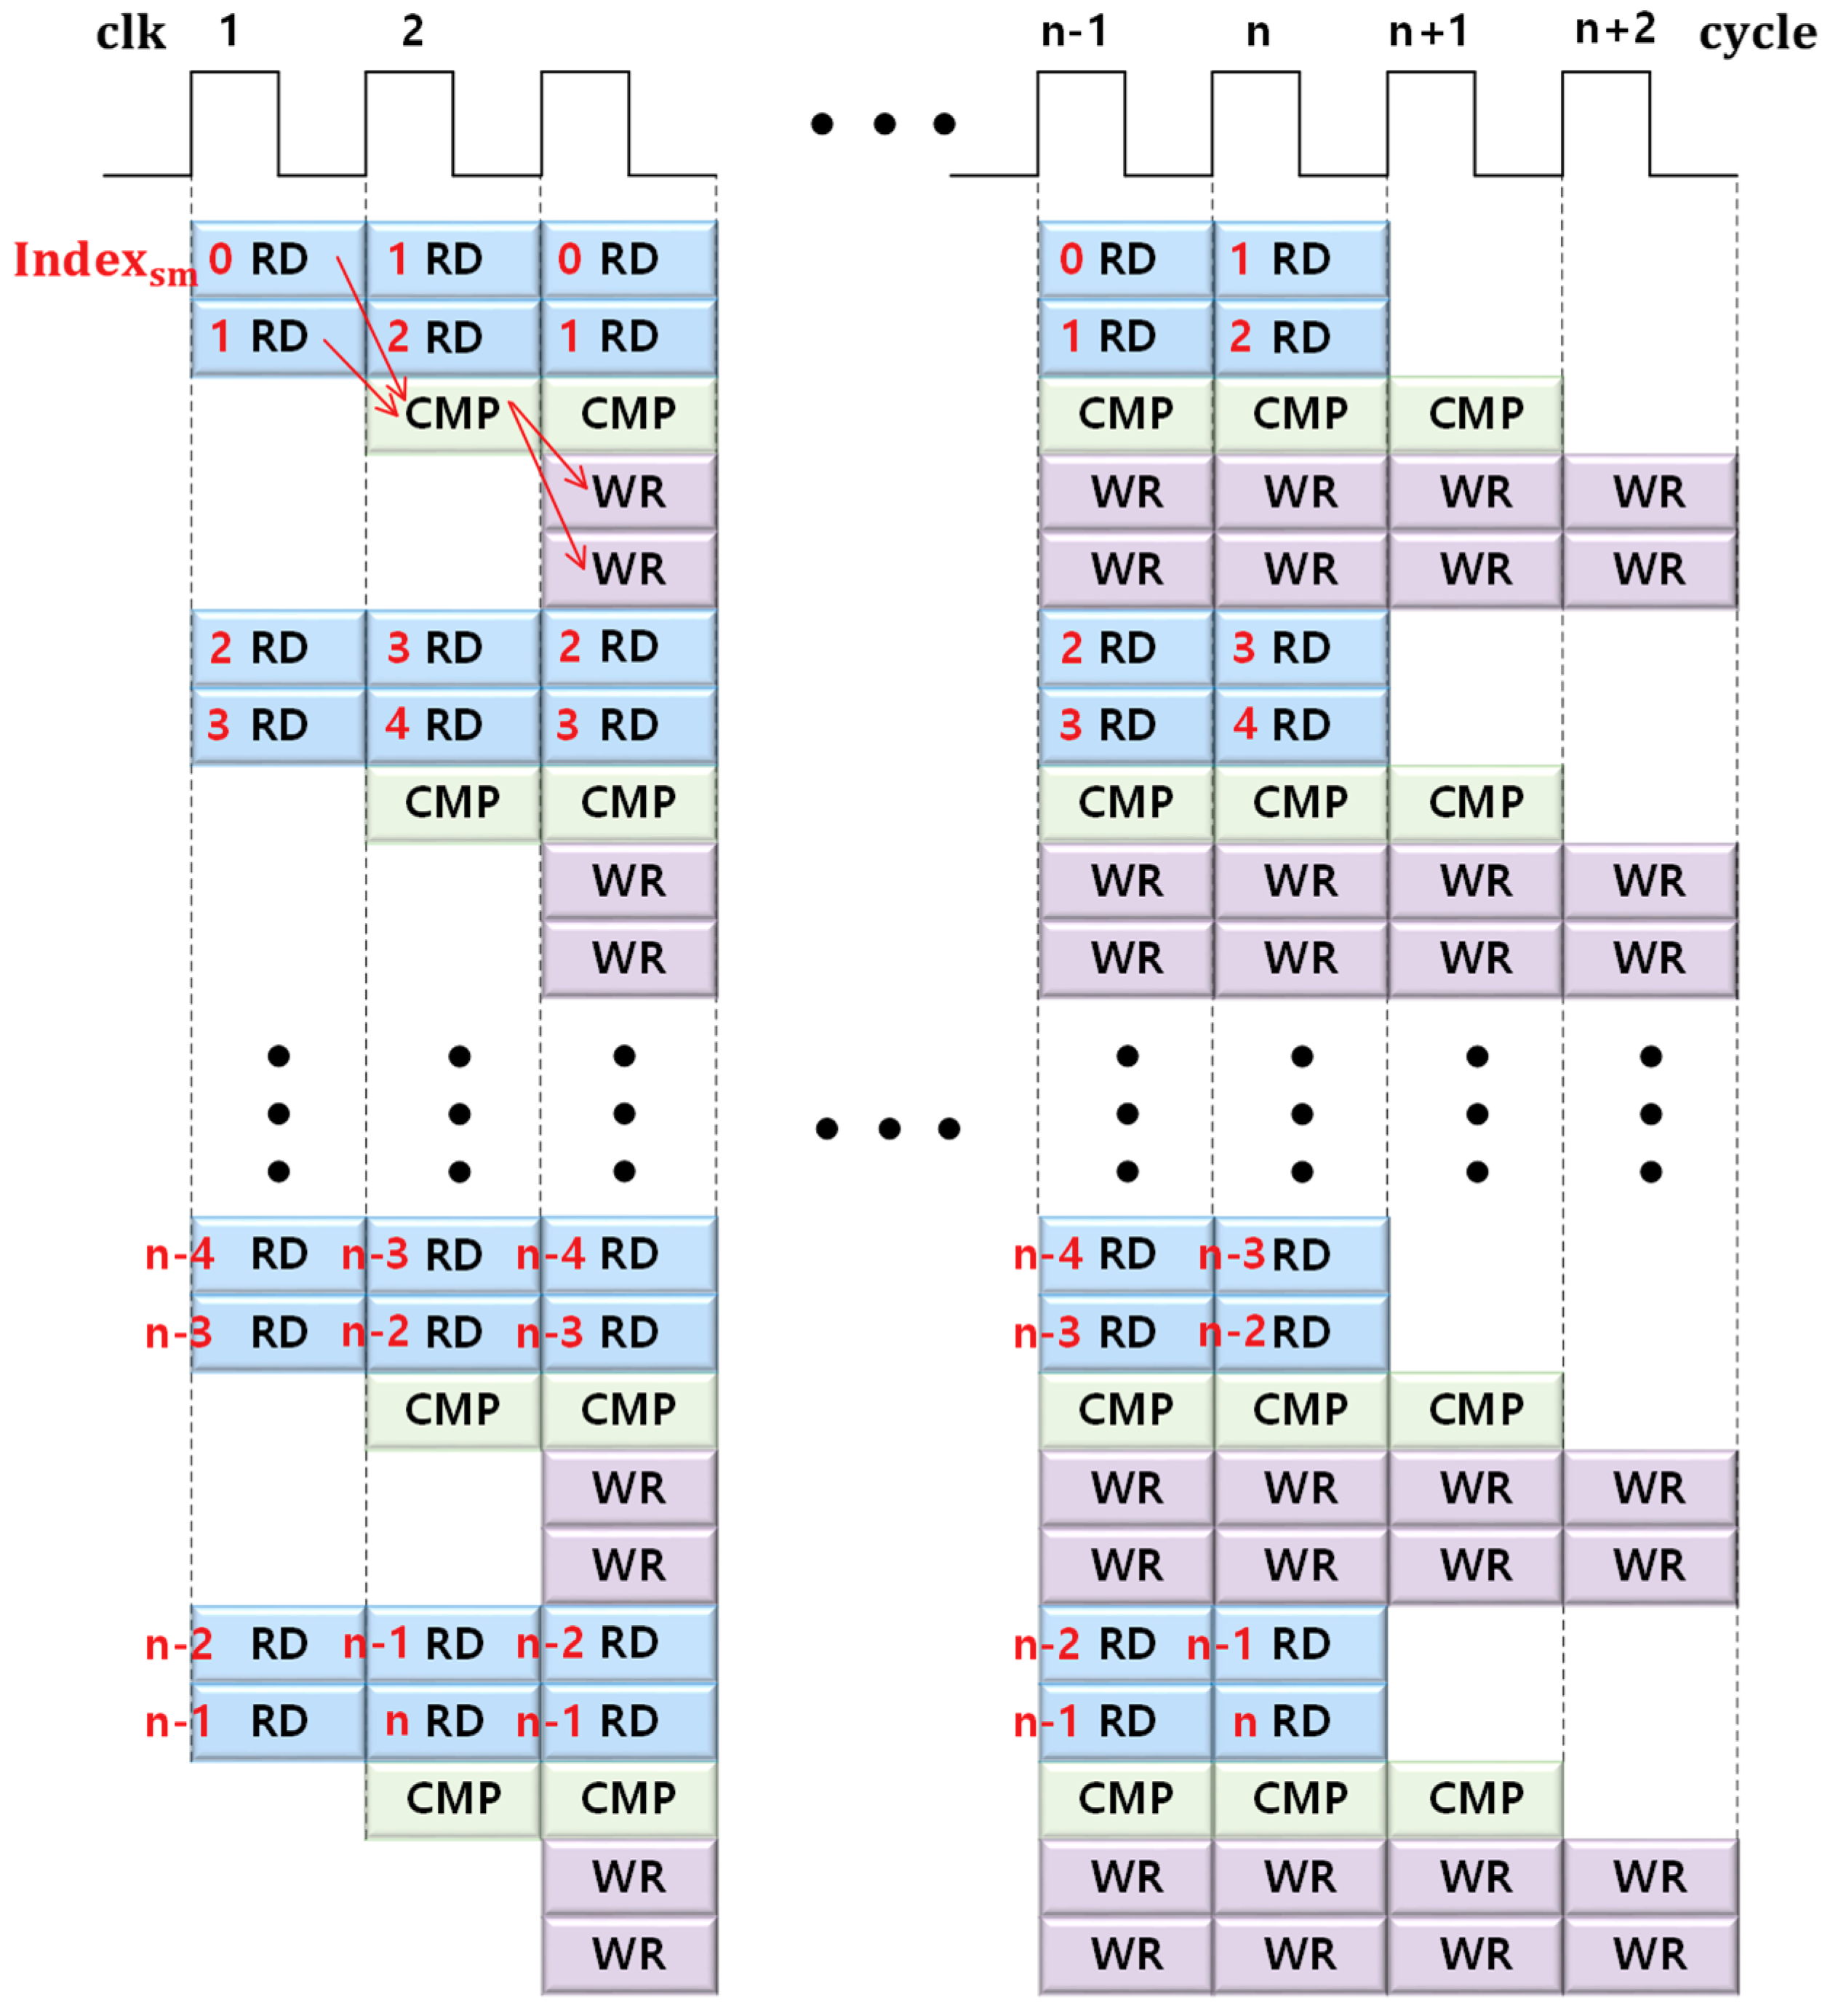
3.3. Parallel Sorting
4. Capacitor Voltage Balancing
4.1. Capacitor Voltage Balancing Methods for MMCs
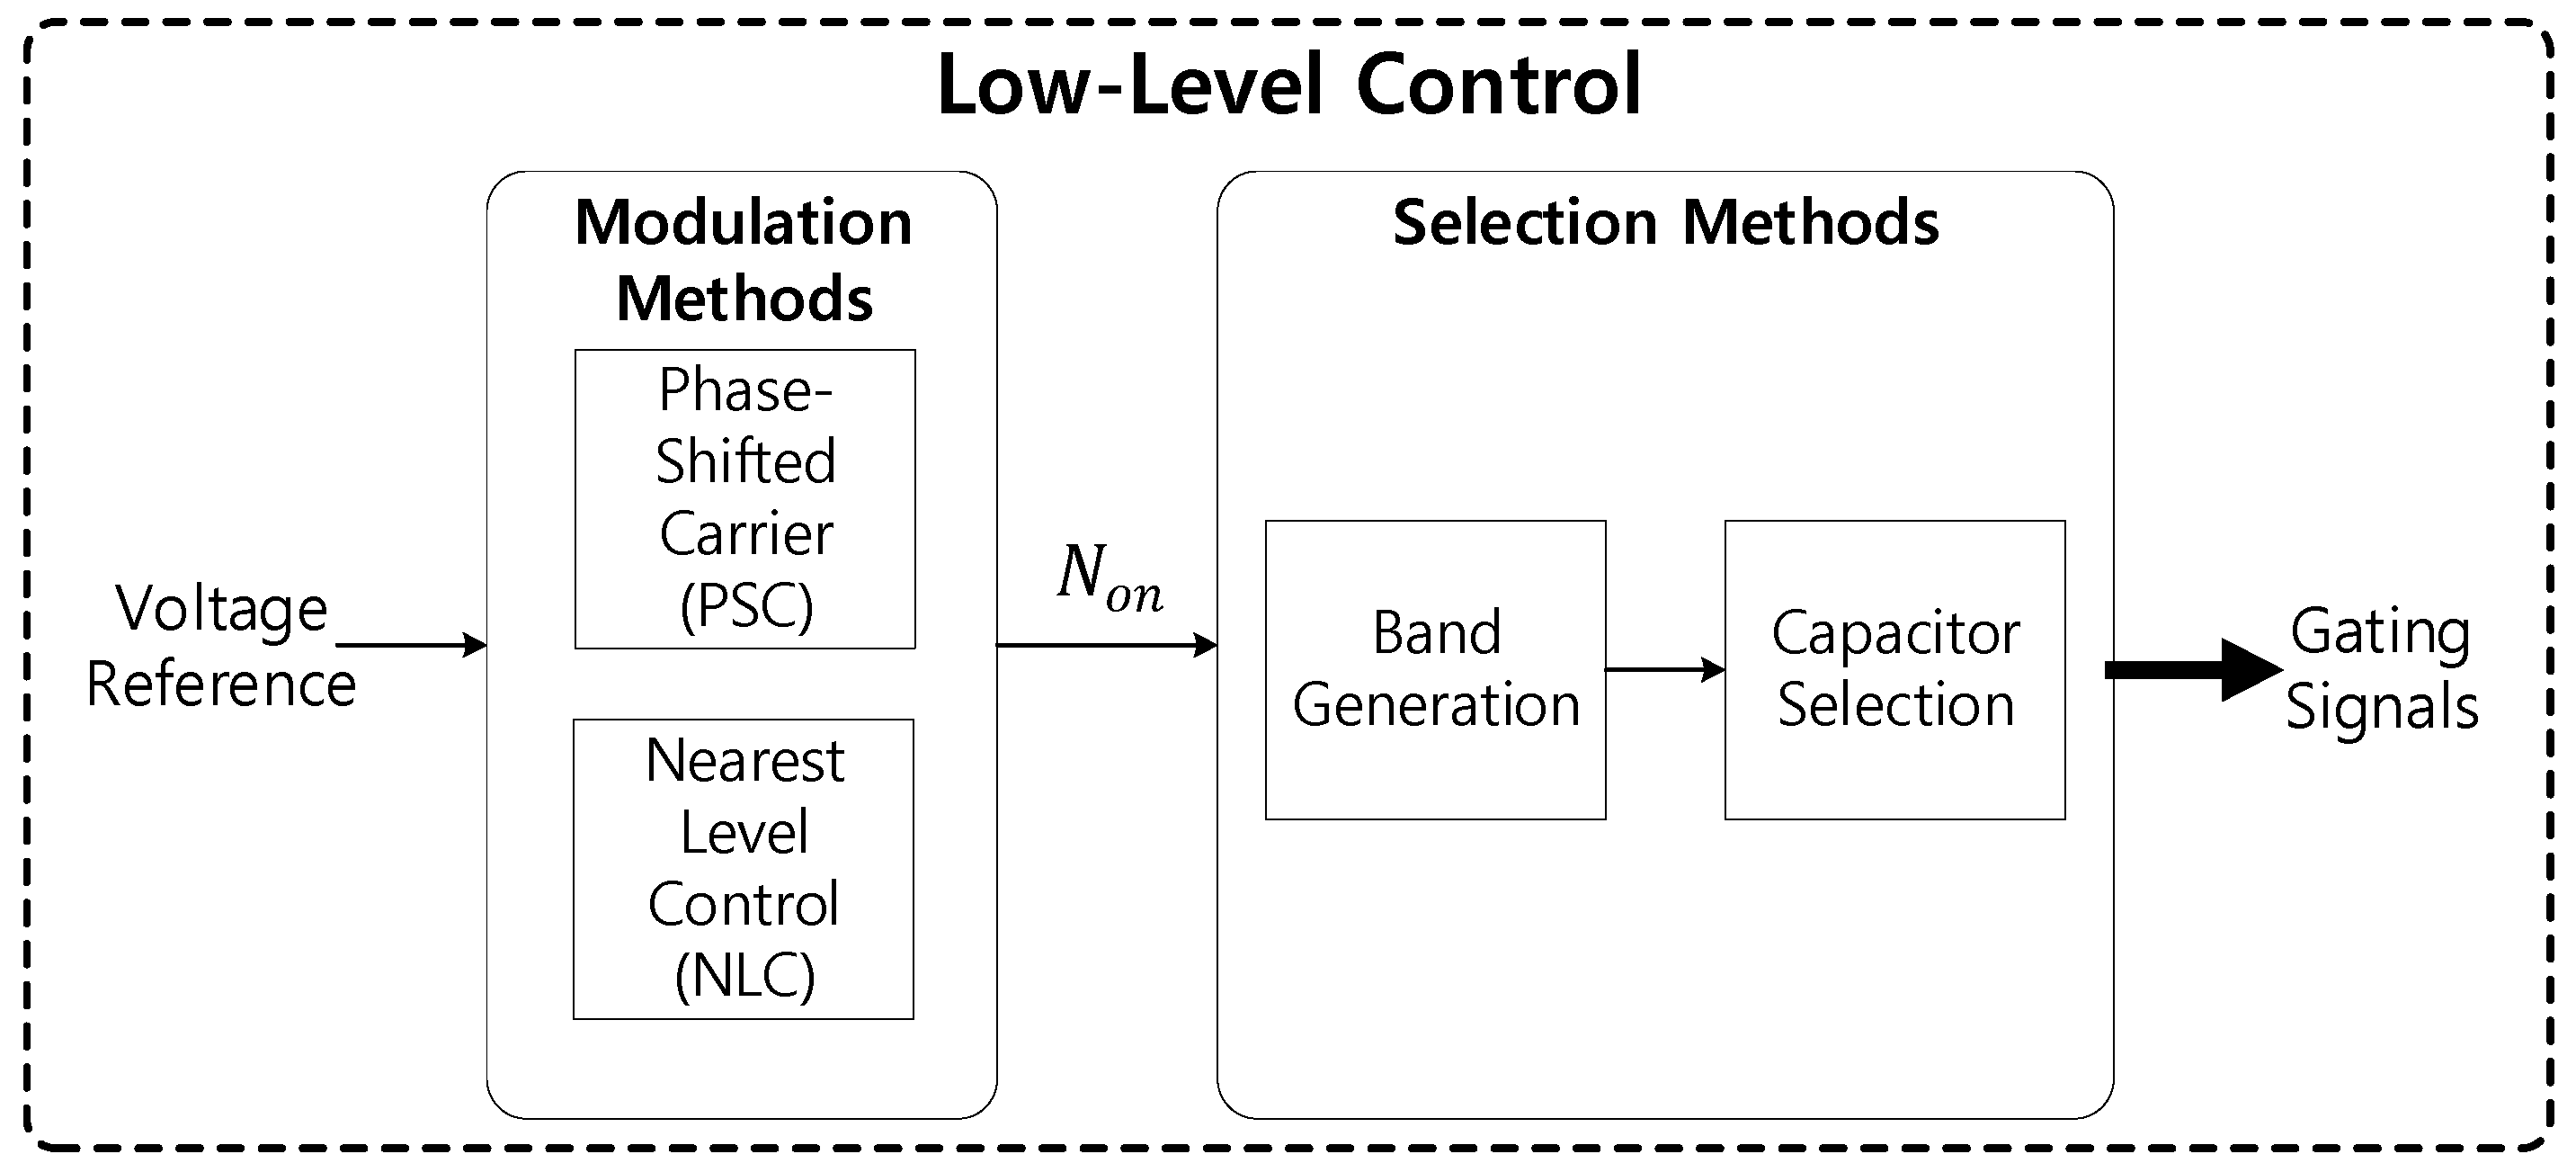
4.2. Band Generation
4.3. Capacitor Selection
4.4. Proposed Method
5. Results
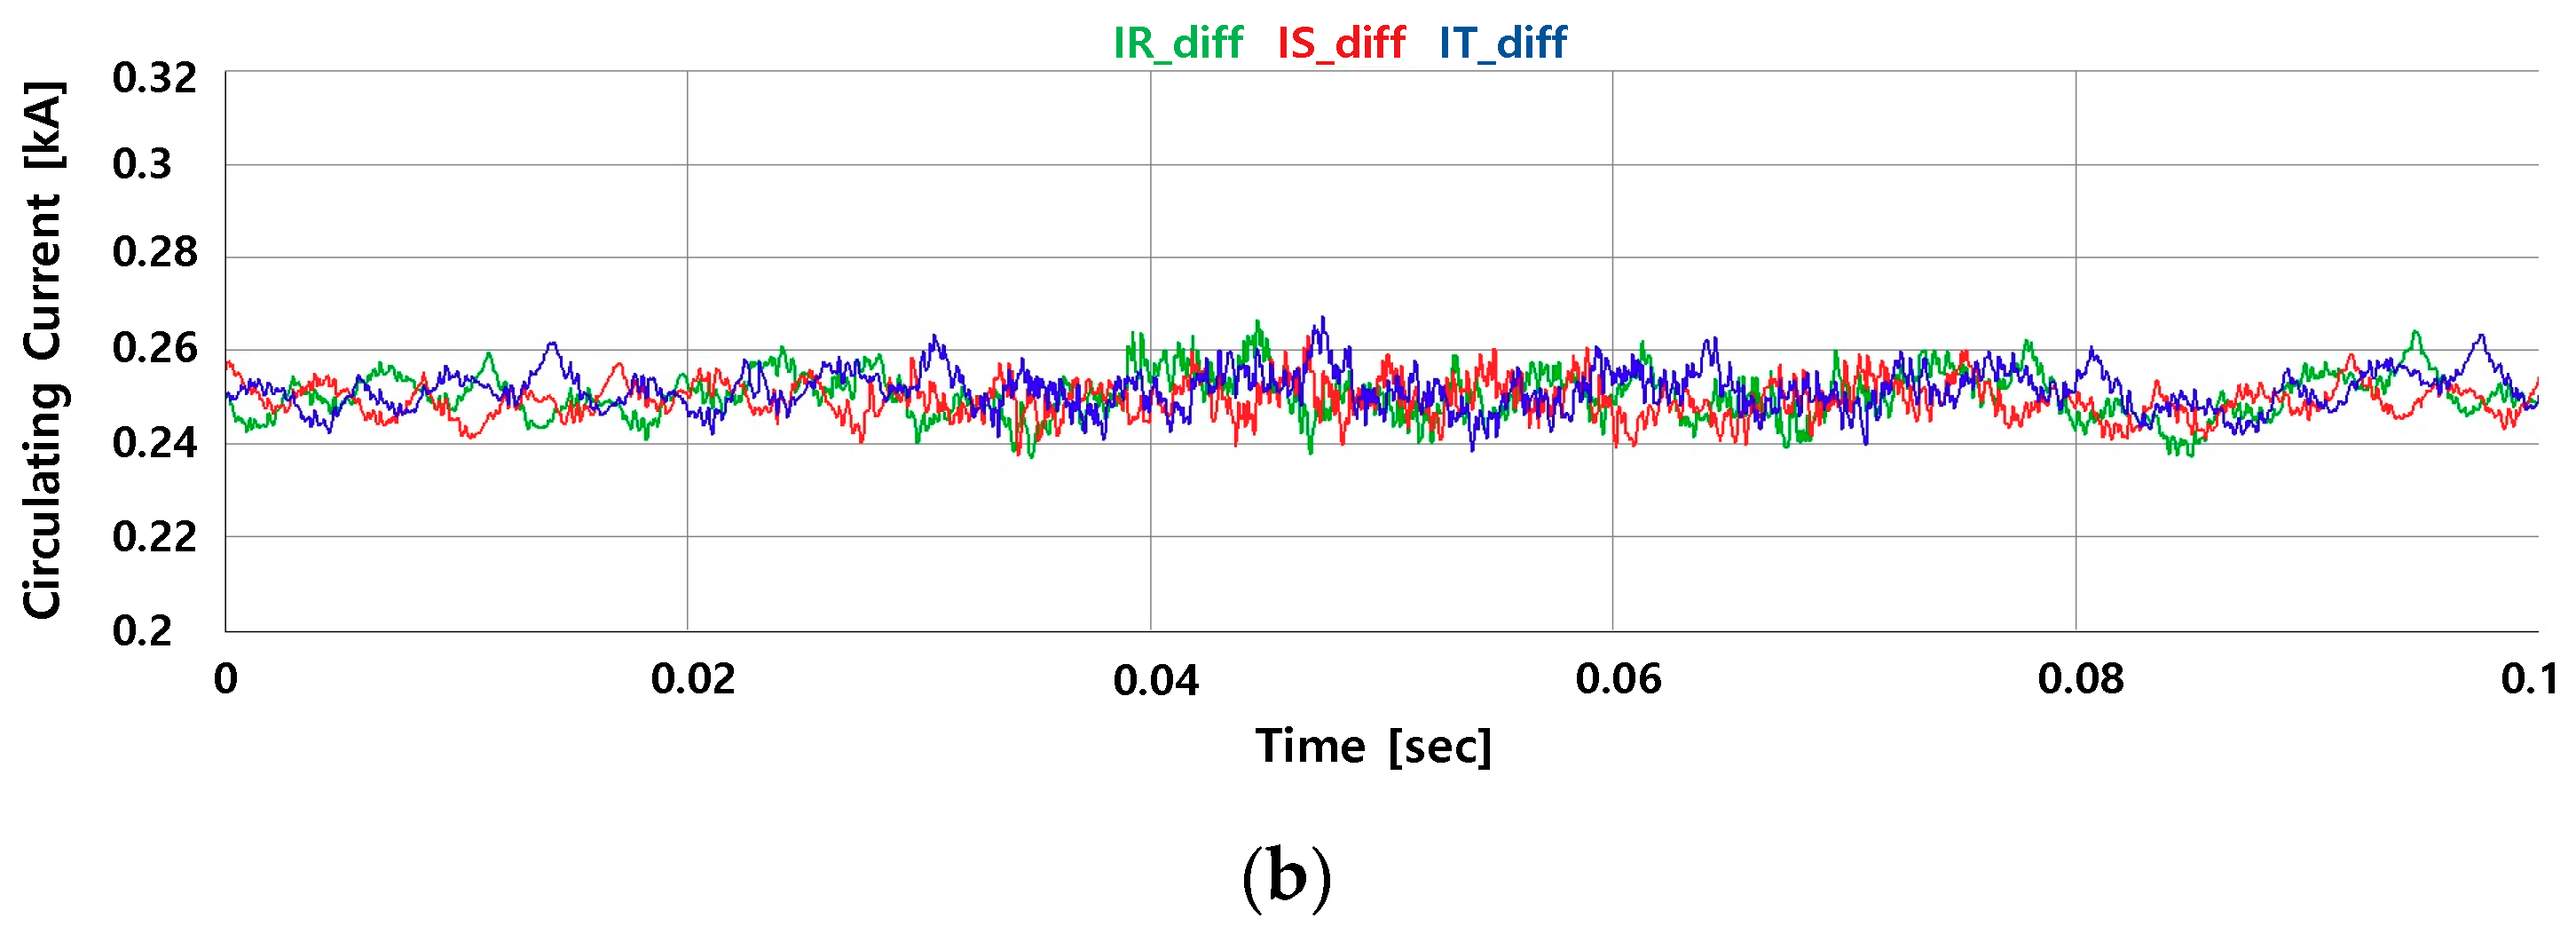
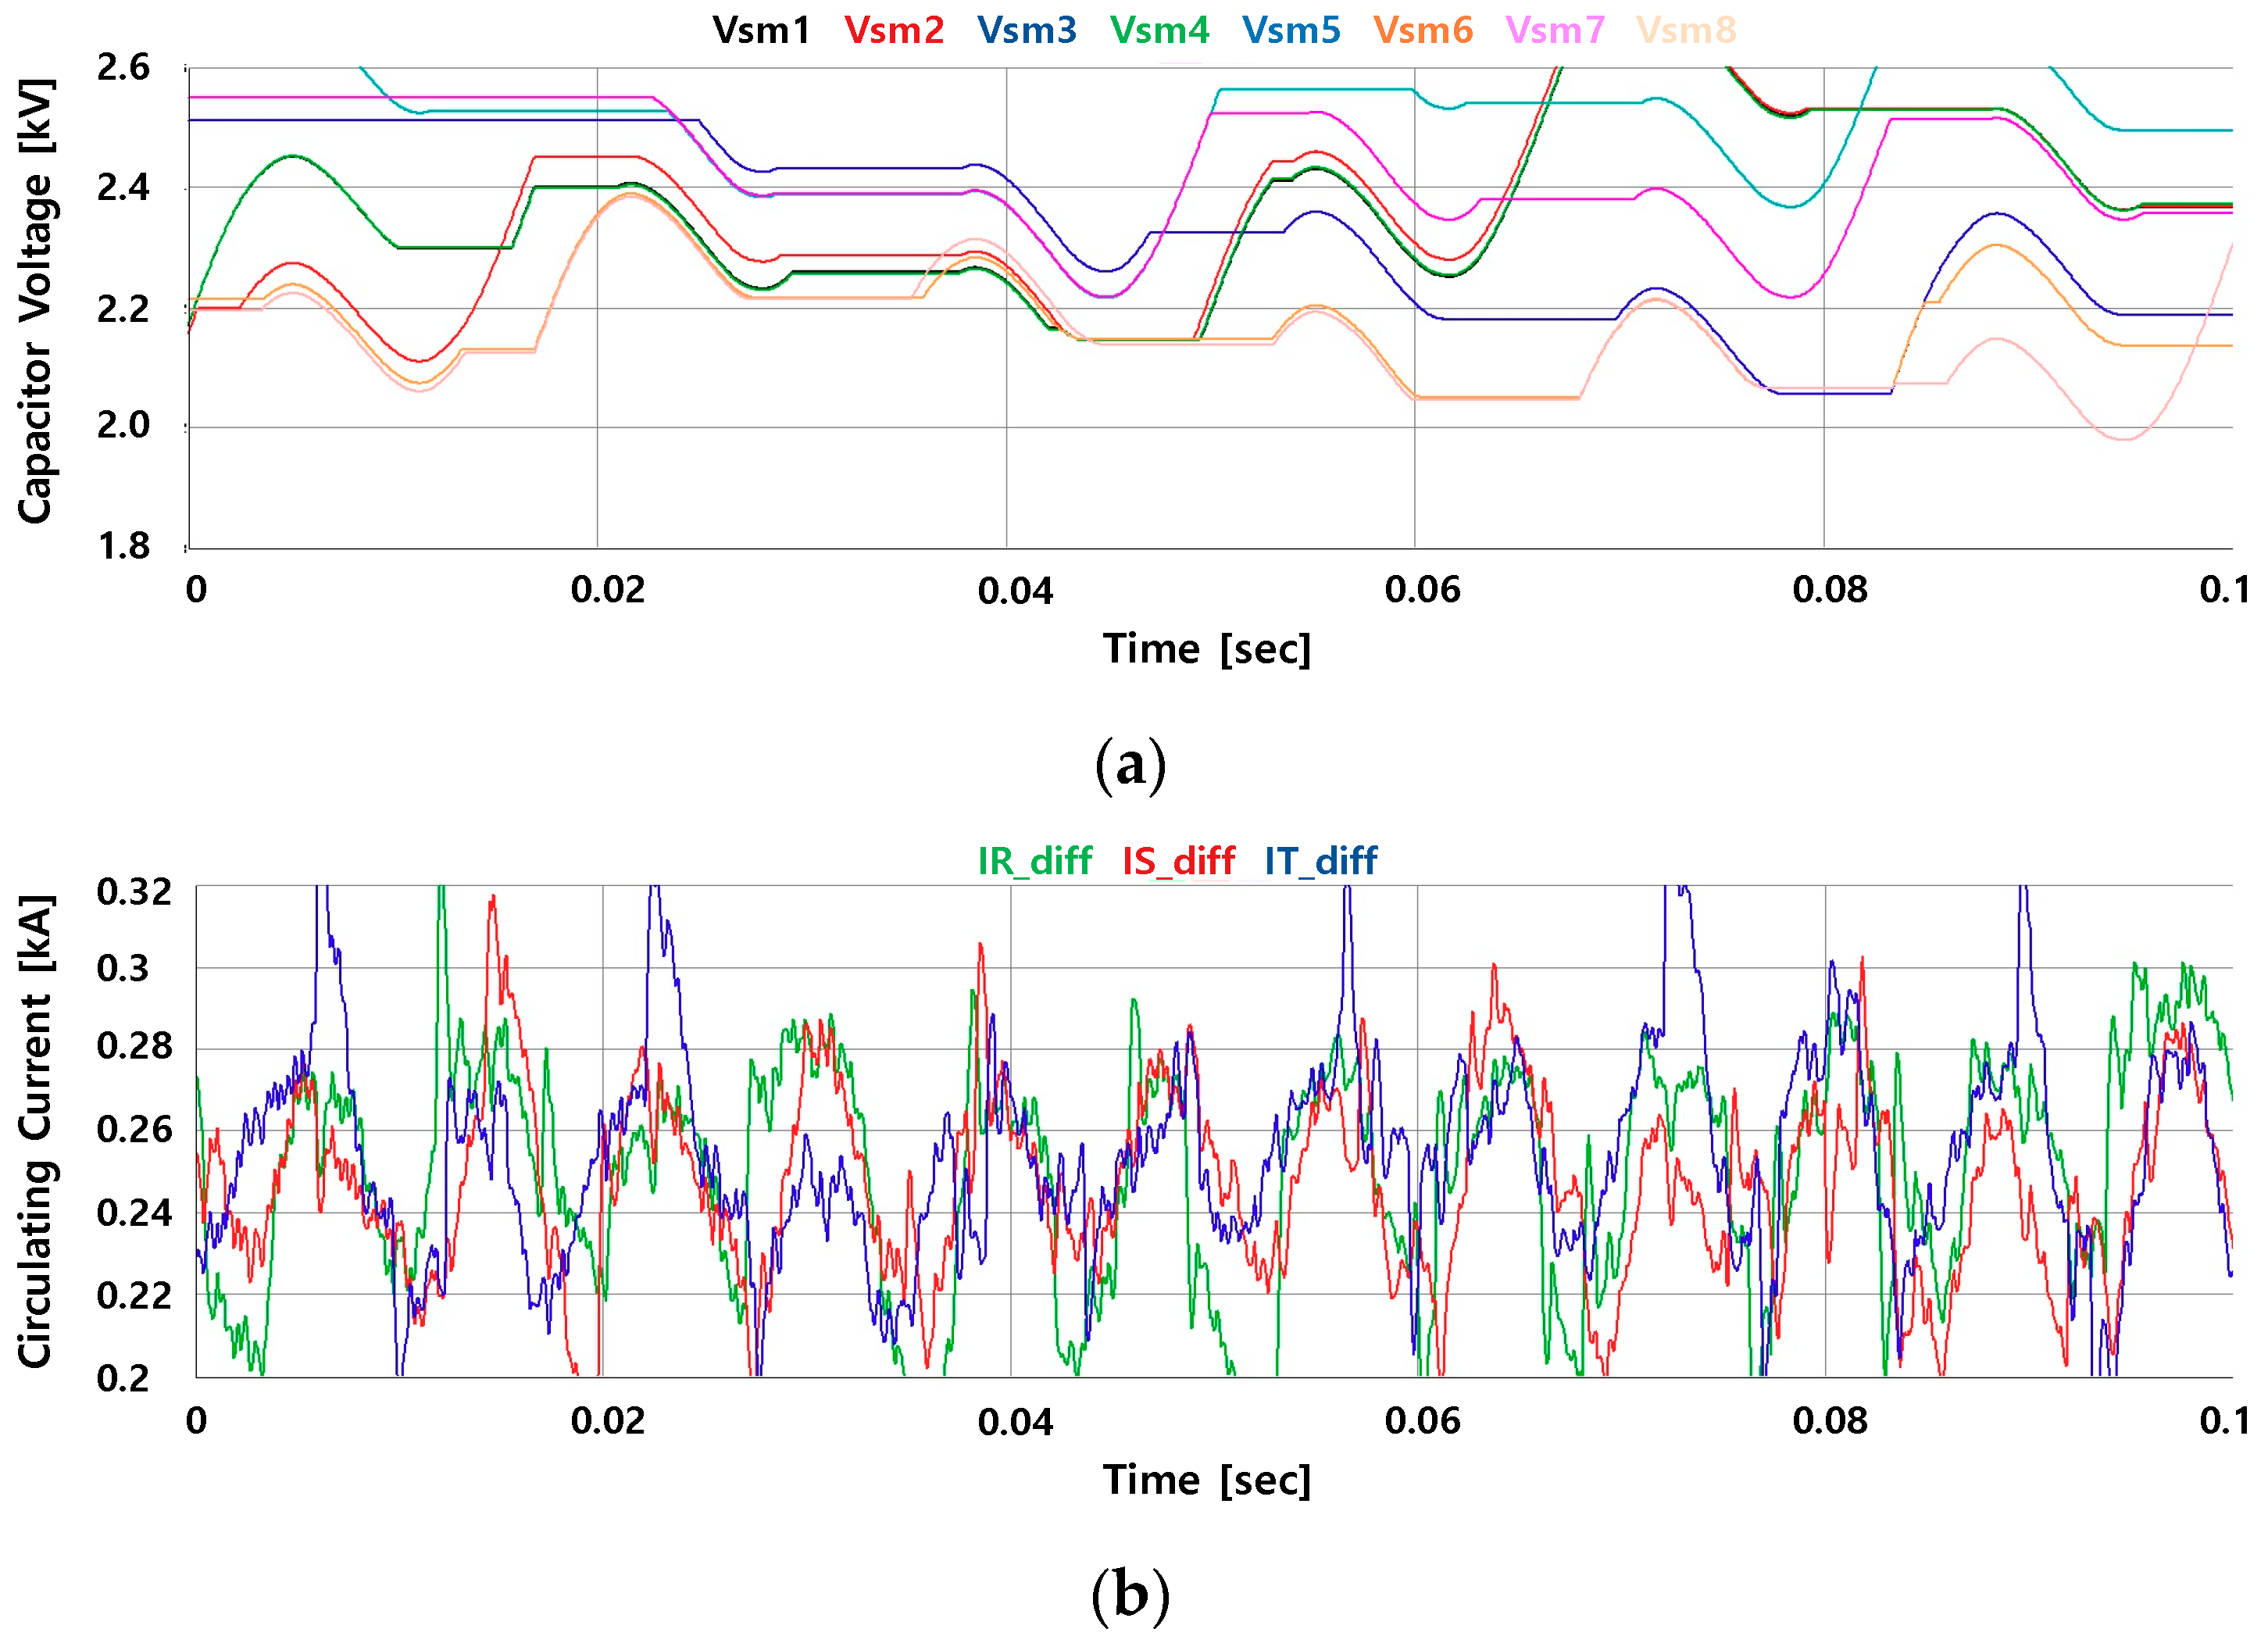
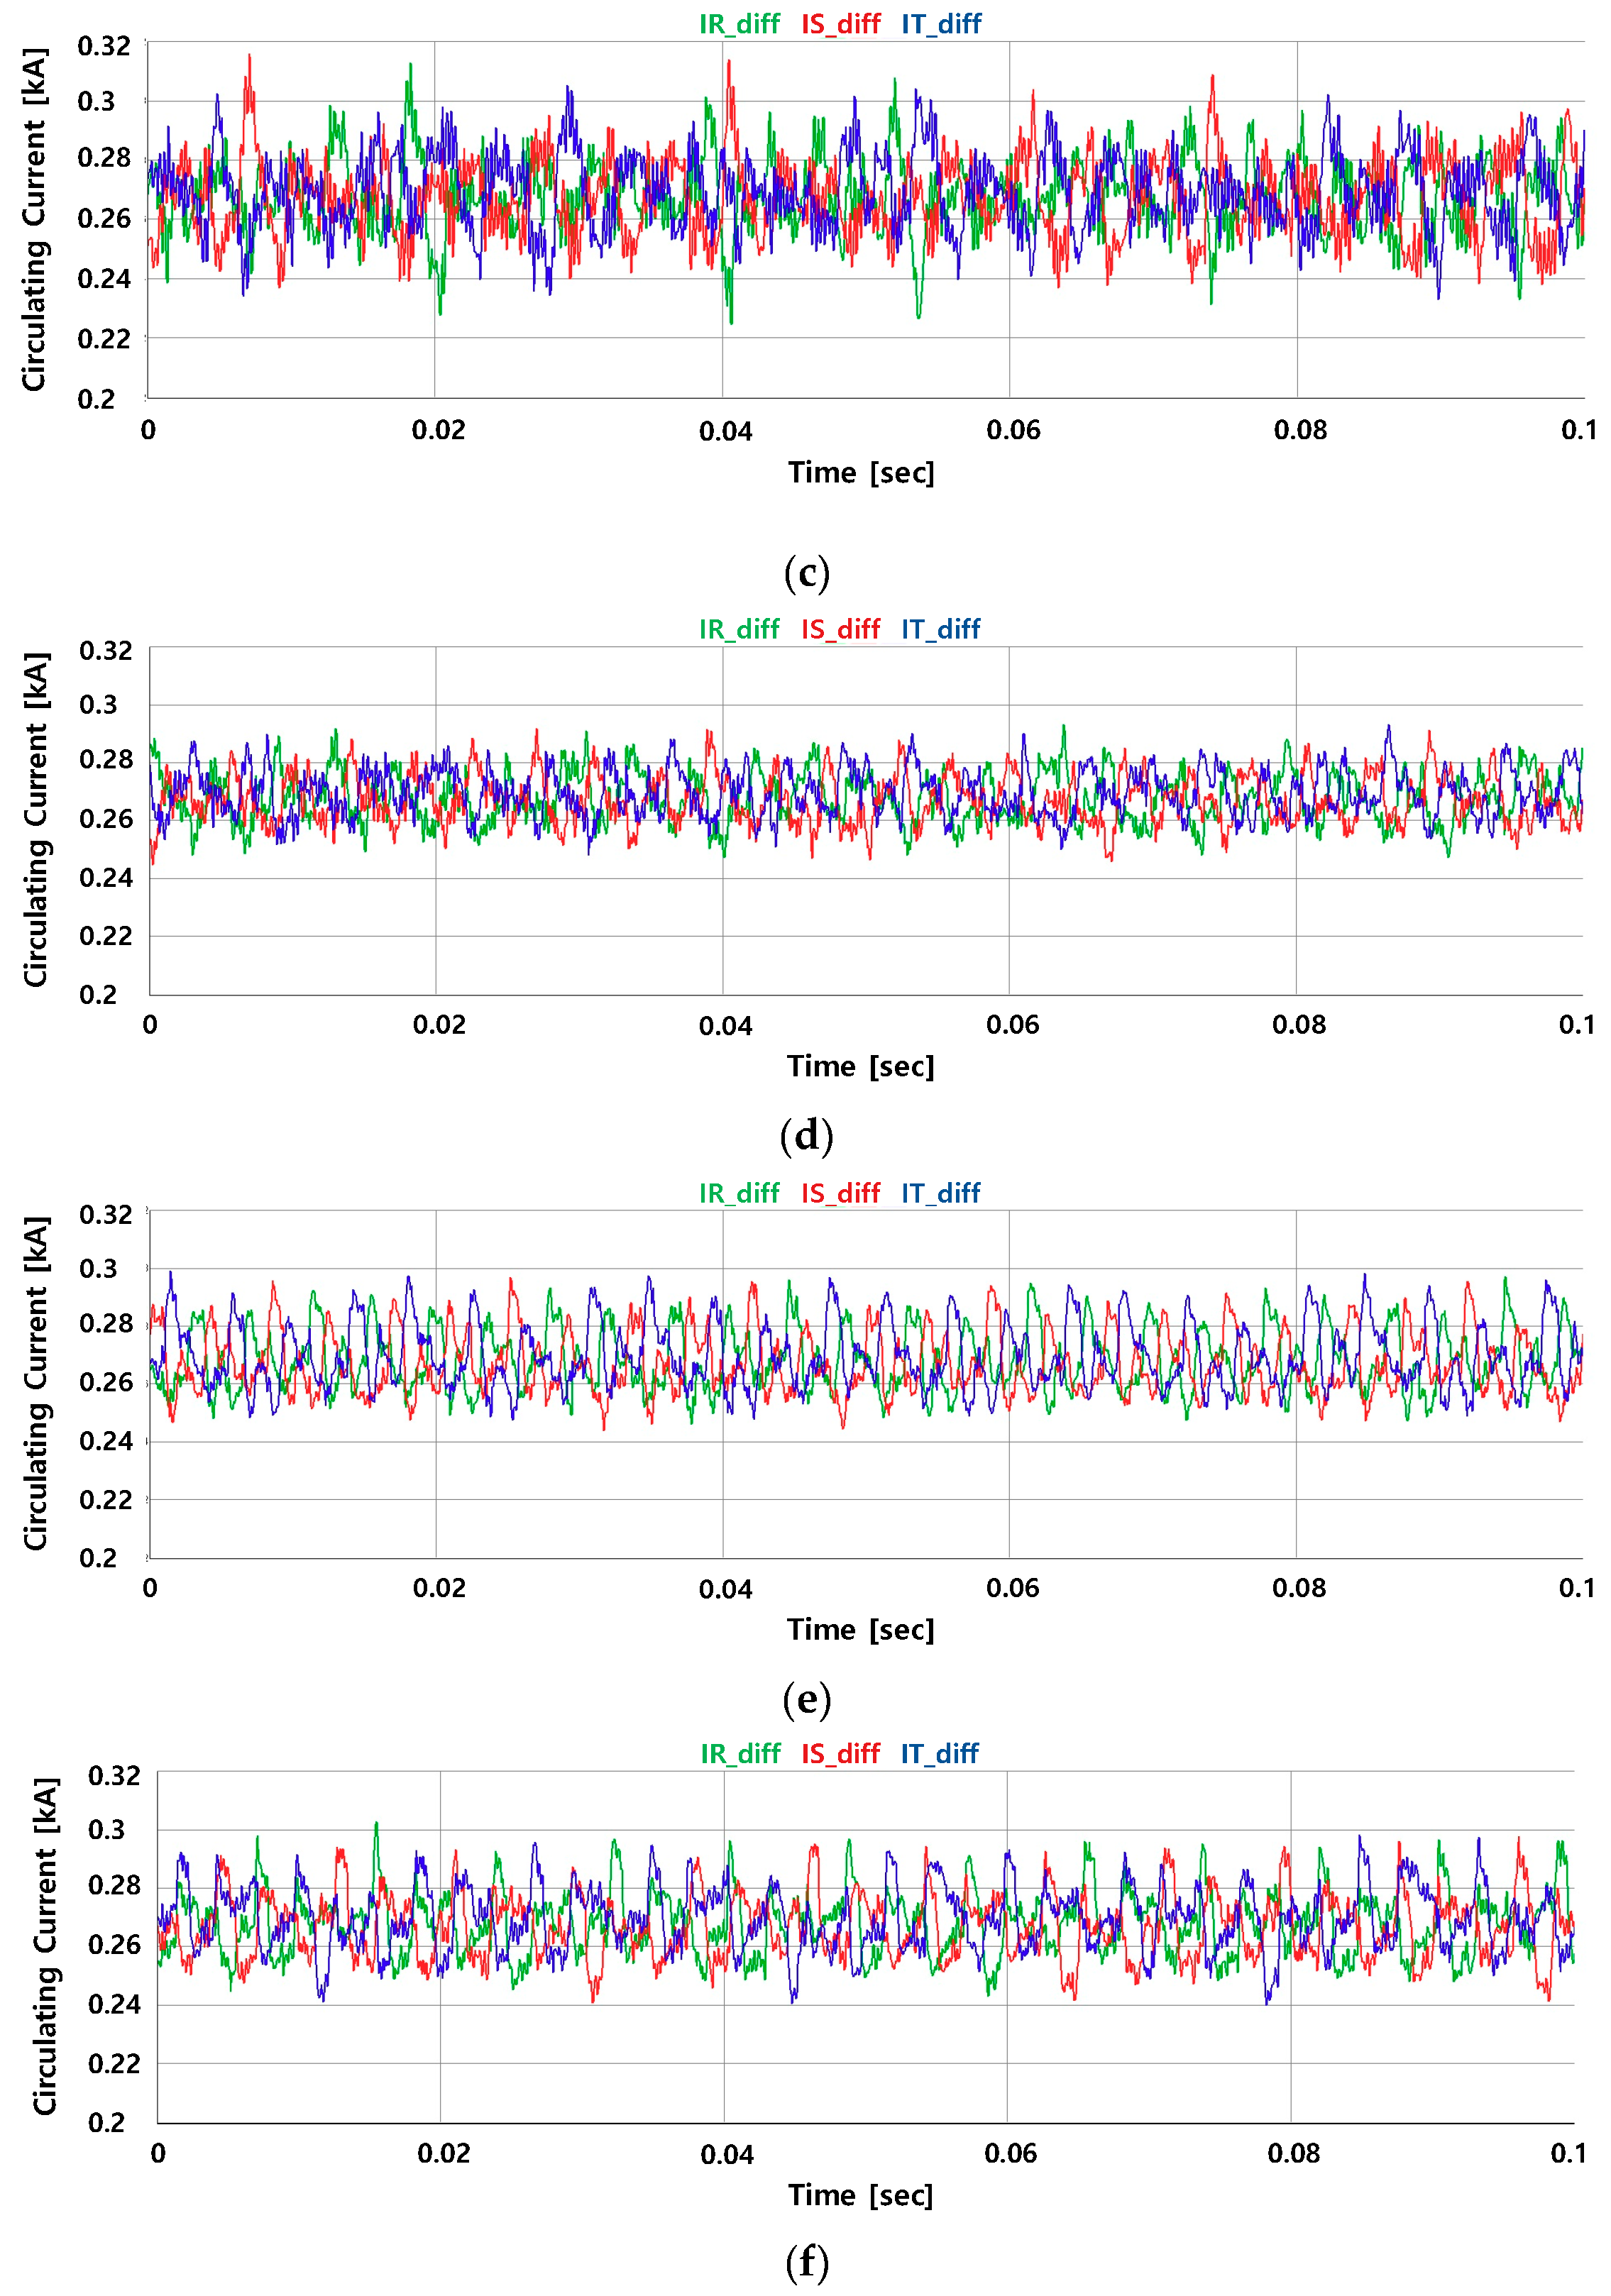
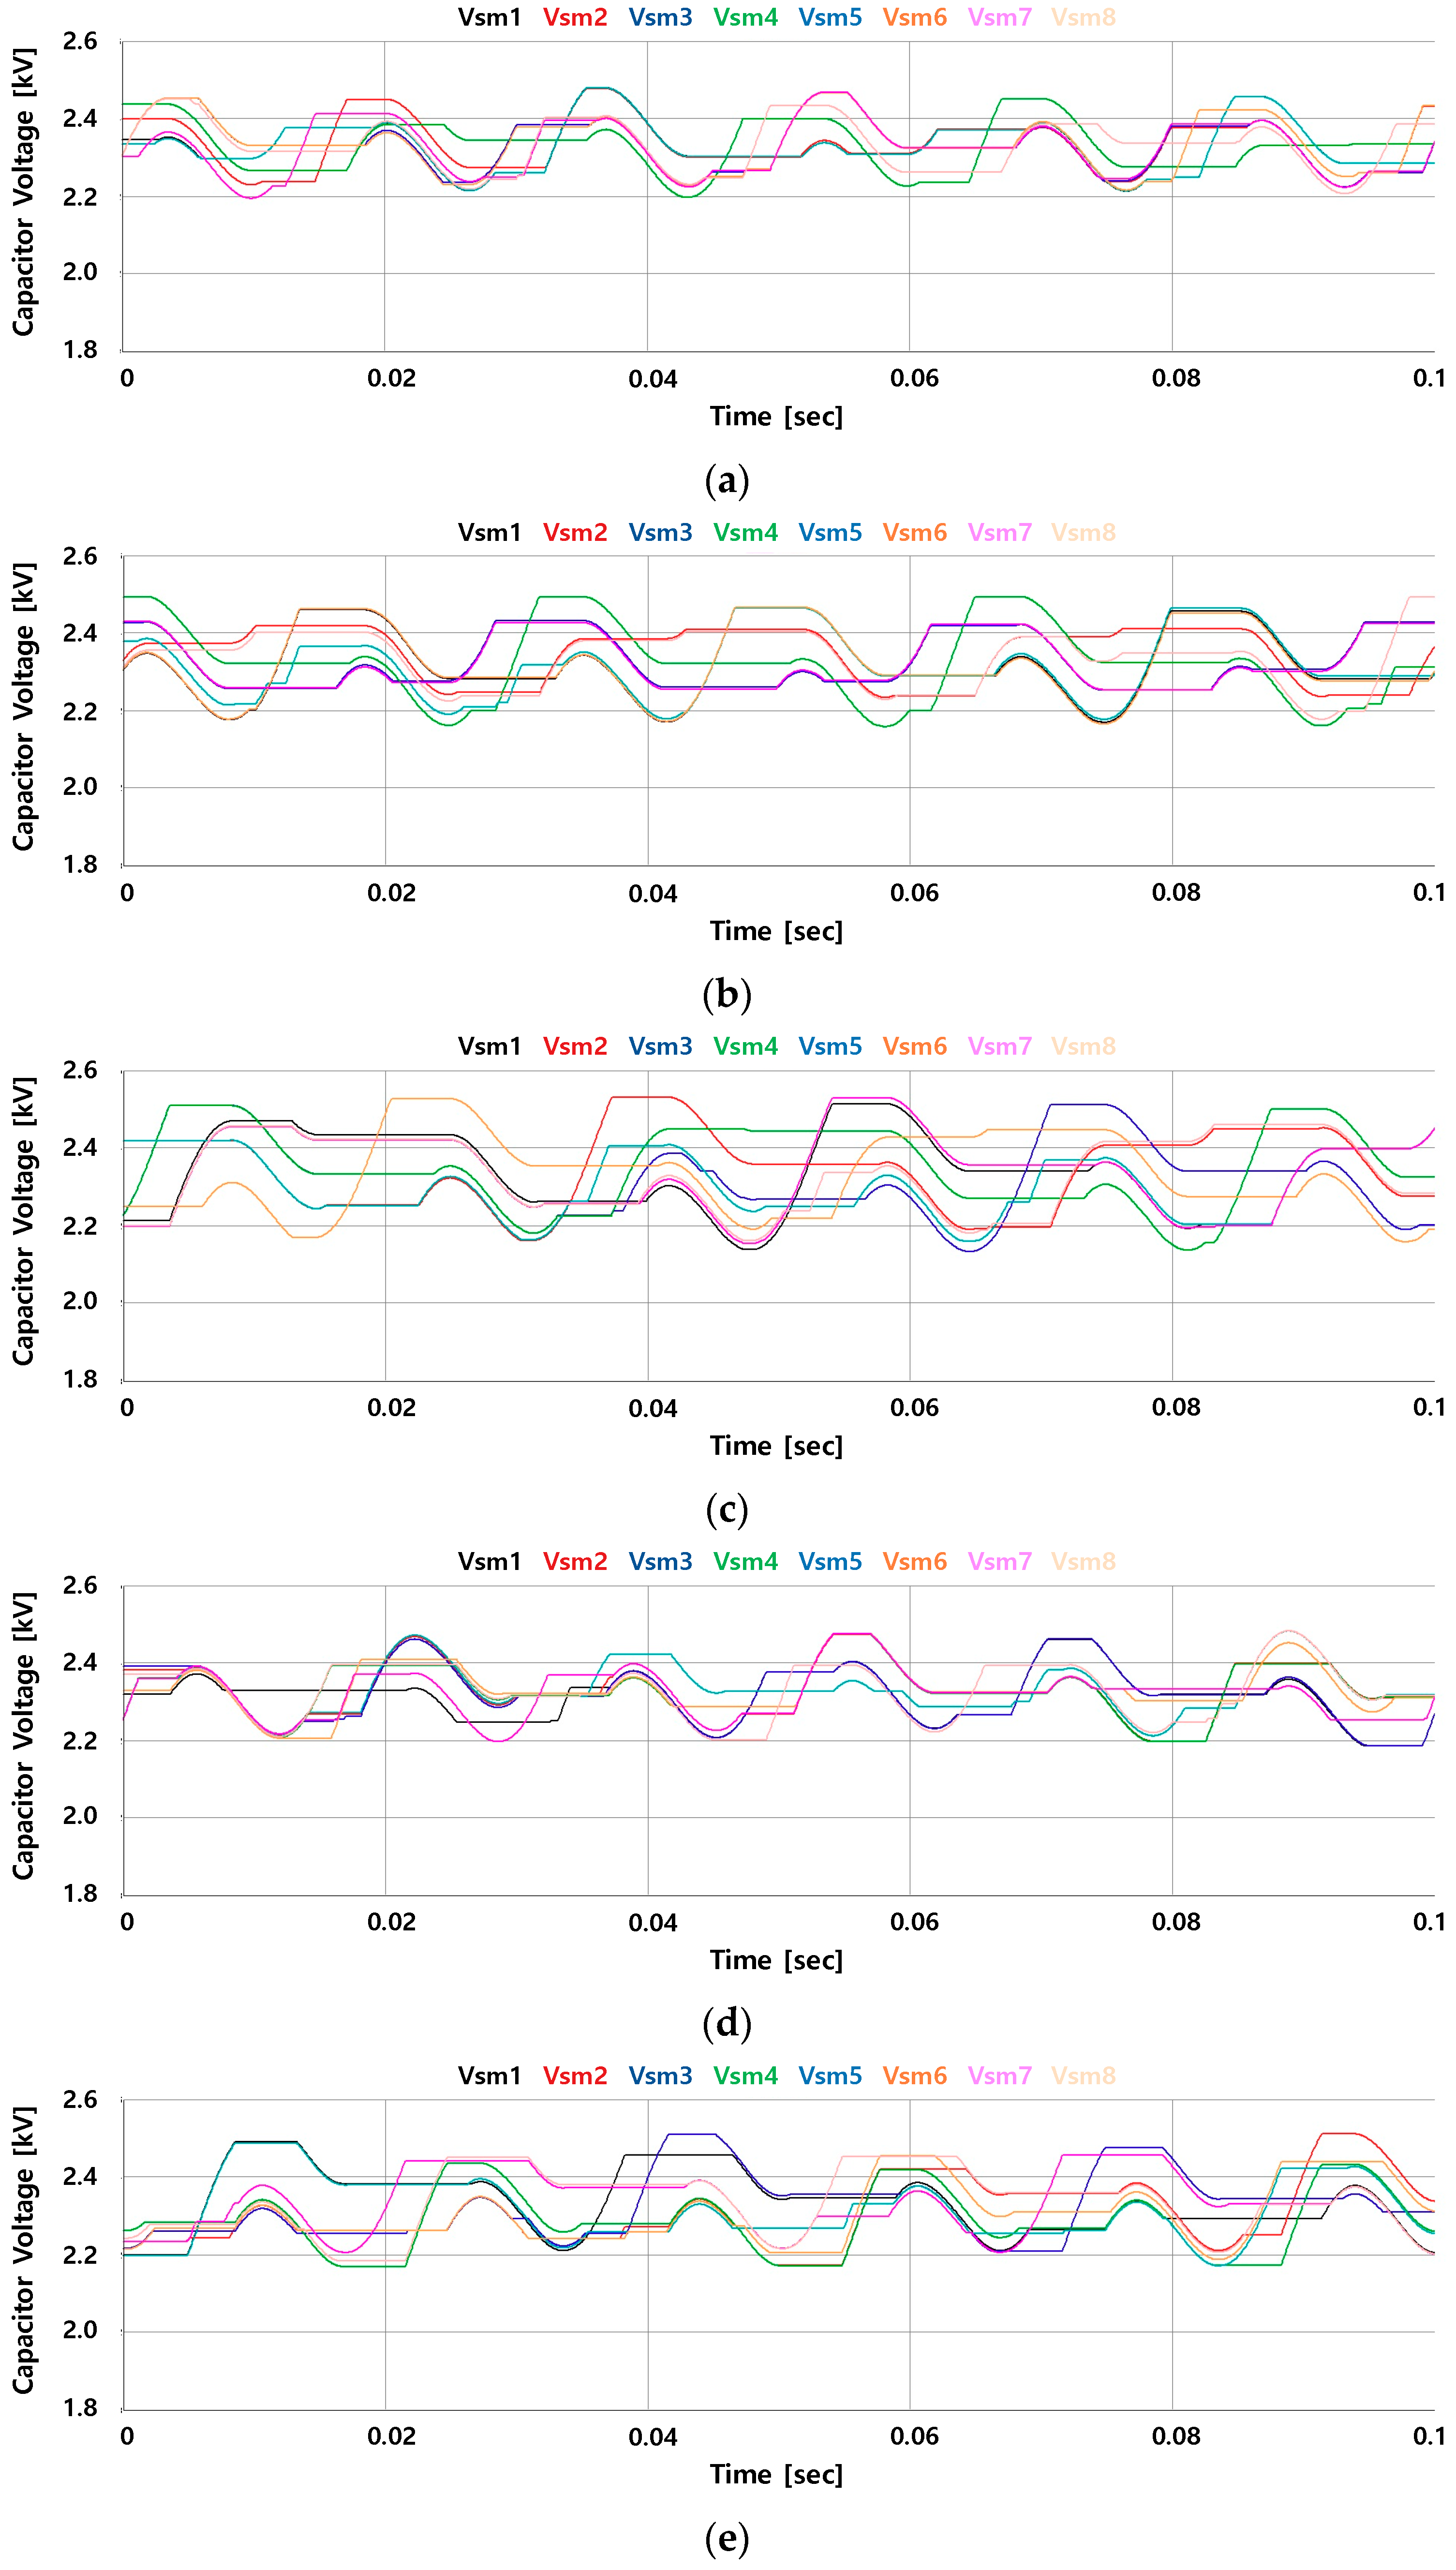
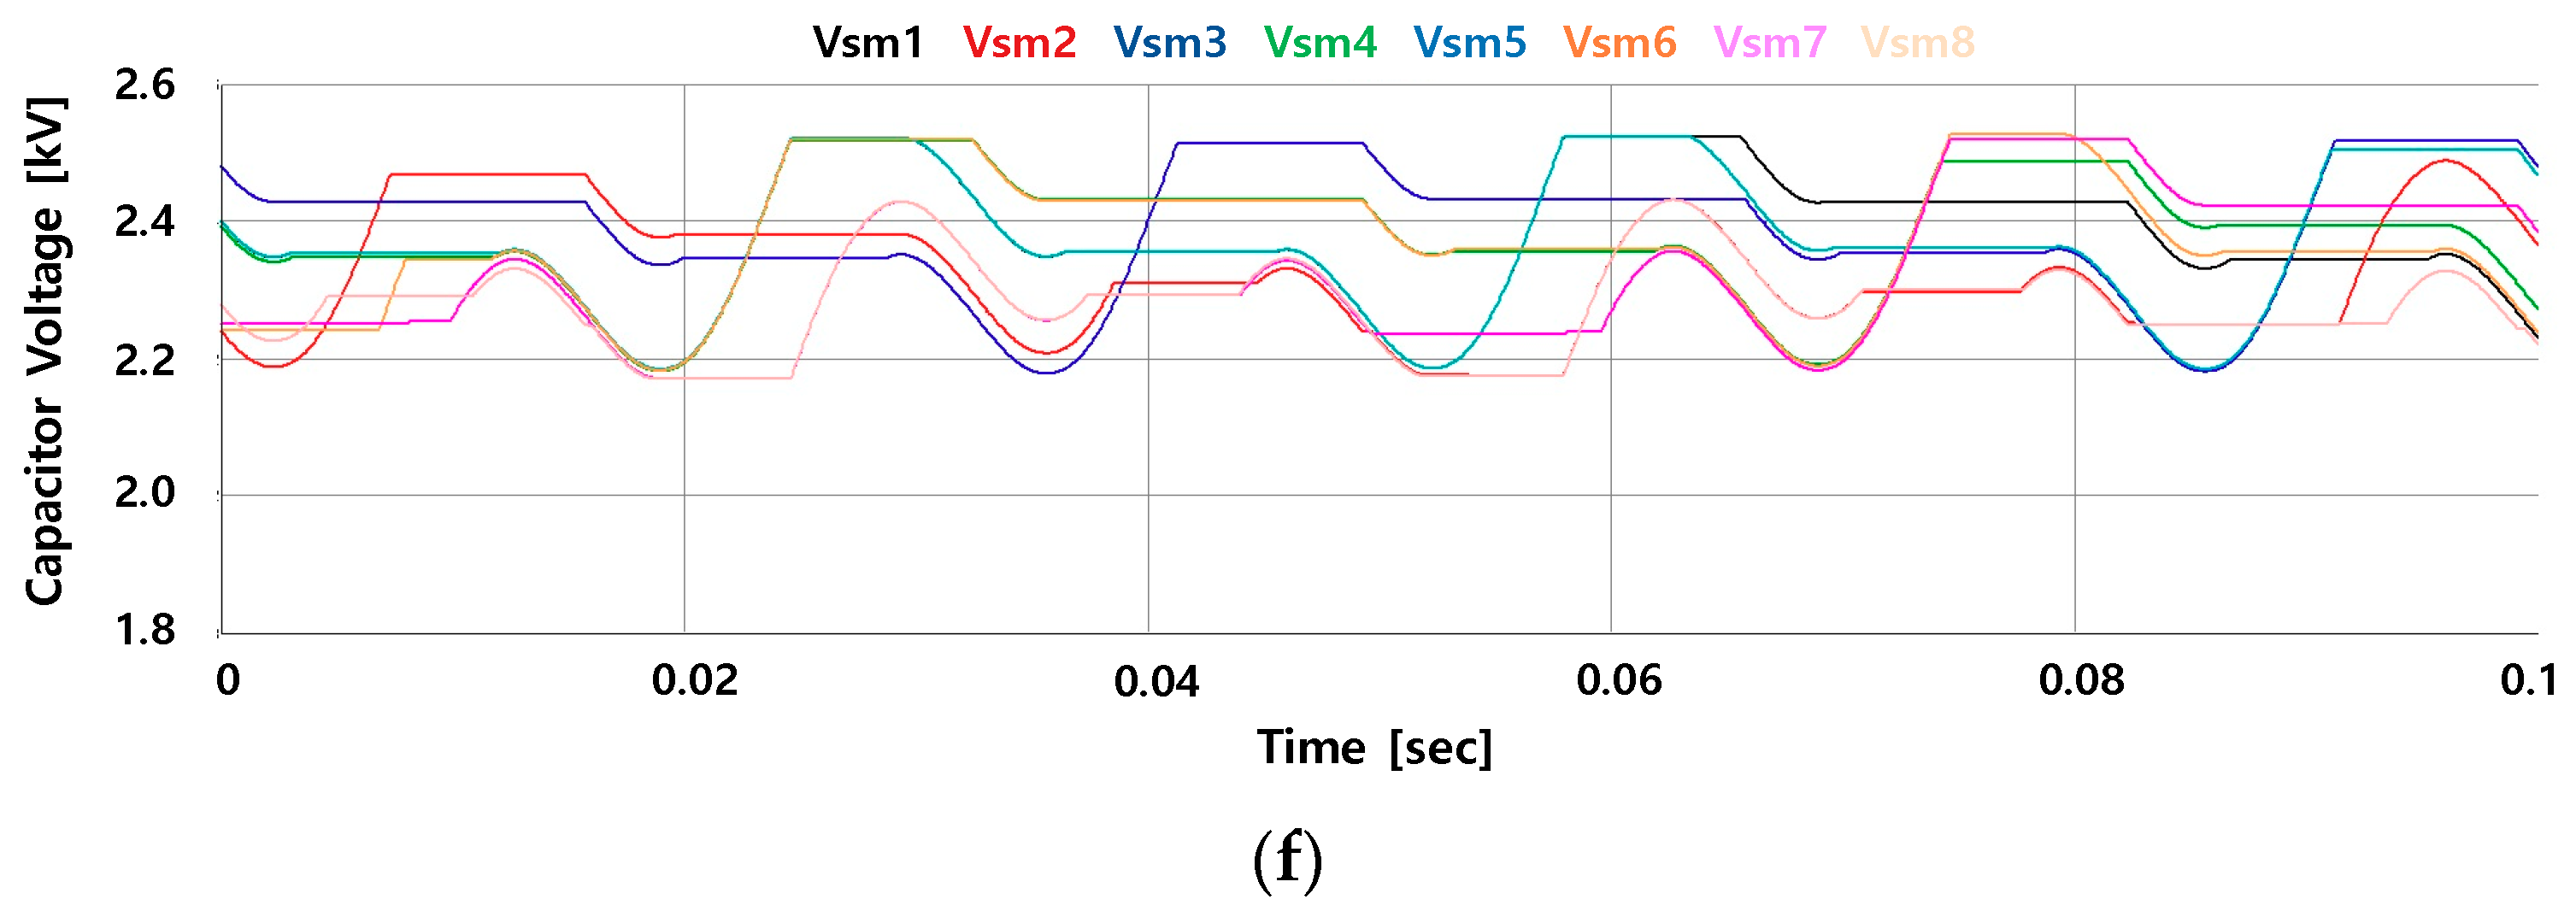
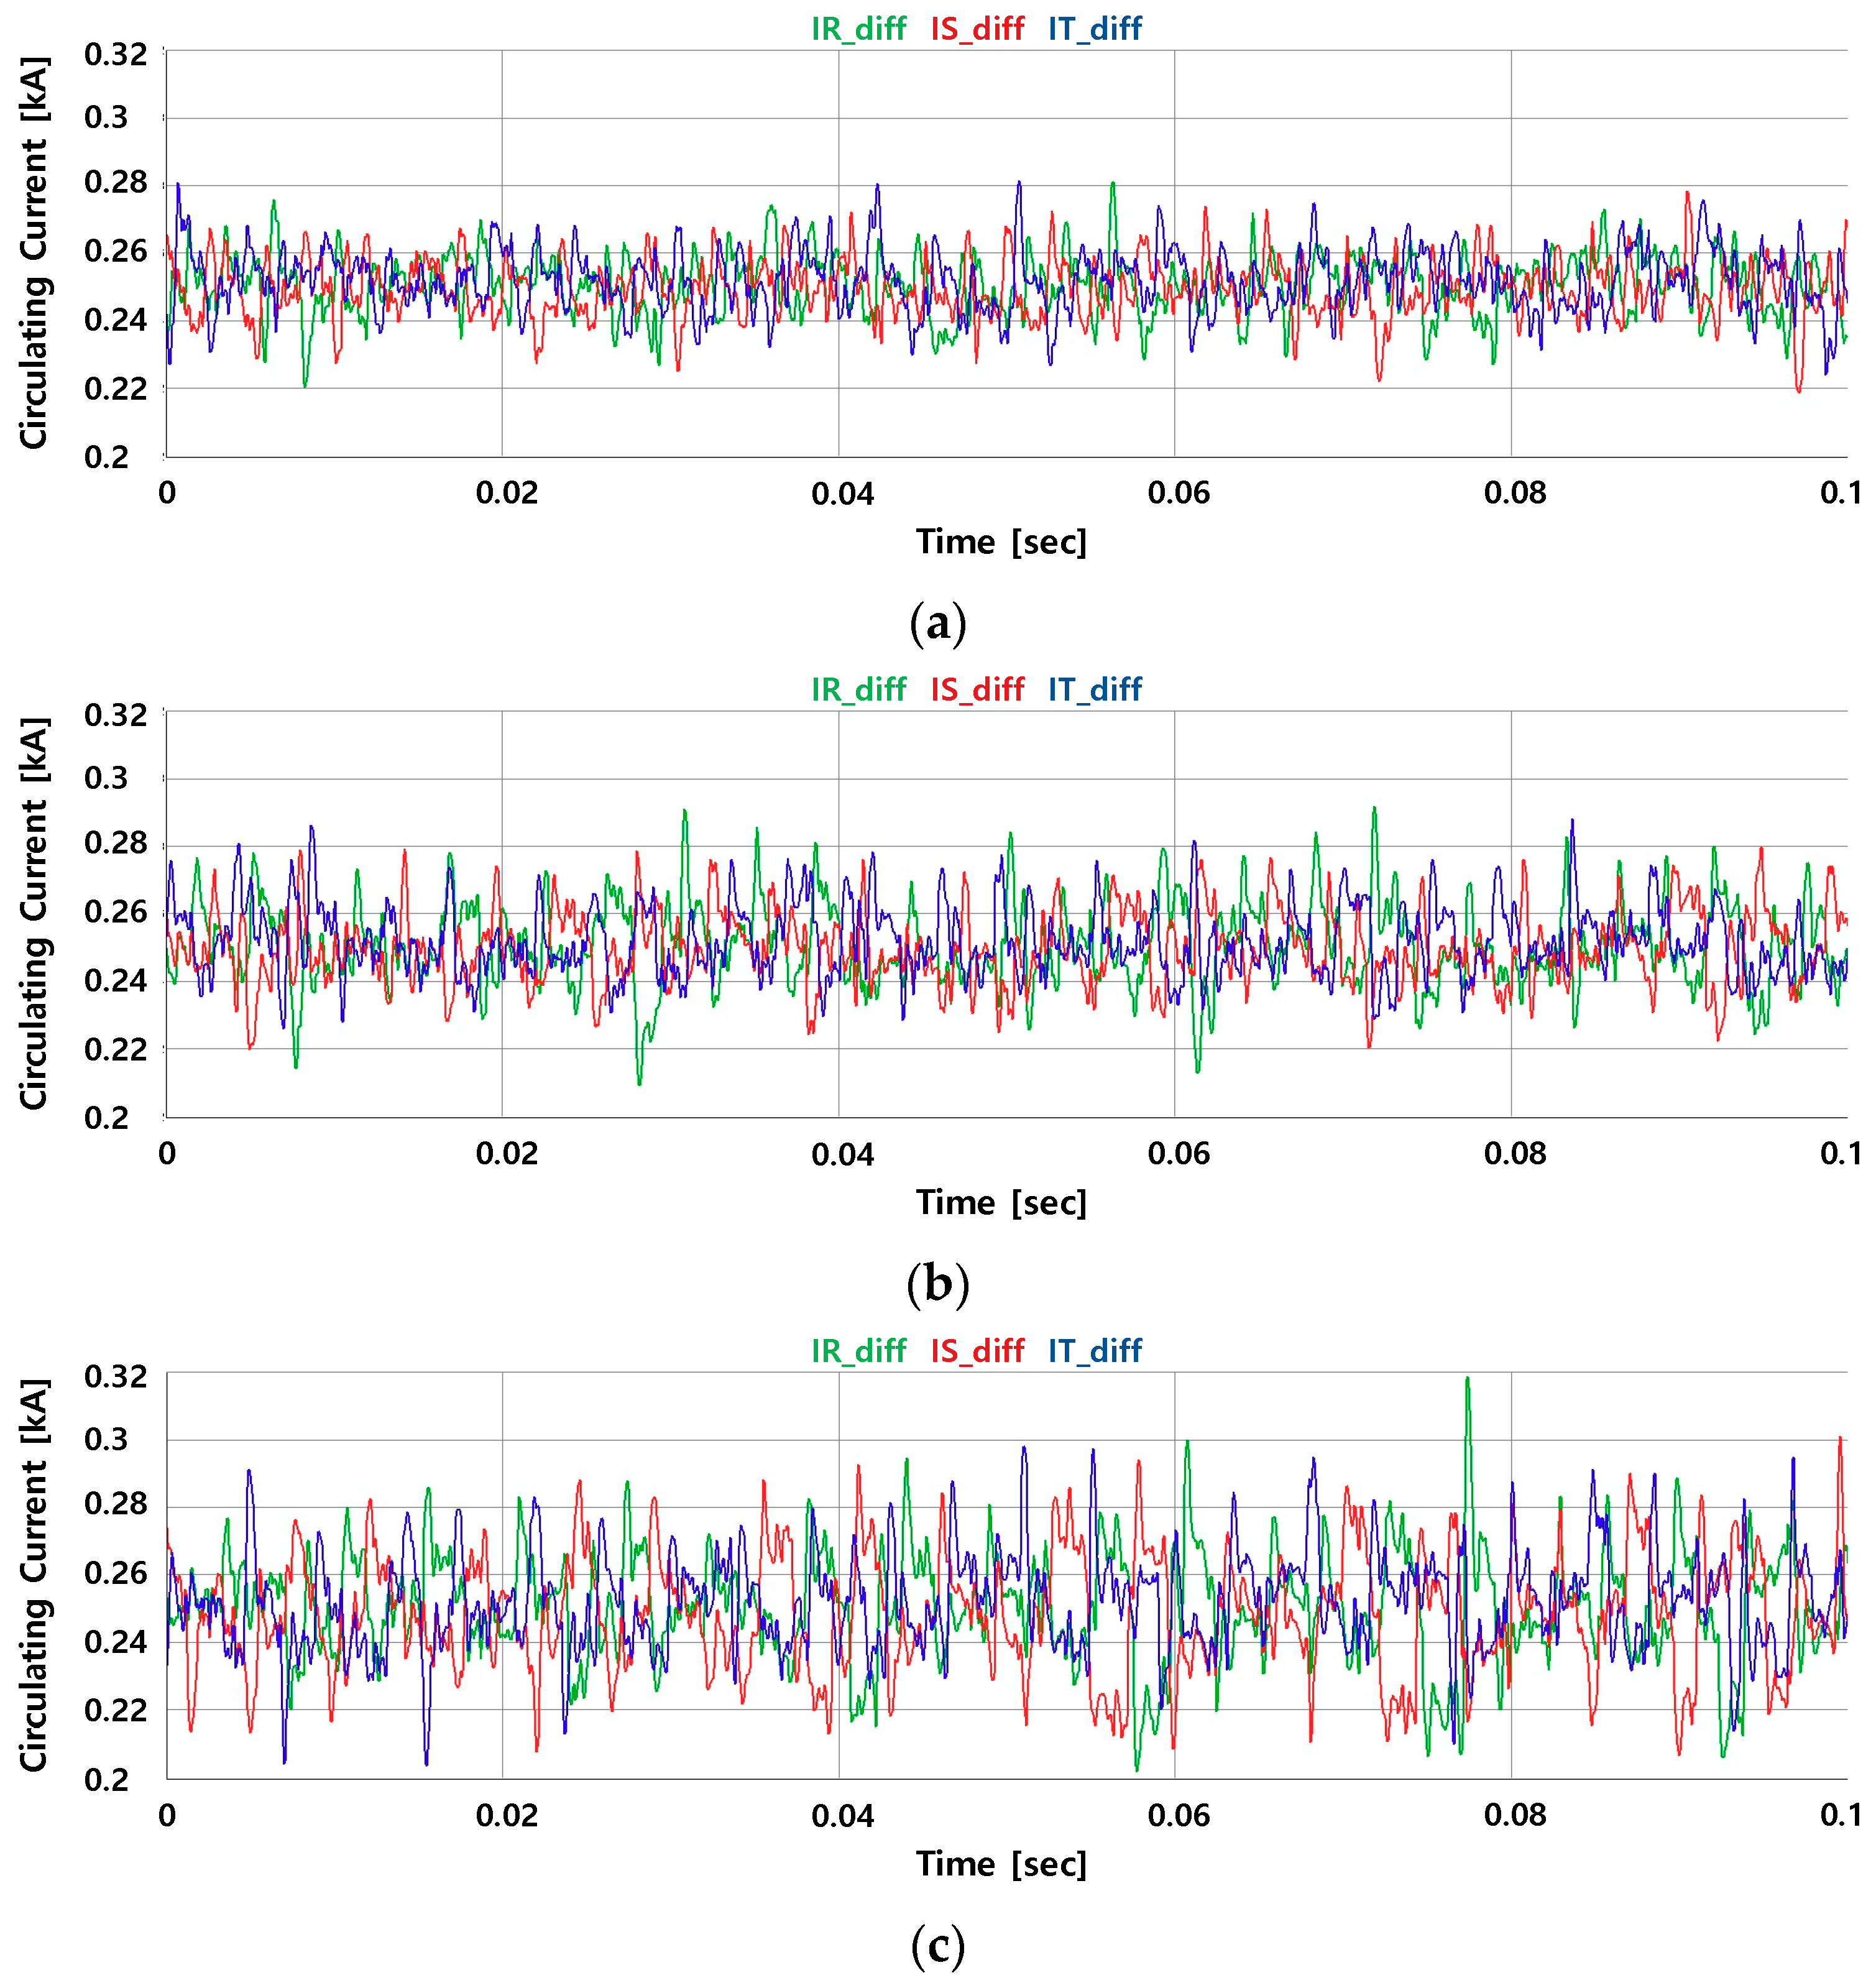
5.1. Experimental Results
5.2. Experimental Conclusions
6. Conclusions
Author Contributions
Funding
Acknowledgments
Conflicts of Interest
References
- Gemmell, B.; Dorn, J.; Retzmann, D.; Soerangr, D. Prospects of multi-level VSC technologies for power transmission. In Proceedings of the 2008 IEEE/PES Transmission and Distribution Conference and Exposition, Chicago, IL, USA, 21–24 April 2008; pp. 1–16. [Google Scholar]
- Andersen, B.R.; Xu, L.; Wong, K.T.G. Topologies for VSC transmission. Power Eng. J. 2001, 16, 298–304. [Google Scholar]
- Lauss, G.F.; Faruque, M.O.; Schoder, K.; Dufour, C.; Viehweider, A.; Langston, J. Characteristics and Design of Power Hardware-in-the-Loop Simulations for Electrical Power Systems. IEEE Trans. Ind. Electron. 2016, 63, 406–417. [Google Scholar] [CrossRef]
- Huo, Y.; Gruosso, G. Ancillary Service with Grid Connected PV: A Real-Time Hardware-in-the-Loop Approach for Evaluation of Performances. Electronics 2019, 8, 7. [Google Scholar] [CrossRef]
- Liang, T.; Dinavahi, V. Real-Time Device-Level Simulation of MMC-Based MVDC Traction Power System on MPSoC. IEEE Trans. Transp. Electr. 2018, 4, 626–641. [Google Scholar] [CrossRef]
- Ghanbari, N.; Bhattacharya, S. Hardware-In-The-Loop Implementation of a Grid Connected PV System. In Proceedings of the IAS Annual Meeting 2018, Baltimore, MD, USA, 23–27 September 2018. [Google Scholar]
- Majstorovic, D.; Celanovic, I.; Teslic, N.D.; Celanovic, N.; Katic, V.A. Ultralow-latency hardware-in-the-loop platform for rapid validation of power electronics designs. IEEE Trans. Ind. Electron. 2011, 5, 4708–4716. [Google Scholar] [CrossRef]
- Ebe, F.; Idlbi, B.; Stakic, D.E.; Chen, S.; Kondzialka, C.; Casel, M.; Heilscher, G.; Seitl, C.; Bründlinger, R.; Strasser, T.I. Comparison of Power Hardware-in-the-Loop Approaches for the Testing of Smart Grid Controls. Energys 2018, 11, 12. [Google Scholar] [CrossRef]
- Huo, Y.; Gruosso, G. Hardware-in-the-Loop Framework for Validation of Ancillary Service in Microgrids: Feasibility, Problems and Improvement. IEEE Access 2019, 7, 58104–58112. [Google Scholar] [CrossRef]
- Oguma, K.; Akagi, H. Low-Voltage-Ride-Through (LVRT) Control of an HVDC Transmission System Using Two Modular Multilevel DSCC Converters. IEEE Trans. Power Electron. 2017, 32, 5931–5942. [Google Scholar] [CrossRef]
- Ji, S.; Wang, F.; Tolbert, L.M.; Lu, T.; Zhao, Z.; Yu, H. An FPGA-Based Voltage Balancing Control for Multi-HV-IGBTs in Series Connection. IEEE Trans. Ind. Appl. 2018, 54, 4640–4649. [Google Scholar] [CrossRef]
- Beddard, A.; Barnes, M.; Preece, R. Comparison of Detailed Modeling Techniques for MMC Employed on VSC-HVDC Schemes. IEEE Trans. Power Deliv. 2011, 30, 579–589. [Google Scholar] [CrossRef]
- Tang, Y.; Ran, L.; Alatise, O.; Mawby, P. A Model Assisted Testing Scheme for Modular Multilevel Converter. IEEE Trans. Power Electron. 2016, 31, 165–176. [Google Scholar] [CrossRef]
- Tu, Q.; Xu, Z.; Chang, Y.; Guan, L. Suppressing DC Voltage Ripples of MMC-HVDC Under Unbalanced Grid Conditions. IEEE Trans. Power Deliv. 2012, 27, 1332–1338. [Google Scholar] [CrossRef]
- Antonopoulos, A.; Angquist, L.; Nee, H. On dynamics and voltage control of the Modular Multilevel Converter. In Proceedings of the 13th European Conference on Power Electronics and Applications, Barcelona, Spain, 8–10 September 2009. [Google Scholar]
- Tu, Q.; Xu, Z. Impact of Sampling Frequency on Harmonic Distortion for Modular Multilevel Converter. IEEE Trans. Power Deliv. 2011, 26, 298–306. [Google Scholar] [CrossRef]
- Saad, H.; Ould-Bachir, T.; Mahseredjian, J.; Dufour, C.; Dennetière, S.; Nguefeu, S. Real-Time Simulation of MMCs Using CPU and FPGA. IEEE Trans. Power Electron. 2015, 30, 259–267. [Google Scholar] [CrossRef]
- Tu, Q.; Xu, Z.; Xu, L. Reduced Switching-Frequency Modulation and Circulating Current Suppression for Modular Multilevel Converters. IEEE Trans. Power Deliv. 2011, 26, 2009–2017. [Google Scholar]
- Hassanpoor, A.; Ängquist, L.; Norrga, S.; Ilves, K.; Nee, H.P. Tolerance Band Modulation Methods for Modular Multilevel Converters. IEEE Trans. Power Deliv. 2010, 25, 2903–2912. [Google Scholar]
- Tu, Q.; Xu, Z.; Huang, H.; Zhang, J. Parameter Design Principle of the Arm Inductor in Modular Multilevel Converter based HVDC. In Proceedings of the 2010 International Conference on Power System Technology, Hangzhou, China, 24–28 October 2010. [Google Scholar]
- Kontos, E.; Bauer, P. Reactor design for DC fault ride-through in MMC-based multi-terminal HVDC grids. In Proceedings of the 2016 IEEE 2nd Annual Southern Power Electronics Conference (SPEC), Auckland, New Zealand, 5–8 December 2016. [Google Scholar]
- David, J.P.; Bergeron, E. A step towards intelligent translation from high-level design to RTL. In Proceedings of the 4th IEEE International Workshop on System-on-Chip for Real-Time Applications 2004, Banff, AB, Canada, 19–21 July 2004; pp. 183–188. [Google Scholar]
- Umeda, T.; Oya, S. Performance Comparison of Open-Source Parallel Sorting with OpenMP. In Proceedings of the 2015 Third International Symposium on Computing and Networking (CANDAR), Sapporo, Japan, 8–11 December 2011; pp. 334–340. [Google Scholar]
- Ashourloo, M.; Mirzahosseini, R.; Iravani, R. Enhanced Model and Real-Time Simulation Architecture for Modular Multilevel Converter. IEEE Trans. Power Deliv. 2018, 33, 466–476. [Google Scholar] [CrossRef]
- Pereira, H.A.; Cupertino, A.F.; Xavier, L.S.; Sangwongwanich, A.; Mathe, L.; Bongiorno, M.; Teodorescu, R. Capacitor voltage balance performance comparison of MMC-STATCOM using NLC and PS-PWM strategies during negative sequence current injection. In Proceedings of the 2016 18th European Conference on Power Electronics and Applications (EPE’16 ECCE Europe), Karlsruhe, Germany, 5–9 September 2016; pp. 1–9. [Google Scholar]
- Rejas, M.; Mathe, L.; Burlacu, P.D.; Pereira, H.; Sangwongwanich, A.; Bongiorno, M.; Teodorescu, R. Performance comparison of phase shifted PWM and sorting method for modular multilevel converters. In Proceedings of the 2015 17th European Conference on Power Electronics and Applications (EPE’15 ECCE-Europe), Geneva, Switzerland, 8–10 September 2015; pp. 1–10. [Google Scholar]
- Saeedifard, M.; Iravani, R. Dynamic Performance of a Modular Multilevel Back-to-Back HVDC System. IEEE Trans. Power Electron. 2015, 30, 311–326. [Google Scholar]


| Quantity | Value of Unit |
|---|---|
| Max Active Power | 240 MW |
| Rated DC Link Voltage | ±120 kV |
| Rated DC Current | 1000 A |
| Primary Voltage of Transformer | 154 kV |
| Secondary Voltage of Transformer | 118 kV |
| Number of SMs per Arm | 100 (+8) |
| Inductance per Arm Reactor | 20 mH |
| Capacity per SM | 6 uF |
| Control Cycle | 10 usec |
| Quantity | Value of Unit |
|---|---|
| Max Active Power | 1000 MW |
| Rated DC Link Voltage | ±500 kV |
| Rated DC Current | 1000 A |
| Primary Voltage of Transformer | 528 kV |
| Secondary Voltage of Transformer | 460 kV |
| Number of SMs per Arm | 400 (+32) |
| Inductance per Arm Reactor | 50 mH |
| Capacity per SM | 10 mF |
| Control Cycle | 10 usec |
© 2019 by the authors. Licensee MDPI, Basel, Switzerland. This article is an open access article distributed under the terms and conditions of the Creative Commons Attribution (CC BY) license (http://creativecommons.org/licenses/by/4.0/).
Share and Cite
Lee, J.; Kang, D.; Lee, J. A Study on the Improved Capacitor Voltage Balancing Method for Modular Multilevel Converter Based on Hardware-In-the-Loop Simulation. Electronics 2019, 8, 1070. https://doi.org/10.3390/electronics8101070
Lee J, Kang D, Lee J. A Study on the Improved Capacitor Voltage Balancing Method for Modular Multilevel Converter Based on Hardware-In-the-Loop Simulation. Electronics. 2019; 8(10):1070. https://doi.org/10.3390/electronics8101070
Chicago/Turabian StyleLee, Junmin, Daewook Kang, and Jangmyung Lee. 2019. "A Study on the Improved Capacitor Voltage Balancing Method for Modular Multilevel Converter Based on Hardware-In-the-Loop Simulation" Electronics 8, no. 10: 1070. https://doi.org/10.3390/electronics8101070
APA StyleLee, J., Kang, D., & Lee, J. (2019). A Study on the Improved Capacitor Voltage Balancing Method for Modular Multilevel Converter Based on Hardware-In-the-Loop Simulation. Electronics, 8(10), 1070. https://doi.org/10.3390/electronics8101070