Cost Minimization Energy Control Including Battery Aging for Multi-Source EV Charging Station

 , , , and
Abstract
:1. Introduction
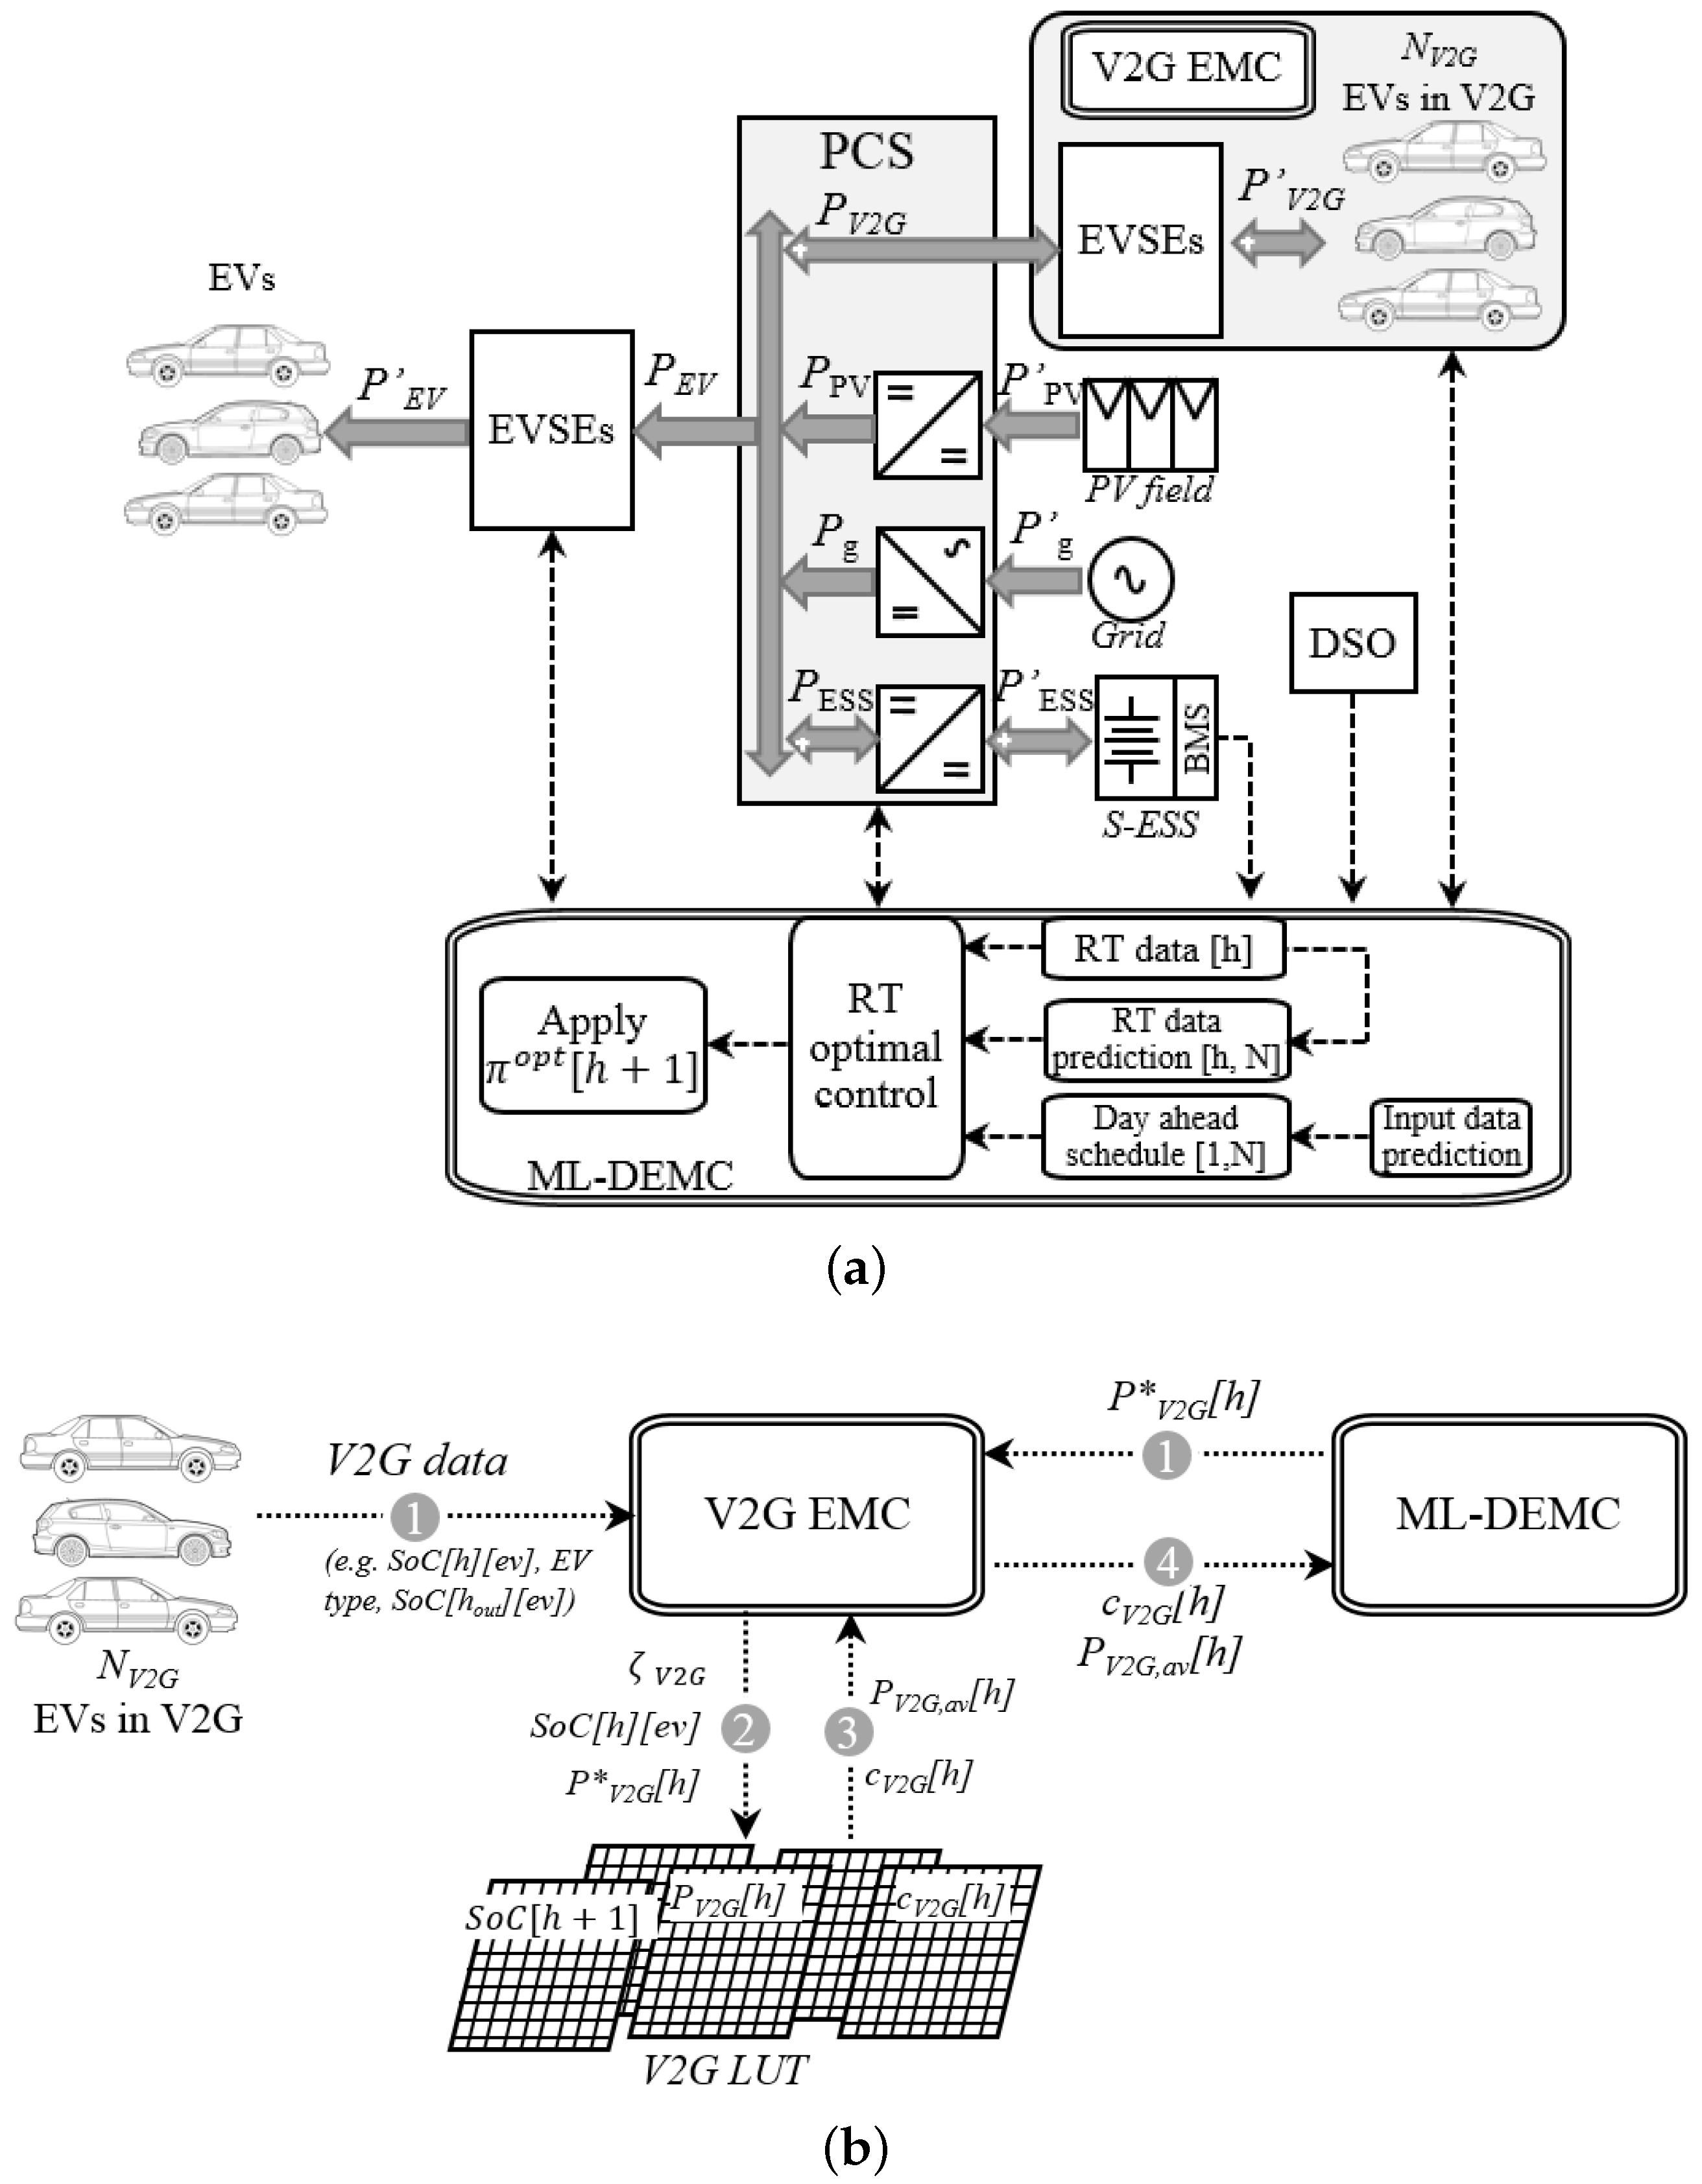
2. System Model
2.1. Energy Storage System
2.2. Vehicle to Grid (V2G)
- is not a function of the grid energy cost;
- the remuneration of each EV is proportional to the energy provided in V2G mode;
- is function of and battery capital cost of the -th vehicle (Equation (7)).
2.3. Problem Statement
3. Multi-Layer Dynamic Energy Management Control
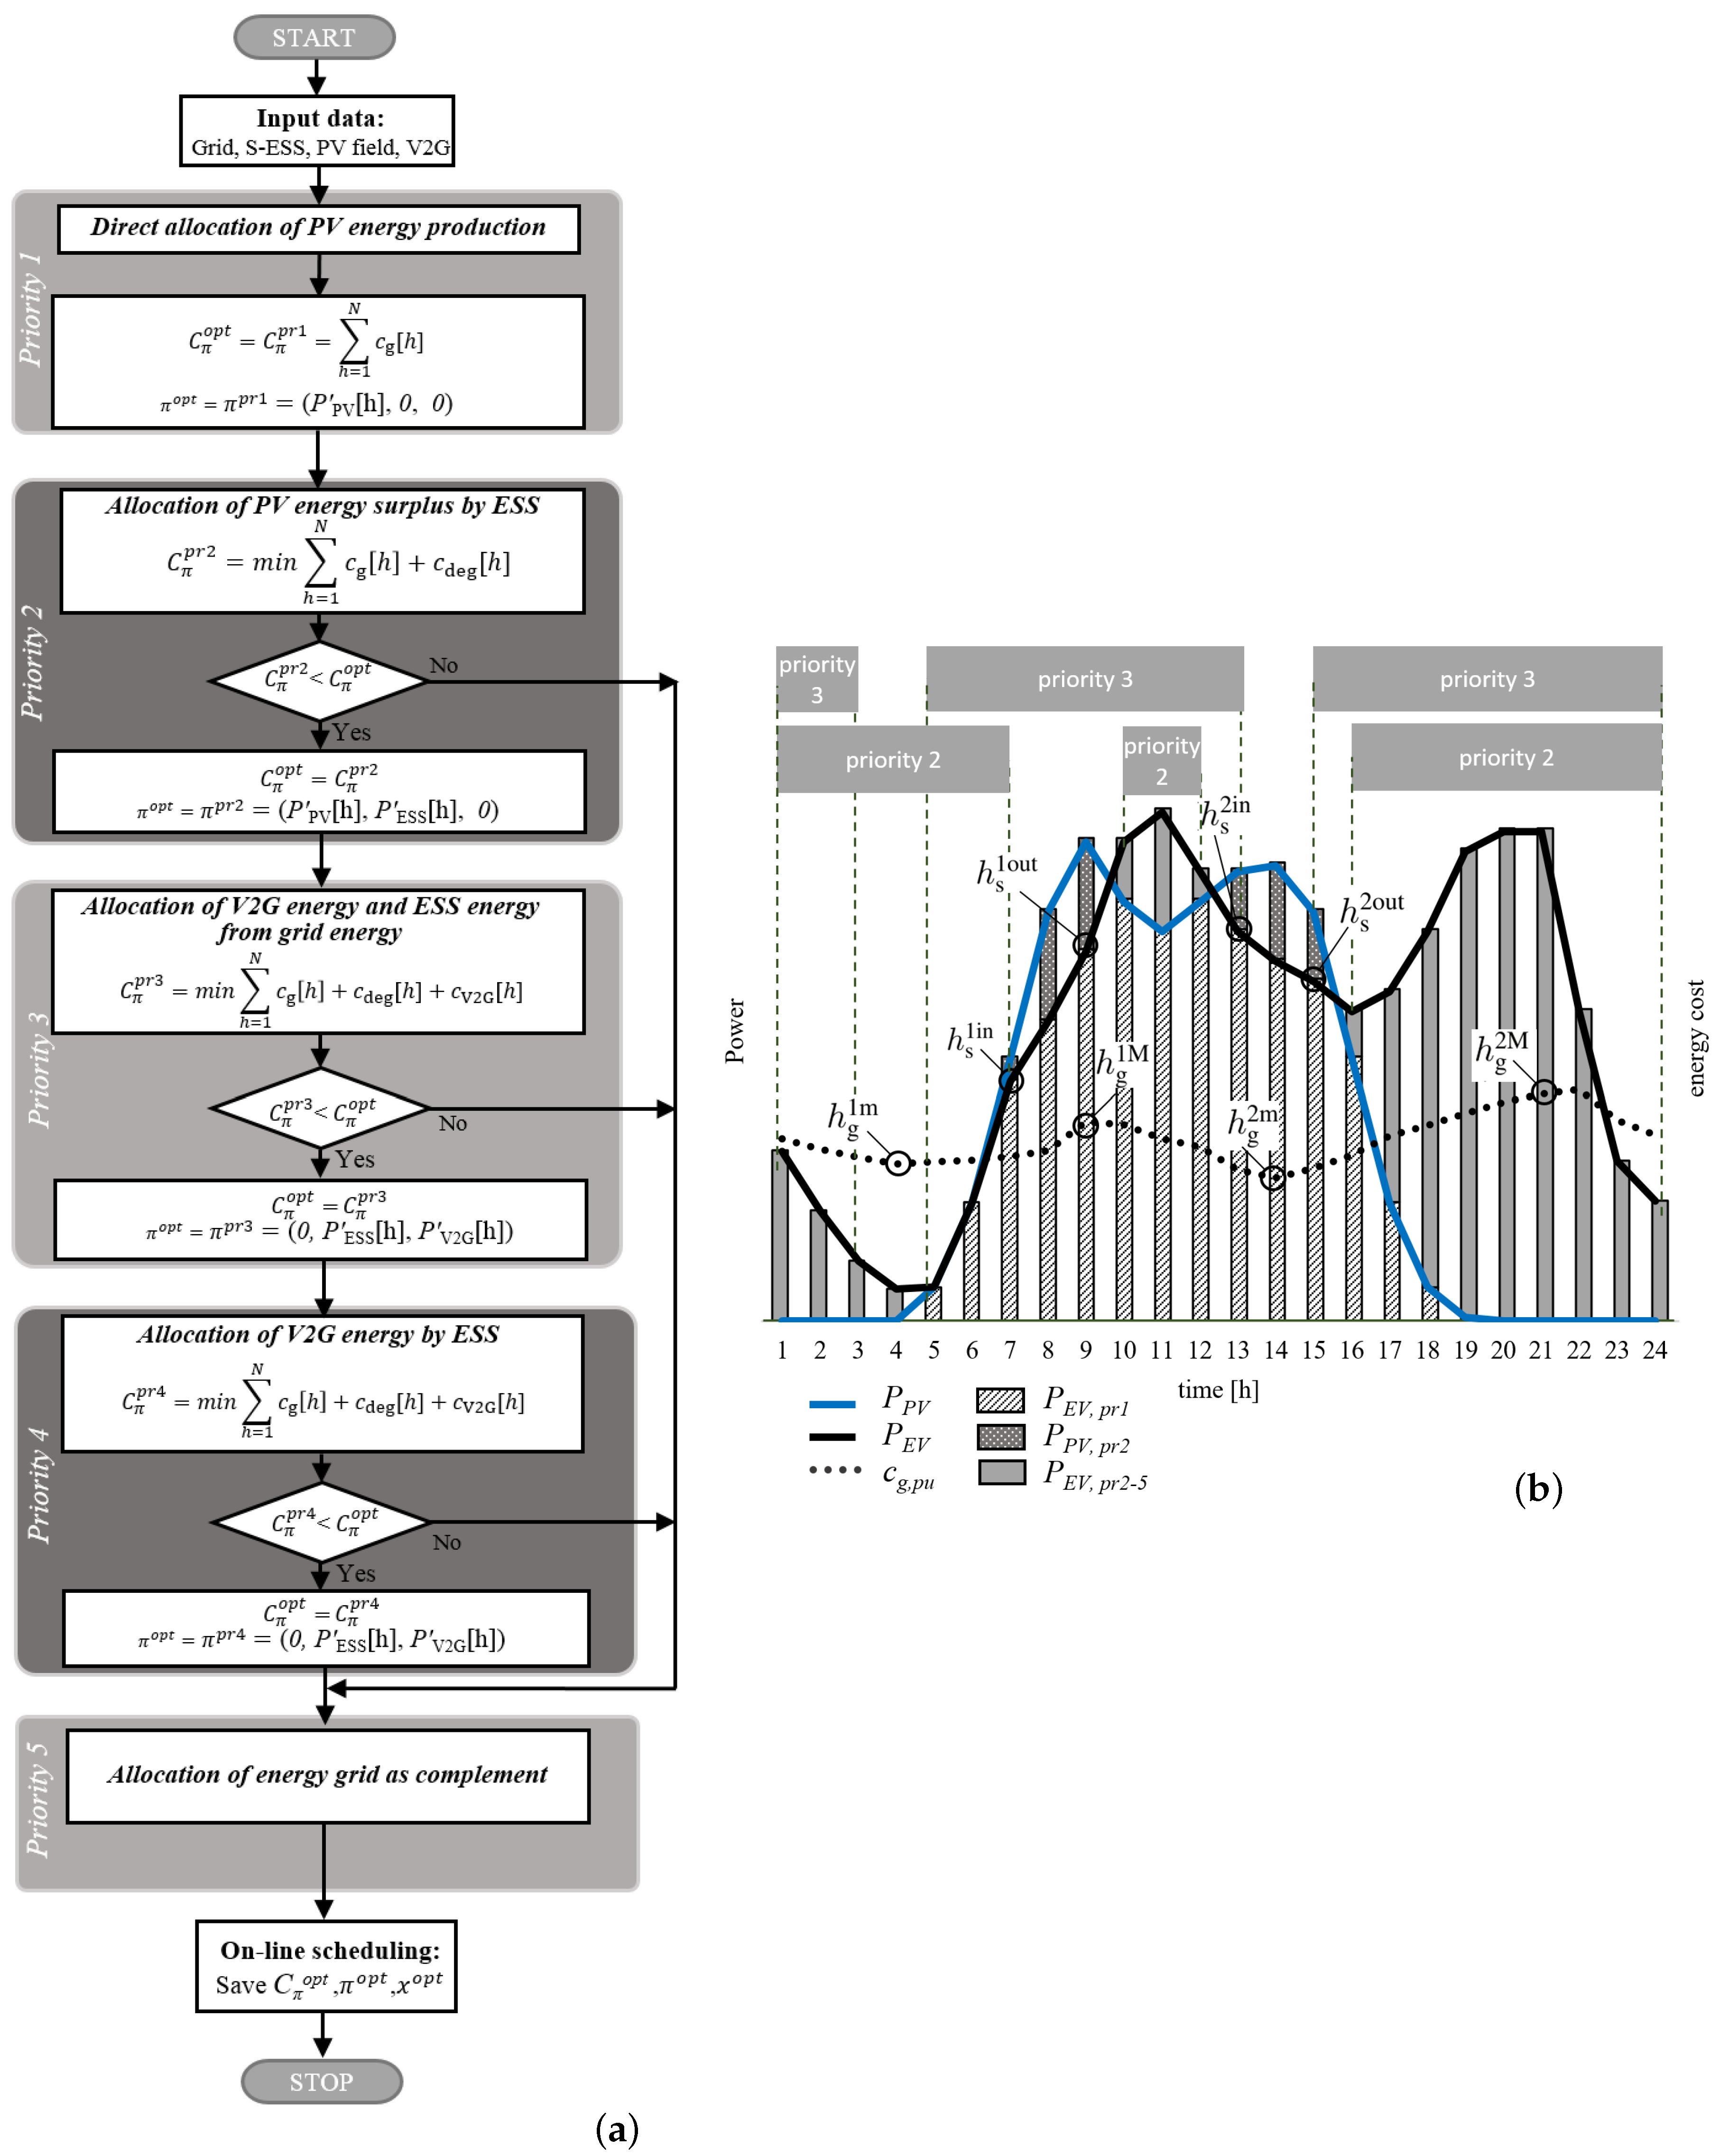
3.1. Priority Level Definition
- the operating cost of the DER source is neglected;
- the use of the local ESS and V2G has to consider the degradation cost of the battery and the future cost of replacing the ’loaned energy’ within the control horizon;
- the local ESS and V2G-ESS may have comparable degradation cost;
- the EMC uses the alternative sources (PV, V2G, S-ESS) only if economically convenient. Thus, the maximum operative cost of the system is obtained when the full energy provision is provided by the grid;
- subsequent layers may not modify decisions made in earlier layers.
- priority 1 direct use of PV energy
- priority 2 indirect use of PV energy
- priority 3 indirect use of grid energy & direct use of V2G energy
- priority 4 indirect use of V2G energy
- priority 5 direct use of grid energy
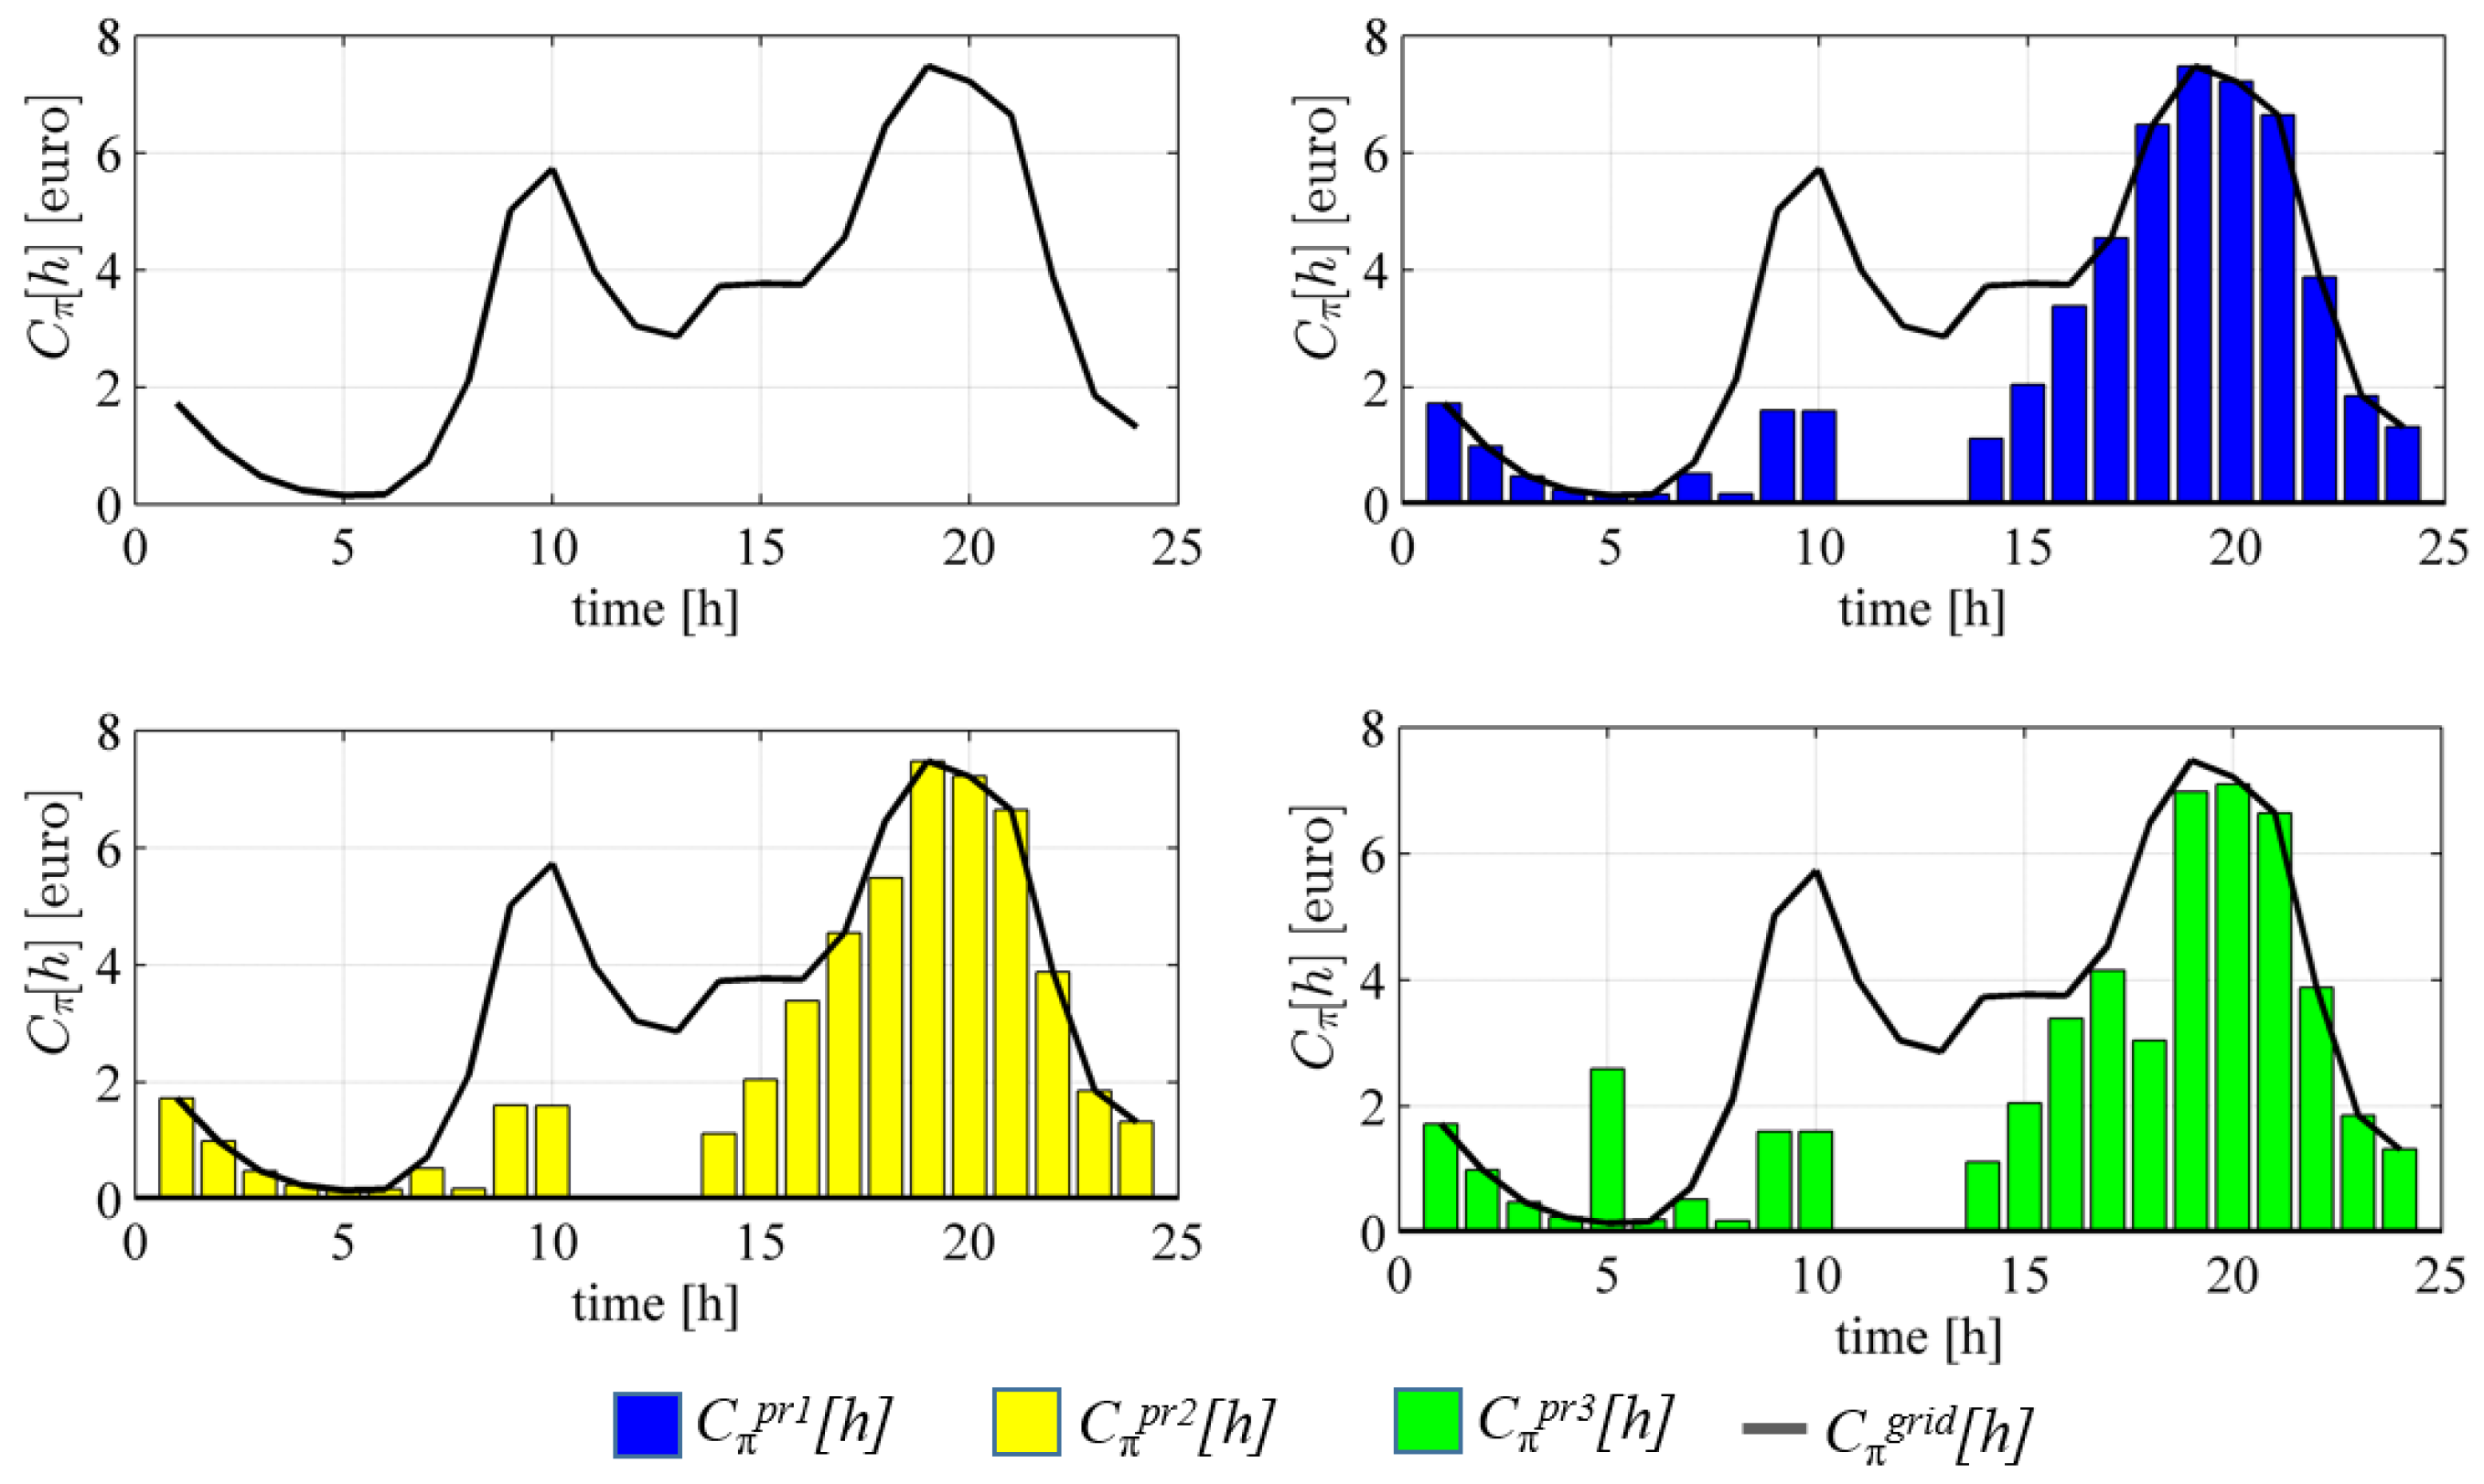
3.2. Deterministic Analysis
3.2.1. Priority 1
3.2.2. Priority 2
- a cluster of tuples is defined with i representing the time stamp of the interval. A cluster is determined by sorting the tuples in decreasing order by electricity price:
- the optimization function allocates the indirect PV energy (stored in the S-ESS) starting from the tuples with the highest price, until it runs out of energy;
- a new can be calculated considering the electricity price reduction and the inclusion of for each of the tuples;
- the ML-DEMC iteratively runs across the possible combinations discarding step-by-step the tuples with lower until finding a lower than .
3.2.3. Priority 3
3.2.4. Priority 4
3.2.5. Priority 5
3.3. Stochastic Analysis
4. Numerical Results
4.1. Comparison with Dynamic Programming Solution
4.2. Numerical Results of the Stochastic Analysis
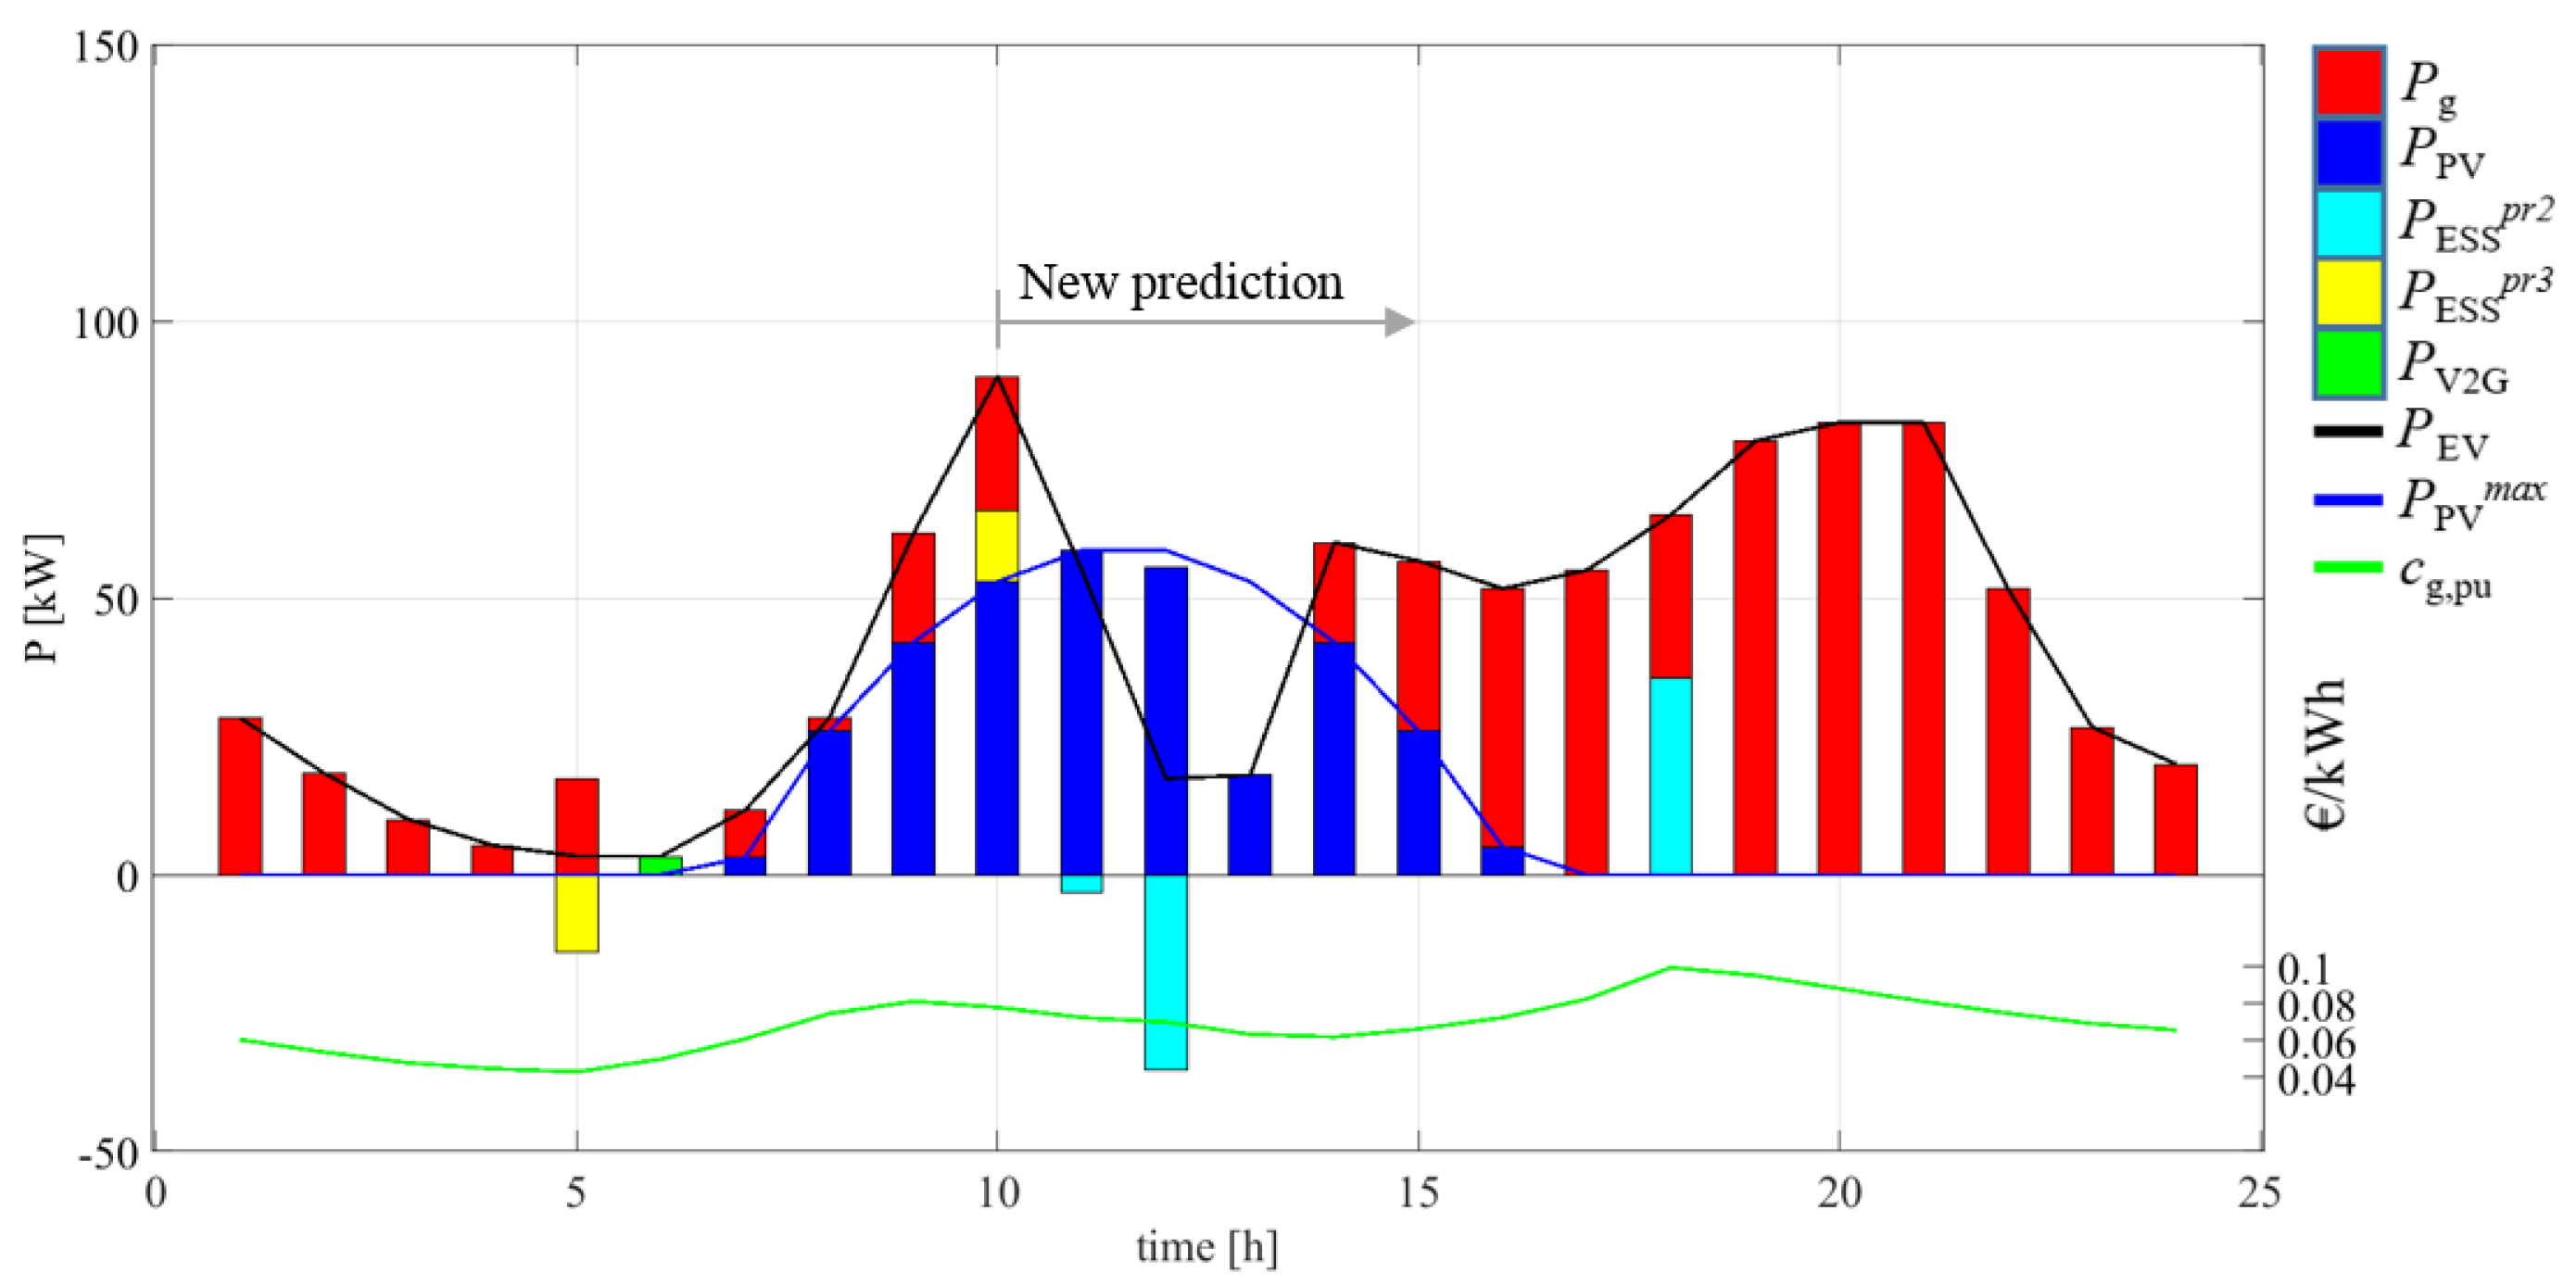
4.3. Real-Time Analysis
5. Conclusions
Author Contributions
Funding
Conflicts of Interest
References
- Habib, S.; Khan, M.M.; Abbas, F.; Sang, L.; Shahid, M.U.; Tang, H. A Comprehensive Study of Implemented International Standards, Technical Challenges, Impacts and Prospects for Electric Vehicles. IEEE Access 2018, 6, 13866–13890. [Google Scholar] [CrossRef]
- Veldman, E.; Verzijlbergh, R.A. Distribution grid impacts of smart electric vehicle charging from different perspectives. IEEE Trans. Smart Grid 2015, 6, 333–342. [Google Scholar] [CrossRef]
- Clement-Nyns, K.; Haesen, E.; Driesen, J. The Impact of Charging Plug-In Hybrid Electric Vehicles on a Residential Distribution Grid. IEEE Trans. Power Syst. 2010, 25, 371–380. [Google Scholar] [CrossRef] [Green Version]
- Dragicevic, T.; Lu, X.; Vasquez, J.C.; Guerrero, J.M. DC Microgrids—Part II: A Review of Power Architectures, Applications, and Standardization Issues. IEEE Trans. Power Electron. 2016, 31, 3528–3549. [Google Scholar] [CrossRef] [Green Version]
- Badawy, M.O.; Sozer, Y. Power Flow Management of a Grid Tied PV-Battery System for Electric Vehicles Charging. IEEE Trans. Ind. Appl. 2017, 53, 1347–1357. [Google Scholar] [CrossRef]
- Abronzini, U.; Attaianese, C.; D’Arpino, M.; Monaco, M.D.; Genovese, A.; Pede, G.; Tomasso, G. Optimal energy control for smart charging infrastructures with ESS and REG. In Proceedings of the 2016 ESARS-ITEC Conference, Toulouse, France, 2–4 November 2016; pp. 1–6. [Google Scholar] [CrossRef]
- Damiano, A.; Gatto, G.; Marongiu, I.; Porru, M.; Serpi, A. Vehicle-to-grid technology: State-of-the-art and future scenarios. J. Energy Power Eng. 2014, 8, 152–165. [Google Scholar]
- Deng, R.; Yang, Z.; Chow, M.Y.; Chen, J. A Survey on Demand Response in Smart Grids: Mathematical Models and Approaches. IEEE Trans. Ind. Inform. 2015, 11, 570–582. [Google Scholar] [CrossRef]
- Chaudhari, K.; Ukil, A.; Kumar, K.N.; Manandhar, U.; Kollimalla, S.K. Hybrid optimization for economic deployment of ESS in PV-integrated EV charging stations. IEEE Trans. Ind. Inform. 2018, 14, 106–116. [Google Scholar] [CrossRef]
- Abronzini, U.; Attaianese, C.; D’Arpino, M.; Monaco, M.D.; Genovese, A.; Pede, G.; Tomasso, G. Multi-source power converter system for EV charging station with integrated ESS. In Proceedings of the 2015 IEEE 1st International Forum on Research and Technologies for Society and Industry Leveraging a Better Tomorrow (RTSI), Torino, Italy, 16–18 September 2015; pp. 427–432. [Google Scholar] [CrossRef]
- Zhou, C.; Qian, K.; Allan, M.; Zhou, W. Modeling of the cost of EV battery wear due to V2G application in power systems. IEEE Trans. Energy Convers. 2011, 26, 1041–1050. [Google Scholar] [CrossRef]
- Ortega-Vazquez, M.A. Optimal scheduling of electric vehicle charging and vehicle-to-grid services at household level including battery degradation and price uncertainty. IET Gener. Transm. Distrib. 2014, 8, 1007–1016. [Google Scholar] [CrossRef]
- Farzin, H.; Fotuhi-Firuzabad, M.; Moeini-Aghtaie, M. A Practical Scheme to Involve Degradation Cost of Lithium-Ion Batteries in Vehicle-to-Grid Applications. IEEE Trans. Sustain. Energy 2016, 7, 1730–1738. [Google Scholar] [CrossRef]
- Ahmadian, A.; Sedghi, M.; Mohammadi-ivatloo, B.; Elkamel, A.; Golkar, M.A.; Fowler, M. Cost-Benefit Analysis of V2G Implementation in Distribution Networks Considering PEVs Battery Degradation. IEEE Trans. Sustain. Energy 2018, 9, 961–970. [Google Scholar] [CrossRef]
- Han, S.; Aki, H.; Han, S. A practical battery wear model for electric vehicle charging applications. In Proceedings of the 2013 IEEE Power Energy Society General Meeting, Vancouver, BC, Canada, 21–25 July 2013; pp. 1–5. [Google Scholar]
- Biral, F.; Bertolazzi, E.; Bosetti, P. Notes on numerical methods for solving optimal control problems. IEEE J. Ind. Appl. 2016, 5, 154–166. [Google Scholar] [CrossRef]
- Sundstrom, O.; Guzzella, L. A generic dynamic programming Matlab function. In Proceedings of the 2009 IEEE Control Applications, (CCA) Intelligent Control, (ISIC), St. Petersburg, Russia, 8–10 July 2009; pp. 1625–1630. [Google Scholar] [CrossRef]
- Attaianese, C.; Monaco, M.D.; Nardi, V.; Tomasso, G. Dual inverter for high efficiency PV systems. In Proceedings of the 2009 IEEE International Electric Machines and Drives Conference, Miami, FL, USA, 3–6 May 2009; pp. 818–825. [Google Scholar] [CrossRef]
- Serpi, A.; Porru, M.; Damiano, A. An Optimal Power and Energy Management by Hybrid Energy Storage Systems in Microgrids. Energies 2017, 10, 1909. [Google Scholar] [CrossRef]
- Christophersen, J.P. Battery Test Manual For Electric Vehicles; rev. 3; Technical Report; Idaho National Lab. (INL): Idaho Falls, ID, USA, 2015.
- Yilmaz, M.; Krein, P.T. Review of the impact of vehicle-to-grid technologies on distribution systems and utility interfaces. IEEE Trans. Power Electron. 2013, 28, 5673–5689. [Google Scholar] [CrossRef]
- Shi, W.; Wong, V.W.S. Real-time vehicle-to-grid control algorithm under price uncertainty. In Proceedings of the 2011 IEEE International Conference on Smart Grid Communications (SmartGridComm), Brussels, Belgium, 17–20 October 2011; pp. 261–266. [Google Scholar] [CrossRef]
- Stein, S.; Gerding, E.; Robu, V.; Jennings, N.R. A model-based online mechanism with pre-commitment and its application to electric vehicle charging. In Proceedings of the 11th International Conference on Autonomous Agents and Multiagent Systems—Volume 2, Taipei, Taiwan, 2–6 May 2012; International Foundation for Autonomous Agents and Multiagent Systems: Richland, SC, USA, 2012; pp. 669–676. [Google Scholar]
- Celli, G.; Soma, G.G.; Pilo, F.; Lacu, F.; Mocci, S.; Natale, N. Aggregated electric vehicles load profiles with fast charging stations. In Proceedings of the 2014 Power Systems Computation Conference, Wroclaw, Poland, 18–22 August 2014; pp. 1–7. [Google Scholar] [CrossRef]
- Attaianese, C.; D’Arpino, M.; Monaco, M.D.; Tomasso, G. Interleaving modulation inverters for high efficiency photovoltaic systems. In Proceedings of the 2014 IEEE PES General Meeting|Conference Exposition, National Harbor, MD, USA, 27–31 July 2014; pp. 1–5. [Google Scholar] [CrossRef]
- SMA Solar Technology. Sunny Tripower. Available online: http://files.sma.de/dl/24336/STP25000TL-30-DEN1742-V31web.pdf (accessed on 18 December 2018).
- Valøen, L.O.; Shoesmith, M.I. The effect of PHEV and HEV duty cycles on battery and battery pack performance. In Proceedings of the PHEV 2007 Conference, Montréal, QC, Canada, 28–30 September 2007; pp. 4–5. [Google Scholar]


| Source | Direct Supply | Indirect Supply | ||
|---|---|---|---|---|
| Priority | Priority | |||
| grid | 5 | 3 | ||
| PV | 0 | 1 | 2 | |
| V2G | 3 | 4 | ||
| ESS | Technology | Case 1 | Case 2 |
|---|---|---|---|
| S-ESS | lead acid | 0.10 € /Wh | 0.07 € /Wh |
| V2G-ESS | lithium ion | 0.30 € /Wh | 0.20 € /Wh |
| Month | Case | [€] | |||||||||
|---|---|---|---|---|---|---|---|---|---|---|---|
| DP | ML-DEMC | DP | ML-DEMC | DP | ML-DEMC | DP | ML-DEMC | DP | ML-DEMC | ||
| March | 1 | 32.45 | 32.29 | 51.19 | 51.51 | 49.34 | 48.34 | 0.16 | 0.15 | 5.90 | 5.96 |
| 2 | 30.74 | 30.58 | 49.92 | 50.13 | 49.13 | 49.52 | 0.42 | 0.35 | 8.75 | 8.40 | |
| June | 1 | 33.76 | 34.00 | 46.26 | 46.99 | 54.14 | 53.61 | 0.00 | 0.00 | 6.07 | 5.96 |
| 2 | 31.98 | 32.30 | 44.13 | 43.99 | 55.09 | 55.52 | 0.46 | 0.49 | 9.92 | 9.48 | |
| September | 1 | 39.22 | 38.79 | 49.19 | 49.46 | 50.12 | 50.33 | 0.23 | 0.21 | 7.12 | 7.04 |
| 2 | 36.92 | 36.76 | 47.71 | 47.31 | 51.45 | 51.71 | 0.94 | 0.99 | 9.52 | 9.75 | |
| December | 1 | 52.83 | 52.72 | 64.75 | 65.18 | 34.56 | 34.27 | 0.60 | 0.55 | 2.36 | 2.42 |
| 2 | 51,72 | 52.05 | 64.27 | 63.74 | 34.48 | 34.72 | 1.46 | 1.54 | 3.62 | 3.79 | |
© 2019 by the authors. Licensee MDPI, Basel, Switzerland. This article is an open access article distributed under the terms and conditions of the Creative Commons Attribution (CC BY) license (http://creativecommons.org/licenses/by/4.0/).
Share and Cite
Abronzini, U.; Attaianese, C.; D’Arpino, M.; Di Monaco, M.; Tomasso, G. Cost Minimization Energy Control Including Battery Aging for Multi-Source EV Charging Station. Electronics 2019, 8, 31. https://doi.org/10.3390/electronics8010031
Abronzini U, Attaianese C, D’Arpino M, Di Monaco M, Tomasso G. Cost Minimization Energy Control Including Battery Aging for Multi-Source EV Charging Station. Electronics. 2019; 8(1):31. https://doi.org/10.3390/electronics8010031
Chicago/Turabian StyleAbronzini, Umberto, Ciro Attaianese, Matilde D’Arpino, Mauro Di Monaco, and Giuseppe Tomasso. 2019. "Cost Minimization Energy Control Including Battery Aging for Multi-Source EV Charging Station" Electronics 8, no. 1: 31. https://doi.org/10.3390/electronics8010031
APA StyleAbronzini, U., Attaianese, C., D’Arpino, M., Di Monaco, M., & Tomasso, G. (2019). Cost Minimization Energy Control Including Battery Aging for Multi-Source EV Charging Station. Electronics, 8(1), 31. https://doi.org/10.3390/electronics8010031