1. Introduction
Tea is one of the most significant economic crops globally, and its quality and yield are highly dependent on the soil moisture conditions of its growth environment. The root systems of tea plants are extremely sensitive to water: a deficit leads to stunted growth and increased lignification, which severely compromises the flavor and economic value; conversely, excessive moisture can trigger root diseases and result in the waste of precious water resources [
1,
2]. With the advancement of the Internet of Things (IoT) and smart agriculture technologies, developing efficient and precise smart irrigation control systems for tea gardens has become a crucial pathway for enhancing the added value of tea and achieving sustainable agricultural development [
3].
However, in practical tea garden irrigation engineering, the spatial limitations of sensor perception and the long-distance transmission characteristics of irrigation networks present dual challenges at both the control execution and decision-diagnostic levels [
4,
5,
6]. These challenges are primarily reflected in the identification capability of decision models regarding interference signals [
7] and the robustness requirements for control algorithms despite significant system time delays [
8].
At the control execution level, the tea garden irrigation process is a typical high-order, nonlinear, and large-time-delay dynamic process. Due to the geographical constraints of tea gardens, there is a substantial physical delay as irrigation water is transported from pump stations through long pipelines to emitters; simultaneously, soil moisture sensors exhibit significant inertial lag when sensing the water infiltration process [
9]. Such pronounced time-delay characteristics often lead traditional Proportional–Integral–Derivative (PID) controllers to produce overshoots or even system instability. Although Smith predictors [
10] are frequently employed to address time-delay issues, they rely heavily on precise mathematical models; in the open environments of tea gardens, model mismatch caused by multiple disturbances (such as sunlight and sudden rainfall) often leads to a sharp decline in robustness. Sliding Mode Control (SMC) [
11] has garnered attention for its strong anti-interference capabilities, yet the inherent “chattering” phenomenon of traditional first-order sliding modes accelerates the mechanical wear of solenoid valves and pumps, shortening equipment lifespan. Therefore, designing an advanced control strategy that can compensate for long time delays while eliminating chattering and adapting to environmental disturbances is fundamental to achieving precision irrigation.
At the decision-diagnostic level, the unique environment of tea gardens makes irrigation decisions based on a single sensor highly prone to misjudgment [
12]. Tea plants exhibit periodic agronomic characteristics of harvesting, where manual picking causes drastic fluctuations in canopy biomass (shoot density) [
13]. The existing irrigation decision systems are typically based on visual recognition or fixed soil moisture thresholds. However, during harvesting, the sudden decrease in canopy shoot density is often misinterpreted by traditional models as a severe “water stress” signal [
14,
15], triggering erroneous irrigation commands. These “false stress” signals not only waste water resources but may also destroy soil aeration due to over-irrigation [
16]. Consequently, there is an urgent need to establish a collaborative decision-making mechanism capable of decoupling “phenology-driven components” from “water stress components” to eliminate non-physiological interference.
To address the aforementioned challenges, this study proposes a smart tea garden precision irrigation system based on Phenology-Aware Collaborative Decision-making (PACD) and an Adaptive Gain Predictive Super-Twisting Sliding Mode Control (AG-PSTC) algorithm. The primary contributions of this study are as follows:
- (1)
Constructing the first collaborative decision-making model for tea phenological perception: An ideal phenological baseline growth model was developed based on the three factors of “temperature, time, and water.” By introducing a Crop Water Stress Index (CWSI) diagnostic operator, the changes in shoot density were successfully decoupled, effectively eliminating misjudgment signals caused by harvesting and enabling the dynamic and precise setting of target soil moisture (Wtarget).
- (2)
Proposing the AG-PSTC control algorithm: To tackle the large-time-delay issue in pipeline delivery, an improved Smith predictor was designed for phase compensation. A second-order super-twisting sliding mode algorithm was utilized to eliminate control chattering, and an adaptive law based on barrier functions was introduced. This allows the controller to achieve finite-time convergence and robust control without prior knowledge of disturbance upper bounds.
- (3)
Performing system integration and field validation: A smart tea garden management system was constructed based on a closed-loop hierarchical architecture of “perception–diagnosis–decision–execution.” Field trials at an experimental base verified the system’s effectiveness in eliminating harvesting interference, maintaining soil moisture stability, and improving irrigation precision in complex farmland environments.
This study aims to construct and validate a vertically integrated framework ranging from crop physiological models to low-level precision control, providing a theoretical basis and technical support for the intelligent management of modern tea gardens.
2. Related Work
The development of smart irrigation systems has evolved significantly, transitioning from simple timer-based mechanisms to advanced algorithm-driven frameworks. To highlight the current research landscape and the specific gaps addressed by this study, existing approaches can be broadly categorized into traditional/fuzzy control systems, model predictive control (MPC) strategies, and IoT/machine learning-based systems.
2.1. Traditional and Fuzzy Control Systems
Early smart irrigation largely relied on conventional PID controllers. To improve adaptability, recent studies have integrated fuzzy logic with PID. For instance, Zhang W. et al. proposed an integrated water and fertilizer irrigation system utilizing a self-correcting fuzzy PID control, which improved resource efficiency [
17]. Similarly, Sijia et al. designed an intelligent irrigation control system based on fuzzy logic to handle non-linear soil environments [
18], while Li X. et al. developed a farm irrigation control system based on a composite controller to enhance steady-state performance [
19]. However, while fuzzy PID systems improve local adaptability, they often struggle with the significant pure time-delay characteristics inherent in the long-distance pipeline networks of hilly tea gardens, leading to phase lag and system oscillation.
2.2. Model Predictive Control (MPC) Strategies
To address the dynamic changes in agricultural environments, MPC has been widely explored. Cáceres et al. [
20] and Quimbita et al. [
21] successfully applied MPC to achieve economic optimality and energy management in smart irrigation. Furthermore, Pacheco et al. [
22] explored the capabilities of Adaptive MPC to handle changing soil dynamics over time. Although MPC provides excellent predictive capabilities and optimal energy management, it is highly dependent on precise mathematical models of the controlled object. In the open and complex environment of a tea garden, unmodeled disturbances and parameter mutations (e.g., sudden changes in soil inertia) often lead to a sharp decline in MPC robustness, and its high computational cost limits embedded deployment.
2.3. IoT and Machine Learning-Based Approaches
The integration of the Internet of Things (IoT) and artificial intelligence has revolutionized irrigation decision-making. Jia et al. [
3] and Zhang Y. et al. [
23] developed IoT smart irrigation systems utilizing LoRa networks and edge computing, significantly improving remote monitoring and data transmission efficiency in farmlands. At the decision-making level, Machine Learning (ML) and Deep Learning (DL) have been extensively deployed. Sami et al. [
24] introduced a deep learning-based sensor modeling approach. Furthermore, Abioye et al. [
7] and Çetin and Beyhan [
25] demonstrated the efficacy of ML in evaluating environmental data to optimize irrigation schedules. Additionally, Ji et al. [
26] proposed an automatic water-saving technology based on the PSO-ELM (Particle Swarm Optimization—Extreme Learning Machine) algorithm combined with micro-control units.
2.4. Summary and Research Gaps
While the aforementioned studies have greatly advanced precision agriculture, they exhibit distinct limitations when applied to smart tea gardens. Most IoT and ML decision models rely on passive threshold triggers (e.g., fixed soil moisture or simple canopy data) and fail to distinguish between actual physiological water stress and non-physiological biomass fluctuations (such as manual plucking), leading to erroneous irrigation commands. Furthermore, existing control algorithms (Fuzzy PID, MPC) lack dedicated mechanisms to simultaneously handle severe time delays and eliminate mechanical chattering without relying on precise mathematical models.
Table 1 summarizes the representative studies and highlights the critical research opportunities. To bridge these gaps, this study proposes the Phenology-Aware Collaborative Decision-Making model to eliminate plucking interference, coupled with the AG-PSTC algorithm to solve the large-time-delay and chattering issues in hilly tea garden irrigation.
3. Materials and Methods
3.1. Experimental Site and Smart Tea Garden System
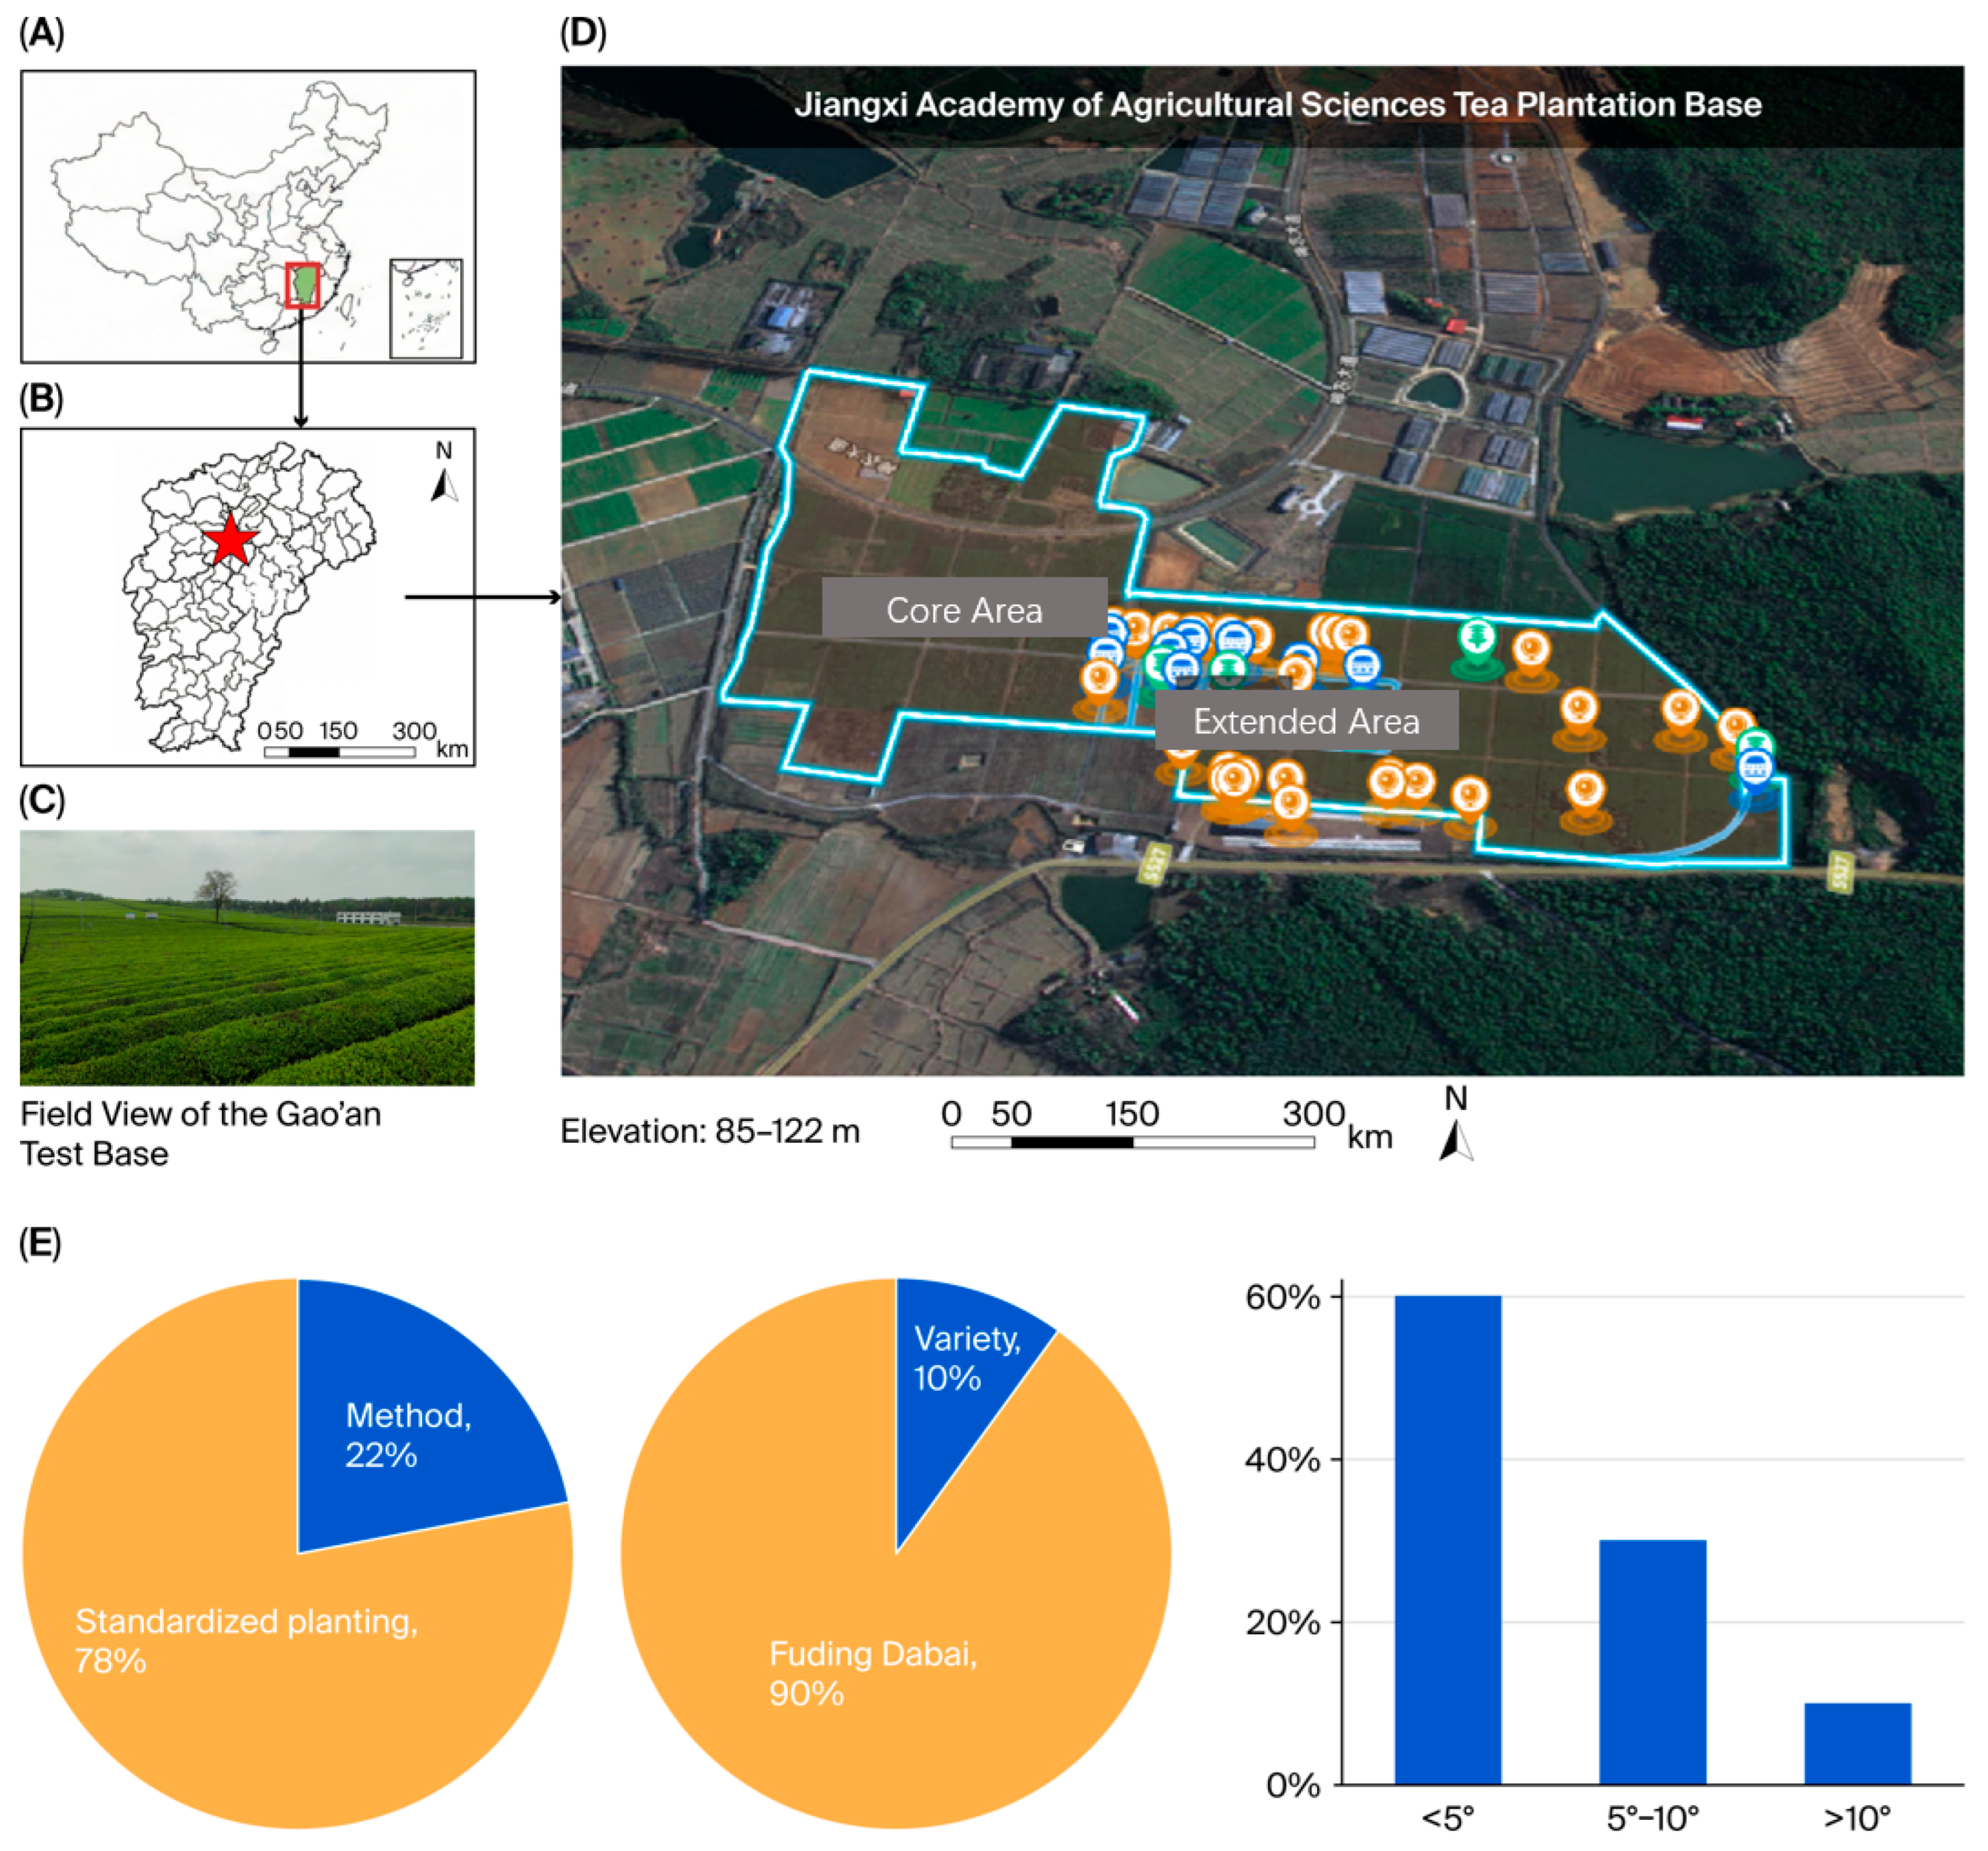
The experimental base for this study is located in the tea plantation of the Jiangxi Academy of Agricultural Sciences, Gao’an City, Jiangxi Province (28°25′18″ N, 115°13′07.71″ E), with an elevation ranging from 85 to 122 m. This base is situated in a typical subtropical monsoon climate zone characterized by high temperatures and humidity during the summer, serving as a representative example of hilly tea-producing regions. The core experimental area covers 53.33 hectares, with standardized planting zones accounting for 78% of the total area (as shown in
Figure 1).
The primary variety cultivated in the experimental area is “Fuding Dabai Cha” (accounting for 90%), with uniform tree age and growth conditions, meeting the requirements for precision irrigation experiments. The topography exhibits significant vertical differentiation, with slopes ranging from 0° to 15°, encompassing various hilly tea garden terrains such as flat areas, gentle slopes, and steep slopes. The soil type is predominantly red soil, characterized by a large time lag and nonlinear water infiltration properties. These characteristics provide an ideal physical environment for validating the control performance of the AG-PSTC algorithm under complex terrain conditions.
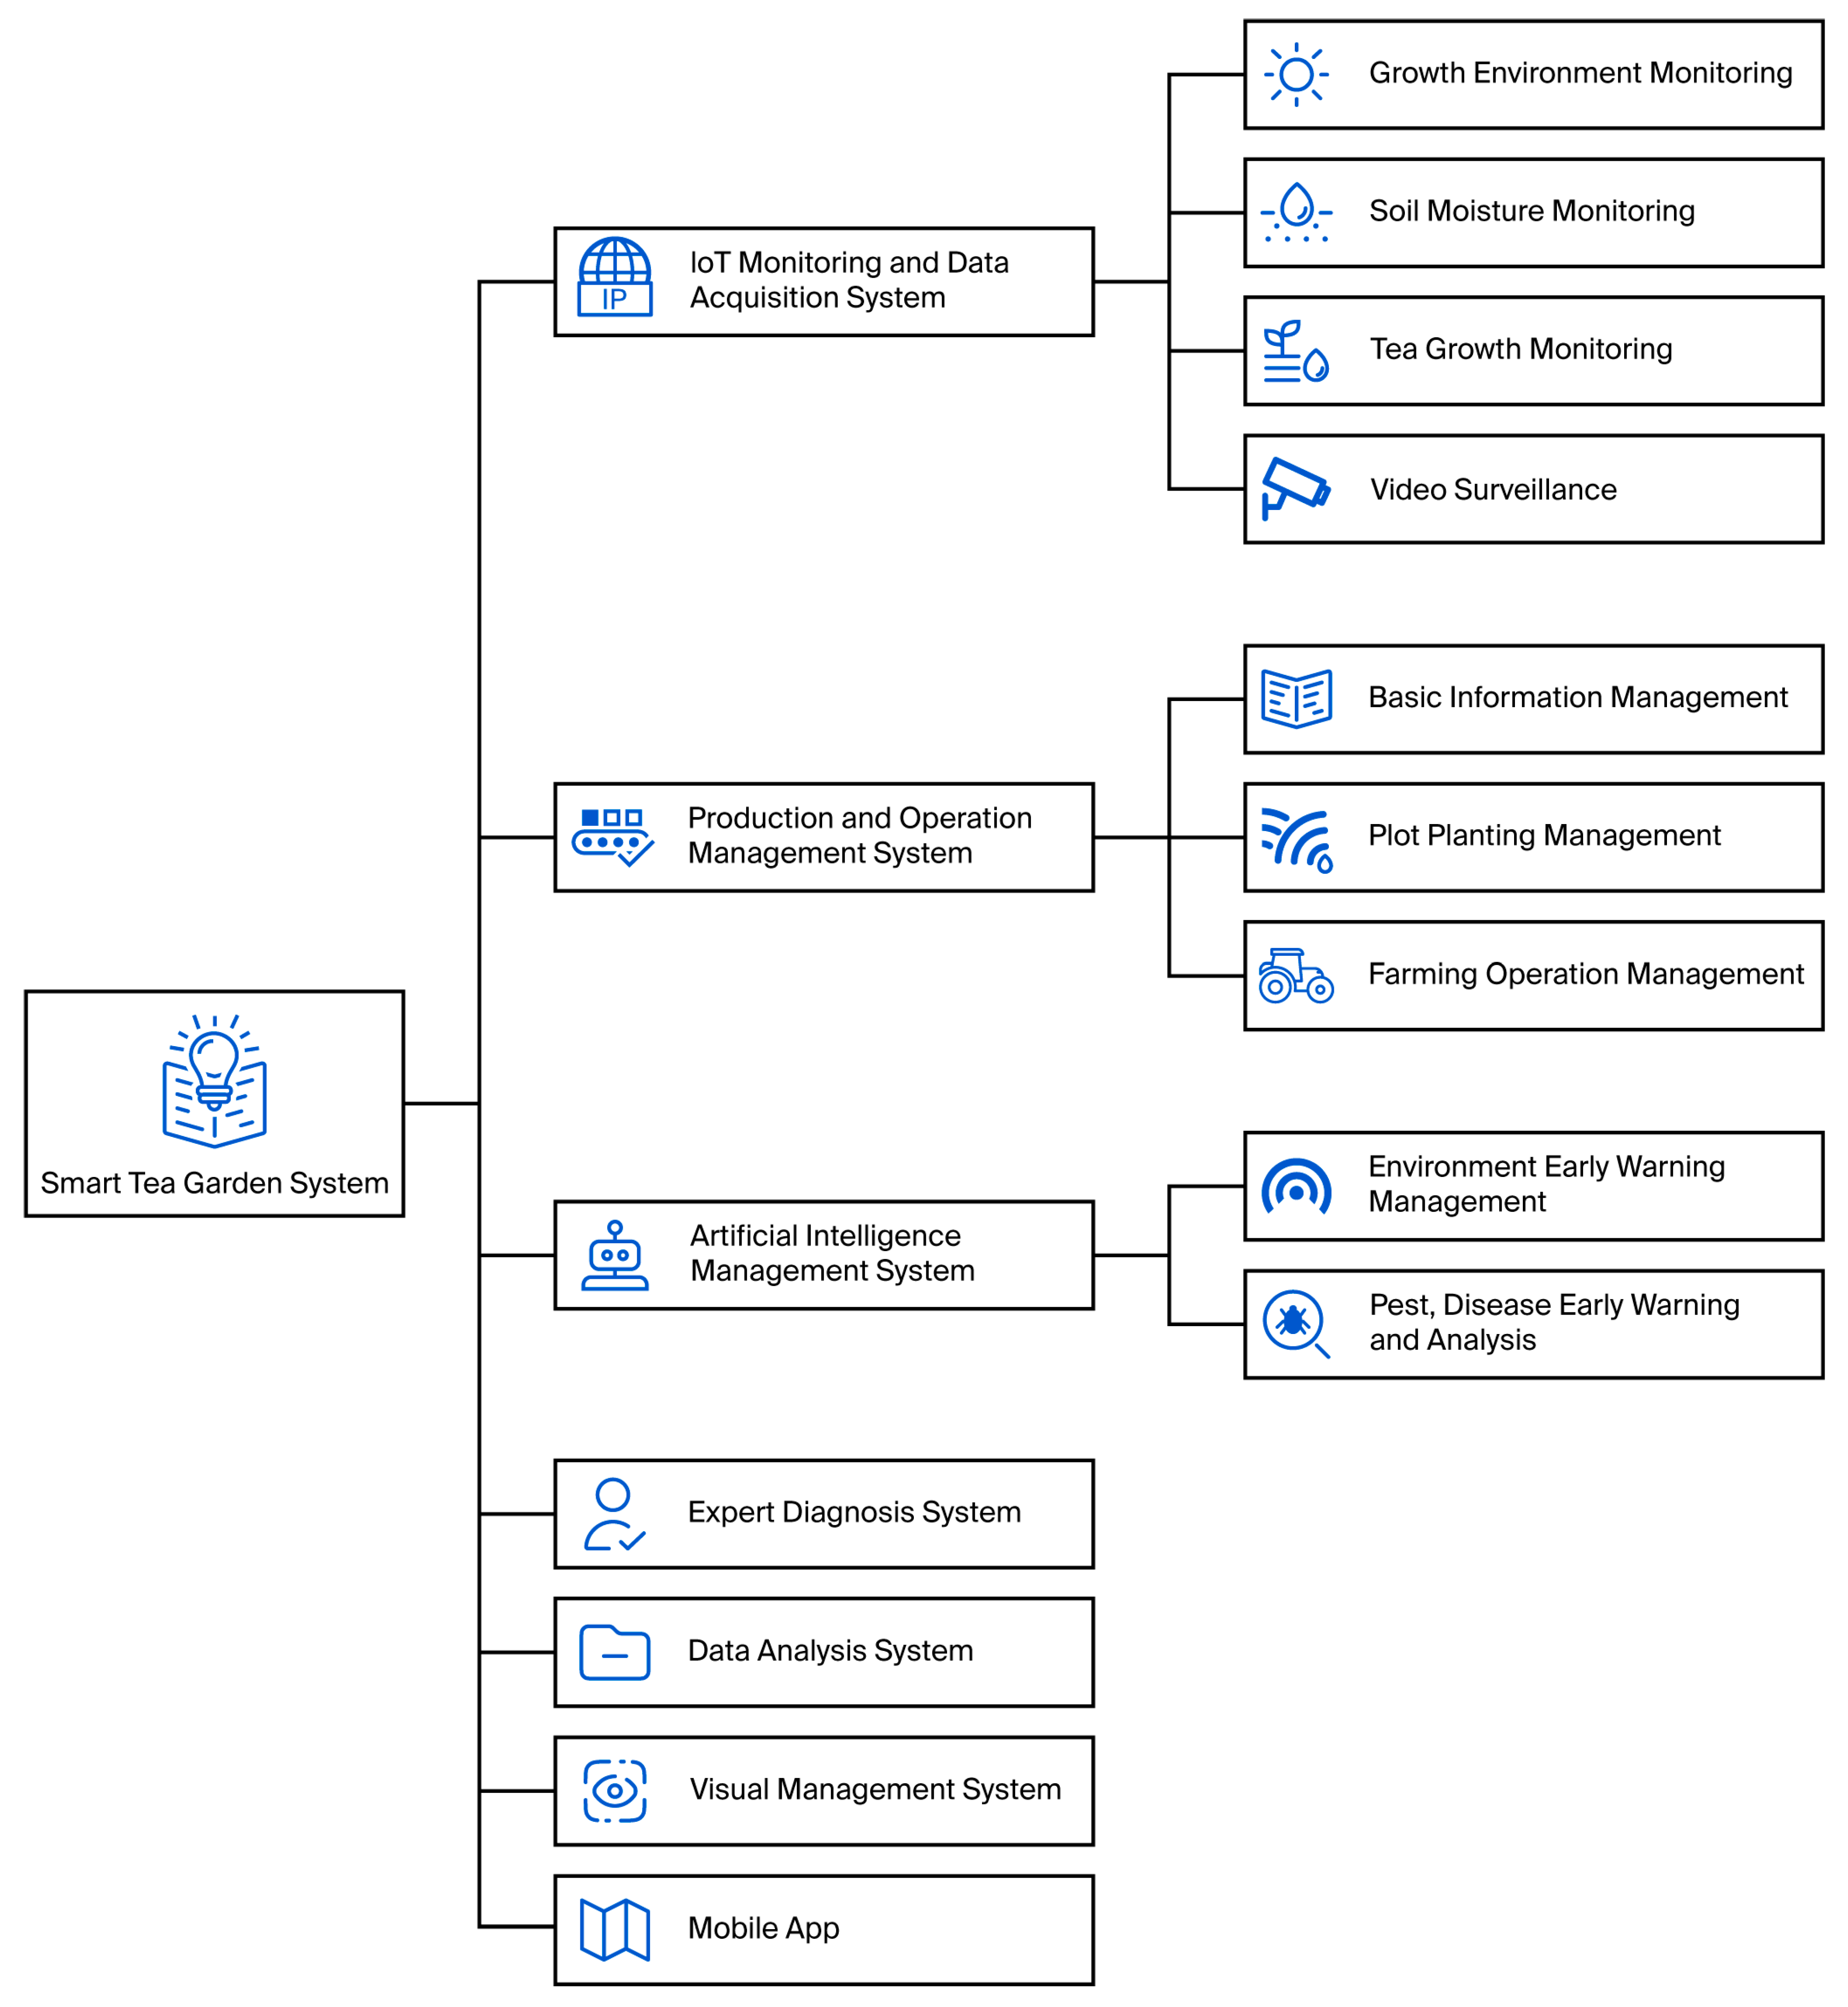
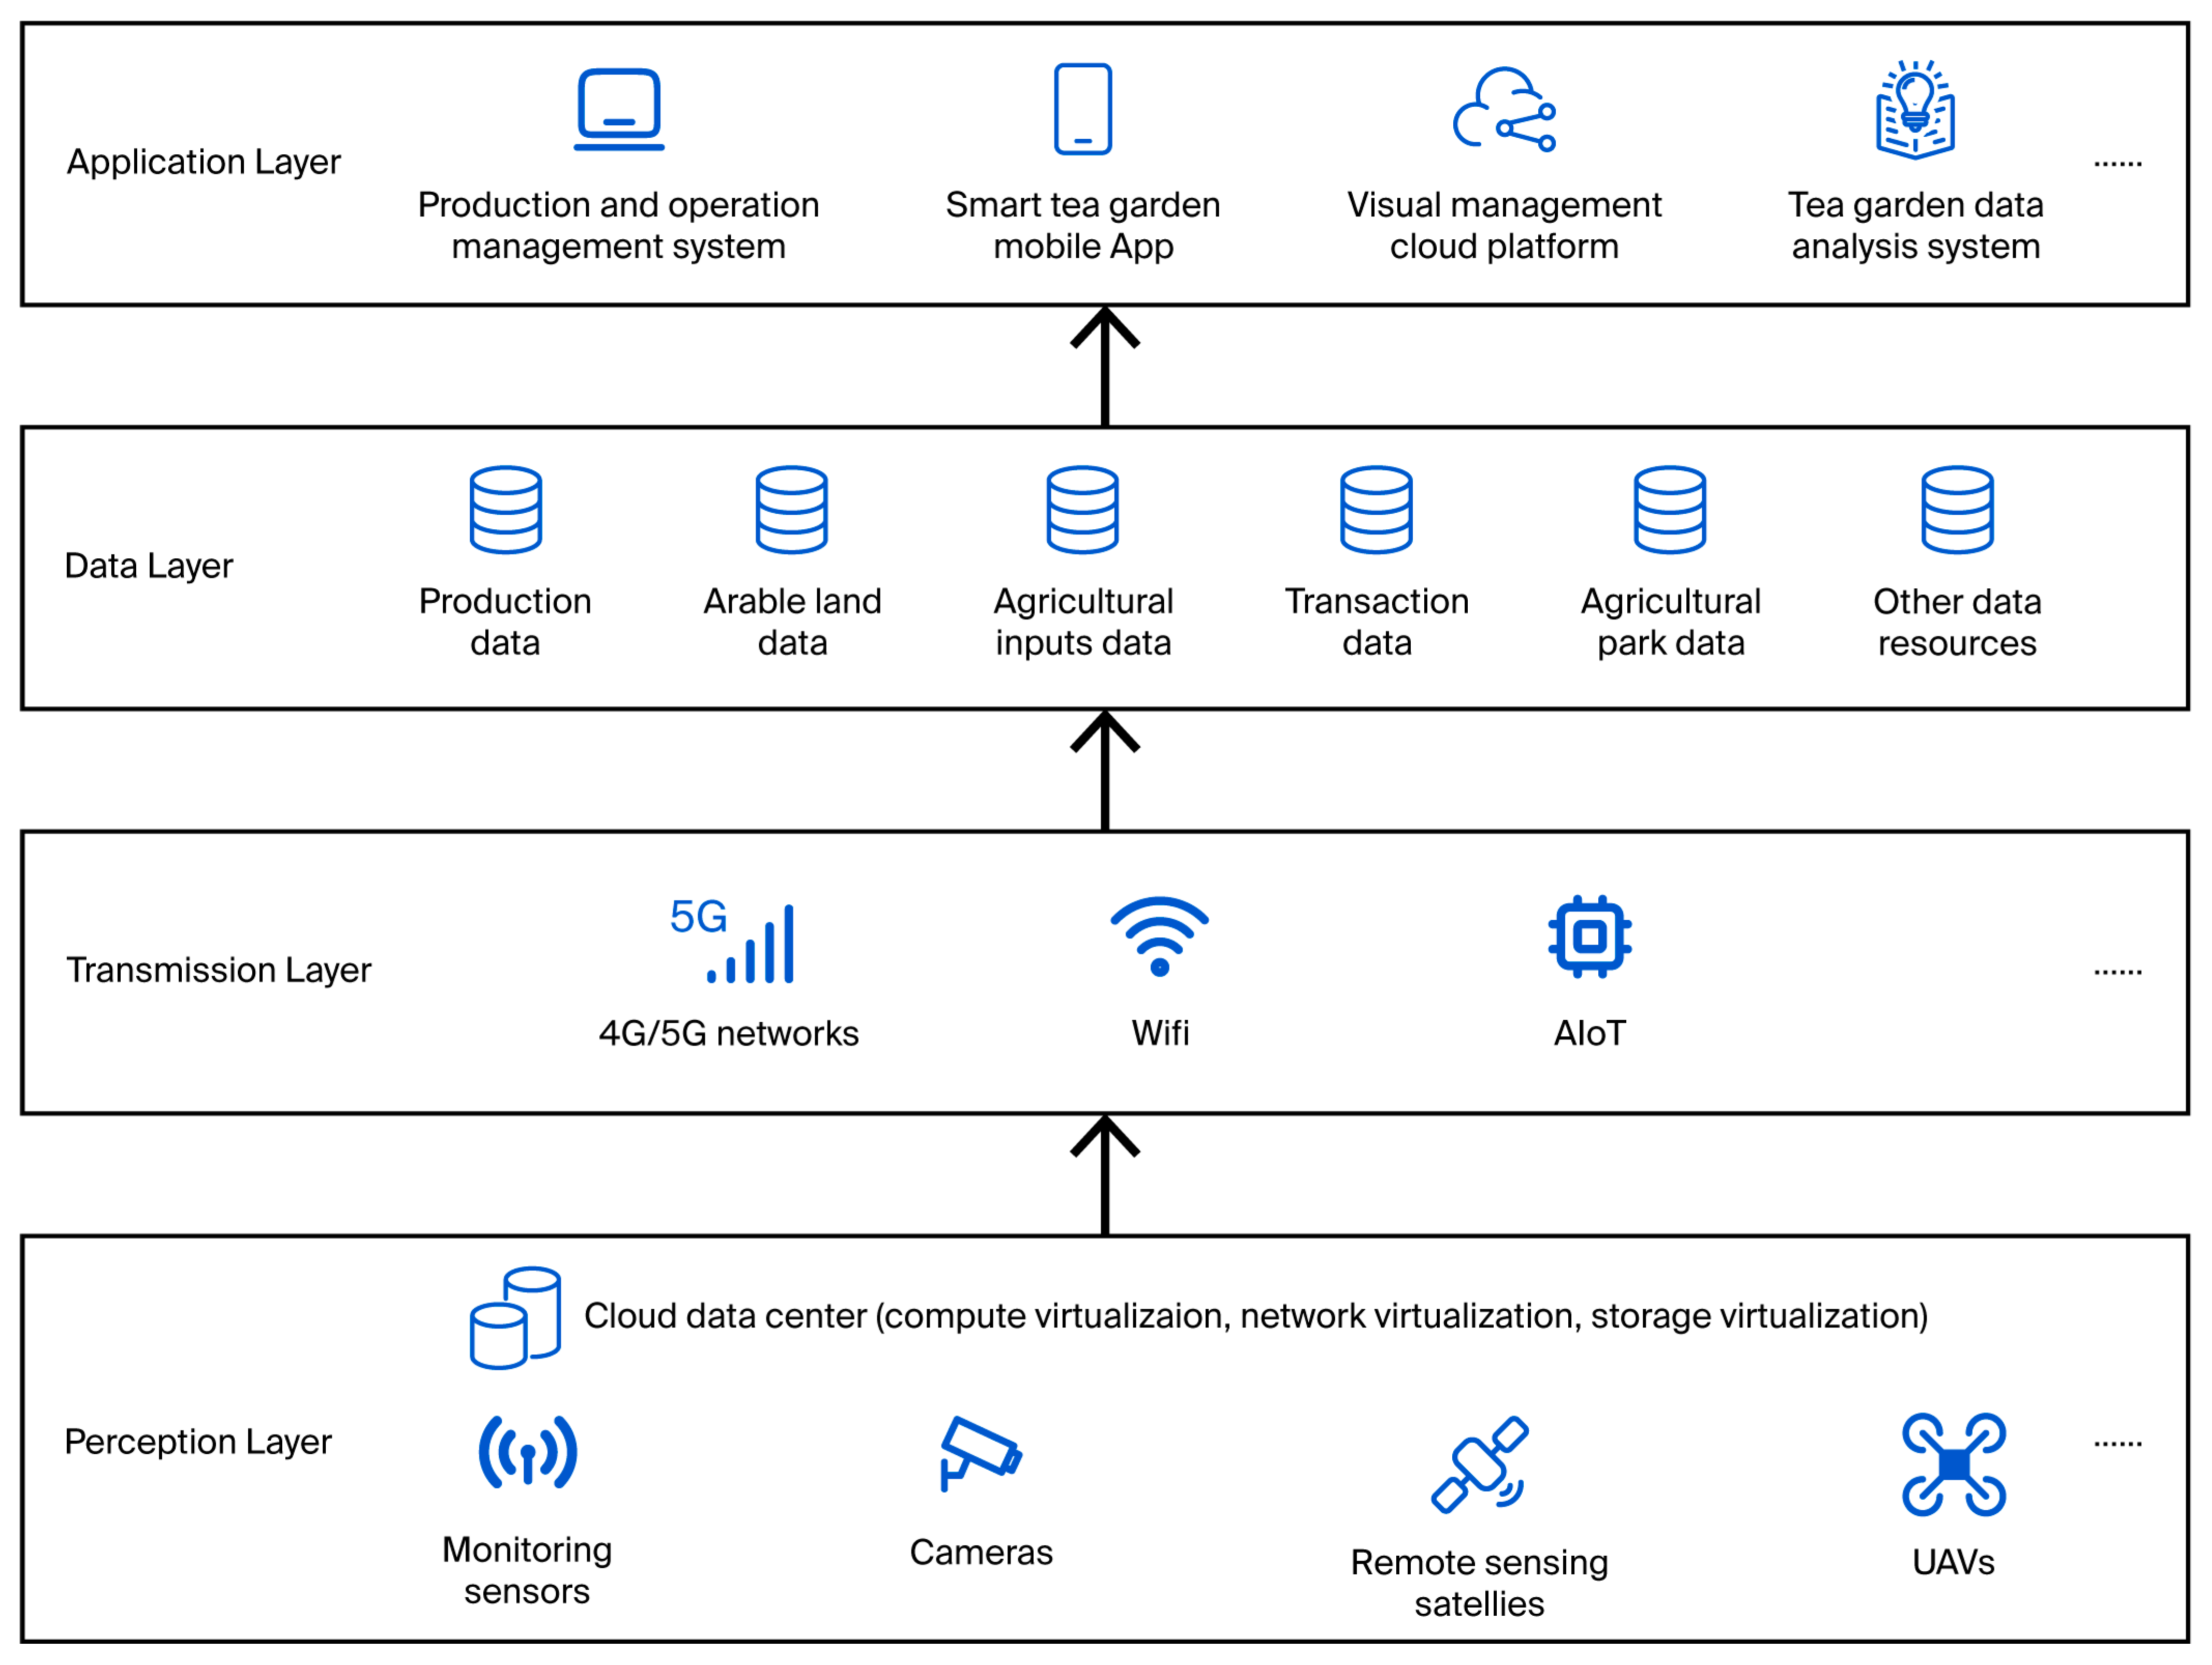
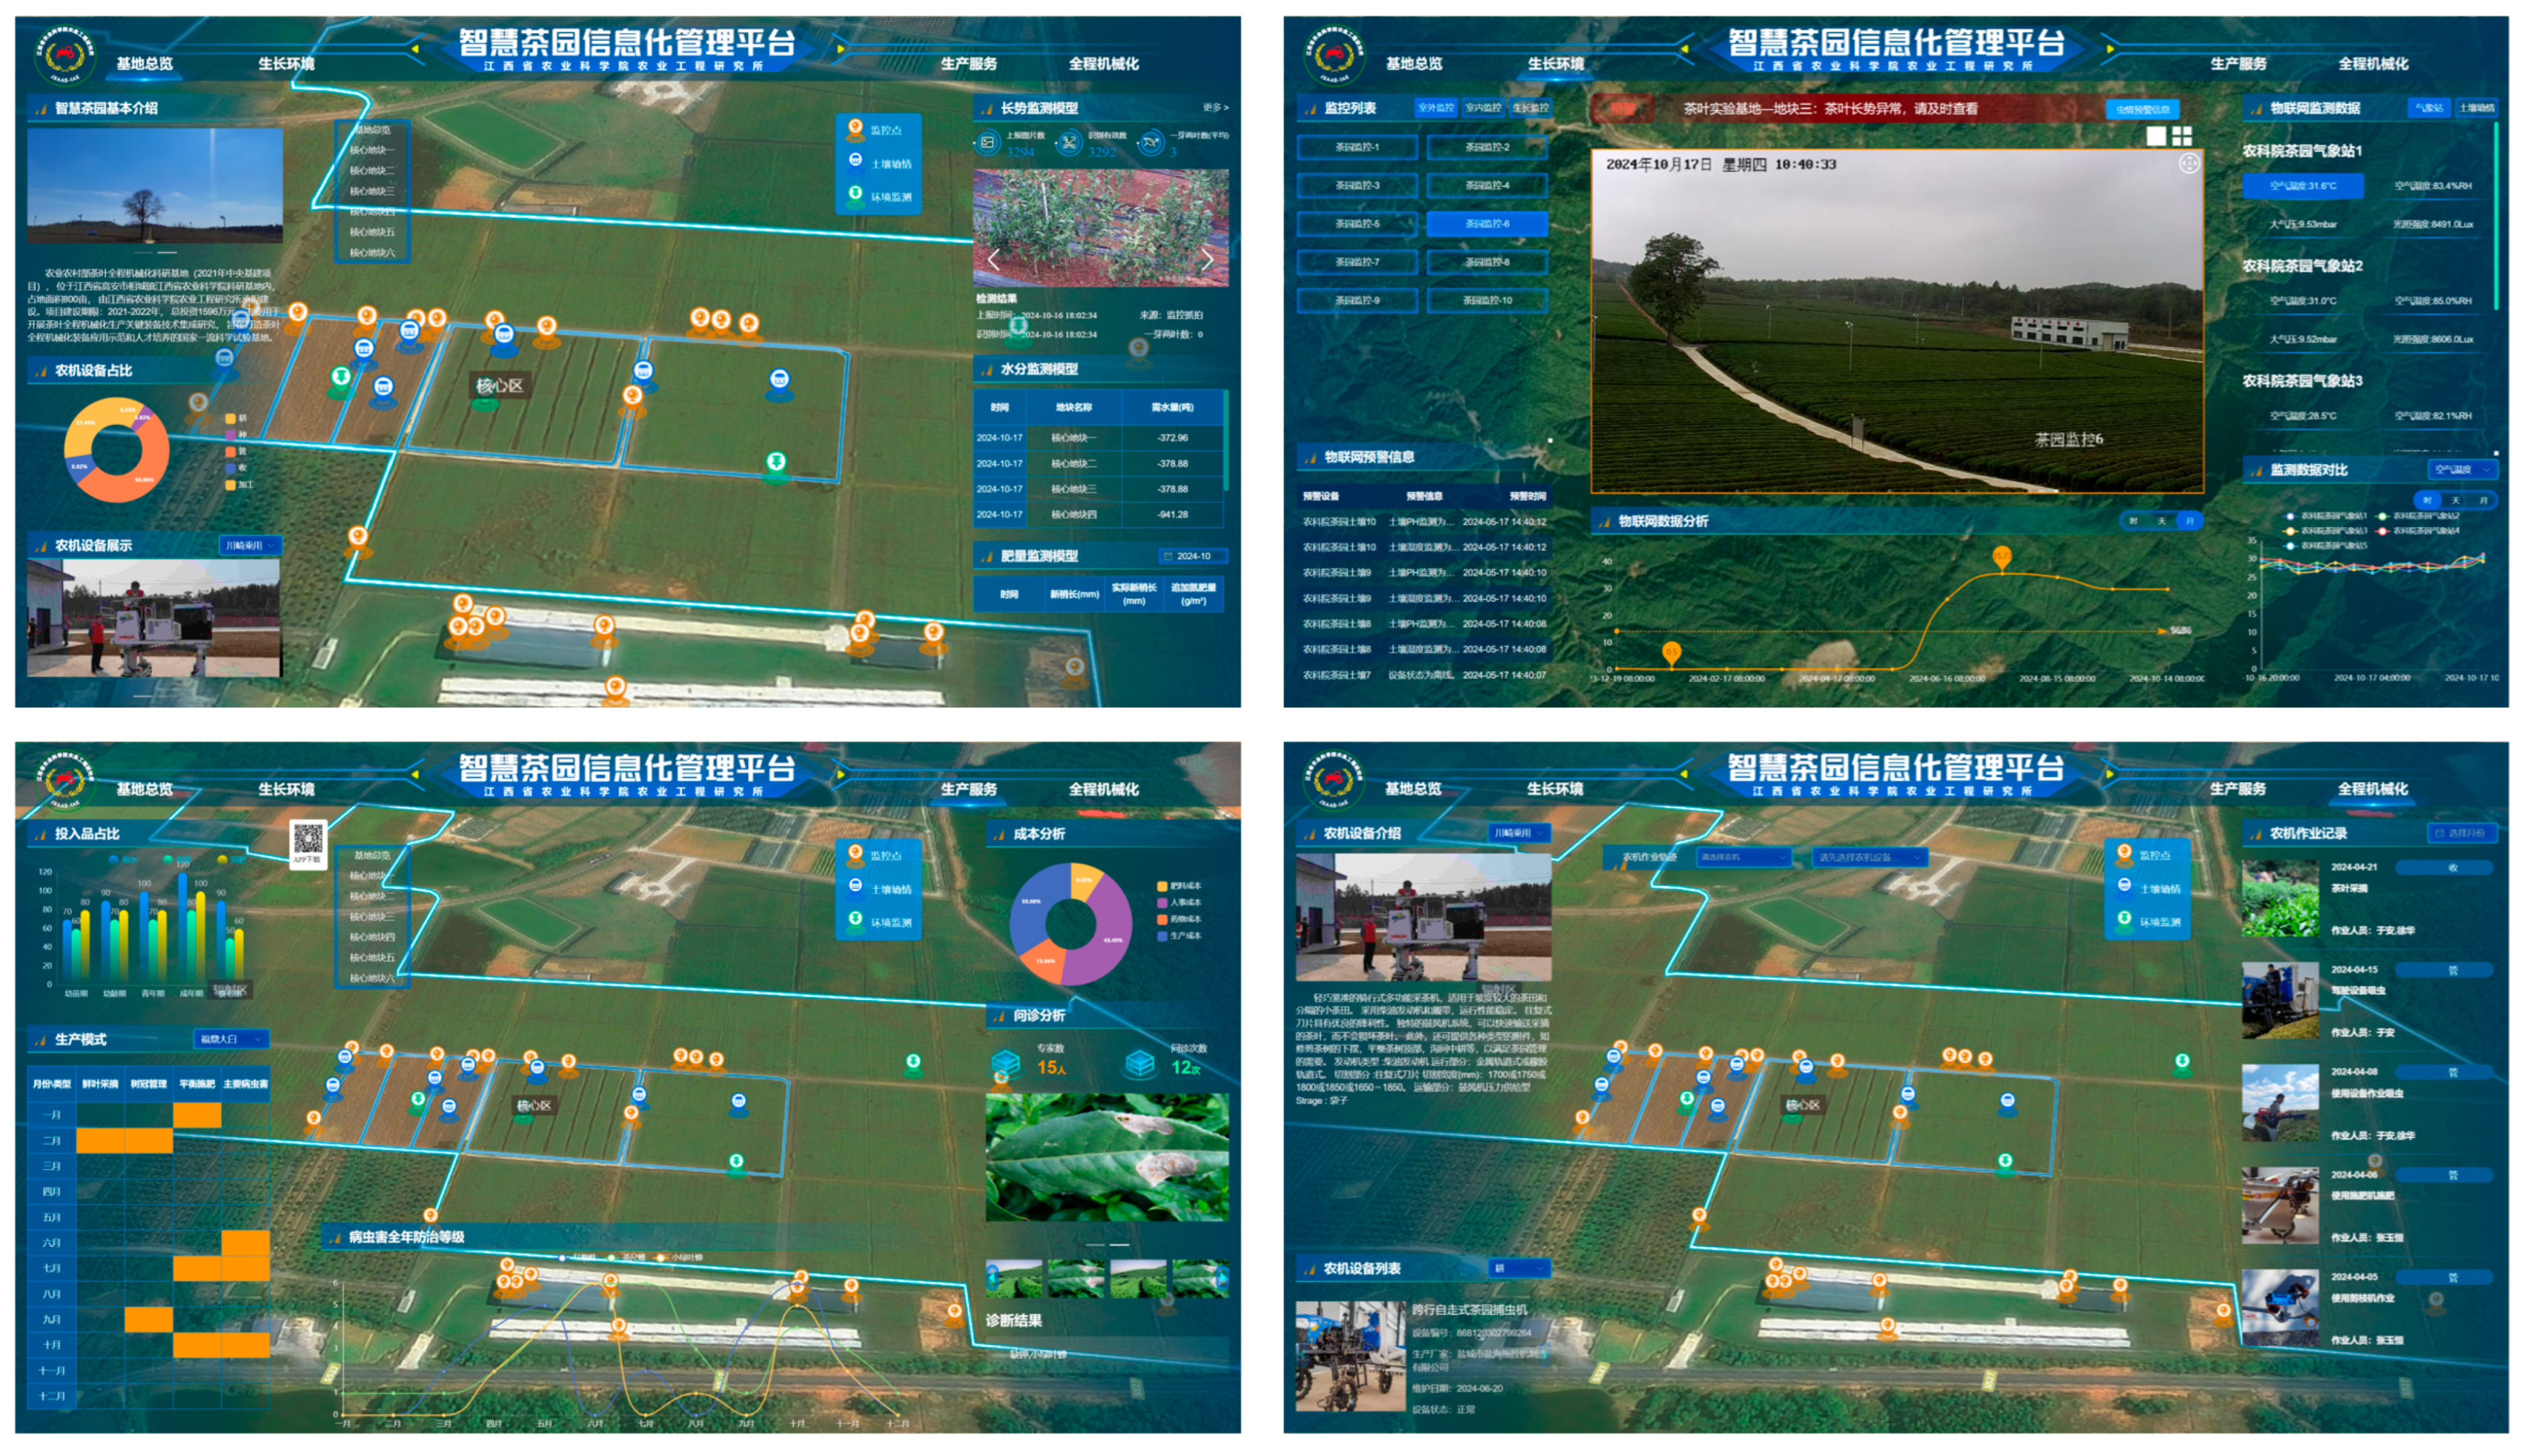
To realize the transformation of tea garden irrigation from experience-driven to data-driven management, an intelligent collaborative management system covering the entire workflow of “perception–diagnosis–decision–execution” was constructed, with a layered design including seven core functional modules: multi-modal sensing and data fusion, production and operation optimization, intelligent warning and prevention, expert knowledge service, big data analysis and decision support (core layer), visualization and human–computer interaction, and mobile collaboration and execution control. The big data analysis and decision support layer was the core for operating the Phenology-Aware Collaborative Decision-Making model, which automatically identified agronomic disturbances such as plucking and dynamically generated target soil moisture commands by analyzing growing degree days (GDDs) and shoot density (SD) (as shown in
Figure 2,
Figure 3 and
Figure 4).
The hardware deployment of the system adheres to the principles of “low power consumption and high reliability.” The field execution terminal utilizes a high-performance embedded controller, which integrates the logic for the improved Smith predictor and the adaptive Sliding Mode Control algorithm. Regarding the communication link, a hybrid networking mode combining LoRa with 4G/5G is employed to ensure stable data transmission across the complex hilly terrain. The technical parameters for selected critical sensing equipment (manufactured by Weihai JXCT Electronic Technology Co., Ltd., Weihai, China) are summarized in
Table 2.
3.2. Tea Tree Phenological Perception and Collaborative Decision-Making Model
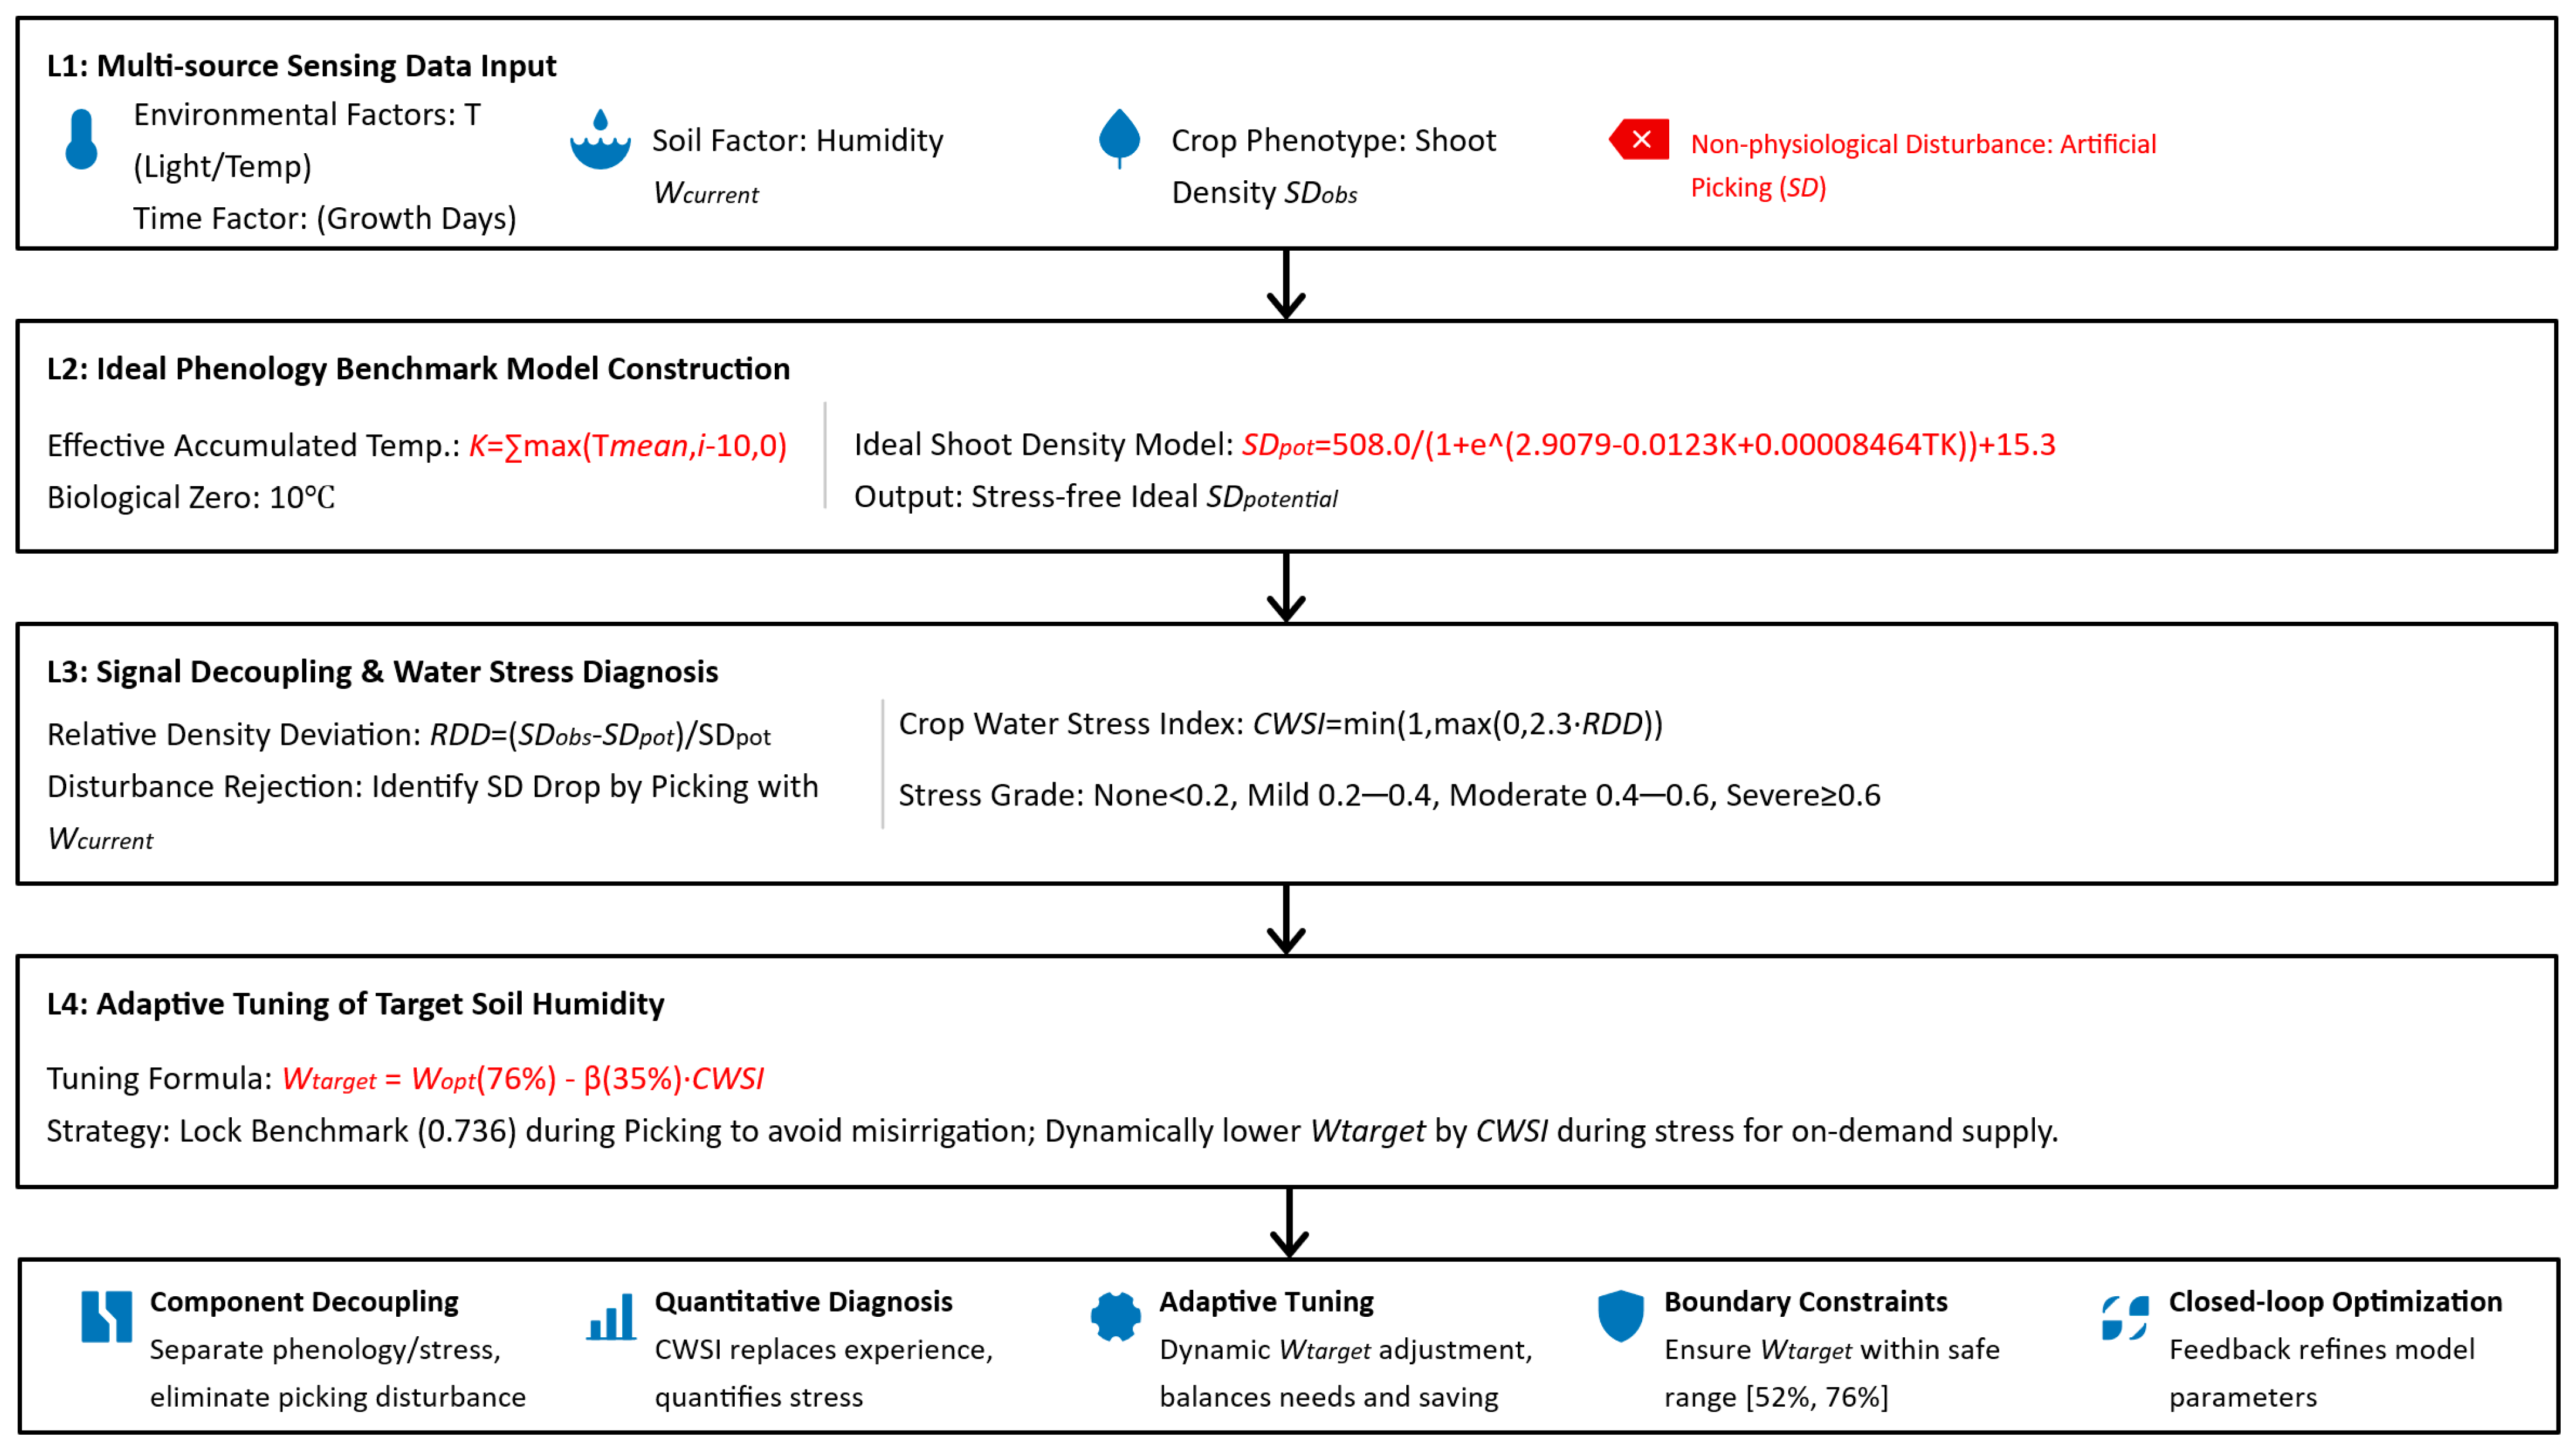
To solve the problem of misjudgment in water deficit diagnosis induced by violent fluctuations in canopy biomass during the picking period of tea gardens, this study constructed a phenological perception collaborative decision-making framework. The core logic of this framework is to decouple the observed shoot density to distinguish physiological water shortage from non-physiological biomass loss. Its overall framework is shown in
Figure 5.
3.2.1. Construction of the Phenological Benchmark Growth Model
The growth of tea trees is affected by the nonlinear coupling of environmental thermal momentum (temperature and time) and soil water environment [
27]. Based on the three-factor collaborative model of “temperature, time, and moisture” [
28,
29], the reference model expression of this study is as follows:
where
Y denotes the relative growth of tea trees (g·g
−1), characterizing the current growth vigor of tea trees;
T denotes the growth time (d), defined as the cumulative number of days from the start of shoot sprouting;
W denotes the relative soil moisture (%), expressed as a percentage of the maximum field capacity;
K denotes the effective accumulated temperature (°C), a cumulative heat unit calculated based on the biological zero temperature (10 °C) [
20], and it is calculated using the following formula:
In the above equation, Tmean,i denotes the daily mean air temperature on the i-th day.
Within this model, Ymax(W) characterizes the limiting envelope of water availability on growth potential, whereas f(T,K) reflects the temporal modulation effect of phenological progression on growth rate. By conducting first-derivative extremum analysis of Ymax(W) with respect to W, the optimal soil moisture threshold for tea plant growth Wopt ≈ 76% and the critical lower limit for growth cessation Wmin ≈ 52% are derived. These two critical thresholds constitute the physical constraint boundaries for the subsequent irrigation control strategy.
3.2.2. Derivation of the Ideal Phenological Benchmark Shoot Density Model
Shoot density (
SD, unit: pieces/m
2) is an intuitive mapping of tea tree growth potential in the canopy phenotype, which is significantly positively correlated with the relative growth
Y (
SD ∝
Y). To eliminate the background interference of phenological succession on water diagnosis, it is necessary to construct an ideal phenological benchmark model under the condition of no water stress:
Based on the measured data of the tea garden, the potential growth
Ypotential and the ideal shoot density
SDpotential are fitted, and the phenological benchmark growth model is finally constructed:
3.2.3. Crop Water Stress Index and Decoupling Algorithm
Based on the dynamic benchmark, the Relative Density Deviation (
RDD) is defined as a diagnostic operator:
To eliminate non-physiological signals (such as picking), a correction logic based on real-time soil moisture
Wcurrent is introduced. When
RDD < 0, it is mapped to the normalized Crop Water Stress Index (
CWSI):
where α represents the sensitivity coefficient, taking the value of 2.3 after field calibration. The stress levels are divided according to the
CWSI value range, i.e., no stress (<0.2), mild stress (0.2~0.4), moderate stress (0.4~0.6), and severe stress (≥0.6), achieving a leap from qualitative empirical judgment to quantitative data diagnosis.
The fundamental biological assumption underlying this decoupling mechanism is that canopy biomass loss induced by agronomic practices (such as manual plucking) and true physiological water stress exhibit fundamentally different time-domain characteristics and physical correlations. Plucking causes a sudden, step-change reduction in observed shoot density, which is physically independent of the slow-changing dynamics of soil moisture depletion. Conversely, actual water stress manifests as a gradual divergence of the observed shoot density from the ideal phenological curve, which is strictly correlated with a continuous decline in root-zone soil moisture.
Therefore, the collaborative decision framework utilizes real-time soil moisture as a physical cross-validation constraint. When a sharp negative RDD is detected, if Wcurrent remains above the critical physiological safety threshold, the diagnostic operator actively rejects this ‘false stress’ signal, logically attributing the biomass loss to non-physiological harvesting rather than drought. This logic ensures that the CWSI accurately reflects genuine physiological needs.
3.2.4. Adaptive Decision-Making and Execution Strategy
The system dynamically adjusts the target soil moisture
Wtarget according to
CWSI to restore growth potential with the minimum water consumption:
where
β = 35% denotes the moisture adjustment gain. This mechanism ensures that a high target value close to
Wopt is set for rapid compensation under severe stress, while a lower target value is set to save water under mild stress, and
Wtarget ∈ [
Wmin,
Wopt] is always guaranteed. To ensure the physiological reliability of these core parameters, α and
β were calibrated using historical data collected from 20 fixed monitoring points within the standardized planting zone of the Gao’an experimental base. Specifically, continuous canopy shoot density observations and root-zone soil moisture data spanning three growth cycles (from 2023 to 2025) were acquired. The optimal values of α = 2.3 and
β = 35% were derived utilizing the least squares fitting method to minimize the deviation between the model’s simulated stress responses and the actual physiological water stress observed in the field. This rigorous calibration ensures the model accurately filters out non-physiological noise during the target soil moisture (
Wtarget) dynamic tuning process.
3.2.5. Dynamic Tuning of the Target Soil Moisture
Based on the above decoupling results, the decision-making layer no longer adopts the traditional fixed-threshold method, but dynamically tunes the target soil moisture Wtarget through the CWSI operator: during the normal growth period, Wcurrent slides slightly with the phenological progress to meet the physiological water demand at different stages; during the picking interference period, when a sharp drop in SDobserved is monitored but Wcurrent is in a reasonable range, the model identifies it as a “non-physiological interference”, automatically ignores the negative feedback deviation, and locks Wcurrent near the physiological benchmark value, thereby suppressing misirrigation; during the water stress period, the system triggers the AG-PSTC control program for precise water replenishment only when the decoupled water stress component exceeds the threshold. Through the method of “algorithm eliminating interference”, this collaborative decision-making framework upgrades irrigation decision-making from “perceptual data” to “perceptual semantics”, improving the robustness of the system.
3.3. Dynamic Modeling of the Irrigation Process
The premise of precise irrigation is to establish a mathematical model that can reflect the dynamic changes in soil moisture and the characteristics of pipeline transportation. The tea garden irrigation system is not an immediate response system, but a complex dynamic process with significant time delay and inertia.
3.3.1. First-Order Inertial Model of Soil Moisture Response
Although water infiltration in unsaturated soil is inherently a complex, high-order, and strongly nonlinear dynamic process in agricultural engineering, deploying precise distributed-parameter models (e.g., the Richards equation) imposes an unacceptable computational burden on embedded controllers. To facilitate real-time control system design, this study aligns with widely validated methodologies in recent smart irrigation research by abstracting the dynamic change in tea garden soil moisture as a nominal first-order inertial link with a pure time delay. By ignoring extreme non-uniform infiltration, the unmodeled high-order dynamics are systematically treated as bounded uncertainties. Consequently, when the solenoid valve opens and water infiltrates the sensor monitoring zone via emitters, the dynamic response of soil moisture
W(
s) to the irrigation volume
Q(
s) is governed by the principles of energy conservation and infiltration diffusion, yielding the following nominal transfer function:
where
K represents the system gain, reflecting the amplitude of soil moisture change caused by the unit pulse irrigation volume;
T represents the inertial time constant, representing the rate of soil water infiltration and reaching a steady state, which is affected by soil porosity, initial water content, and other factors.
3.3.2. Analysis of the Large-Time-Delay Characteristic of Pipeline Transportation
Due to the hilly terrain characteristics of the tea garden at Jiangxi Academy of Agricultural Sciences tea base, there is a long physical distance between the pump station and the emitters of each branch. There is an obvious mechanical migration time when water is pressurized from the pump station, passes through the main pipe, branch pipe, and capillary pipe, and is ejected from the dripper. In addition, soil moisture sensors also have a sampling period and infiltration response delay when sensing water fluctuations.
Considering the pipeline migration time delay and sensor lag comprehensively, the pure time delay of the system is defined as τ. Combined with the first-order inertial link above [
30,
31,
32], the dynamic model of the tea garden irrigation process can be uniformly expressed as a first-order system with pure time delay:
In the simulation and experimental parameter setting of this study, the nominal gain K = 0.8, time constant T = 30 s, and nominal pure time delay τ = 5 s.
3.3.3. Description of Nonlinear External Disturbances
In a practical production environment, the system is inevitably subjected to various unpredictable external disturbances
d(
t). Crucially, in this study,
d(
t) is defined as a lumped disturbance term. It includes not only meteorological disturbances (such as severe evapotranspiration driven by high temperatures) and agronomic interference (such as canopy structure changes), but more importantly, it encapsulates the unmodeled high-order dynamics, nonlinear seepage characteristics of the soil, and parameter uncertainties that were simplified in the nominal first-order model. Thus, the state-space expression of the system is described as follows:
where
u(
t −
τ) denotes the control input affected by time delay, and
d(
t) denotes the comprehensive external disturbance term. The coupling of such high-order uncertainty and time delay constitutes the main challenge for the design of control algorithms, requiring the controller to have extremely strong phase compensation and disturbance suppression capabilities.
3.4. Design of the Adaptive Gain Predictive Super-Twisting Sliding Mode Controller
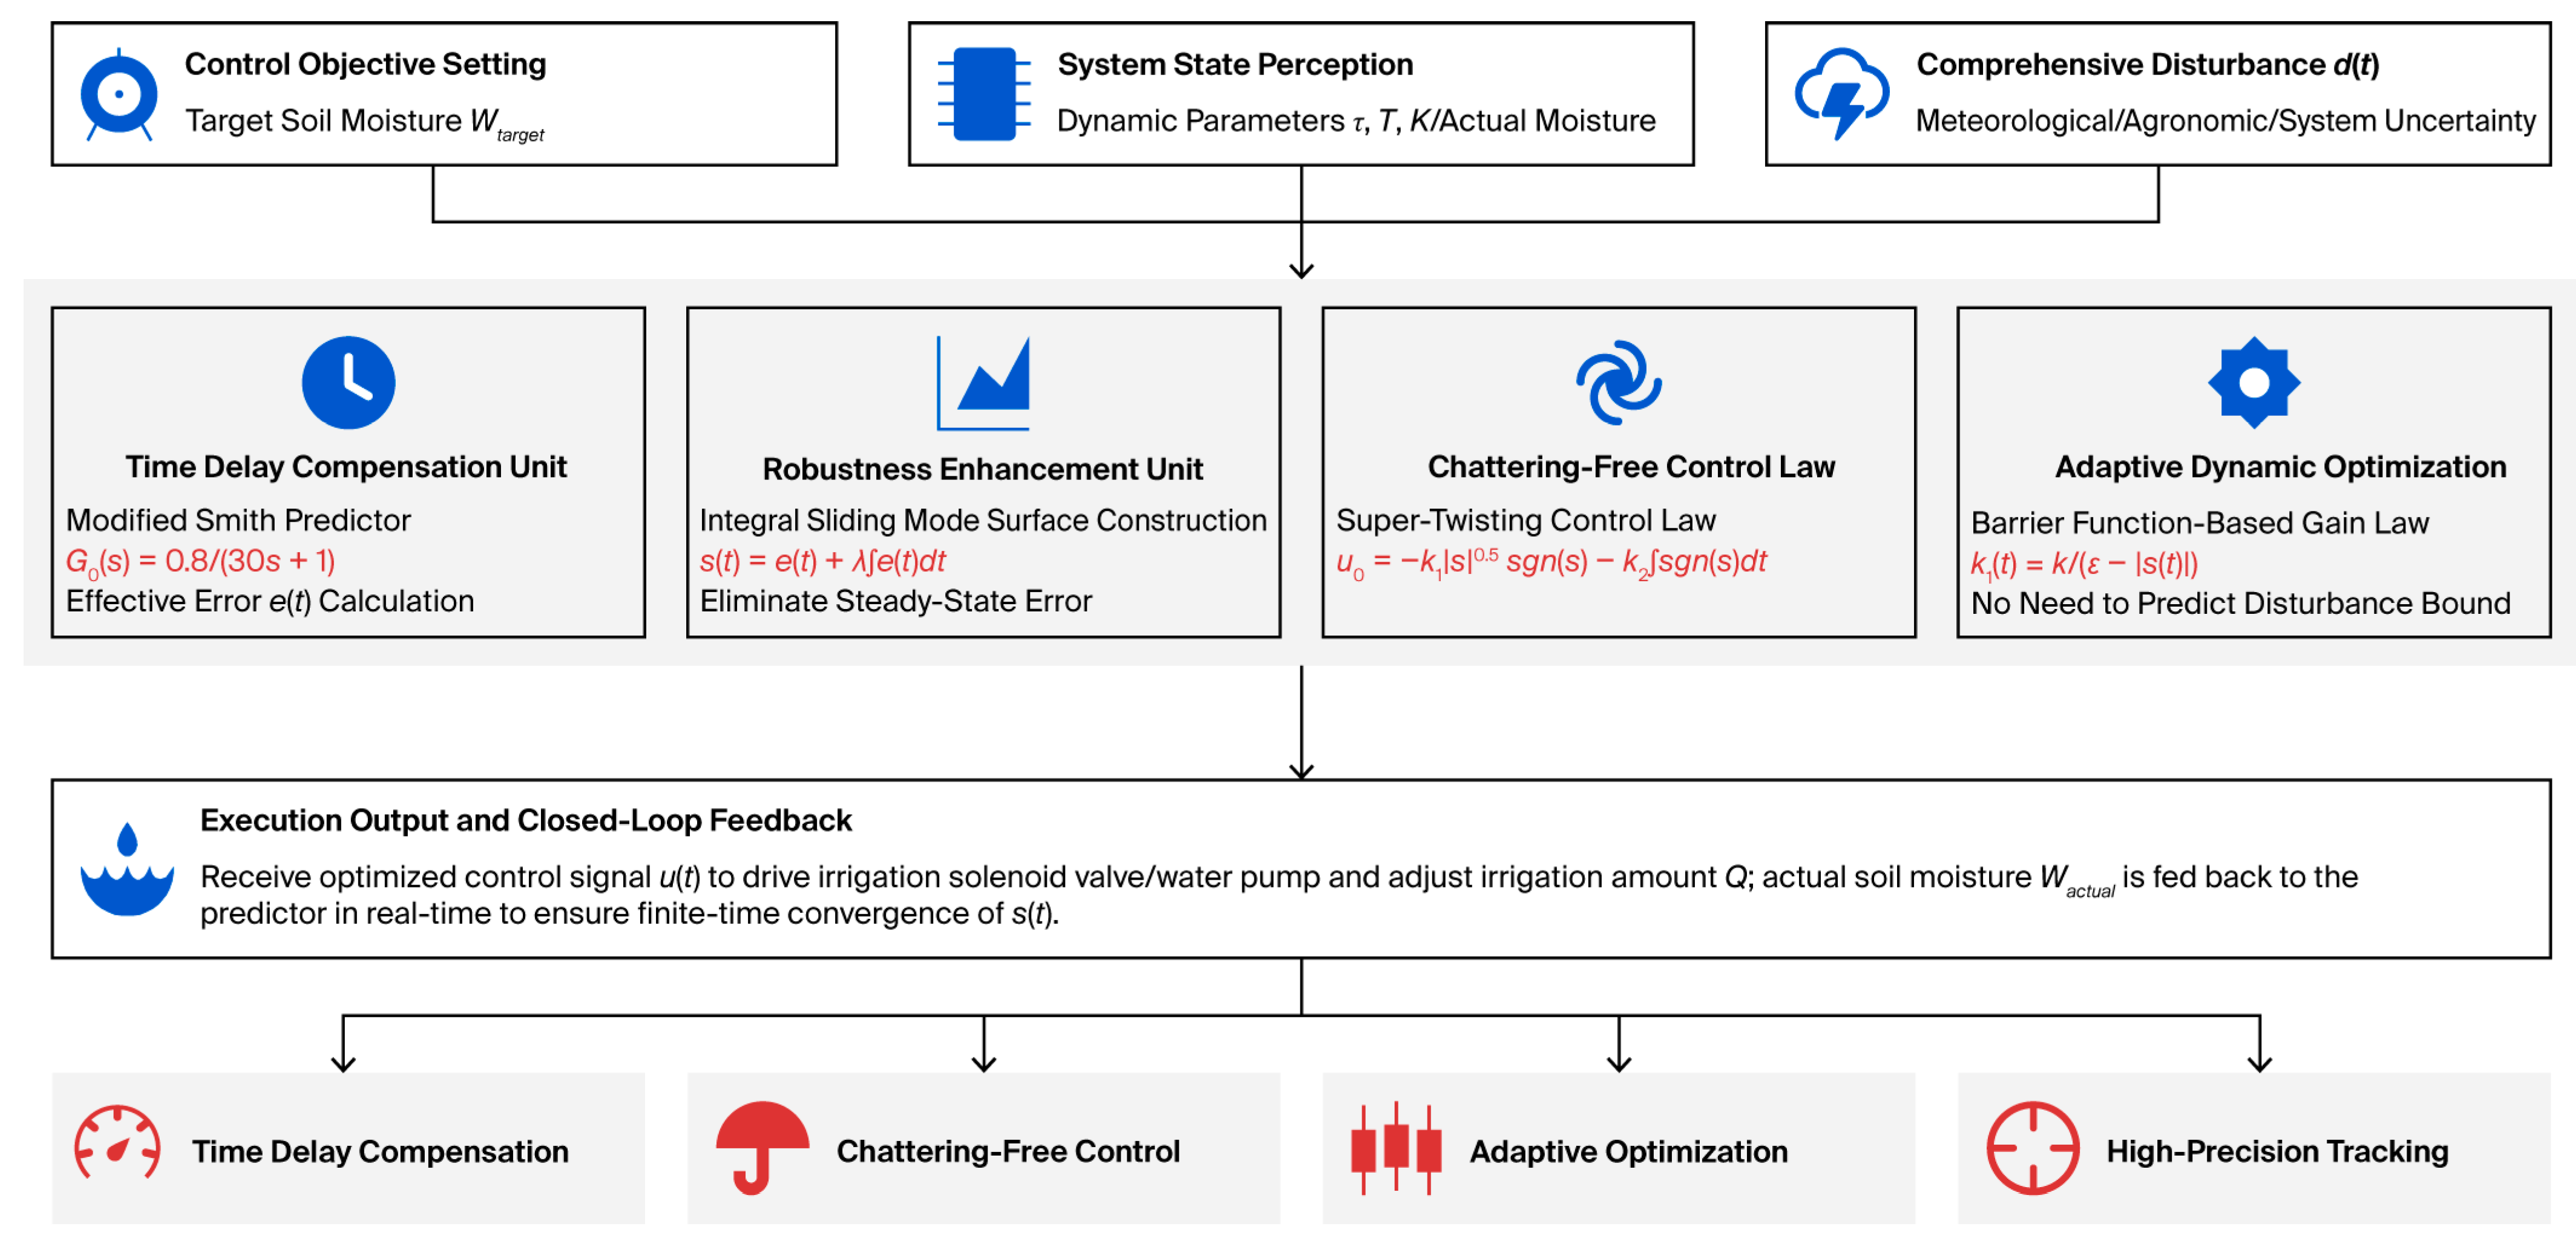
This study proposes an Adaptive Gain Predictive Super-Twisting Sliding Mode Control strategy for resolving the problems of long-distance pipeline transportation time delay, parameter perturbation, and external nonlinear disturbances in the tea garden irrigation system. The controller consists of four parts: an improved Smith predictor, an integral sliding mode surface, a super-twisting control law, and a barrier function-based adaptive gain law. Its overall algorithm framework is shown in
Figure 6.
3.4.1. Improved Smith Predictor
Due to the long and widely distributed irrigation pipelines in tea gardens, the system has significant pure time-delay characteristics (
e−τs), which reduce the system phase margin and easily cause the instability of traditional feedback control. To eliminate the influence of pure time delay on the closed-loop system performance, this study introduces an improved Smith predictor to construct an internal prediction model [
20].
Let the transfer function of the actual controlled object be
G(
s)
e−τs, where
G(
s) denotes the transfer function of the non-delayed part and τ denotes the pure time delay. An ideal model delay
is constructed to predict the future state of the system. The effective error signal
e(
t) received by the controller is defined as follows:
where
r(
t) represents the set value of the target soil moisture;
y(
t) represents the output of the non-delayed prediction model;
ydelay(
t) represents the output of the delayed prediction model; and the term [
y(
t) −
ydelay(
t)] constitutes the estimated compensation for model mismatch and external disturbances. This structure not only achieves the phase lead compensation for the time-delay link but also corrects the error caused by model mismatch through the feedback branch.
3.4.2. Construction of the Integral Sliding Mode Surface
To eliminate the steady-state error of the system and enhance the robustness of the control system to parameter fluctuations, an integral sliding mode surface
s(
t) is selected. Compared with the traditional linear sliding mode surface, the integral sliding mode surface can ensure that the system enters the sliding mode motion stage from the initial moment and improve the response speed. The sliding mode function is defined as follows:
where λ > 0 denotes the integral gain coefficient of the sliding mode surface, which mainly determines the speed at which the error state trajectory converges to the sliding mode surface.
3.4.3. Super-Twisting Control Law
The sign function switching term sgn(
s) in traditional first-order Sliding Mode Control causes a high-frequency “chattering” phenomenon, which leads to frequent starting and stopping of executive mechanisms such as solenoid valves and water pumps in tea garden irrigation engineering, resulting in mechanical wear. For this reason, this study adopts the super-twisting algorithm (STA) in the second-order sliding mode to design the control law. By hiding the discontinuous switching term inside the integral term, STA obtains a continuous control signal while retaining the strong robustness of Sliding Mode Control [
26].
The designed control input
u(
t) consists of two parts:
The integrated control law expression is as follows:
where
k1 and
k2 are the control gains. This algorithm can ensure that the sliding mode variable
and its derivative
converge to zero in finite time, thus achieving the accurate tracking of the target moisture and the protection of the executive mechanism.
3.4.4. Barrier Function-Based Adaptive Gain Law
In the actual tea garden environment, the boundary of external disturbances (such as sudden light changes and soil heterogeneity) is often unknown and time-varying. The fixed gains k1 and k2 balance the requirements of anti-disturbance performance and chattering suppression with difficulty: a very small gain cannot suppress large disturbances, while a very large gain aggravates chattering.
For this reason, an adaptive law based on a barrier function is introduced to dynamically adjust the control gain with the size of the error. The error neighborhood ϵ is defined as the preset steady-state error boundary. When the system state is within the boundary (∣
s∣ < ϵ), the adaptive gain
k1(
t) is designed as follows:
where
k > 0 denotes the adjustment constant. When the error ∣
s(
t)∣ approaches the boundary ϵ, the denominator approaches zero, and the gain
k1(
t) increases rapidly, producing a strong control effect to pull the system state back to the steady-state region. When the error is small (∣
s(
t)∣ ≪ ϵ), the gain is automatically reduced, thereby avoiding unnecessary high-gain output, reducing system energy consumption, and suppressing noise.
Through the above design, the AG-PSTC controller can achieve finite-time convergence of the system state and high-precision steady-state maintenance without prior knowledge of the upper bound of disturbances, effectively solving the problem of precise irrigation in complex farmland environments.
3.5. Experimental Design and Evaluation Indicators
To comprehensively evaluate the performance of the proposed smart irrigation scheme in terms of decision-making stability and control accuracy, this study is divided into two stages: software simulation verification and field comparison test.
3.5.1. Simulation Experiment Design
A simulation model was built in the MATLAB/Simulink R2023b environment.
- (1)
Control algorithm comparison design: Traditional PID, Fuzzy PID, Adaptive PID, Model Predictive Control (MPC), traditional Sliding Mode Control (SMC), and a hybrid Smith-SMC algorithm were selected as the benchmarks to compare with the AG-PSTC algorithm proposed in this study. A ±40% time-delay parameter perturbation was introduced in the experiment (the pure time delay τ was adjusted from the nominal value of 5 s to 3 s to 7 s, and the inertial constant was adjusted from the nominal value of 30 to 20 to 40) to verify the robustness of the algorithm. The working condition was set to apply a unit step signal at t = 1 s to verify the dynamic response indicators of the system. At the same time, a Sine Wave signal (amplitude set to 0.2, frequency set to 1 rad/s) was superimposed to verify the anti-disturbance ability of the algorithm.
- (2)
Decision model interference test: A 60-day simulation cycle was set. A cliff-like drop in canopy shoot density (60% drop) caused by picking operations was simulated from the 20th to the 30th day to compare the Wtarget tuning performance of the “fixed-threshold strategy”, the “traditional phenological strategy”, and the proposed “collaborative decision strategy”.
To ensure the simulation environment rigorously mimics real-world agricultural complexities, the applied disturbance parameters were grounded in physical field behaviors. The ±40% time-delay perturbation simulates the severe non-stationary hydraulic lags typical in hilly tea gardens, where elevation variations, pump pressure fluctuations, and pipeline air pockets cause unpredictable water delivery delays. Furthermore, the superimposed Sine Wave noise was explicitly designed to represent the natural diurnal (day/night) periodicity. This continuous harmonic disturbance effectively models both the cyclical fluctuations in crop evapotranspiration rates driven by daily temperature changes and the periodic baseline drift commonly observed in field soil moisture sensors.
3.5.2. Field Test Scheme
Field verification was conducted in June 2025 during the picking season at the Jiangxi Academy of Agricultural Sciences. Rather than a random selection, this specific temporal and spatial window was deliberately designed as an ‘extreme stress test’ scenario. The combination of a typical summer climate (average temperature of 26.11 °C, peak 37 °C) and intensive manual picking operations creates a highly rigorous environment characterized by maximum water loss and severe non-physiological agronomic disturbances. To validate the system’s baseline robustness and anti-interference capabilities under these extreme conditions, soil moisture sensors were deployed at a depth of 20 cm—the primary water absorption layer of the tea tree root zone—ensuring the physiological relevance of the monitoring data. The fully automated test utilized the base’s existing distributed sensor network and smart irrigation executive mechanisms, supported by a hybrid LoRa (5 km transmission, 9.6 kbps rate) and 4G/5G (100 Mbps rate) communication architecture to guarantee stable data transmission across the complex hilly terrain.
3.5.3. Evaluation Indicators
This study adopts the following two types of quantitative indicators to comprehensively evaluate the system:
Maximum overshoot (Mp): It measures the fluctuation degree of the system in the process of reaching the set value.
Mean Absolute Error (
MAE): It is used to evaluate the control accuracy of the system in the steady state, and it is calculated using the following formula:
Adjustment time (ts): The shortest time required for the system to enter and maintain within the ±2% error band of the target value.
Decision fluctuation variance (
): It is used to measure the stability of the target value
Wtarget during the interference period:
The smaller the variance, the less the decision is affected by non-physiological interference such as picking.
Maximum decision deviation (∆Wmax): It is defined as the maximum amplitude of the target value deviating from the ideal benchmark during the interference period. This indicator directly reflects the model’s ability to identify and eliminate “false stress signals”.
4. Results
4.1. Analysis of AG-PSTC Algorithm Performance and Anti-Time-Delay Characteristics
4.1.1. Dynamic Tracking Performance Comparison
Under nominal operating conditions (
K = 0.8,
T = 30,
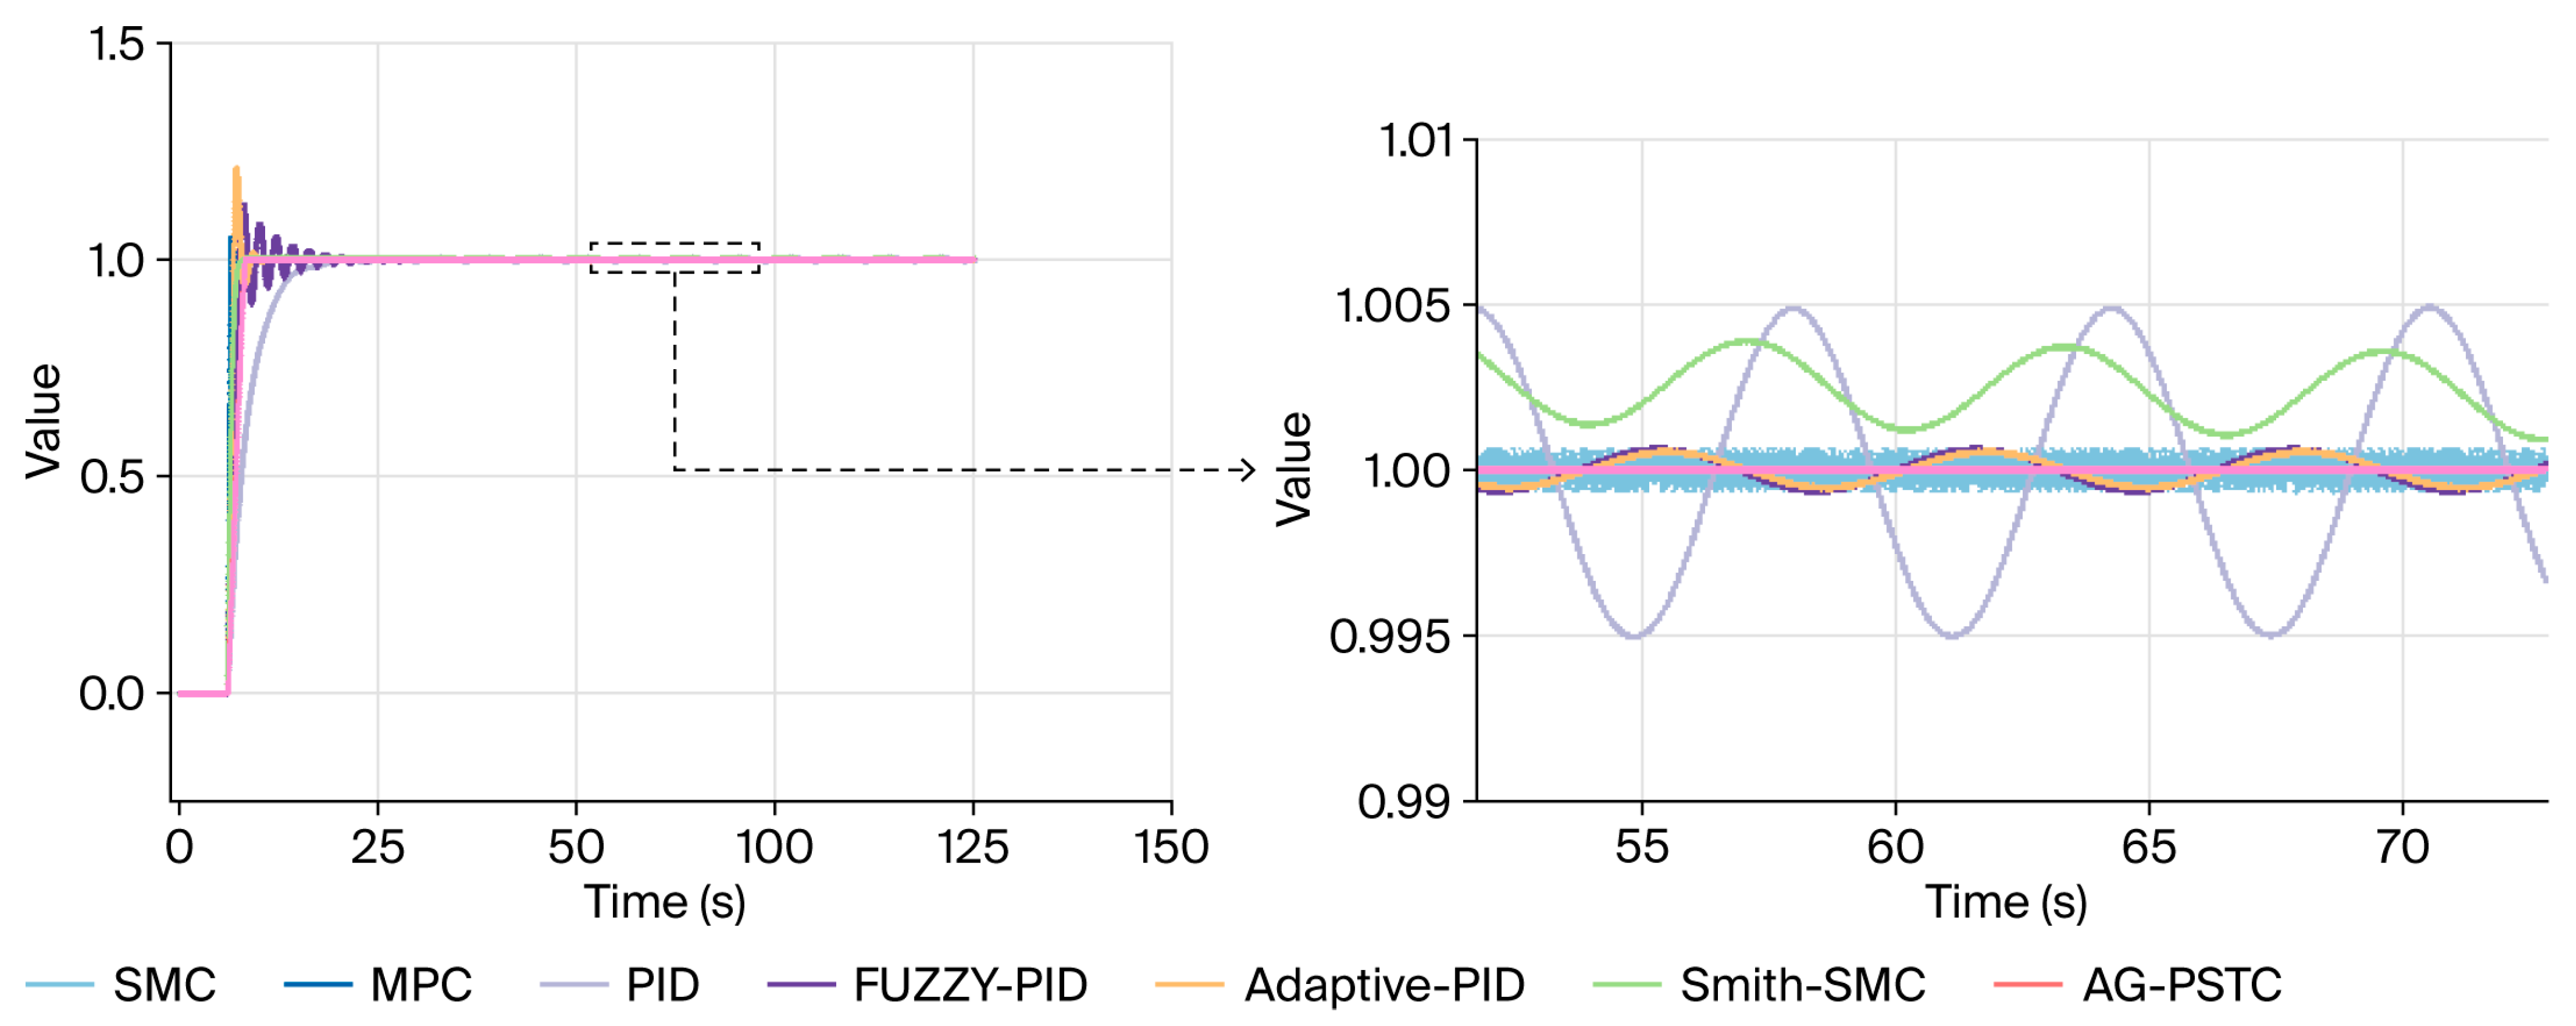
τ = 5), this study compares the dynamic tracking performance of seven control algorithms for soil moisture. The simulation curves are shown in
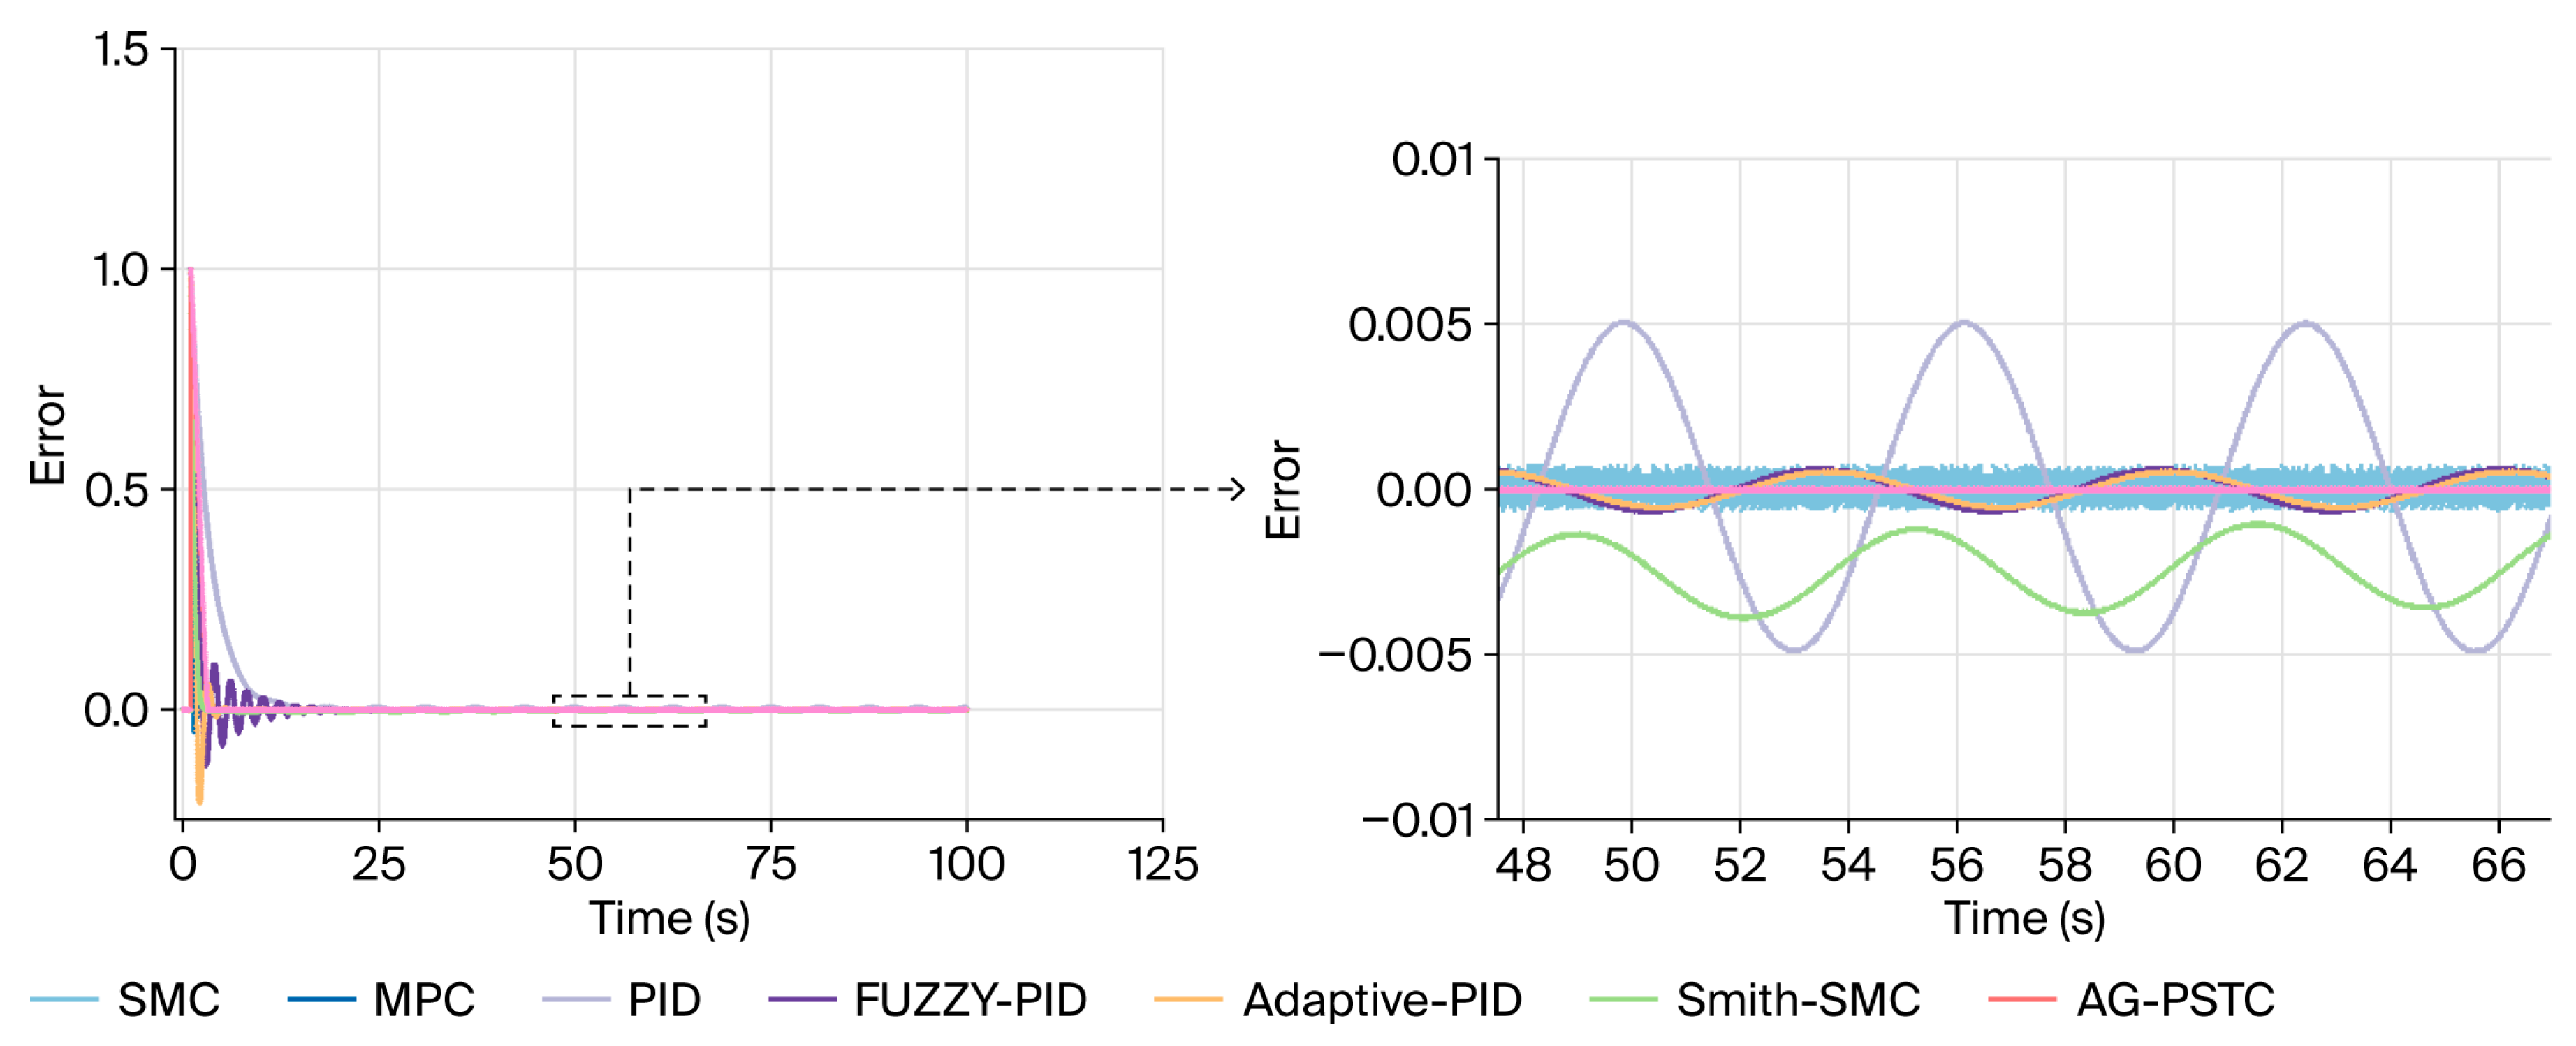
Figure 7, the error fluctuations in
Figure 8, and the quantitative indicators are summarized in
Table 3.
Experimental results demonstrate that the PID controller is most significantly affected by the pure time-delay of the system, with a slow response process and a rise time as high as 5.57 s. Although its steady-state overshoot is small (0.49%), an obvious phase lag occurs near the setpoint, resulting in a long settling time of 16.21 s, which makes it difficult to meet the real-time requirements of precision irrigation. In contrast, although Fuzzy-PID and Adaptive-PID reduce the rise time to 1.20 s and 0.61 s respectively through parameter self-tuning, they exhibit severe stability deficiencies when dealing with large time-delay systems. In particular, Adaptive-PID shows a sharp increase in overshoot to 21.27%, accompanied by intense dynamic oscillations, which can easily cause frequent switching and mechanical damage to solenoid valves in practical engineering.
In the field of advanced control, MPC exhibits an extremely fast initial response (
tr = 0.03 s), but at the cost of a 5.05% overshoot. Moreover, due to computational overhead and model dependence, small deviations still exist in the steady state. The traditional SMC shows excellent performance in both response speed (
tr = 1.23 s) and settling time (
ts = 7.49 s), but presents the inherent “chattering” phenomenon of sliding mode control in the steady state. The error curve in
Figure 8 clearly shows that its steady-state MAE remains at the order of 3.34 × 10
−4, limiting control accuracy.
To address the time-delay issue within the sliding mode framework, the Smith-SMC algorithm was also evaluated. While the inclusion of the Smith predictor noticeably accelerates the system’s response (tr = 0.91 s) and shortens the adjustment time to 6.35 s with a minimal overshoot of 0.38%, it struggles significantly with steady-state accuracy. The MAE of Smith-SMC degrades to 1.85 × 10⁻³, indicating that simply combining a traditional Smith predictor with a first-order sliding mode surface fails to eliminate chattering and instead amplifies the steady-state error under these tracking conditions.
The proposed AG-PSTC algorithm in this study achieves the best comprehensive control performance. Benefiting from the feedforward mechanism of the improved Smith predictor, the system essentially eliminates phase lag. While maintaining a fast response (tr = 1.23 s), its settling time is only 7.54 s, and it achieves smooth convergence with nearly zero overshoot (0.28%). By embedding the discontinuous switching term into the integral term via the super-twisting algorithm, combined with the barrier function-based adaptive gain law, the steady-state MAE of the algorithm is only 6.94 × 10⁻⁷. Compared with the conventional PID, the steady-state error is reduced by four orders of magnitude; compared with traditional SMC, the steady-state accuracy is improved by approximately 500 times, and it vastly outperforms the Smith-SMC hybrid in maintaining high-precision steady-state control.
4.1.2. Phase Trajectory and Convergence Characteristic Analysis
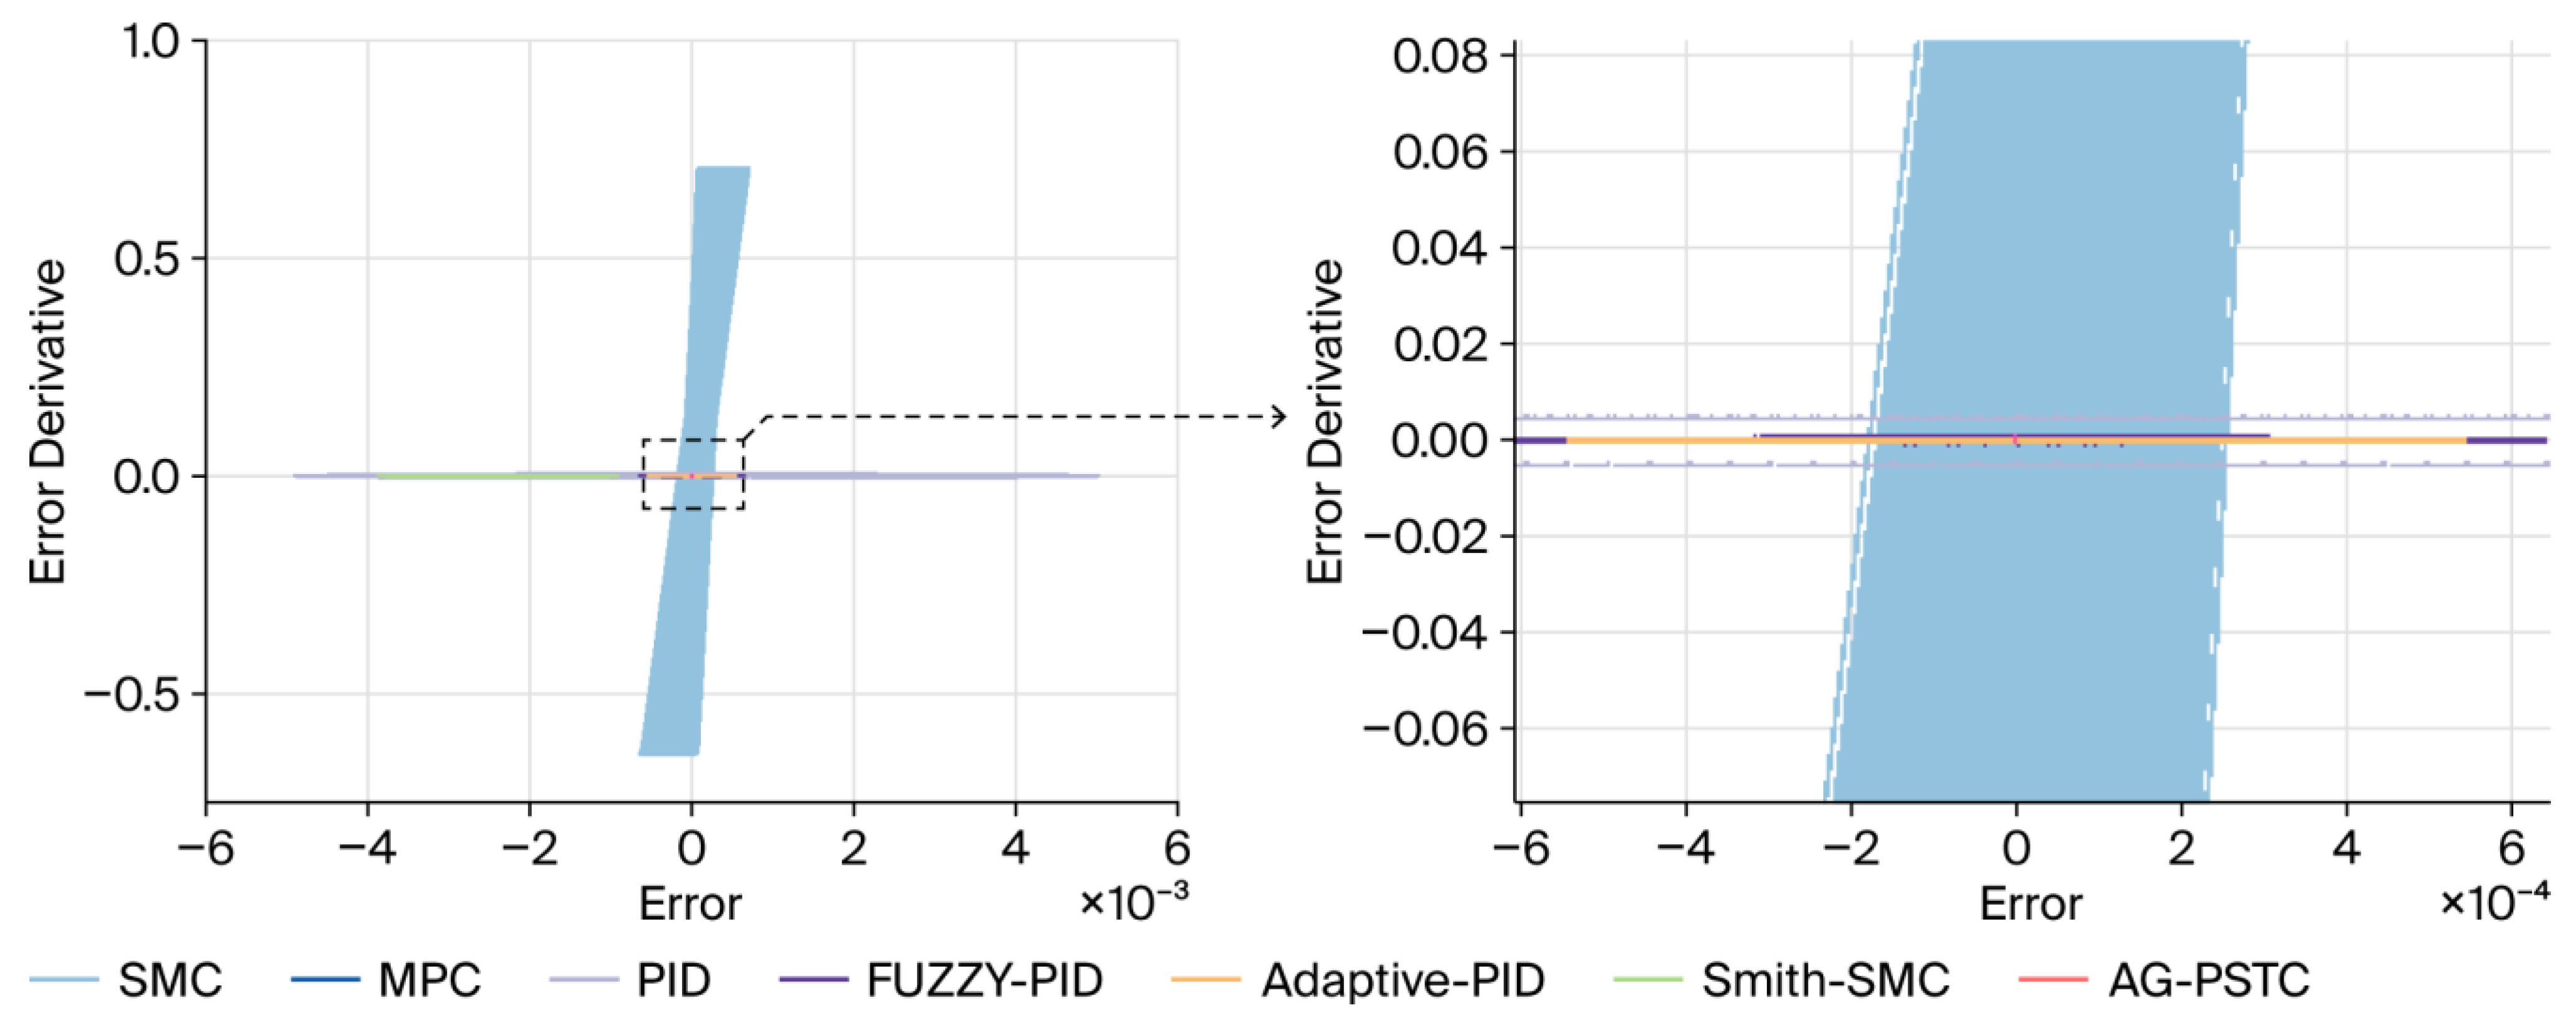
As shown in
Figure 9, by drawing the phase trajectory diagram (the relationship between error
and error derivative
) in the stable stage, it is observed that the phase trajectory of AG-PSTC rapidly curls to the origin (0,0) in a very short time. In contrast, the traditional SMC has slight reciprocating fluctuations near the sliding mode surface. This verifies that AG-PSTC not only has the robustness of the second-order sliding mode but also effectively suppresses system chattering through the adaptive gain law, achieving a continuous and smooth control output.
4.1.3. Robustness Verification Under Complex Working Conditions
In the actual tea garden irrigation process, affected by soil texture differences (inertial changes) and pipeline transportation distance (time-delay changes), it is often difficult to obtain an accurate mathematical model of the controlled object. For this reason, this study carried out a robustness pressure test for the dual-parameter perturbation of “time delay” and “inertia” (as shown in
Table 4).
(1) Time-delay parameter perturbation test
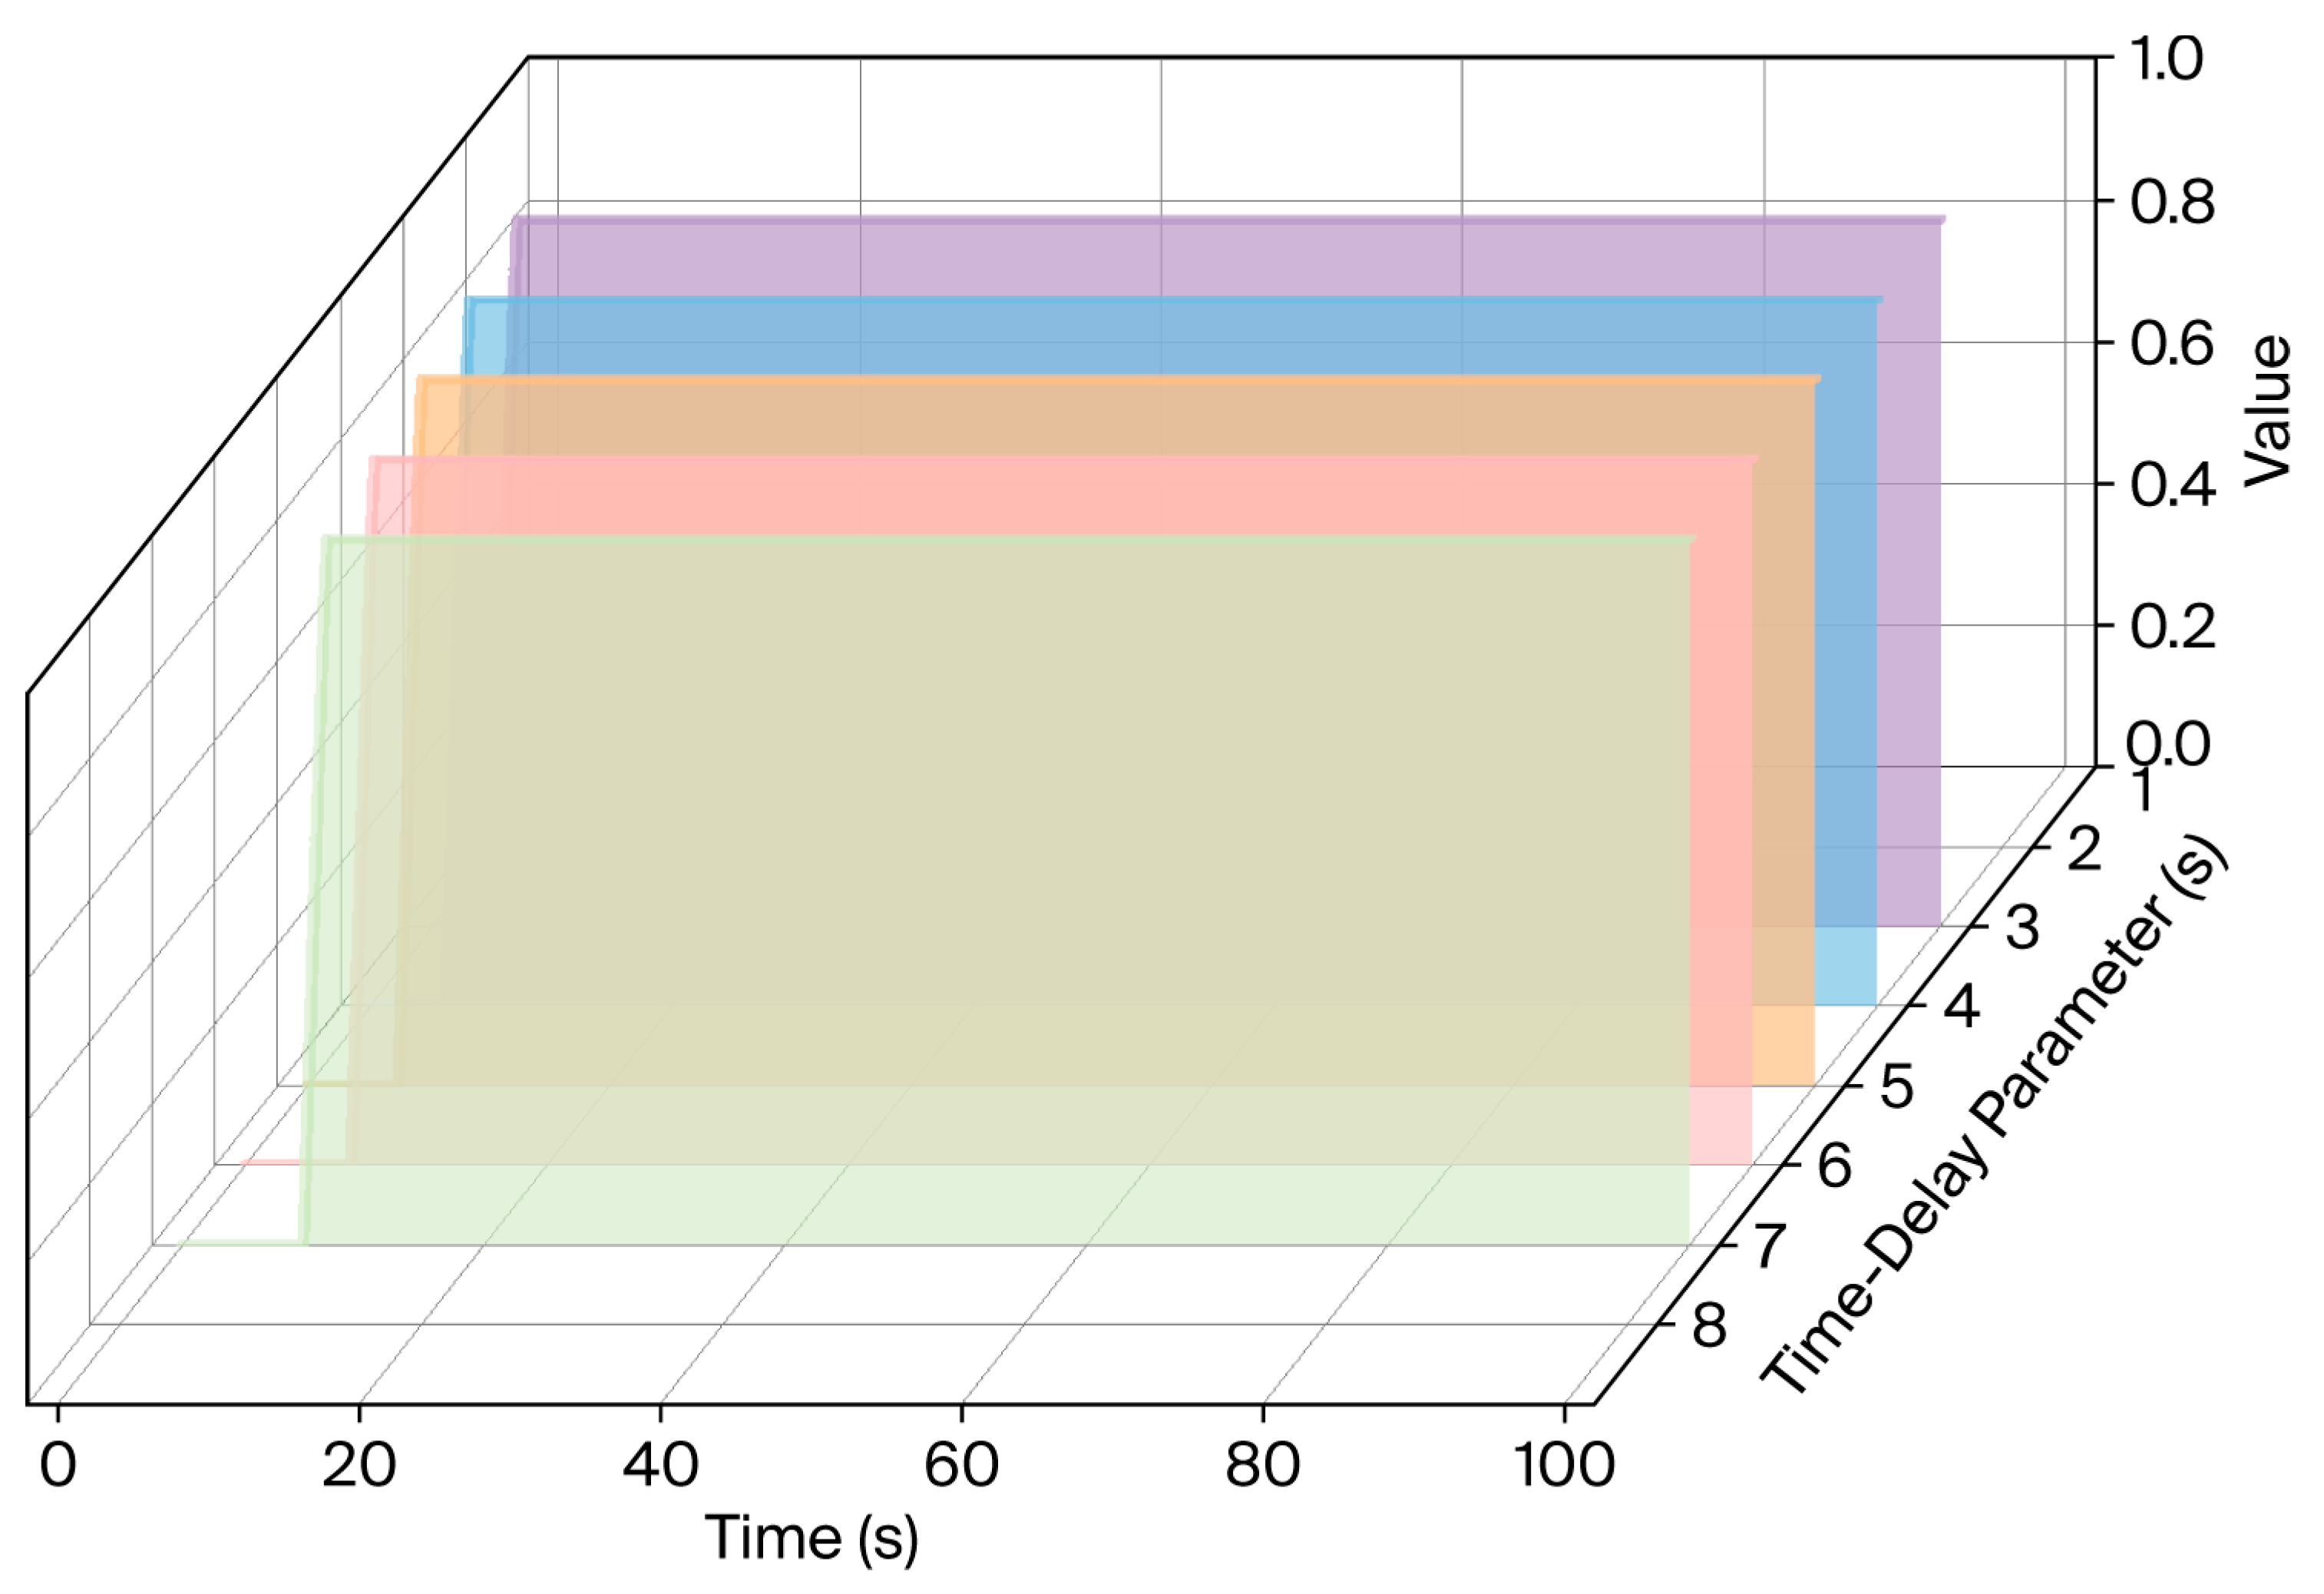
To simulate the phase lag uncertainty caused by long-distance water delivery, the pure time delay τ of the system was adjusted in the range of 3 s to 7 s. The experimental results are shown in
Figure 10.
Performance stability: The response curves of AG-PSTC under different time-delay working conditions show extremely high consistency. Even in the extreme case where the delay time deviates from the nominal value by ±40%, the system can still converge to the target set value quickly and stably.
Error quantification: Statistical data show that the steady-state mean absolute error under each time-delay working condition is stable at the level of 6.9 × 10⁻⁷, which strongly proves that the improved Smith predictor has excellent compensation performance for the pure time-delay link and effectively solves the problem of insufficient control accuracy of long-distance pipeline water delivery in hilly tea gardens.
(2) Inertial parameter perturbation test
Due to the significant differences in the infiltration rate of soil in different plots, the system time constant
T drifts with the changes in soil porosity and initial moisture. In this study, the nominal time constant
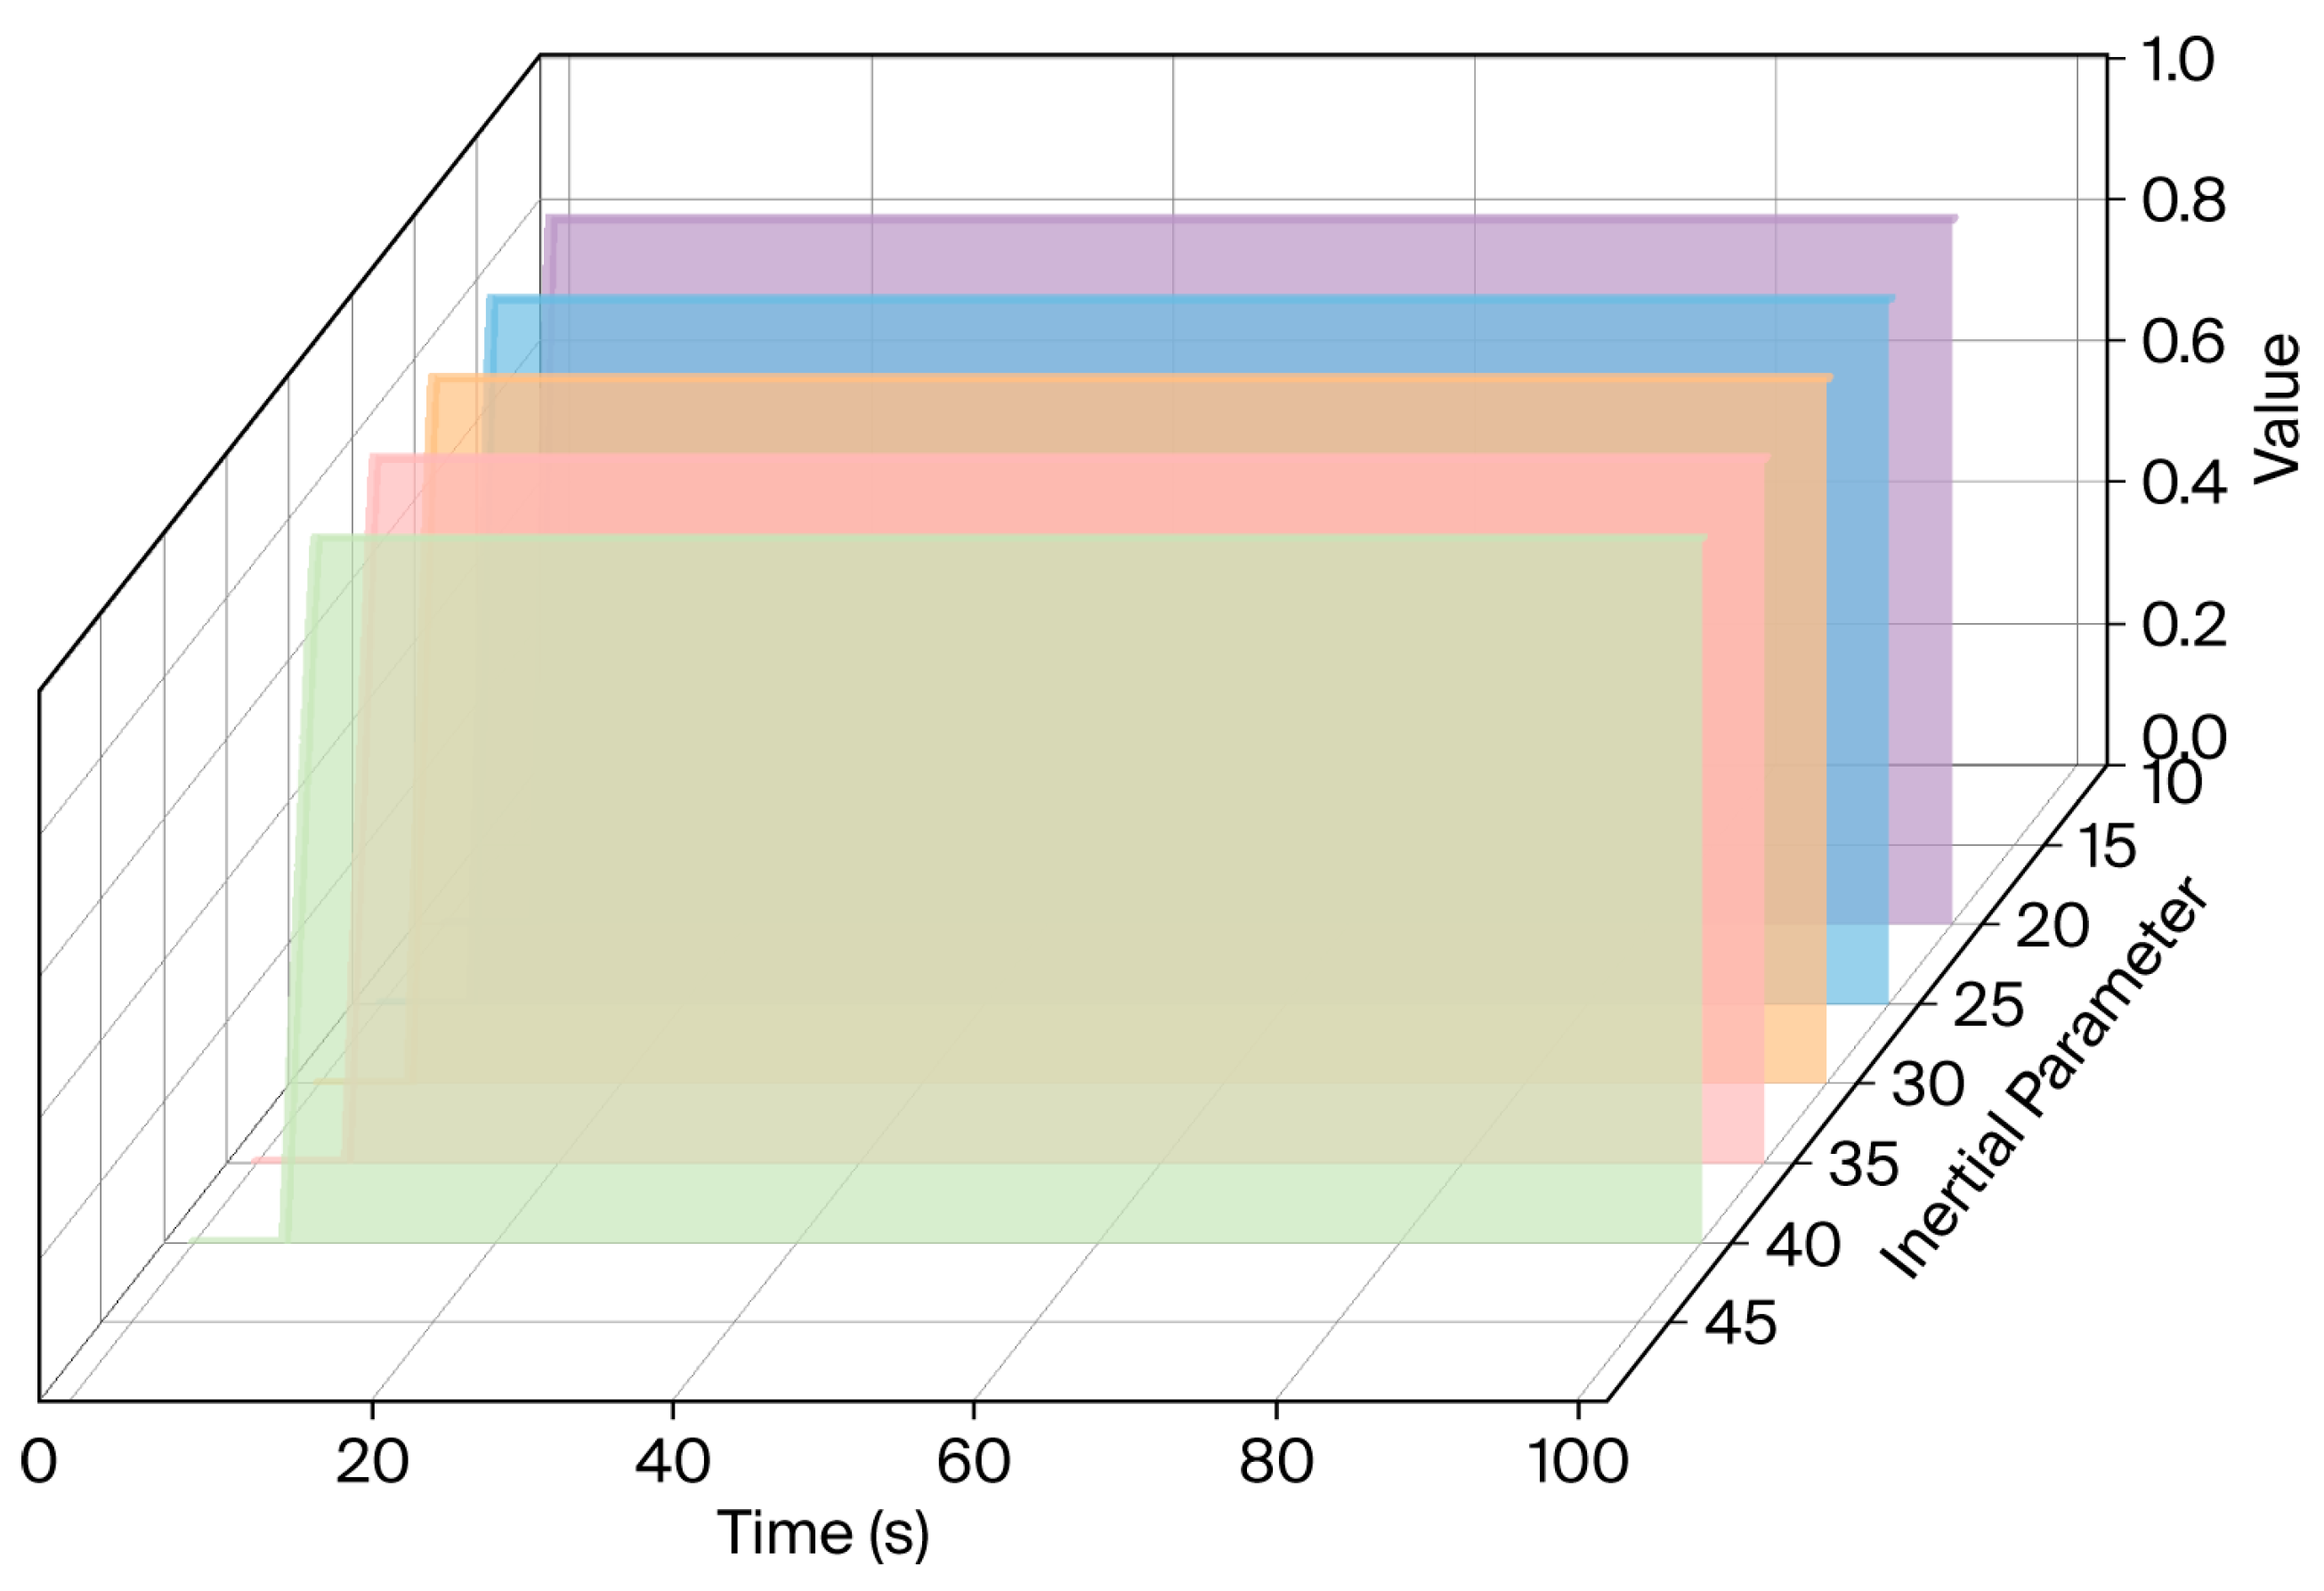
T = 30 s was adjusted to 20 s and 40 s (deviation amplitude of about ±33%) for simulation tests. The results are shown in
Figure 11. Benefiting from the barrier function-based adaptive gain law, when the system inertia changes and causes the error change rate to fluctuate, AG-PSTC can dynamically adjust the control gain to keep the system at the optimal damping ratio at all times. The test shows that, under the large perturbation of inertial parameters, the fluctuation in the system adjustment time is less than 2 s, reflecting the extremely strong adaptability of the algorithm to “soil environmental heterogeneity”.
4.2. Analysis of Decision-Making Stability Under Complex Phenological Interference
The biggest challenge of tea garden irrigation decision-making is to distinguish between “physiological water stress” and “non-physiological biomass fluctuation”. This section verifies the robustness of the three decision-making strategies by simulating the drastic changes in canopy structure caused by picking operations.
4.2.1. Interference Identification and Decision-Making Trajectory Analysis
In the 60-day simulation operation, the system simulated the manual picking process from the 20th to the 30th day. During this period, the observed shoot density exhibited a cliff-like drop of 60%. This substantial reduction is not an arbitrary mathematical artifact, but a direct representation of intensive summer harvesting practices. For the ‘Fuding Dabaicha’ cultivar, modern standardized tea gardens frequently employ concentrated manual ‘flush’ plucking or mechanized harvesting during the peak season. These intensive operations rapidly strip the active upper canopy layer, which is the primary visual target of the canopy monitoring sensors. Consequently, while the permanent woody framework of the tea plant remains intact, the observed surface shoot density typically experiences an acute, transient reduction of 50% to 70% within a single harvesting cycle. This simulated 60% drop scenario thus serves as a highly realistic stress test for the model’s diagnostic reliability under severe agronomic interventions. The decision target values (
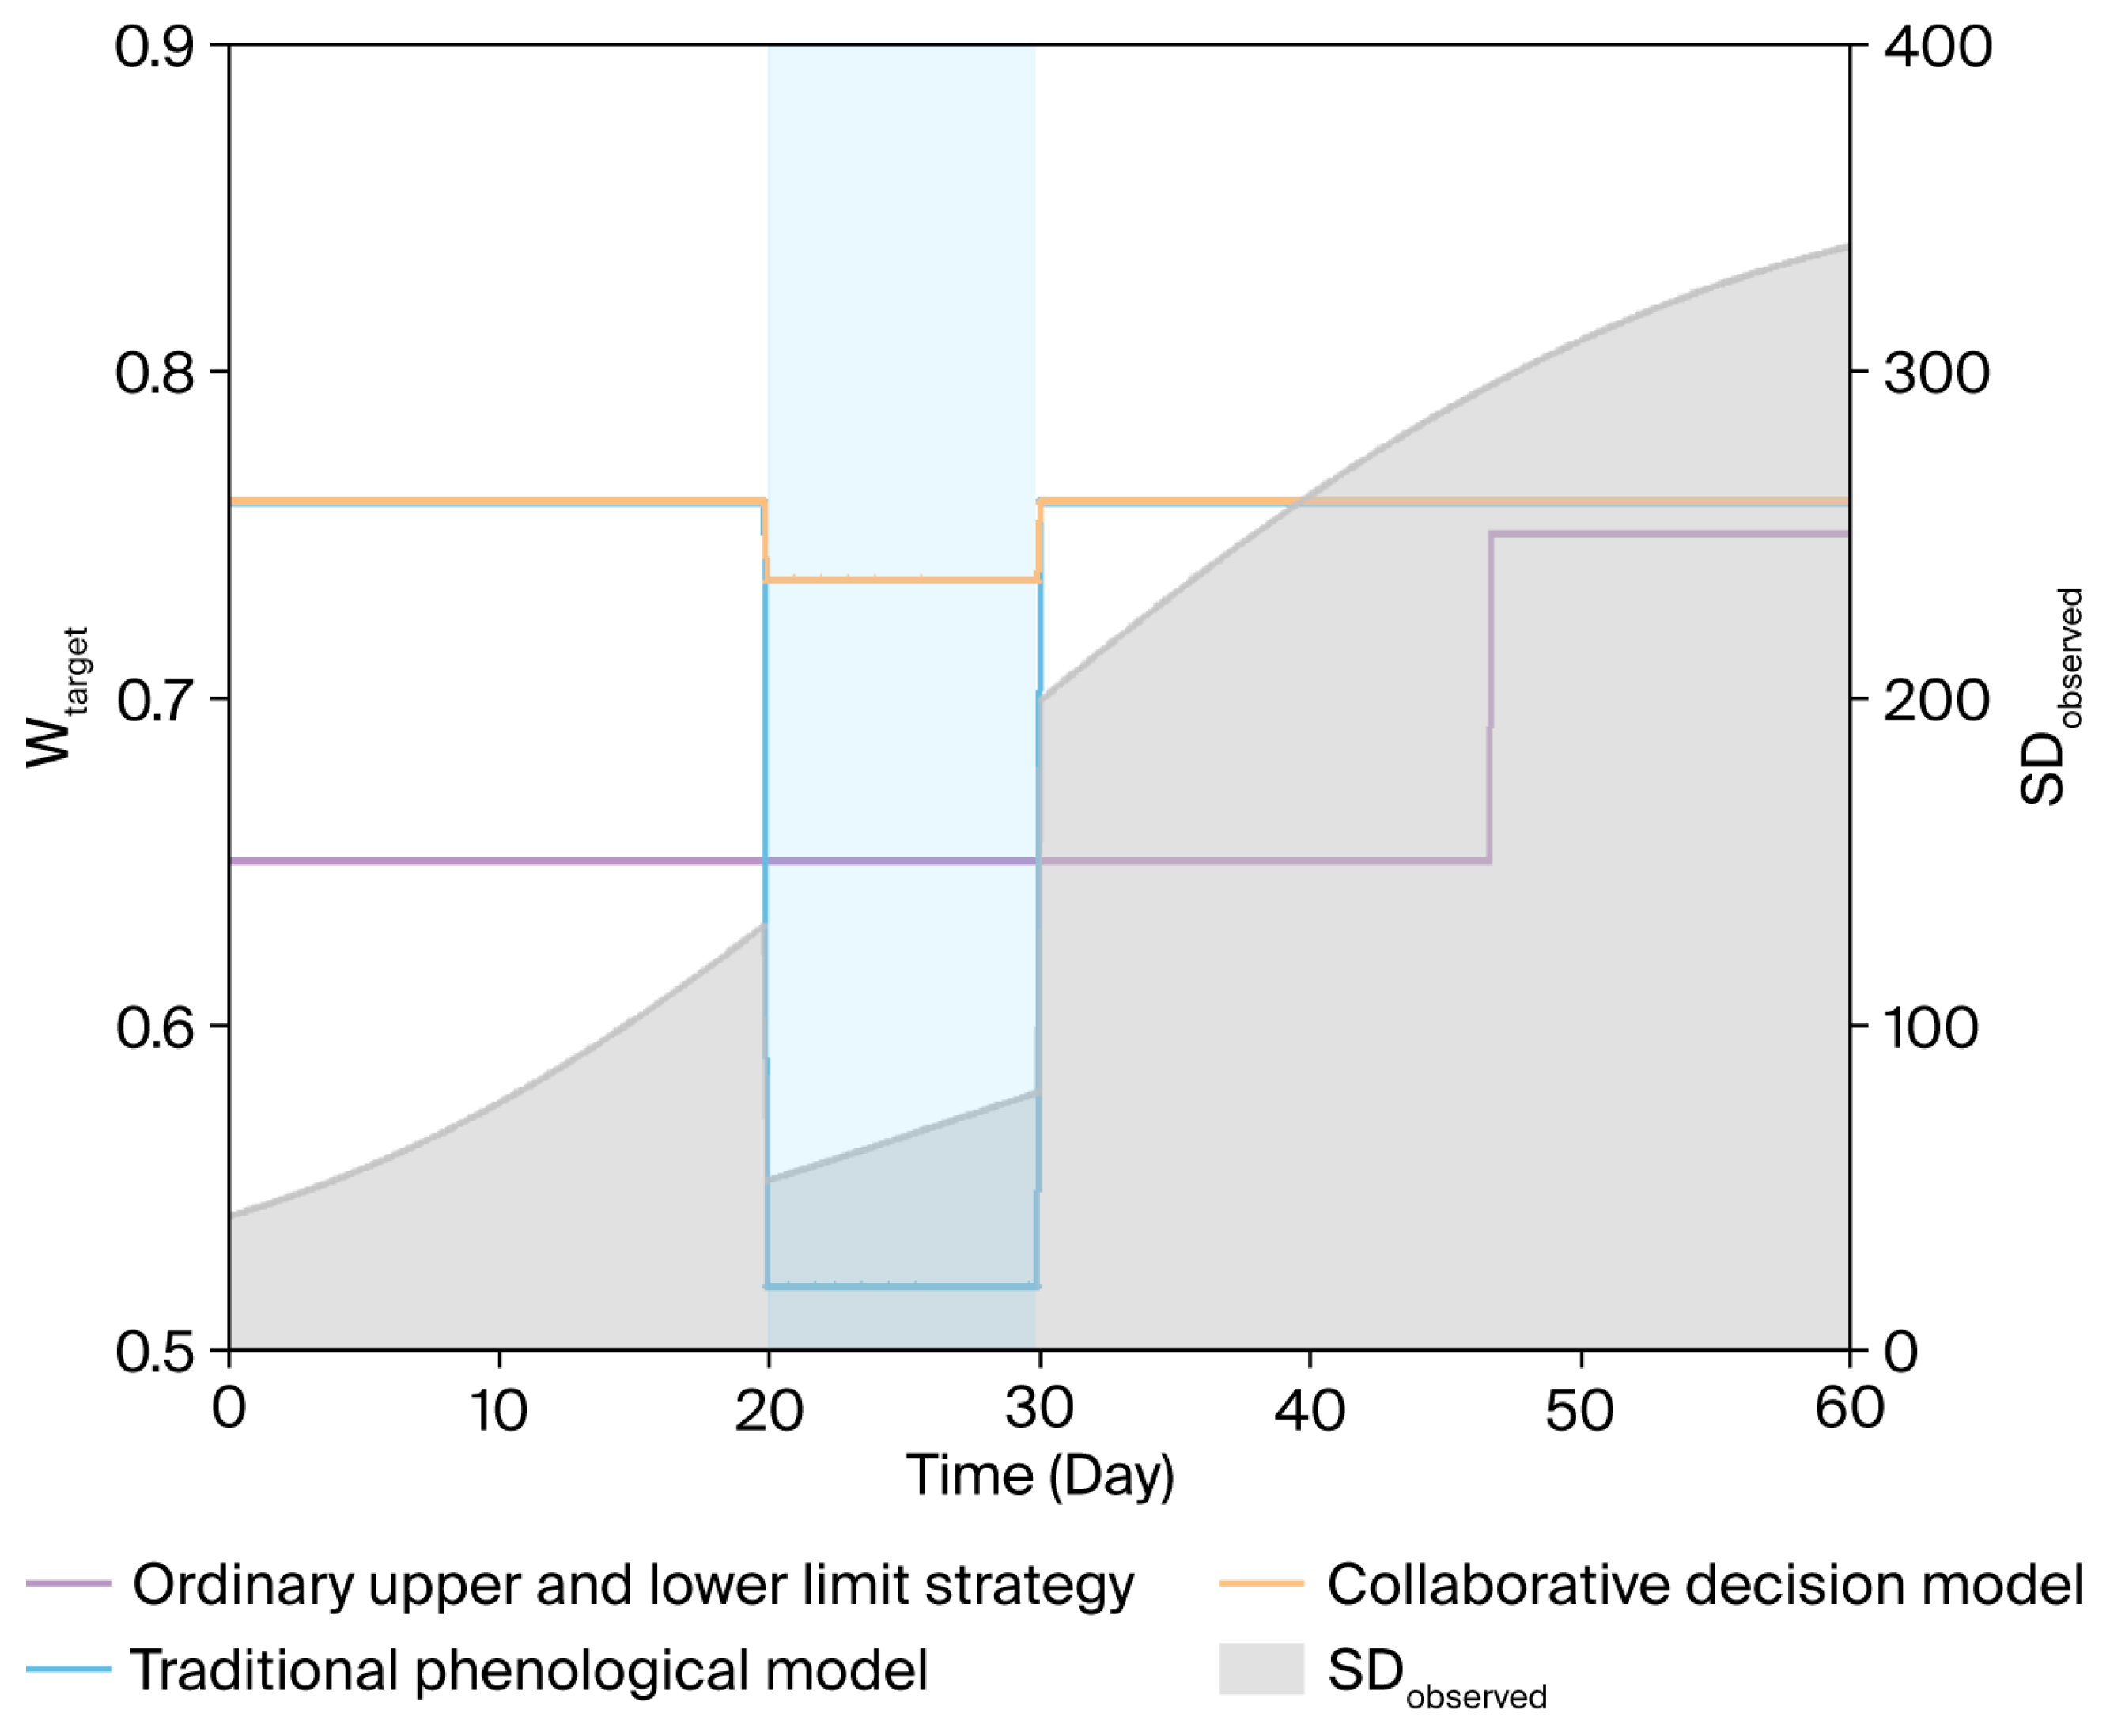
Wtarget) that tune trajectories generated by the three strategies are shown in
Figure 12.
- (1)
Fixed-threshold control: Due to the adoption of a static hard threshold of 0.65–0.75, although its decision value does not fluctuate with biomass, it cannot flexibly adjust according to the actual water demand law of tea trees in different phenological periods, lacking agronomic scientificity.
- (2)
Traditional phenological model: A significant misjudgment response of “false water stress” occurred. Due to the lack of a water feedback correction mechanism in the model, the low density caused by picking was mistakenly identified as severe growth retardation, leading the target soil moisture Wtarget to drop from 0.75 to 0.52 by mistake. This decision-making error caused long-term ineffective irrigation in actual production, resulting in root diseases and water resource waste.
- (3)
Collaborative decision algorithm proposed in this study: It showed extremely strong identification ability. By comparing with the benchmark growth model calculated by growth time (T) and effective accumulated temperature (K), the algorithm accurately identified that the decrease in SD at this stage was a non-physiological interference, and successfully locked Wtarget in the physiological benchmark area near 0.736 through the water compensation factor.
4.2.2. Quantitative Evaluation of Decision-Making Indicators
For further quantitative analysis,
Table 5 lists the evaluation indicators of each algorithm during the picking interference period. When encountering a 60% drop in shoot density, the traditional phenological model lacked the identification of the water physiological state, and its decision mean value was only 0.522. This value is far lower than the physiological safety threshold for tea tree growth, reflecting that the model has misjudged non-physiological interference as extreme drought. In contrast, the decision mean value of the collaborative decision model remains at 0.736, which is highly consistent with the ideal phenological benchmark, proving that the model effectively retrieves the real irrigation demand through the decoupling logic of “phenology-driven” and “water stress”. Decision variance is an important reference for evaluating the reliability of executive mechanisms. The traditional phenological model produces a large variance (5.70 × 10
−4) due to signal fluctuations, which lead to frequent starting and stopping of water pumps and solenoid valves. In contrast, the variance of the collaborative decision model proposed in this study is only 5.77 × 10
−6, and the stability is improved by about two orders of magnitude compared with the traditional phenological model. This means that the irrigation commands generated by the system are extremely stable, which can significantly reduce hardware loss. In terms of the maximum deviation amplitude index, the deviation generated by the traditional phenological model is as high as 0.239, which is enough to trigger catastrophic decision-making actions. The collaborative decision model strictly controls the deviation within 0.024. Although the ordinary upper and lower limit strategy (fixed threshold) shows absolute static stability (variance and deviation are 0) during the interference period, it cannot flexibly tune
Wtarget with the phenological period, and its crop growth adaptability is far lower than that of the proposed model.
4.2.3. Analysis of Meteorological Environmental Characteristics
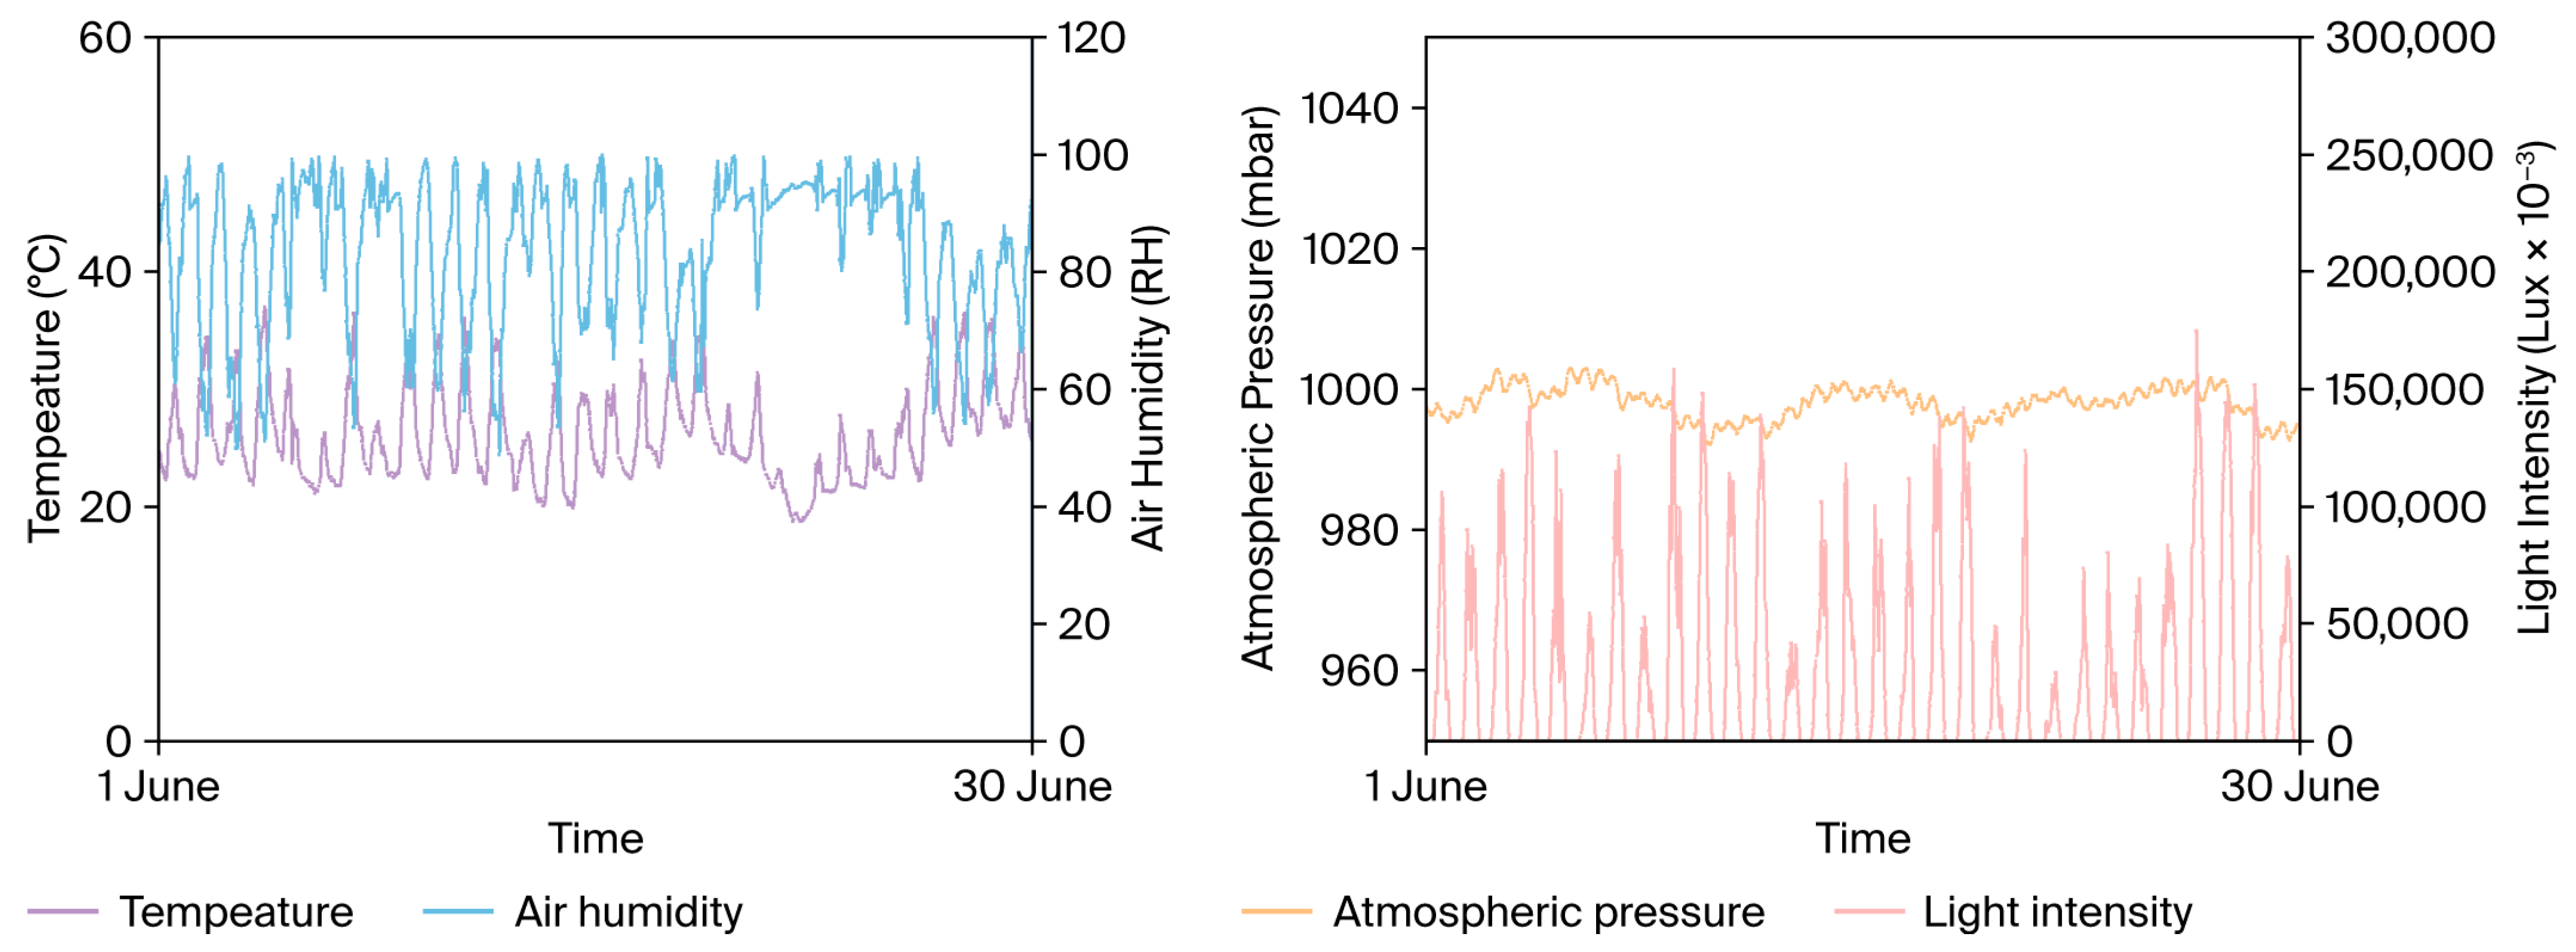
During the test period, the system completely recorded the multi-dimensional meteorological data above the tea garden (
Figure 13). The monitoring results show that the test area presented typical high-temperature and high-humidity summer climate characteristics in June: the daily average air temperature was 26.11 °C, and the extreme peak temperature reached 37 °C. The high-temperature period was accompanied by severe crop evapotranspiration, which severely tested the real-time water replenishment capacity of the irrigation system. The average light intensity was 28,550.64 Lux, and the average air humidity was as high as 83.84%. Although the high-humidity environment alleviates the water tension of leaves to a certain extent, high temperature and high light are still the main factors driving soil water loss. The atmospheric pressure remained stable at about 997.92 mbar, and the violent fluctuations in meteorological elements (especially the high-temperature peak) were accurately captured by the system, providing reliable external parameter input for the decision-making layer to calculate the CWSI.
4.2.4. Evaluation of Soil Micro-Environment Stability
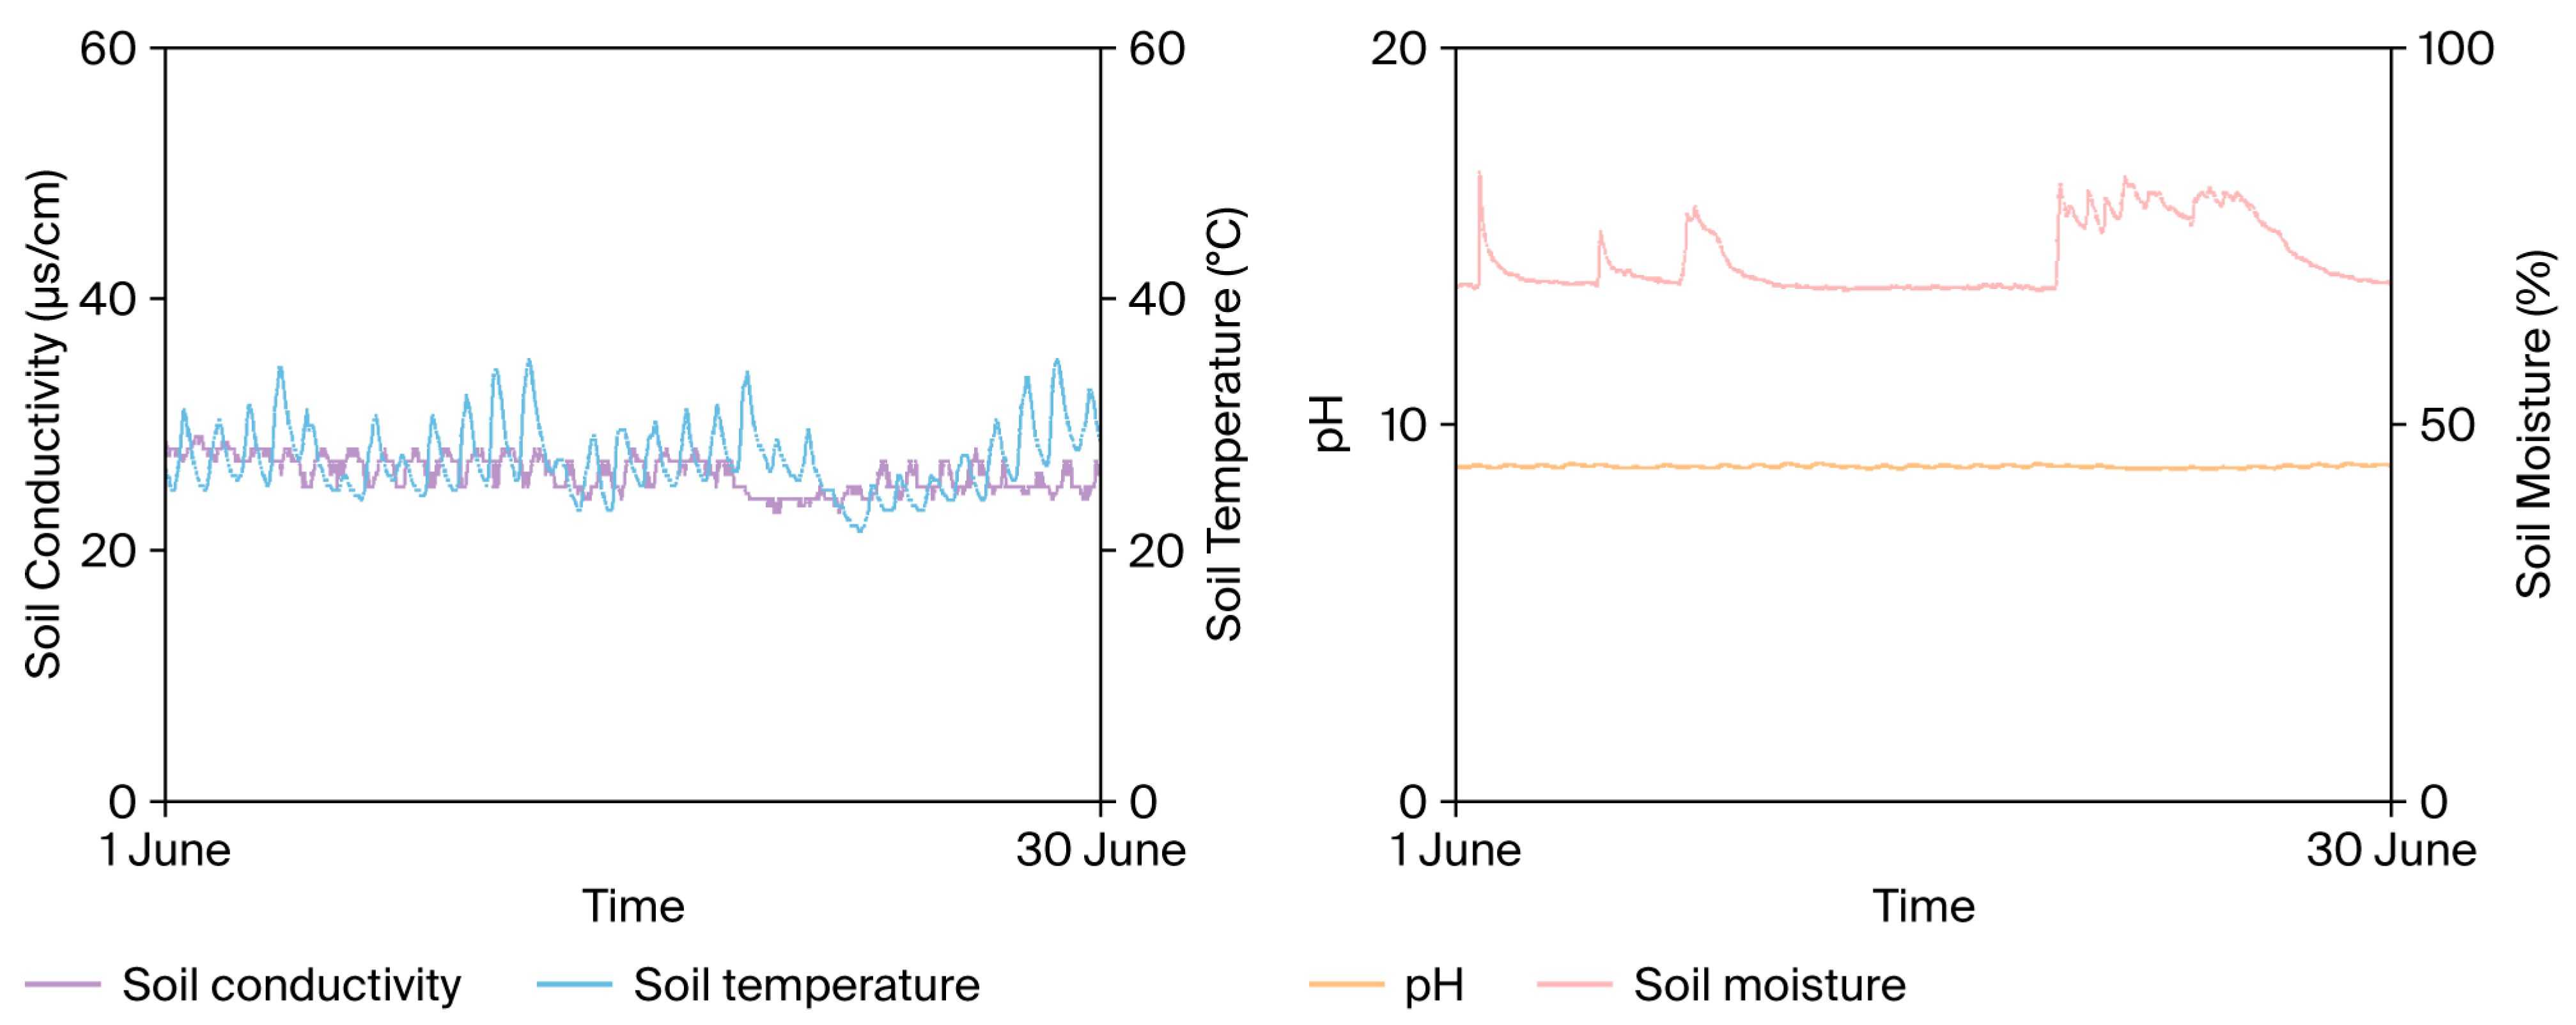
Under the high-precision regulation of the AG-PSTC algorithm, the physical and chemical properties inside the soil show significant steady-state characteristics (
Figure 14). Through the feedback of integrated sensors deployed at the root zone depth, the data show that the soil pH value always fluctuates in a narrow range of 8.83–8.97. A stable acid–base environment effectively avoids the risk of nutrient loss or root salinization caused by over-irrigation. The soil electrical conductivity is maintained between 23 and 29 μs/cm. The stable distribution of EC value reflects the uniform infiltration of water in soil pores, which indirectly verifies the continuity and smoothness of control commands in the irrigation execution stage without the phenomenon of violent “flood irrigation”.
4.3. Field Verification and Water Regulation Accuracy
To verify the effectiveness of the above algorithm and decision model in the real agricultural environment, this study carried out on-site integrated verification tests at the Jiangxi Academy of Agricultural Sciences tea base. The core study goal is to investigate the system’s ability to maintain the stability of tea tree root zone moisture under a high-temperature evaporation environment and a manual picking interference.
4.3.1. Decision-Making Identification Results Under Agronomic Interference
During the June field tests at the Jiangxi Academy of Agricultural Sciences tea base, the system’s response to artificial harvesting interference was comprehensively evaluated. Monitoring data revealed that manual picking operations induced a sharp, non-physiological 60% decrease in SD captured by visual sensors. Under these conditions, traditional visual-based diagnostic models failed to contextualize the agronomic disturbance, generating continuous false drought alarms due to the sudden drop in biomass. In strict contrast, the proposed collaborative decision model successfully identified this anomaly by dynamically cross-referencing stable real-time soil moisture (Wcurrent) and executing a logical comparison against a benchmark model driven by growth time and effective accumulated temperature. Consequently, the diagnostic operator completely rejected the plucking-induced signal noise, maintaining the irrigation target values (Wtarget) strictly within the physiological baseline range of 0.73–0.74 without downward drift. System operation logs confirmed that throughout the continuous plucking cycle, the model demonstrated robust anti-interference capabilities by triggering zero erroneous irrigation events, thereby effectively preventing the massive water waste characteristic of traditional single-sensor phenological logic.
4.3.2. Measured Water Control Accuracy and Physicochemical Stability Indicators
In the system execution stage, the AG-PSTC algorithm showed stable regulation ability under the extremely high-temperature working condition with an external air temperature of 37 °C. The measured soil moisture curve is shown in
Figure 14. The system still achieved the smooth tracking of the set target under the background of time delay in long-distance pipeline transportation, without any overshoot or oscillation induced by the phase lag. Statistical results show that the standard deviation of soil moisture during the test was controlled within 1.51%. At the same time, the monitoring data of the physical and chemical environment of the root zone soil show that the soil pH value was always maintained in the range of 8.83–8.97, and the electrical conductivity was maintained between 23 and 29 μS/cm. The stable fluctuations in physicochemical indicators reflect the continuity of the irrigation water infiltration process, verifying that the executive mechanism has smooth output characteristics driven by the AG-PSTC algorithm.
Statistical results show that the standard deviation of soil moisture during the test was controlled within 1.51%. While a parallel physical control plot was not established due to field constraints, the statistical significance of this 1.51% variance lies in its evaluation as a dynamic tracking error rather than a static environmental baseline. Given the extreme meteorological background—where peak temperatures reached 37 °C, driving severe natural evapotranspiration that would otherwise cause a sharp baseline moisture depletion of 4% to 6% per day—maintaining a fluctuation variance of merely 1.51% around the dynamic target (Wtarget) is non-trivial. It mathematically isolates the controller’s active compensation performance, demonstrating that the stability was achieved through the high-frequency, precise regulation of the AG-PSTC algorithm overcoming intense natural variability, rather than resulting from a naturally stable soil environment.
5. Discussion
5.1. Regulation Mechanism of the AG-PSTC Algorithm for Large-Time-Delay Nonlinear Systems
The large-time-delay characteristic of tea garden irrigation systems has always been a control problem in the field of precision agriculture. The theoretical breakthrough of the AG-PSTC algorithm proposed in this study is that it not only achieves feedforward compensation in phase through the Smith predictor but also, more importantly, introduces a barrier function adaptive gain law.
Currently, domestic and foreign studies such as Li et al. [
33] or Zhang et al. [
34] mostly adopt conventional PID or fixed-gain Sliding Mode Control. Although the PID algorithm has a simple structure, despite extreme situations such as a 40% deviation of time-delay parameters in this study, it often produces severe oscillation due to an insufficient phase margin. Nasiru et al. [
35] used an optimization algorithm based on PID to find the optimal parameters, and the stabilization time of the system is still 101.25 s. In contrast, the adaptive mechanism of the proposed algorithm can automatically increase the gain when the error approaches the boundary and reduce the gain in the steady state, which solves the inherent contradiction between “anti-disturbance” and “chattering suppression” from a mathematical logic perspective. The smooth convergence of the phase trajectory proves the superiority of the algorithm in the complex dynamic environment, providing a new theoretical paradigm for long-distance water delivery irrigation in hilly areas.
5.2. Identification Logic of Phenological Perception Collaborative Decision-Making for Non-Physiological Interference
In the context of modern precision agriculture, traditional Internet of Things (IoT) systems primarily serve as robust data acquisition platforms. For instance, typical IoT frameworks rely on distributed sensor nodes to collect real-time physical parameters—such as standalone soil moisture, ambient temperature, or electrical conductivity—and transmit them via communication protocols like LoRa or 5G [
3,
23]. However, relying solely on these direct environmental measurements creates a “single perception dimension” and a “passive feedback mechanism”. Most existing studies, such as irrigation strategies based purely on a single soil moisture threshold, show significant vulnerability to high-intensity agronomic operations like pruning and plucking [
36].
To overcome the limitations of centralized cloud processing and passive feedback, recent advancements emphasize processing collected data at the fog or edge computing level [
23]. Edge and fog computing bring intelligent data analysis closer to the data source, enabling real-time, localized decision-making processes that incorporate elements far beyond direct environmental measurements. As Zou et al. [
37] and Kayad et al. [
38] clearly pointed out in their research on the robustness of agricultural IoT, a feedback mechanism that simply relies on raw physical parameters (such as water content and leaf surface temperature difference) cannot effectively distinguish non-physiological environmental interference from actual crop physiological signals in a highly non-stationary operation environment, leading to easy steady-state oscillations or misoperation of the decision-making system.
To address this persistent issue, our study leverages this edge-assisted intelligent analysis paradigm by assessing the dynamic change in shoot density with in-depth “physiological semantics”, introducing a benchmark phenological model of the three-factor collaborative evolution of “temperature–time–moisture”. This mechanism upgrades the irrigation system from a traditional “threshold trigger” to an intelligent agent with logical reasoning ability: when the visual sensor captures a cliff-like drop in biomass (shoot density), the system no longer blindly judges it as “water stress”, but actively traces back the historical accumulated temperature and the current real-time CWSI.
This backtracking logic based on “physiological memory” effectively compensates for the uncertainty fault of the artificial intelligence models proposed by Oliveira et al. [
39] caused by feature mutations in complex production environments, and complements the research on remote sensing phenology for water stress early warning by Li [
40] and Singh [
41]. This study proves through the quantitative evaluation of decision variance that the collaborative decision-making mechanism reduces the irrigation misoperation rate to an extremely low level by eliminating agronomic interference pulses. This not only improves control accuracy but also symbolizes the leap of the smart irrigation paradigm from “data-driven monitoring” to “in-depth logical reasoning diagnosis” supported by edge intelligence.
6. Conclusions
This study proposes the AG-PSTC algorithm and a collaborative decision-making framework to address the time delay and phenological interference faced by precision irrigation in smart tea gardens. The proposed system provides technical support from decision theory to control execution for achieving precision management in complex environments. The following conclusions are drawn through simulation and field verification:
- (1)
Improvement in control performance: The proposed AG-PSTC algorithm addresses the large-time-delay characteristic of irrigation pipelines. Under a ±40% time-delay perturbation, the steady-state MAE remained at the level of 6.91 × 10⁻⁵. The rise time was 78% shorter than that of the traditional PID controller, and the steady-state error was reduced by four orders of magnitude compared with conventional feedback strategies.
- (2)
Mitigation of decision-making interference: The collaborative decision model decoupled the phenology-driven component and the water stress component. The decision variance during the picking interference period was 5.77 × 10⁻⁶, presenting a stability improvement of two orders of magnitude compared with traditional phenological models. This mechanism suppressed erroneous irrigation actions caused by picking operations.
- (3)
System operation stability: Field verification demonstrated that under high-temperature and disturbed environments, the soil moisture standard deviation was controlled within 1.51%. Physicochemical indicators, such as soil pH and EC in the root zone, remained stable, fulfilling the water demand of the tea plants.
The verification experiments in this study were conducted on the Fuding Dabaicha cultivar in red soil hilly tea plantations. The current core model parameters (α and β) were calibrated based on standardized planting areas characterized by uniform tree age and vigorous growth conditions. The model currently does not account for the disparate canopy recovery capabilities and varying water stress tolerances inherent in low-yield tea gardens or tea trees of different ages. Applying this baseline model directly to heterogeneous agronomic scenarios without introducing age-specific correction coefficients or growth vigor weights may limit its practical engineering accuracy. In future research, we will expand the range of test cultivars, soil types, and tree age brackets to establish a multi-dimensional phenological benchmark growth model.
Furthermore, addressing the inherent high-order and nonlinear characteristics of tea plantation irrigation systems remains a challenge. While previous studies have utilized nominal first-order models for irrigation scheduling, traditional control algorithms applied to these simplified models often struggle with steady-state oscillations caused by unmodeled nonlinear seepage characteristics in open environments. The AG-PSTC algorithm utilizes ‘nominal reduced-order modeling coupled with robust compensation’ to bridge the gap between theoretical modeling simplification and complex engineering practice.
Finally, while the field trial demonstrated the system’s performance under summer stress conditions, the current validation relies on data from a single time period (June 2025) and a single geographical location (Gao’an site). This spatial-temporal limitation indicates that the potential impacts of broader seasonal shifts, diverse microclimates, and regional meteorological variations on the system’s long-term reliability require further quantification. Subsequent trials will be deployed across geographically diverse tea-producing regions and span different critical phenological phases to verify and refine the system’s universal robustness.
Author Contributions
L.W., conceptualization, project management, funding acquisition, paper review; H.L., methodology, experimental verification, data analysis, initial draft writing and revision; S.S. and C.Y., resource investigation and data management. All authors have read and agreed to the published version of the manuscript.
Funding
This study was supported by the construction project of the Construction Project of Scientific Research Base for Tea Full Process Mechanization of Ministry of Agriculture and Rural Affairs f China (2103-00000-20-01-763233) and Jiangxi Province Pilot Project for Integrated R&D, Manufacturing, and Promotion of al Machinery Equipment (YCTY202508).
Data Availability Statement
The data presented in this study are available on request from the corresponding author.
Conflicts of Interest
The authors declare no conflicts of interest.
Abbreviations
The following abbreviations are used in this manuscript:
| AG-PSTC | Adaptive Gain Predictive Super-Twisting Sliding Mode Control |
| CWSI | Crop Water Stress Index |
| EC | Electrical Conductivity |
| GDD | Growing Degree Days |
| MAE | Mean Absolute Error |
| MPC | Model Predictive Control |
| Mp | Maximum Overshoot |
| PACD | Phenology-Aware Collaborative Decision-Making |
| PID | Proportional–Integral–Derivative |
| RDD | Relative Density Deviation |
| RMSE | Root Mean Square Error |
| SD | Shoot Density |
| SMC | Sliding Mode Control |
| ts | Adjustment Time |
| IoT | Internet of Things |
| STA | Super-Twisting Algorithm |
| LoRa | Long Range |
| DL/ML | Deep Learning/Machine Learning |
| PSO-ELM | Particle Swarm Optimization—Extreme Learning Machine |
| MCU | Micro Control Unit |
References
- Qian, W.; Hu, J.; Zhang, X.; Zhao, L.; Wang, Y.; Ding, Z. Response of tea plants to drought stress. In Stress Physiology of Tea in the Face of Climate Change; Springer: Singapore, 2018; pp. 63–81. [Google Scholar]
- Wulansari, R.W.; Athallah, F.N.F.; Pramudita, A.A. Effect of slope and year of pruning of tea plants on soil water content in Indonesian tea plantations. Soil Sci. Annu. 2022, 73, 157103. [Google Scholar] [CrossRef]
- Jia, X.; Huang, Y.; Wang, Y.; Sun, D. Research on water and fertilizer irrigation system of tea plantation. Int. J. Distrib. Sens. Netw. 2019, 15, 1550147719840182. [Google Scholar] [CrossRef]
- Abioye, E.A.; Abidin, M.S.Z.; Mahmud, M.S.A.; Buyamin, S.; Ishak, M.H.I.; Rahman, M.K.I.A.; Otuoze, A.O.; Onotu, P.; Ramli, M.S.A. A review on monitoring and advanced control strategies for precision irrigation. Comput. Electron. Agric. 2020, 173, 105441. [Google Scholar] [CrossRef]
- Anjum, M.N.; Cheema, M.J.M.; Hussain, F.; Wu, R.-S. Precision irrigation: Challenges and opportunities. In Precision Agriculture; Elsevier: Amsterdam, The Netherlands, 2023; pp. 85–101. [Google Scholar]
- Zhang, J.; Guan, K.; Peng, B.; Jiang, C.; Zhou, W.; Yang, Y.; Pan, M.; E Franz, T.; Heeren, D.M.; Rudnick, D.R.; et al. Challenges and opportunities in precision irrigation decision-support systems for center pivots. Environ. Res. Lett. 2021, 16, 053003. [Google Scholar] [CrossRef]
- Abioye, E.A.; Hensel, O.; Esau, T.J.; Elijah, O.; Abidin, M.S.Z.; Ayobami, A.S.; Yerima, O.; Nasirahmadi, A. Precision irrigation management using machine learning and digital farming solutions. AgriEngineering 2022, 4, 70–103. [Google Scholar] [CrossRef]
- Chauhdary, J.N.; Li, H.; Jiang, Y.; Pan, X.; Hussain, Z.; Javaid, M.; Rizwan, M. Advances in sprinkler irrigation: A review in the context of precision irrigation for crop production. Agronomy 2023, 14, 47. [Google Scholar] [CrossRef]
- Mamouras, K.; Wang, Z. Online signal monitoring with bounded lag. IEEE Trans. Comput.-Aided Des. Integr. Circuits Syst. 2020, 39, 3868–3880. [Google Scholar] [CrossRef]
- Mo, H.; Sansavini, G. Hidden Markov model-based smith predictor for the mitigation of the impact of communication delays in wide-area power systems. Appl. Math. Model. 2021, 89, 19–48. [Google Scholar] [CrossRef]
- Rath, A.; Behera, B.P.; Sethi, B.K. Improved shunt active filter for non-ideal grid using model predictive and sliding mode control. IEEE Trans. Consum. Electron. 2024, 70, 6600–6608. [Google Scholar] [CrossRef]
- Guo, J.; Sun, Y.; Liu, T.; Li, Y.; Fei, T. An optimization coverage strategy for wireless sensor network nodes based on path loss and false alarm probability. Sensors 2025, 25, 396. [Google Scholar] [CrossRef]
- Han, R.; Zheng, Y.; Tian, R.; Shu, L.; Jing, X.; Yang, F. An image dataset for analyzing tea picking behavior in tea plantations. Front. Plant Sci. 2025, 15, 1473558. [Google Scholar] [CrossRef]
- Wu, J.; Wang, J.; Hui, W.; Zhao, F.; Wang, P.; Su, C.; Gong, W. Physiology of plant responses to water stress and related genes: A review. Forests 2022, 13, 324. [Google Scholar] [CrossRef]
- Sharma, V.; Honkavaara, E.; Hayden, M.; Kant, S. UAV remote sensing phenotyping of wheat collection for response to water stress and yield prediction using machine learning. Plant Stress 2024, 12, 100464. [Google Scholar] [CrossRef]
- Ji, T.; Guo, X.; Wu, F.; Wei, M.; Li, J.; Ji, P.; Wang, N.; Yang, F. Proper irrigation amount for eggplant cultivation in a solar greenhouse improved plant growth, fruit quality and yield by influencing the soil microbial community and rhizosphere environment. Front. Microbiol. 2022, 13, 981288. [Google Scholar] [CrossRef] [PubMed]
- Zhang, W.; Tong, J.; Zhang, F.; Zhang, W.; Zhang, J.; Zhang, J.; Zhang, J.; Sun, H.; Northwood, D.O.; Waters, K.E.; et al. Integrated irrigation of water and fertilizer with superior self-correcting fuzzy PID control system. PLoS ONE 2025, 20, e0324448. [Google Scholar] [CrossRef]
- Sijia, L.; Wenwen, H.; Shipu, X.; Yingjing, W.; Yong, L.; Yunsheng, W. Research and design of intelligent irrigation control system based on fuzzy. In Proceedings of the 2021 IEEE 4th International Conference on Computer and Communication Engineering Technology (CCET), Beijing, China, 13–15 August 2021; pp. 396–401. [Google Scholar]
- Li, X.; Li, Z.; Xie, D.; Wang, M.; Zhou, G.; Chen, L. Design of farm irrigation control system based on the composite controller. Actuators 2023, 12, 81. [Google Scholar] [CrossRef]
- Cáceres, G.; Millán, P.; Pereira, M.; Lozano, D. Smart farm irrigation: Model predictive control for economic optimal irrigation in agriculture. Agronomy 2021, 11, 1810. [Google Scholar] [CrossRef]
- Quimbita, W.; Toapaxi, E.; Llanos, J. Smart irrigation system considering optimal energy management based on model predictive control (MPC). Appl. Sci. 2022, 12, 4235. [Google Scholar] [CrossRef]
- Pacheco, E.; Pérez, E.; Salvador, J.R.; Millán, P. Exploring the Capabilities of Adaptive Model Predictive Control in Irrigation Systems. In Proceedings of the 2024 European Control Conference (ECC), Stockholm, Sweden, 25–28 June 2024; pp. 418–423. [Google Scholar]
- Zhang, Y.; Wang, X.; Jin, L.; Ni, J.; Zhu, Y.; Cao, W.; Jiang, X. Research and development of an IoT smart irrigation system for farmland based on LoRa and edge computing. Agronomy 2025, 15, 366. [Google Scholar] [CrossRef]
- Sami, M.; Khan, S.Q.; Khurram, M.; Farooq, M.U.; Anjum, R.; Aziz, S.; Qureshi, R.; Sadak, F. A deep learning-based sensor modeling for smart irrigation system. Agronomy 2022, 12, 212. [Google Scholar] [CrossRef]
- Çetin, M.; Beyhan, S. Smart irrigation systems using machine learning and control theory. In The Digital Agricultural Revolution; Wiley: Hoboken, NJ, USA, 2022; pp. 57–85. [Google Scholar]
- Ji, H.; Song, D.; Zhang, C. Automatic water-saving irrigation technology for farmland based on PSO-ELM algorithm and micro control unit. Front. Mech. Eng. 2025, 11, 1619319. [Google Scholar] [CrossRef]
- Huang, Y.; Jiang, H.; Wang, W. Research on tea tree growth monitoring model using soil information. Plants 2022, 11, 262. [Google Scholar] [CrossRef] [PubMed]
- Chen, H.; Liu, C.J.; Liu, C.F.; Hu, C.-Y.; Hsiao, M.-C.; Chiou, M.-T.; Su, Y.-S.; Tsai, H.-T. A growth model to estimate shoot weights and leaf numbers in tea. Agron. J. 2019, 111, 2255–2262. [Google Scholar] [CrossRef]
- Long, L.; Shi, Y.; Ma, L.; Ruan, J. Characterization of young shoot population, yield, and nitrogen demands of tea (Camellia sinensis L.) harvested under different standards. Horticulturae 2022, 8, 275. [Google Scholar] [CrossRef]
- Awais, M.; Li, W.; Li, H.; Cheema, M.J.M.; Hussain, S.; Liu, C. Optimization of intelligent irrigation systems for smart farming using multi-spectral unmanned aerial vehicle and digital twins modeling. Environ. Sci. Proc. 2022, 23, 13. [Google Scholar]
- Sasaki, F.; Shiba, T.; Matsukura, K. Novel method of determining parameters for the effective accumulated temperature model by using seasonal pest occurrence data. Ecol. Model. 2024, 490, 110651. [Google Scholar] [CrossRef]
- Chen, X.; Xu, L.; Shi, W.; Zheng, L. Design of Wireless Monitoring System for Tea Garden. IOP Conf. Ser. Mater. Sci. Eng. 2019, 490, 062086. [Google Scholar] [CrossRef]
- Li, Y. Remote irrigation control based on LoRa technology and fuzzy PID algorithm. IEEE Access 2025, 13, 122613–122627. [Google Scholar] [CrossRef]
- Zhang, H. Optimization algorithm for PID control parameters of electrical equipment in rural electric drainage and irrigation stations. Mob. Inf. Syst. 2022, 2022, 4268662. [Google Scholar] [CrossRef]
- Nasiru, A.; Hassan, S.M.; Sadiq, A.A.; Nazif, D.M.; Isiyaka, A.A. Optimal tilt integral derivative (TID) controller design for an irrigation valve control model using adaptive spiral dynamic algorithm. Niger. J. Eng. Sci. Technol. Res. 2023, 9, 155–171. [Google Scholar]
- Carota, G.A.; Felipe, V.Q.P.; Ferreira, B.S.T.; Rodrigues, I.P.; de Almeida Pereira, A.R. Proposta de um controlador PID ajustável para um sistema de irrigação. Cad. UniFOA 2025, 20, 1–12. [Google Scholar] [CrossRef]
- Zou, X.; Liu, W.; Huo, Z.; Wang, S.; Chen, Z.; Xin, C.; Bai, Y.; Liang, Z.; Gong, Y.; Qian, Y.; et al. Current status and prospects of research on sensor fault diagnosis of agricultural internet of things. Sensors 2023, 23, 2528. [Google Scholar] [CrossRef]
- Kayad, A.; Paraforos, D.S.; Marinello, F.; Fountas, S. Latest advances in sensor applications in agriculture. Agriculture 2020, 10, 362. [Google Scholar] [CrossRef]
- Oliveira, R.C.d.; Silva, R.D.d.S.e. Artificial Intelligence in Agriculture: Benefits, Challenges, and Trends. Appl. Sci. 2023, 13, 7405. [Google Scholar] [CrossRef]
- Li, W.; Awais, M.; Ru, W.; Shi, W.; Ajmal, M.; Uddin, S.; Liu, C. Review of sensor network-based irrigation systems using IoT and remote sensing. Adv. Meteorol. 2020, 2020, 8396164. [Google Scholar] [CrossRef]
- Singh, M.; Karada, M.S.; Rai, R.K.; Pratap, D.; Agnihotri, D.; Singh, A.K.; Singh, B.K. A review on remote sensing as a tool for irrigation monitoring and management. Int. J. Environ. Clim. Change 2023, 13, 203–211. [Google Scholar] [CrossRef]
Figure 1.
The real-world view of the smart tea garden experimental base at the Jiangxi Academy of Agricultural Sciences. (A) Location of Jiangxi Province in China; (B) Location of the experimental base indicated by the red star; (C) Field view of the Gao’an test base; (D) Satellite map of the tea plantation showing the deployment of IoT nodes. The overlapping symbols indicate the high-density deployment of the sensor network. Different colored symbols represent specific devices. (E) Statistical overview of the tea plantation, including the proportion of standardized planting areas, distribution of tea varieties, and the classification of terrain slopes.
Figure 1.
The real-world view of the smart tea garden experimental base at the Jiangxi Academy of Agricultural Sciences. (A) Location of Jiangxi Province in China; (B) Location of the experimental base indicated by the red star; (C) Field view of the Gao’an test base; (D) Satellite map of the tea plantation showing the deployment of IoT nodes. The overlapping symbols indicate the high-density deployment of the sensor network. Different colored symbols represent specific devices. (E) Statistical overview of the tea plantation, including the proportion of standardized planting areas, distribution of tea varieties, and the classification of terrain slopes.
Figure 2.
The schematic diagram of functional modules for the smart tea plantation system.
Figure 2.
The schematic diagram of functional modules for the smart tea plantation system.
Figure 3.
The general framework of the smart tea plantation system. The upward arrows indicate the direction of data flow from the physical perception layer to the upper application layer.
Figure 3.
The general framework of the smart tea plantation system. The upward arrows indicate the direction of data flow from the physical perception layer to the upper application layer.
Figure 4.
The software user interface of the intelligent management platform for the smart tea plantation. Note: The original software interface is developed in Chinese for local operators. The four panels respectively display: the base overview and equipment distribution (top left), real-time video surveillance and IoT environmental data monitoring (top right), agricultural input statistics and pest diagnosis (bottom left), and agricultural machinery operation records (bottom right).
Figure 4.
The software user interface of the intelligent management platform for the smart tea plantation. Note: The original software interface is developed in Chinese for local operators. The four panels respectively display: the base overview and equipment distribution (top left), real-time video surveillance and IoT environmental data monitoring (top right), agricultural input statistics and pest diagnosis (bottom left), and agricultural machinery operation records (bottom right).
Figure 5.
The Tea Plant Phenology Perception Adaptive Decision Model Framework. The downward arrows indicate the logical and operational flow of the decision-making process from data input to final execution.
Figure 5.
The Tea Plant Phenology Perception Adaptive Decision Model Framework. The downward arrows indicate the logical and operational flow of the decision-making process from data input to final execution.
Figure 6.
The logical framework diagram of the AG-PSTC Adaptive Gain Predictive Super-Twisting Sliding Mode Control algorithm. The downward arrows indicate the sequential logic and data flow of the control algorithm, from input sensing and processing to execution and final performance output.
Figure 6.
The logical framework diagram of the AG-PSTC Adaptive Gain Predictive Super-Twisting Sliding Mode Control algorithm. The downward arrows indicate the sequential logic and data flow of the control algorithm, from input sensing and processing to execution and final performance output.
Figure 7.
The comparison of dynamic tracking curves of different control algorithms for soil moisture target values.
Figure 7.
The comparison of dynamic tracking curves of different control algorithms for soil moisture target values.
Figure 8.
The comparison of steady-state error fluctuation curves of different control algorithms in the tracking process.
Figure 8.
The comparison of steady-state error fluctuation curves of different control algorithms in the tracking process.
Figure 9.
The comparison of control phase trajectory convergence characteristics between the AG-PSTC algorithm and the traditional algorithms.
Figure 9.
The comparison of control phase trajectory convergence characteristics between the AG-PSTC algorithm and the traditional algorithms.
Figure 10.
The AG-PSTC algorithm tracking performance curve under pure time-delay parameter perturbation (±40%).
Figure 10.
The AG-PSTC algorithm tracking performance curve under pure time-delay parameter perturbation (±40%).
Figure 11.
The AG-PSTC algorithm error response curve under inertial parameter perturbation (±33%).
Figure 11.
The AG-PSTC algorithm error response curve under inertial parameter perturbation (±33%).
Figure 12.
The comparison of irrigation target value tuning trajectories generated by three decision models under simulated picking interference.
Figure 12.
The comparison of irrigation target value tuning trajectories generated by three decision models under simulated picking interference.
Figure 13.
The real-time monitoring data of multi-dimensional meteorological elements in the tea garden during the test period.
Figure 13.
The real-time monitoring data of multi-dimensional meteorological elements in the tea garden during the test period.
Figure 14.
The stability analysis of the physical and chemical environments of tea garden soil under precise irrigation control.
Figure 14.
The stability analysis of the physical and chemical environments of tea garden soil under precise irrigation control.
Table 1.
Summary of related works, features, methods, and their limitations in the context of smart tea gardens.
Table 1.
Summary of related works, features, methods, and their limitations in the context of smart tea gardens.
| Reference | Method | Key Technologies and Features | Limitations Regarding Smart Tea Gardens |
|---|
| Li X. et al. [19]; Zhang W. et al. [17]; Sijia et al. [18] | Fuzzy PID/Composite Controllers | Self-correcting mechanisms, logic-based tuning, localized control. | Struggles with large pure time-delays in long-distance hilly pipelines; prone to phase lag and oscillation. |
| Electrical Conductivity Cáceres et al. [20]; Quimbita et al. [21]; Pacheco et al. [22] | MPC and Adaptive MPC | Optimal energy management, predictive economic modeling, adaptive constraints. | High computational cost; heavily relies on accurate mathematical models, which are difficult to obtain in heterogeneous soils. |
| Jia et al. [3]; Zhang Y. et al. [23]; Ji et al. [26] | LoRa IoT + Edge Computing + PSO-ELM | Long-range low-power communication, MCU integration, swarm-optimized neural networks. | Emphasizes data transmission and static learning; lacks dynamic physiological modeling for specific crop phenology. |
| Sami et al. [24]; Abioye et al. [7]; Çetin and Beyhan [25] | Deep Learning/Machine Learning | Advanced sensor modeling, big data pattern recognition, automated scheduling. | “Black box” approach; highly vulnerable to non-physiological agronomic disturbances (e.g., sudden canopy loss due to plucking). |
Table 2.
The technical parameters of key sensing equipment in the smart tea plantation system.
Table 2.
The technical parameters of key sensing equipment in the smart tea plantation system.
| Technical Parameter | Measurement Range | Accuracy |
|---|
| Soil Moisture | 0~100% | ±3% |
| Electrical Conductivity (EC) | 0~10,000 μs/cm | 10 μs/cm |
| pH Value | 3~9 | ±0.3 |
| Temperature | −40~125 °C | ±0.2 °C |
| Humidity | 0~100% | ±3% |
Table 3.
The comparison of dynamic tracking performance indicators of different control algorithms.
Table 3.
The comparison of dynamic tracking performance indicators of different control algorithms.
| Control Algorithm | Rise Time (s) | Adjustment Time (s) | Overshoot (%) | MAE | RMSE |
|---|
| SMC | 1.23 | 7.49 | 0.06 | 3.34 × 10⁻⁴ | 3.87 × 10⁻⁴ |
| MPC | 0.03 | 6.69 | 5.05 | 1.57 × 10⁻⁶ | 1.73 × 10⁻⁶ |
| PID | 5.57 | 16.21 | 0.49 | 3.17 × 10⁻³ | 3.51 × 10⁻³ |
| Fuzzy-PID | 1.20 | 16.40 | 12.77 | 4.18 × 10⁻⁴ | 4.62 × 10⁻⁴ |
| Adaptive-PID | 0.61 | 8.65 | 21.27 | 3.54 × 10⁻⁴ | 3.91 × 10⁻⁴ |
| Smith-SMC | 0.91 | 6.35 | 0.38 | 1.85 × 10⁻³ | 2.07 × 10⁻³ |
| AG-PSTC | 1.23 | 7.54 | 0.28 | 6.94 × 10⁻⁷ | 8.64 × 10⁻⁷ |
Table 4.
The summary of robust performance evaluation of the AG-PSTC algorithm under time-delay and inertial parameter perturbations.
Table 4.
The summary of robust performance evaluation of the AG-PSTC algorithm under time-delay and inertial parameter perturbations.
Experimental
Condition | Parameter Value | Perturbation
Amplitude | Rise Time (s) | MAE
(10-5) | Conclusion |
|---|
| Nominal condition | = 5, T = 30 | 0 | 1.23 | 6.91 | Excellent benchmark performance |
| Time-delay perturbation | = 3/7 | ±40% | 1.21/1.26 | 6.88/6.95 | Extremely strong phase compensation |
| Inertial perturbation | T = 20/40 | ±33% | 1.15/1.42 | 6.90/6.98 | Stable adaptive performance |
Table 5.
The comparison of performance indicators of different decision strategies during the simulated picking interference period.
Table 5.
The comparison of performance indicators of different decision strategies during the simulated picking interference period.
| Indicator | Ordinary Upper and Lower Limit Strategy | Traditional Phenological Model | Collaborative Decision Model |
|---|
| Mean value during interference | 0.650 | 0.522 | 0.736 |
| Decision variance | 0 | 5.70 × 10⁻⁴ | 5.77 × 10⁻⁶ |
| Maximum deviation amplitude | 0 | 0.239 | 0.024 |
| Disclaimer/Publisher’s Note: The statements, opinions and data contained in all publications are solely those of the individual author(s) and contributor(s) and not of MDPI and/or the editor(s). MDPI and/or the editor(s) disclaim responsibility for any injury to people or property resulting from any ideas, methods, instructions or products referred to in the content. |