Article

On-Device Motion Activity Intensity Recognition Using Smartwatch Accelerator

School of AI Convergence, Sungshin Women’s University, 34 da-gil 2, Bomun-ro, Seongbuk-gu, Seoul 02844, Republic of Korea
*
Author to whom correspondence should be addressed.
Electronics 2026, 15(7), 1351; https://doi.org/10.3390/electronics15071351
Submission received: 10 February 2026 / Revised: 10 March 2026 / Accepted: 11 March 2026 / Published: 24 March 2026
(This article belongs to the Special Issue Wearable Sensors for Human Position, Attitude and Motion Tracking)

Abstract

Wearable device-based Human Activity Recognition (HAR) is widely used in health management, rehabilitation, and personal safety. While contemporary HAR research effectively classifies a wide range of discrete activities, there remains a significant gap in organizing these heterogeneous motions into a structured intensity framework suitable for continuous risk assessment. Furthermore, many high-performing models rely on computationally intensive architectures that hinder real-time deployment on resource-constrained wearables. We propose an on-device method for estimating five-level activity intensity in real time using only accelerometer signals from a commercial smartwatch. To bridge the gap between simple identification and intensity modeling, 13 dynamic and emergency-like wrist motions were integrated with 11 daily activities from the PAMAP2 dataset, yielding 21 activities mapped onto an ordinal five-level intensity scale. A finetuned Multi-Layer Perceptron (MLP) classifier trained on this integrated dataset achieved 0.939 accuracy and a quadratic weighted kappa (QWK) of 0.971. The model was deployed on a Galaxy Watch 7, achieving < 1 ms inference latency and a size < 0.1 MB, confirming real-time feasibility. This approach demonstrates that organizing diverse activities into a lightweight, intensity-aware framework provides a robust foundation for safety-aware monitoring systems under real-world, on-device constraints.

1. Introduction

As societal concerns about personal safety grow, the need for real-time monitoring technology using wearable devices is increasing. Smartwatches incorporate sensors such as accelerometers, heart rate monitors, and GPS, enabling them to sensitively capture changes in user activity. They hold significant potential not only for health management and rehabilitation but also for detecting dangerous situations. Importantly, danger often manifests not as a single abrupt event but through gradual changes in activity intensity that serve as early indicators. Therefore, beyond simply classifying activities, a methodology is needed to represent human behavior along discretized ordinal intensity levels, providing a foundation for subsequent risk assessment.
Recent safety-oriented HAR research has explored various applications, including fall detection, personal protection monitoring, and workplace safety management. However, many existing approaches depend on the offline analysis of data collected in controlled laboratory environments, with limited validation on actual wearable devices. Moreover, for users who are highly likely to be exposed to dangerous situations—such as individuals under personal protection—technology that detects risks in real time through a worn smartwatch is crucial for enabling immediate response. These limitations underscore the need for real-time HAR models capable of recognizing multi-level activity intensity.
To address this, we constructed a new smartwatch accelerometer dataset containing dynamic and emergency-like wrist motions that are largely absent from existing public HAR datasets. Designed to capture a wide range of real-world intensity variations, this dataset complements established activity corpora used to represent lower-intensity daily and static behaviors. Extending this perspective to the protection of individuals under wearable-based personal safety monitoring supports the development of situation-specific, tiered alert systems.
Motivated by these needs, this study proposes an on-device accelerometer-only framework for five-level activity intensity estimation, with the objective of determining its feasibility under the computational and memory constraints of a commercial smartwatch. In this framework, the spectrum of activity intensity is presented by five ordinal levels, where the highest level includes aggressive or emergency-like wrist movements that may be associated with potentially dangerous situations. This study supports the development of a hierarchical warning system by aiming to develop threat detection technology for women in their 20s and 30s, the primary target group of personal protection programs, as part of public safety R&D efforts.
The main contributions of this study are as follows:
(1)
Development of a multi-level activity intensity recognition model: Using only accelerometer signals from a smartwatch, we mapped 21 activities to five intensity levels and designed a model capable of real-time inference with four features.
(2)
Dataset construction for activity intensity recognition: We built the core of our dataset using 13 Dyn-Intensity activities designed to capture dynamic and emergency-like wrist motions, and complemented them with 11 low-intensity PAMAP2 activities. This integration produced a unified 21-class dataset spanning an activity intensity spectrum.
(3)
On-device real-time verification: The proposed model was deployed on a Galaxy Watch 7, achieving <1 ms inference latency and a memory footprint of <0.1 MB, demonstrating real-time feasibility on commercial devices.
The remainder of this paper is organized as follows. First, we provide an overview of prior research on wearable-based activity recognition and intensity estimation. We then describe the datasets, feature engineering process, and model design employed in this study. Next, we outline the experimental setup and evaluation procedures used to validate the proposed model. The results are subsequently presented and analyzed, including both model performance and on-device evaluation. We then discuss the main findings and their broader implications. Finally, we conclude the paper with closing remarks and potential directions for future research.

2. Related Work

HAR using IMU-based sensing has advanced significantly across healthcare, fitness, and safety monitoring [1,2,3,4]. Early studies primarily focused on classifying fundamental activities—such as walking, running, and sitting—using accelerometer and IMU time-series data. Classic reviews, such as Bulling et al. [5], summarized the general HAR pipeline from pre-processing to classification, while Attal et al. [6] benchmarked machine learning methods for accelerometer-based activity recognition. More recently, deep learning architectures such as CNN, DeepConvLSTM, and Transformer-based models, including Conformer, have demonstrated outstanding performance on datasets containing wearable IMU sensor data for HAR [7,8]. These approaches have established a robust research foundation for reliable nominal multi-class activity recognition, where activity labels are treated as discrete and unordered categories.
Alongside advances in activity-type classification, increasing attention has been directed toward estimating activity intensity from wrist-worn accelerometers due to its relevance to health monitoring and behavioral assessment [9,10]. In physical-activity research, intensity is commonly structured using a four-level taxonomy based on Metabolic Equivalents (METs)—sedentary, light, moderate, and vigorous (SLMV) [11]. Despite the inherently ordered nature of such scales, many computational approaches formulate intensity estimation as a standard multi-class classification problem. In practice, several studies further simplify the task into the binary detection of moderate-to-vigorous physical activity (MVPA) versus non-MVPA [12,13], thereby reducing the granularity of the intensity spectrum and not explicitly incorporating ordinal relationships into the modeling objective.
To address this limitation, a limited number of studies have explored ordinal modeling strategies. Hossain et al. [14] applied ordinal random forest and partial proportional odds models to four-level activity intensity classification from accelerometer data. Similarly, Bağcı Daş and Birant [15] introduced HAROC, an ordinal classification framework for HAR based on band-power-derived activity ordering. These works represent meaningful efforts to incorporate ordered structure into activity modeling. However, most evaluations have been conducted in controlled laboratory environments using multi-sensor configurations or offline processing pipelines, and real-time deployment on single wrist-worn devices has been less extensively investigated.
In parallel, substantial progress has been made in real-time on-device HAR. Lightweight architectures such as TinierHAR [16] and smartwatch inference pipelines achieving sub-10 ms latency [17] have demonstrated the feasibility of executing nominal activity classification under strict computational constraints. Advances in edge-oriented deep learning design [18] and efficient triggering mechanisms [19] have further enhanced deployment practicality in wearable systems. Nevertheless, these developments have predominantly focused on activity-type recognition, while the preservation of ordinal intensity structure within a single accelerometer-based, real-time inference framework remains comparatively underexplored.
Taken together, nominal multi-class activity recognition and lightweight real-time HAR have achieved considerable maturity. However, the integration of ordinal activity intensity modeling with single-sensor, wrist-worn, real-time on-device deployment remains relatively limited. To address this gap, the present study proposes an accelerometer-only framework for five-level ordinal activity intensity estimation and validates its feasibility under the computational and memory constraints of a commercial smartwatch platform.

3. Methods

3.1. System Overview

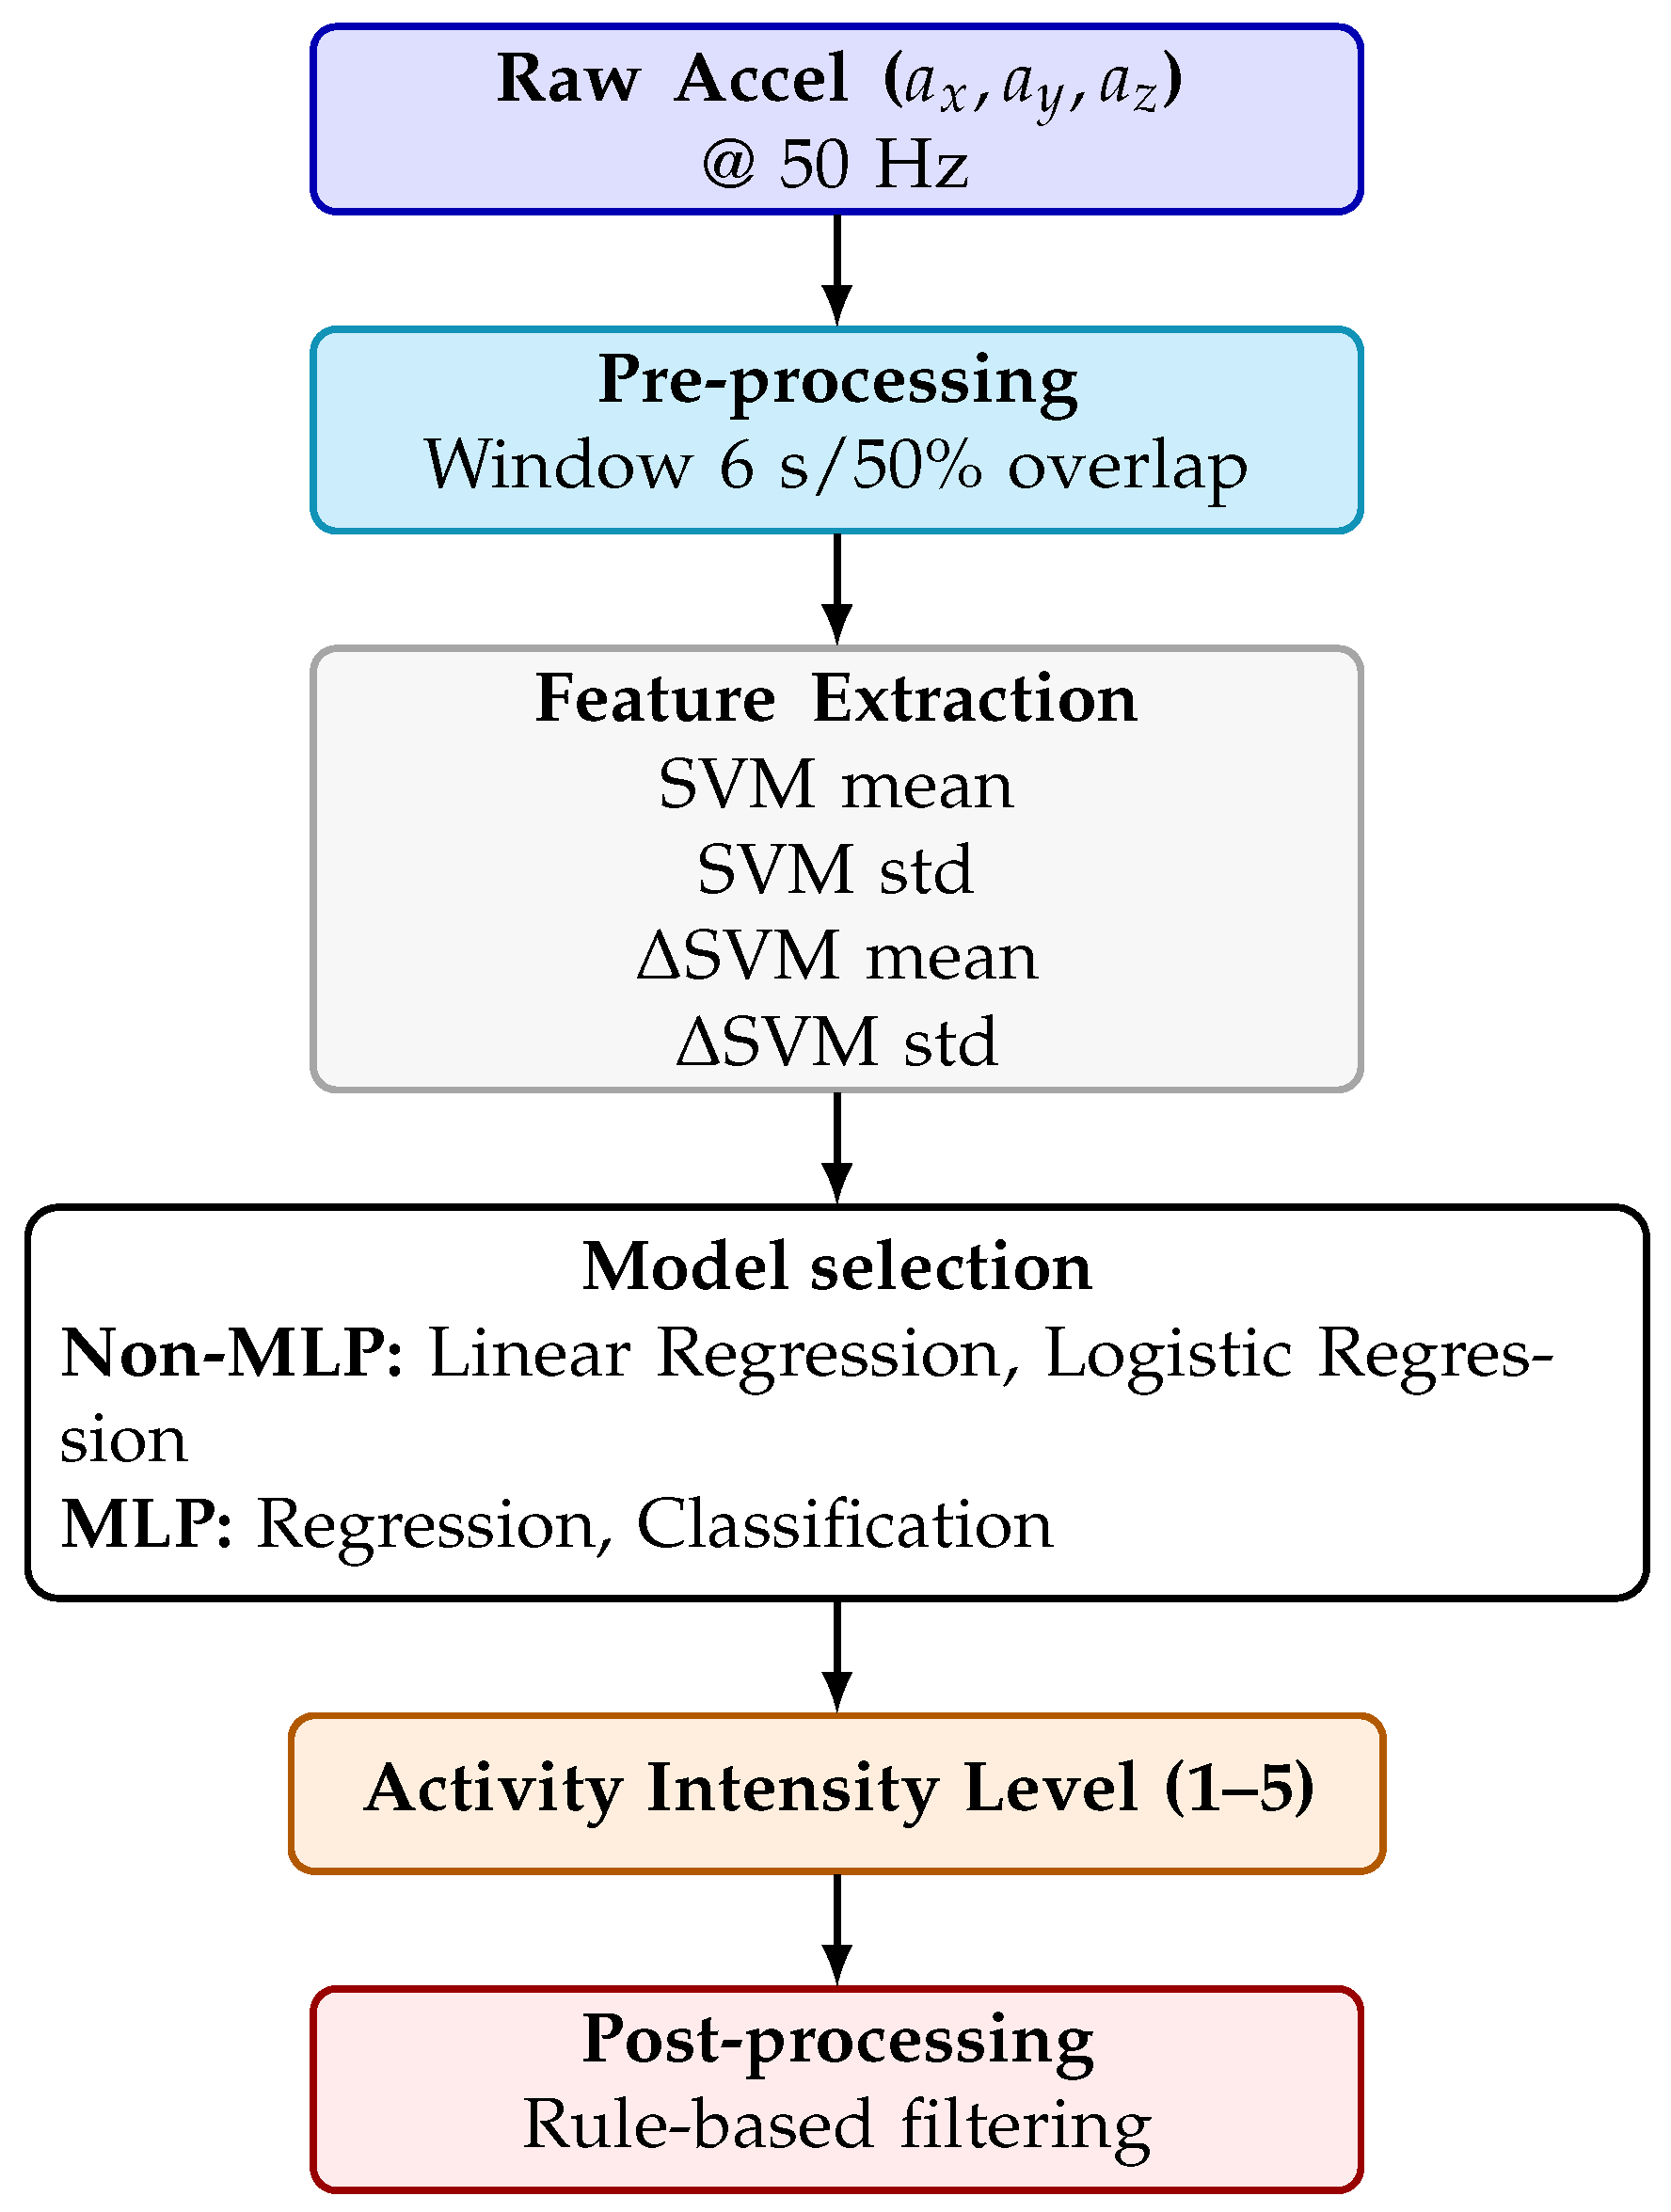
Figure 1 illustrates the overall pipeline of the proposed on-device multi-level activity intensity recognition framework. The 3-axis accelerometer signals from the smartwatch are sampled at 50 Hz and processed in four stages:
Pre-processing: Raw signals ( a x , a y , a z ) are segmented into 6 s sliding windows with 50% overlap, providing fixed intervals for analysis.
Extracting features from raw data: Within each window, two derived signals are computed: the Signal Vector Magnitude (SVM) and its temporal difference ( Δ SVM). The mean and standard deviation of each are computed, resulting in four lightweight statistical features (SVM mean, SVM std, Δ SVM mean, Δ SVM std).
Modeling: The extracted features were normalized according to each model’s requirements and subsequently fed into two types of predictive models: non-MLP methods (Linear Regression [20], Logistic Regression [21]) and MLP methods (regression and classification variants [22]). Each model estimates the activity intensity on a five-level scale.
Post-processing: MLP model implementations employ temporal smoothing, hysteresis rules, median filtering, and jerk suppression, whereas non-MLP model implementations apply probability thresholds, margin conditions, and standardized feature gating. This pipeline is optimized for lightweight, real-time operation on commercial smartwatch platforms and is validated through on-device evaluation.

3.2. Data Acquisition

This study utilized two complementary datasets: a newly collected smartwatch accelerometer dataset, Dyn-Intensity, and a publicly available dataset, PAMAP2. Dyn-Intensity was designed to capture dynamic and emergency-like wrist motions that are generally absent from existing HAR datasets, while PAMAP2 provides representative static and low-intensity daily activities. Together, these datasets offer a broad range of movements needed to model continuous activity intensity. Data can be found at https://github.com/AILAB-IMU/Dyn-Intensity (accessed on 9 February 2026).
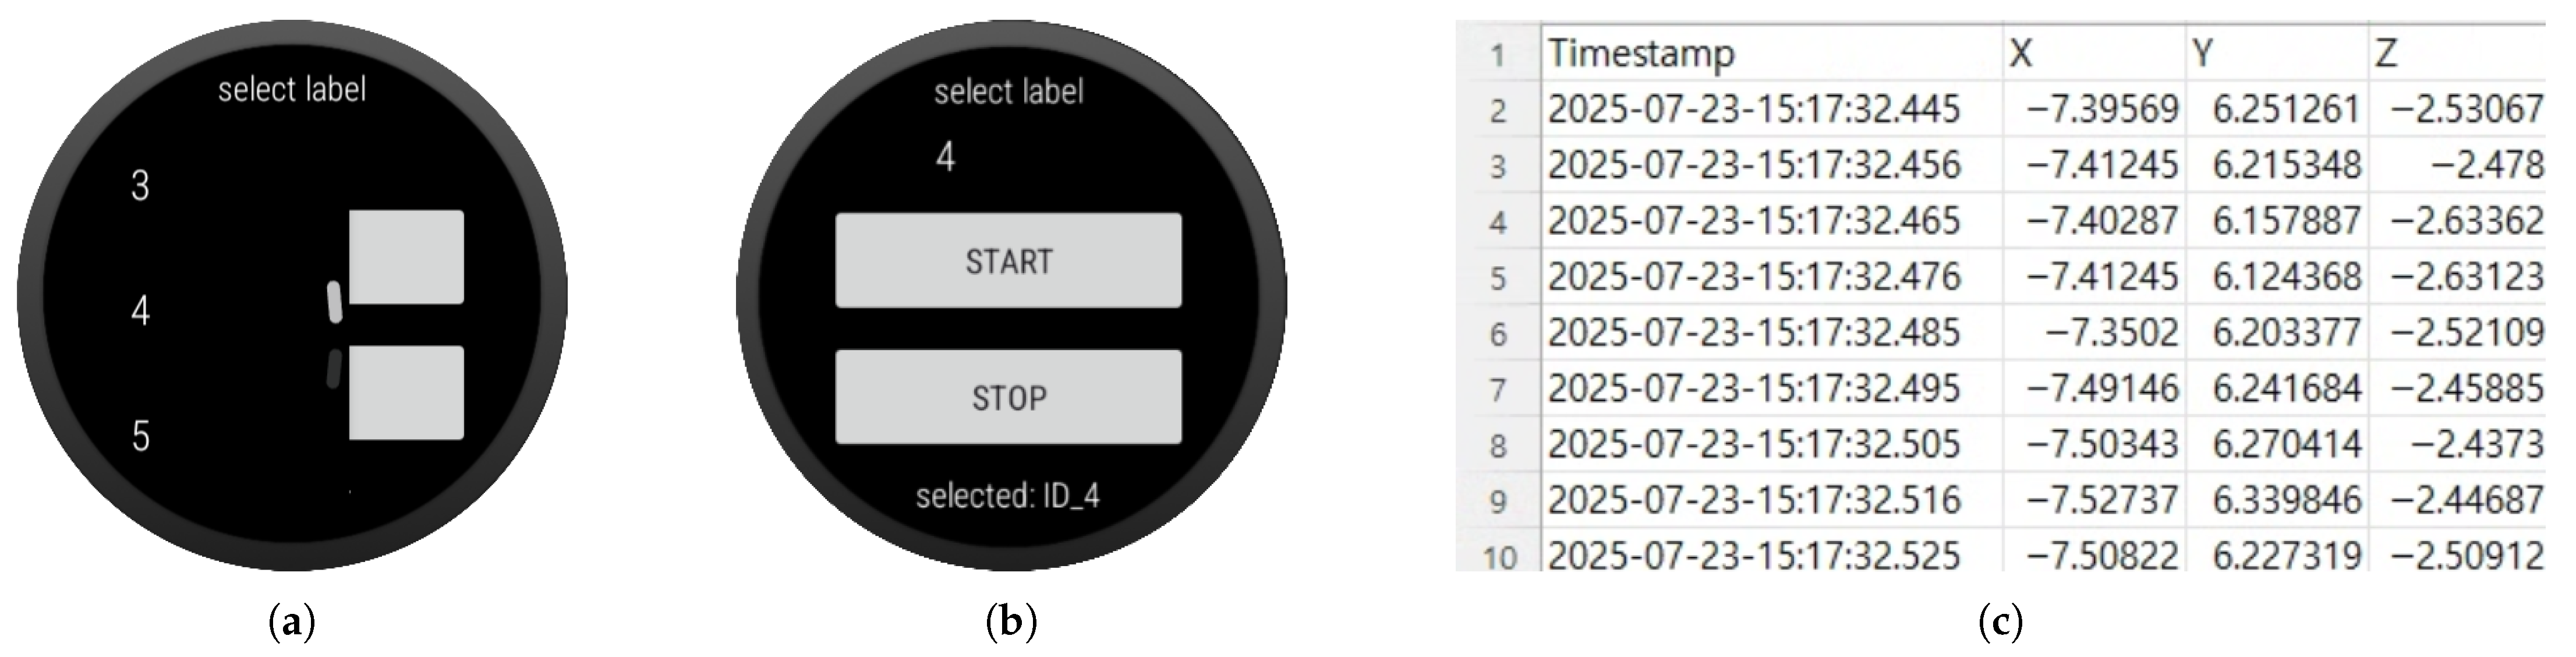
Dyn-Intensity Dataset. Dyn-Intensity was collected from eight female participants aged 20–23, each wearing a Samsung Galaxy Watch 7 on the dominant wrist. The dataset contains three static activities (lying, sitting, watching TV), nine dynamic activities (running, ascending stairs, descending stairs, rope jumping, slalom running, jumping jacks, board work, palm pushing, dynamic handclap) and several emergency-like movements (sudden sprints, irregular arm motions, violent whole-body gestures) to represent high-intensity behaviors. These emergency-like motions were grouped into a single emergency-like motion category and subsequently mapped to the highest activity intensity level (Level 5). Participants selected activity labels directly on the watch, and Figure 2 illustrates the recorded accelerometer log structure. A detailed list of Dyn-Intensity activities is provided in Table 1. To ensure precise temporal alignment between activity labels and sensor signals, the data segments recorded before the actual onset of each activity (after pressing the start button) and after the completion of the activity (before pressing the stop button) were manually removed. This trimming process was performed by synchronizing the recorded accelerometer logs with simultaneously captured video recordings, allowing non-activity intervals to be accurately identified and excluded from the dataset.
PAMAP2 Dataset. To complement Dyn-Intensity with additional static and low-intensity daily activities, we selected 11 activities from the PAMAP2 dataset [23], including lying, sitting, standing, walking, cycling, watching TV, computer work, car driving, ironing, folding laundry, and vacuum cleaning. The rationale for this selection is revisited in the Activity Intensity-Level Mapping section, where feature distributions are compared between datasets. Detailed descriptions appear in Table 2. Since the PAMAP2 accelerometer signals are originally sampled at 100 Hz, an anti-aliasing low-pass FIR filter (cutoff = 22.5 Hz, below the Nyquist frequency of 25 Hz) was applied prior to decimation, and the signals were subsequently downsampled to 50 Hz to ensure consistent temporal resolution with the Dyn-Intensity dataset.
Activity Class Integration. To build a unified dataset, overlapping activities (lying, sitting, watching TV) were merged after confirming that their feature distributions were nearly identical across datasets. The final integrated dataset consists of 21 activity classes, spanning static, daily, dynamic, and emergency-level movements.

3.3. Signal Pre-Processing

The collected acceleration signals were segmented into fixed time intervals for analysis. Each interval was defined as 6 s (300 samples), with adjacent windows overlapping by 3 s (150 samples). This sliding-window strategy enables the capture of abrupt short-duration motions while maintaining stable feature extraction over longer temporal contexts. A 6 s window length was selected to balance responsiveness and statistical stability for wrist-worn accelerometer signals, as shorter windows are more sensitive to transient fluctuations, whereas longer windows increase decision latency. This choice is further supported by a systematic sensitivity analysis reported in study [24], which demonstrated progressive performance improvement with increasing window duration in wrist-based accelerometer activity recognition. The 50% overlap further reduces effective latency and ensures smoother temporal transitions between consecutive predictions without incurring significant computational overhead, making this configuration suitable for real-time on-device intensity estimation.

3.4. Feature Extraction

Each segmented window was processed to derive two motion-related signals from the tri-axial acceleration data ( a x , a y , a z ) :
  • Signal Vector Magnitude (SVM):
    SVM t = a x , t 2 + a y , t 2 + a z , t 2 ,
    representing the overall magnitude of motion at time t.
  • Delta Signal Vector Magnitude ( Δ SVM):
    Δ SVM t = SVM t SVM t 1 , ( t > 1 )
    capturing instantaneous changes between consecutive samples.
For both signals, the mean and standard deviation were computed within each window, yielding four features:
  • SVM mean and SVM standard deviation: indicators of overall motion intensity and stability.
  • Δ SVM mean and Δ SVM standard deviation: descriptors of rapidity and irregularity of temporal changes.
These features require only O ( L ) computation per window, where L is the number of samples in a window, making them suitable for lightweight on-device processing.
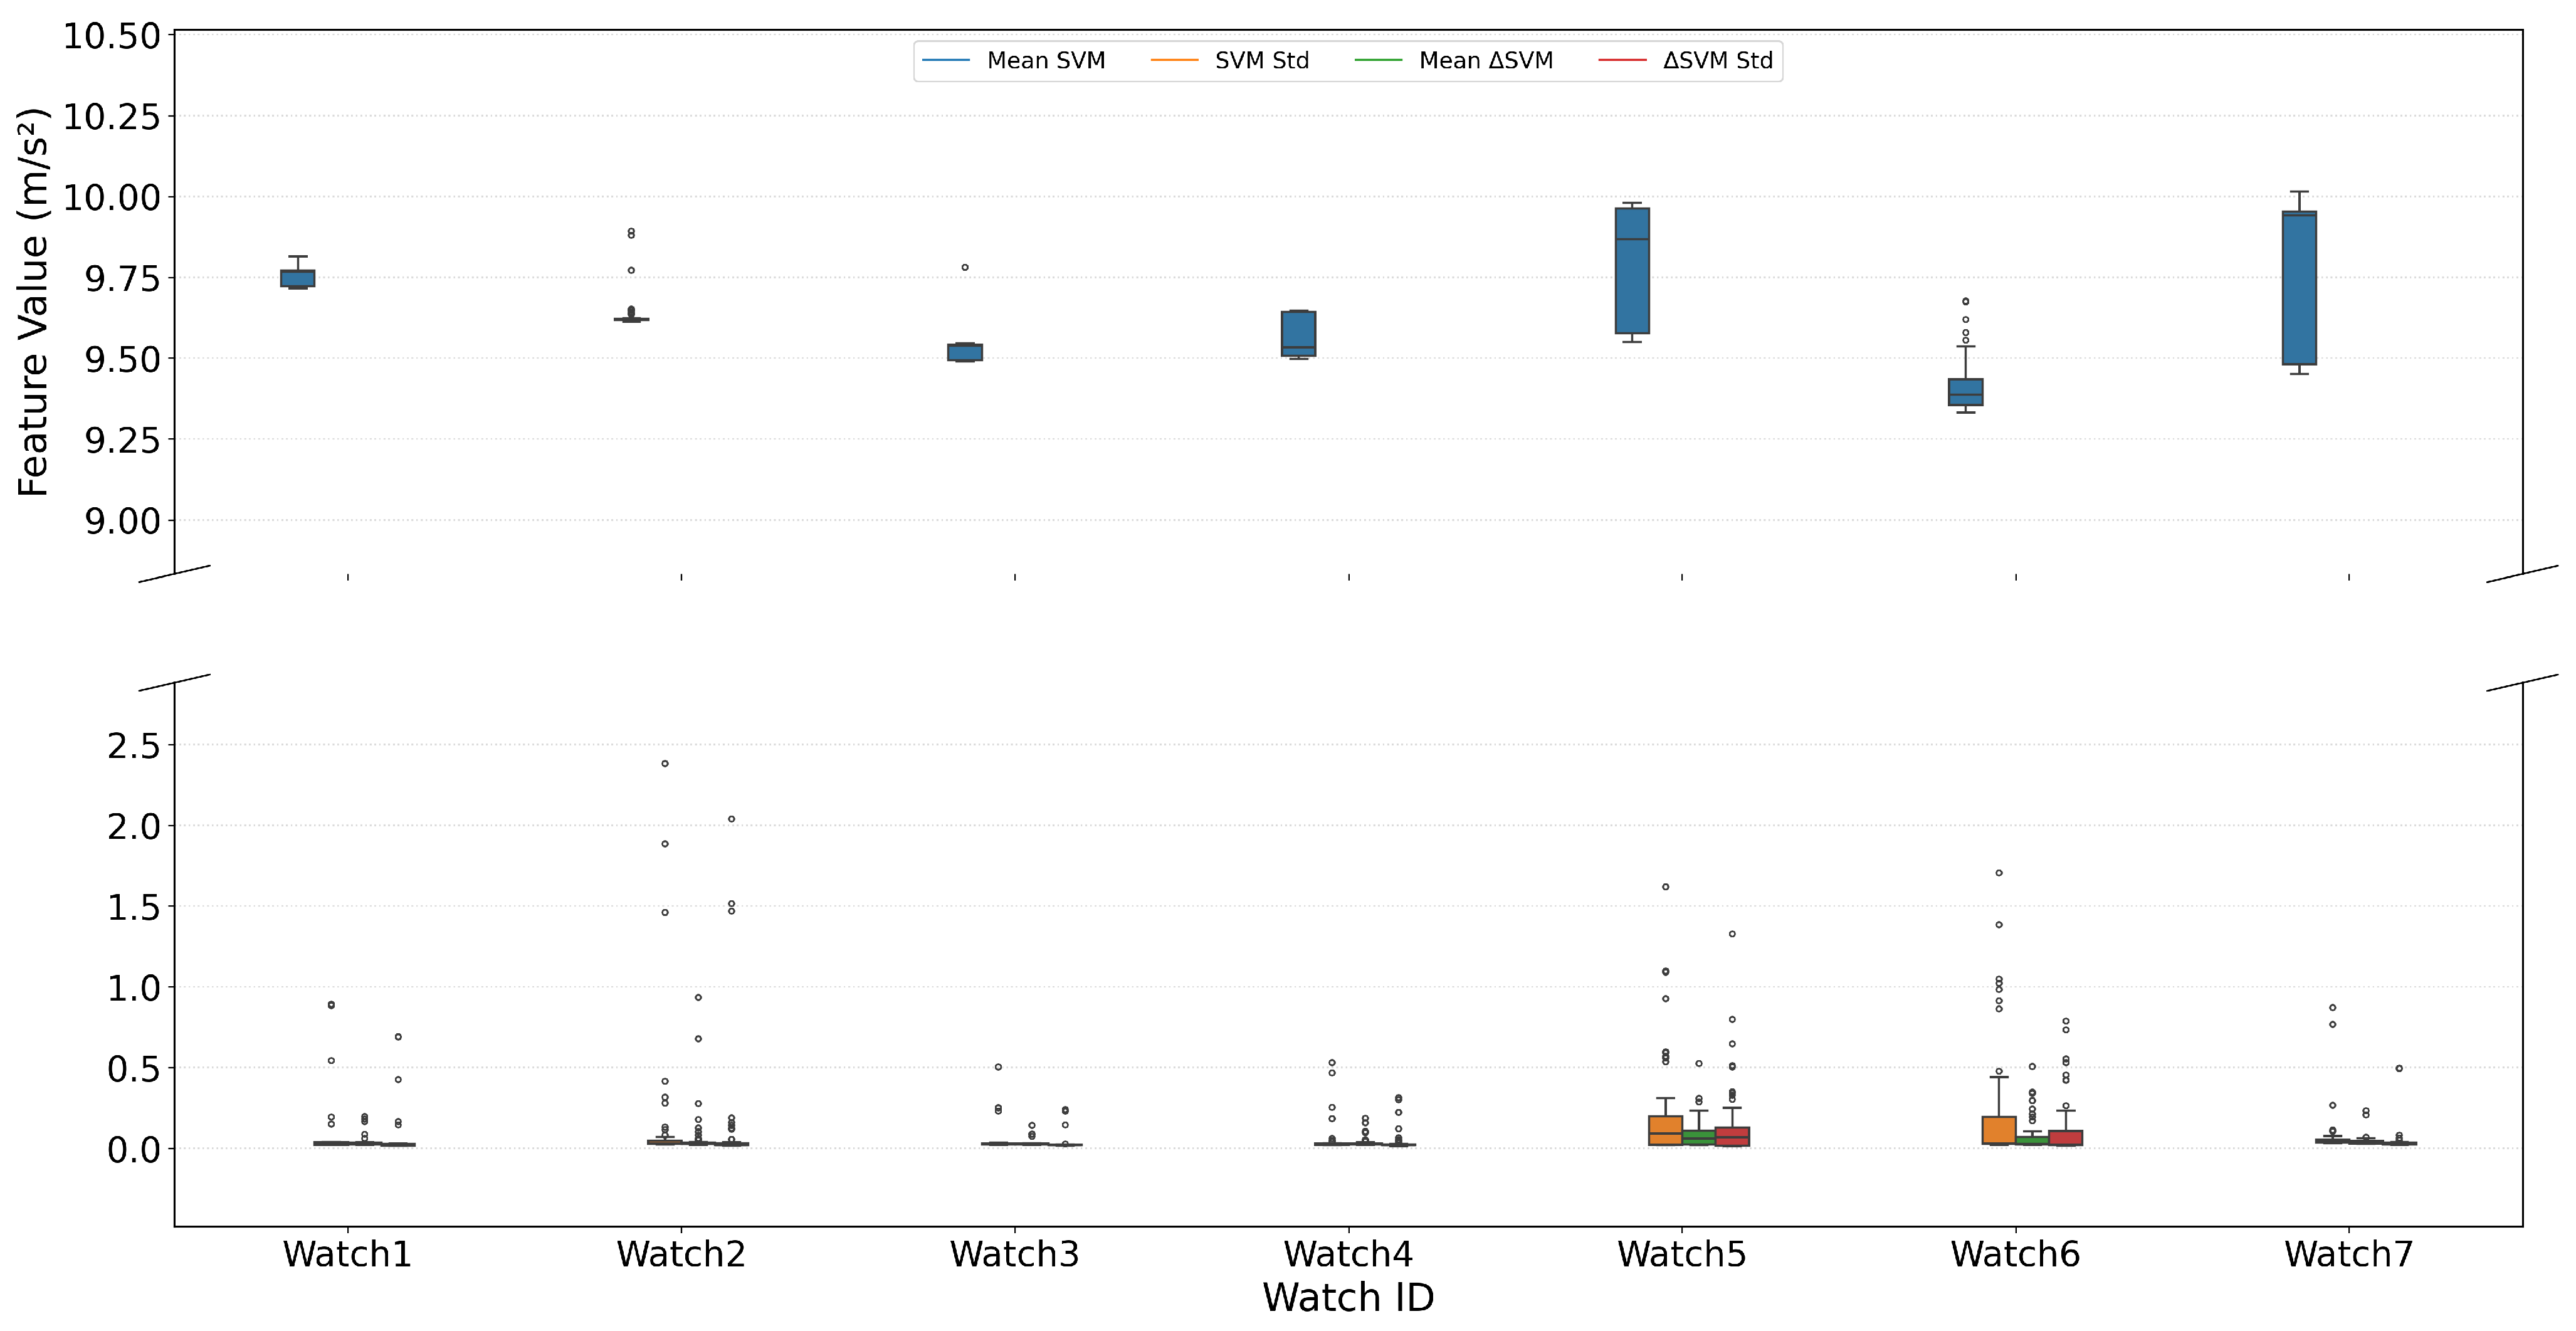
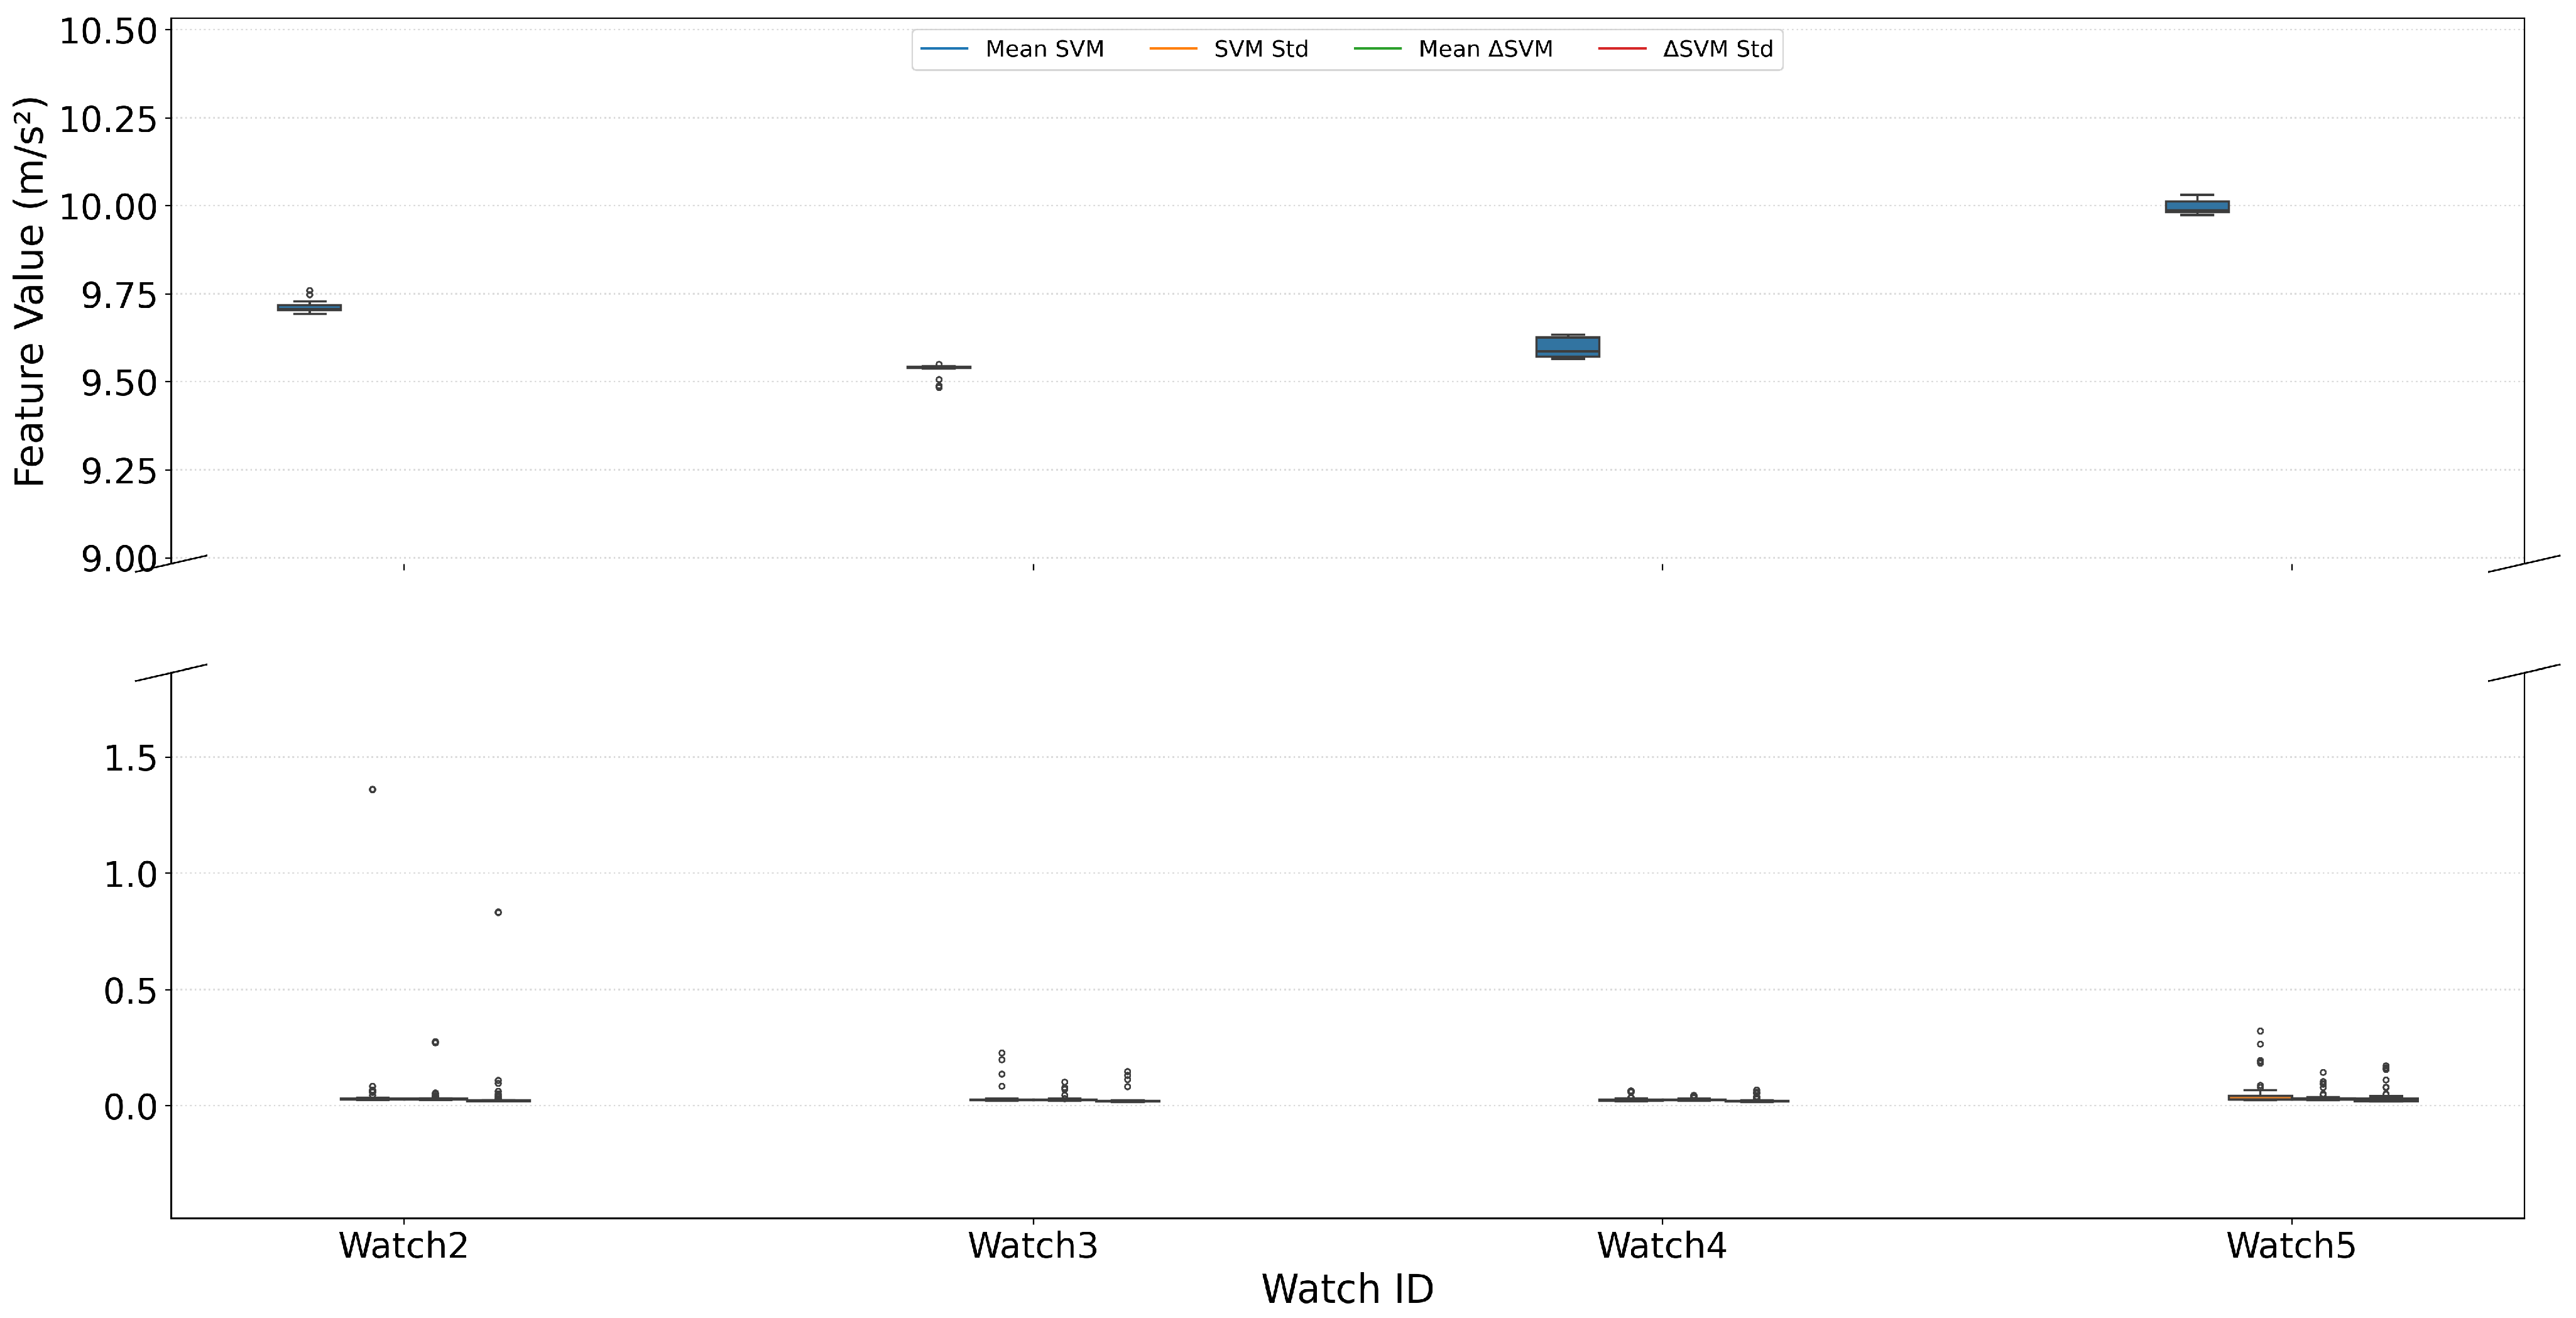
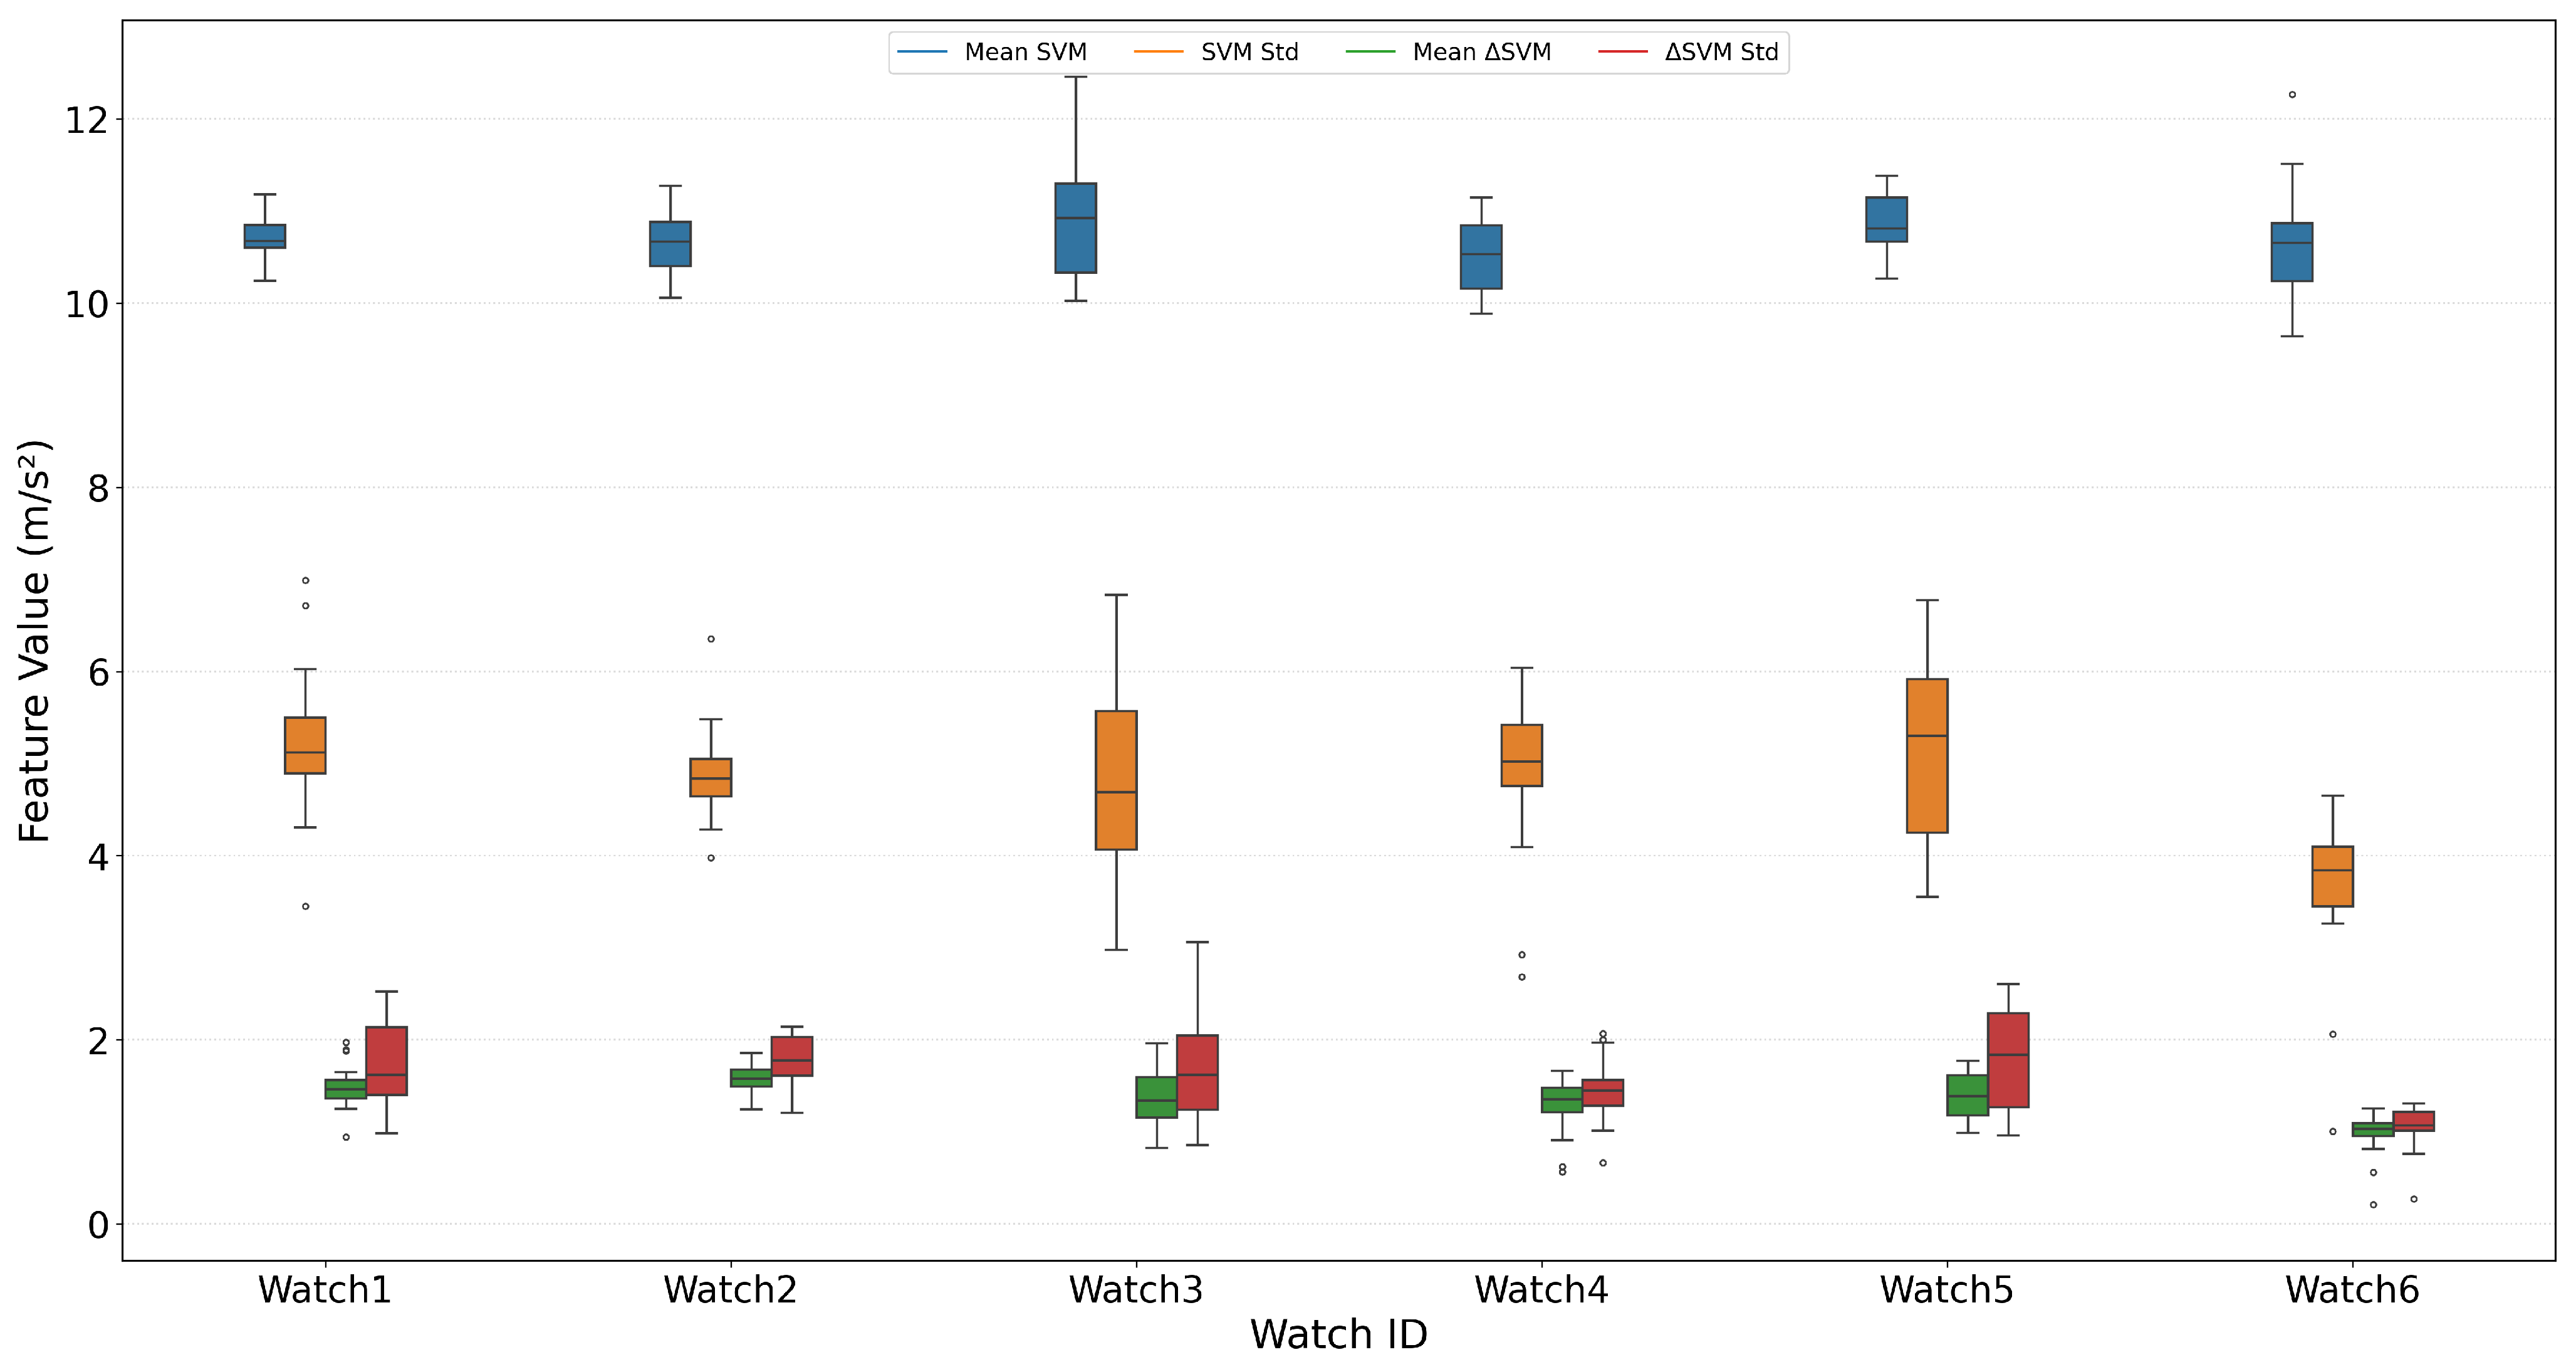
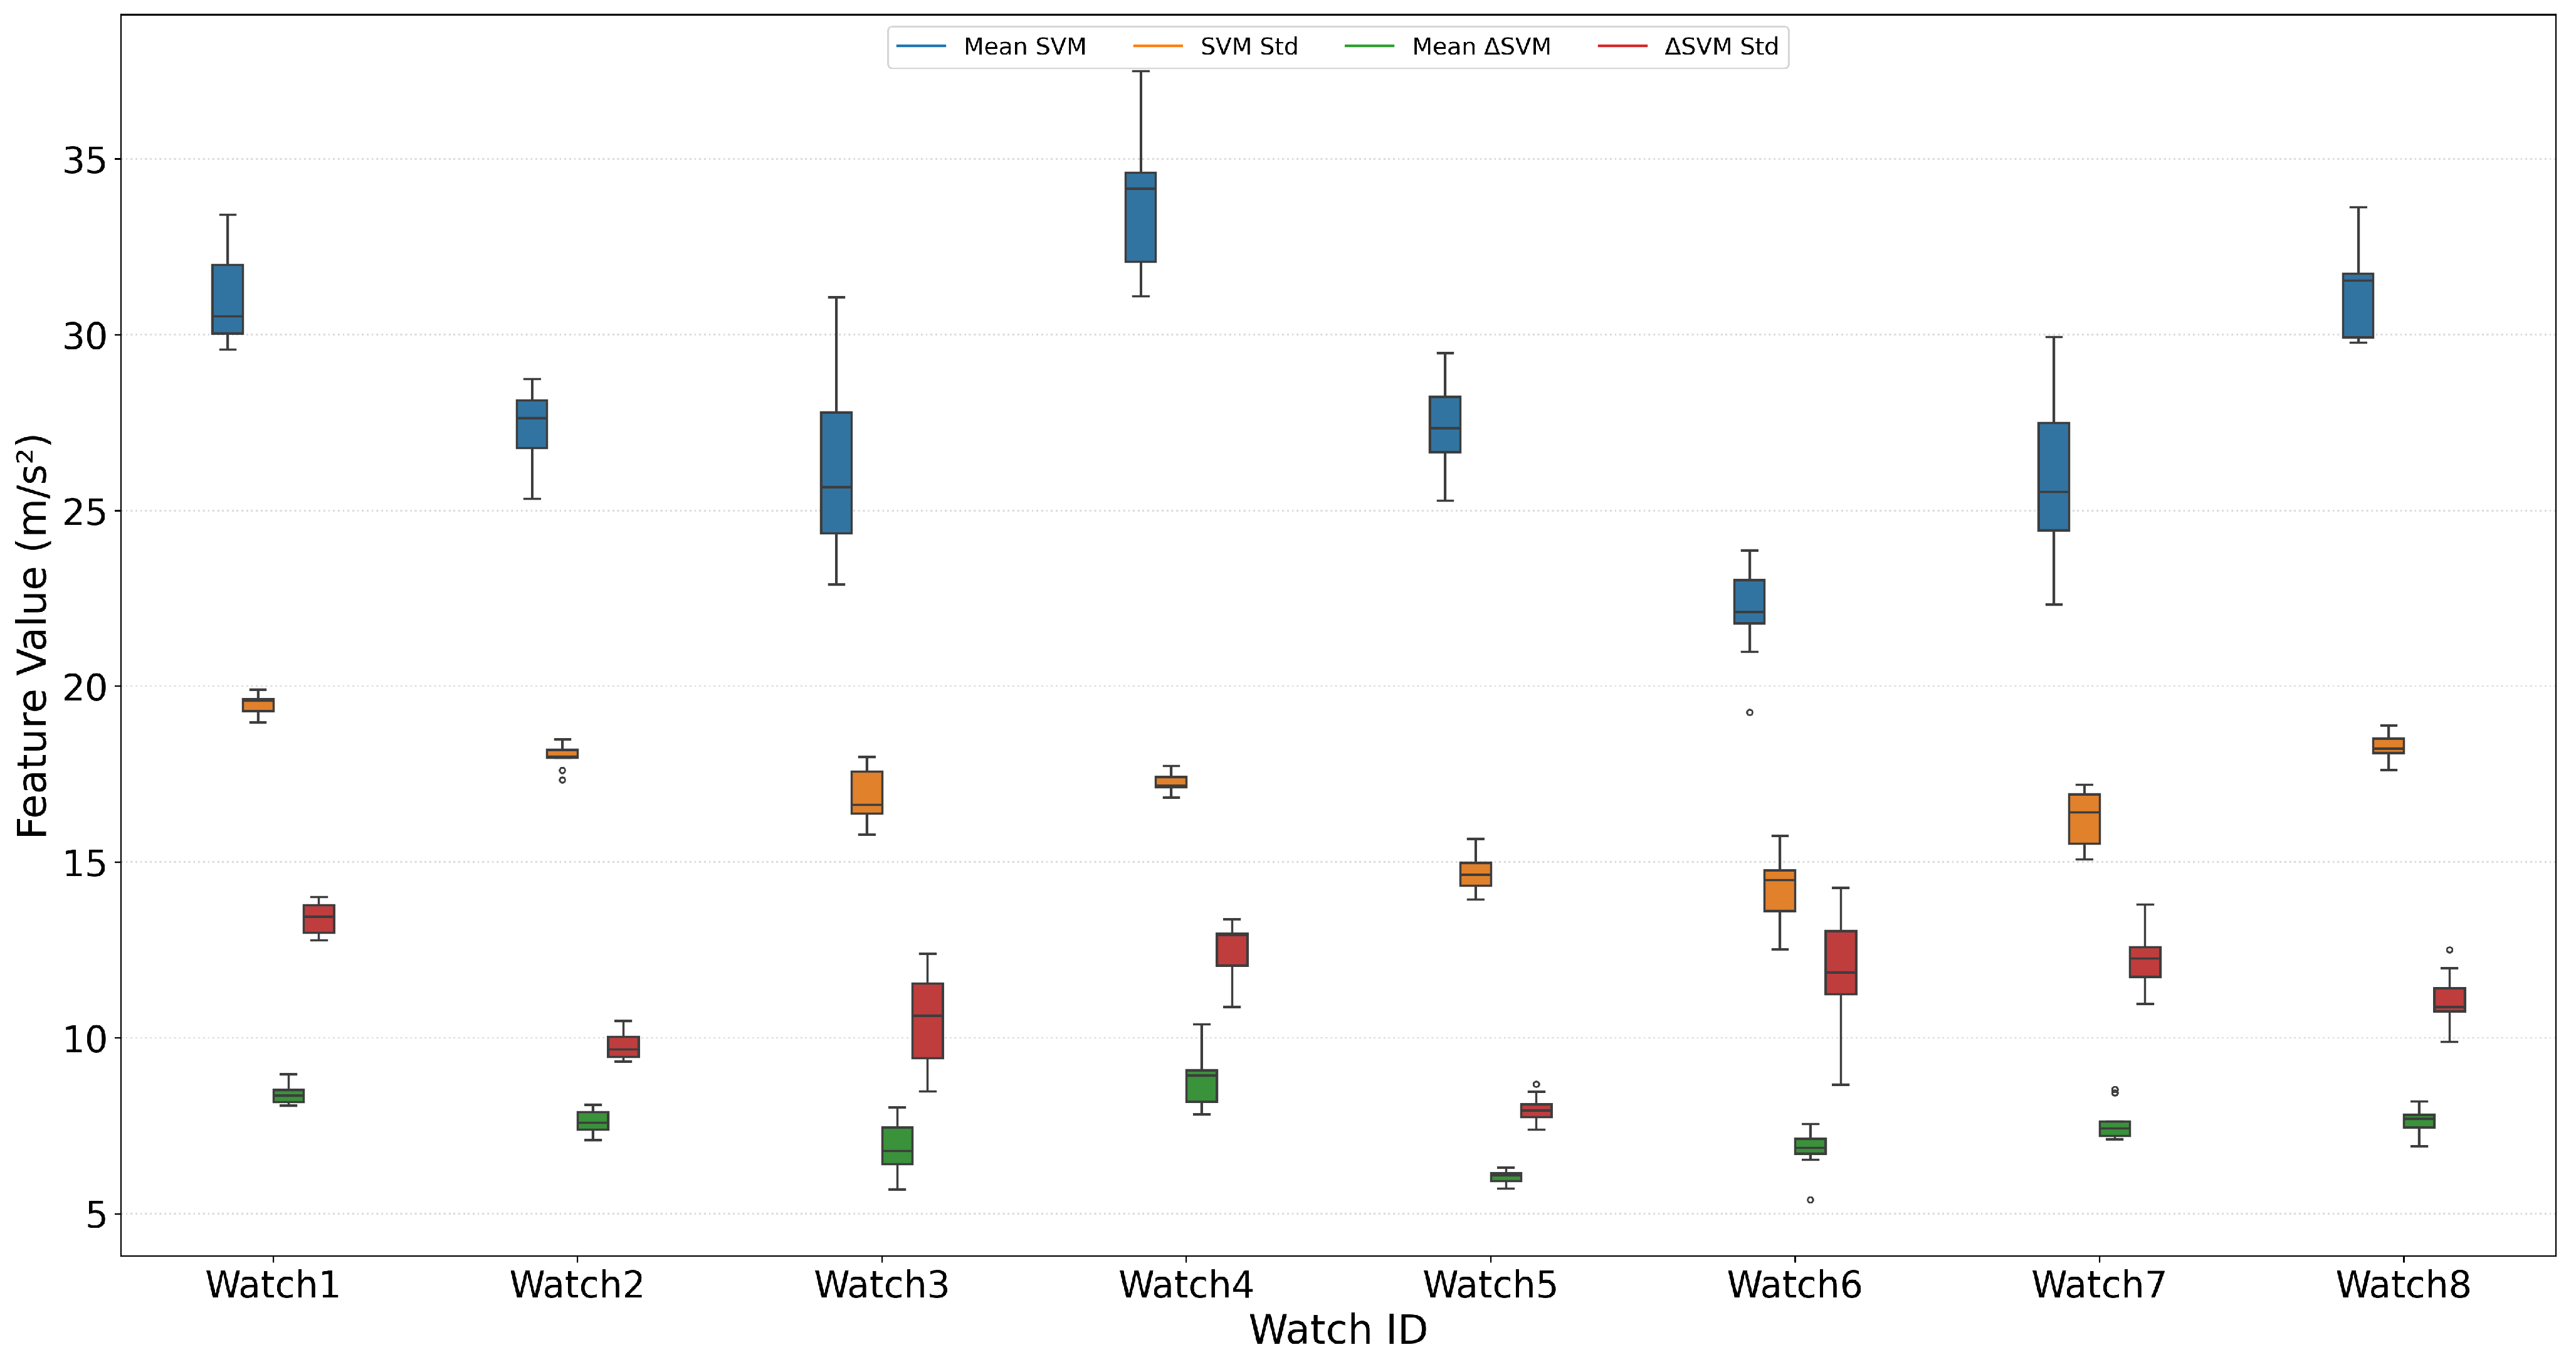
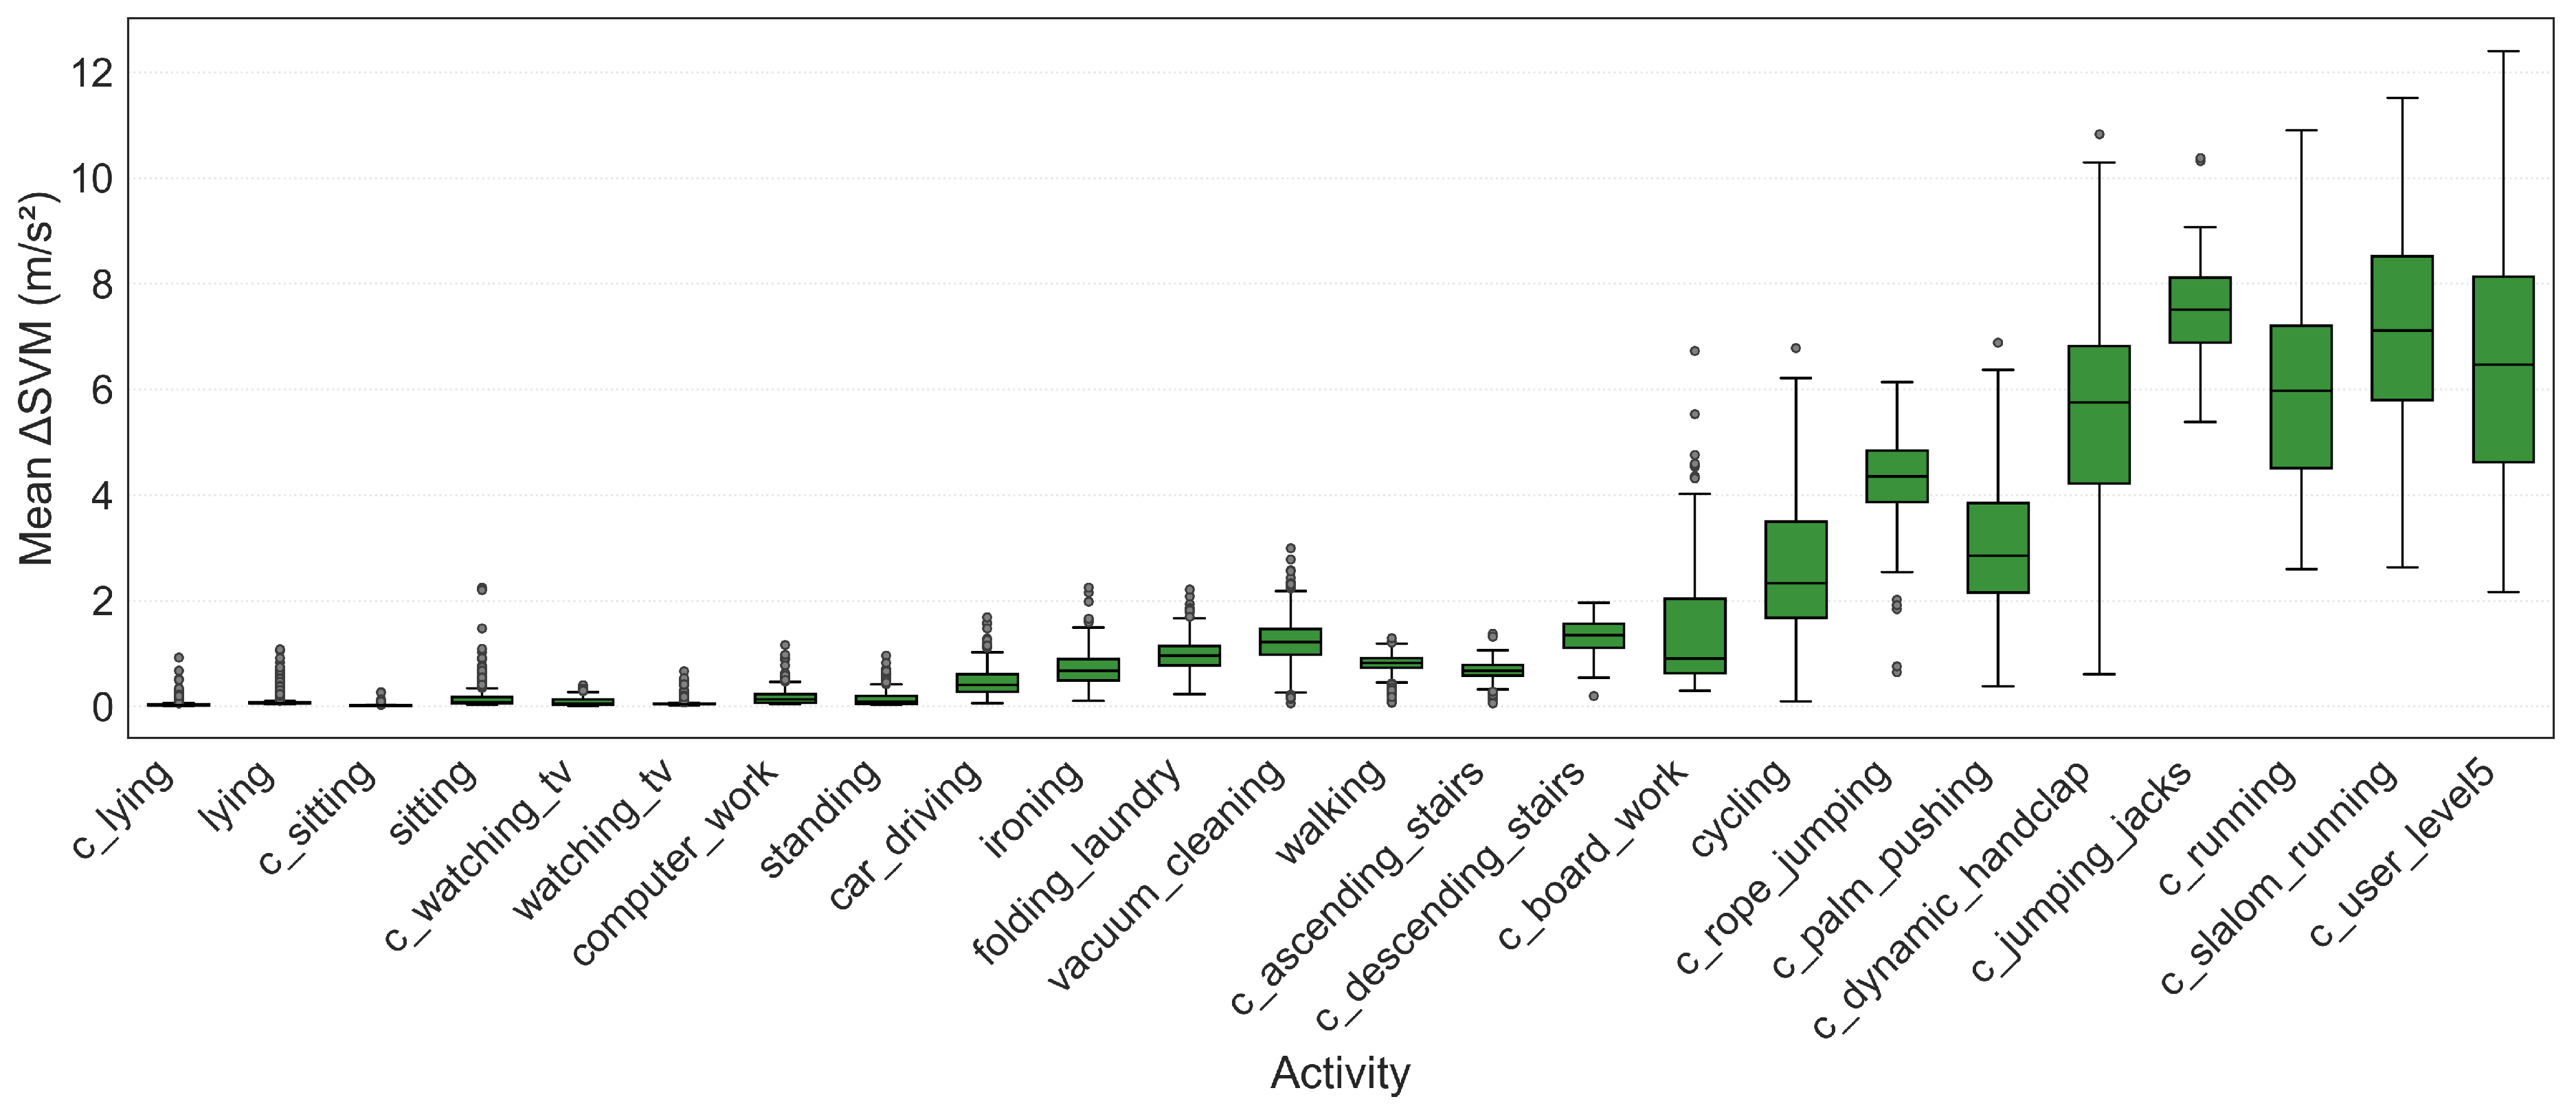
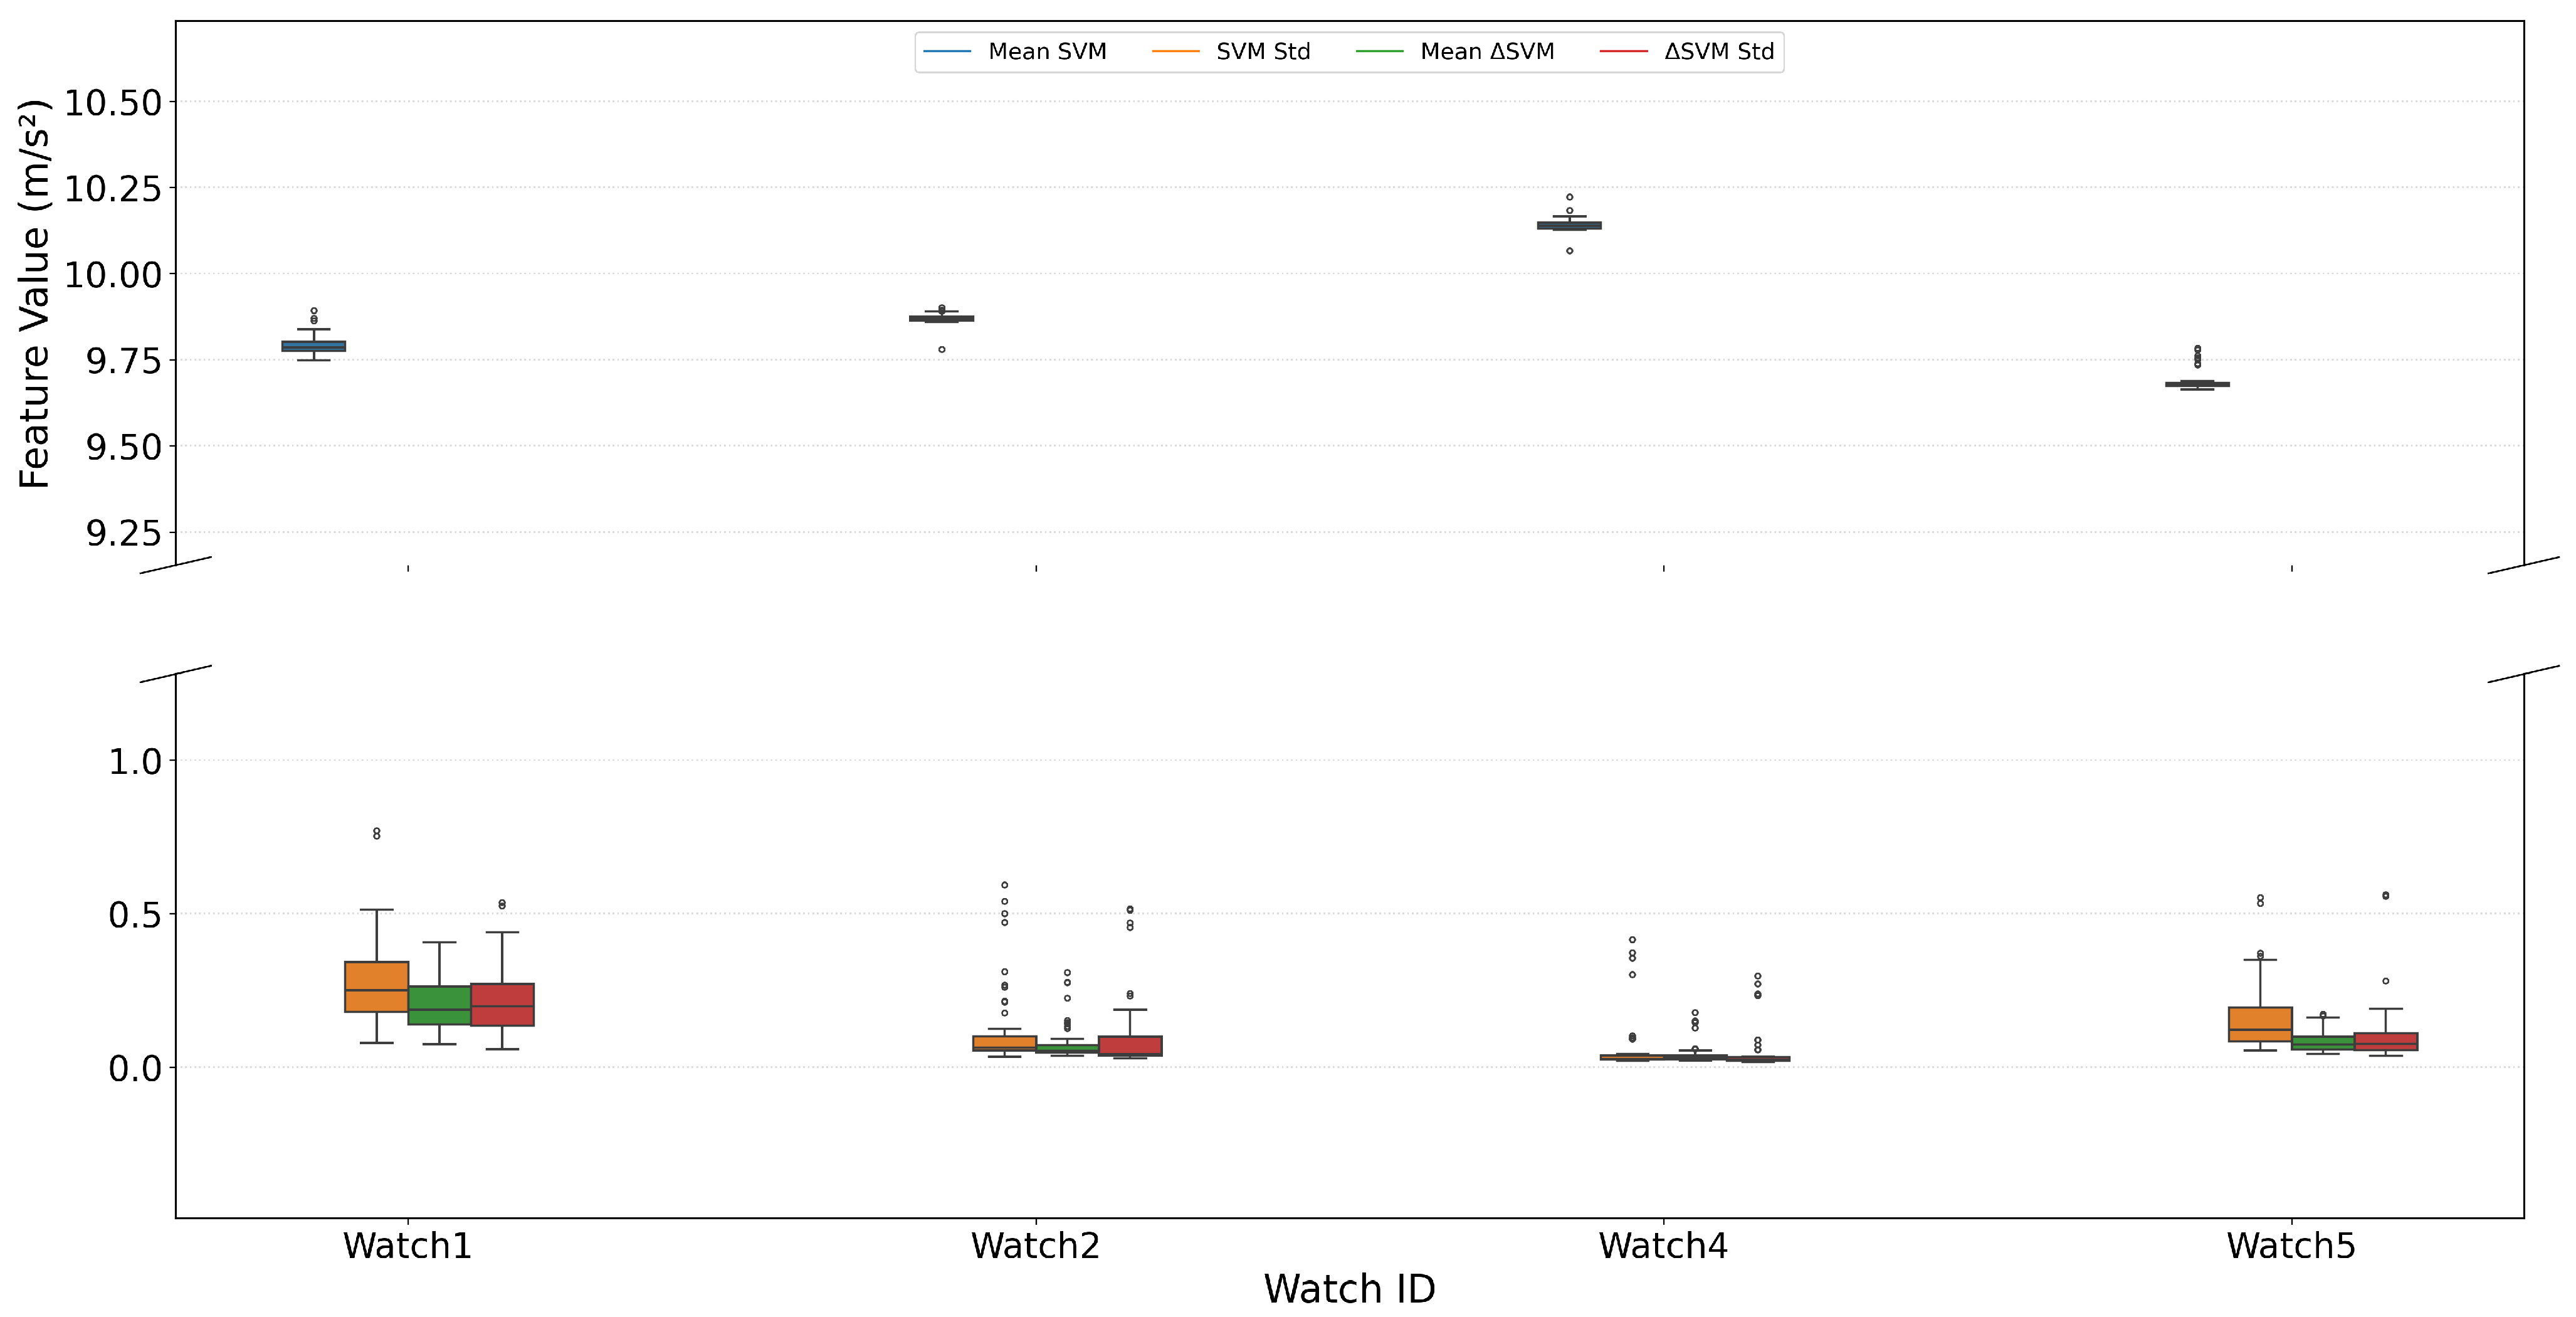
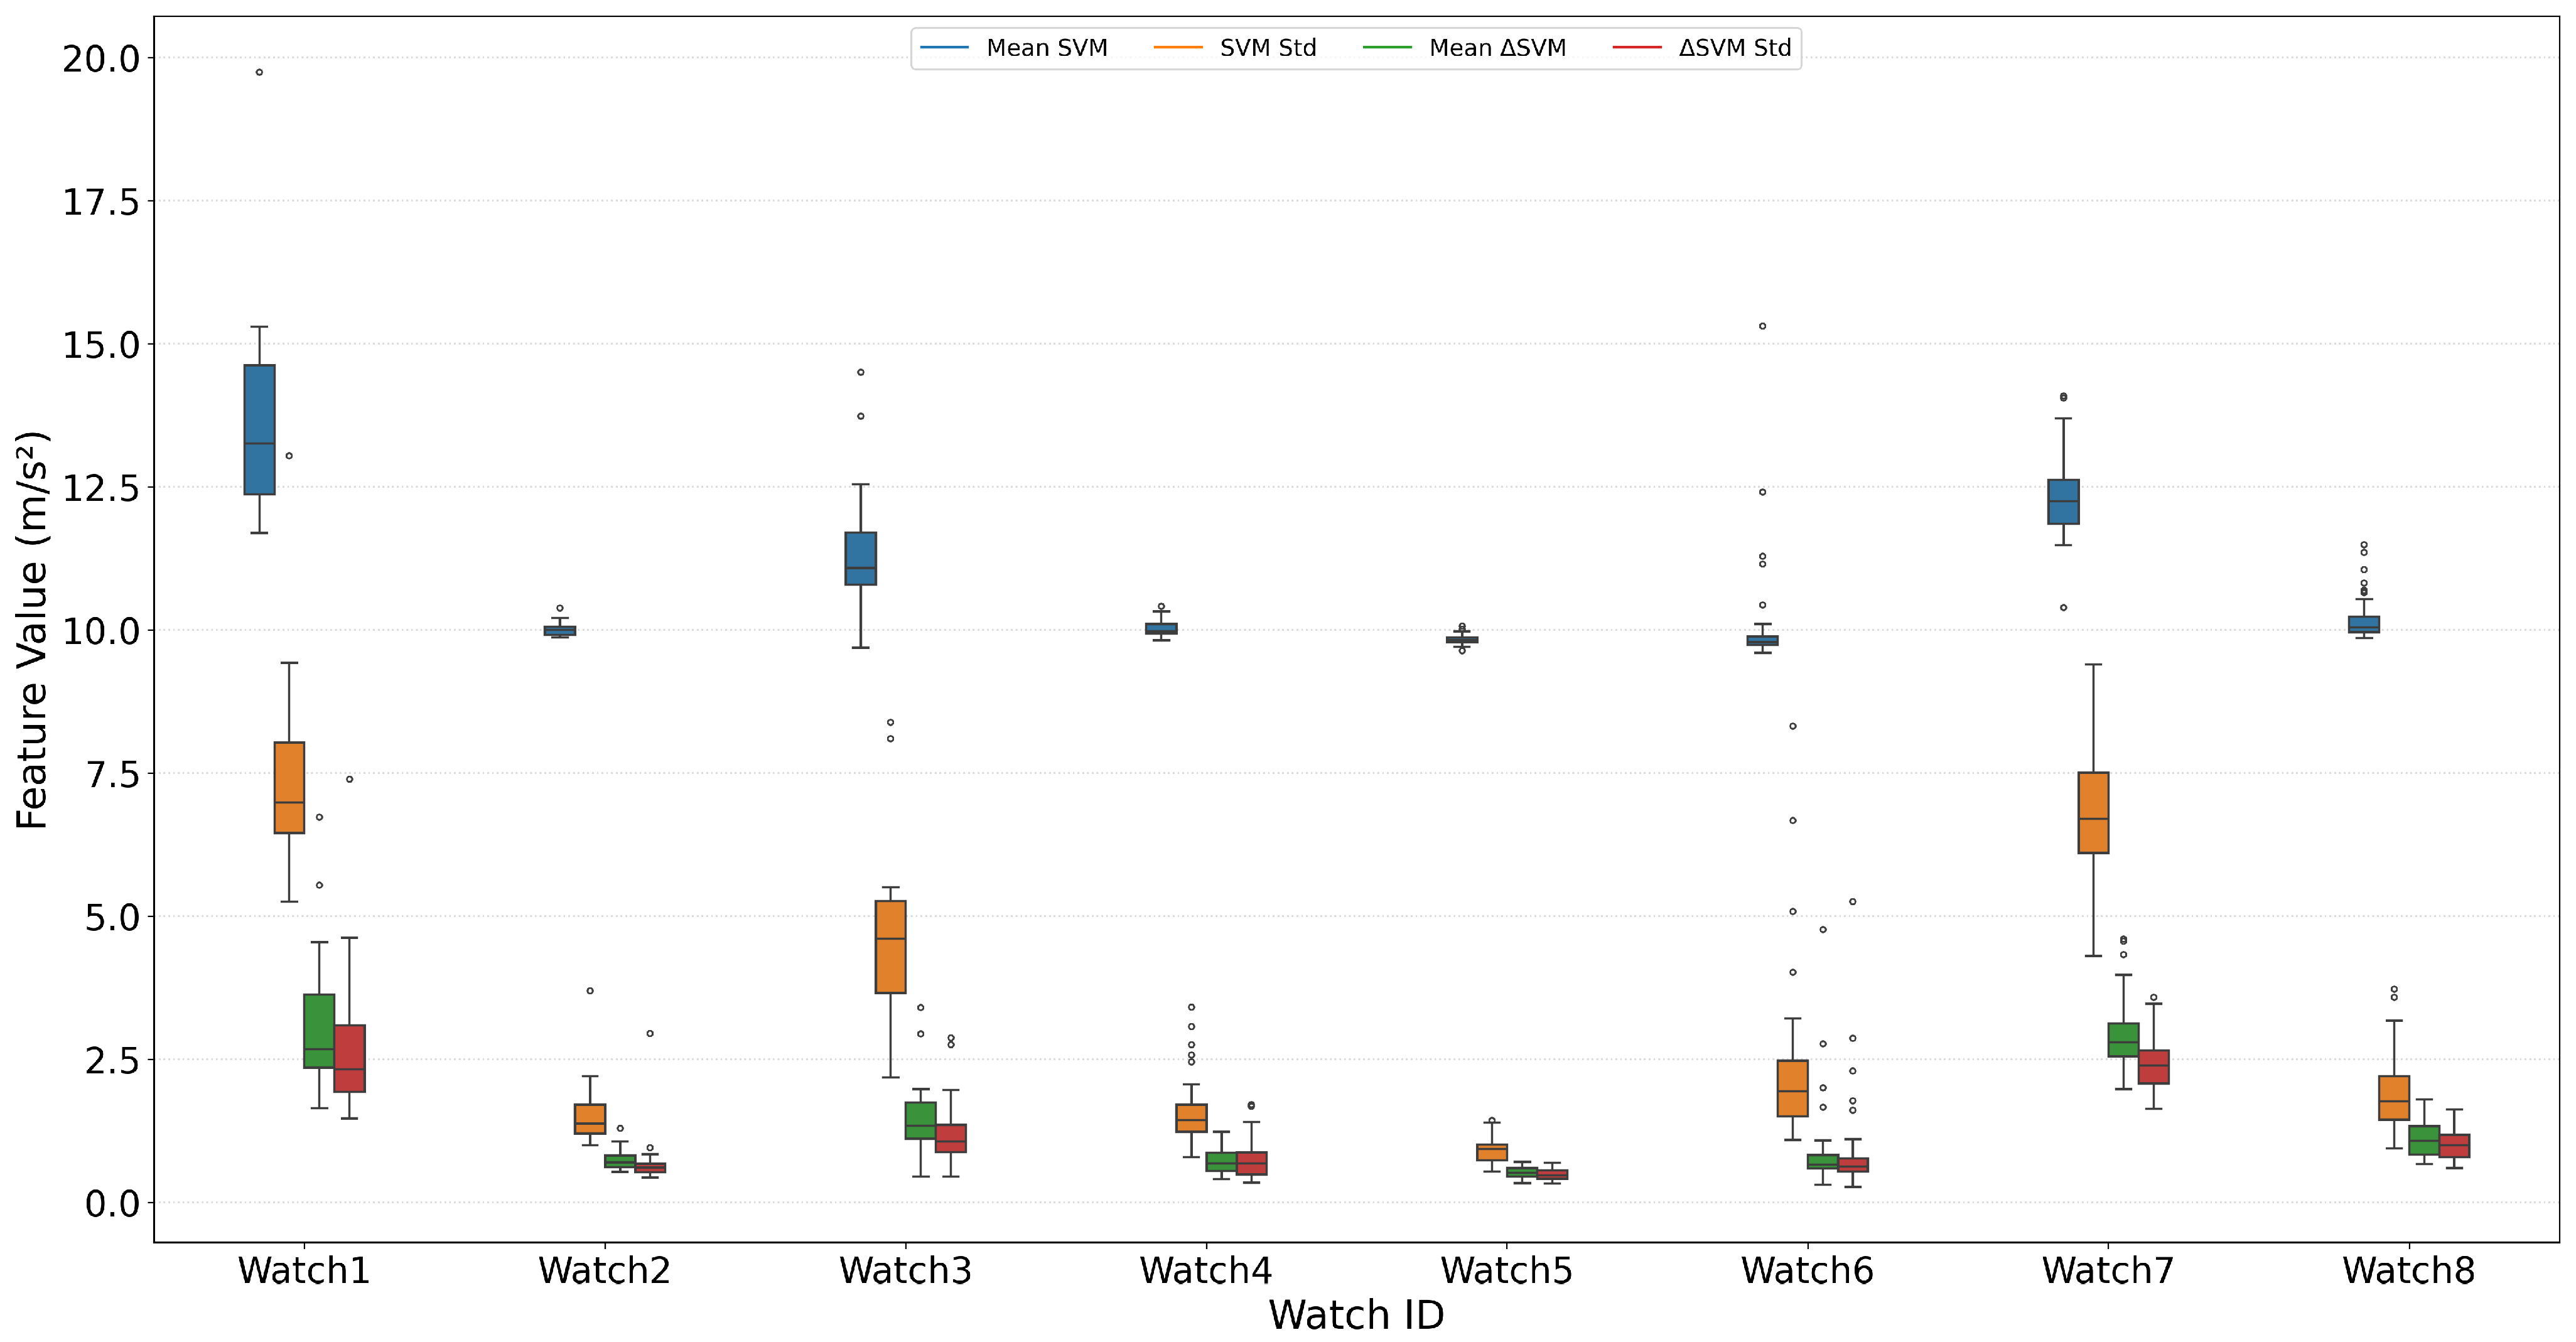
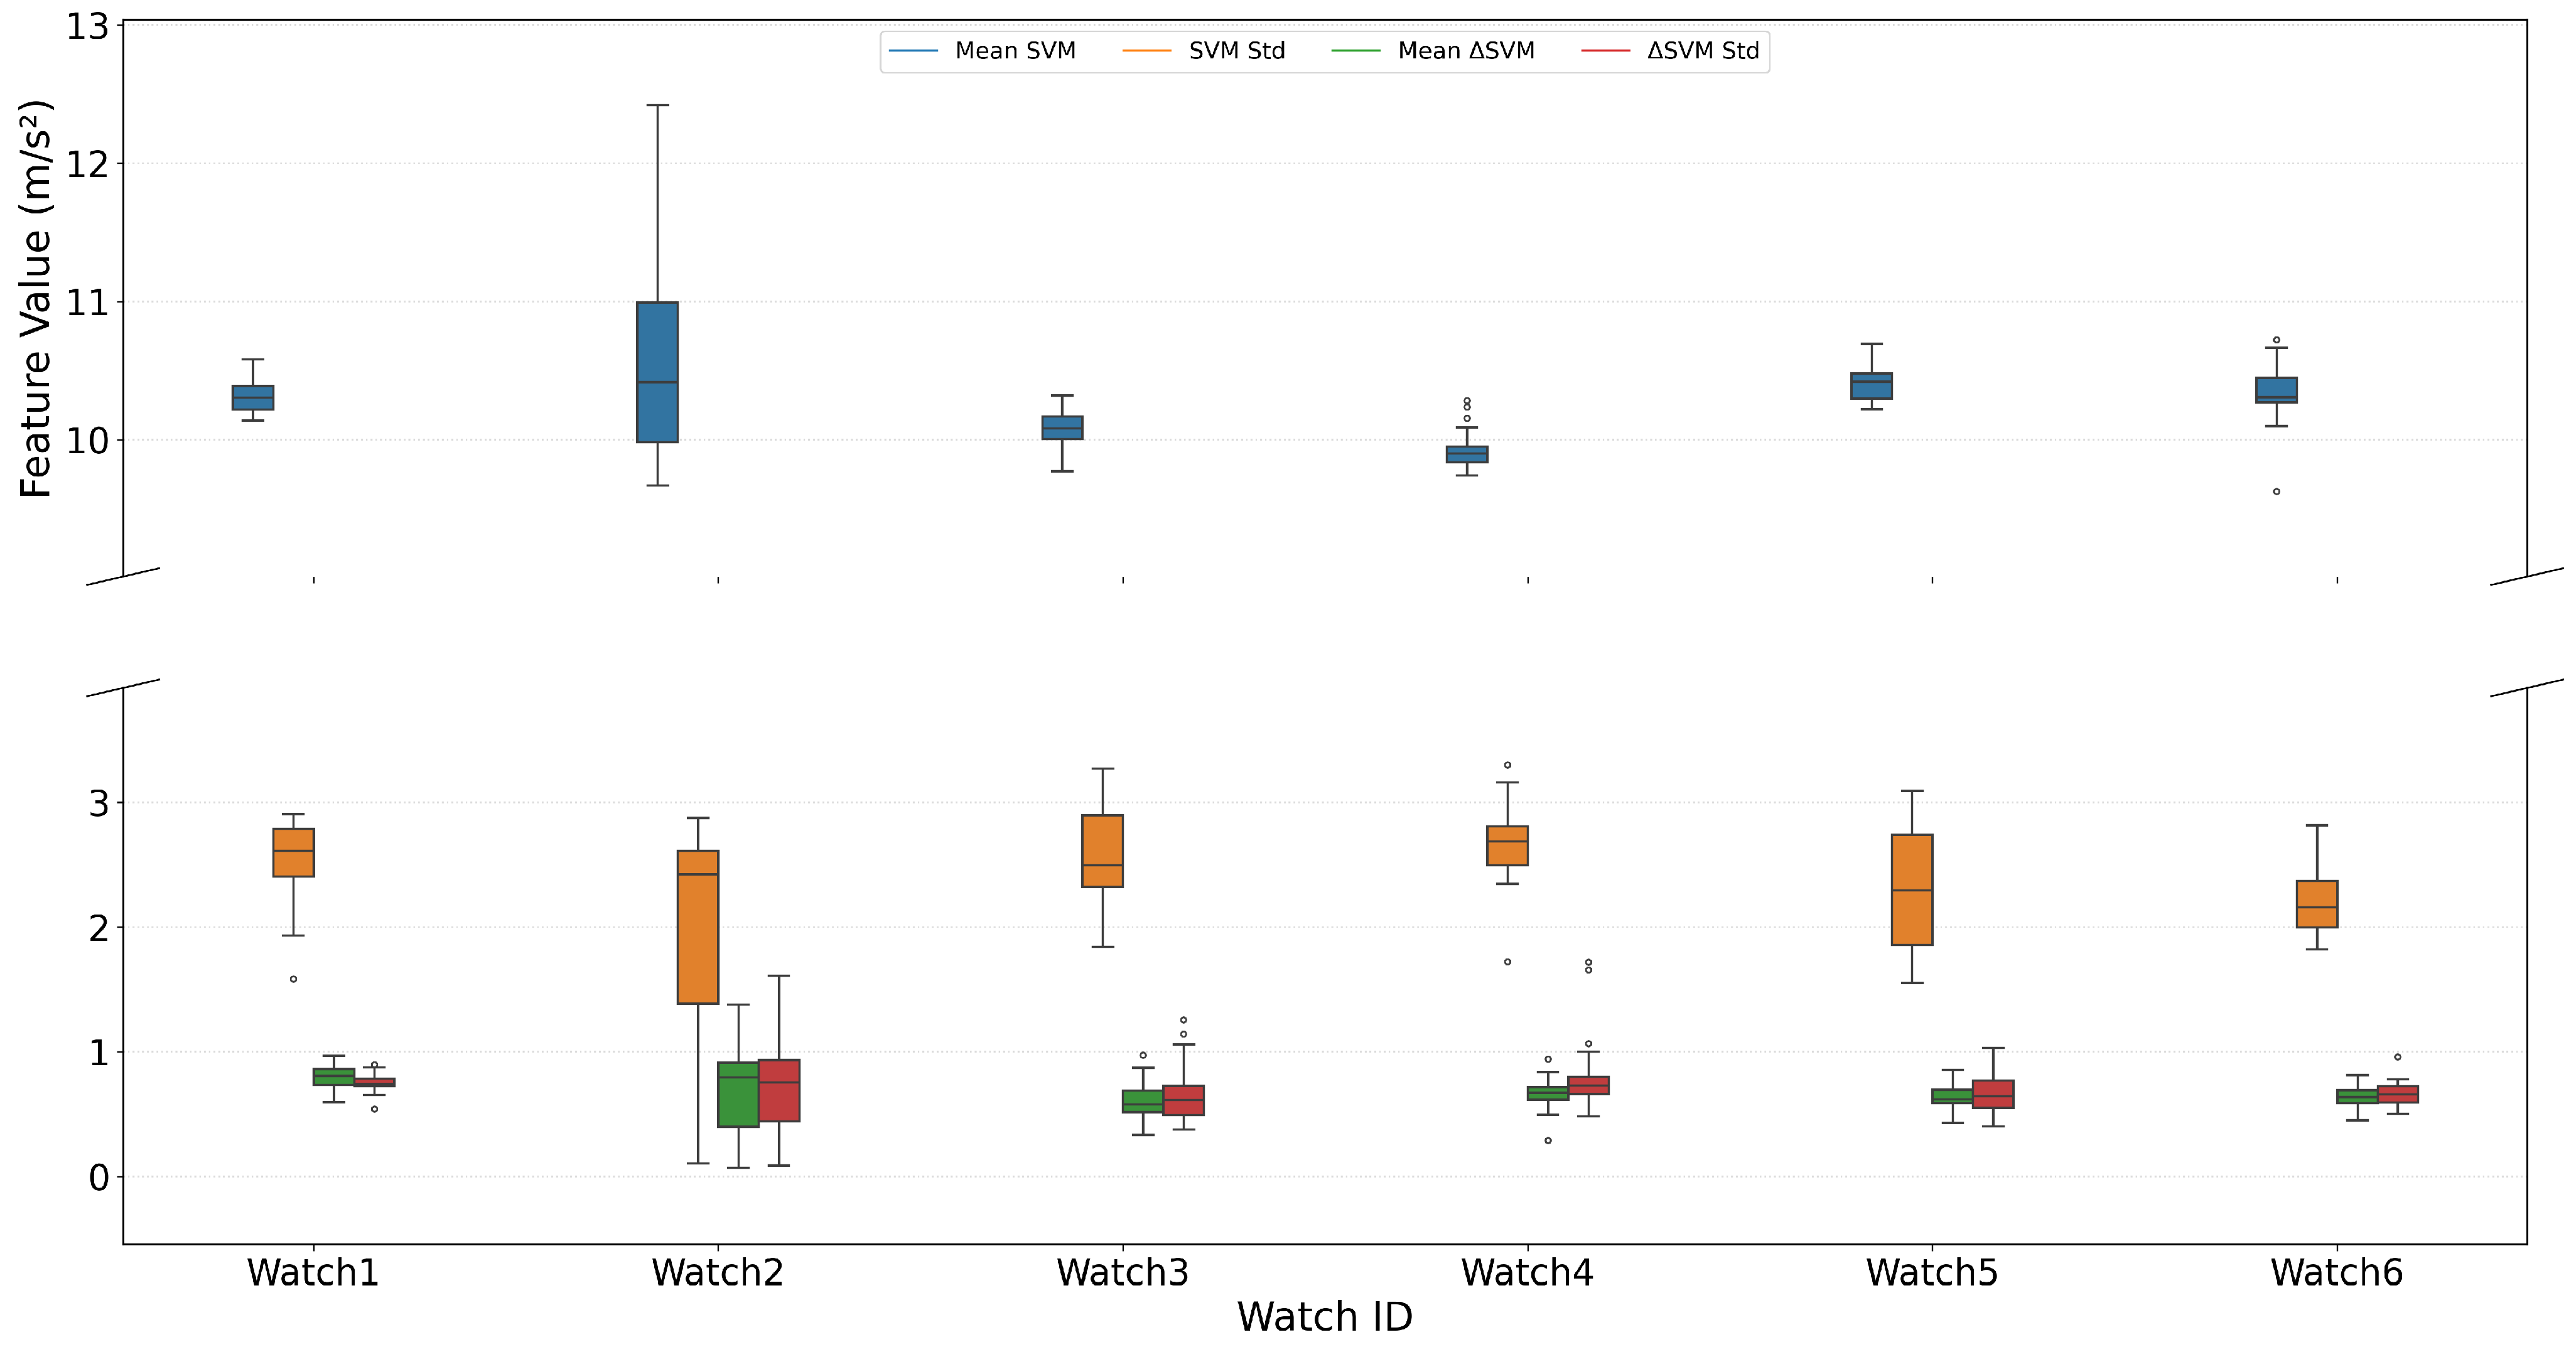
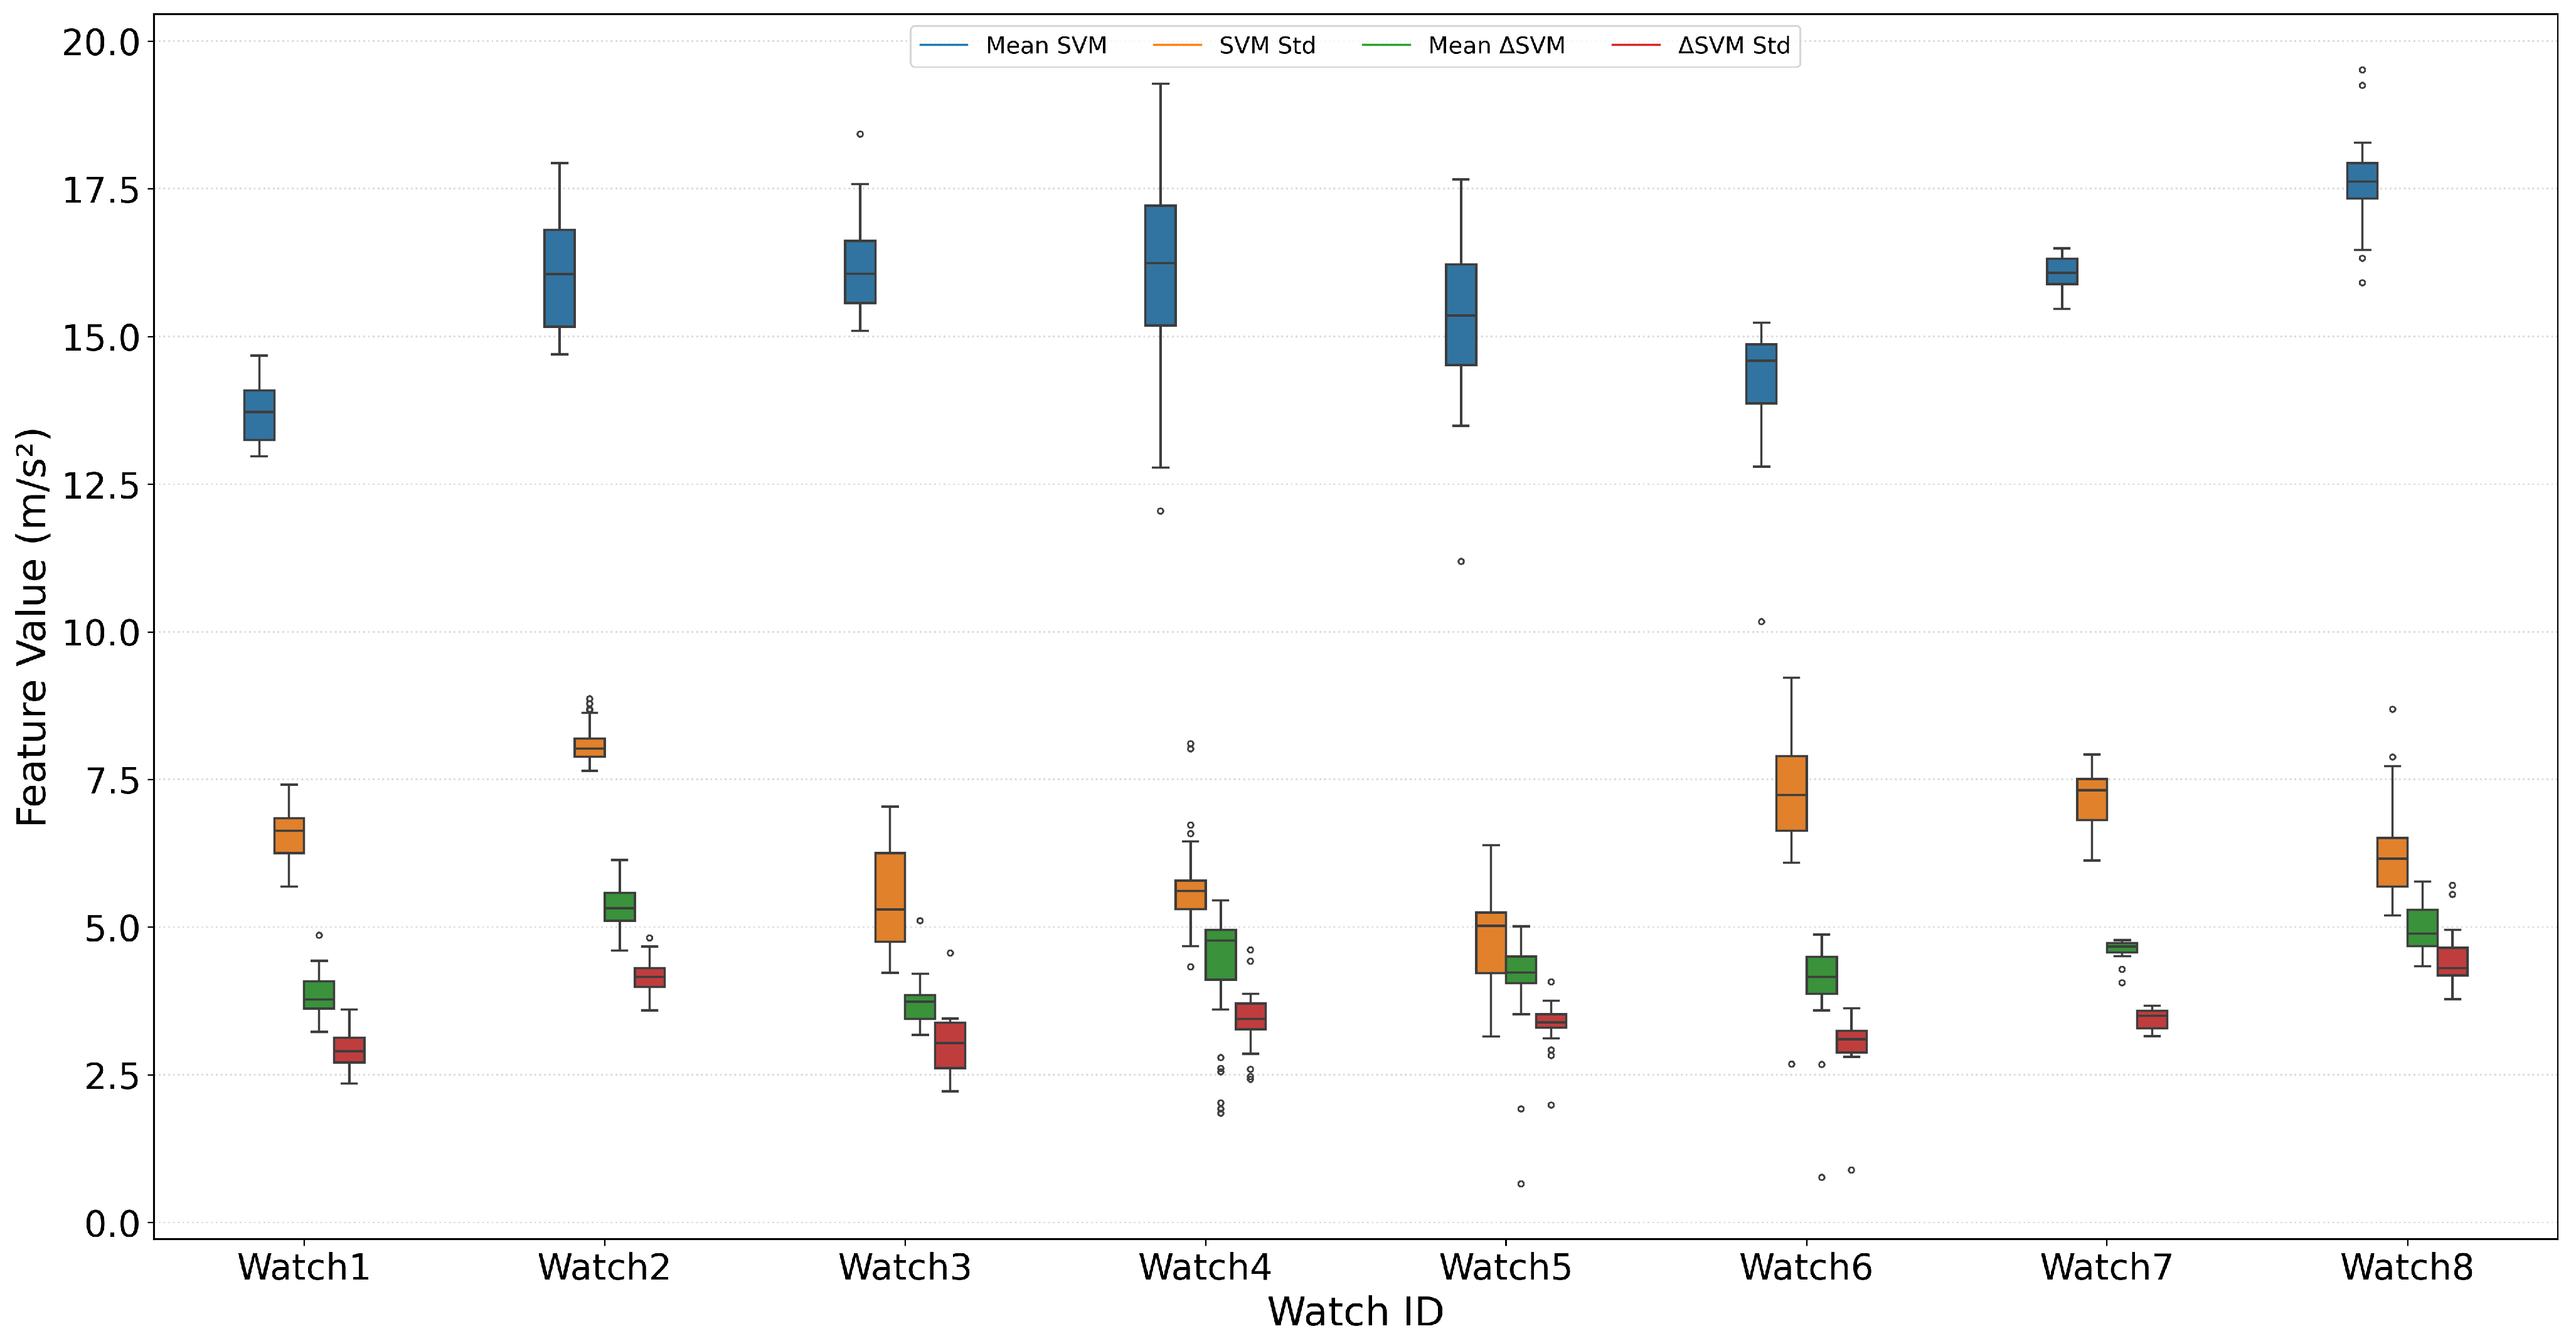
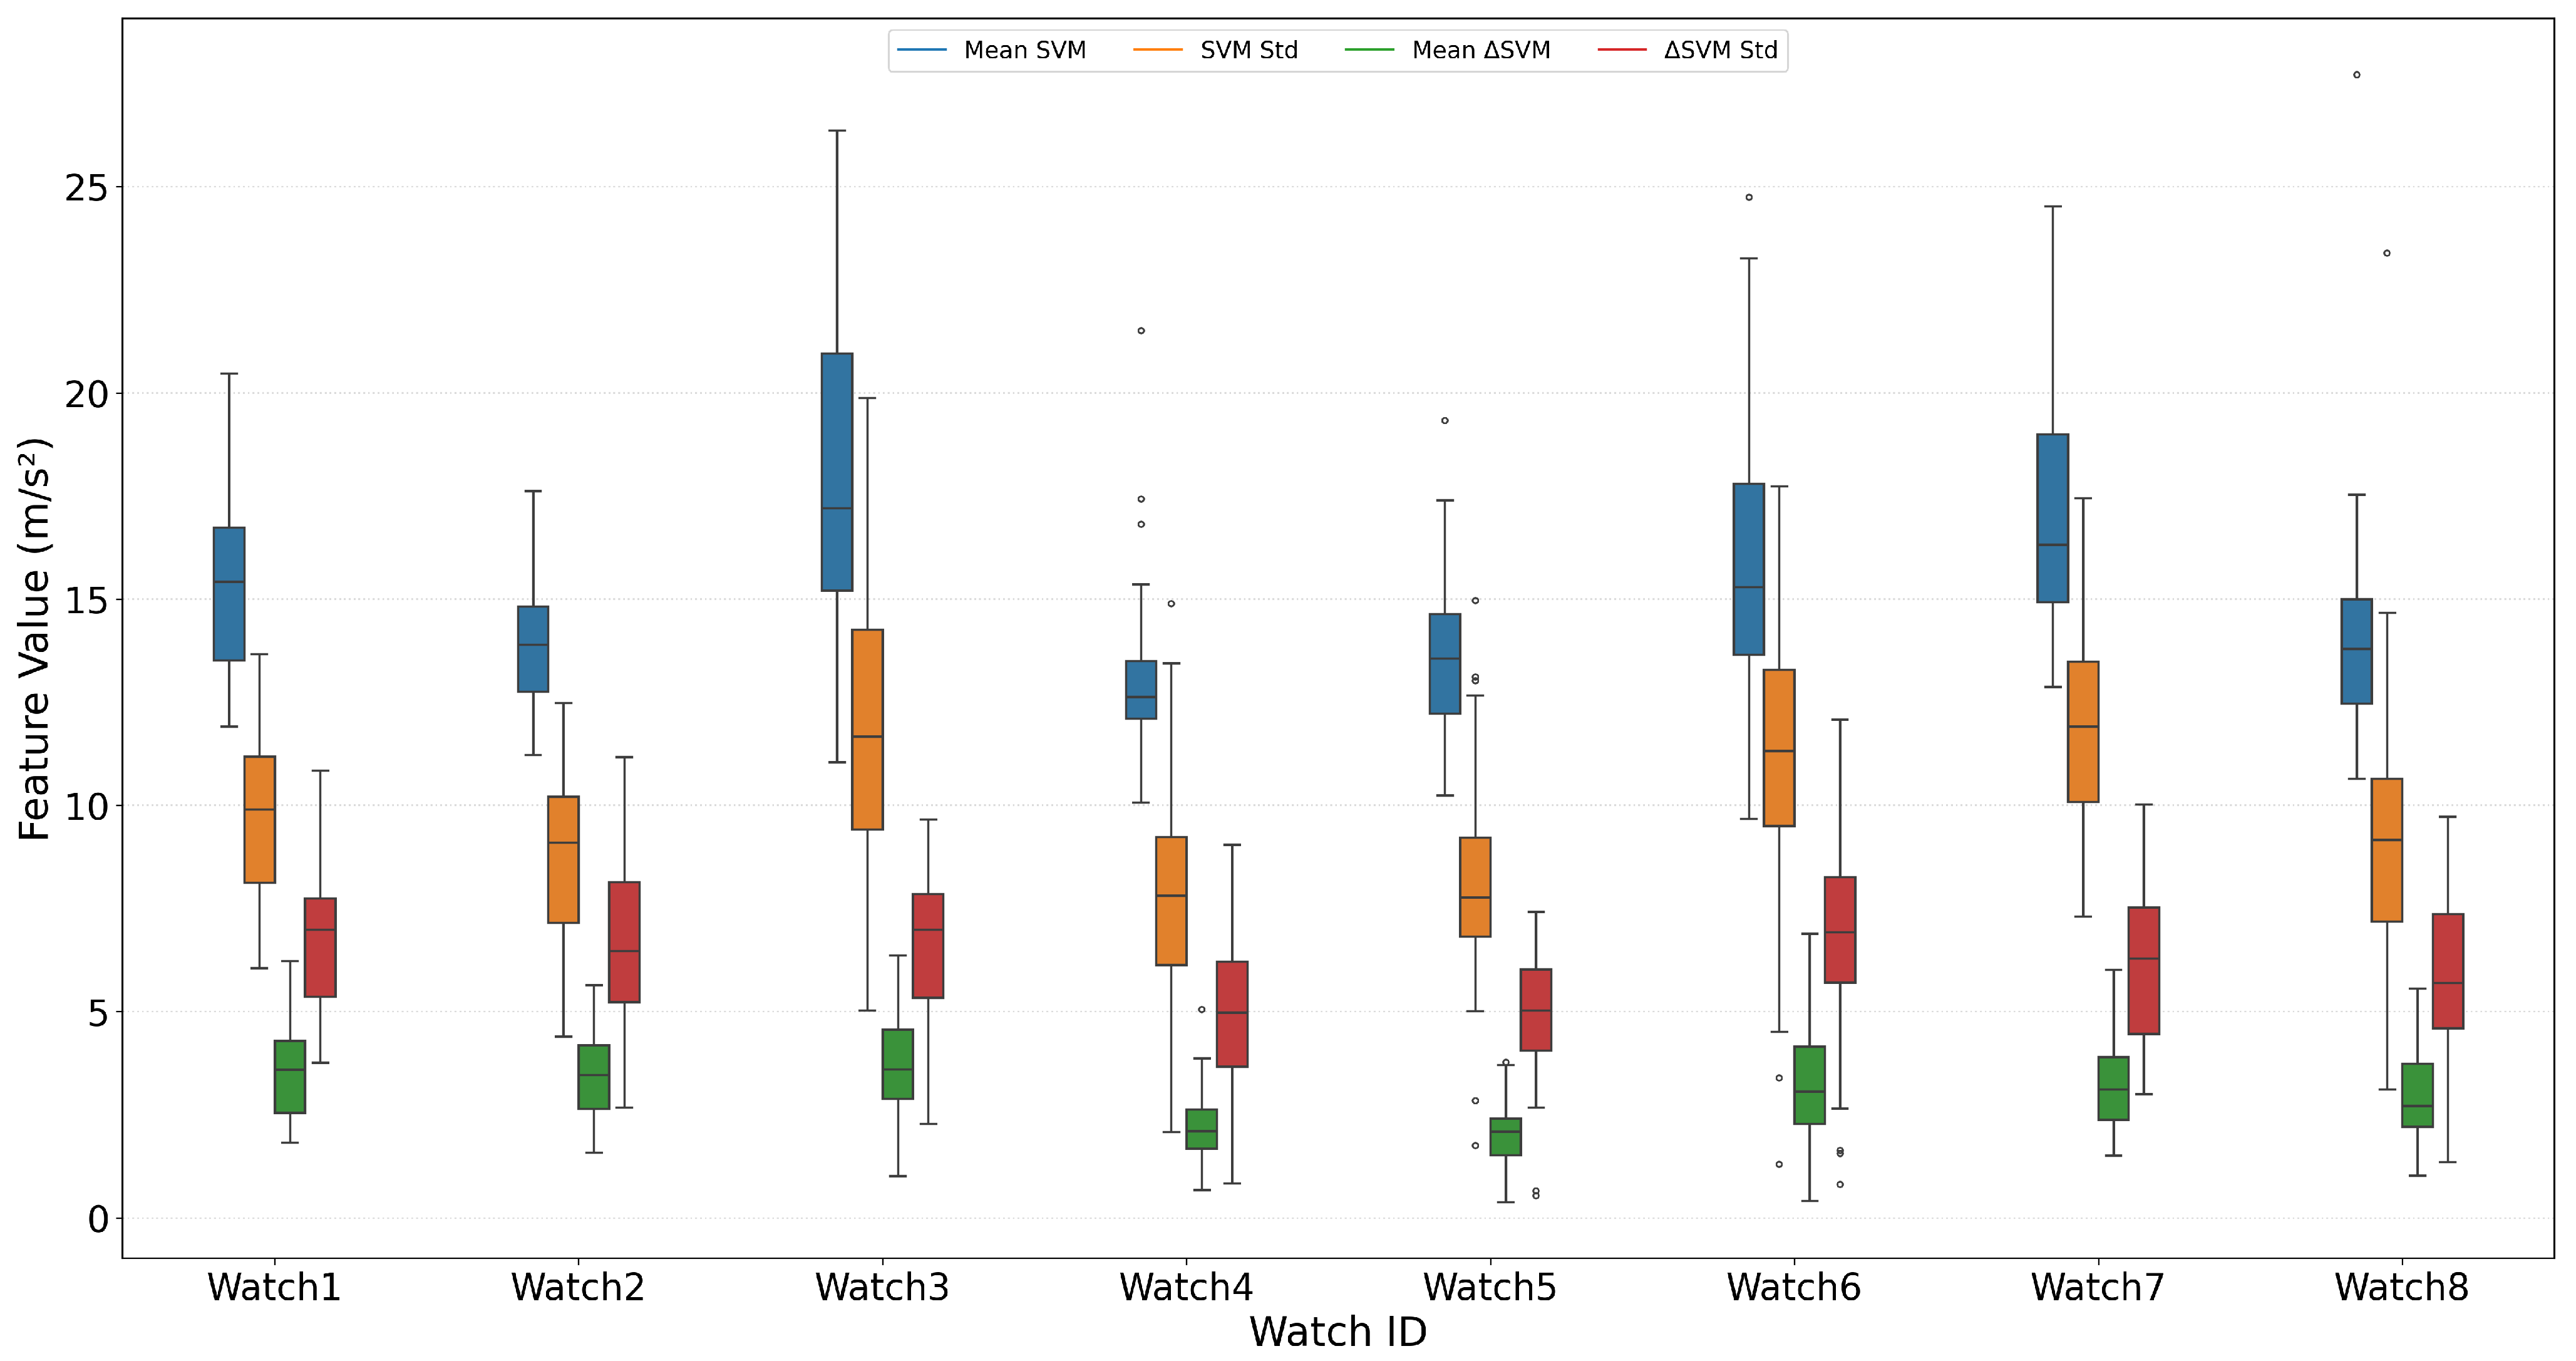
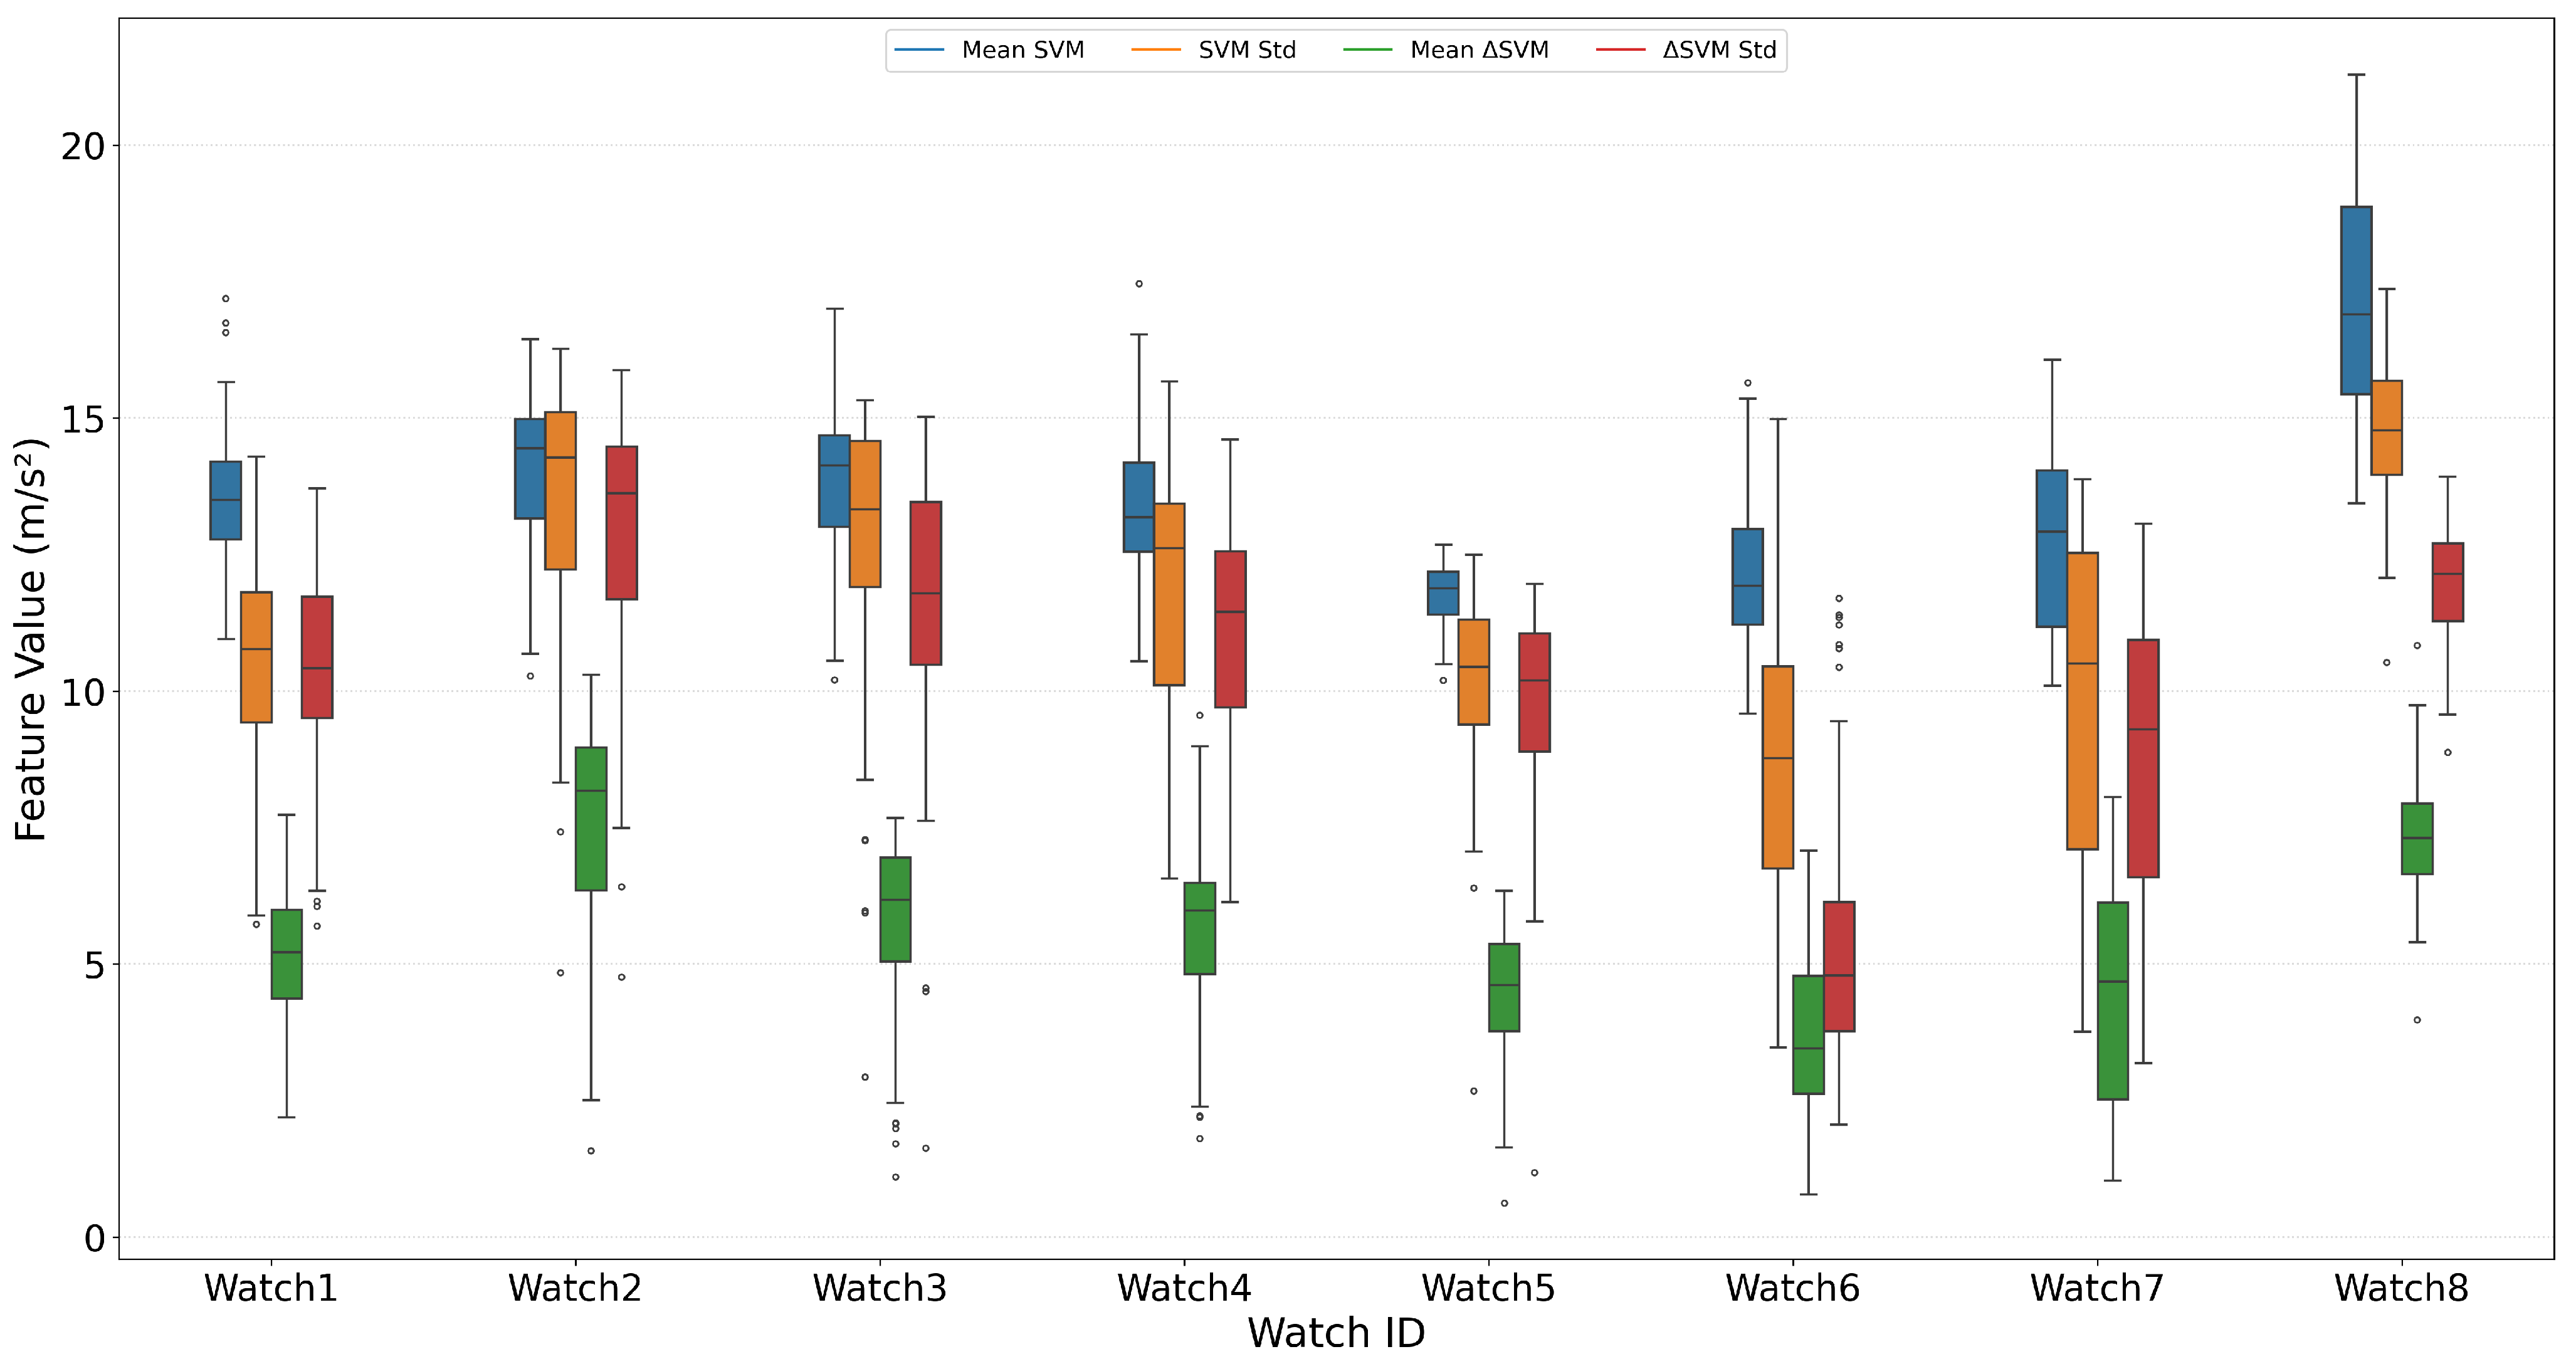
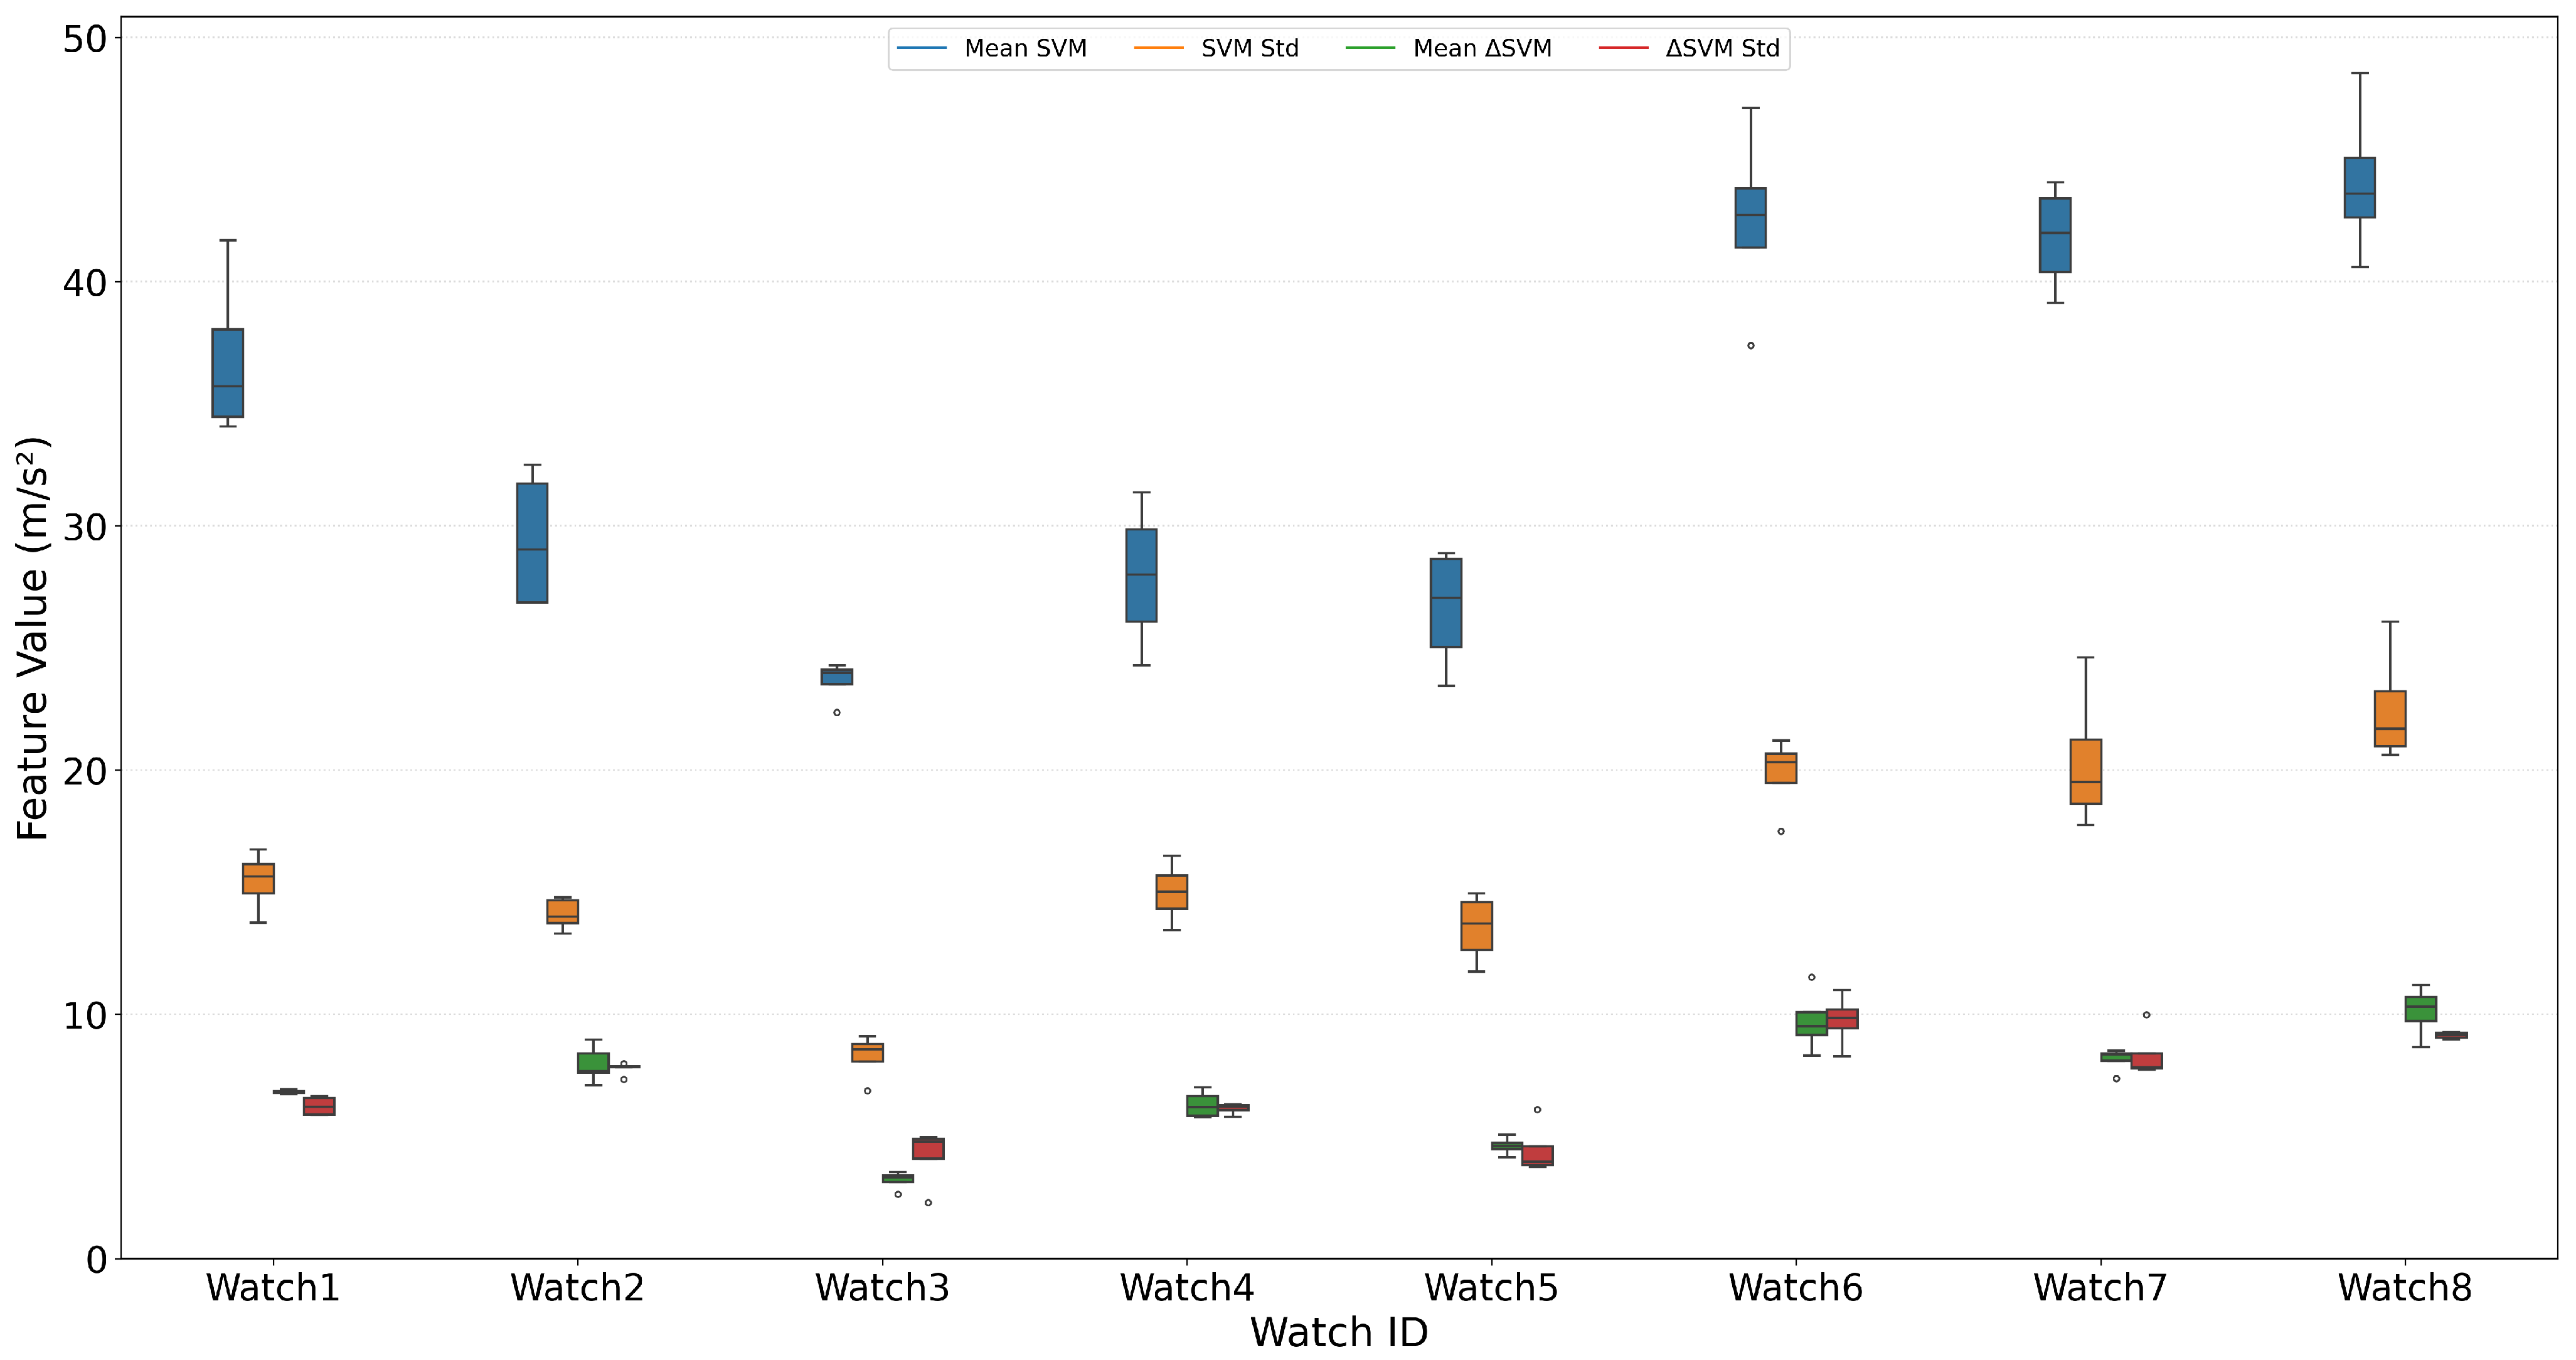
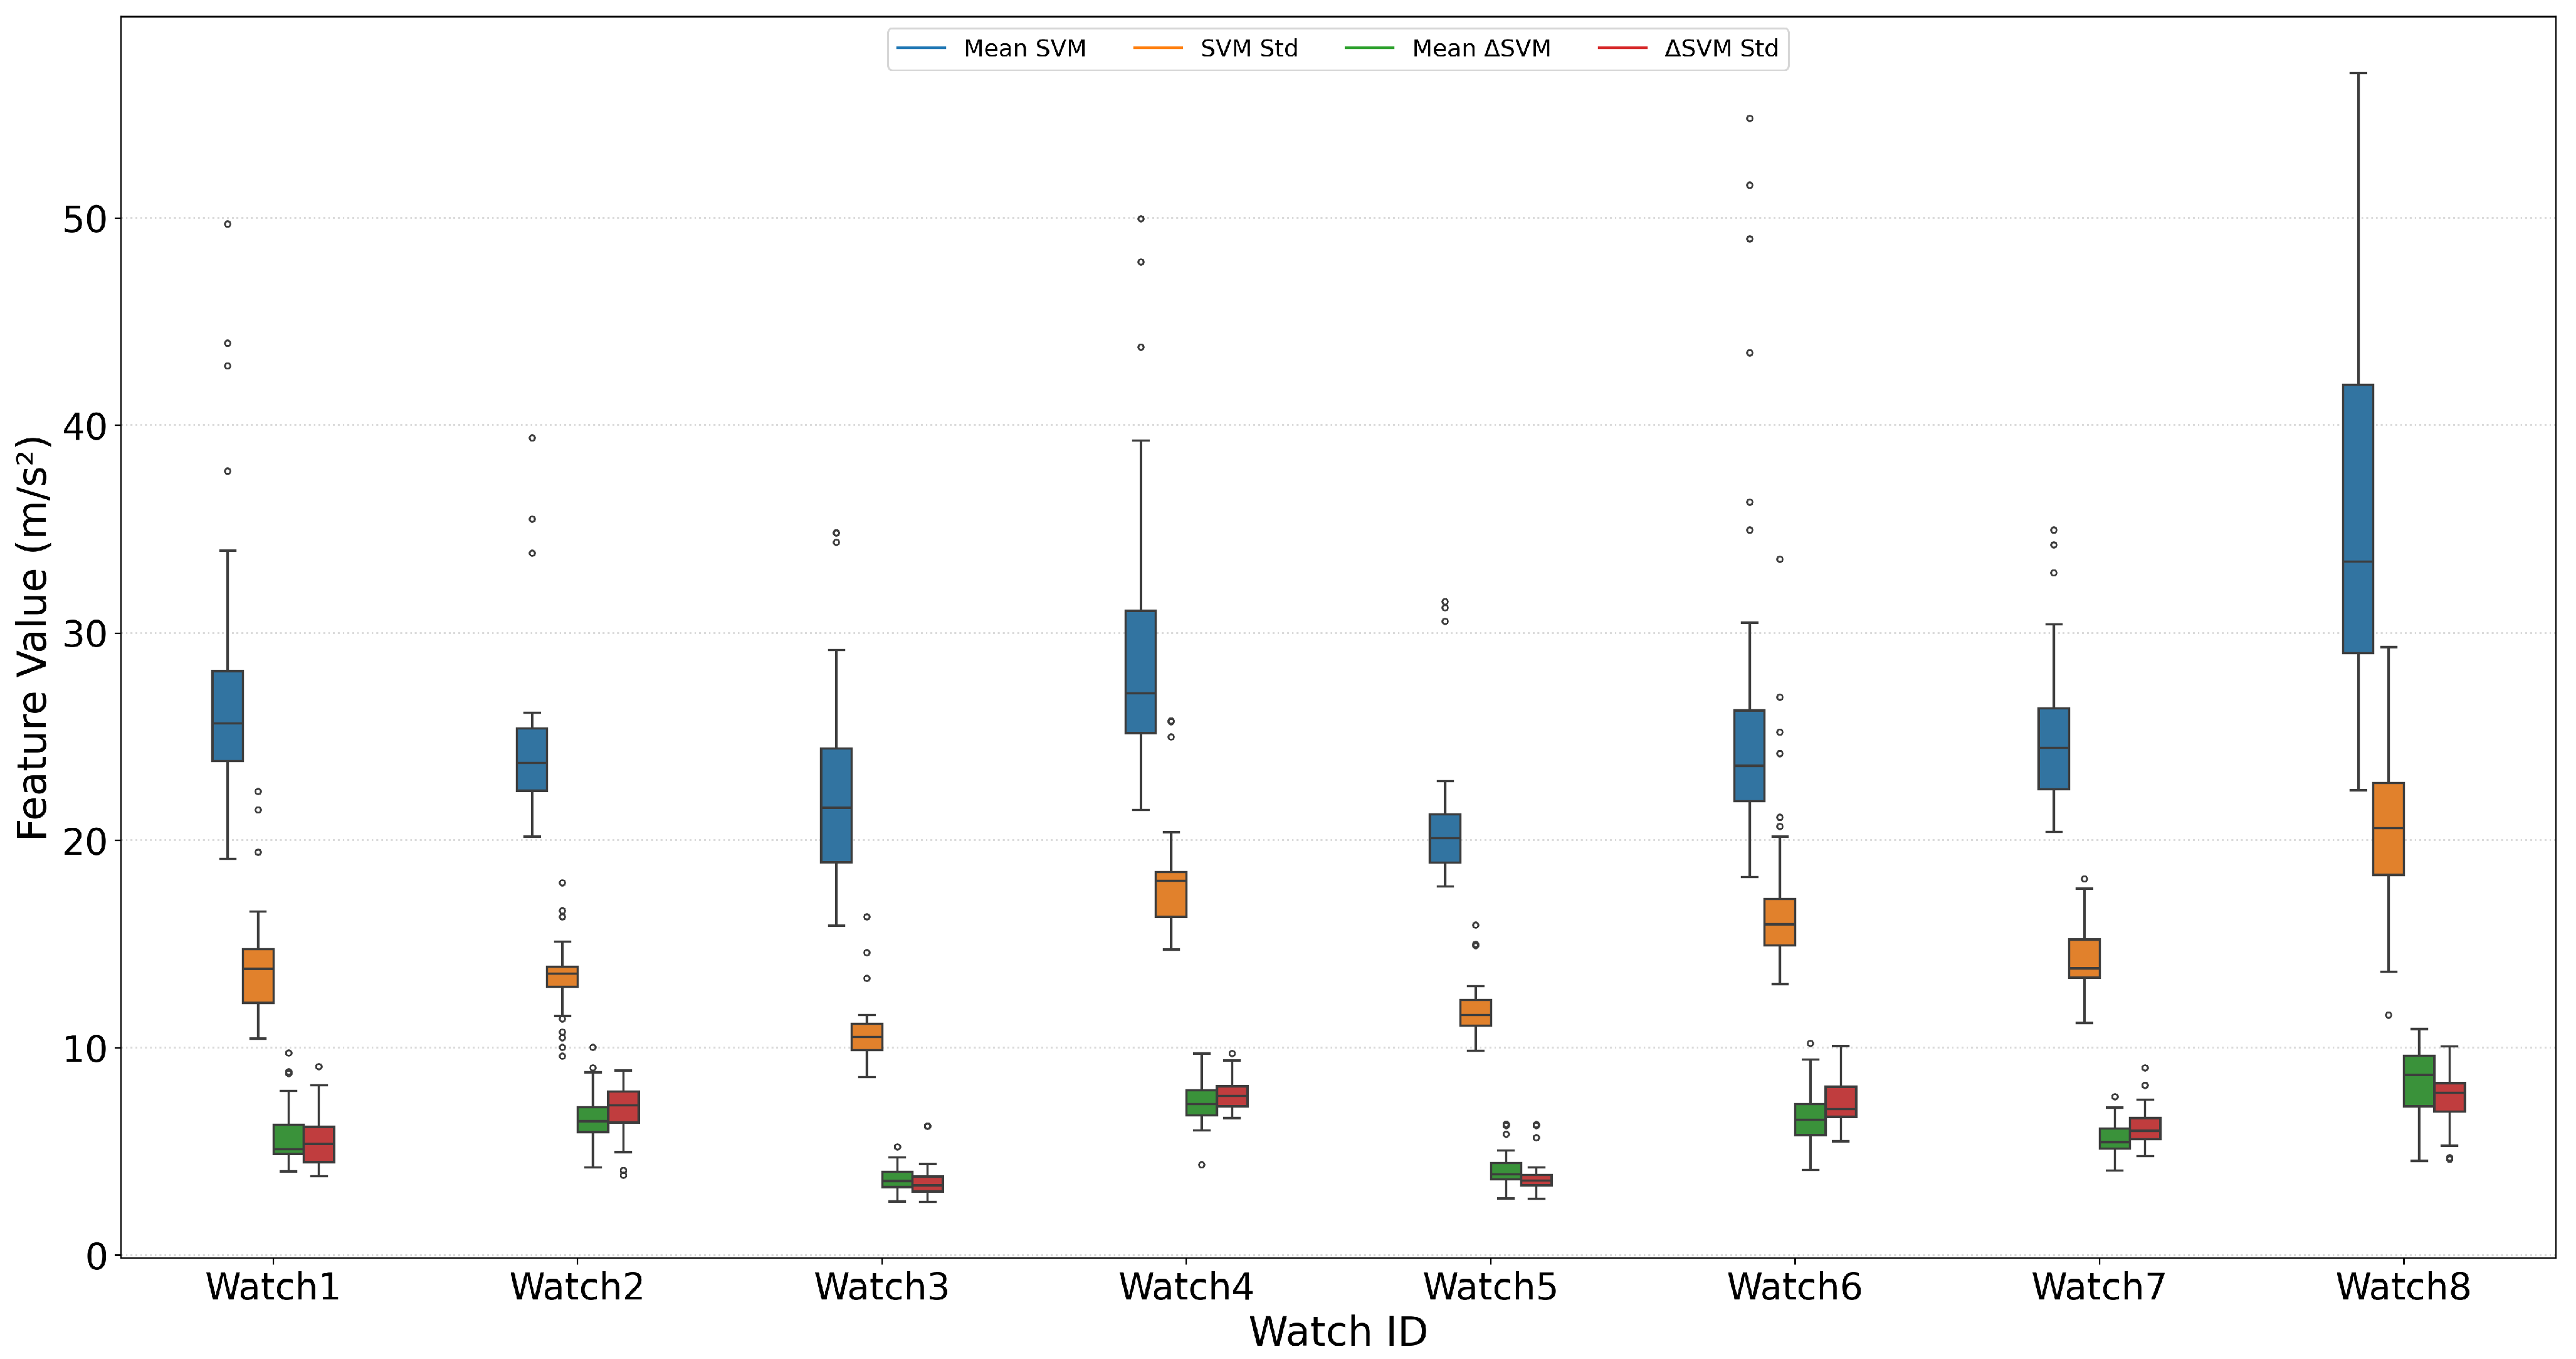
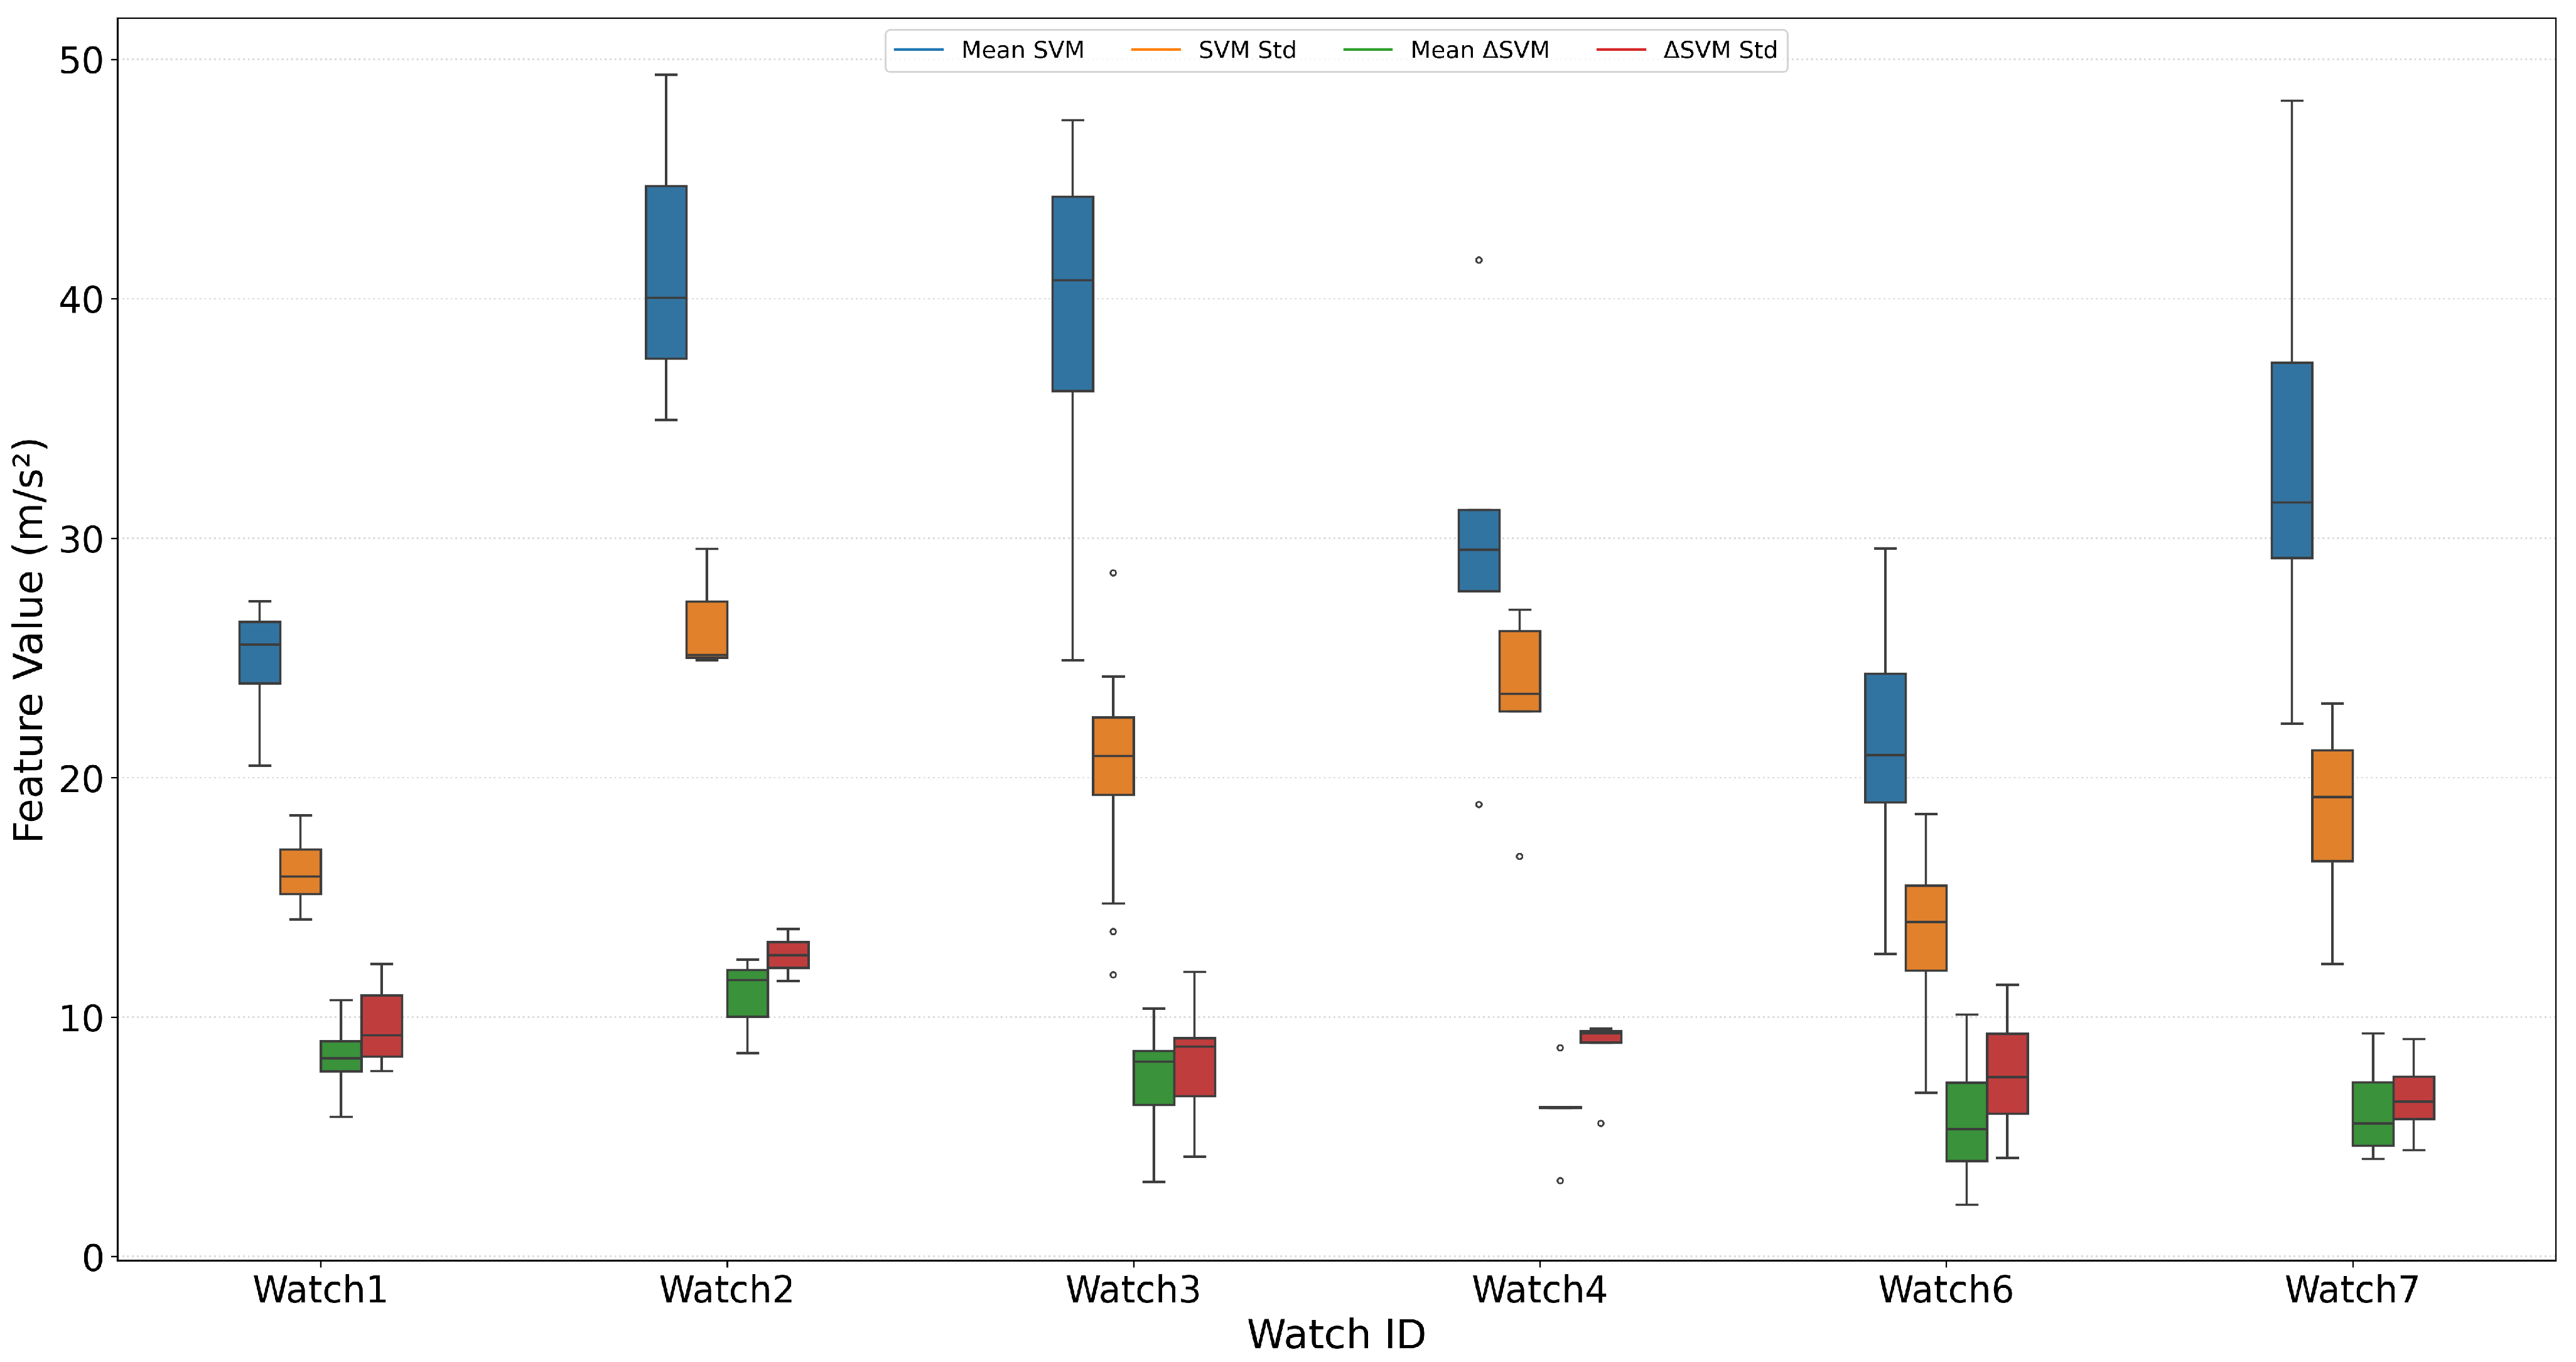
Feature distributions of identical activities across participants in the Dyn-Intensity dataset showed consistent patterns (Figure 3, Figure 4, Figure 5, Figure 6, Figure 7, Figure 8, Figure 9, Figure 10, Figure 11, Figure 12, Figure 13, Figure 14 and Figure 15), confirming inter-subject reliability. Based on this consistency, data corresponding to the same activity were merged into representative categories. The merged Dyn-Intensity dataset was then integrated with PAMAP2 to compare average feature characteristics and establish the foundation for intensity-level mapping. As shown, box colors represent the extracted features in all feature distribution plots: blue for SVM mean, orange for SVM standard deviation, green for Δ SVM mean, and red for Δ SVM standard deviation.
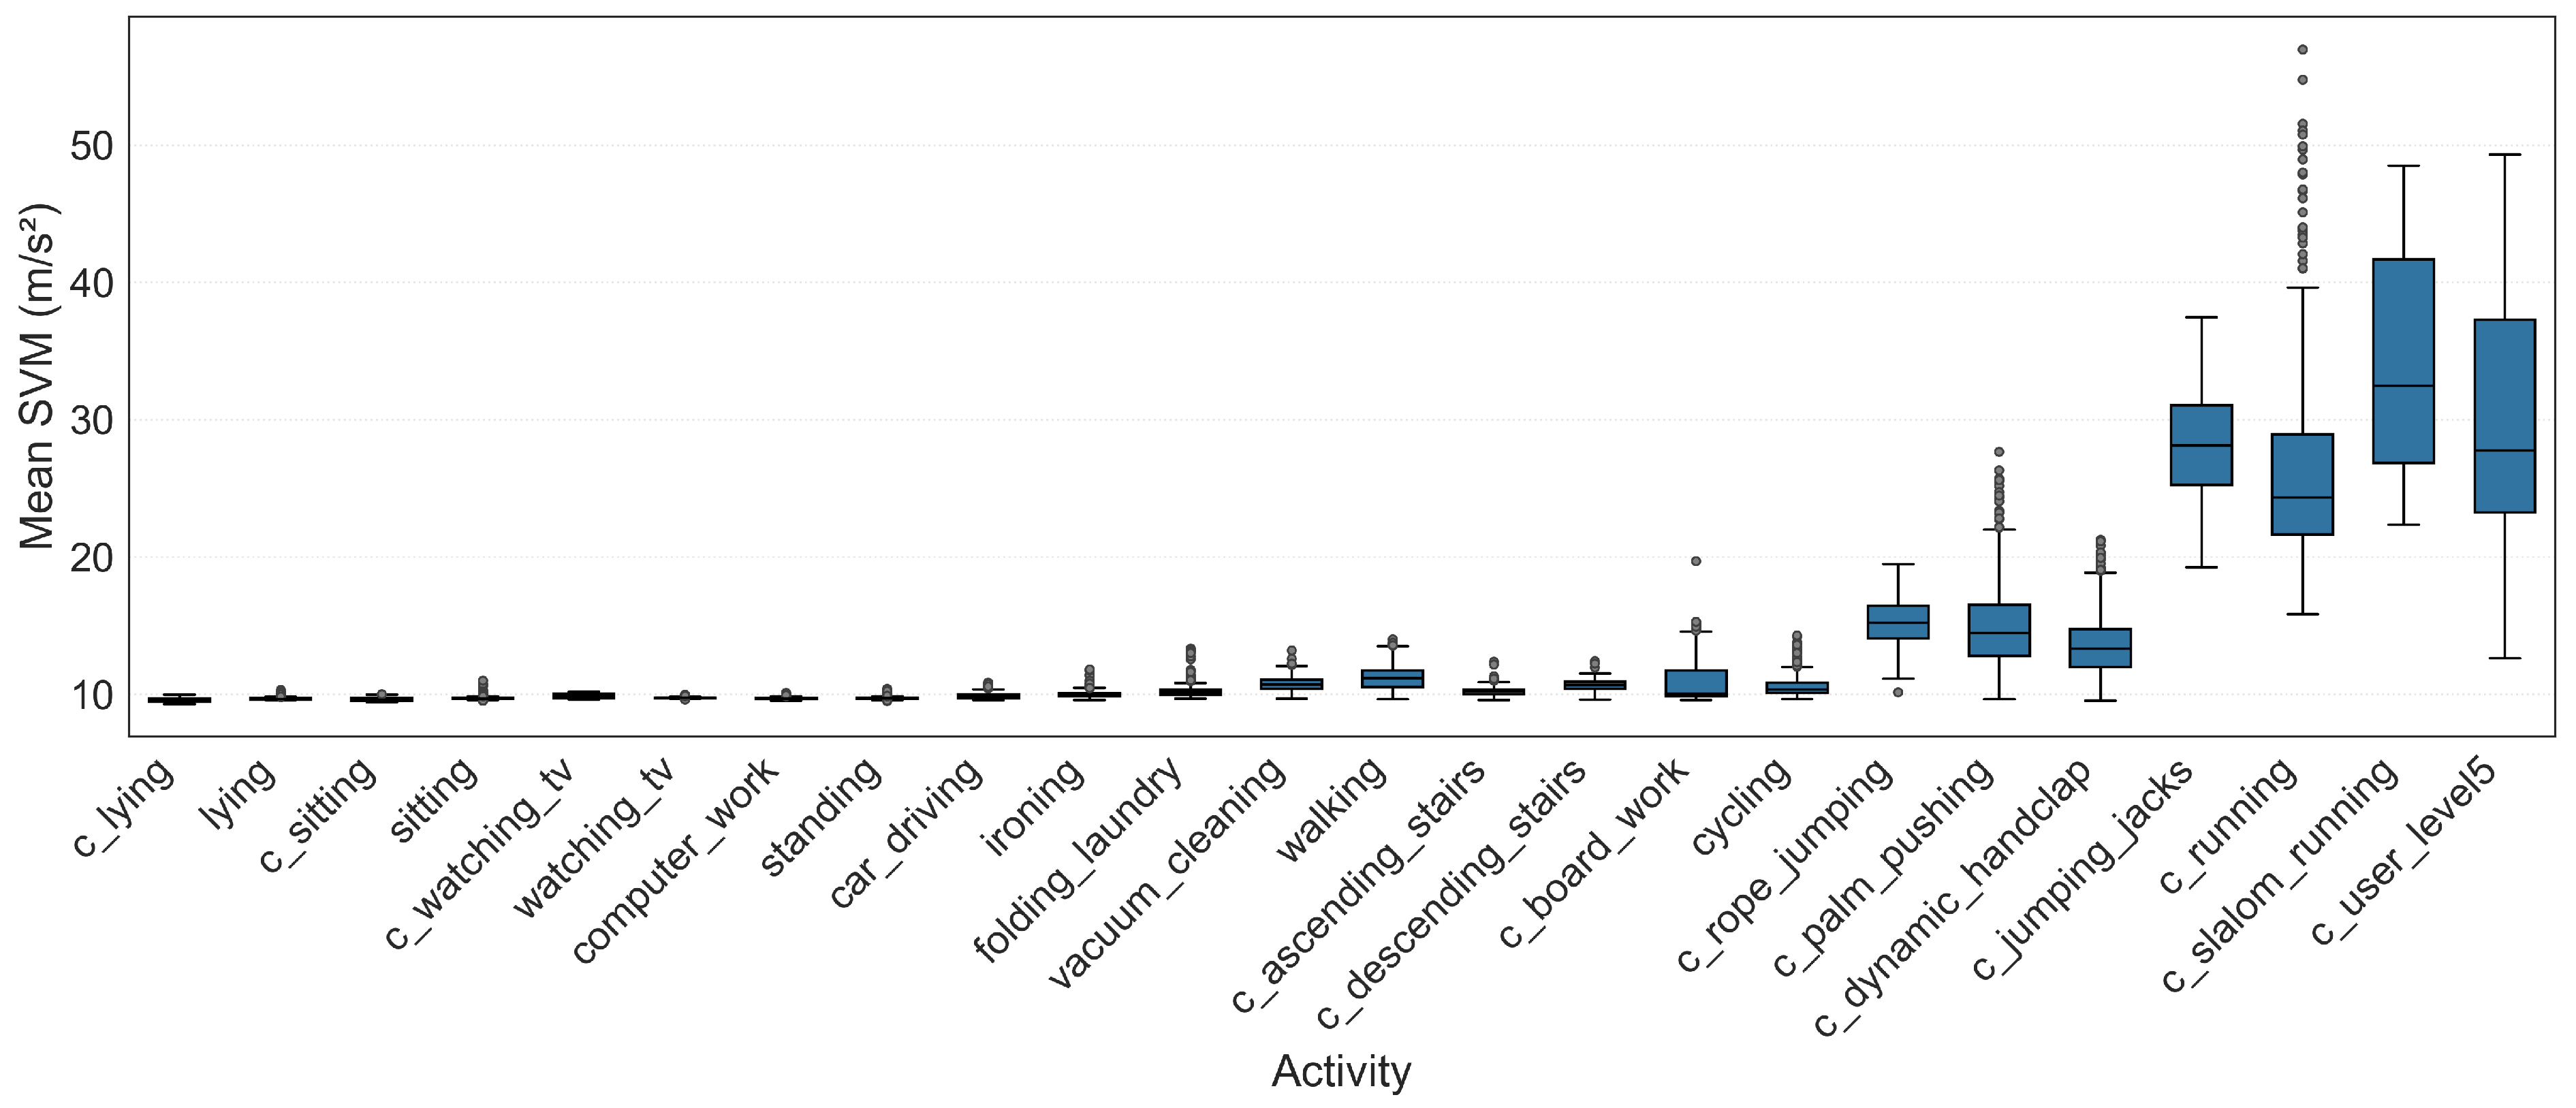
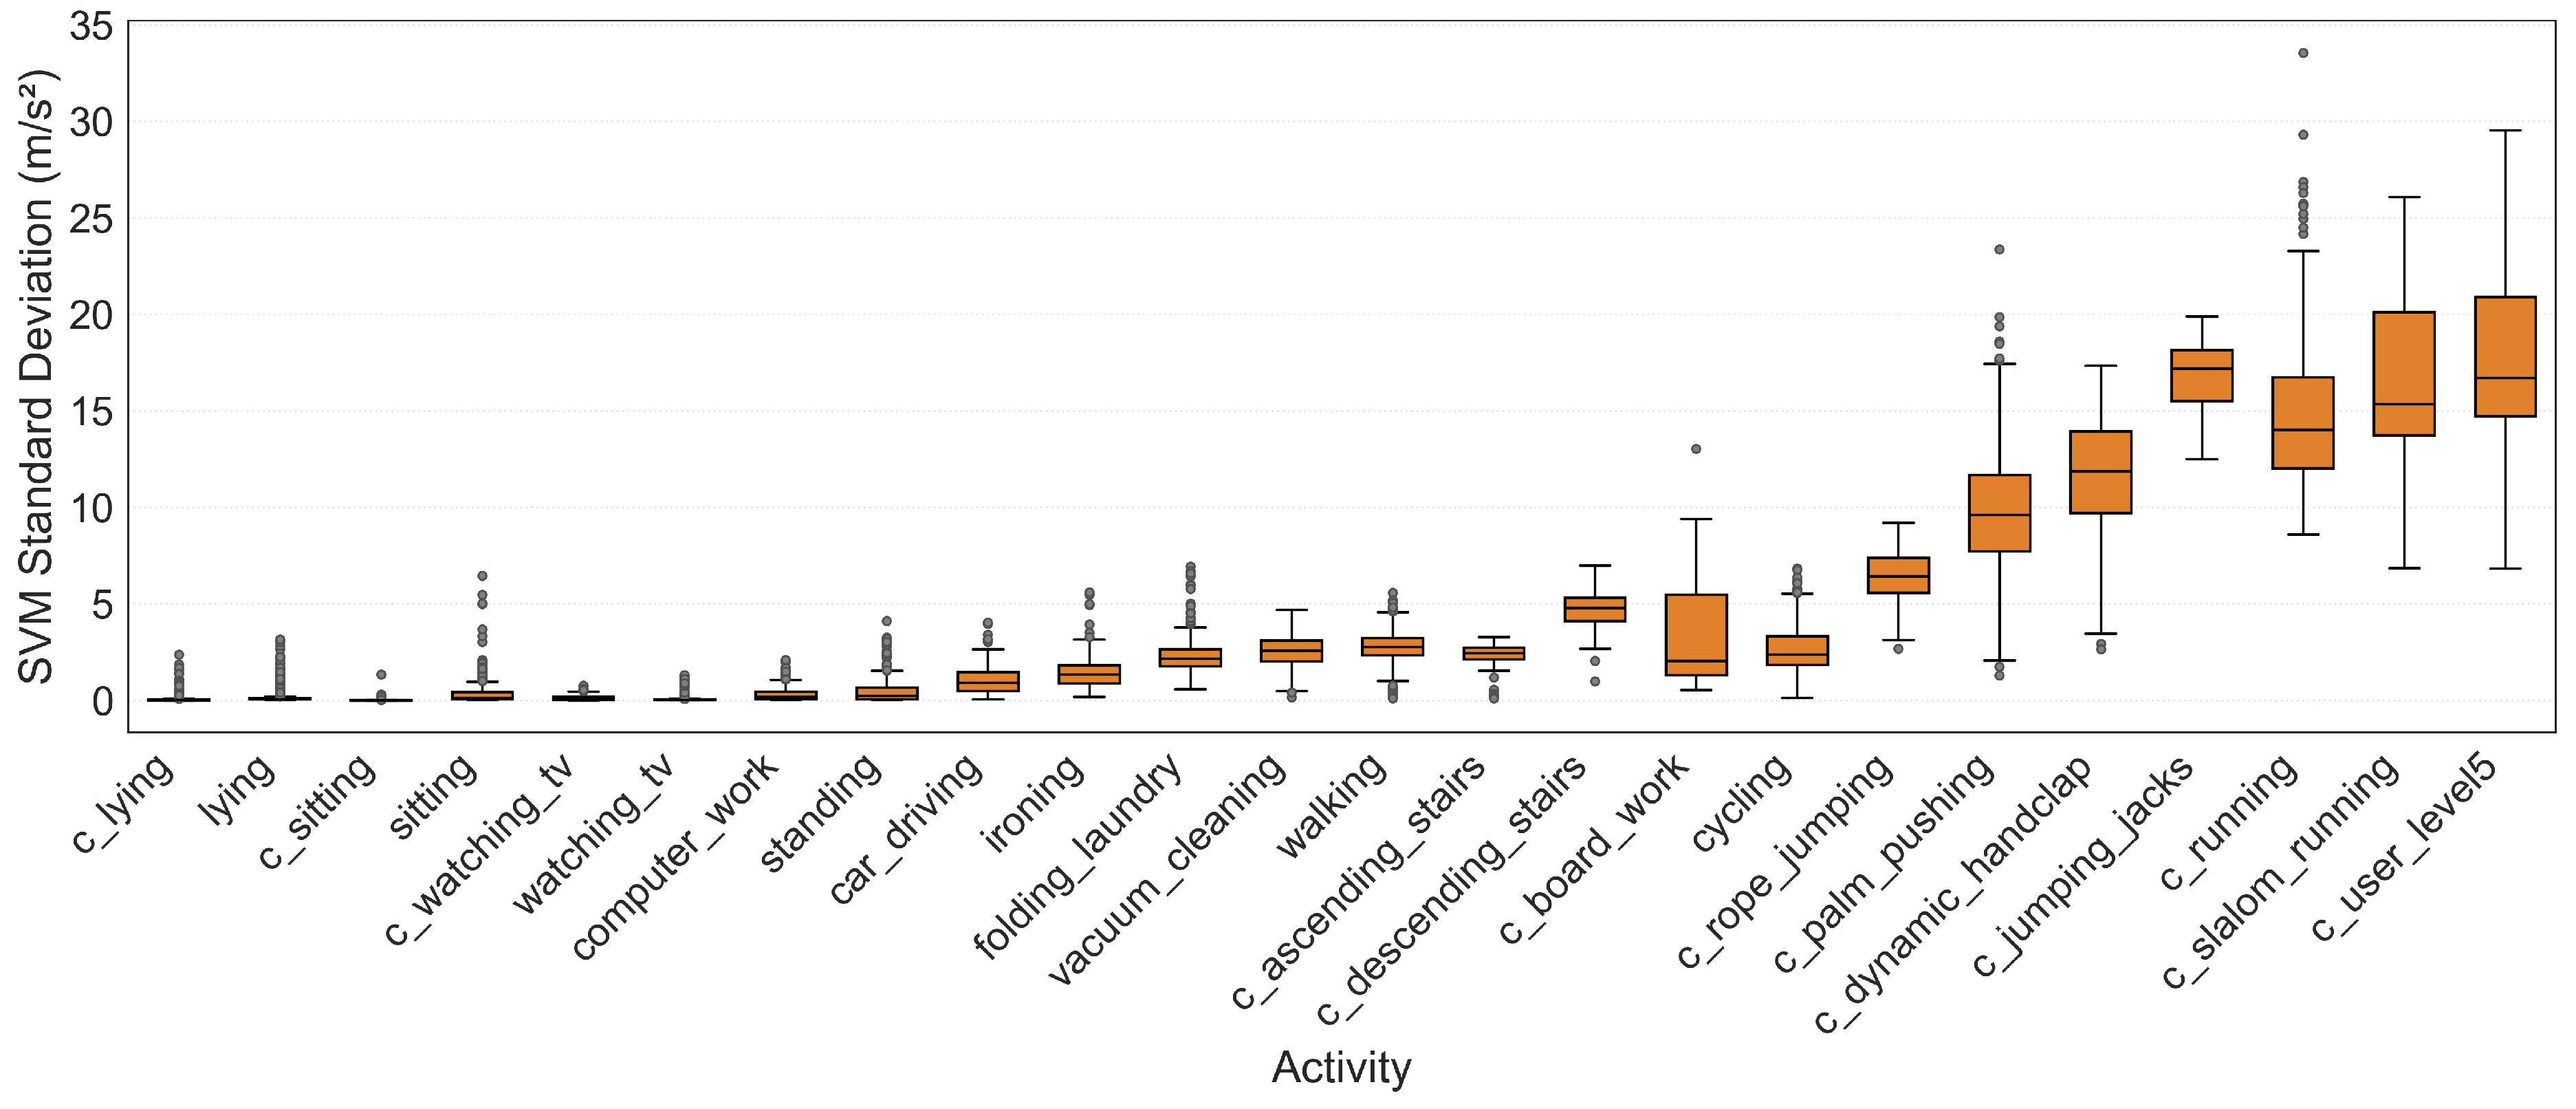
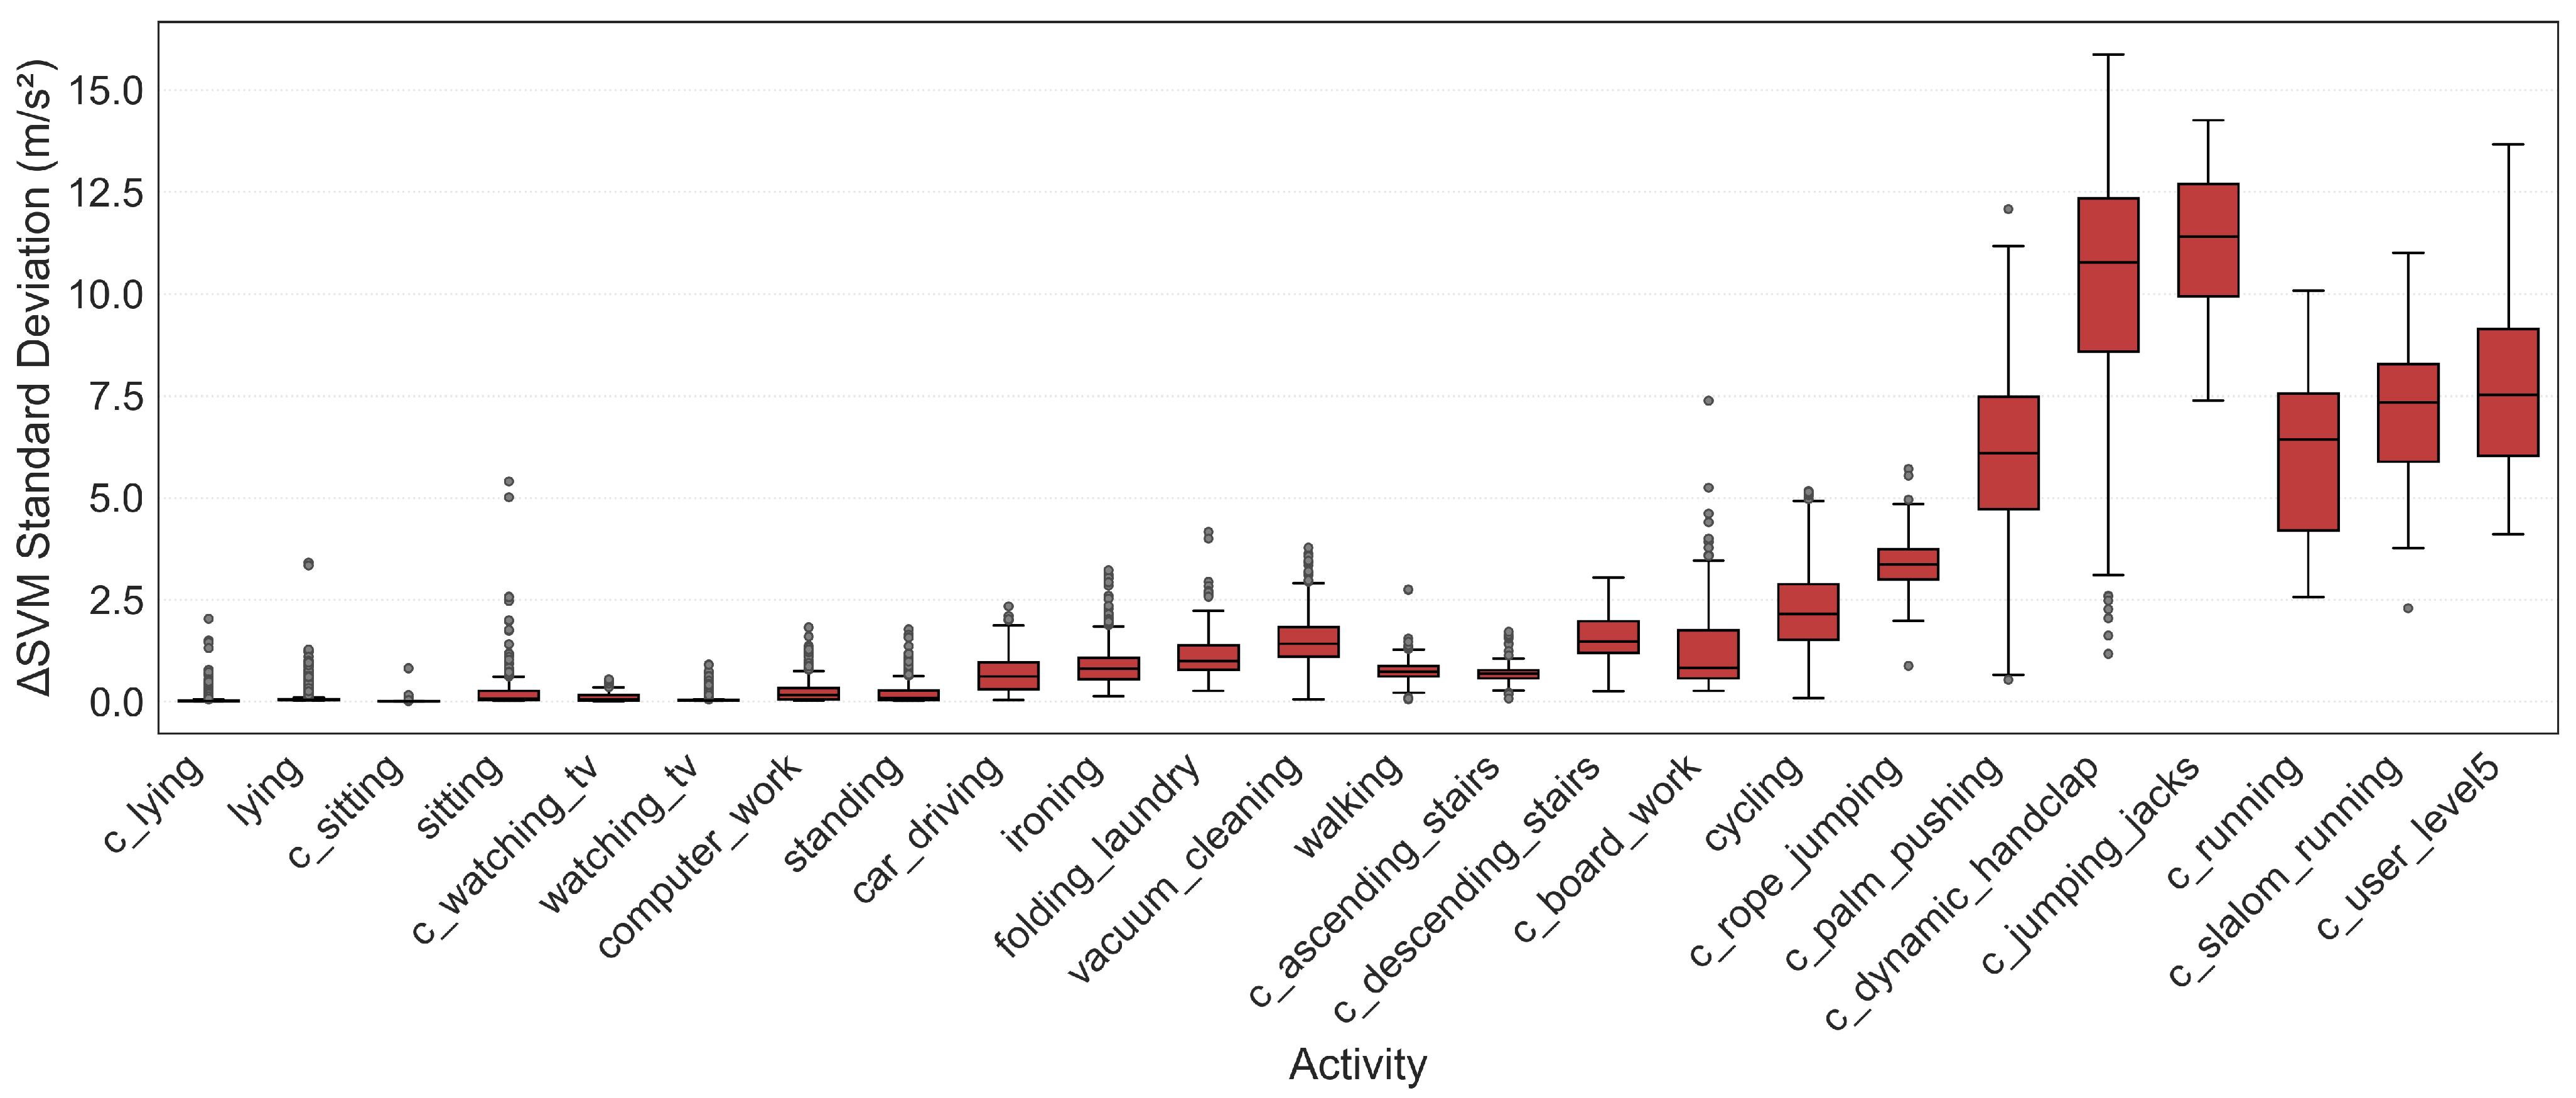
These comparisons (Figure 16, Figure 17, Figure 18 and Figure 19) show that static activities exhibit nearly overlapping distributions across all four features, supporting their integration into unified categories. To differentiate Dyn-Intensity activities from PAMAP2 activities in the boxplot visualizations, Dyn-Intensity activity names include the prefix “c_”, although this naming convention is used solely for figure labeling and does not affect any modeling procedure. In contrast, high-intensity activities show larger mean values and greater variability, making them clearly distinguishable from lower-intensity motions. Furthermore, change-based features such as Δ SVM standard deviation effectively capture irregular activities like slalom running and palm pushing. These findings confirm that the four selected features are robust across data sources and suitable for modeling the five discrete ordinal levels of activity intensity.

3.5. Activity Intensity-Level Mapping

In this study, the 21 activities were reorganized into five intensity levels according to activity intensity. This restructuring enabled activity intensity to be represented using five ordered levels, ranging from daily behaviors to vigorous and atypical emergency situations, thereby moving beyond simple activity classification.
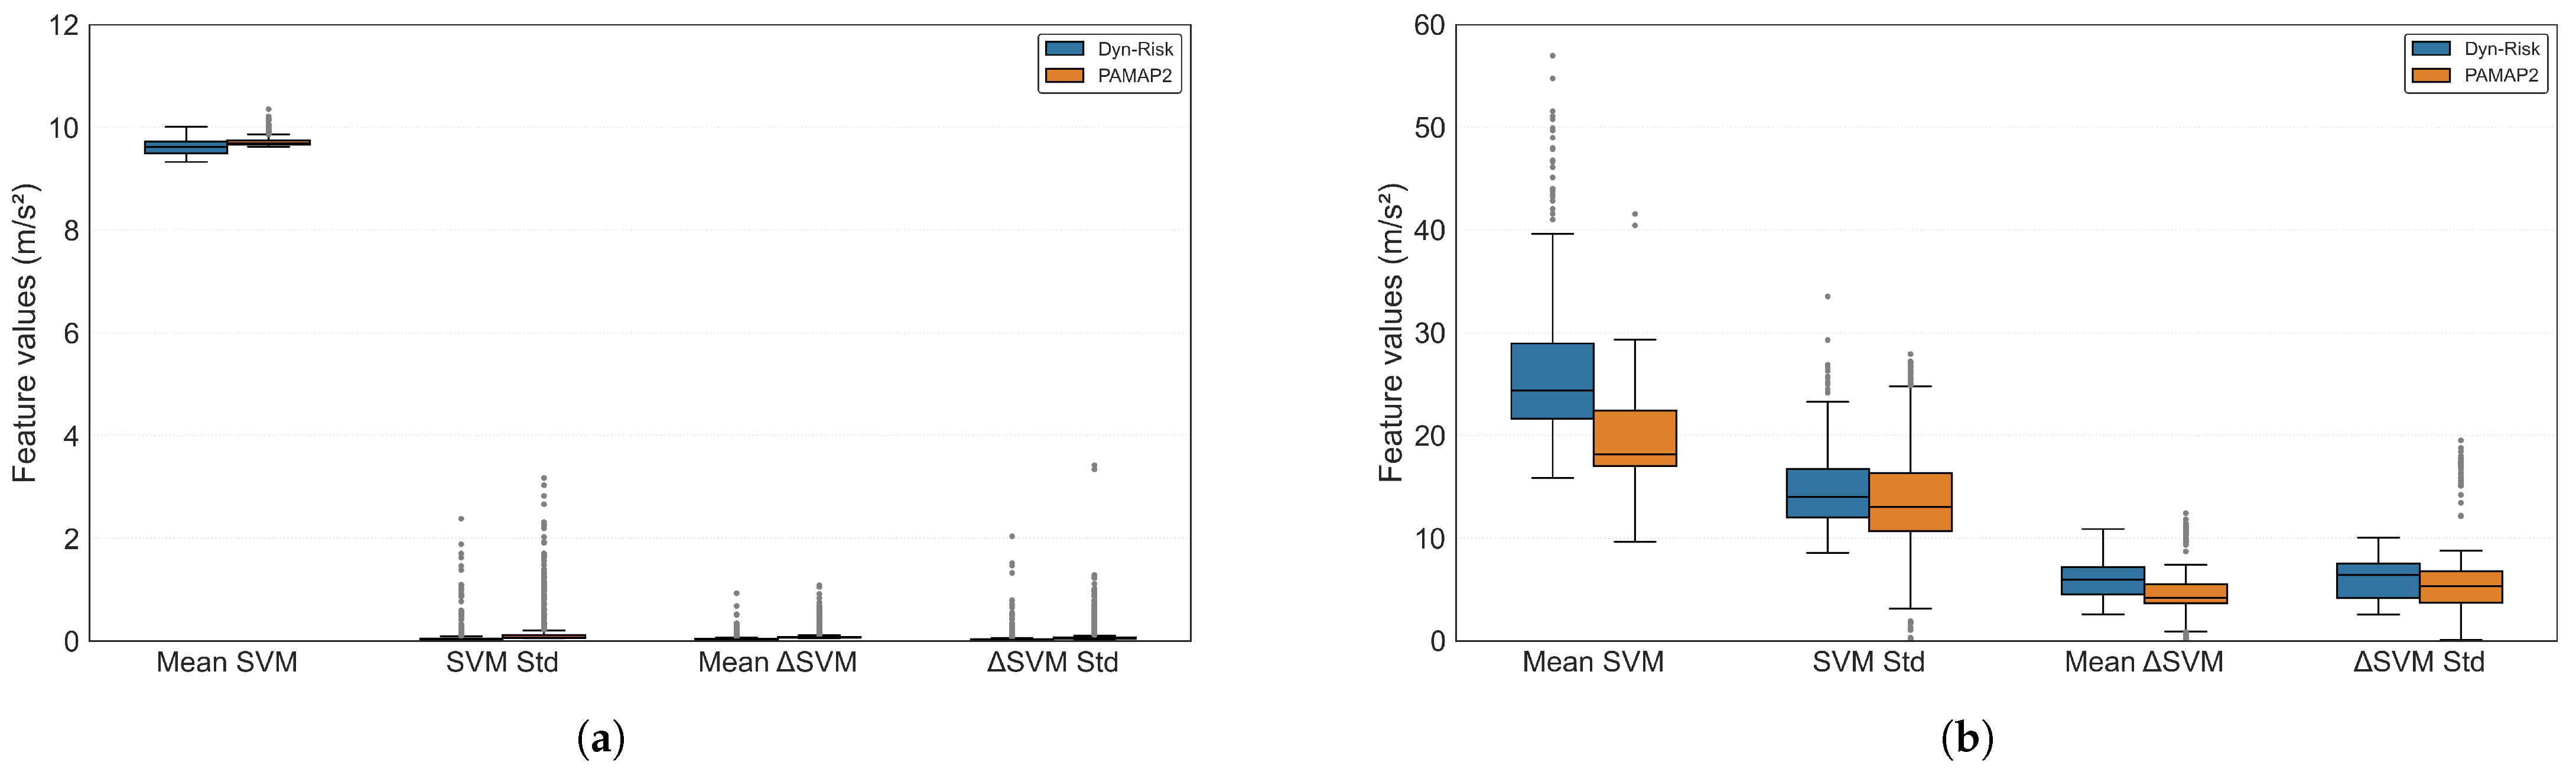
As described in the Data Acquisition section, the integrated dataset comprised 21 activities. Among these, overlapping static activities were merged into unified representative categories, supported by feature-level consistency analysis. Figure 20 compares the feature distributions of a static activity (lying) and a dynamic activity (running) between the PAMAP2 and Dyn-Intensity datasets.
For the static activity, all four features—SVM mean, SVM standard deviation, Δ SVM mean, and Δ SVM standard deviation—exhibited nearly identical central tendencies and ranges across the two datasets. This consistency indicates that sensor characteristics and signal magnitudes remained stable despite differences in devices and participants, thereby validating their integration into a single representative class. Therefore, each instance of lying, sitting, and watching TV was integrated across datasets into a single, consistent category for subsequent intensity-level mapping and model training.
In contrast, the dynamic activity (running) exhibited noticeable differences primarily in SVM-based features, both in mean values and distributional variability, whereas the Δ SVM-derived features showed relatively consistent patterns between groups. These discrepancies are likely attributable to variations in running speed, arm swing intensity, and sensor placement among participants rather than inconsistencies in data collection. In particular, the Dyn-Intensity running data were designed to emulate an emergency-like situation, where participants performed rapid, full-speed running to replicate realistic high-risk movements. Consequently, dynamic activities were retained as independent categories based solely on the Dyn-Intensity dataset to preserve the individuality of high-intensity motion patterns.
Ultimately, the 21 activities were mapped into five hierarchical intensity levels—static, low-intensity daily, moderate-intensity, high-intensity, and vigorous/emergency-like—as summarized in Table 3. It should be noted that this five-level intensity mapping was defined as a heuristic structuring approach rather than derived from externally validated physiological intensity scales, and it was informed by exploratory inspection of the feature distributions across activities, as illustrated in Figure 16, Figure 17, Figure 18 and Figure 19. This five-level structure establishes a unified labeling framework that supports both classification-based (discrete levels) and regression-based (continuous-scale) modeling in subsequent analysis.

3.6. Activity Intensity Estimation Model

The proposed modeling framework was designed to estimate activity intensity levels in both continuous and discrete forms. To comprehensively evaluate model performance and on-device applicability, two approaches were employed: regression-based models for continuous intensity estimation and classification-based models for discrete level prediction.

3.6.1. Motivation for Comparing Non-MLP and MLP Approaches

Wearable devices such as smartwatches operate under strict resource constraints, including limited computational power, memory capacity, and battery life. Therefore, activity intensity estimation models must simultaneously achieve high accuracy, real-time processing capability, and lightweight implementation. To address these requirements, this study comparatively evaluates two fundamentally different modeling paradigms—the model-free approach and the MLP-model approach.
The non-MLP models (both Linear Regression and Logistic Regression) offer extremely low computational complexity and can be implemented using simple mathematical formulations. Conversely, the MLP models (both regression and classification) offer greater predictive accuracy by learning nonlinear relationships within the data. However, these models typically incur higher computational costs, making direct deployment on wearable devices challenging. To overcome this limitation, the present study applies TensorFlow Lite (float16) quantization to the MLP models, enabling efficient on-device inference while maintaining accuracy.
Because the two approaches differ in model complexity, inference cost, memory requirements, and predictive performance, a systematic comparison is necessary. Moreover, since activity intensity can be formulated as either a continuous variable (regression) or a discrete set of levels (classification), each modeling paradigm was implemented in both forms. This design enables a comprehensive evaluation across predictive accuracy, computational efficiency, and real-time feasibility on wearable devices.

3.6.2. Non-MLP Approaches

(1)
Linear Regression
A second-order polynomial feature transformation (interaction-only) was applied before training a linear regressor. The model outputs continuous intensity values, reflecting its formulation as an ordinal regression estimator. For evaluation under the unified five-level framework, these continuous predictions were discretized using a lightweight validation-based threshold optimization procedure. Because the output of the Linear Regression model exhibits a smooth and approximately monotonic structure, a simple grid-based search around median-derived initial thresholds was sufficient to identify a strictly increasing set of thresholds that maximized the quadratic weighted kappa (QWK) on the validation set. This optimization is applied only during evaluation and does not affect model training. The dataset was partitioned into disjoint training, validation, and test sets. The threshold optimization was performed by conducting a grid search on the validation set to find the cut-off points that maximize the QWK. The optimized thresholds obtained on the validation set were fixed prior to final test evaluation, and the test set was not involved in threshold selection at any stage.
(2)
Logistic Regression
A multinomial Logistic Regression model was trained using quadratic interaction-only polynomial features and StandardScaler normalization. As a pure classification model, it directly predicts one of five discrete intensity levels without requiring any post-processing.

3.6.3. MLP Approaches

(3)
MLP (Regression)
The regression MLP was composed of four hidden layers (256–128–64–16 units) with ReLU activations, followed by batch normalization and dropout for regularization. The output layer used a linear activation to generate continuous intensity values, and the model was trained using the Huber loss ( δ = 3.0 ) to enhance robustness to outliers. After training, the model was quantized to float16 precision and converted into a TFLite format to enable real-time on-device inference. To allow direct comparison with classification models, continuous outputs were discretized into five levels using a validation-driven threshold optimization procedure. Unlike the linear model, the MLP produced nonlinear and broader output distributions; therefore, a two-stage coordinate-ascent search (coarse-to-fine) was employed to efficiently locate a strictly increasing set of thresholds that maximized QWK. The optimized thresholds were fixed and applied unchanged to the test set. As with the linear model, this discretization step does not influence training and serves solely to provide a consistent ordinal mapping for evaluation.
(4)
MLP (Classification)
The classification MLP consisted of three hidden layers (256–128–64 units) with ReLU activations (tanh in the final hidden layer), combined with batch normalization and a dropout rate of 0.2 for regularization. The output layer used a softmax activation to produce one of five discrete intensity levels. Training was performed using categorical cross-entropy loss with class weights to address class imbalance. After training, the model was quantized to float16 precision and exported as a TFLite model for efficient real-time inference on the smartwatch.

3.6.4. Model Efficiency and On-Device Feasibility

All four models balance predictive accuracy and computational efficiency. Linear Regression and Logistic Regression are implemented as direct mathematical formulae for reliable execution on the device. MLP models achieve higher predictive performance while remaining feasible for real-time operation. A summary of the model configurations is presented in Table 4.

4. Experiments

4.1. Experimental Environment

Offline training was performed on a workstation equipped with an AMD (Advanced Micro Devices, Inc., Santa Clara, CA, USA) Ryzen 9 9950X CPU and 64 GB RAM. On-device experiments were conducted on a commercial smartwatch, the Samsung Galaxy Watch 7 (SM-L300, Exynos W1000 CPU, 2 GB RAM, Wear OS 5) (Samsung Electronics Co., Ltd., Suwon-si, Republic of Korea).
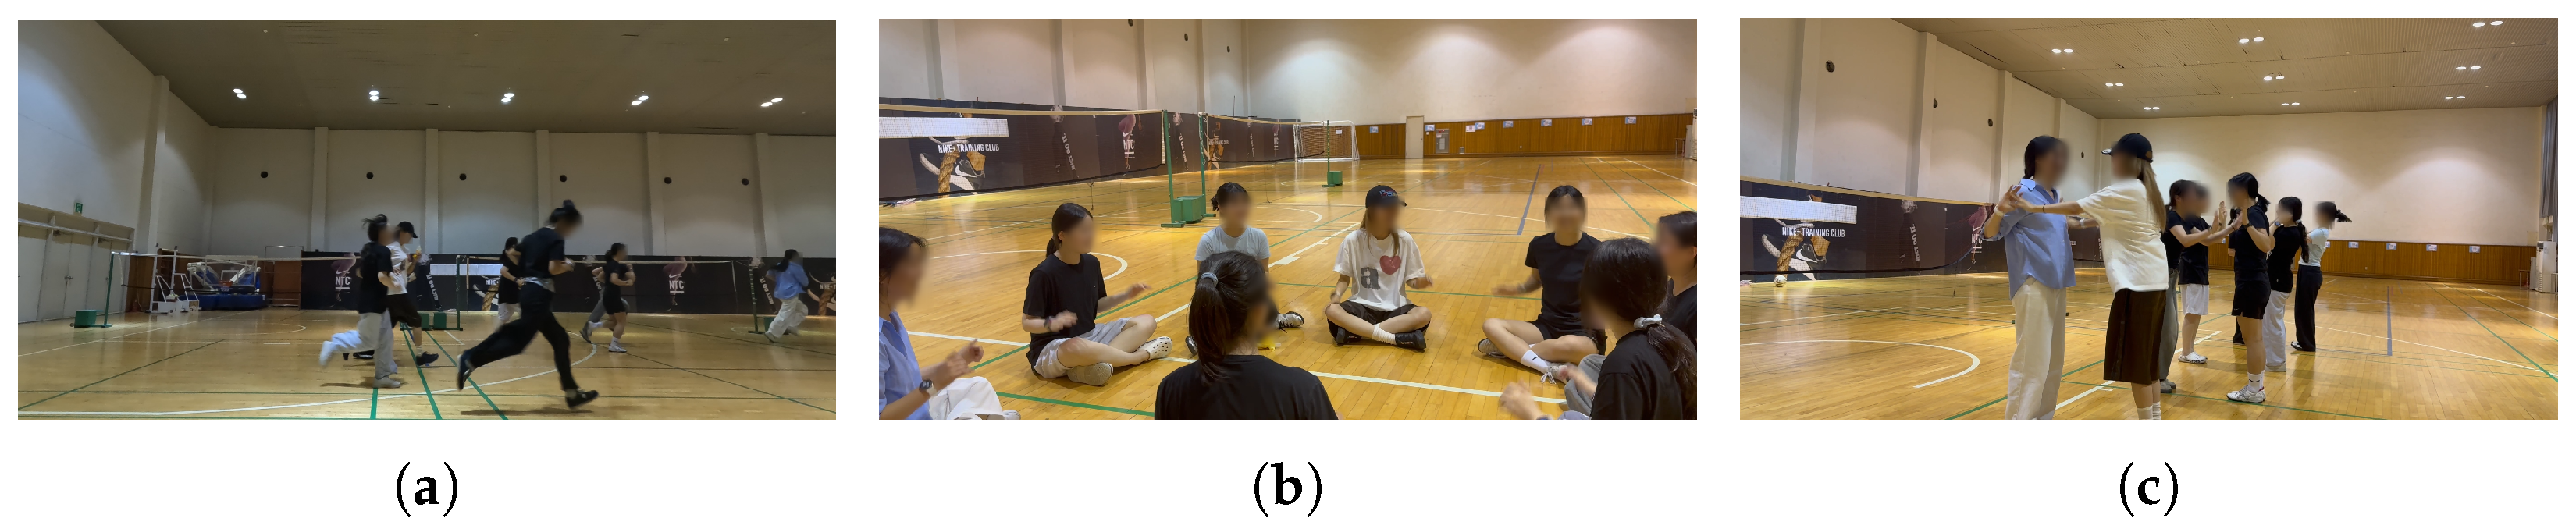
All on-device experiments were conducted in an indoor sports facility. Participants wore the smartwatch on their dominant wrist and repeatedly performed activities of varying intensity (e.g., running, dynamic clapping, and palm pushing). Examples of the experimental environment and performed activities are shown in Figure 21.

4.2. Training Configuration

Specifically, the model-free approaches were implemented as formula-based algorithms (direct mathematical expressions), whereas the MLP-model approaches were deployed as quantized TFLite models. Both formula-based and TFLite-based implementations were executed on the smartwatch to enable consistent performance comparison.
All models were trained using the Adam optimizer (learning rate = 0.0005), with Early Stopping (patience = 25) and ReduceLROnPlateau (patience = 8) applied to ensure stable convergence. To account for class imbalance, sample weights were used during the training of regression-formulated models, whereas class weights were assigned for classification-formulated models. The continuous outputs of regression models were discretized into five levels using validation-optimized thresholds, ensuring compatibility with the classification-based five-level prediction framework.

4.3. Evaluation Protocol

Both non-MLP and MLP approaches were implemented in two prediction formulations: regression and classification. The dataset was split in a stratified manner at a ratio of 64% for training, 16% for validation, and 20% for testing. All scalers were fitted exclusively to the training set to avoid data leakage.
For regression-based models, MSE, Mean Absolute Error (MAE), and the coefficient of determination ( R 2 ) were used to assess continuous prediction performance. For discretized regression results, accuracy and the quadratic weighted kappa (QWK) were additionally calculated. QWK is particularly suitable for ordinal prediction because it reflects the degree of sequential agreement between predicted and true labels.
The QWK is formally defined as
QWK = 1 i , j w i j O i j i , j w i j E i j ,
where i and j index the true and predicted intensity levels, respectively, and span all K ordinal classes (in this study, K = 5 ). Thus, both O i j and E i j form K × K matrices representing the observed and expected confusion matrices. The weight matrix is defined as w i j = ( i j ) 2 ( K 1 ) 2 , which assigns larger penalties as the ordinal difference between classes increases, while assigning zero penalty when i = j . This formulation ensures that ordinal misclassifications are penalized proportionally to their severity.
Classification-based models were evaluated using accuracy, precision, recall, F1-score, and QWK. This unified evaluation protocol ensured fair and consistent comparison between regression-based and classification-based approaches, enabling quantitative verification of prediction tendencies across model types.

5. Results

5.1. Regression Model Performance

Table 5 compares the performance of the two regression models: the non-MLP Linear Regression and the MLP regressor. As a result, the Linear Regression model achieved a QWK of 0.933, demonstrating that the model can preserve ordinal relationships between activity intensity levels. In contrast, the MLP regressor trained with Huber loss ( δ = 3.0 ) and Min–Max scaling demonstrated superior performance, achieving an MSE of 0.075, an MAE of 0.151, an R 2 of 0.95, and a QWK of 0.969. This indicates that while the non-MLP Linear Regression model can model ordinal continuity efficiently, the MLP regression model provides more robust and precise estimation across nonlinear transitions between activity intensity levels.

5.2. Classification Model Performance

Table 6 compares the performance of the two classification models: the non-MLP Logistic Regression and the MLP classifier. The Logistic Regression model achieved an accuracy of 0.931 and a QWK of 0.968. The MLP classifier achieved the best performance with an accuracy of 0.939, an F1-score of 0.941, and a QWK of 0.971. These results indicate that although the classification models do not explicitly model sequential dependencies between intensity levels, the MLP classifier achieved an ordinal consistency comparable to that of regression-based models. This demonstrates that the proposed MLP classification model can provide stable multi-level activity intensity recognition while maintaining high efficiency in resource-constrained on-device environments.
To provide further insight into the behavior of the best-performing model, the per-class precision, recall, and F1-score of the MLP classifier are reported in Table 7.

5.3. Feature Contribution Analysis

To further examine the behavior of the coefficient-based models, feature contributions were analyzed for both Linear Regression and Logistic Regression. Feature importance was estimated based on the absolute magnitude of the learned model coefficients, which reflects the relative influence of each feature on the model predictions. Because polynomial feature expansion was applied during pre-processing, additional interaction terms derived from the original four features were generated. Each expanded feature was mapped back to its original feature group based on the feature name, and the absolute coefficient magnitudes were aggregated into two groups: SVM-based features and Δ SVM-based features. The contribution ratio was computed as the proportion of the summed absolute coefficients within each feature group relative to the total coefficient magnitude.
For Linear Regression, Δ SVM-based features accounted for 0.6447 of the total coefficient magnitude, compared to 0.3553 for SVM-based features. A similar pattern was observed in Logistic Regression, where Δ SVM-based features contributed 0.688, whereas SVM-based features contributed 0.312, as summarized in Table 8.
To further validate these results, permutation importance analysis [25] was conducted on the test set using classification accuracy as the evaluation metric. This method evaluates feature importance by measuring the decrease in model performance when the values of a specific feature are randomly permuted. In the Logistic Regression model, permuting the mean of Δ SVM resulted in the largest decrease in accuracy, substantially exceeding that of representative SVM-based features such as the mean of SVM, as shown in Table 9.
Overall, these findings indicate that variation-oriented dynamics captured by Δ SVM play a more influential role in distinguishing activity intensity levels than magnitude-oriented SVM statistics.

5.4. Confusion Matrix and Error Analysis

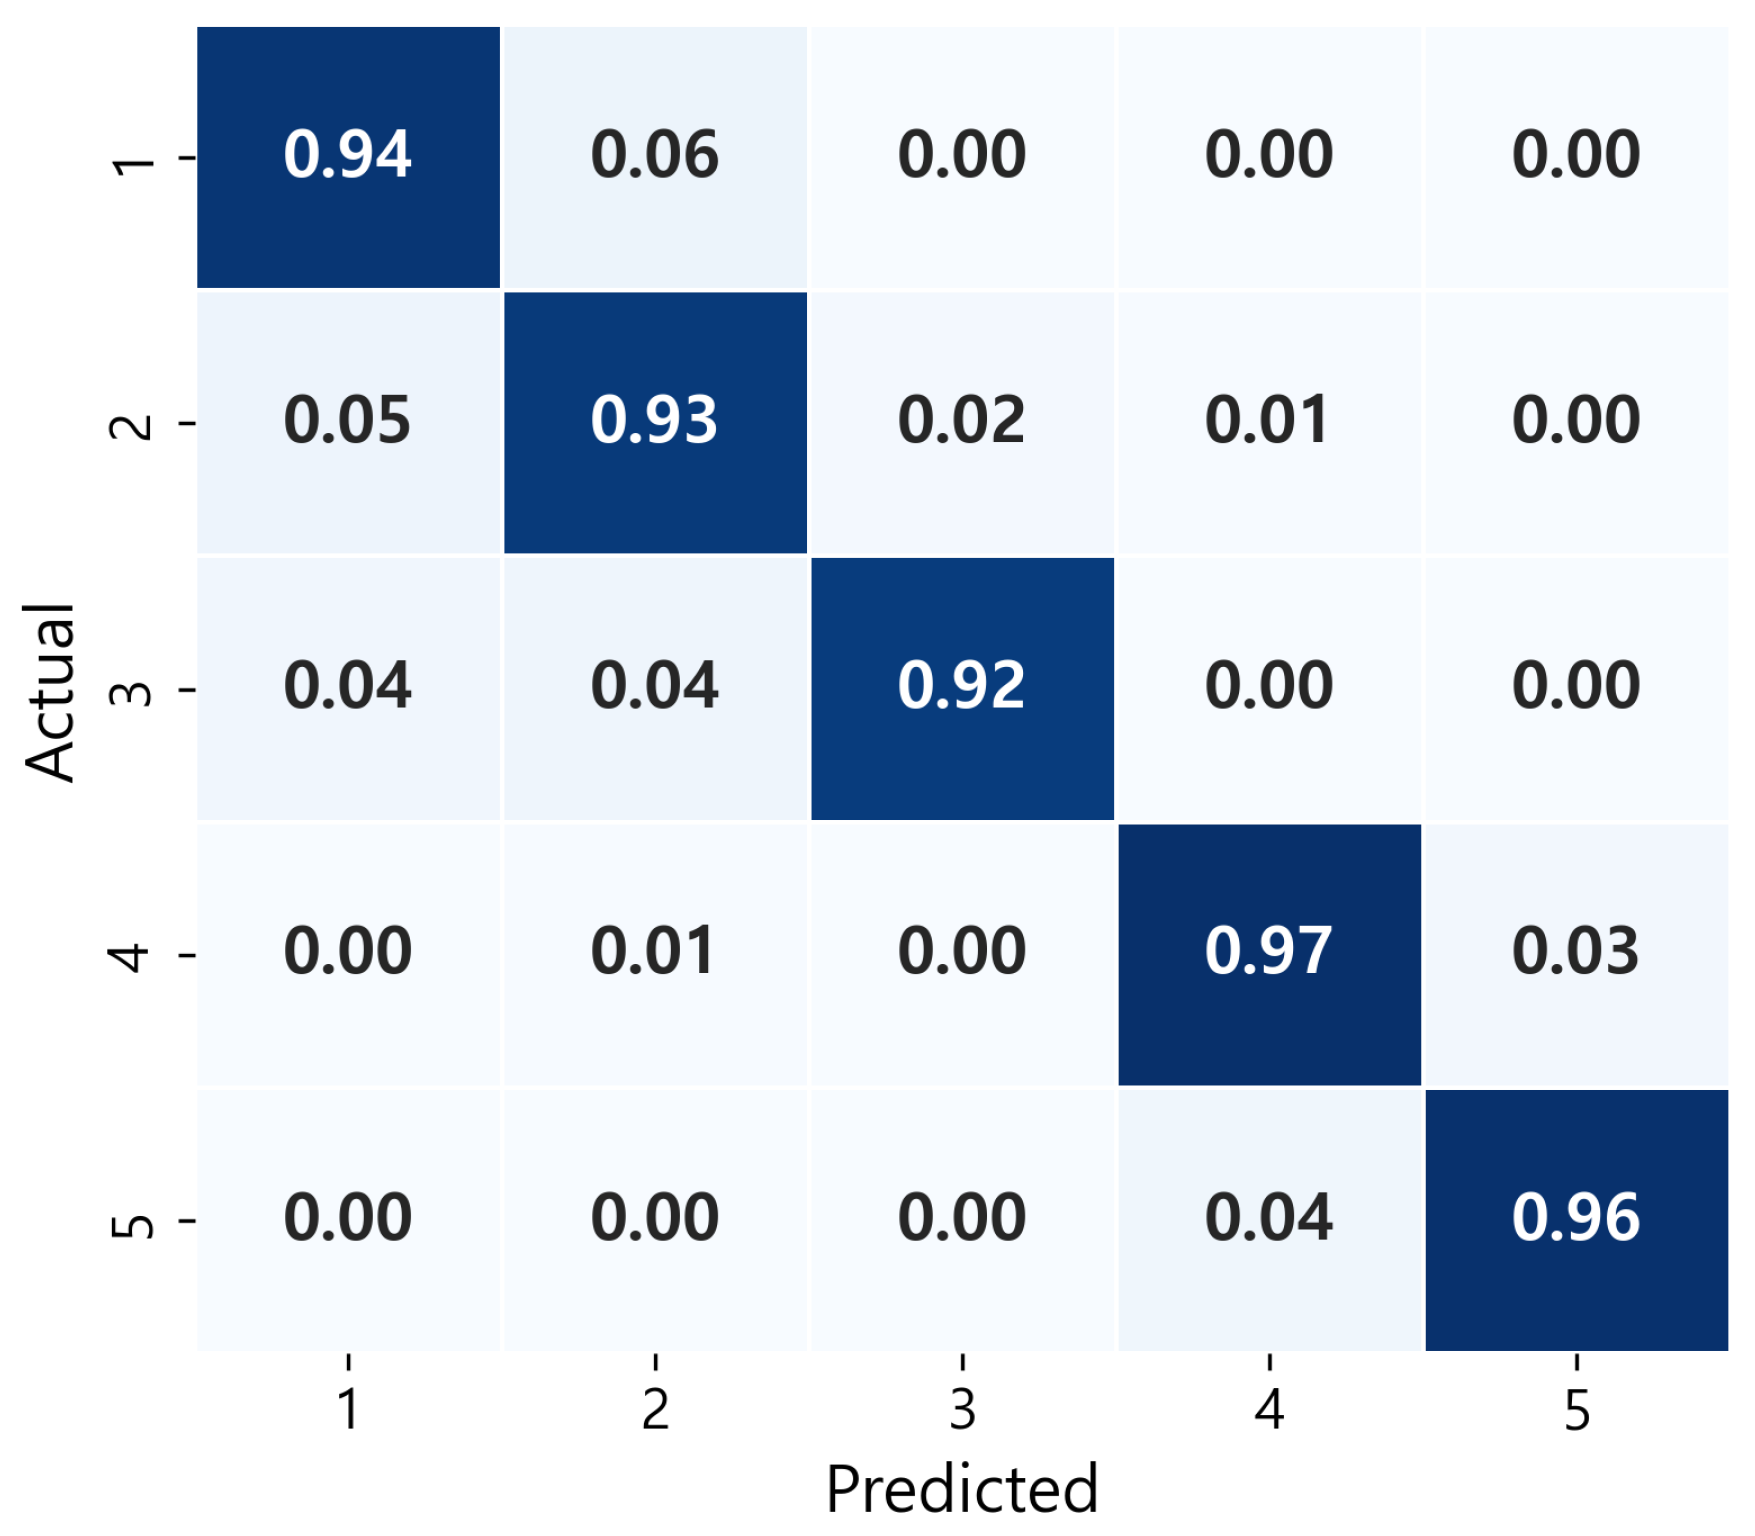
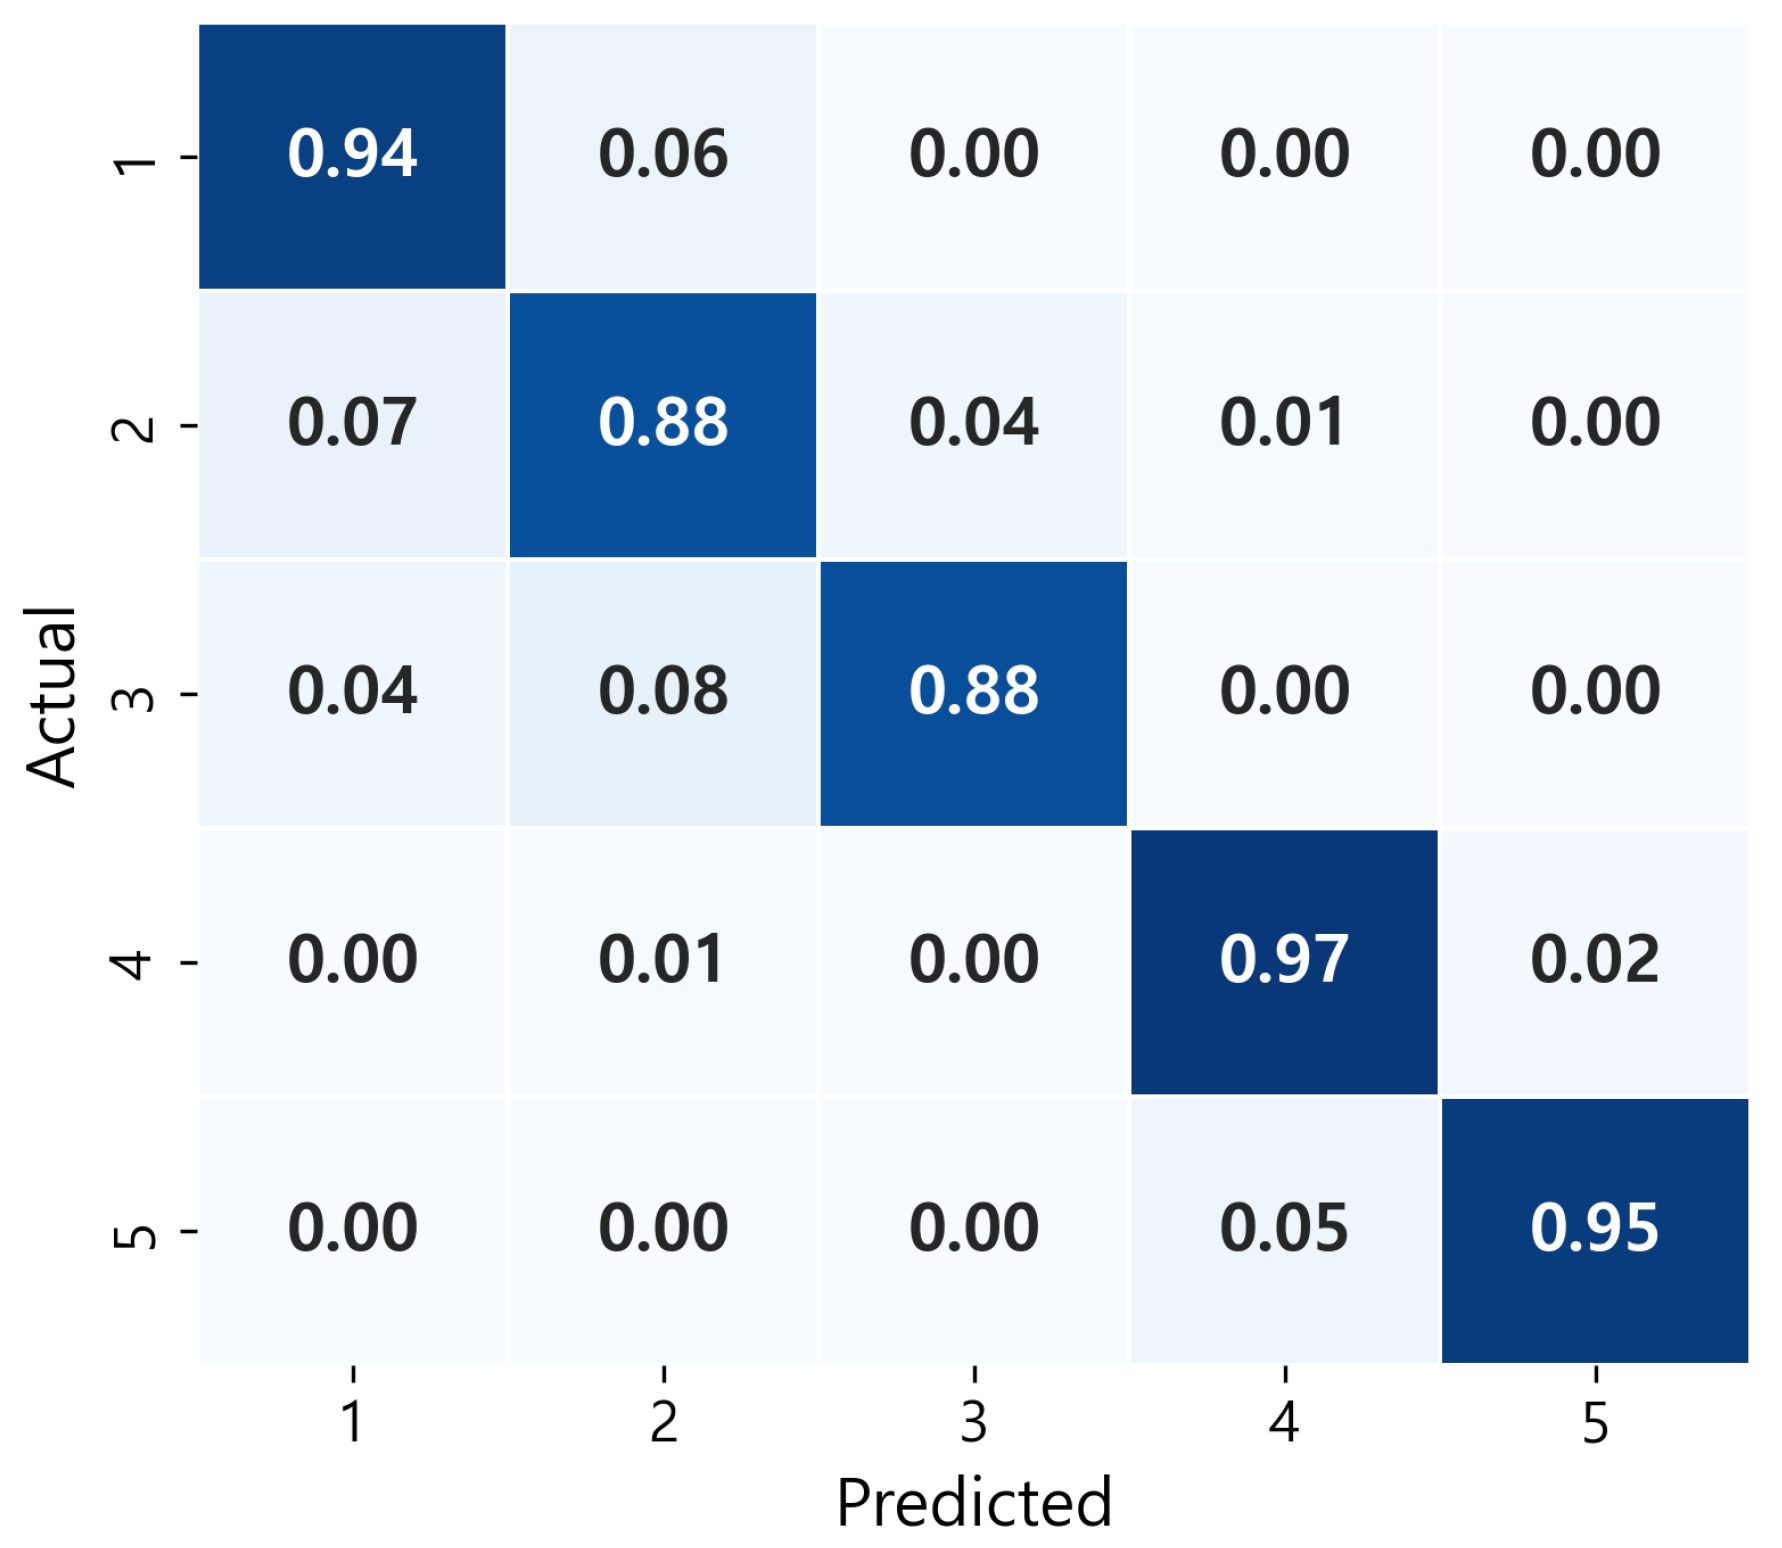
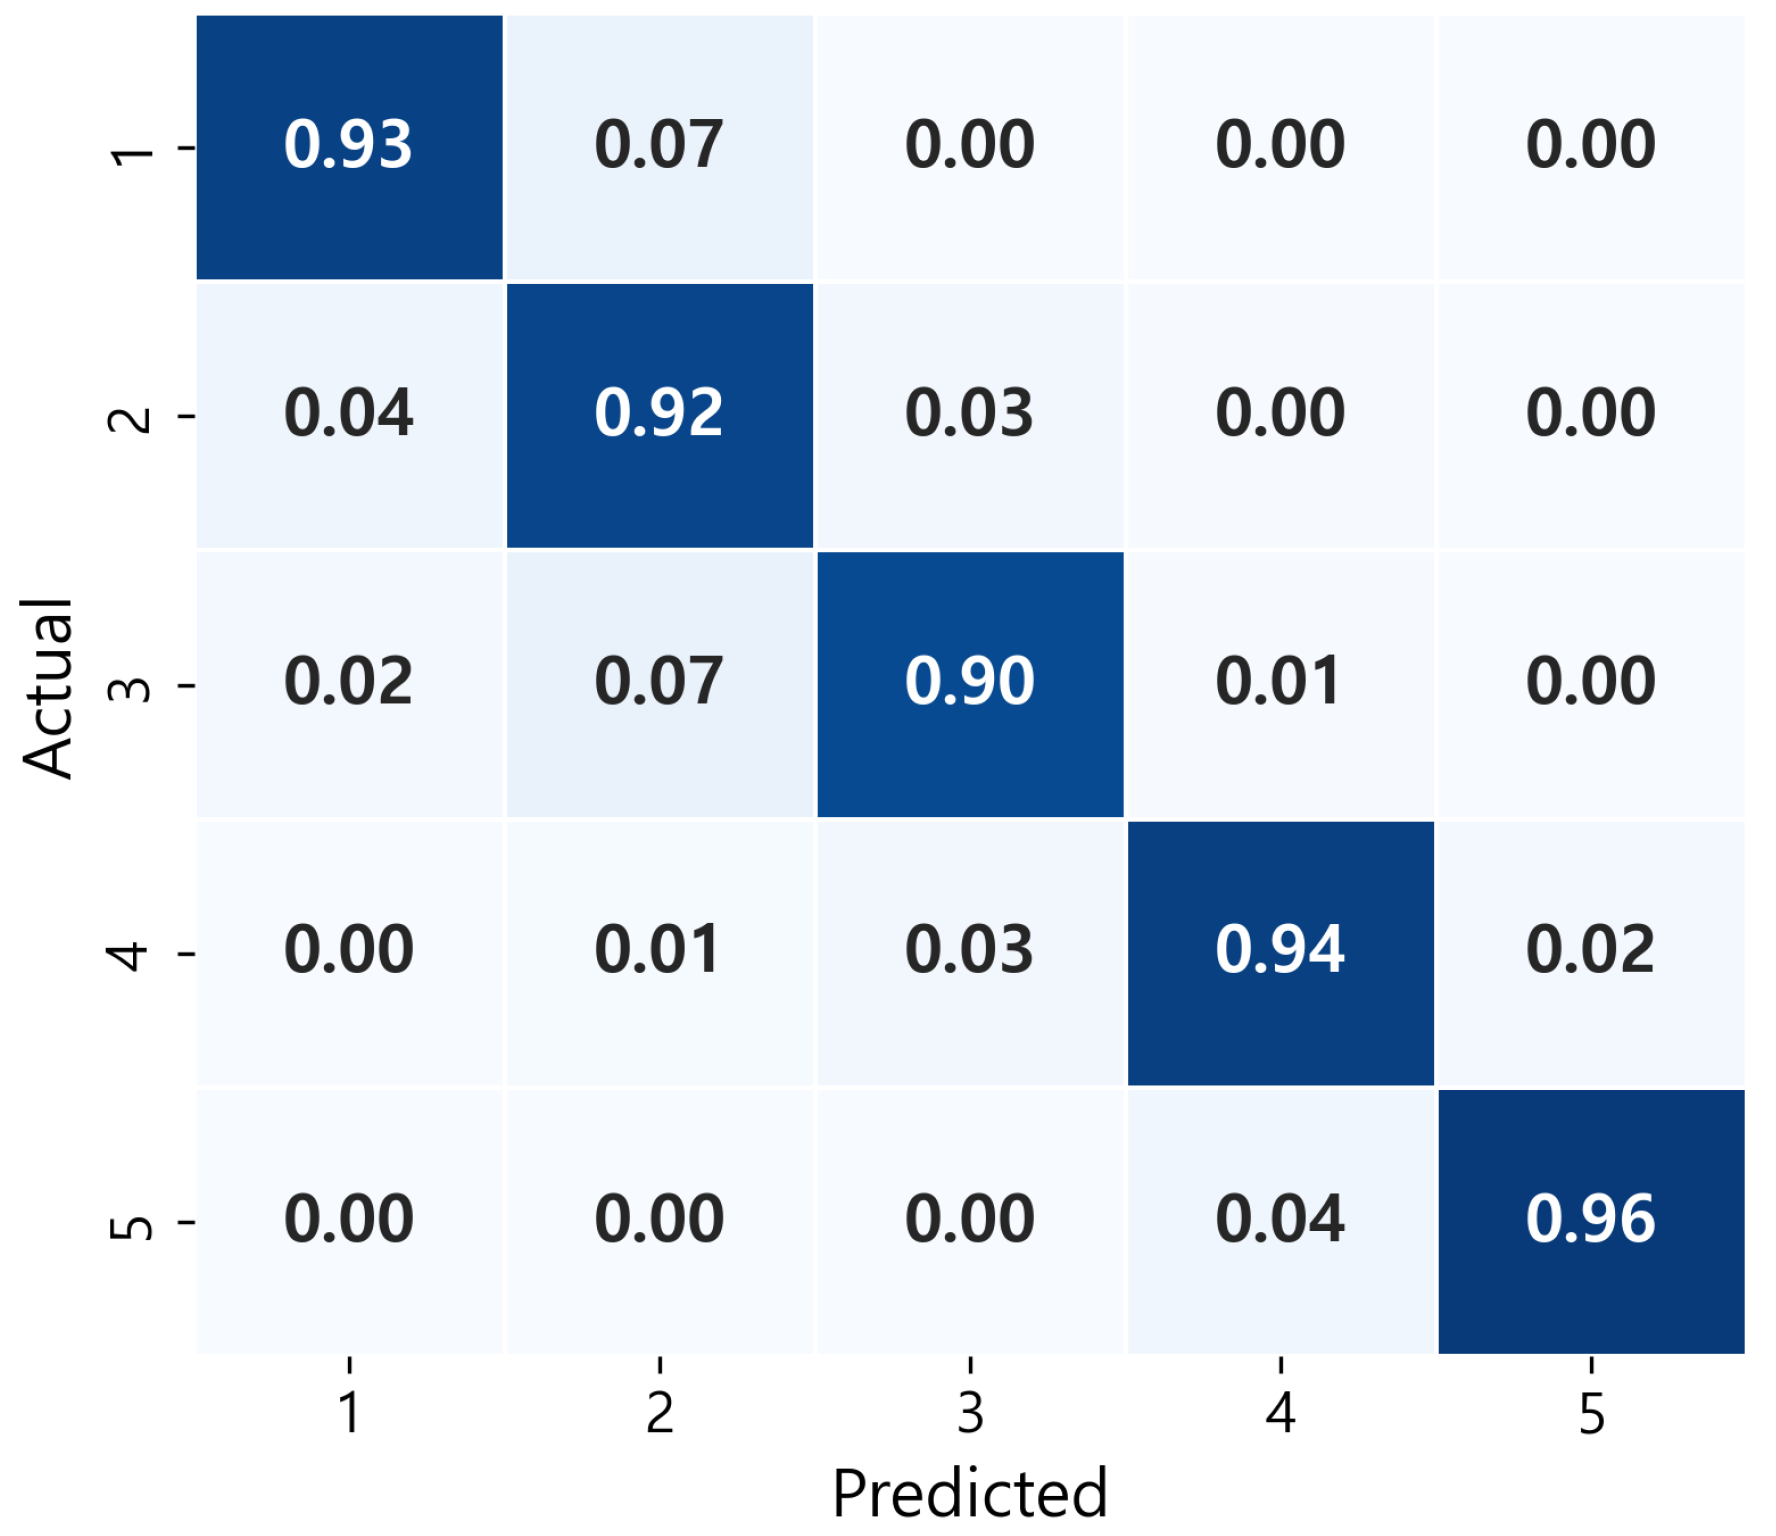
Figure 22 shows the normalized confusion matrix of the MLP classifier on the test set. Unlike conventional HAR studies that mainly focus on recognizing daily activities, the evaluation dataset in this study includes customized emergency-like wrist motions collected for wearable-based personal safety monitoring. This design allows the proposed model to capture activity intensity patterns relevant to potential risk situations that are rarely represented in existing public HAR datasets.
The matrix exhibits strong concentration along the diagonal, confirming that most samples were correctly classified into their corresponding activity intensity levels. Misclassifications were primarily observed between adjacent levels (Level 2↔3 and Level 4↔5), indicating that the model successfully captured the ordinal relationships between intensity levels. Furthermore, the limited confusion observed between adjacent levels can be interpreted as a reflection of natural boundary transitions that occur within the continuous spectrum of human motion. While such cases represent ordinal misclassification between neighboring levels, they are consistent with the gradual transitions that occur between similar activity intensities. Notably, confusion was minimal between Level 1 (static activities) and Level 5 (vigorous or high-intensity activities), demonstrating the model’s ability to clearly distinguish extreme activity levels.
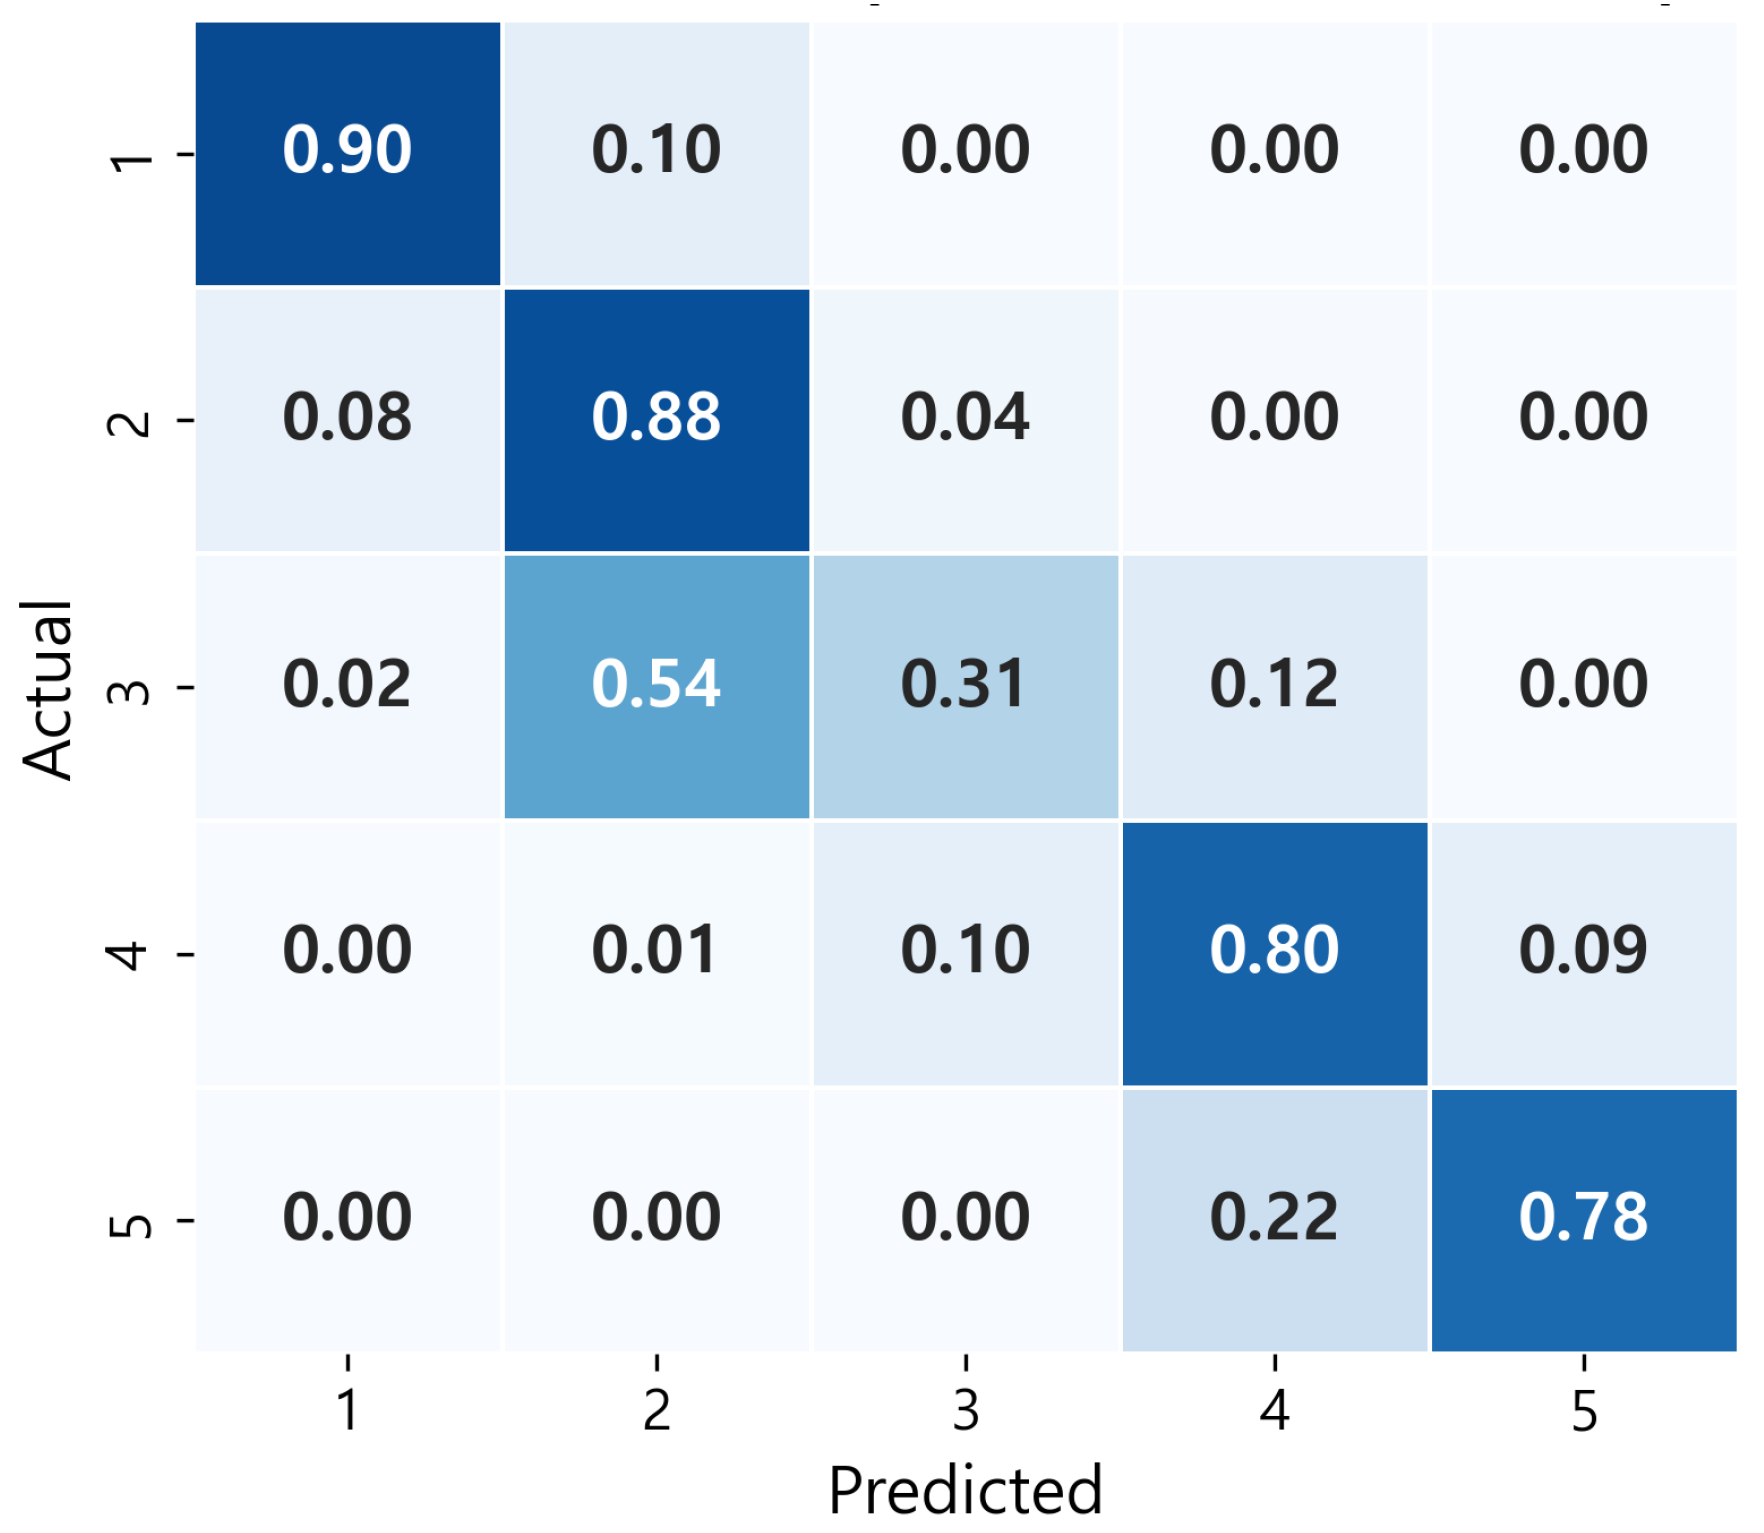
In conclusion, the proposed MLP classifier consistently distinguished multi-level activity intensities—from static to highly vigorous activities—while stably learning the sequential structure between intensity levels. For completeness, additional confusion matrices for the remaining three models—classification (non-MLP), regression (MLP), and regression (non-MLP)—are provided in Figure 23, Figure 24 and Figure 25.

5.5. On-Device Evaluation

To verify the real-time applicability of the proposed activity intensity recognition model, on-device inference experiments were conducted on a Galaxy Watch 7. All experiments focused on real-time processing performance (inference latency, memory usage, and model size) as well as prediction stability, providing a comprehensive evaluation of the device-independence and real-time inference capability of the proposed approach.

5.5.1. Evaluation of MLP Classifier

The MLP-model classifier, deployed in its quantized TFLite form, was executed on the device. After 2000 iterations, the model achieved sub-millisecond inference latency (p50 = 0.038 ms) with minimal memory overhead, as shown in Table 10. It should be noted that this value reflects only the neural network computation time per window. The overall decision latency of the system is primarily determined by the fixed 6 s sliding window used for feature extraction, whereas the model inference introduces negligible additional delay. Here, p50, p90, and p99 denote the 50th, 90th, and 99th percentile latencies, respectively, characterizing both typical and worst-case inference times. Peak memory indicates the maximum runtime memory consumption during inference, while model size represents the storage footprint of the quantized TFLite model on the device.
The model enabled predictions directly on the watch; however, temporary fluctuations in predicted intensity levels were occasionally observed during wrist shaking or small stationary motions. To mitigate this issue, post-processing rules were applied. As a post-processing step, the prediction probabilities from recent windows were smoothed using a moving average, and a hysteresis condition was introduced so that level transitions occurred only when consistent predictions were maintained for a certain duration. In addition, a median filter and probability-based constraints were applied to suppress transient spikes caused by abrupt jerks.
These post-processing rules consist only of simple arithmetic operations, enhancing prediction stability without affecting inference latency. Experimental results showed that erroneous high-intensity predictions during low-intensity activities were effectively suppressed. The model maintained stable multi-level predictions across various activity scenarios.
To further evaluate generalization performance under real-world conditions, a real-time subject-independent validation was conducted using three newly recruited participants (Subjects 09–11) who were entirely excluded from the training and hyperparameter tuning processes. The deployed quantized MLP model was executed directly on the Galaxy Watch without retraining, and predictions were generated in real time while the participants performed activities corresponding to each intensity level. The unseen participants performed representative activities for each intensity level, including lying (Level 1), walking (Level 2), dynamic handclap (Level 3), rope jumping (Level 4), and running (Level 5).
As shown in Table 11, for these unseen users, the model maintained consistent multi-level intensity recognition without observable performance degradation compared to the original test results. These findings demonstrate that the proposed MLP classifier generalizes robustly to new users under fully on-device, real-time operating conditions, thereby supporting its practical applicability in wearable deployment scenarios.

5.5.2. Evaluation of the Non-MLP Classifier

A comparative experiment was conducted by implementing a non-MLP classifier on the same device. Due to fundamental differences in model architecture and processing pipelines, the evaluation metrics for the MLP classifier and the non-MLP classifier differ. While the non-MLP evaluation emphasizes inference latency and resource usage under optimized CPU delegation, as shown in Table 10, the non-MLP model assessment focuses on end-to-end latency including the fixed processing window, with detailed measurements presented in Table 12. This complementary evaluation approach provides a holistic understanding of on-device execution feasibility, distinguishing between model computation time and end-to-end system latency.
This model was implemented using explicit mathematical formulas as its internal logic, with all computations executed in real-time on the watch CPU. The end-to-end latency, which includes a single 6 s processing window, was primarily determined by the fixed window duration rather than computational overhead. This result confirms that the model can perform efficient on-device inference under smartwatch constraints, with Table 12 presenting the detailed end-to-end latency measurements. Here, end-to-end (E2E) latency refers to the total decision delay, including the fixed 6 s processing window and the subsequent computation time. As in the previous analysis, p50, p90, and p99 correspond to the 50th, 90th, and 99th percentile E2E latencies, respectively, highlighting both typical and worst-case decision delays on the device.
The post-processing of the non-MLP classifier was designed to apply additional probability thresholds and margin conditions between classes. This design holds predictions with low confidence and only allows level transitions when a certain level of cumulative change is reached. Furthermore, a feature gate was applied to temporarily hold results when input features deviated from the normal range, preventing unstable judgments. These rules require negligible computation and were optimized to operate effectively within the real-time inference cycle. The model maintained prediction trends similar to the MLP while requiring significantly lower computational cost.

6. Discussion

This study proposed a model capable of multi-level activity intensity recognition, ranging from low-intensity daily activities to vigorous behaviors associated with higher physical risk, using only the accelerometer sensor of a smartwatch. The proposed MLP Approaches successfully learned a five-level continuous intensity structure, showing limited confusion only between adjacent intensity intervals. Moreover, the Δ SVM-based feature sensitively captured instantaneous motion changes, effectively distinguishing atypical or vigorous movements.
Unlike previous wearable HAR studies that primarily focused on single-purpose binary classification tasks such as fall detection or exercise intensity estimation, this work primarily focused on self-collected dynamic behaviors and further incorporated static and daily activities to extend the dynamic intensity scale into a continuous spectrum. This approach enabled the recognition of gradual transitions in activity intensity rather than discrete class distinctions. Furthermore, the same algorithm was implemented in both MLP and non-MLP approaches, demonstrating real-time operation. These results demonstrate that the proposed model can support efficient on-device activity intensity recognition on the Galaxy Watch 7 platform.
Another notable contribution of this study lies in its potential for personalization. The User_level5 label, representing user-defined vigorous or hazardous situations, can be re-collected and re-trained to reflect individual movement patterns. The personalized model can be directly deployed in models, with adjustable thresholds for customized sensitivity, enabling user-driven risk detection based on activity intensity.
Nevertheless, several limitations should be acknowledged. First, the data collection was limited to female participants in their 20s, and further validation is required to generalize the findings to broader populations across different ages, genders, and wearing positions. In addition, the data were collected in controlled indoor environments; therefore, robustness against environmental noise and variations in sensor placement in real-world and industrial settings remains to be evaluated.

7. Conclusions

This study proposed an on-device model capable of real-time recognition of five activity intensity levels using only three-axis acceleration data from smartwatches. The MLP classification model, based on four statistical features (SVM mean and standard deviation, Δ SVM mean and standard deviation), achieved 0.939 accuracy and a QWK of 0.971. It achieved sub-millisecond inference latency (<1 ms) and a compact model size (<0.1 MB), experimentally confirming stable real-time operation even under the limited computational resources of smartwatch environments.
The proposed framework demonstrated the ability to recognize risk levels across ordered activity intensity levels, enabling stepwise interpretation of activity intensity beyond simple activity classification. This provides a technical foundation for implementing real-time risk awareness and stepwise alert systems in wearable environments. Furthermore, by re-collecting and retraining the User_level5 data defined by individual users, the model can be extended into a personalized risk detection system tailored to each user’s motion characteristics. In addition, fine-tuning post-processing thresholds allows customization of alert sensitivity to reflect the user’s personal risk perception or behavioral tendencies.
Future research could consider the (i) validation of generalization across diverse populations, wear locations, and activity environments; (ii) fusion of multimodal signals such as heart rate and gyroscope data; (iii) automatic optimization of user-specific retraining and post-processing thresholds; and (iv) adaptive update techniques to address data drift during long-term use. Through these directions, the proposed system could evolve into a personalized risk detection and prediction platform that adapts to real-world conditions.
In conclusion, the proposed approach simultaneously achieved high accuracy and real-time performance using a single sensor, demonstrating its potential for future development into wearable-based personal safety management and industrial safety monitoring systems.

Author Contributions

Conceptualization, J.Y.; methodology, S.K. and J.Y.; software, S.K.; validation, S.K. and J.Y.; formal analysis, S.K.; investigation, S.K.; resources, S.K.; data curation, J.Y.; writing—original draft preparation, S.K.; writing—review and editing, S.K. and J.Y.; visualization, S.K.; supervision, J.Y.; project administration, J.Y.; funding acquisition, J.Y. All authors have read and agreed to the published version of the manuscript.

Funding

This work was supported by the Sungshin Women’s University Research Grant of 2026.

Institutional Review Board Statement

This study was conducted in accordance with the Declaration of Helsinki and approved by the Institutional Review Board (or Ethics Committee) of Sungshin Women’s University (SSWUIRB-2024-061).

Informed Consent Statement

Informed consent was obtained from all subjects involved in the study.

Data Availability Statement

The Dyn-Risk dataset generated in this study, along with the pre-processed PAMAP2 subsets used for model integration, is available at https://github.com/AILAB-IMU/Dyn-Intensity (accessed on 9 February 2026).

Conflicts of Interest

The author declares no conflicts of interest.

References

  1. Del Rosario, M.B.; Lovell, N.H.; Redmond, S.J. Learning the Orientation of a Loosely-Fixed Wearable IMU Relative to the Body Improves the Recognition Rate of Human Postures and Activities. Sensors 2019, 19, 2845. [Google Scholar] [CrossRef] [Scilit] [PubMed]
  2. Mao, Y.; Yan, L.; Guo, H.; Hong, Y.; Huang, X.; Yuan, Y. A Hybrid Human Activity Recognition Method Using an MLP Neural Network and Euler Angle Extraction Based on IMU Sensors. Appl. Sci. 2023, 13, 10529. [Google Scholar] [CrossRef] [Scilit]
  3. Fridriksdottir, E.; Bonomi, A.G. Accelerometer-Based Human Activity Recognition for Patient Monitoring Using a Deep Neural Network. Sensors 2020, 20, 6424. [Google Scholar] [CrossRef] [Scilit]
  4. Bibbo, L.; Angiulli, G.; Laganà, F.; Pratticò, D.; Cotroneo, F.; La Foresta, F.; Versaci, M. MEMS and IoT in HAR: Effective Monitoring for the Health of Older People. Appl. Sci. 2025, 15, 4306. [Google Scholar] [CrossRef] [Scilit]
  5. Bulling, A.; Blanke, U.; Schiele, B. A Tutorial on Human Activity Recognition Using Body-Worn Inertial Sensors. ACM Comput. Surv. 2014, 46, 33. [Google Scholar] [CrossRef] [Scilit]
  6. Attal, F.; Mohammed, S.; Dedabrishvili, M.; Chamroukhi, F.; Oukhellou, L.; Amirat, Y. Physical Human Activity Recognition Using Wearable Sensors. Sensors 2015, 15, 31314–31338. [Google Scholar] [CrossRef] [Scilit] [PubMed]
  7. Seenath, S.; Dharmaraj, M. Conformer-Based Human Activity Recognition Using Inertial Measurement Units. Sensors 2023, 23, 7357. [Google Scholar] [CrossRef] [Scilit] [PubMed]
  8. Zhou, H.; Zhang, X.; Feng, Y.; Zhang, T.; Xiong, L. Efficient Human Activity Recognition on Edge Devices Using DeepConv LSTM Architectures. Sci. Rep. 2025, 15, 13830. [Google Scholar] [CrossRef] [Scilit] [PubMed]
  9. Gomes, E.; Bertini, L.; Campos, W.R.; Sobral, A.P.; Mocaiber, I.; Copetti, A. Machine Learning Algorithms for Activity-Intensity Recognition Using Accelerometer Data. Sensors 2021, 21, 1214. [Google Scholar] [CrossRef] [Scilit]
  10. Chen, D.; Du, Y.; Liu, Y.; Hong, J.; Yin, X.; Zhu, Z.; Wang, J.; Zhang, J.; Chen, J.; Zhang, B.; et al. Development and Validation of a Smartwatch Algorithm for Differentiating Physical Activity Intensity in Health Monitoring. Sci. Rep. 2024, 14, 9530. [Google Scholar] [CrossRef] [Scilit] [PubMed]
  11. Wei, B.; Romano, C.; Pedram, M.; Nolan, B.; Morelli, W.A.; Alshurafa, N. Developing and Comparing a New BMI-Inclusive Energy Expenditure Algorithm on Wrist-Worn Wearables. Sci. Rep. 2025, 15, 20060. [Google Scholar] [CrossRef] [Scilit] [PubMed]
  12. Wang, X.; Yu, H.; Kold, S.; Rahbek, O.; Bai, S. Wearable Sensors for Activity Monitoring and Motion Control: A Review. Biomim. Intell. Robot. 2023, 3, 100089. [Google Scholar] [CrossRef] [Scilit]
  13. Pernek, I.; Kurillo, G.; Stiglic, G.; Bajcsy, R. Recognizing the Intensity of Strength Training Exercises with Wearable Sensors. J. Biomed. Inform. 2015, 58, 145–155. [Google Scholar] [CrossRef] [Scilit]
  14. Hossain, E.; Hossain, M.; Alam, M.; Haque, M.; Uddin, M.; Haque, M. Ordinal statistical models of physical activity levels from accelerometer data. Int. J. Exerc. Sci. 2021, 14, 1460–1475. [Google Scholar] [CrossRef] [Scilit] [PubMed]
  15. Bağcı Daş, D.; Birant, D. Ordered physical human activity recognition based on ordinal classification. Turk. J. Electr. Eng. Comput. Sci. 2021, 29, 2478–2496. [Google Scholar] [CrossRef] [Scilit]
  16. Bian, S.; Liu, M.; Rey, V.F.; Geissler, D.; Lukowicz, P. TinierHAR: Towards Ultra-Lightweight Deep Learning Models for Efficient Human Activity Recognition on Edge Devices. In Proceedings of the 2025 ACM International Symposium on Wearable Computers (ISWC), Espoo, Finland, 12–16 October 2025. [Google Scholar]
  17. Yeon, T.; Xu, V.; Hoffmann, H.; Ahuja, K. WatchHAR: Real-Time On-Device Human Activity Recognition System for Smartwatches. In Proceedings of the 27th International Conference on Multimodal Interaction (ICMI), Canberra, Australia, 13–17 October 2025. [Google Scholar] [CrossRef] [Scilit]
  18. Huang, X.; Chen, Y.; Wang, W.; Wu, H.; Song, A. Deep Ensemble Learning for Human Activity Recognition Using Wearable Sensors via Filter Activation. J. ACM 2022, 1, 1–24. [Google Scholar] [CrossRef] [Scilit]
  19. Lattanzi, E.; Calisti, L.; Capellacci, P. Lightweight Accurate Trigger to Reduce Power Consumption in Sensor-Based Continuous Human Activity Recognition. Pervasive Mob. Comput. 2023, 96, 101848. [Google Scholar] [CrossRef] [Scilit]
  20. Montgomery, D.C.; Peck, E.A.; Vining, G.G. Introduction to Linear Regression Analysis, 5th ed.; Wiley: Hoboken, NJ, USA, 2012. [Google Scholar]
  21. Hosmer, D.W.; Lemeshow, S. Applied Logistic Regression, 2nd ed.; Wiley: New York, NY, USA, 2000. [Google Scholar]
  22. TensorFlow. TensorFlow Lite Guide. Available online: https://www.tensorflow.org/lite/guide (accessed on 16 October 2025).
  23. Reiss, A.; Stricker, D. Introducing a New Benchmarked Dataset for Activity Monitoring. In Proceedings of the 2012 16th International Symposium on Wearable Computers, Newcastle, UK, 18–22 June 2012; pp. 108–109. [Google Scholar]
  24. Oh, H.; Yoo, J. Real-Time Detection of At-Risk Movements Using Smartwatch IMU Sensors. Appl. Sci. 2025, 15, 1842. [Google Scholar] [CrossRef] [Scilit]
  25. Breiman, L. Random Forests. Mach. Learn. 2001, 45, 5–32. [Google Scholar] [CrossRef] [Scilit]
Figure 1. Compressed system pipeline for on-device multi-level activity intensity recognition.
Electronics 15 01351 g001
Figure 2. On-watch labeling and logging during data acquisition. (a) On-watch label selection; (b) start/stop control; (c) sample CSV log ( a x , a y , a z ).
Electronics 15 01351 g002
Figure 3. Feature distribution for lying.
Electronics 15 01351 g003
Figure 4. Feature distribution for sitting.
Electronics 15 01351 g004
Figure 5. Feature distribution for watching TV.
Electronics 15 01351 g005
Figure 6. Feature distribution for board work.
Electronics 15 01351 g006
Figure 7. Feature distribution for ascending stairs.
Electronics 15 01351 g007
Figure 8. Feature distribution for descending stairs.
Electronics 15 01351 g008
Figure 9. Feature distribution for rope jumping.
Electronics 15 01351 g009
Figure 10. Feature distribution for palm pushing.
Electronics 15 01351 g010
Figure 11. Feature distribution for dynamic handclap.
Electronics 15 01351 g011
Figure 12. Feature distribution for jumping jacks.
Electronics 15 01351 g012
Figure 13. Feature distribution for slalom running.
Electronics 15 01351 g013
Figure 14. Feature distribution for running.
Electronics 15 01351 g014
Figure 15. Feature distribution for emergency-level movements.
Electronics 15 01351 g015
Figure 16. Mean SVM feature values extracted from the activities in the Dyn-Intensity and PAMAP2 datasets.
Electronics 15 01351 g016
Figure 17. Standard deviation of the SVM feature observed across the activities in the Dyn-Intensity and PAMAP2 datasets.
Electronics 15 01351 g017
Figure 18. Mean Δ SVM feature values computed for the activities in the Dyn-Intensity and PAMAP2 datasets.
Electronics 15 01351 g018
Figure 19. Standard deviation of the Δ SVM feature across the activities in the Dyn-Intensity and PAMAP2 datasets.
Electronics 15 01351 g019
Figure 20. Comparison of feature distributions between the PAMAP2 and self-collected datasets.The static activity (lying) shows nearly identical distributions across all four features, validating its integration into a unified class. In contrast, the dynamic activity (running) exhibits noticeable differences, likely reflecting individual variability in movement intensity and sensor placement. (a) Static activity, lying: Similar distributions across datasets, consolidated into one category. (b) Dynamic activity, running: Distinct distributions observed, only self-collected data used.
Electronics 15 01351 g020
Figure 21. Examples of the experimental environment and activities performed. (a) Running; (b) dynamic handclap; (c) palm pushing.
Electronics 15 01351 g021
Figure 22. Confusion matrix of the MLP classifier model on the test set (activity intensity Levels 1–5). The color intensity represents the normalized value, where darker shades indicate a higher classification frequency.
Electronics 15 01351 g022
Figure 23. Confusion matrix of the Logistic Regression model on the test set (activity intensity Levels 1–5). The color intensity represents the normalized value, where darker shades indicate a higher classification frequency.
Electronics 15 01351 g023
Figure 24. Confusion matrix of the Linear Regression model on the test set (activity intensity Levels 1–5). The color intensity represents the normalized value, where darker shades indicate a higher classification frequency.
Electronics 15 01351 g024
Figure 25. Confusion matrix of the MLP regression model on the test set (activity intensity Levels 1–5). The color intensity represents the normalized value, where darker shades indicate a higher classification frequency.
Electronics 15 01351 g025
Table 1. Descriptions of activities included in the Dyn-Intensity dataset.
ActivityDescription
LyingLying quietly while doing nothing; small posture changes are allowed.
SittingSitting in a chair in a comfortable position; posture changes are allowed.
Watching TVWatching television in a relaxed posture (sitting or lying).
Board workStanding in front of a whiteboard and writing or erasing text; involves moderate forward–backward arm swings.
Palm pushingPushing forward repeatedly with both palms to simulate resistance or self-defense motion; involves abrupt upper-body acceleration.
Dynamic handclapClapping hands rapidly with large arm movements; produces strong upper-body motion.
Jumping jacksPerforming full-body jumping movements, spreading and closing arms and legs simultaneously.
RunningSprinting for short distances at maximum speed; generates intense whole-body acceleration and impact.
Slalom runningSprinting in a zig-zag pattern between cones or markers; requires rapid direction changes at high speed.
Rope jumpingJumping rope using basic or alternate-foot jumps.
Ascending stairsWalking upstairs between the ground and top floors (five floors total).
Descending stairsWalking downstairs between the ground and top floors (five floors total).
User_level5Performing extreme resistance or escape-like motion under simulated threat; includes rapid arm swings, pushing, and evasive body movements to represent intense struggle.
Table 2. Descriptions of PAMAP2 activities used in this study.
ActivityDescription
LyingLying quietly while doing nothing; small posture changes are allowed.
SittingSitting in a chair in a comfortable position; posture changes are allowed.
StandingStanding still or while talking, possibly with gestures.
Watching TVWatching television in a relaxed posture (sitting or lying).
Computer workPerforming normal office-related computer tasks.
Car drivingDriving between the office and home.
IroningIroning one or two shirts or T-shirts.
Folding laundryFolding shirts, T-shirts, and bed linens.
Vacuum cleaningCleaning one or two office rooms, including moving chairs or light furniture.
CyclingCycling outdoors at a slow to moderate pace, similar to commuting or leisure biking.
WalkingWalking outdoors at a moderate to brisk pace (4–6 km/h), comfortable for the subject.
Table 3. Five-level intensity mapping of 21 integrated activities constructed from the PAMAP2 and Dyn-Intensity datasets.
LevelDescriptionActivity Classes
Level 1Static (P + D)lying, sitting, standing, watching TV, computer work, car driving
Level 2Low-intensity daily (P + D)walking, ironing, folding laundry, vacuum cleaning, board work, ascending stairs, descending stairs
Level 3Moderate intensity (P + D)cycling, rope jumping
Level 4High intensity (D)palm pushing, dynamic handclap
Level 5Vigorous/emergency-like (D)jumping jacks, running, slalom running, user_level5 (emergency-like vigorous motions)
P = PAMAP2 dataset; D = Dyn-Intensity dataset. Overlapping static activities were merged.
Table 4. Summary of the implemented models and their main configurations.
ApproachModelKey CharacteristicsScalerLoss/Objective
Non-MLP Approaches
Linear RegressionSecond-order polynomial features (interaction only); threshold optimization via validation grid search.RobustScalerMSE/QWK
maximization
Logistic RegressionMultinomial Logistic Regression; polynomial features (interaction only).StandardScalerCross-entropy
MLP Approaches
MLP (Regression)Four hidden layers (256–128–64–16); ReLU activation, batch normalization, dropout (0.2–0.3).Min–MaxHuber ( δ = 3.0 )
MLP (Classification)Three hidden layers (256–128–64); ReLU activation (tanh for last layer), batch normalization, dropout (0.2); softmax output.StandardScalerCross-entropy
Table 5. Performance comparison of regression-based models (non-MLP vs. MLP).
ModelMSEMAE R 2 QWK
Linear Regression0.1890.3330.874 0.933 ± 0.004
MLP Regressor0.0750.1510.95 0.969 ± 0.003
Table 6. Performance comparison of classification-based models (non-MLP vs. MLP).
ModelAccuracyPrecisionRecallF1QWK
Logistic Regression 0.931 ± 0.007 0.9170.9240.92 0.968 ± 0.004
MLP Classifier 0.939 ± 0.006 0.940.9430.941 0.971 ± 0.003
Table 7. Per-class performance of the MLP classifier across the five activity intensity levels.
LevelPrecisionRecallF1-ScoreSupport
10.95990.94230.9511763
20.90400.92530.9146509
30.92700.92030.9236138
40.95510.96590.9605176
50.95240.96150.9569104
Table 8. Feature contribution ratios based on the absolute magnitude of model coefficients.
Feature GroupLinear RegressionLogistic Regression
SVM-based features0.35530.3120
Δ SVM-based features0.64470.6880
Table 9. Permutation importance of representative features in the Logistic Regression model.
FeatureAccuracy Decrease
Mean of Δ SVM0.4767
Mean of SVM0.1312
Table 10. On-device inference performance of the MLP classifier deployed in its quantized TFLite form on the Galaxy Watch 7. The table reports inference latency (p50, p90, p99), peak memory usage, and model size under the default XNNPACK CPU delegate.
Configurationp50 (ms)p90 (ms)p99 (ms)Peak Memory (MB)Model Size (MB)
XNNPACK (default)0.0380.0730.22650.380.088
Table 11. Performance comparison between the original test set and real-time subject-independent validation (MLP classifier). Unseen participants performed representative activities across all five intensity levels.
Evaluation SettingAccuracyQWK
Original Test Set0.9390.971
Real-Time Unseen Subjects0.9520.988
Table 12. End-to-end (decision) latency of the non-MLP classification pipeline on the Galaxy Watch 7. This table reports the total latency including the fixed 6 s processing window, thus focusing on overall pipeline delay rather than resource consumption.
ScenarioE2E (p50, ms)E2E (p90, ms)E2E (p99, ms)
Real-time monitoring6014.56020.36070.0
Disclaimer/Publisher’s Note: The statements, opinions and data contained in all publications are solely those of the individual author(s) and contributor(s) and not of MDPI and/or the editor(s). MDPI and/or the editor(s) disclaim responsibility for any injury to people or property resulting from any ideas, methods, instructions or products referred to in the content.