Figure 1.
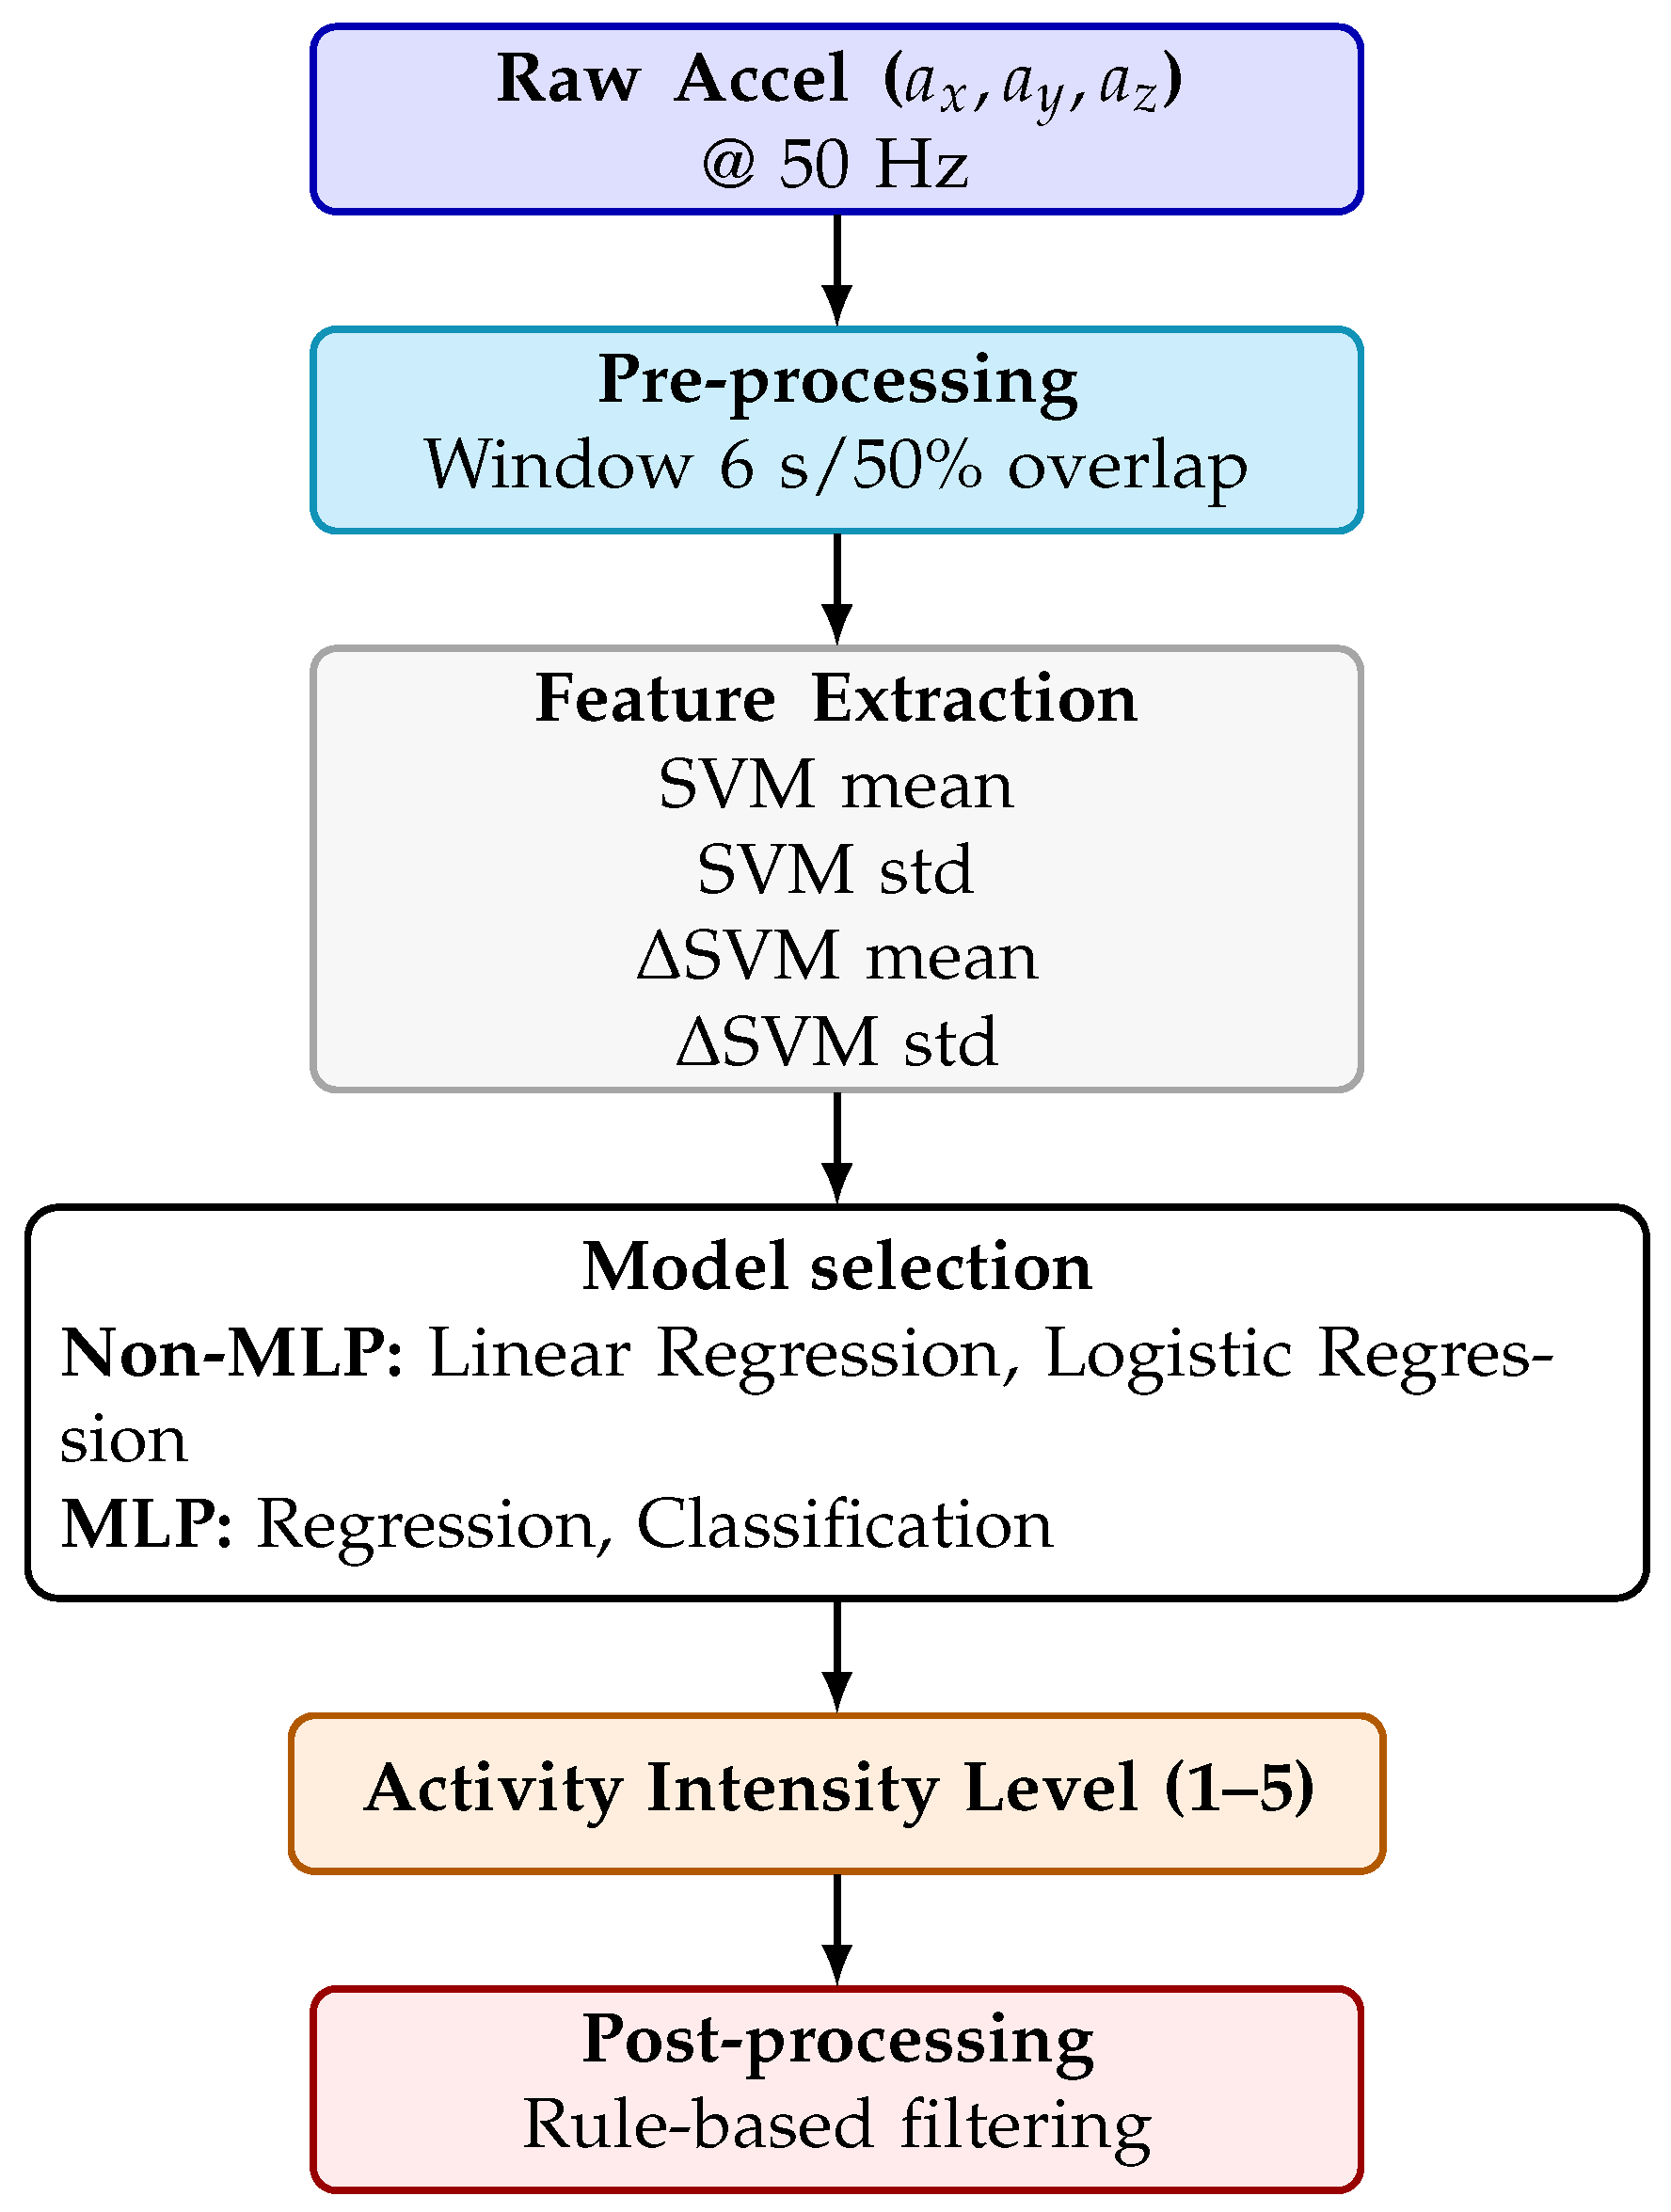
Compressed system pipeline for on-device multi-level activity intensity recognition.
Figure 1.
Compressed system pipeline for on-device multi-level activity intensity recognition.
Figure 2.
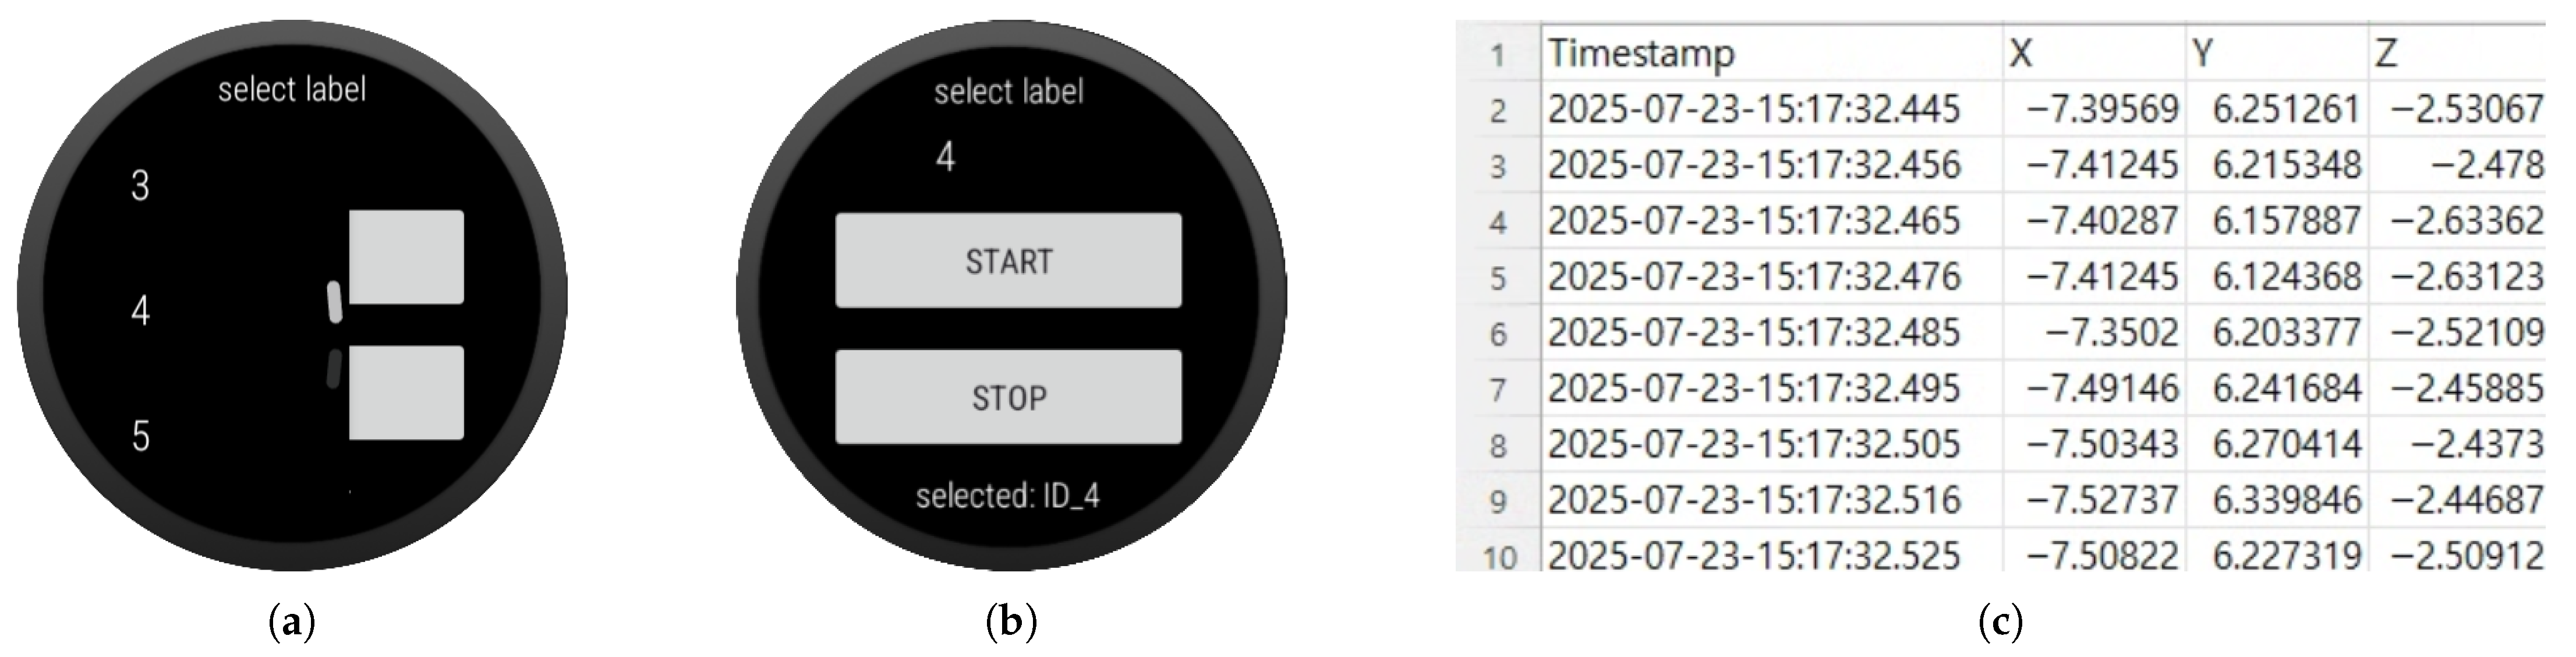
On-watch labeling and logging during data acquisition. (a) On-watch label selection; (b) start/stop control; (c) sample CSV log ().
Figure 2.
On-watch labeling and logging during data acquisition. (a) On-watch label selection; (b) start/stop control; (c) sample CSV log ().
Figure 3.
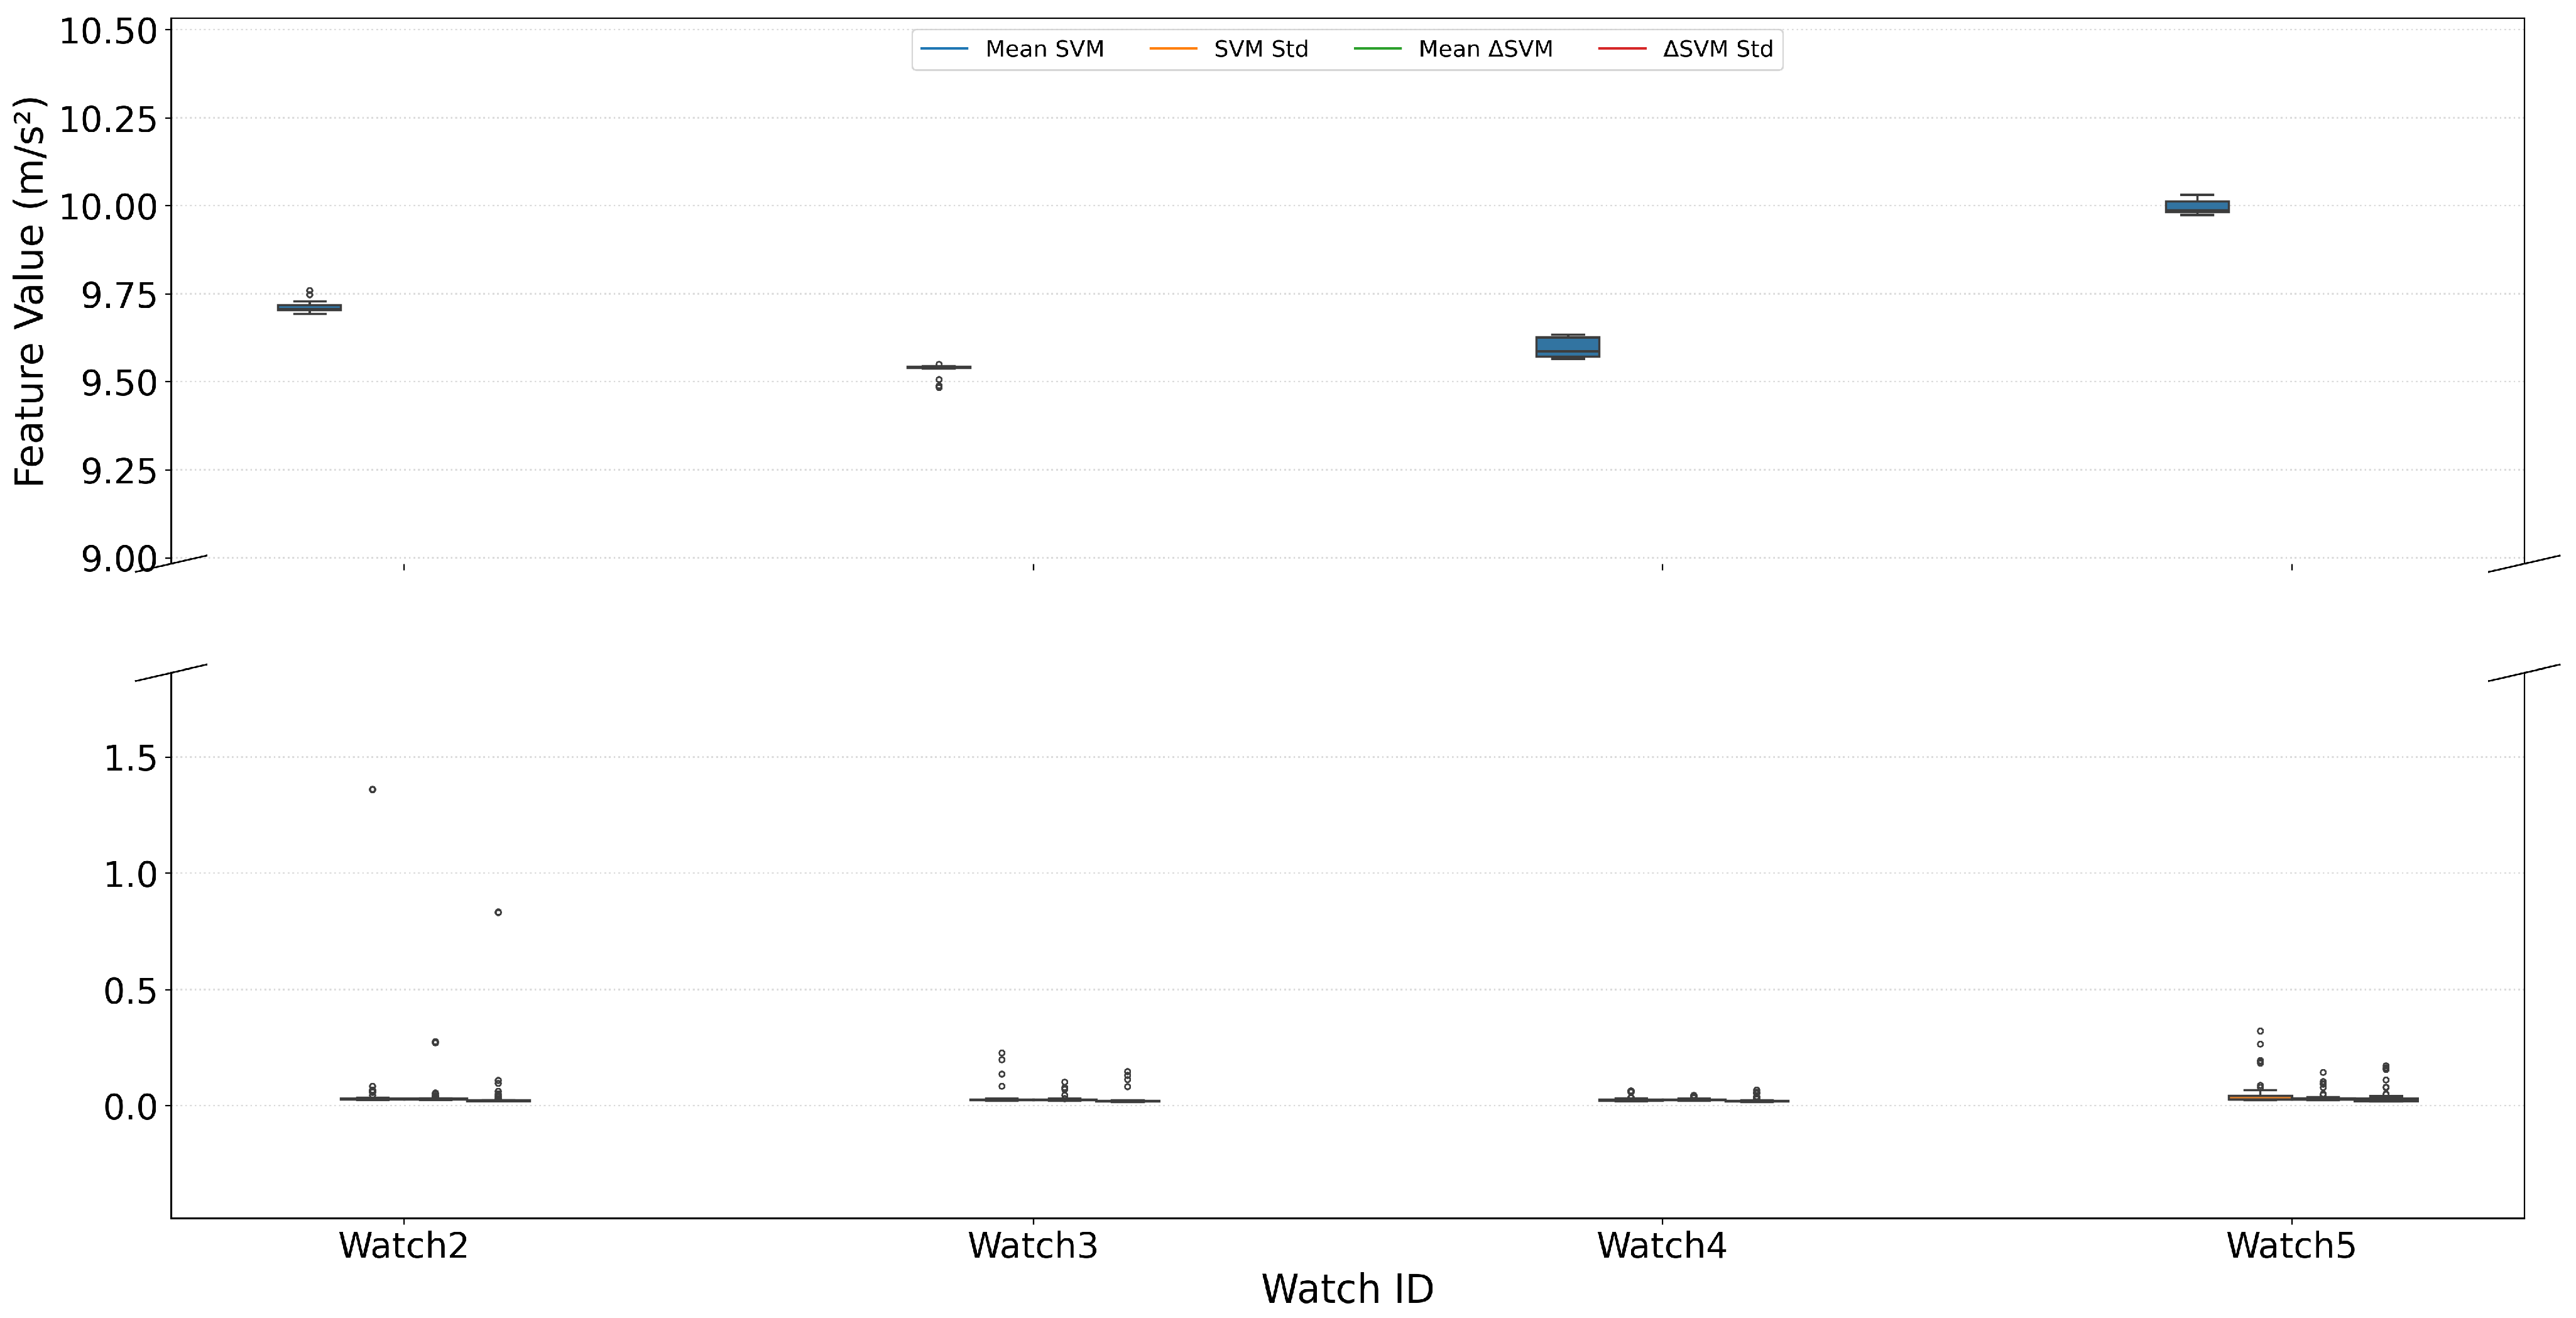
Feature distribution for lying.
Figure 3.
Feature distribution for lying.
Figure 4.
Feature distribution for sitting.
Figure 4.
Feature distribution for sitting.
Figure 5.
Feature distribution for watching TV.
Figure 5.
Feature distribution for watching TV.
Figure 6.
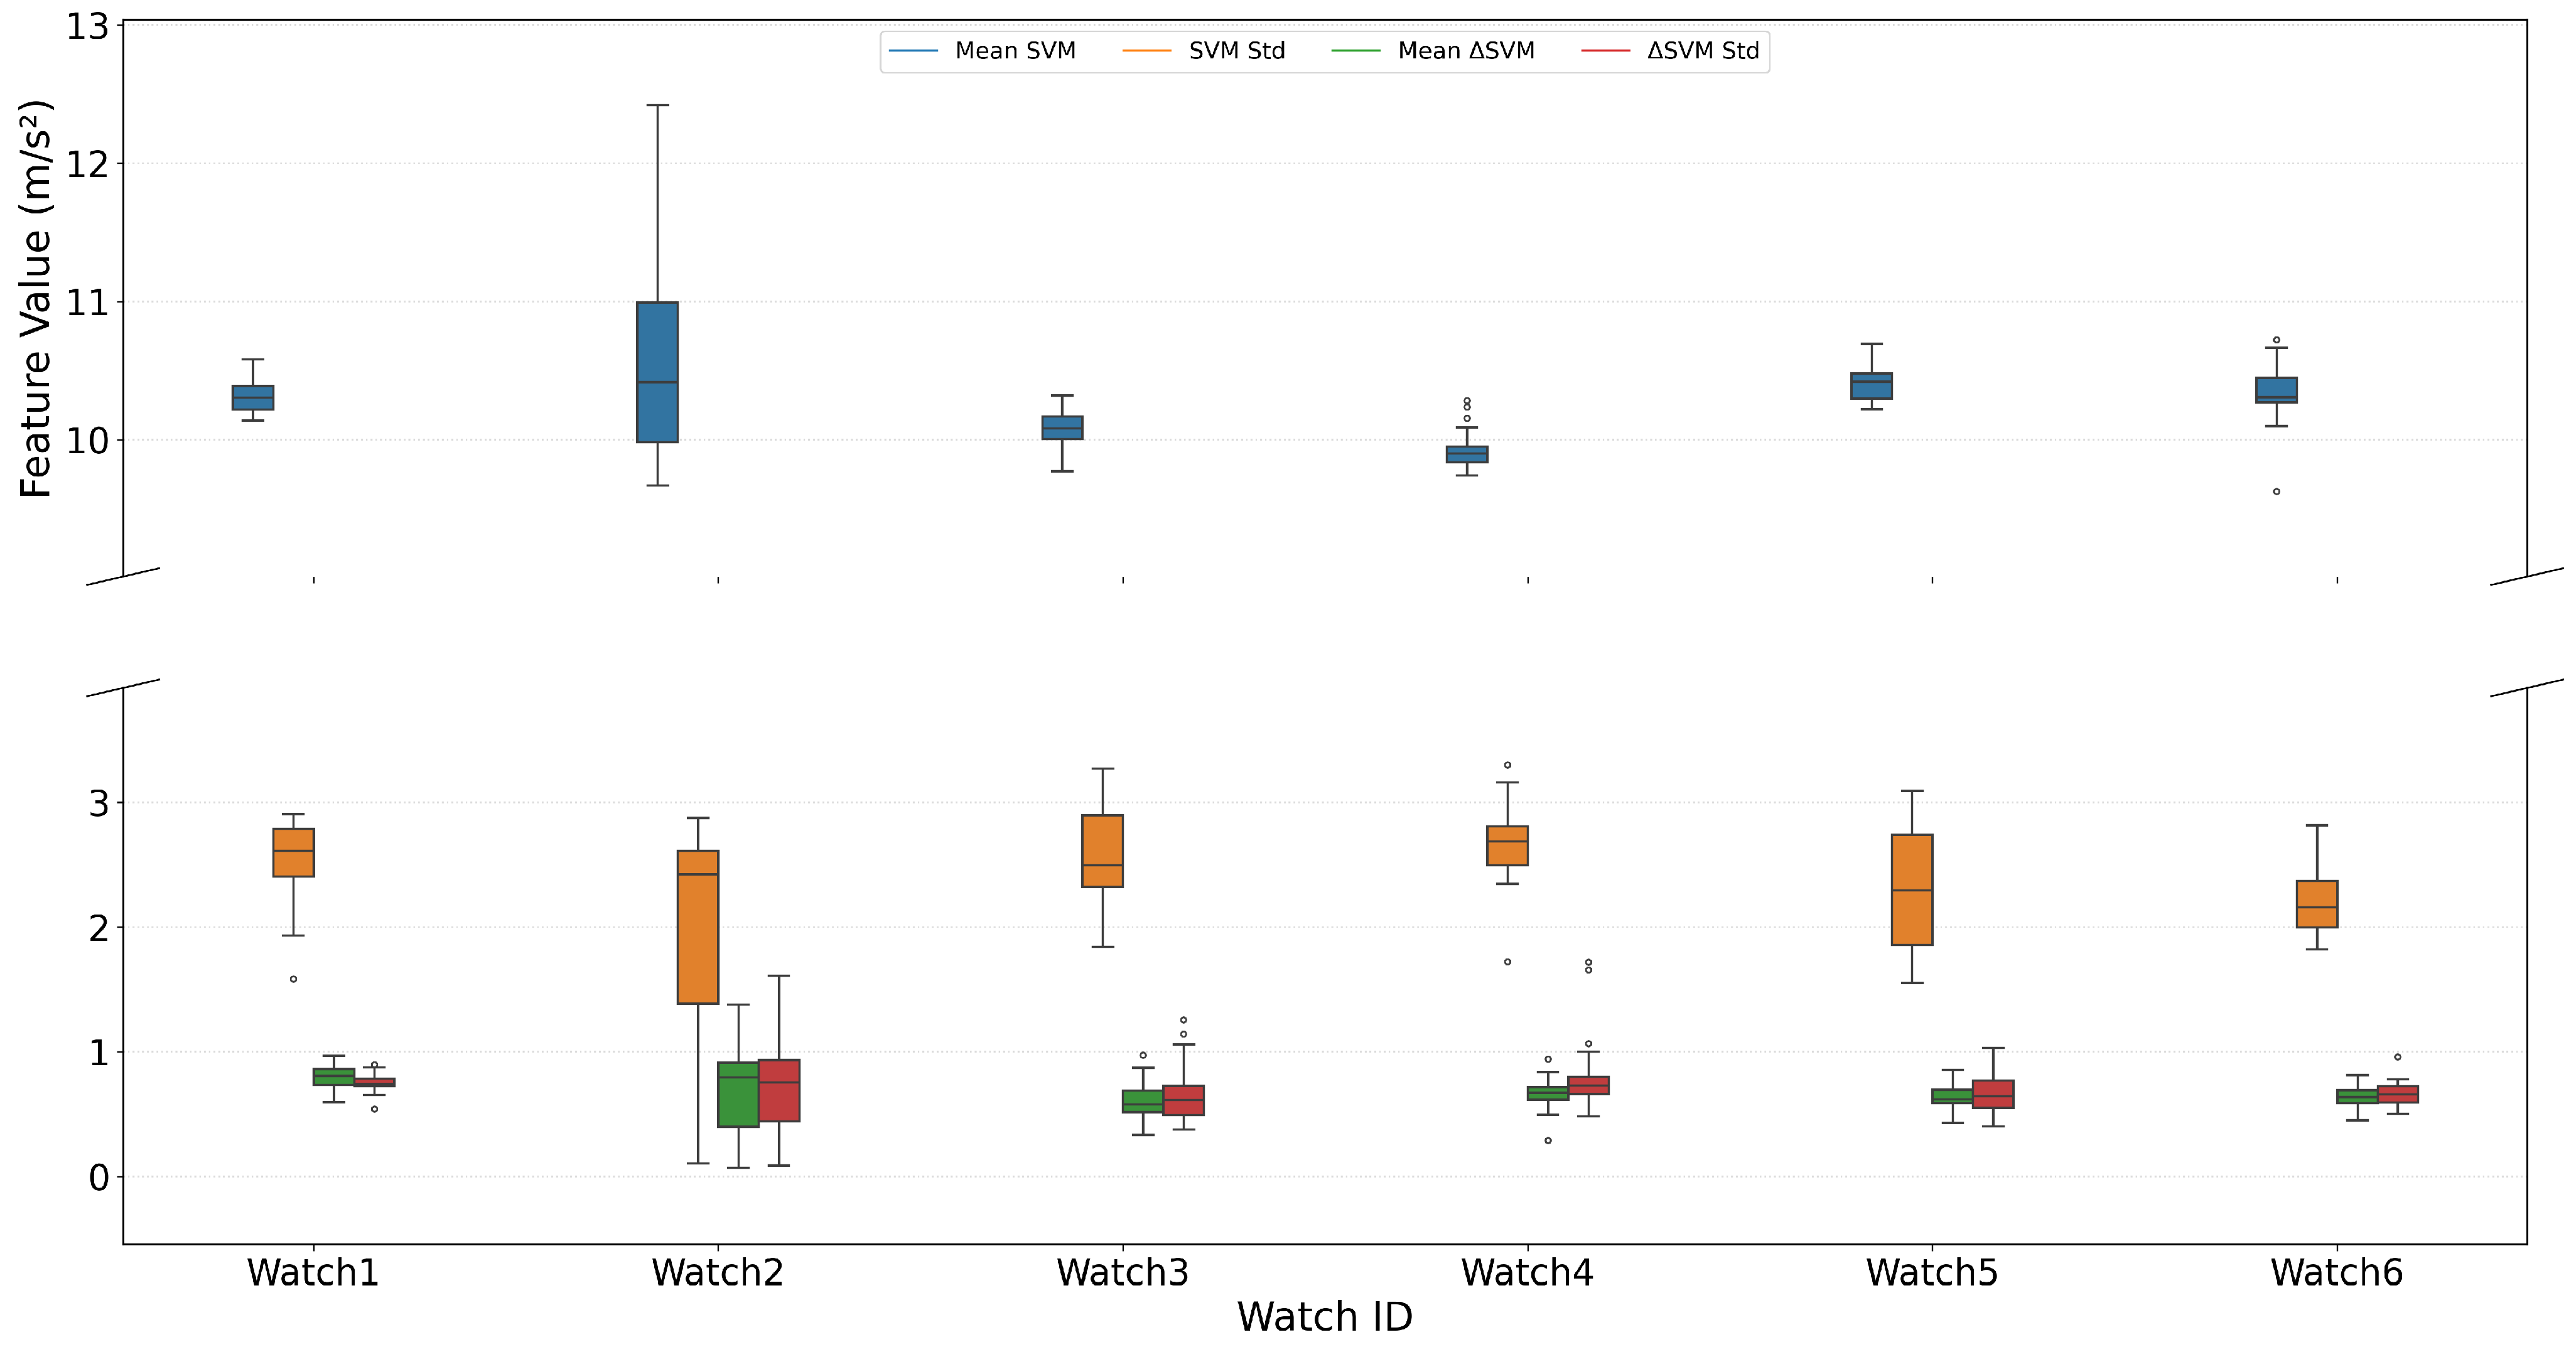
Feature distribution for board work.
Figure 6.
Feature distribution for board work.
Figure 7.
Feature distribution for ascending stairs.
Figure 7.
Feature distribution for ascending stairs.
Figure 8.
Feature distribution for descending stairs.
Figure 8.
Feature distribution for descending stairs.
Figure 9.
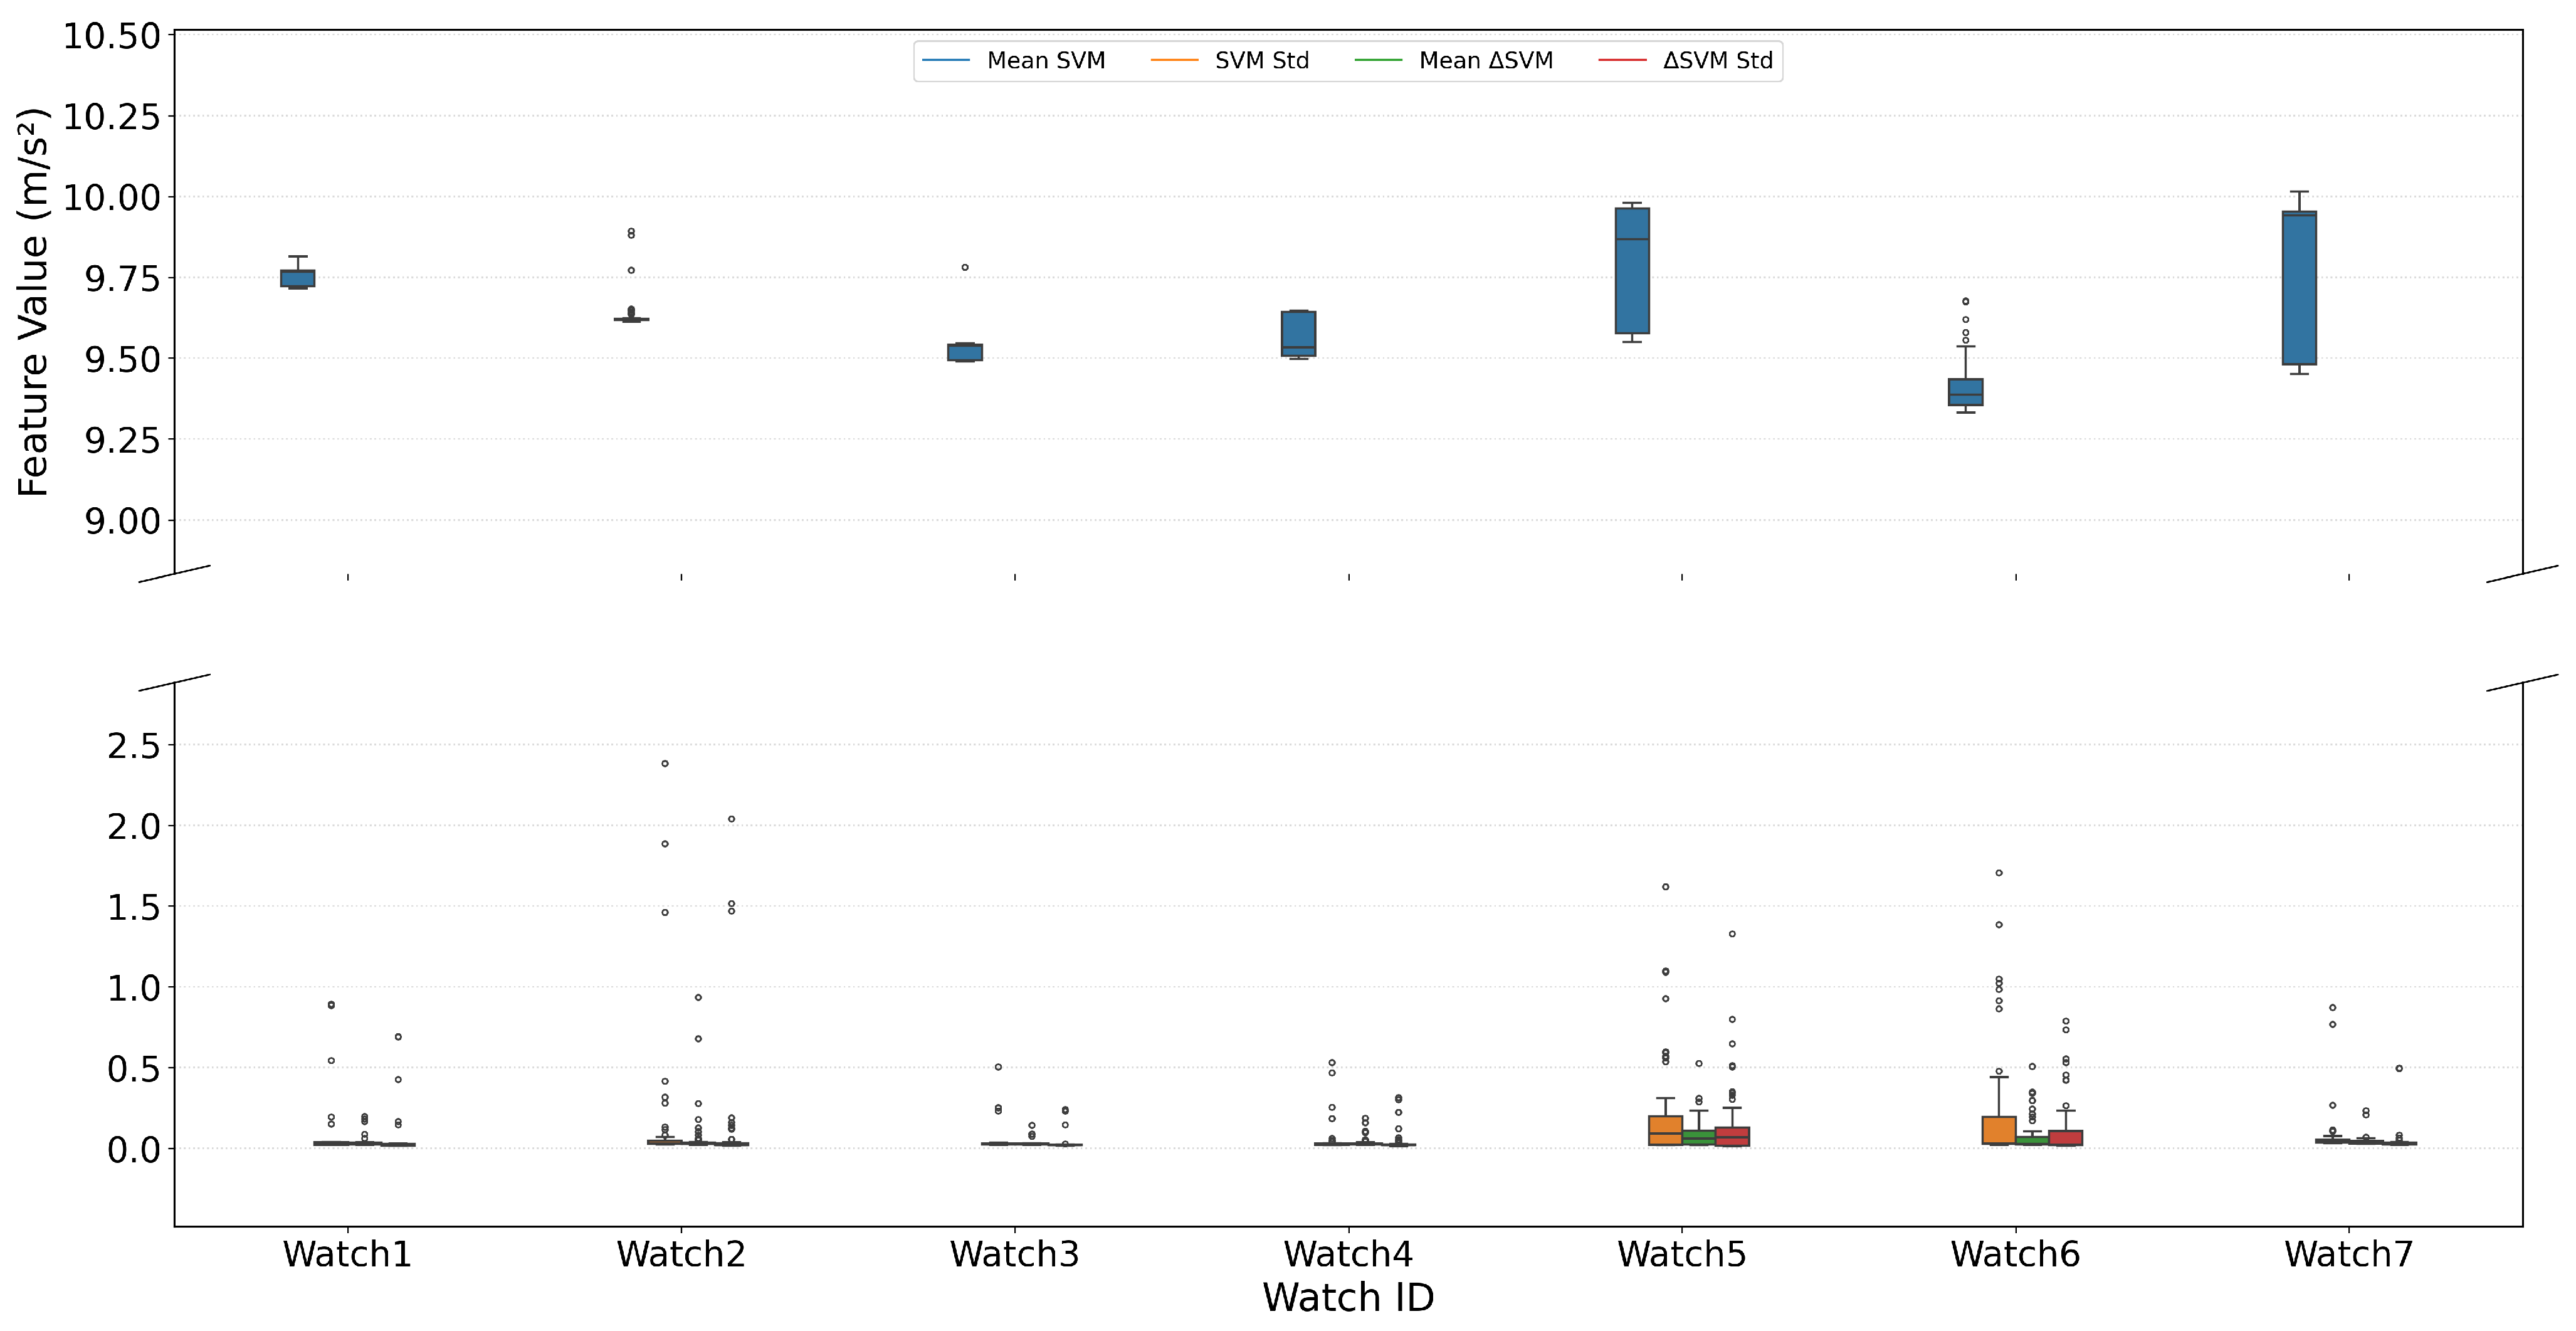
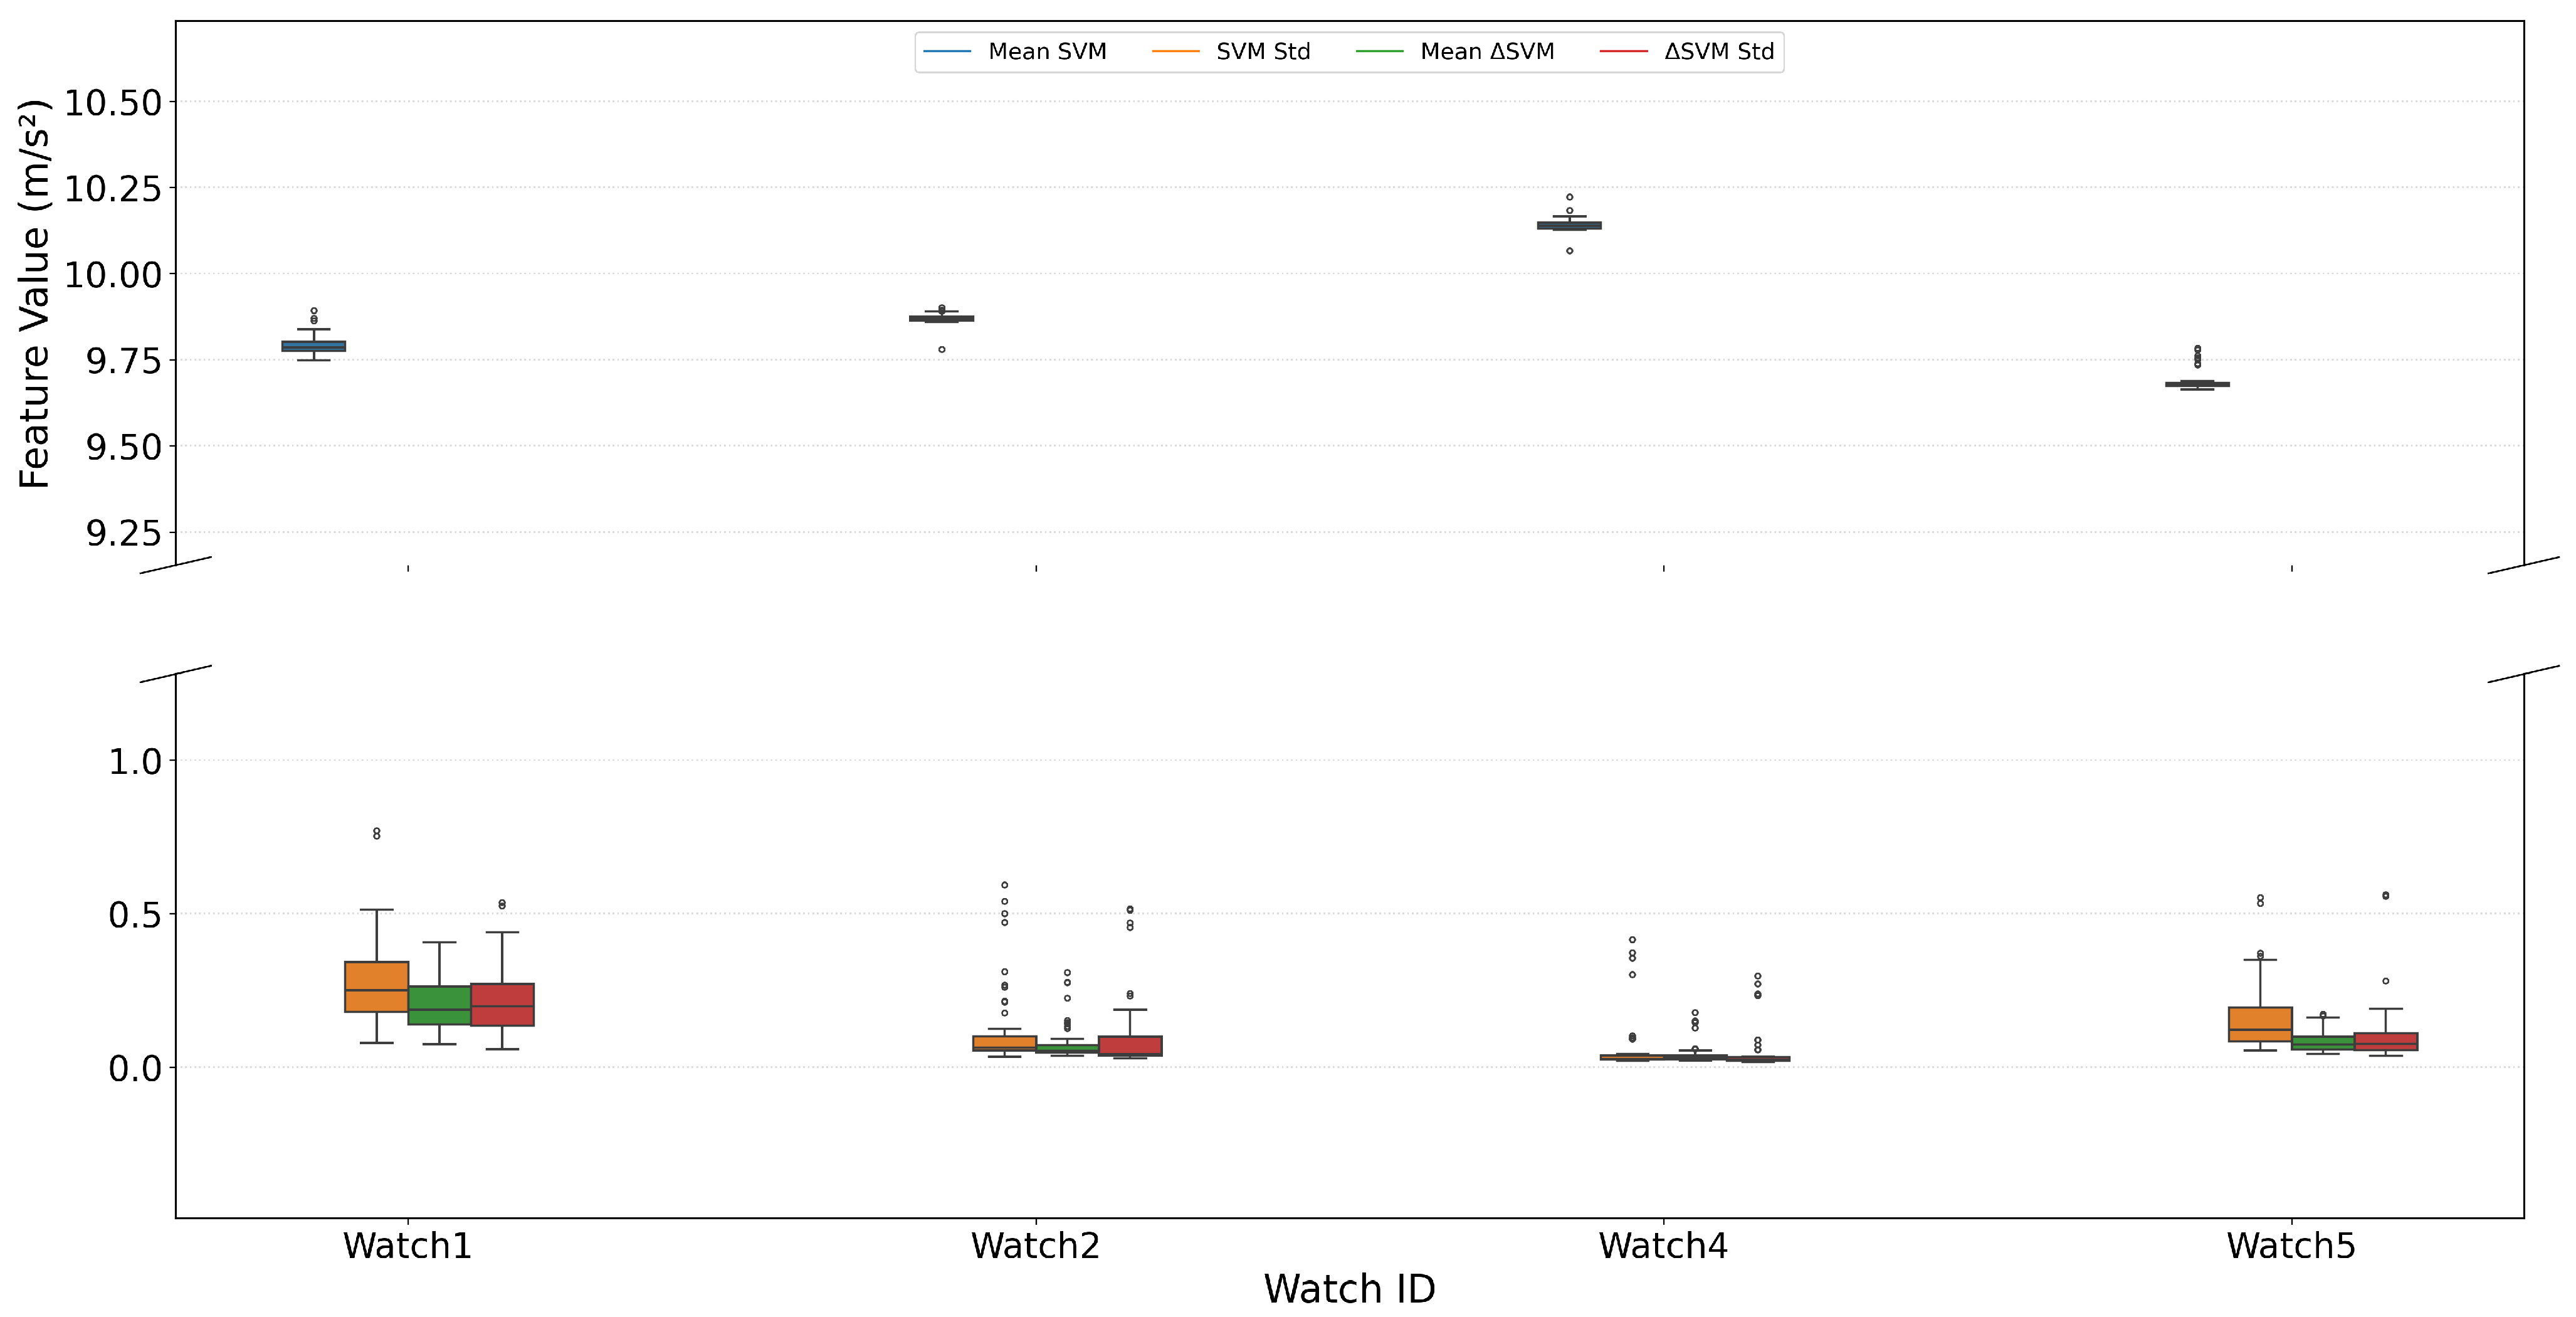
Feature distribution for rope jumping.
Figure 9.
Feature distribution for rope jumping.
Figure 10.
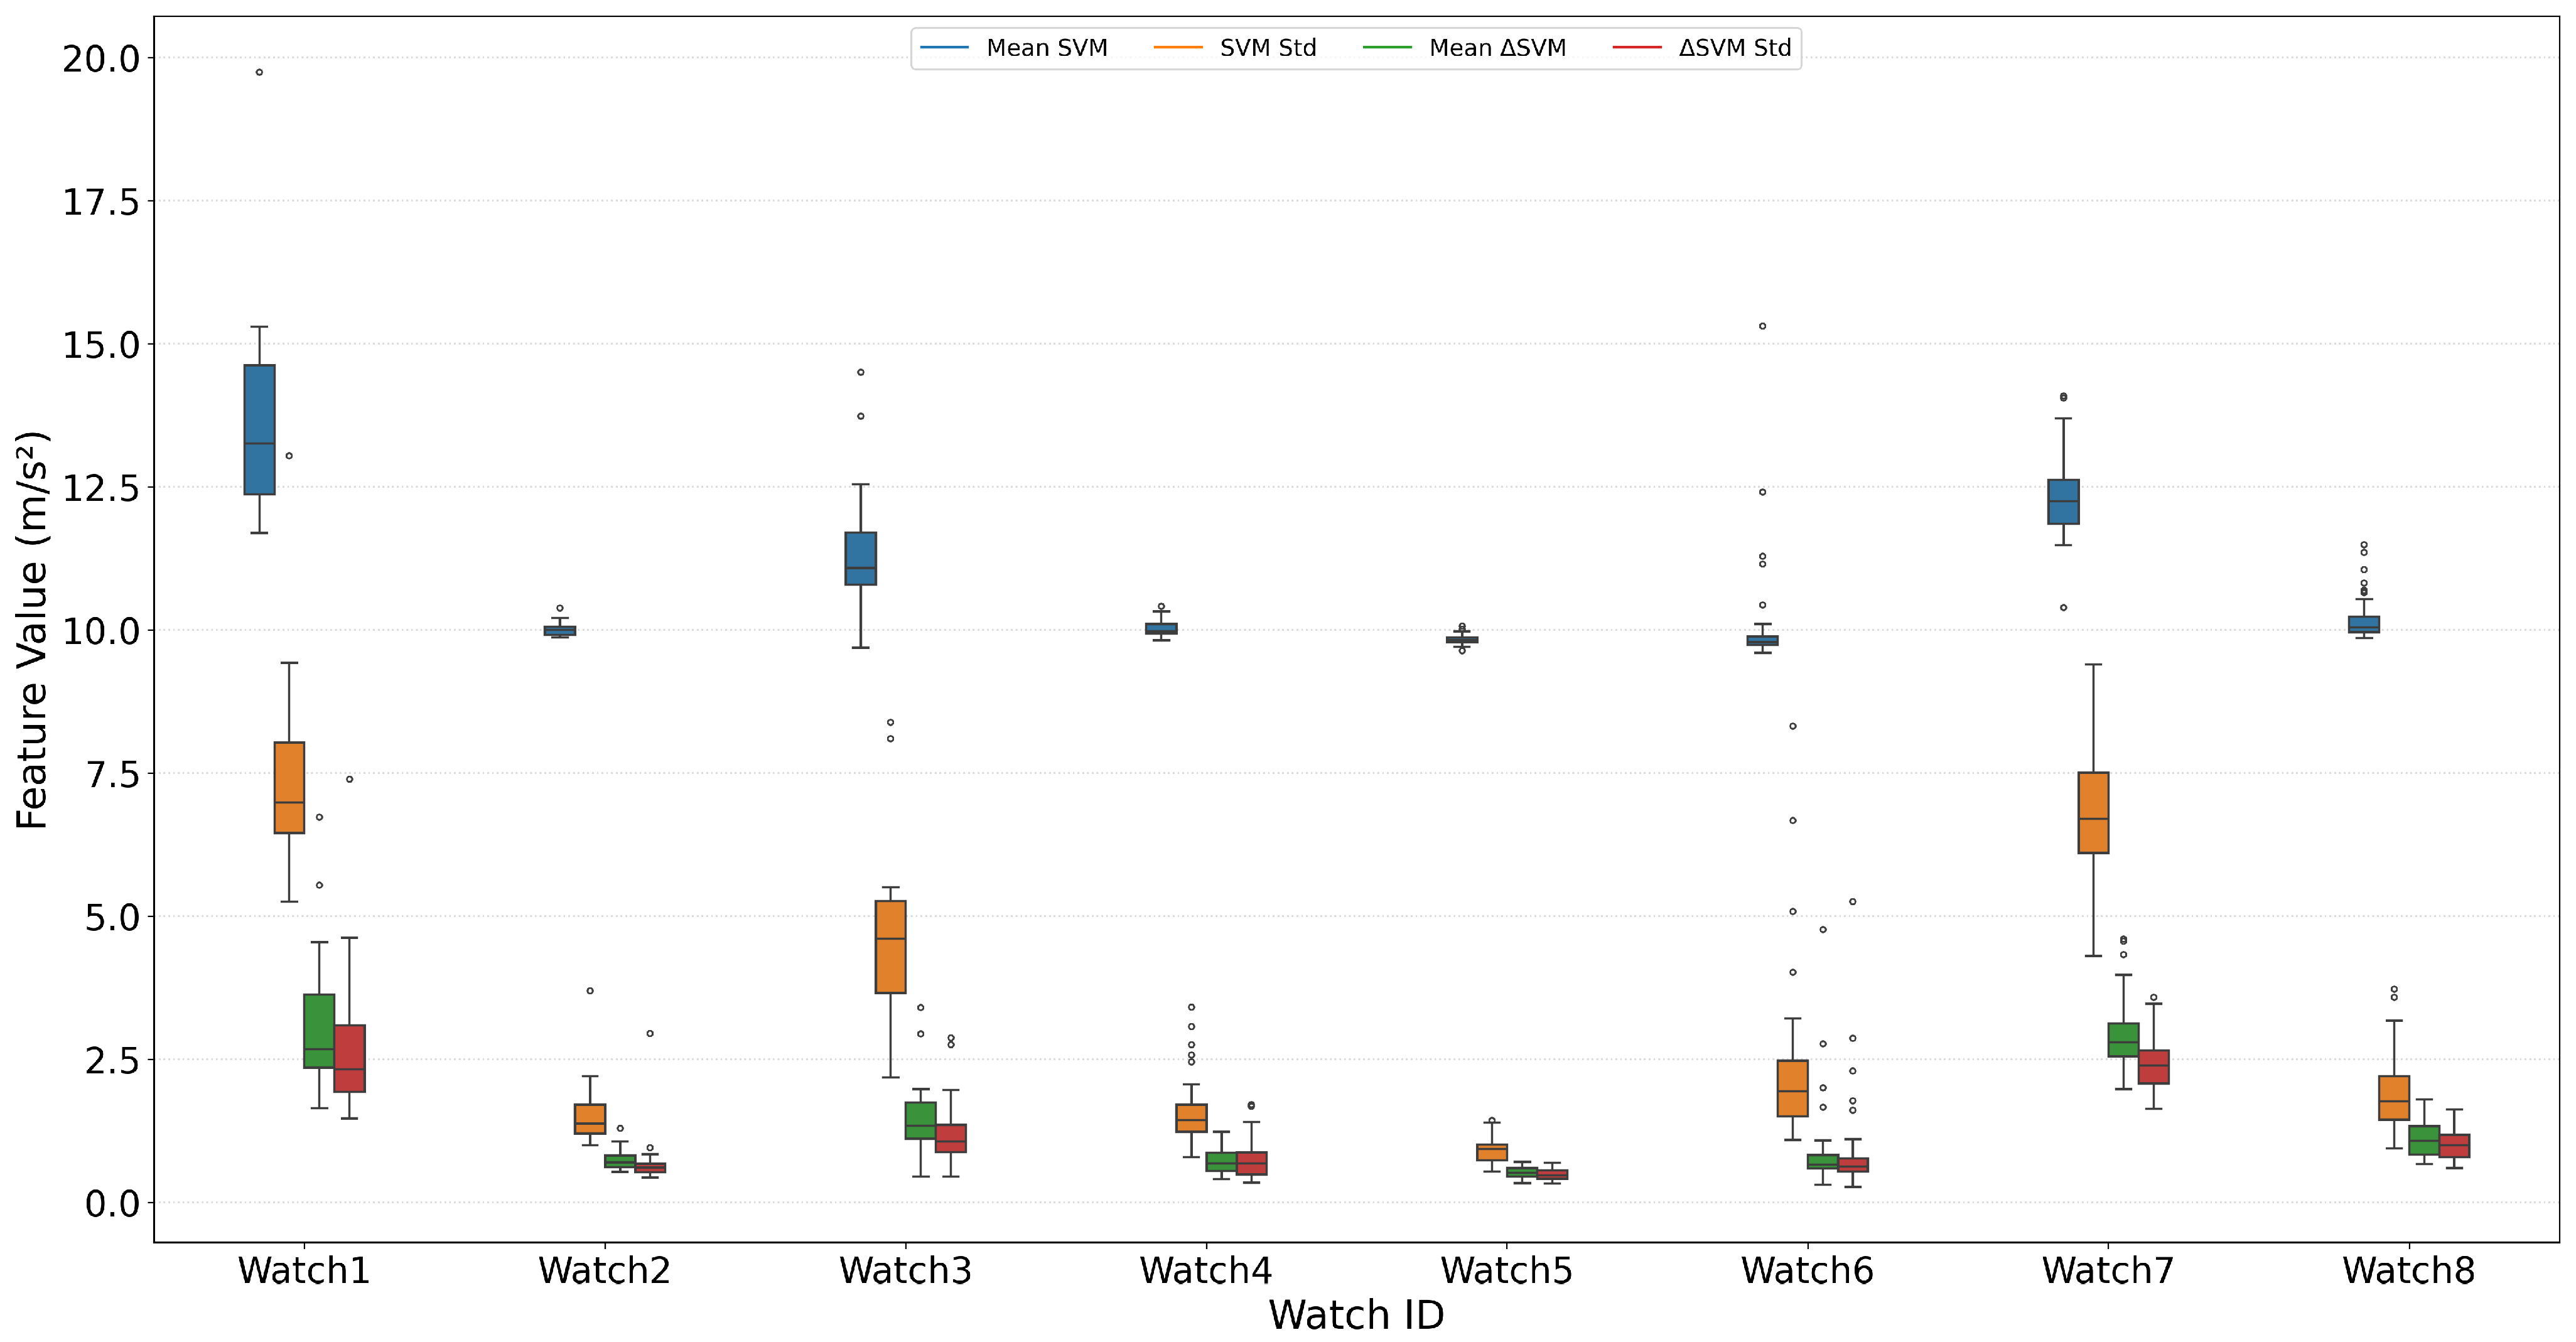
Feature distribution for palm pushing.
Figure 10.
Feature distribution for palm pushing.
Figure 11.
Feature distribution for dynamic handclap.
Figure 11.
Feature distribution for dynamic handclap.
Figure 12.
Feature distribution for jumping jacks.
Figure 12.
Feature distribution for jumping jacks.
Figure 13.
Feature distribution for slalom running.
Figure 13.
Feature distribution for slalom running.
Figure 14.
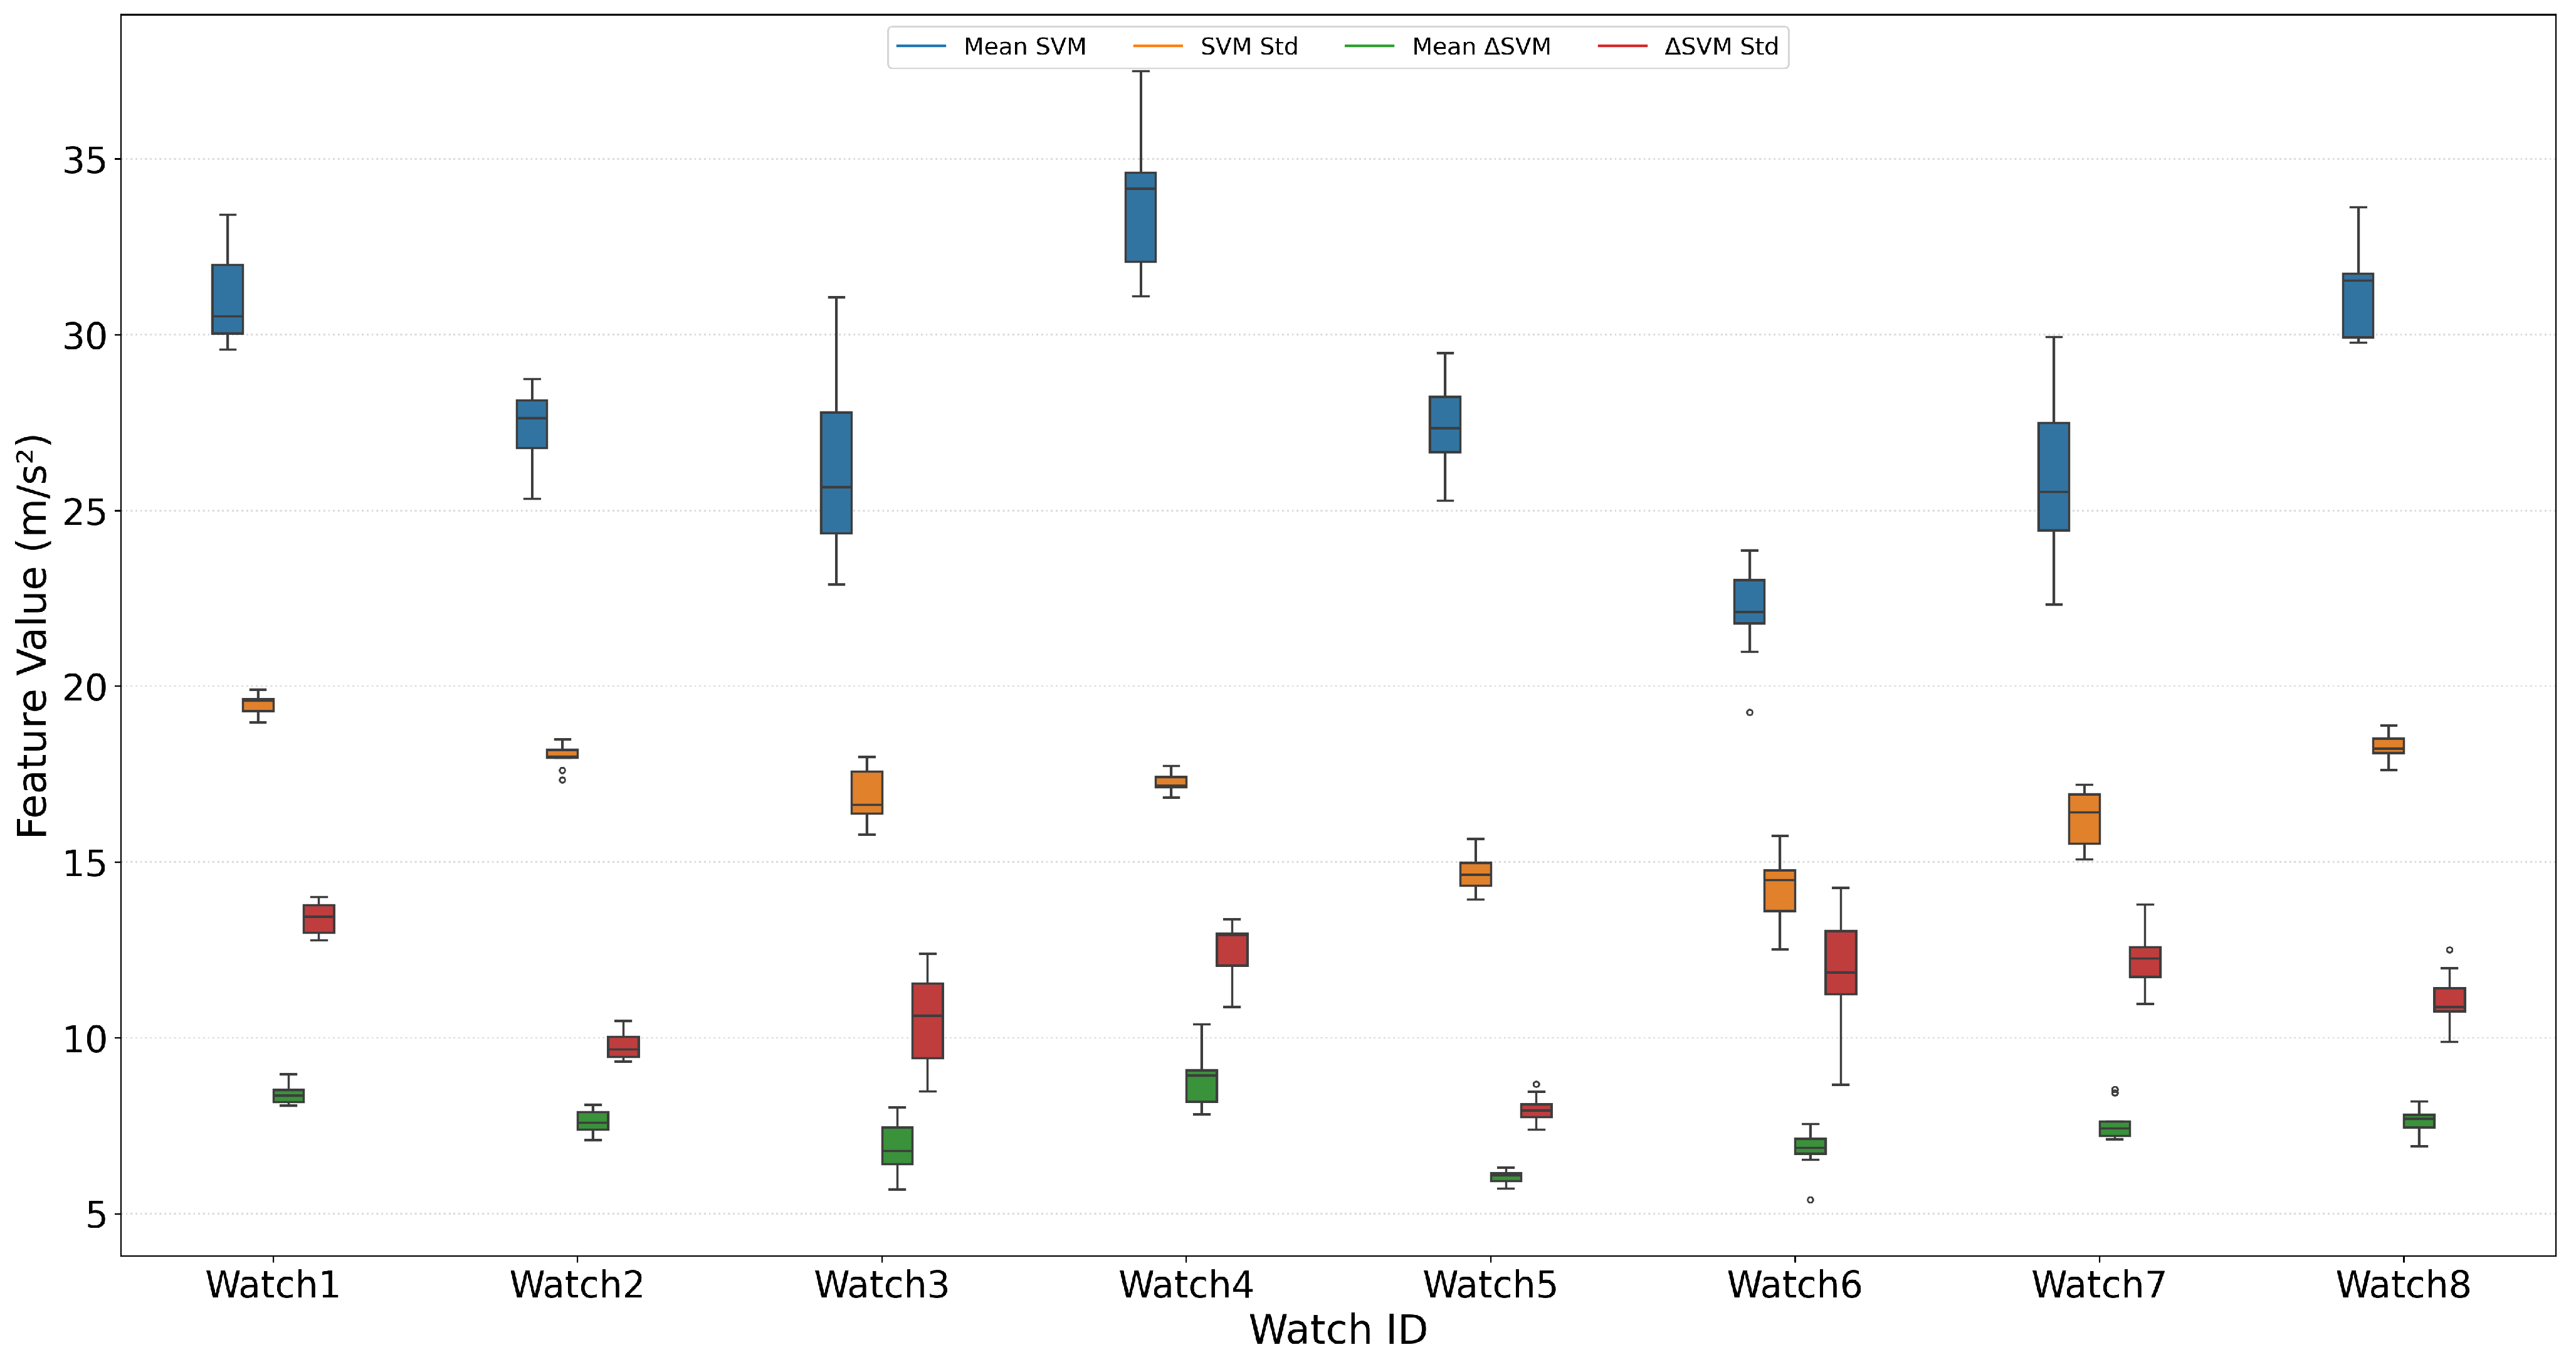
Feature distribution for running.
Figure 14.
Feature distribution for running.
Figure 15.
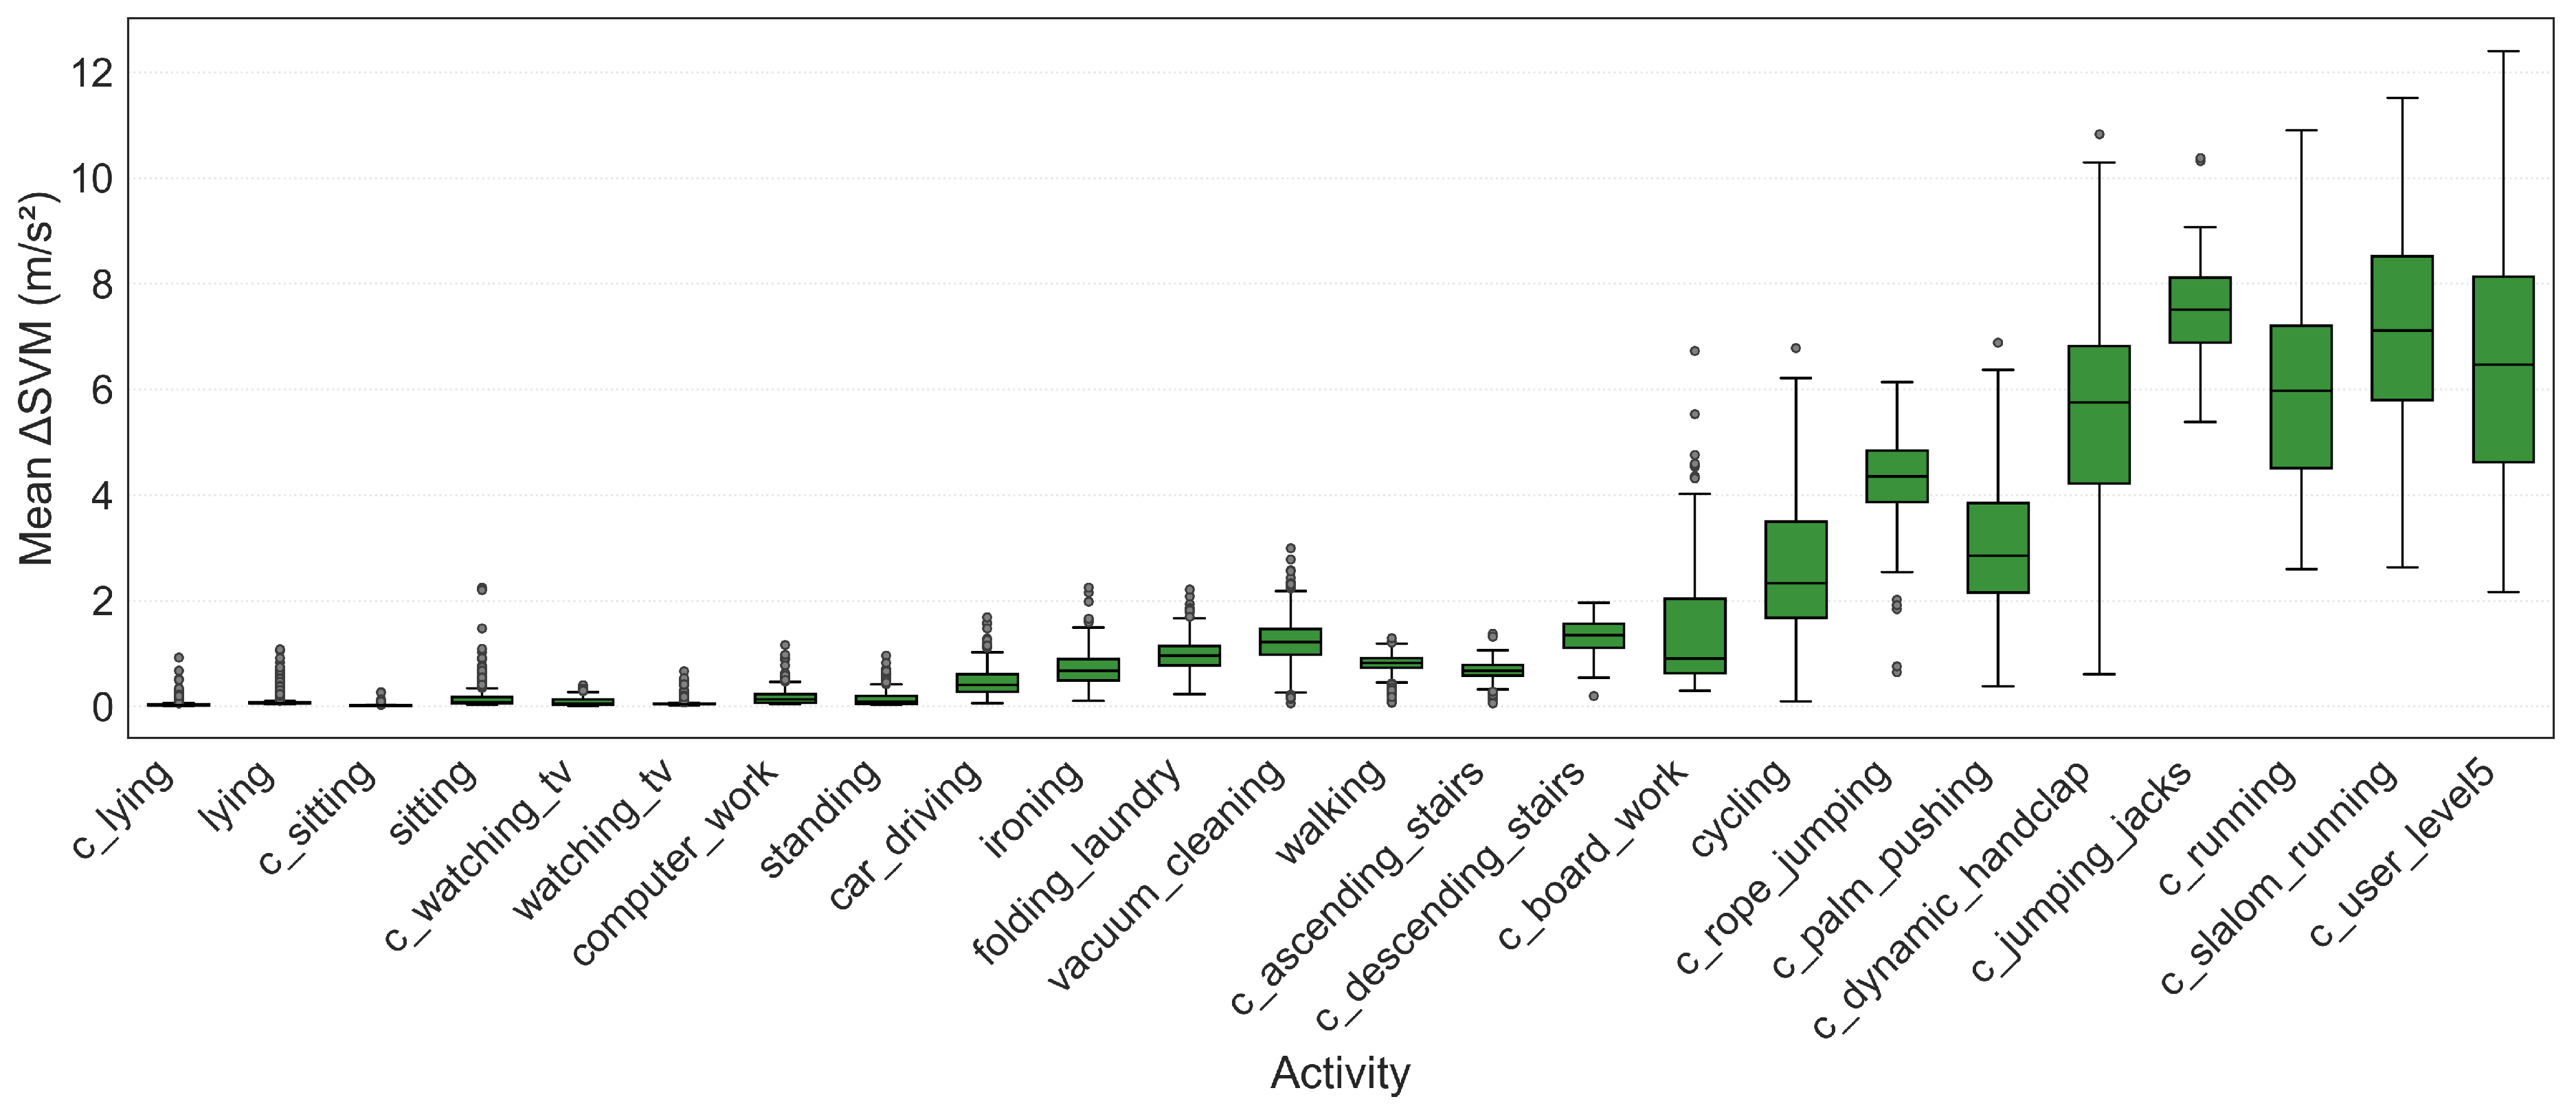
Feature distribution for emergency-level movements.
Figure 15.
Feature distribution for emergency-level movements.
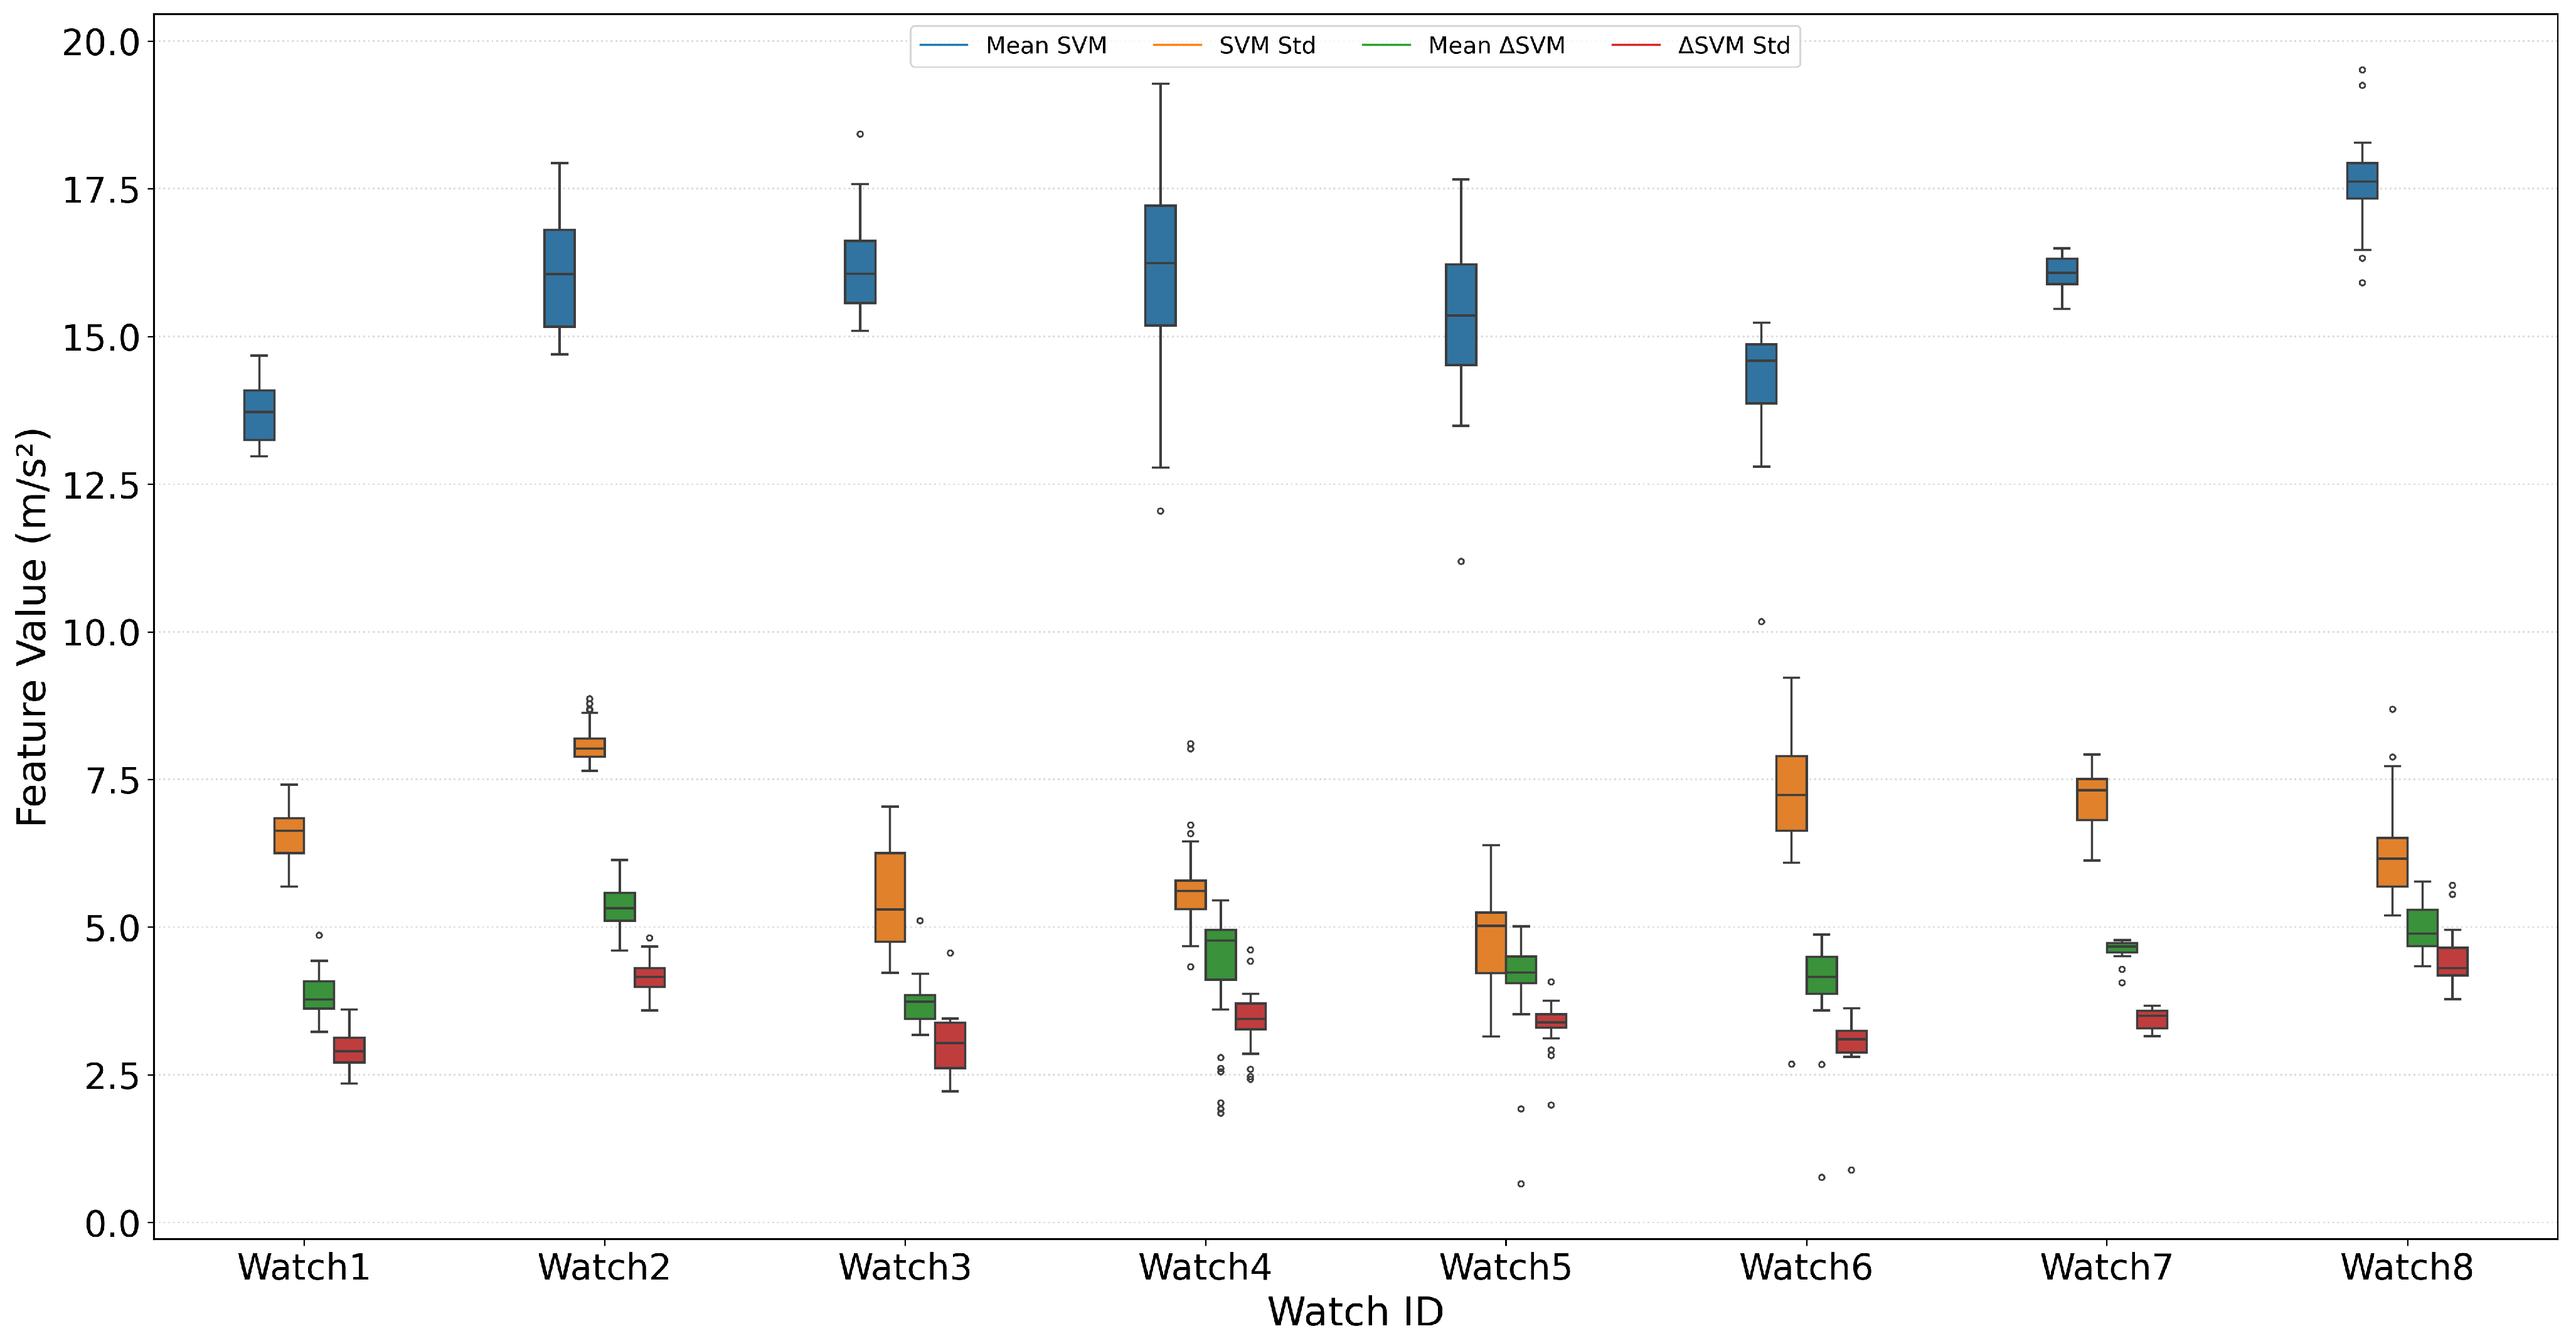
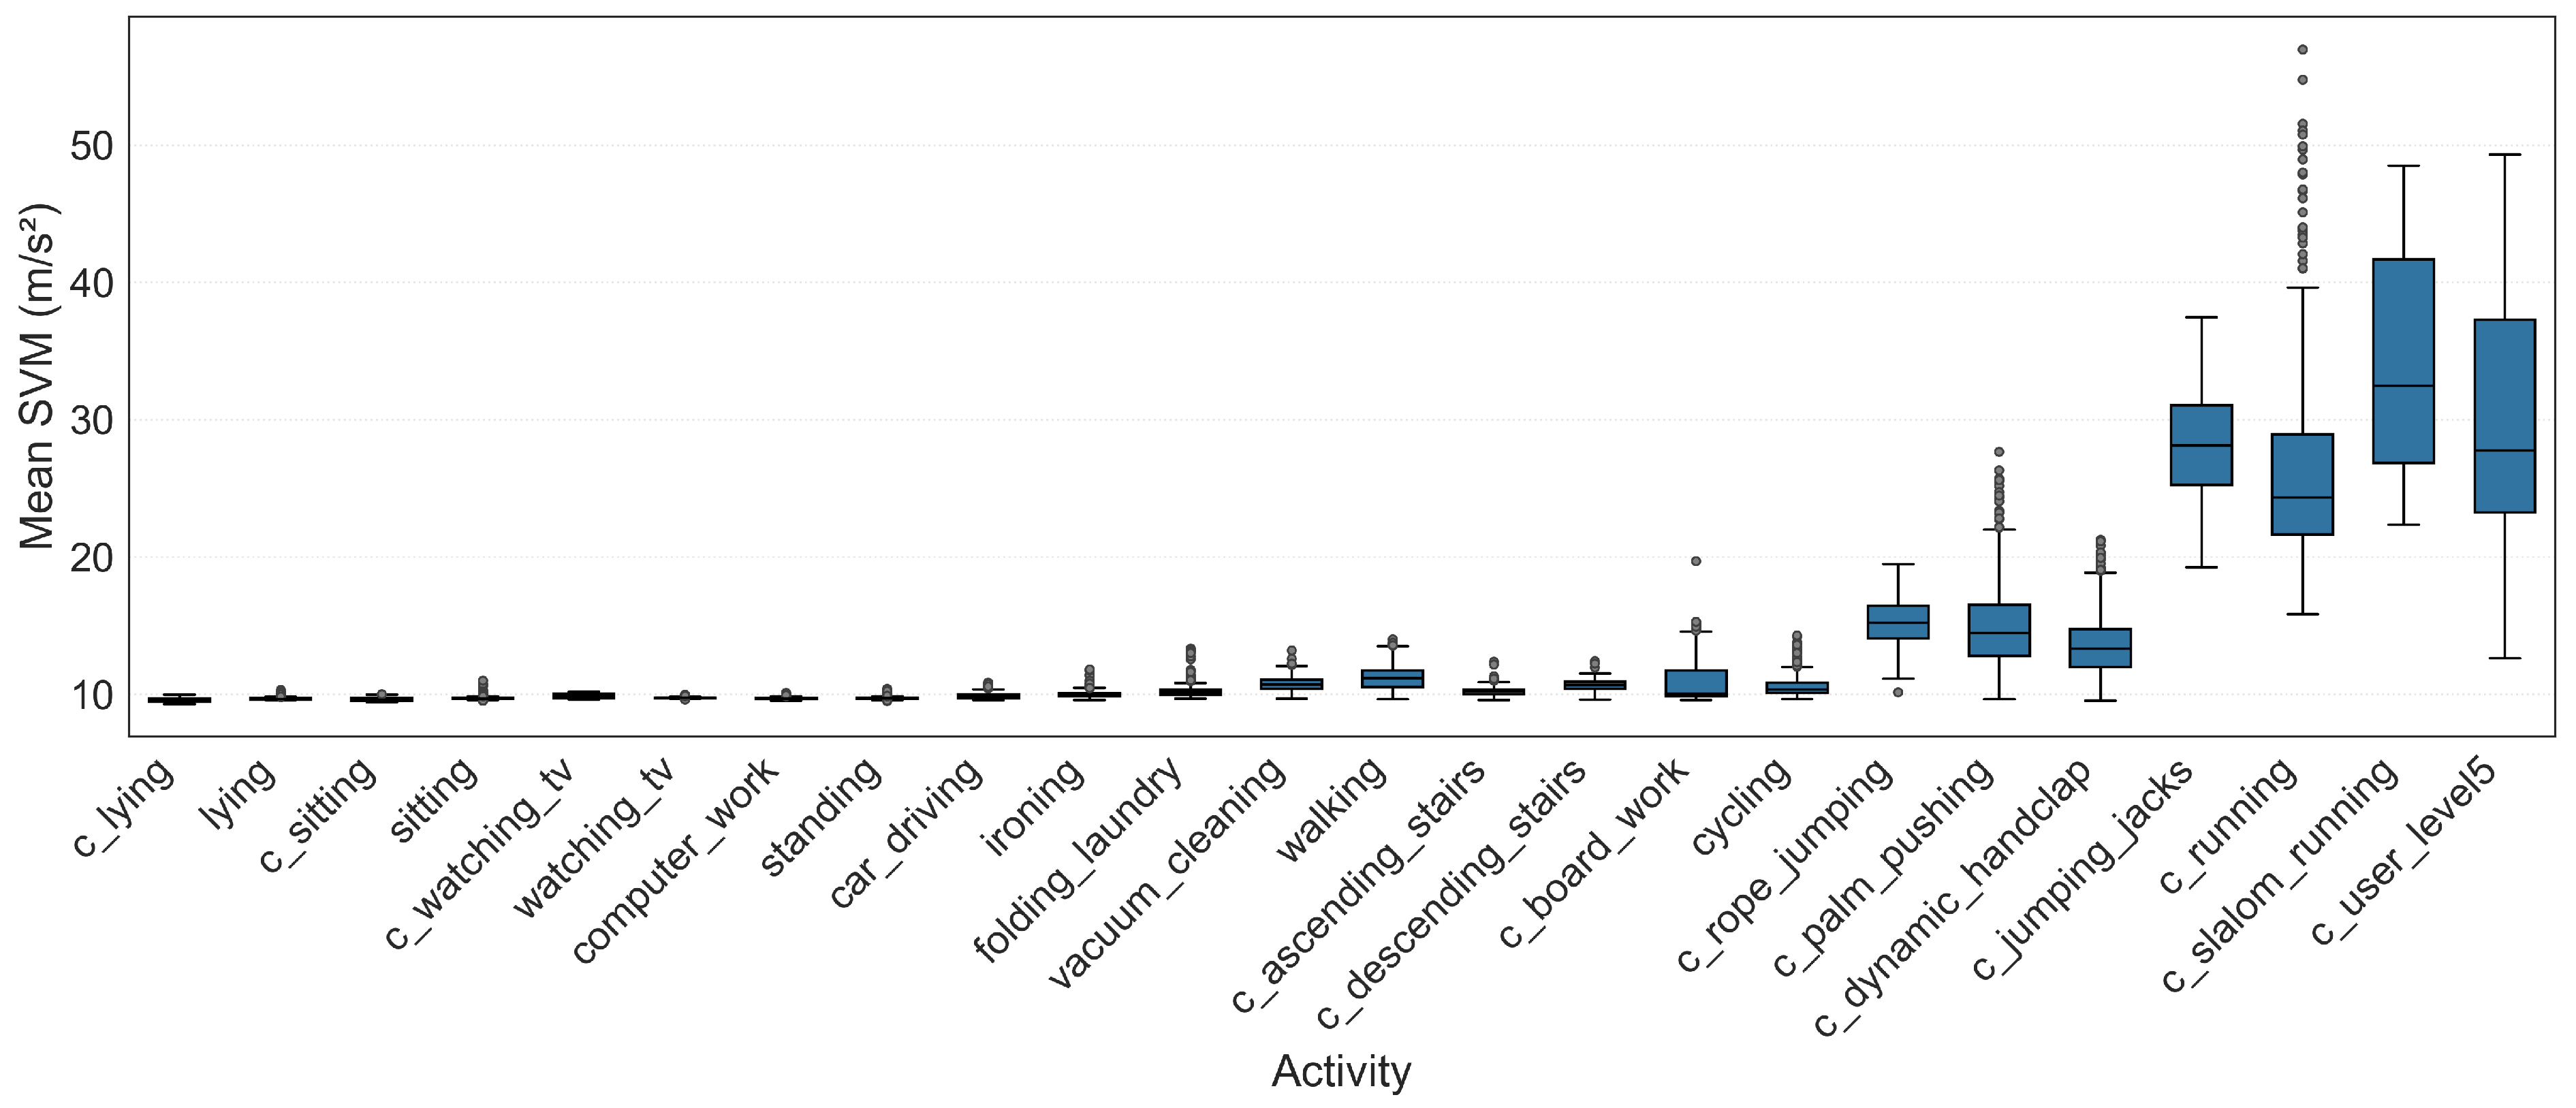
Figure 16.
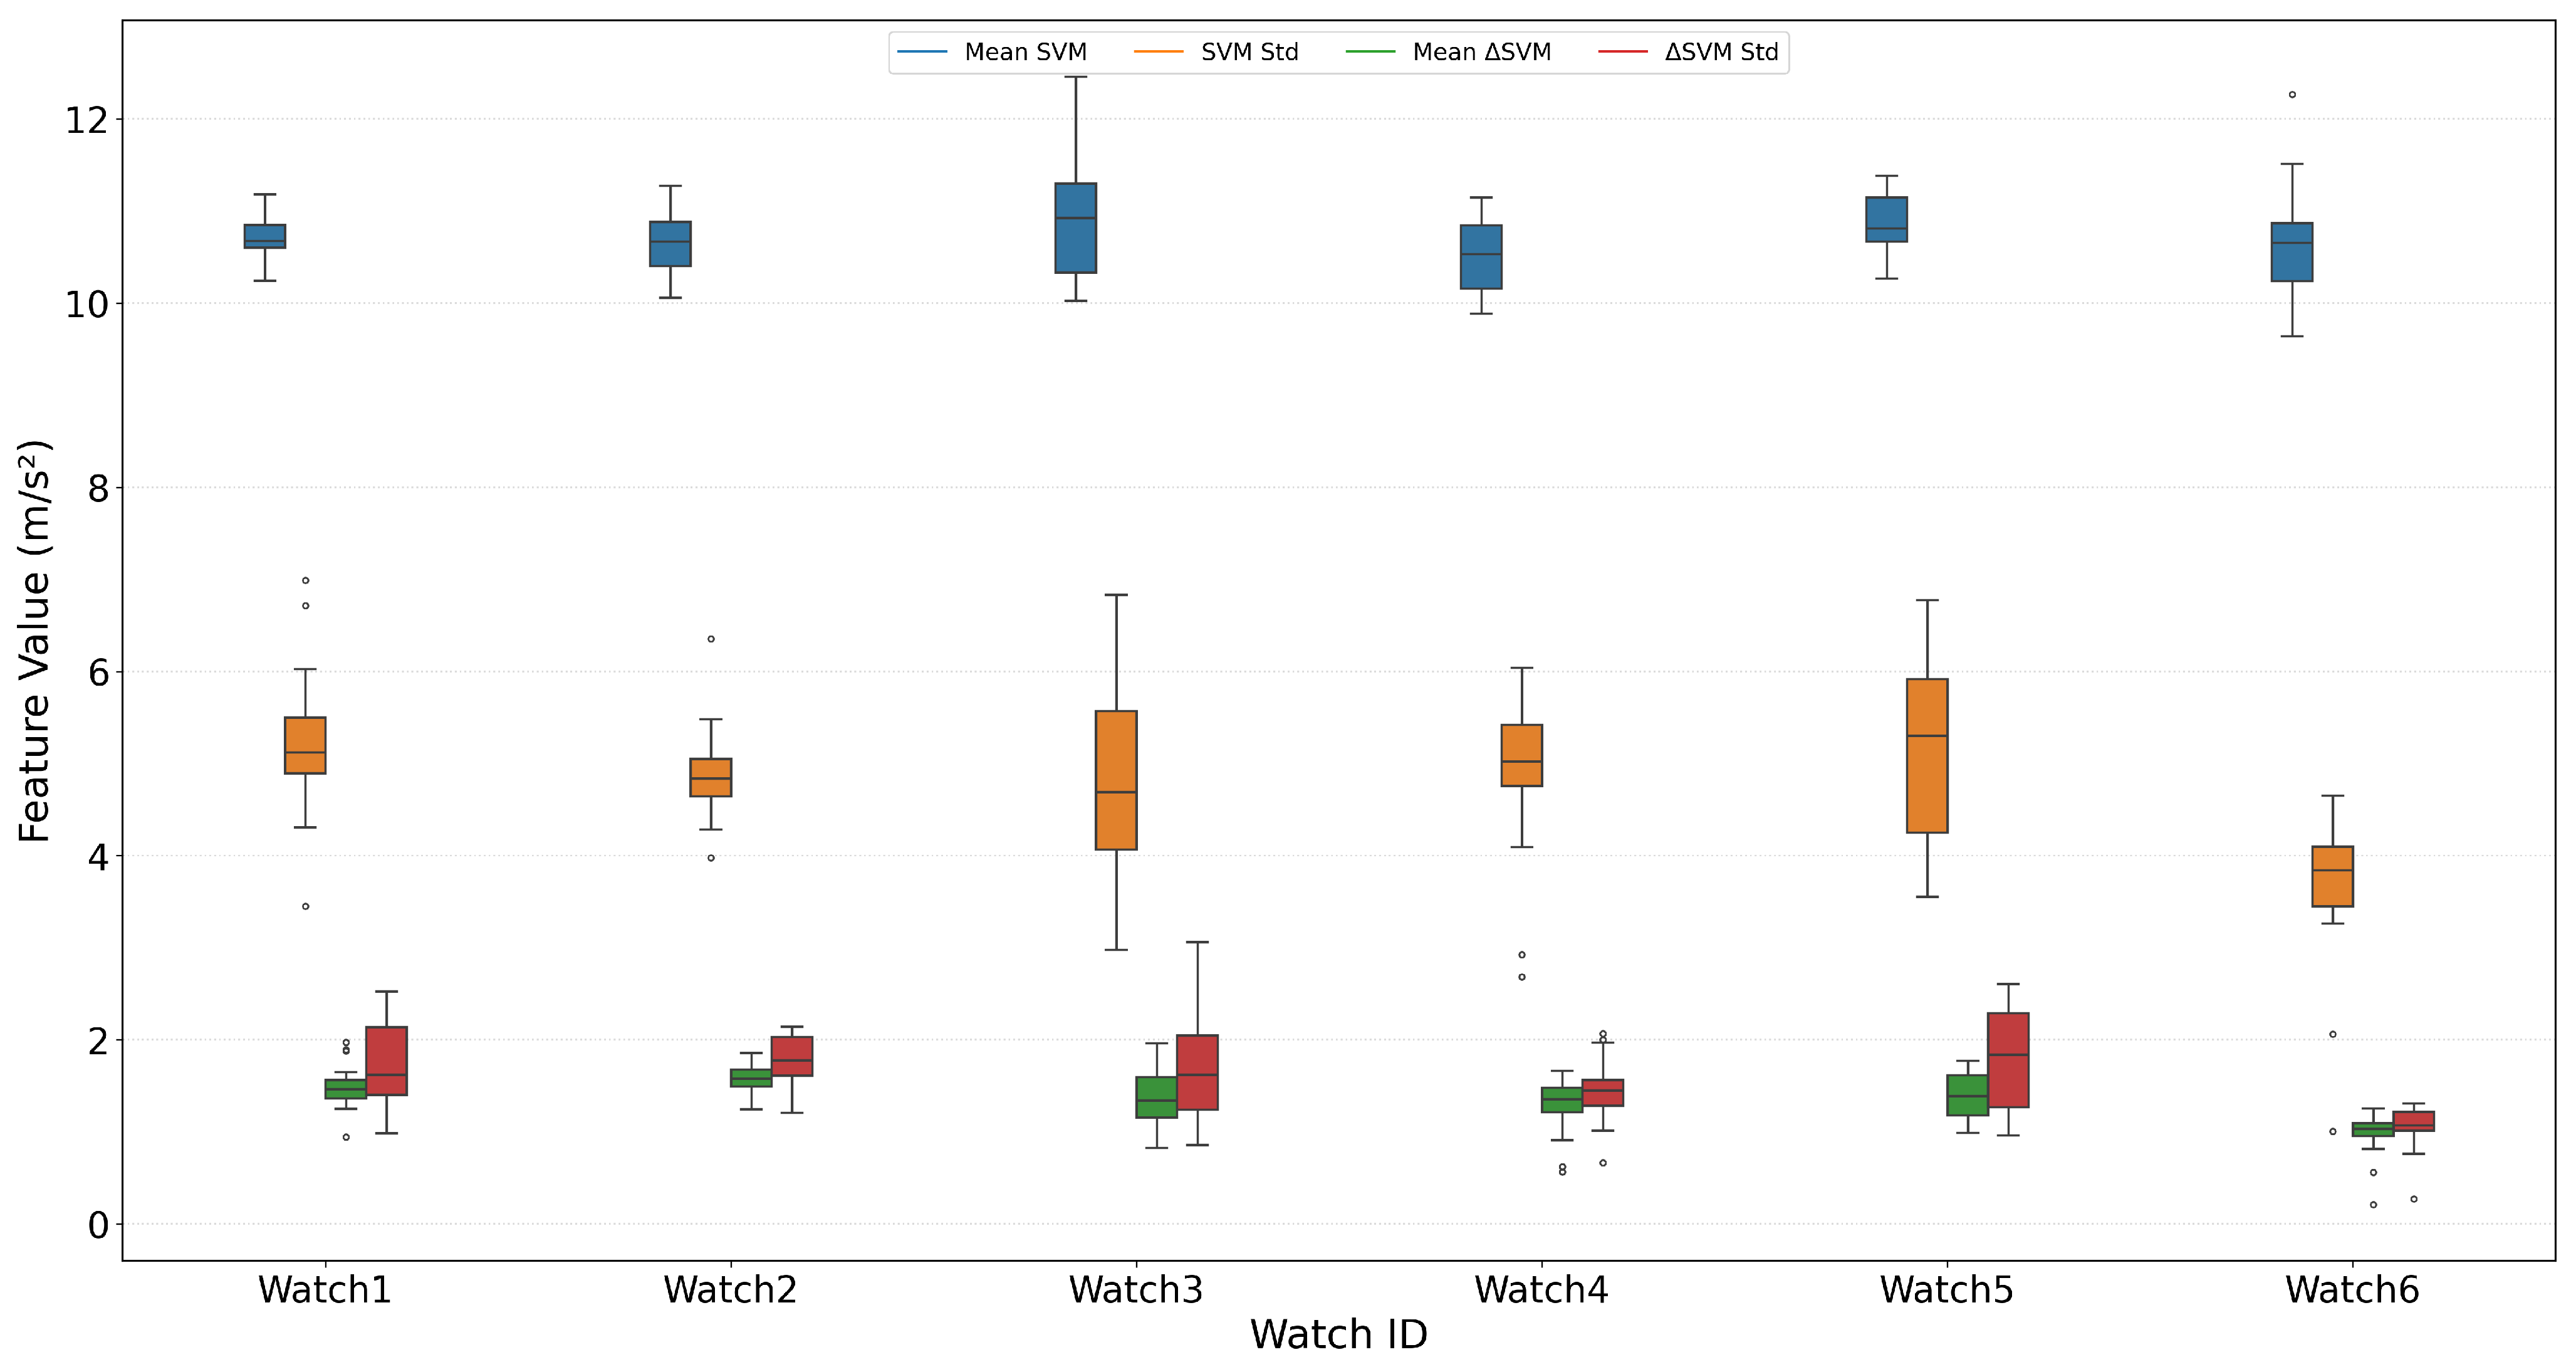
Mean SVM feature values extracted from the activities in the Dyn-Intensity and PAMAP2 datasets.
Figure 16.
Mean SVM feature values extracted from the activities in the Dyn-Intensity and PAMAP2 datasets.
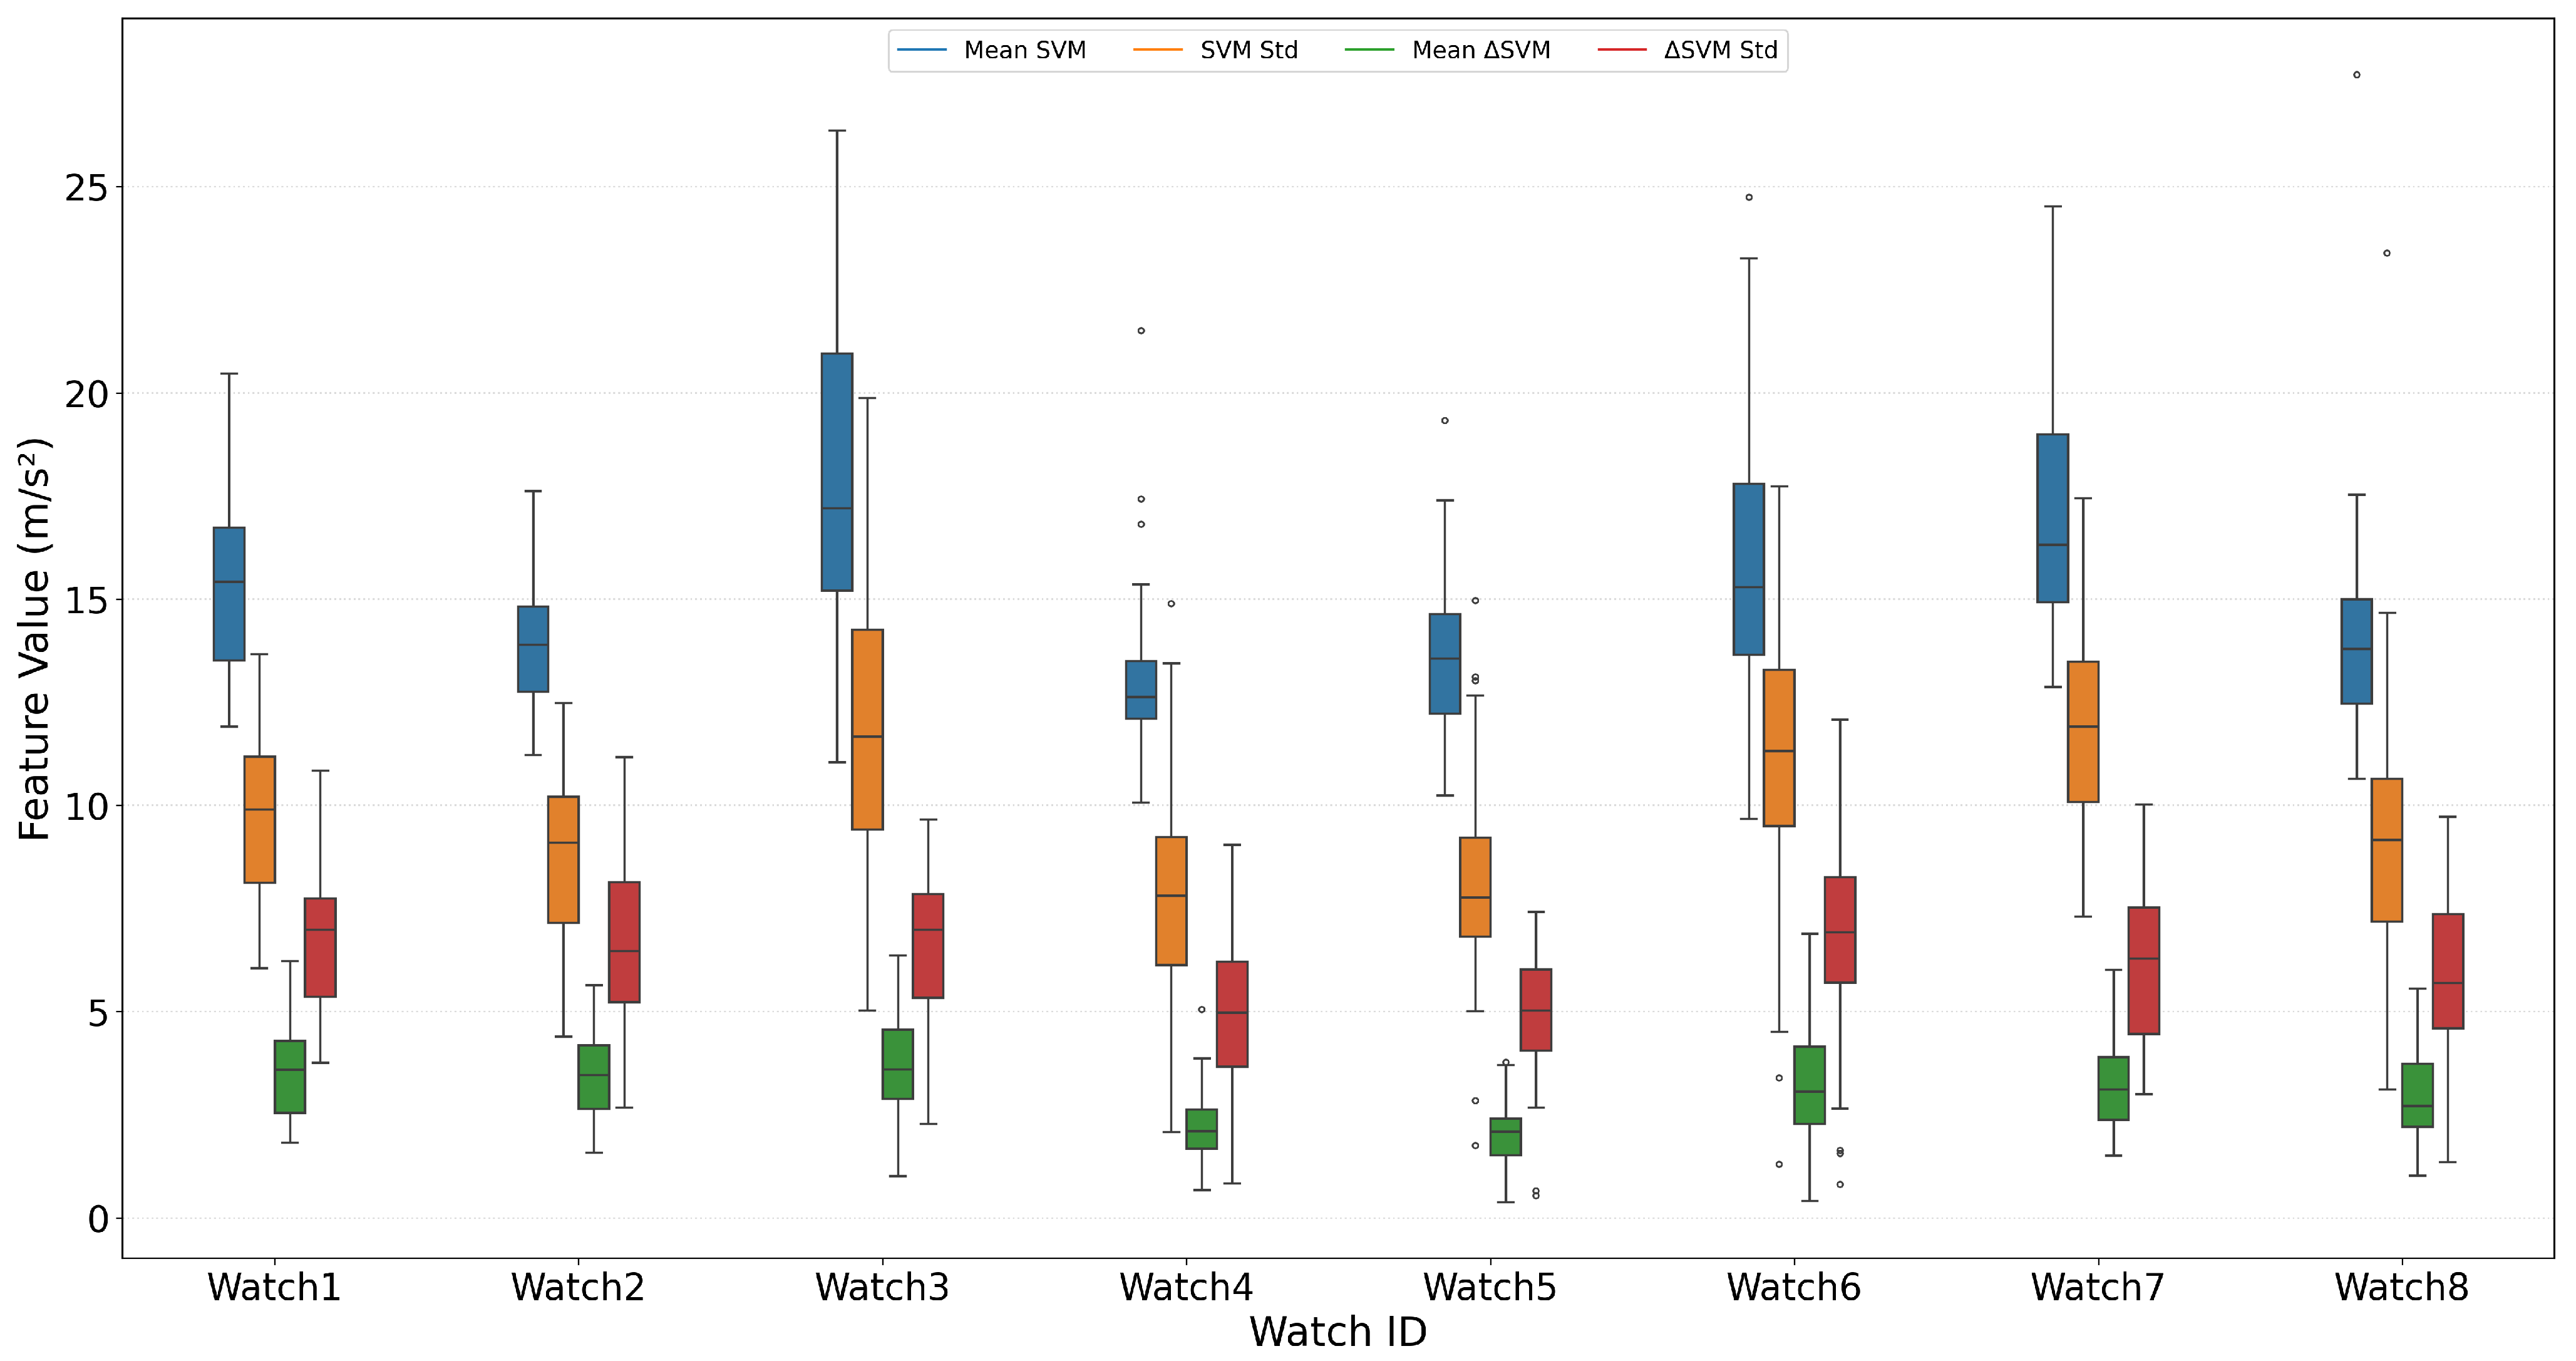
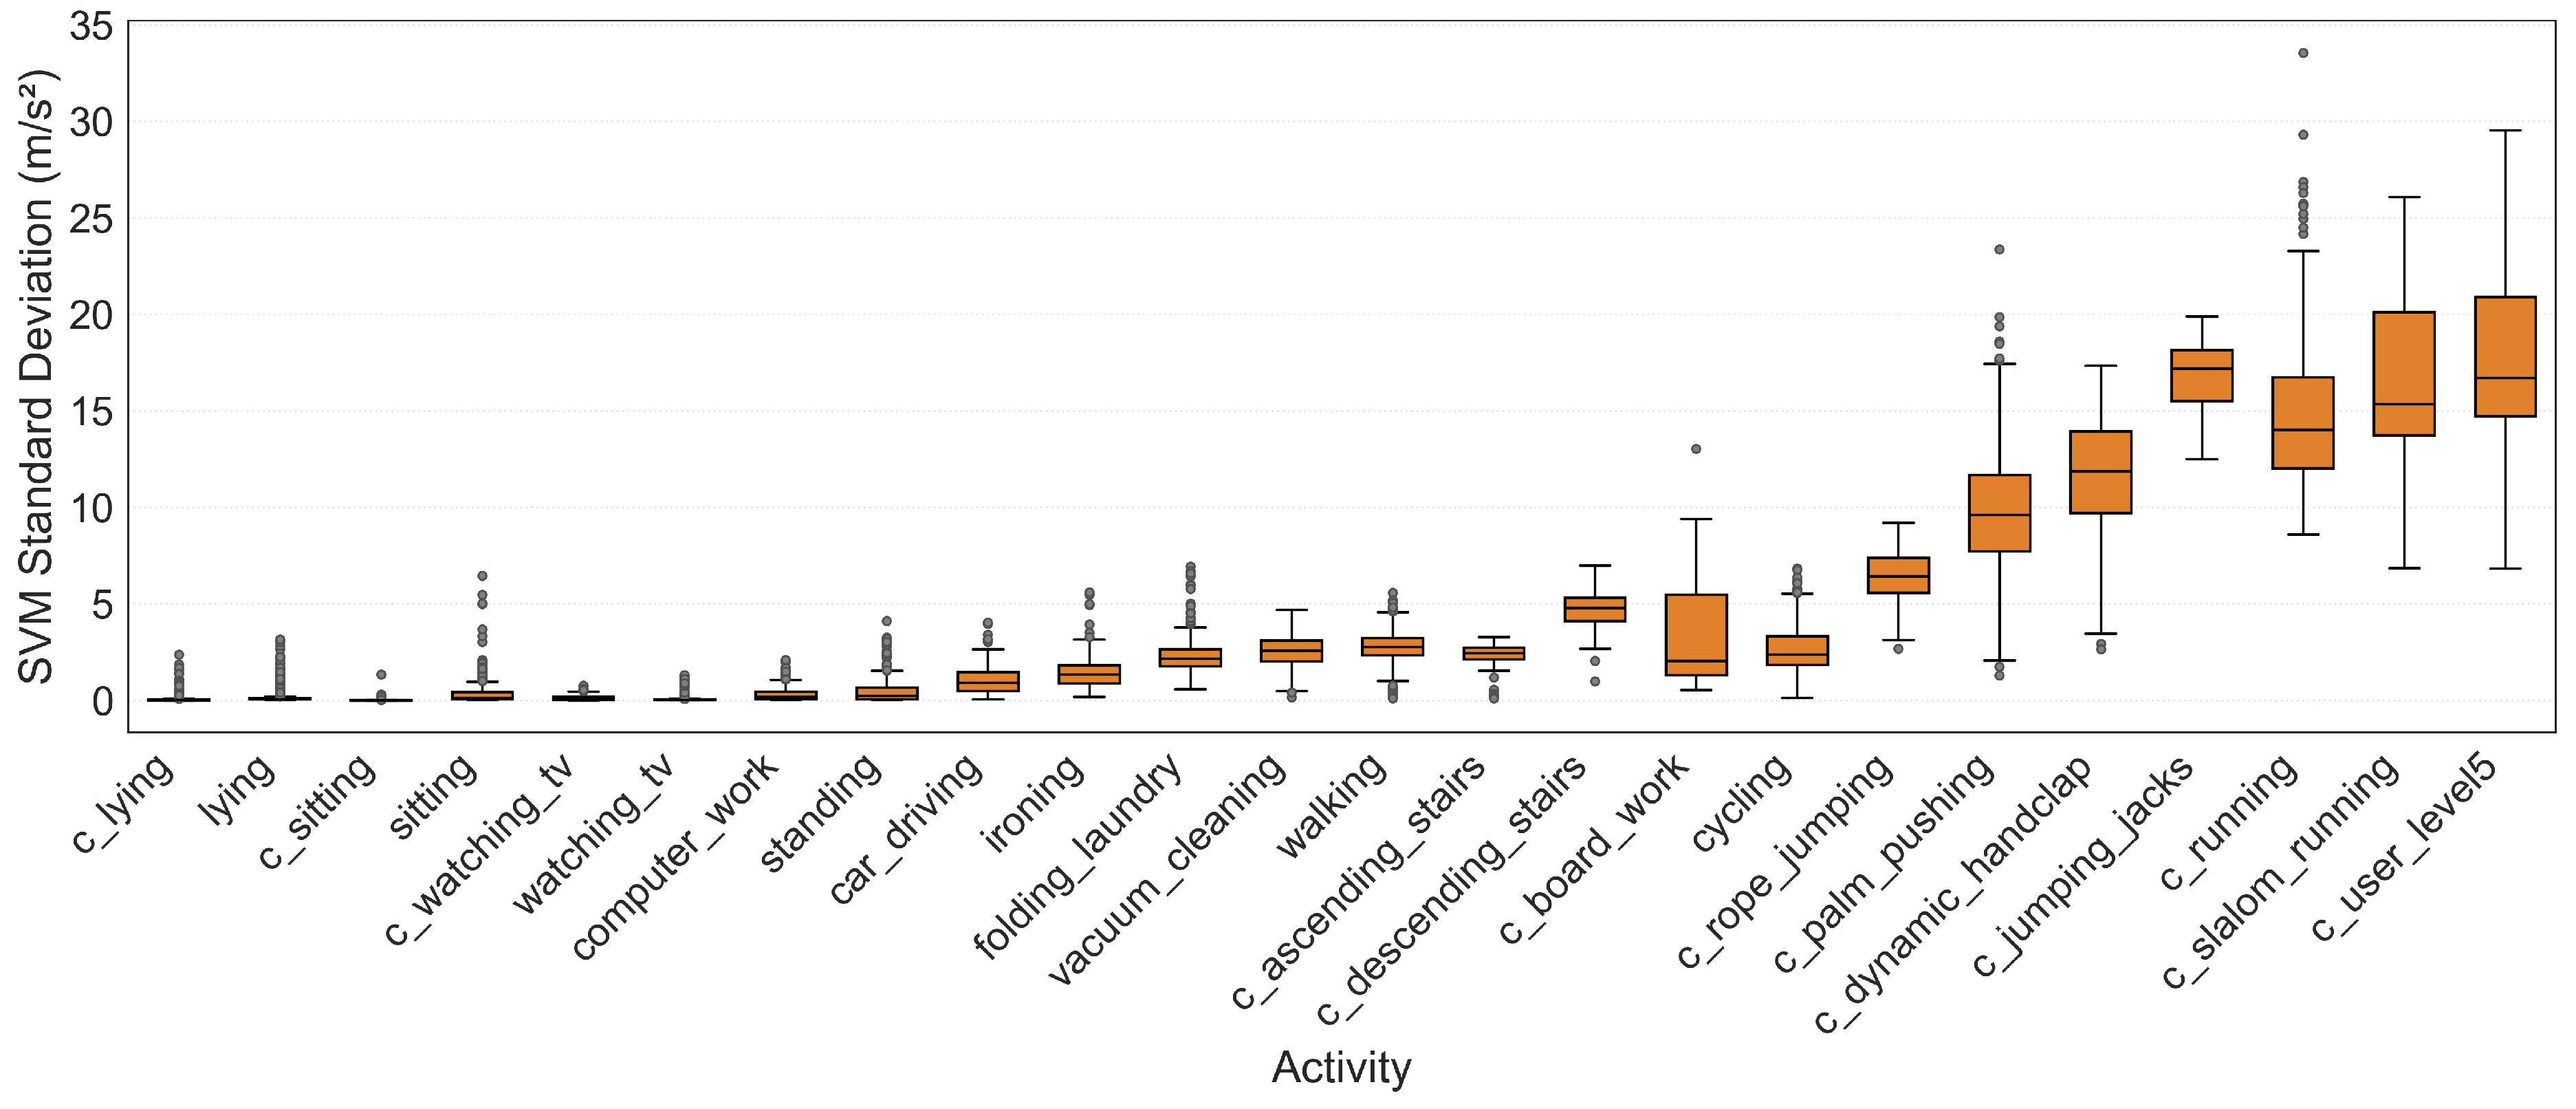
Figure 17.
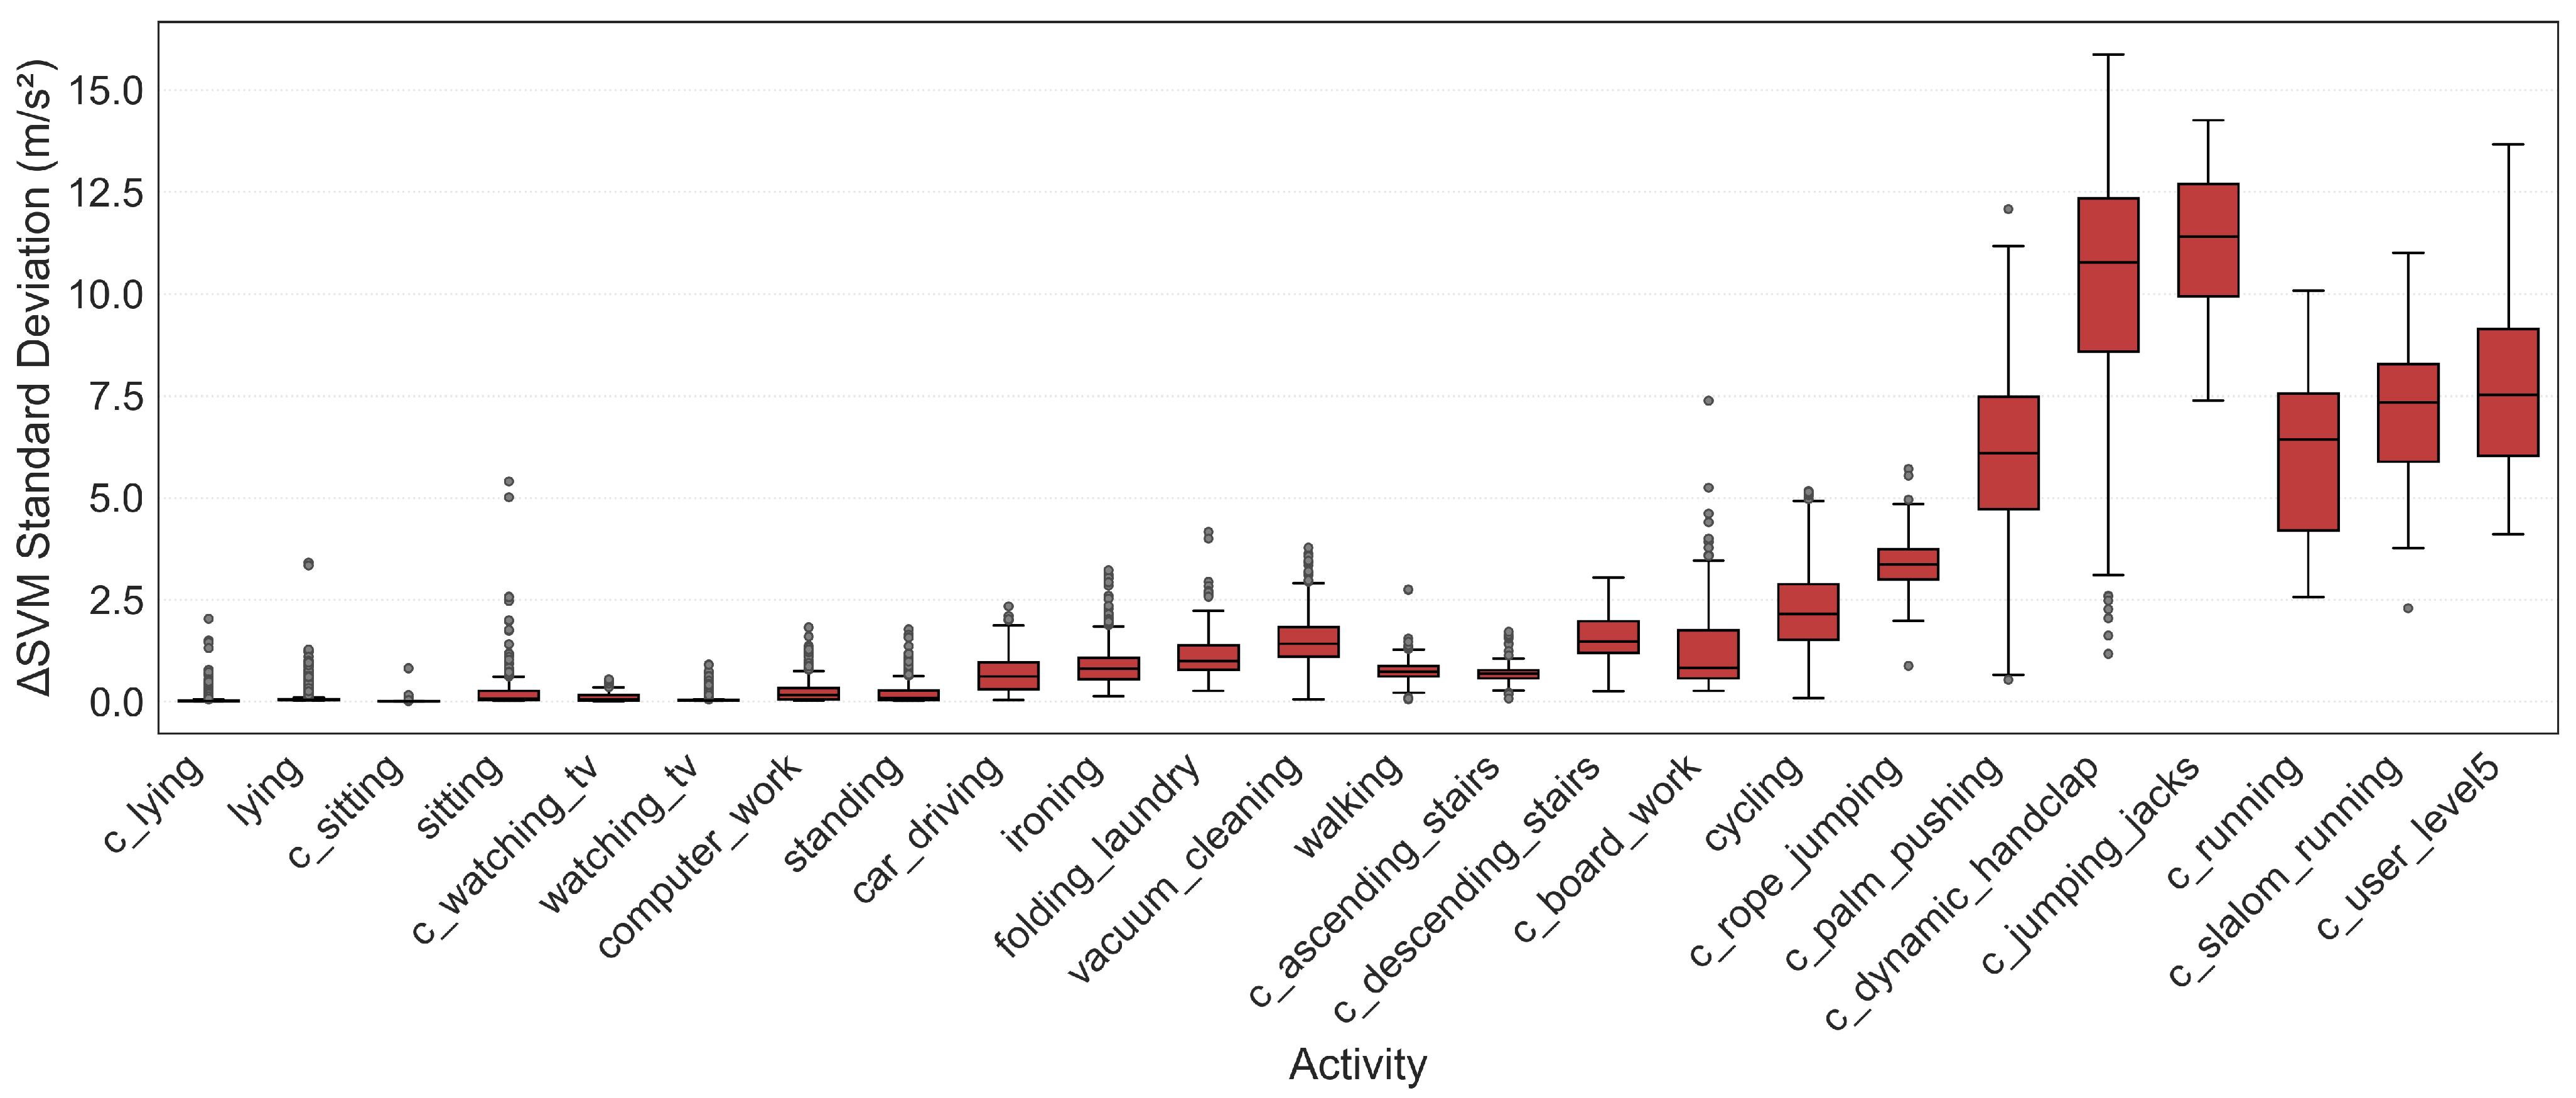
Standard deviation of the SVM feature observed across the activities in the Dyn-Intensity and PAMAP2 datasets.
Figure 17.
Standard deviation of the SVM feature observed across the activities in the Dyn-Intensity and PAMAP2 datasets.
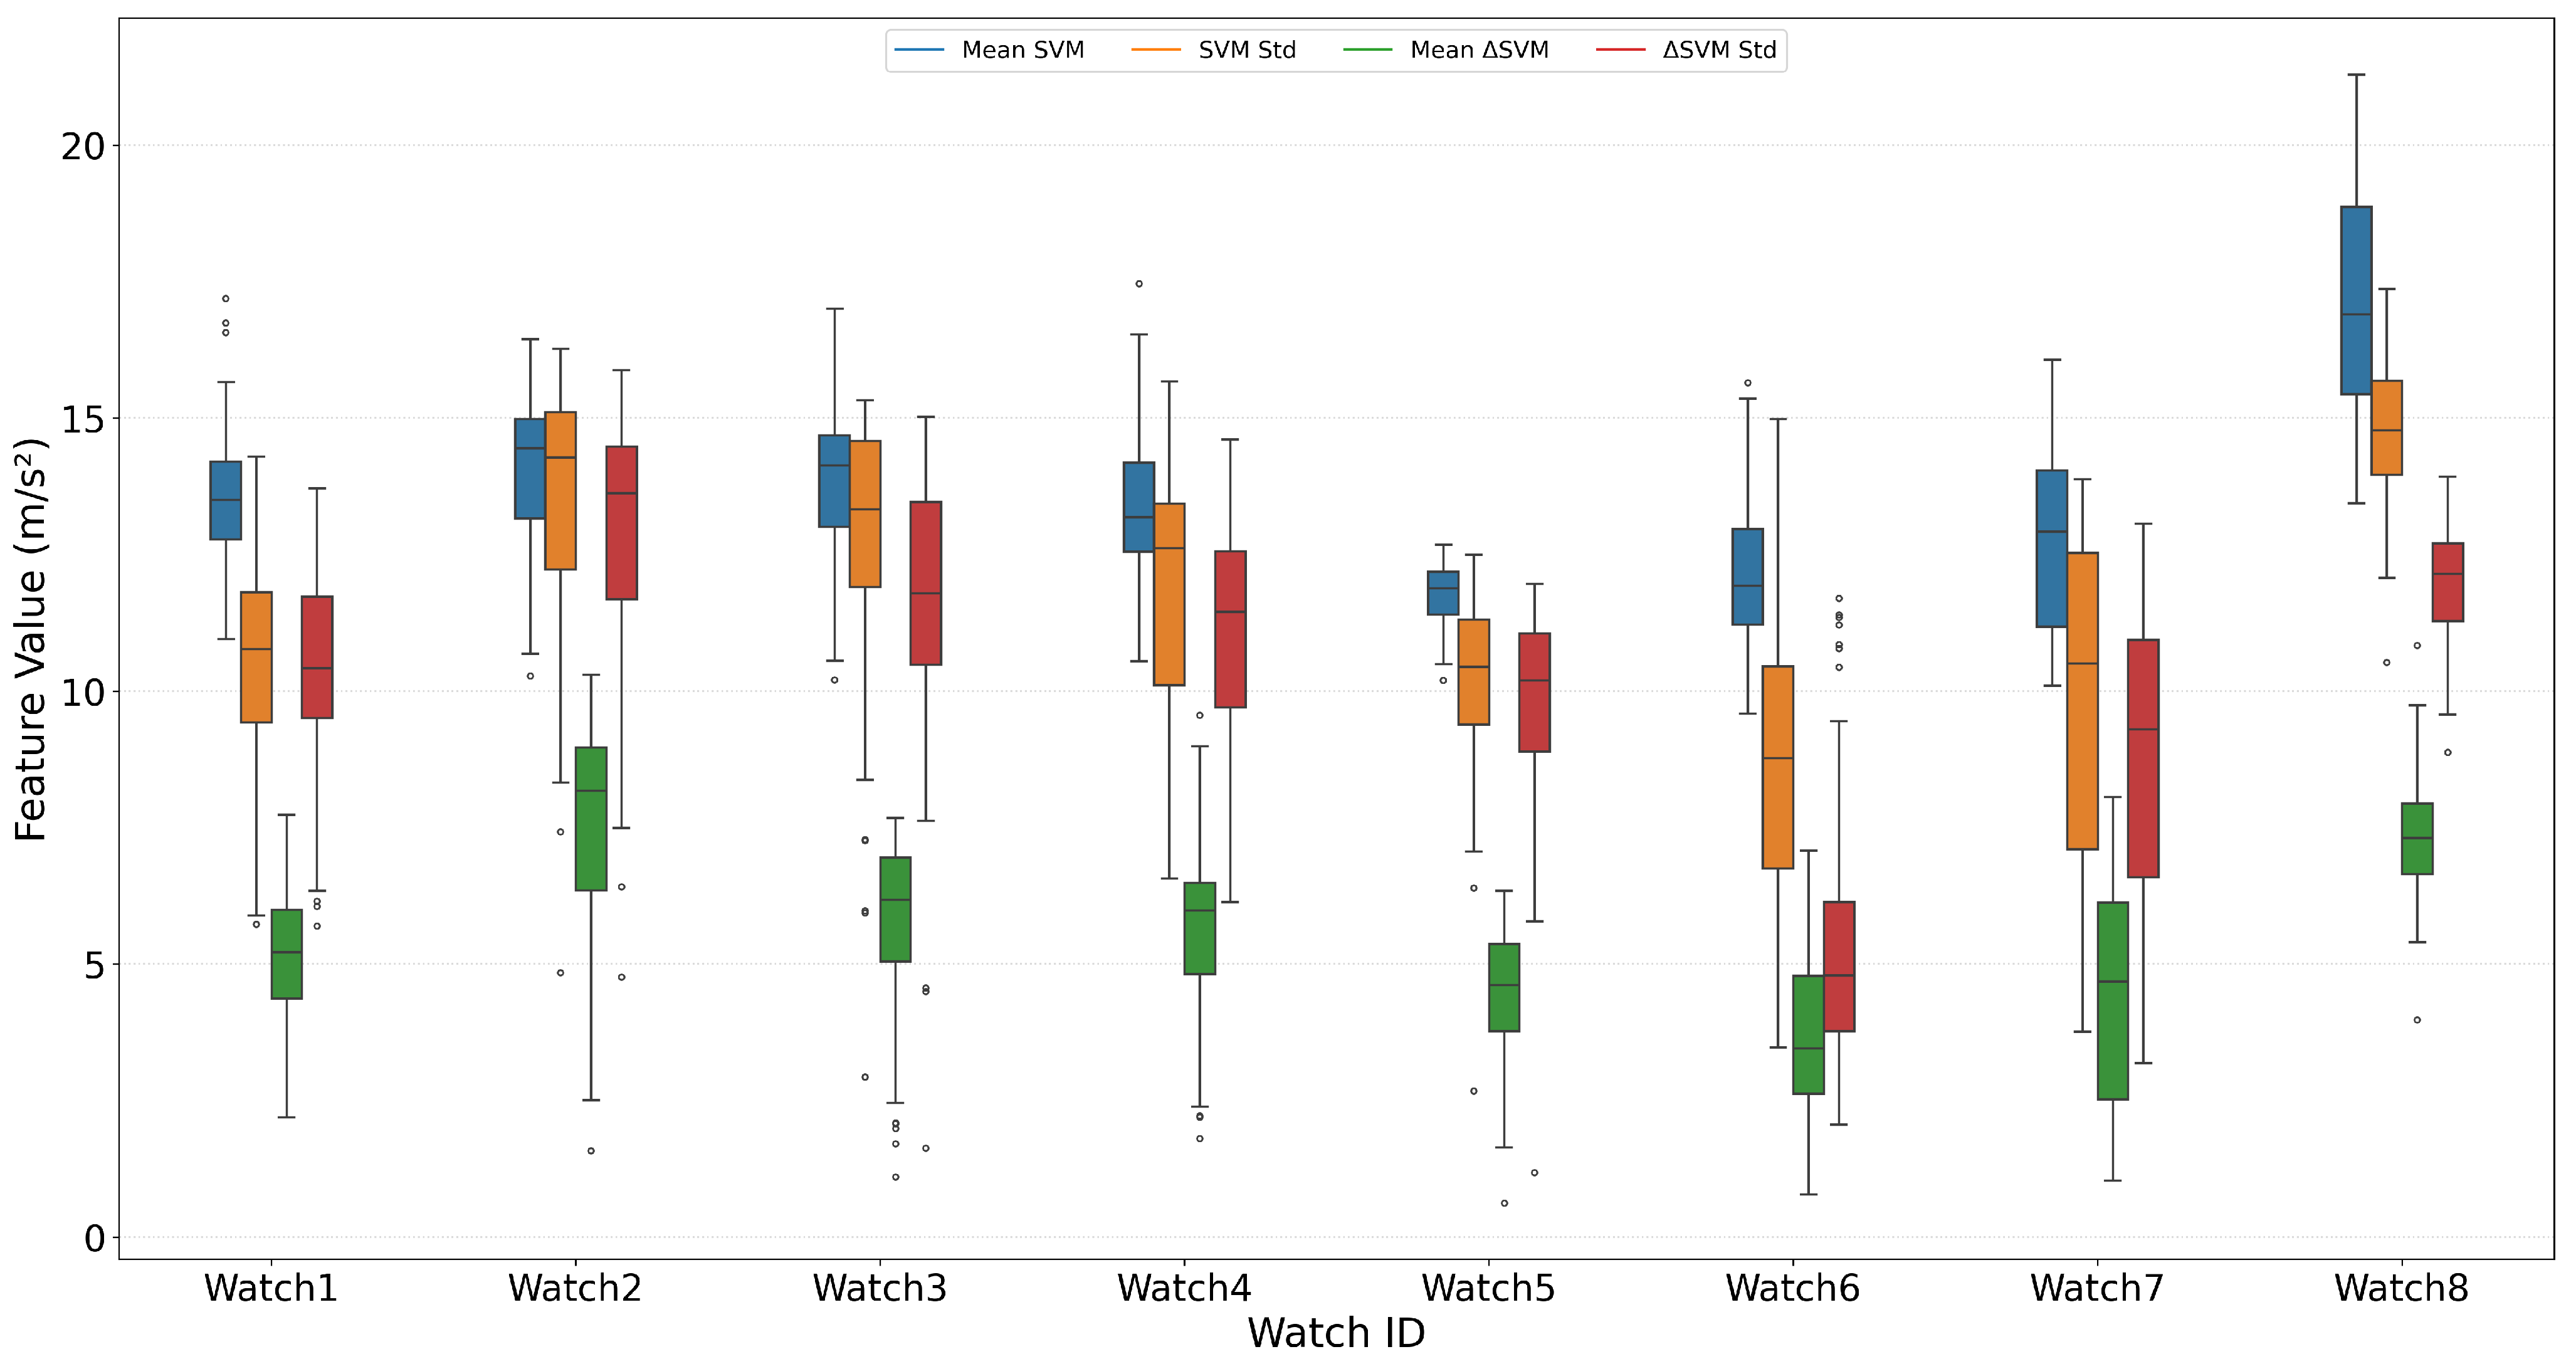
Figure 18.
Mean SVM feature values computed for the activities in the Dyn-Intensity and PAMAP2 datasets.
Figure 18.
Mean SVM feature values computed for the activities in the Dyn-Intensity and PAMAP2 datasets.
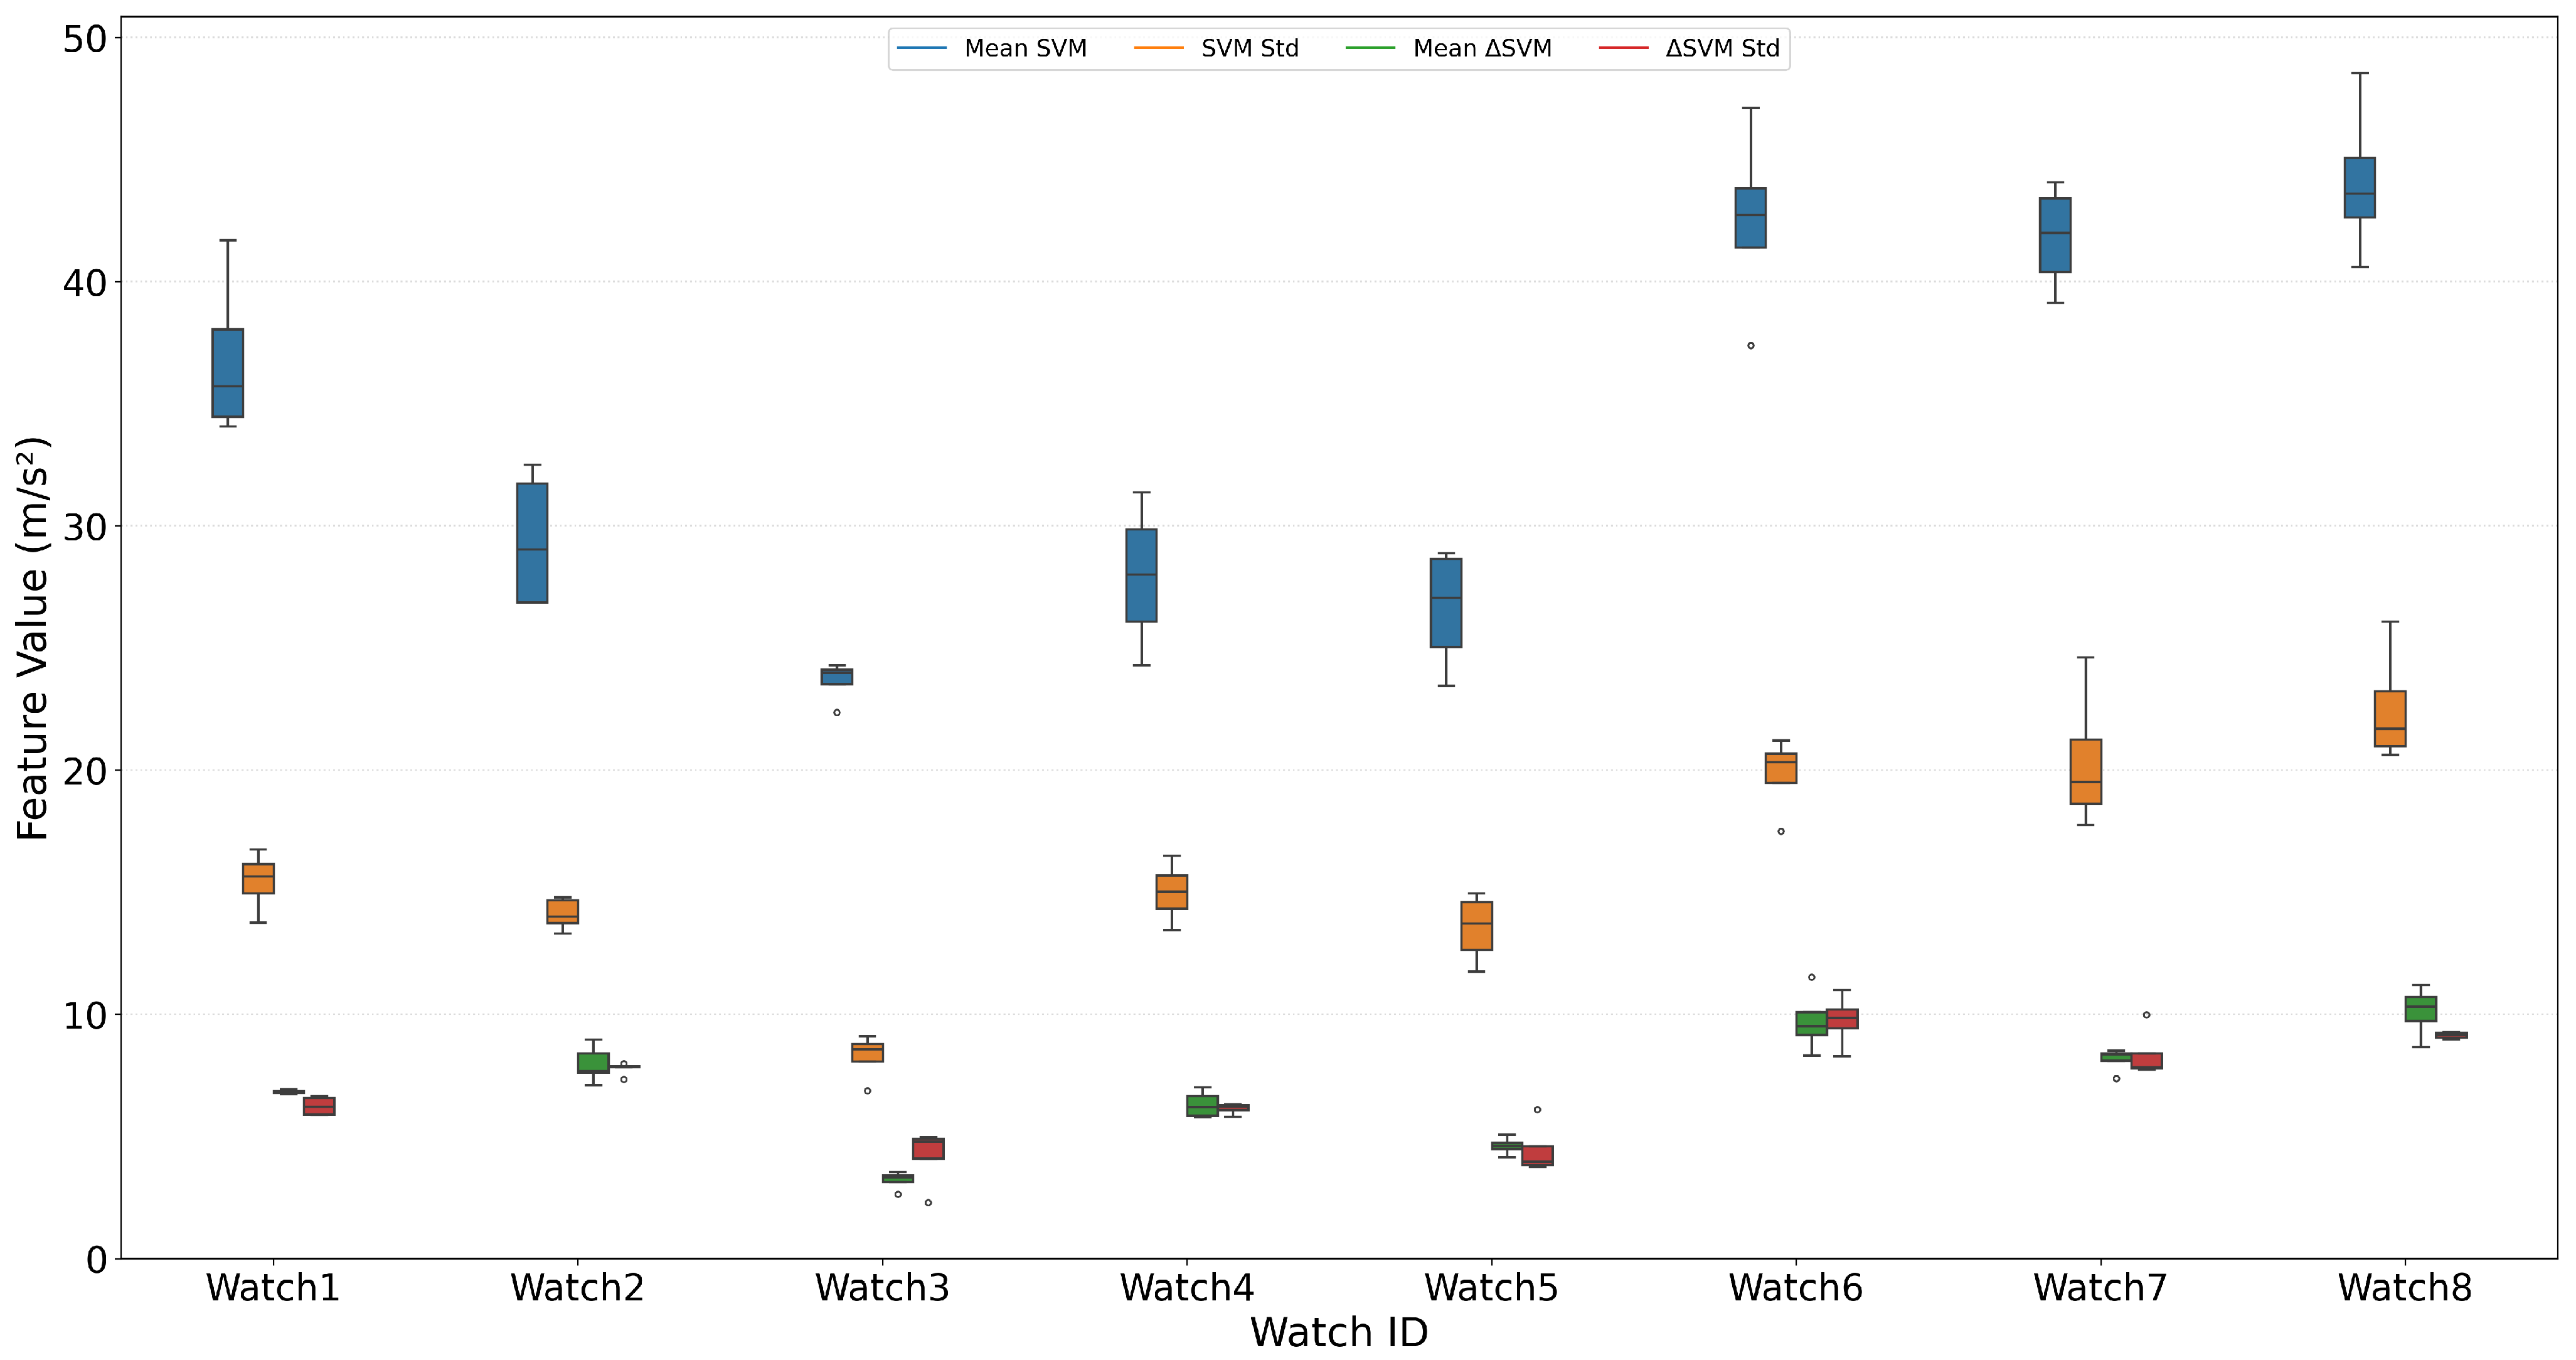
Figure 19.
Standard deviation of the SVM feature across the activities in the Dyn-Intensity and PAMAP2 datasets.
Figure 19.
Standard deviation of the SVM feature across the activities in the Dyn-Intensity and PAMAP2 datasets.
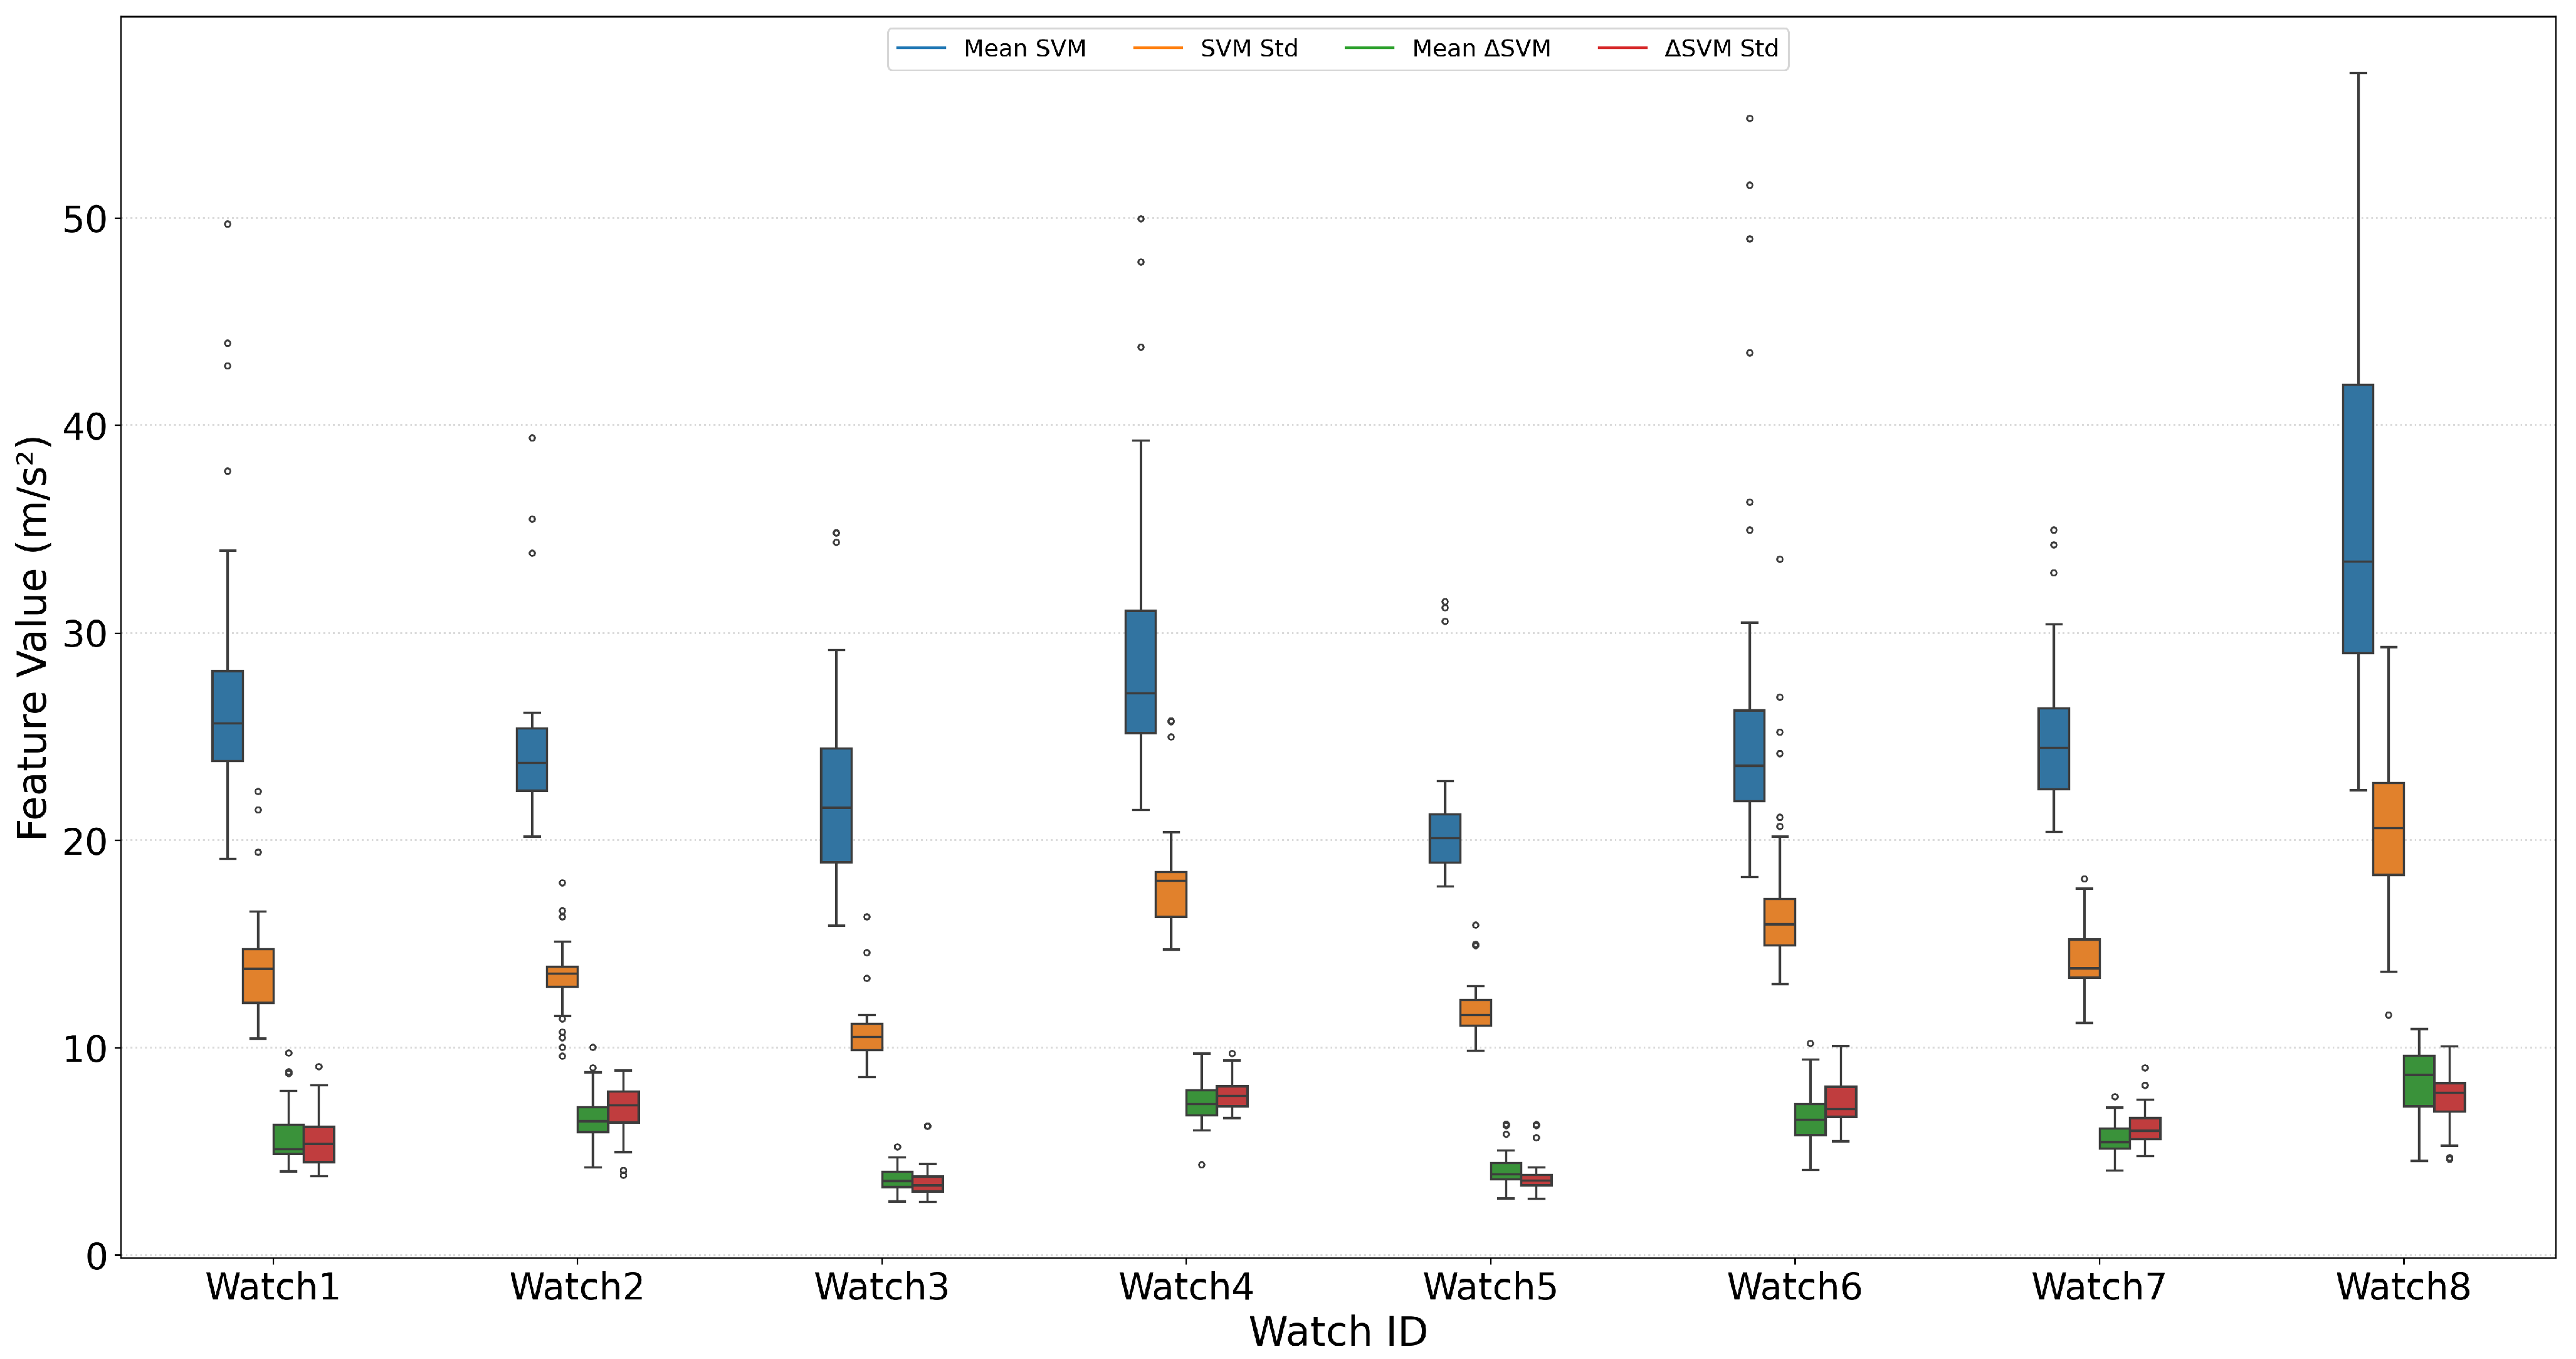
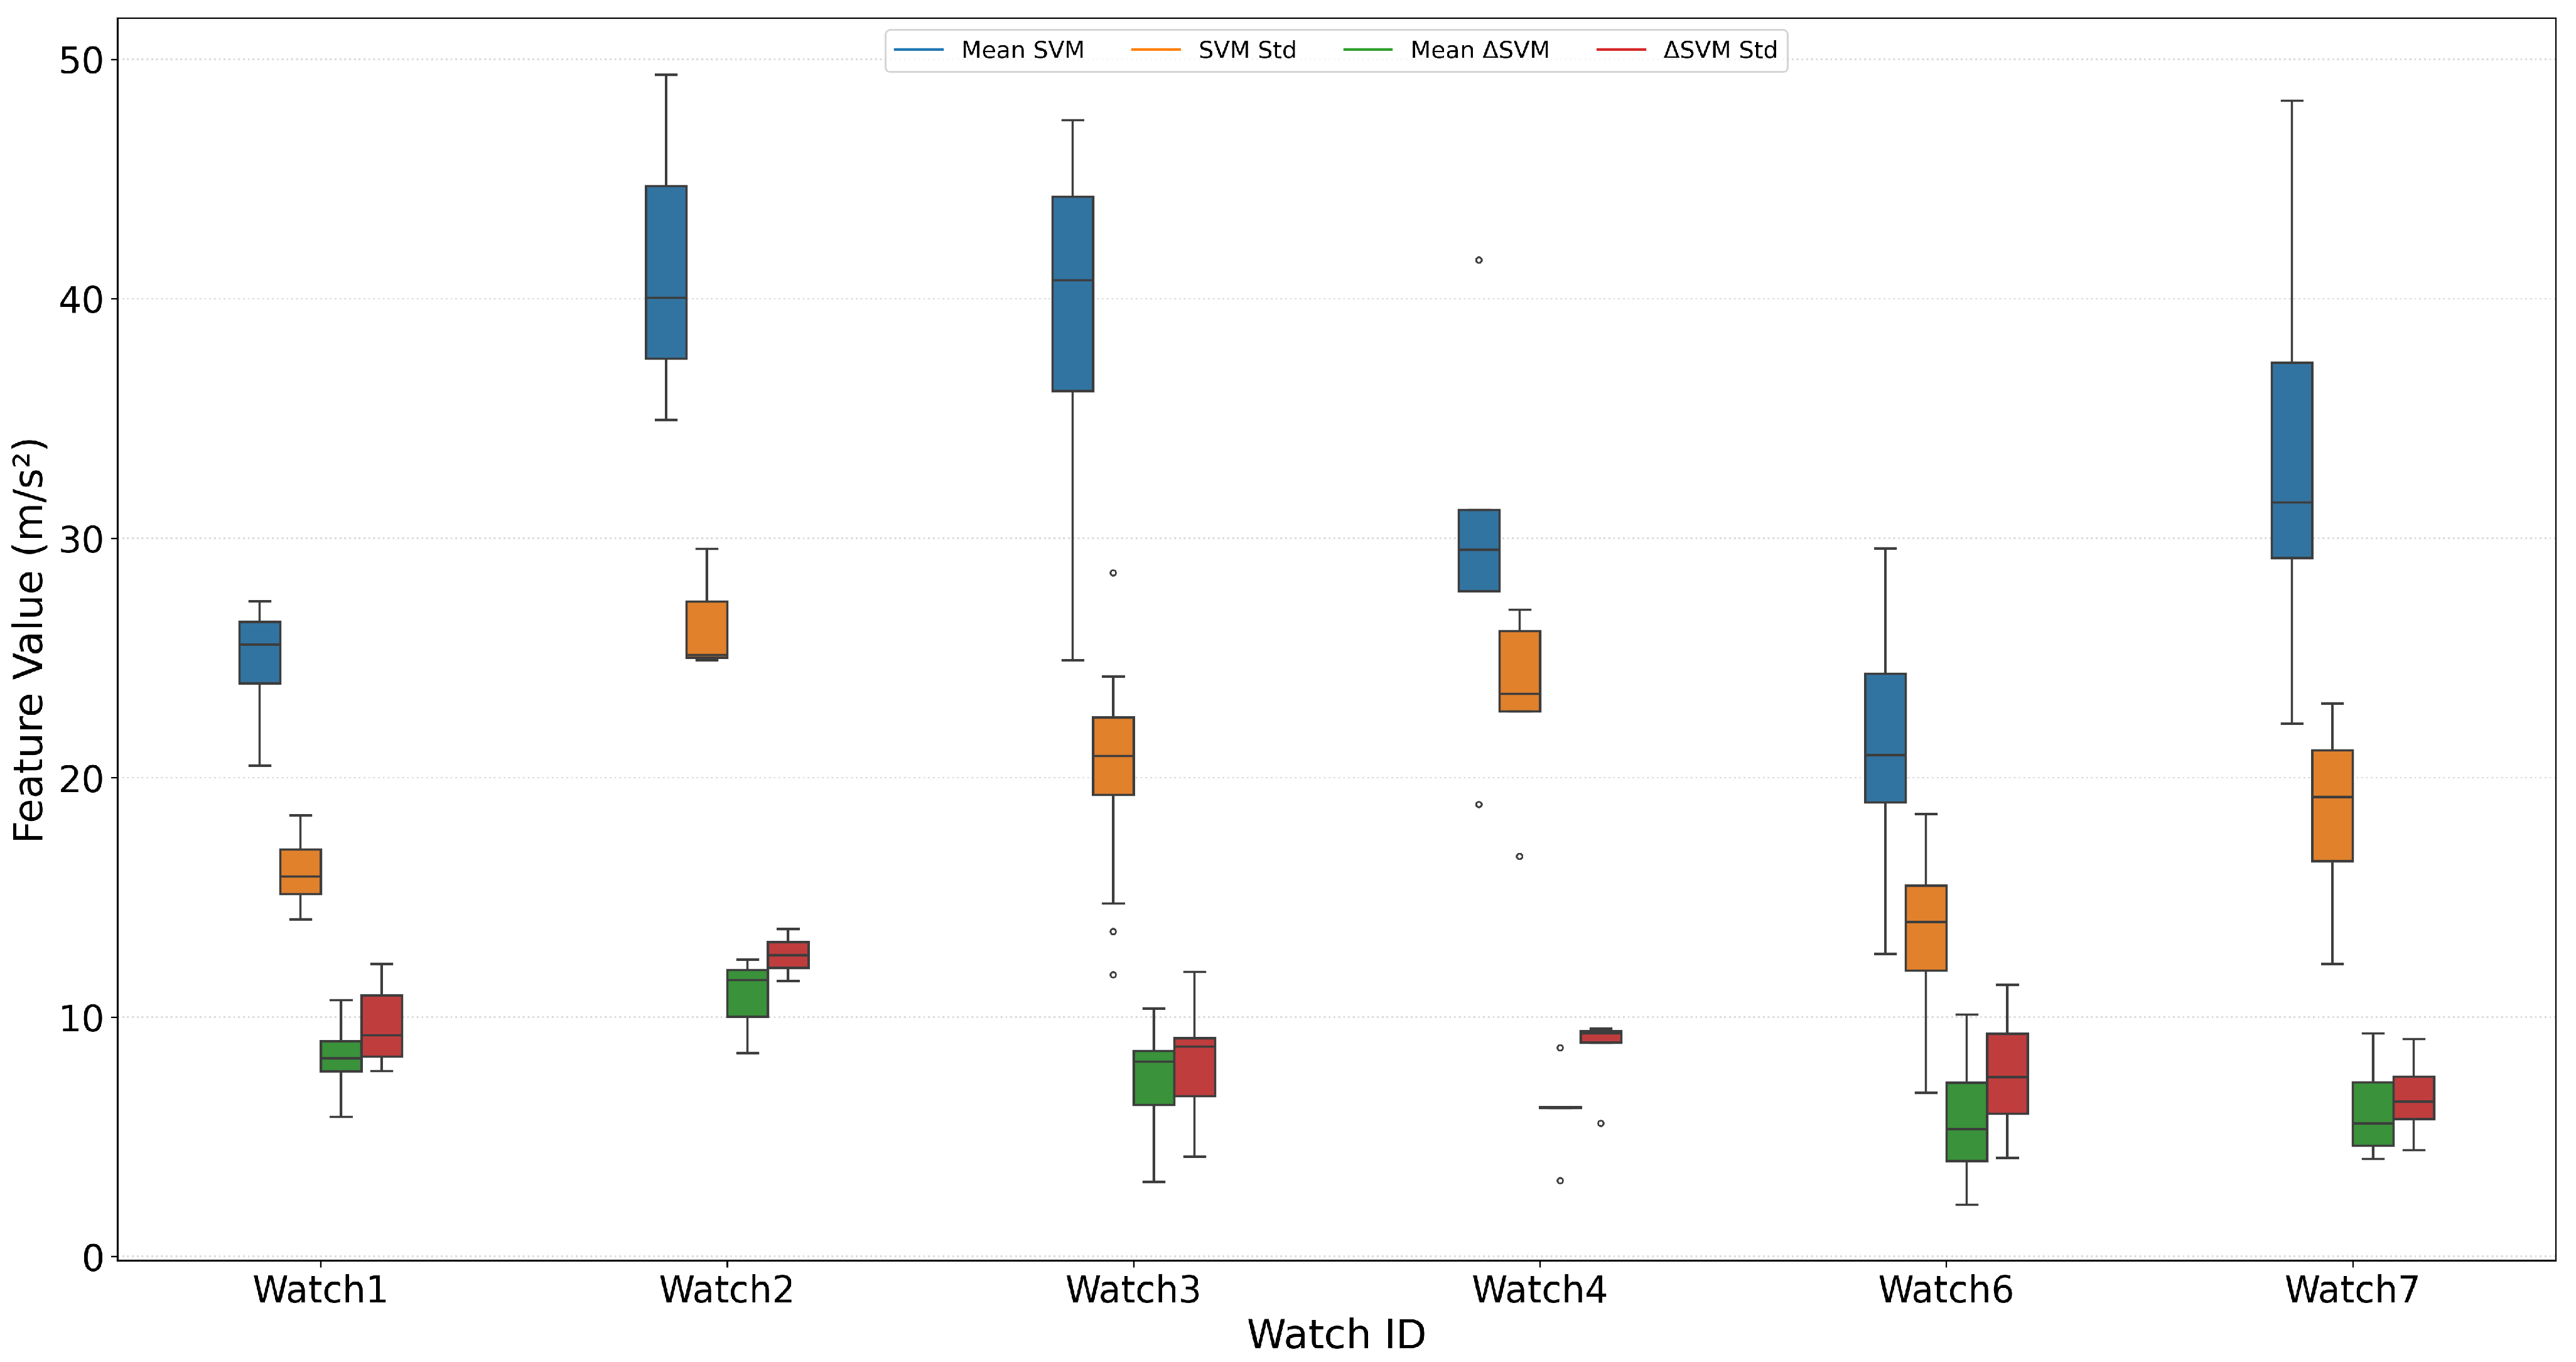
Figure 20.
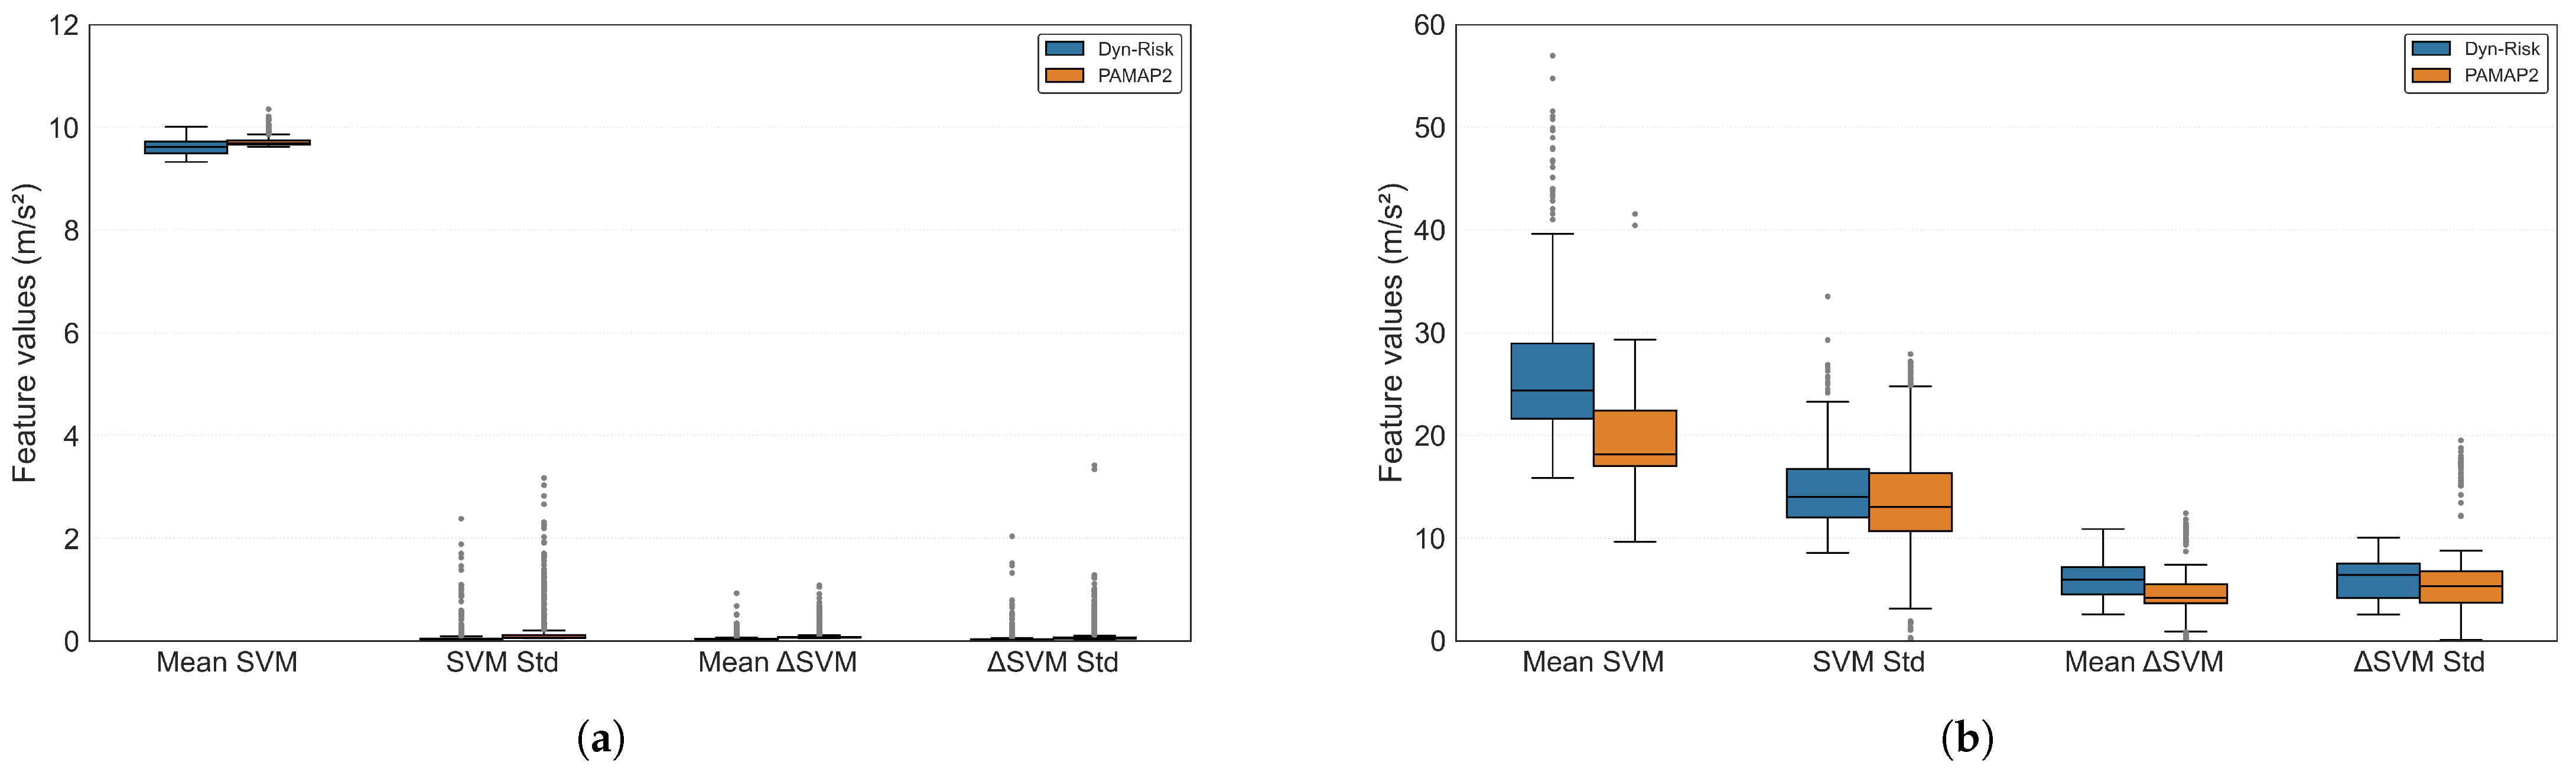
Comparison of feature distributions between the PAMAP2 and self-collected datasets.The static activity (lying) shows nearly identical distributions across all four features, validating its integration into a unified class. In contrast, the dynamic activity (running) exhibits noticeable differences, likely reflecting individual variability in movement intensity and sensor placement. (a) Static activity, lying: Similar distributions across datasets, consolidated into one category. (b) Dynamic activity, running: Distinct distributions observed, only self-collected data used.
Figure 20.
Comparison of feature distributions between the PAMAP2 and self-collected datasets.The static activity (lying) shows nearly identical distributions across all four features, validating its integration into a unified class. In contrast, the dynamic activity (running) exhibits noticeable differences, likely reflecting individual variability in movement intensity and sensor placement. (a) Static activity, lying: Similar distributions across datasets, consolidated into one category. (b) Dynamic activity, running: Distinct distributions observed, only self-collected data used.
Figure 21.
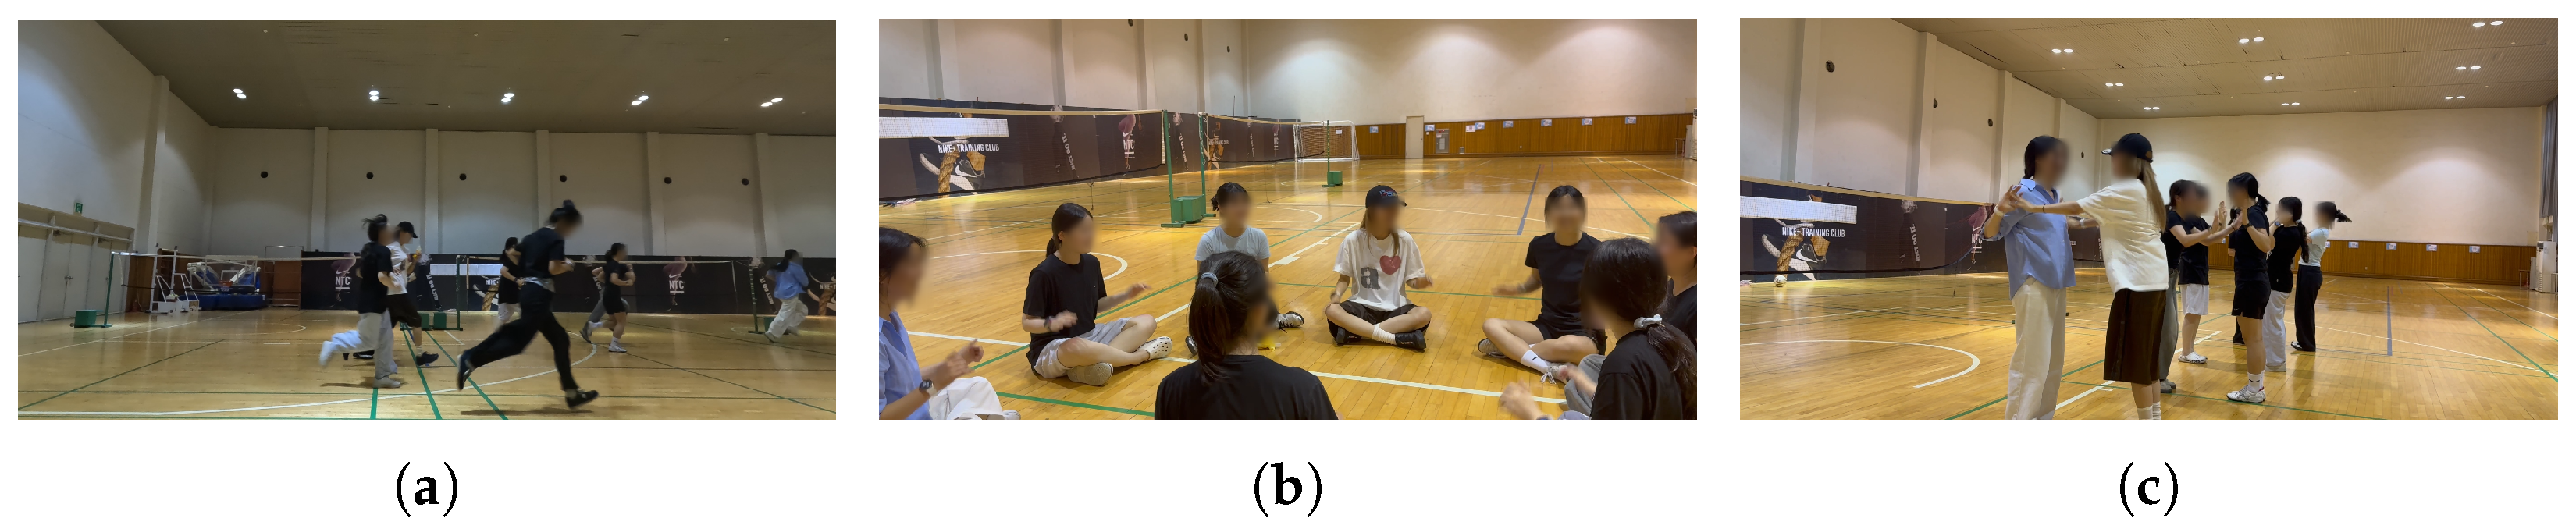
Examples of the experimental environment and activities performed. (a) Running; (b) dynamic handclap; (c) palm pushing.
Figure 21.
Examples of the experimental environment and activities performed. (a) Running; (b) dynamic handclap; (c) palm pushing.
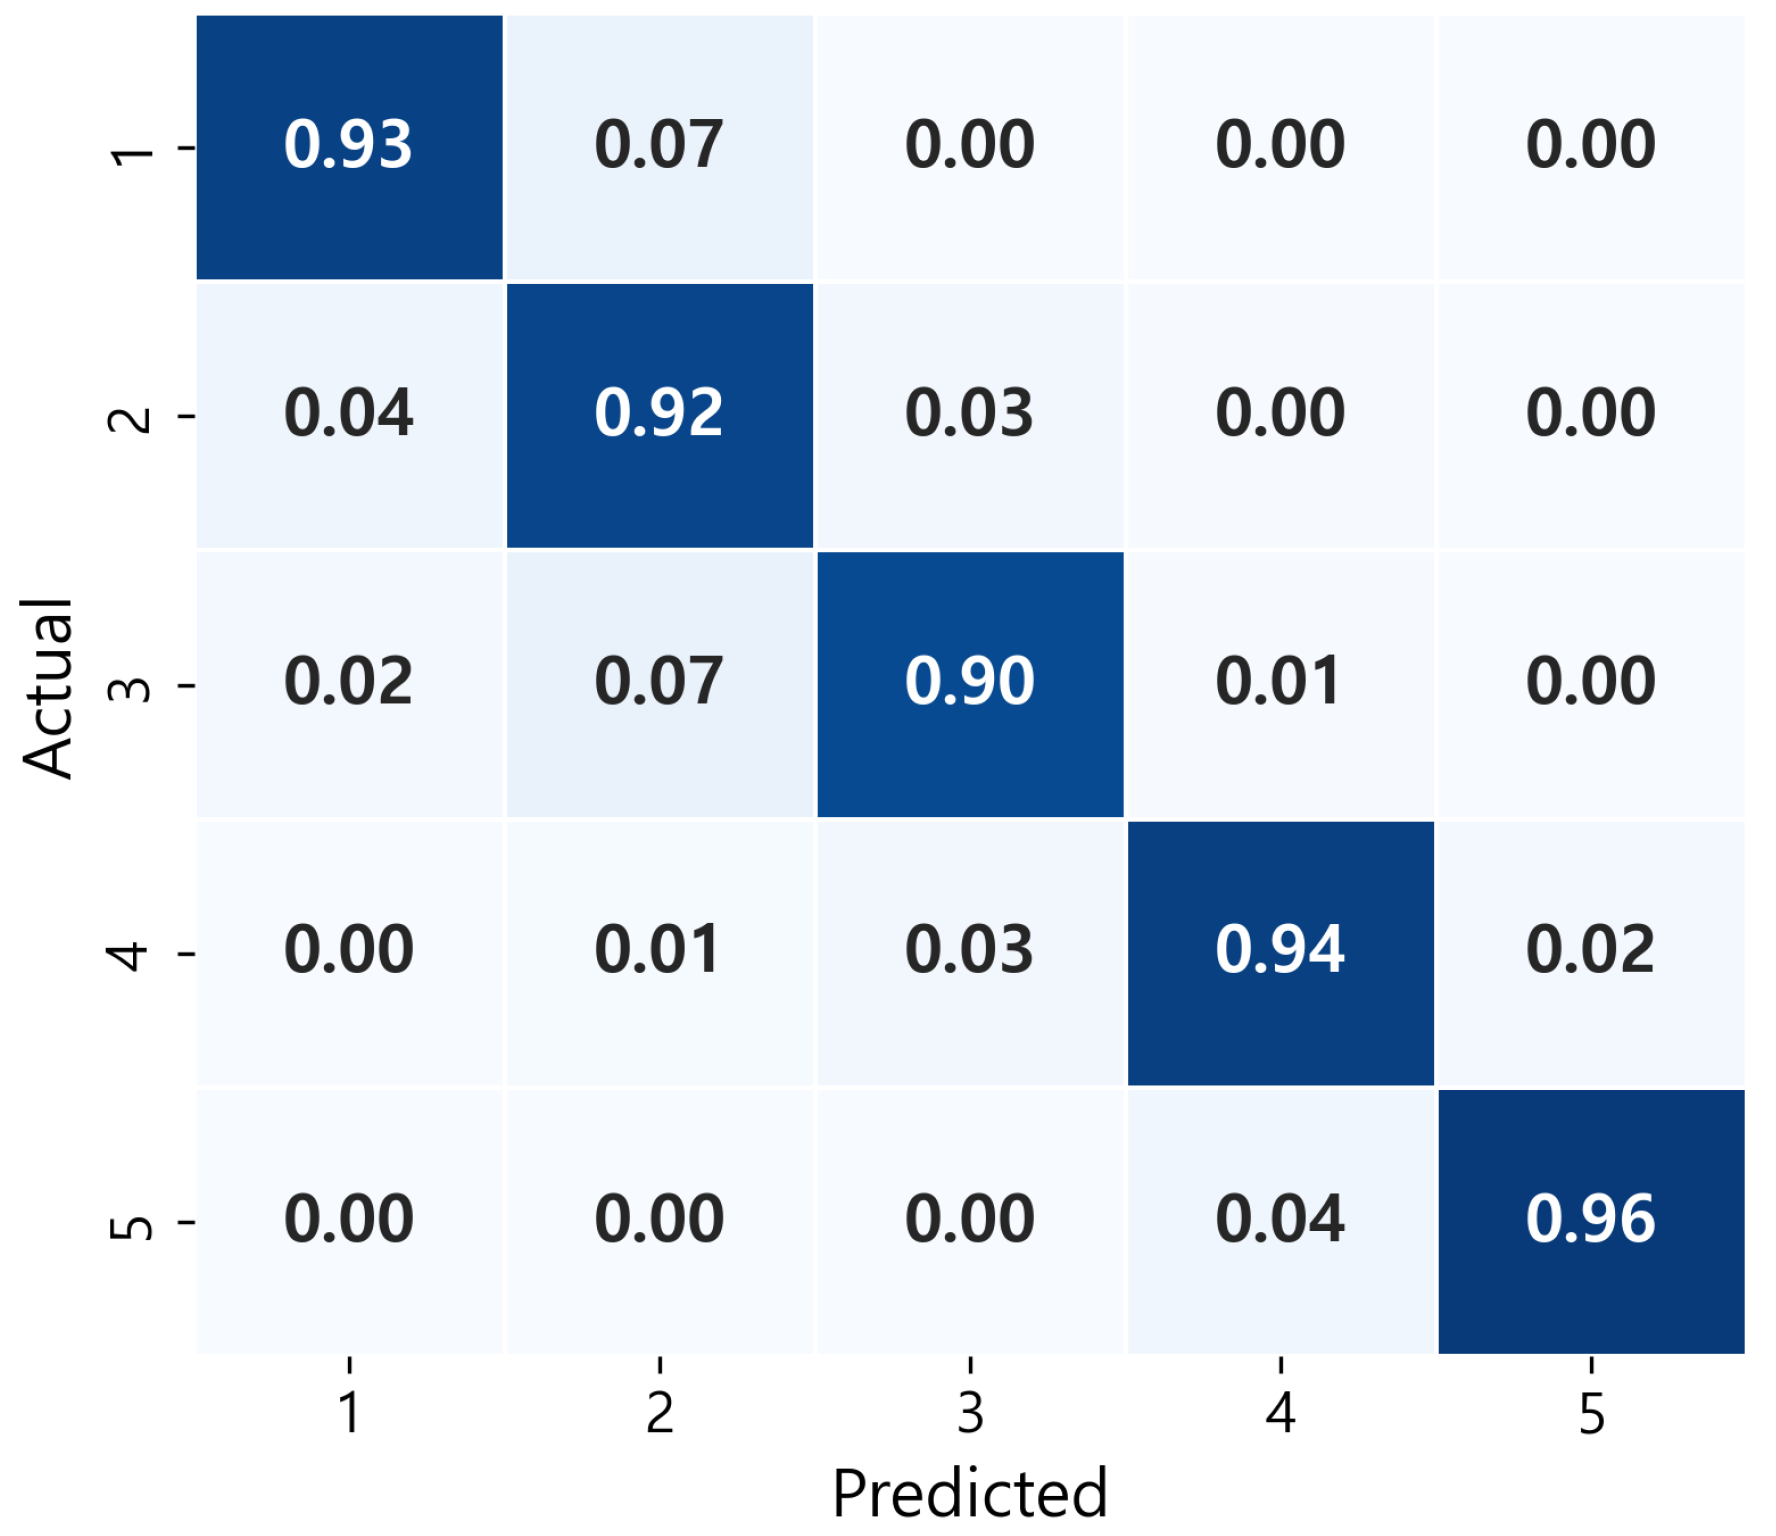
Figure 22.
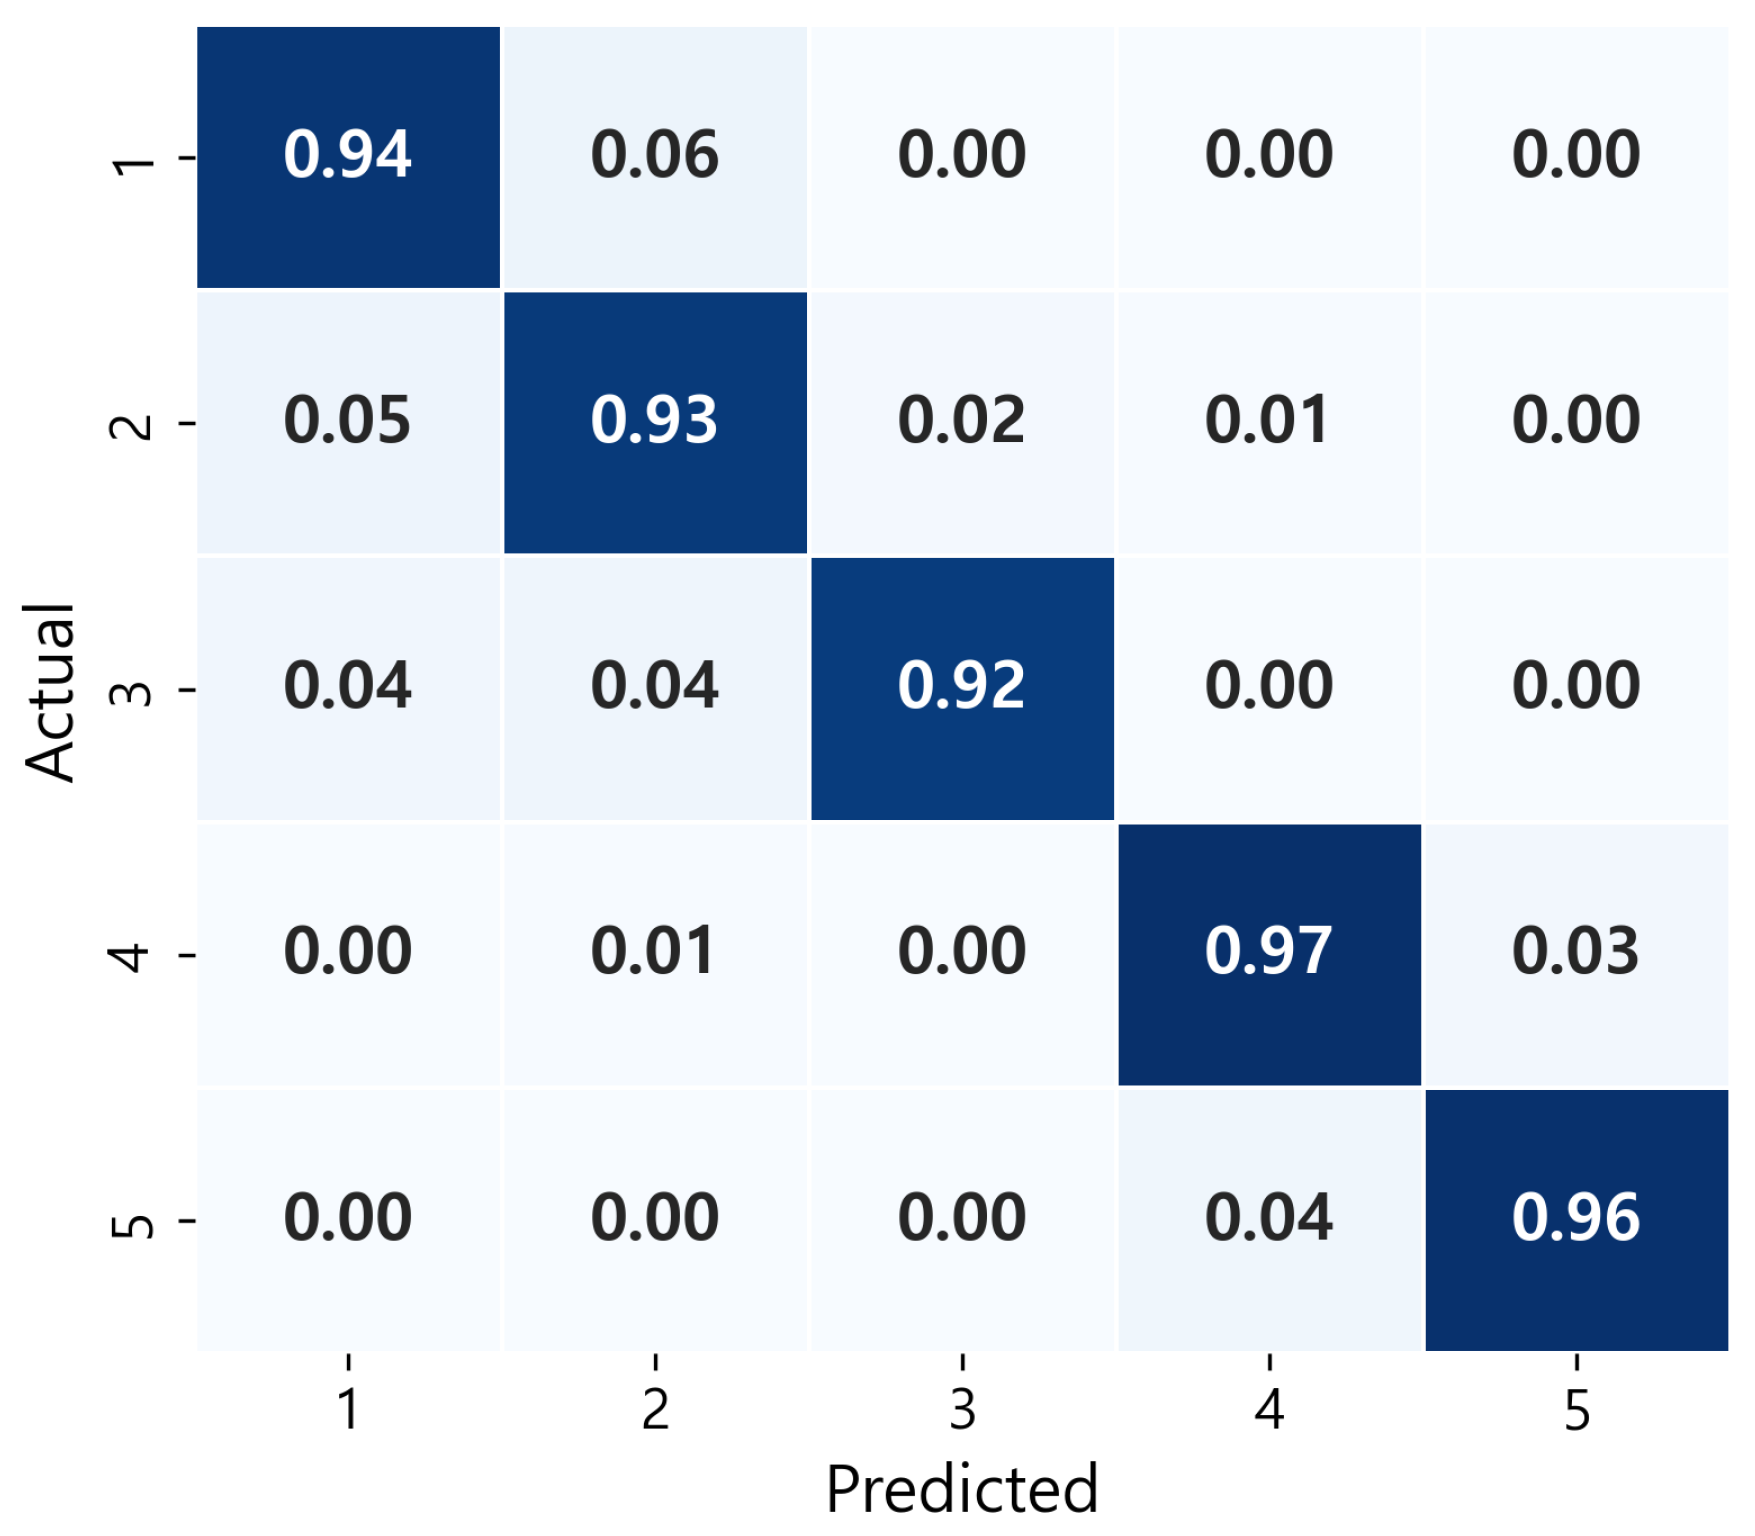
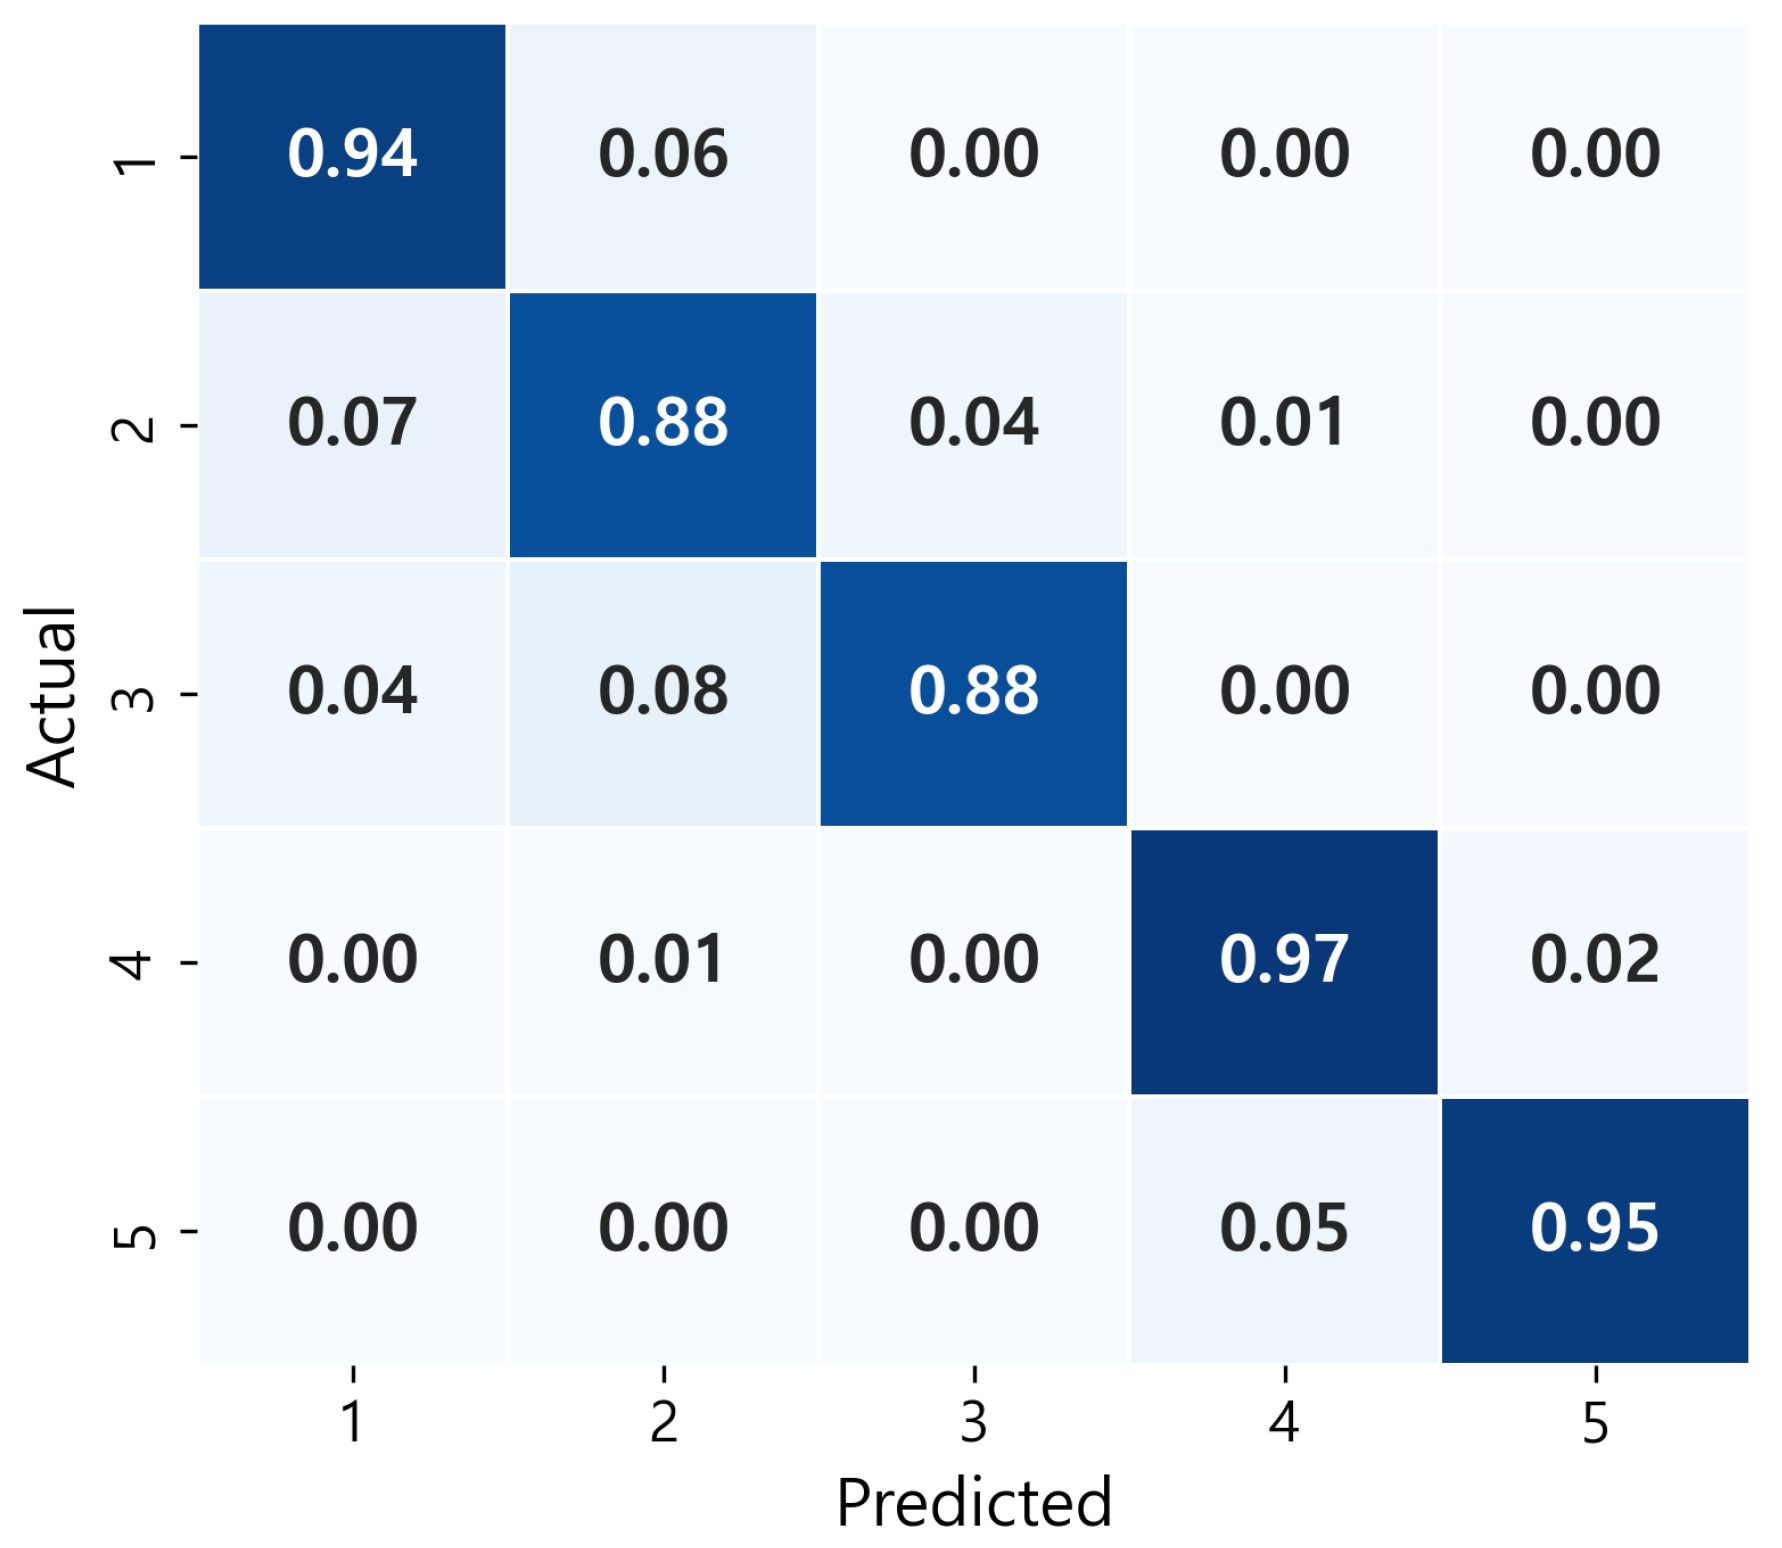
Confusion matrix of the MLP classifier model on the test set (activity intensity Levels 1–5). The color intensity represents the normalized value, where darker shades indicate a higher classification frequency.
Figure 22.
Confusion matrix of the MLP classifier model on the test set (activity intensity Levels 1–5). The color intensity represents the normalized value, where darker shades indicate a higher classification frequency.
Figure 23.
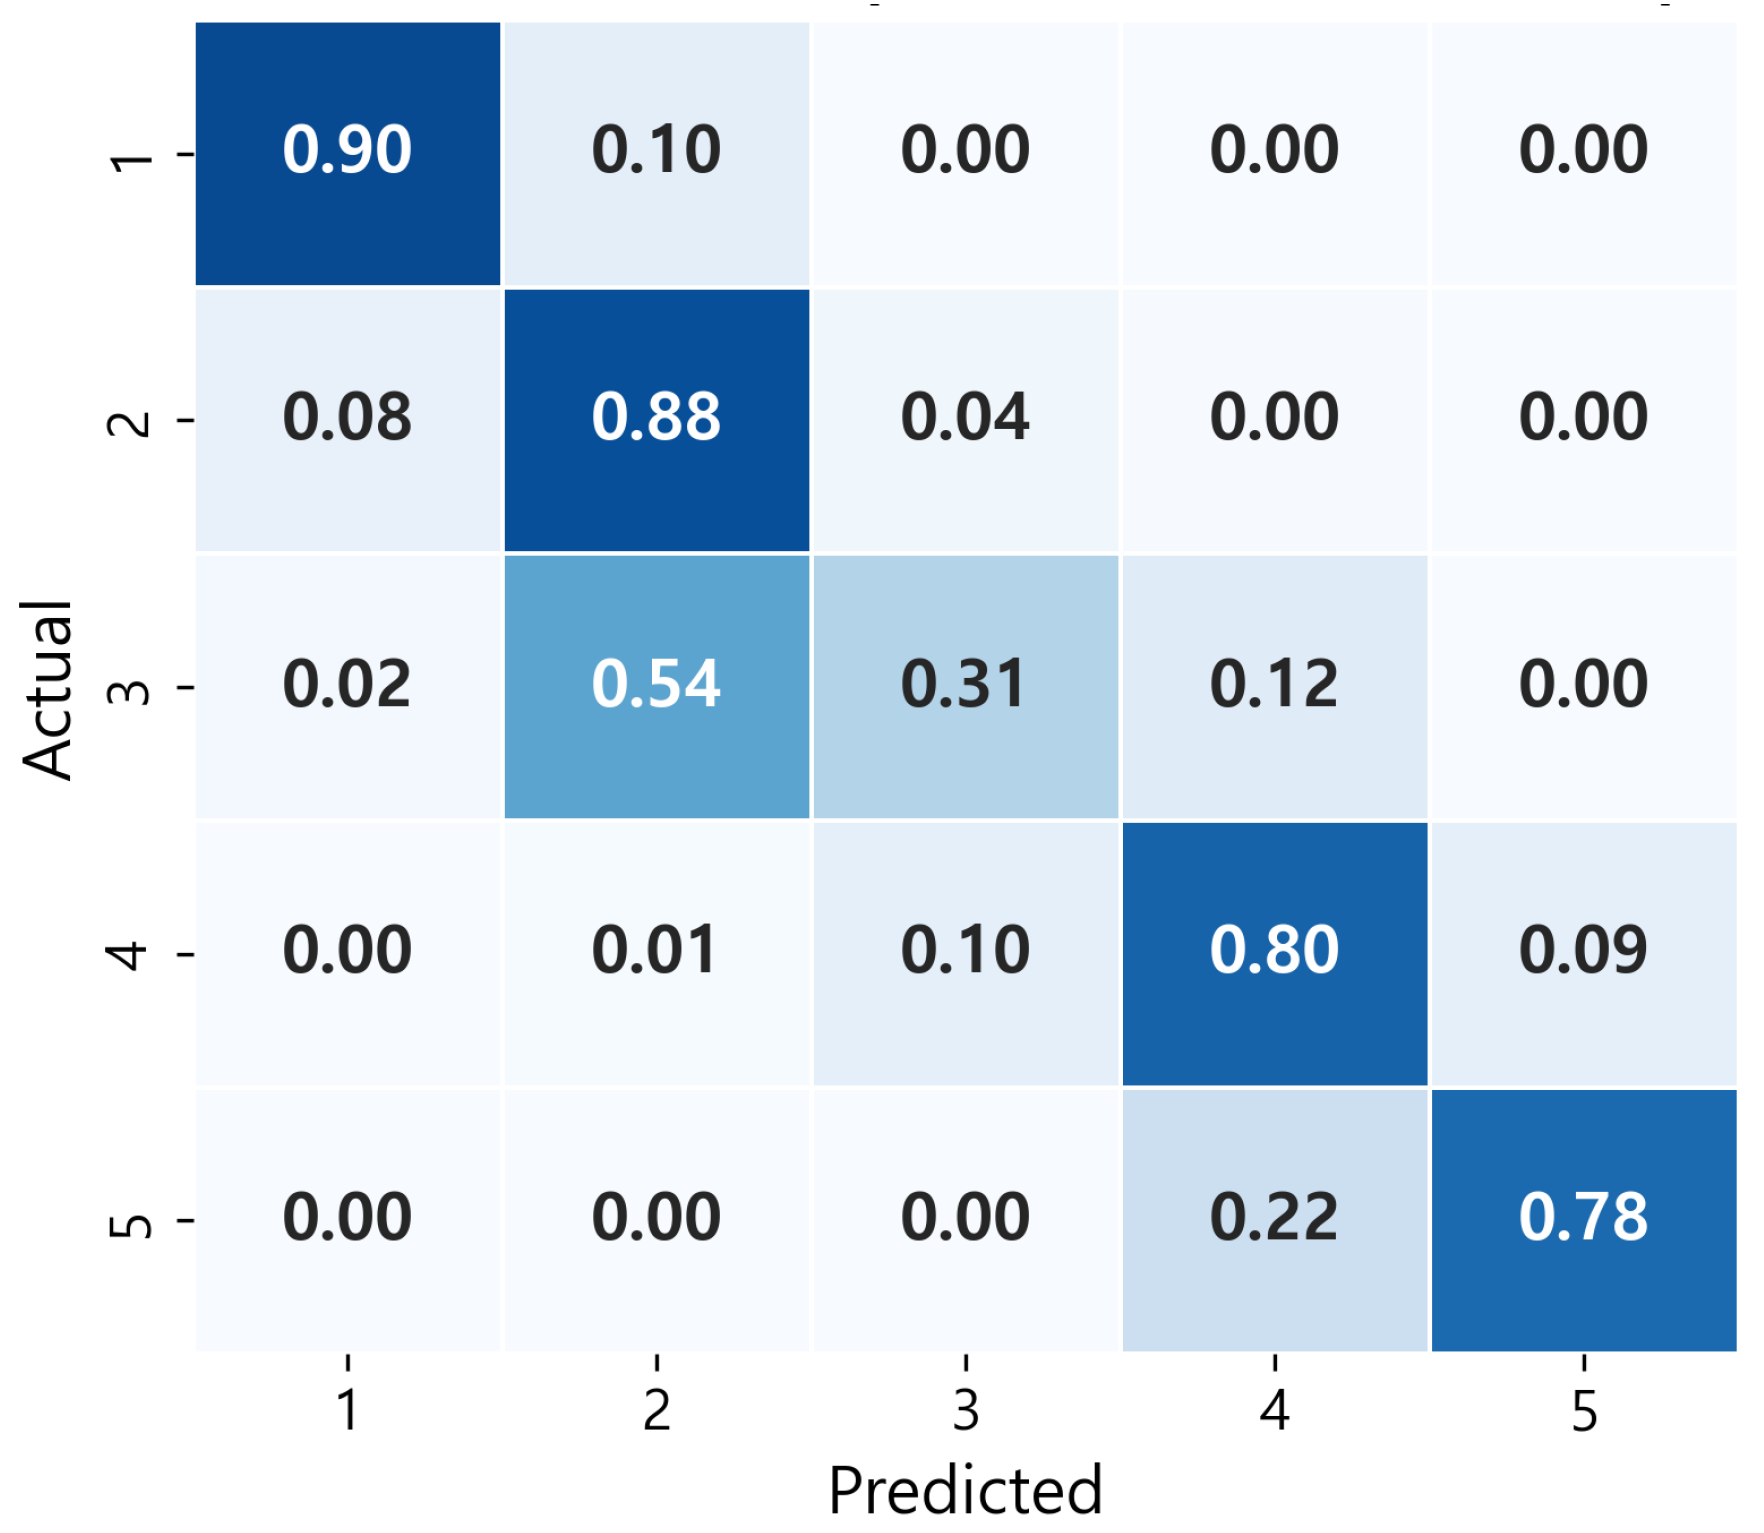
Confusion matrix of the Logistic Regression model on the test set (activity intensity Levels 1–5). The color intensity represents the normalized value, where darker shades indicate a higher classification frequency.
Figure 23.
Confusion matrix of the Logistic Regression model on the test set (activity intensity Levels 1–5). The color intensity represents the normalized value, where darker shades indicate a higher classification frequency.
Figure 24.
Confusion matrix of the Linear Regression model on the test set (activity intensity Levels 1–5). The color intensity represents the normalized value, where darker shades indicate a higher classification frequency.
Figure 24.
Confusion matrix of the Linear Regression model on the test set (activity intensity Levels 1–5). The color intensity represents the normalized value, where darker shades indicate a higher classification frequency.
Figure 25.
Confusion matrix of the MLP regression model on the test set (activity intensity Levels 1–5). The color intensity represents the normalized value, where darker shades indicate a higher classification frequency.
Figure 25.
Confusion matrix of the MLP regression model on the test set (activity intensity Levels 1–5). The color intensity represents the normalized value, where darker shades indicate a higher classification frequency.
Table 1.
Descriptions of activities included in the Dyn-Intensity dataset.
Table 1.
Descriptions of activities included in the Dyn-Intensity dataset.
| Activity | Description |
|---|
| Lying | Lying quietly while doing nothing; small posture changes are allowed. |
| Sitting | Sitting in a chair in a comfortable position; posture changes are allowed. |
| Watching TV | Watching television in a relaxed posture (sitting or lying). |
| Board work | Standing in front of a whiteboard and writing or erasing text; involves moderate forward–backward arm swings. |
| Palm pushing | Pushing forward repeatedly with both palms to simulate resistance or self-defense motion; involves abrupt upper-body acceleration. |
| Dynamic handclap | Clapping hands rapidly with large arm movements; produces strong upper-body motion. |
| Jumping jacks | Performing full-body jumping movements, spreading and closing arms and legs simultaneously. |
| Running | Sprinting for short distances at maximum speed; generates intense whole-body acceleration and impact. |
| Slalom running | Sprinting in a zig-zag pattern between cones or markers; requires rapid direction changes at high speed. |
| Rope jumping | Jumping rope using basic or alternate-foot jumps. |
| Ascending stairs | Walking upstairs between the ground and top floors (five floors total). |
| Descending stairs | Walking downstairs between the ground and top floors (five floors total). |
| User_level5 | Performing extreme resistance or escape-like motion under simulated threat; includes rapid arm swings, pushing, and evasive body movements to represent intense struggle. |
Table 2.
Descriptions of PAMAP2 activities used in this study.
Table 2.
Descriptions of PAMAP2 activities used in this study.
| Activity | Description |
|---|
| Lying | Lying quietly while doing nothing; small posture changes are allowed. |
| Sitting | Sitting in a chair in a comfortable position; posture changes are allowed. |
| Standing | Standing still or while talking, possibly with gestures. |
| Watching TV | Watching television in a relaxed posture (sitting or lying). |
| Computer work | Performing normal office-related computer tasks. |
| Car driving | Driving between the office and home. |
| Ironing | Ironing one or two shirts or T-shirts. |
| Folding laundry | Folding shirts, T-shirts, and bed linens. |
| Vacuum cleaning | Cleaning one or two office rooms, including moving chairs or light furniture. |
| Cycling | Cycling outdoors at a slow to moderate pace, similar to commuting or leisure biking. |
| Walking | Walking outdoors at a moderate to brisk pace (4–6 km/h), comfortable for the subject. |
Table 3.
Five-level intensity mapping of 21 integrated activities constructed from the PAMAP2 and Dyn-Intensity datasets.
Table 3.
Five-level intensity mapping of 21 integrated activities constructed from the PAMAP2 and Dyn-Intensity datasets.
| Level | Description | Activity Classes |
|---|
| Level 1 | Static (P + D) | lying, sitting, standing, watching TV, computer work, car driving |
| Level 2 | Low-intensity daily (P + D) | walking, ironing, folding laundry, vacuum cleaning, board work, ascending stairs, descending stairs |
| Level 3 | Moderate intensity (P + D) | cycling, rope jumping |
| Level 4 | High intensity (D) | palm pushing, dynamic handclap |
| Level 5 | Vigorous/emergency-like (D) | jumping jacks, running, slalom running, user_level5 (emergency-like vigorous motions) |
Table 4.
Summary of the implemented models and their main configurations.
Table 4.
Summary of the implemented models and their main configurations.
| Approach | Model | Key Characteristics | Scaler | Loss/Objective |
|---|
| Non-MLP Approaches |
| | Linear Regression | Second-order polynomial features (interaction only); threshold optimization via validation grid search. | RobustScaler | MSE/QWK
maximization |
| | Logistic Regression | Multinomial Logistic Regression; polynomial features (interaction only). | StandardScaler | Cross-entropy |
| MLP Approaches |
| | MLP (Regression) | Four hidden layers (256–128–64–16); ReLU activation, batch normalization, dropout (0.2–0.3). | Min–Max | Huber () |
| | MLP (Classification) | Three hidden layers (256–128–64); ReLU activation (tanh for last layer), batch normalization, dropout (0.2); softmax output. | StandardScaler | Cross-entropy |
Table 5.
Performance comparison of regression-based models (non-MLP vs. MLP).
Table 5.
Performance comparison of regression-based models (non-MLP vs. MLP).
| Model | MSE | MAE | | QWK |
|---|
| Linear Regression | 0.189 | 0.333 | 0.874 | |
| MLP Regressor | 0.075 | 0.151 | 0.95 | |
Table 6.
Performance comparison of classification-based models (non-MLP vs. MLP).
Table 6.
Performance comparison of classification-based models (non-MLP vs. MLP).
| Model | Accuracy | Precision | Recall | F1 | QWK |
|---|
| Logistic Regression | | 0.917 | 0.924 | 0.92 | |
| MLP Classifier | | 0.94 | 0.943 | 0.941 | |
Table 7.
Per-class performance of the MLP classifier across the five activity intensity levels.
Table 7.
Per-class performance of the MLP classifier across the five activity intensity levels.
| Level | Precision | Recall | F1-Score | Support |
|---|
| 1 | 0.9599 | 0.9423 | 0.9511 | 763 |
| 2 | 0.9040 | 0.9253 | 0.9146 | 509 |
| 3 | 0.9270 | 0.9203 | 0.9236 | 138 |
| 4 | 0.9551 | 0.9659 | 0.9605 | 176 |
| 5 | 0.9524 | 0.9615 | 0.9569 | 104 |
Table 8.
Feature contribution ratios based on the absolute magnitude of model coefficients.
Table 8.
Feature contribution ratios based on the absolute magnitude of model coefficients.
| Feature Group | Linear Regression | Logistic Regression |
|---|
| SVM-based features | 0.3553 | 0.3120 |
| SVM-based features | 0.6447 | 0.6880 |
Table 9.
Permutation importance of representative features in the Logistic Regression model.
Table 9.
Permutation importance of representative features in the Logistic Regression model.
| Feature | Accuracy Decrease |
|---|
| Mean of SVM | 0.4767 |
| Mean of SVM | 0.1312 |
Table 10.
On-device inference performance of the MLP classifier deployed in its quantized TFLite form on the Galaxy Watch 7. The table reports inference latency (p50, p90, p99), peak memory usage, and model size under the default XNNPACK CPU delegate.
Table 10.
On-device inference performance of the MLP classifier deployed in its quantized TFLite form on the Galaxy Watch 7. The table reports inference latency (p50, p90, p99), peak memory usage, and model size under the default XNNPACK CPU delegate.
| Configuration | p50 (ms) | p90 (ms) | p99 (ms) | Peak Memory (MB) | Model Size (MB) |
|---|
| XNNPACK (default) | 0.038 | 0.073 | 0.226 | 50.38 | 0.088 |
Table 11.
Performance comparison between the original test set and real-time subject-independent validation (MLP classifier). Unseen participants performed representative activities across all five intensity levels.
Table 11.
Performance comparison between the original test set and real-time subject-independent validation (MLP classifier). Unseen participants performed representative activities across all five intensity levels.
| Evaluation Setting | Accuracy | QWK |
|---|
| Original Test Set | 0.939 | 0.971 |
| Real-Time Unseen Subjects | 0.952 | 0.988 |
Table 12.
End-to-end (decision) latency of the non-MLP classification pipeline on the Galaxy Watch 7. This table reports the total latency including the fixed 6 s processing window, thus focusing on overall pipeline delay rather than resource consumption.
Table 12.
End-to-end (decision) latency of the non-MLP classification pipeline on the Galaxy Watch 7. This table reports the total latency including the fixed 6 s processing window, thus focusing on overall pipeline delay rather than resource consumption.
| Scenario | E2E (p50, ms) | E2E (p90, ms) | E2E (p99, ms) |
|---|
| Real-time monitoring | 6014.5 | 6020.3 | 6070.0 |