1. Introduction
EIT represents a non-invasive imaging modality based on the injection of low-amplitude electrical currents and the measurement of boundary voltages to reconstruct the spatial distribution of electrical properties within a conductive medium. Unlike computed tomography (CT), which relies on ionizing radiation and large-scale imaging systems, Electrical Impedance Tomography infers internal electrical properties from boundary voltage measurements and is primarily used as a functional and monitoring modality rather than a standalone diagnostic imaging tool. Owing to its safety, low cost, and suitability for real-time and portable implementations, EIT has attracted growing interest in biomedical sensing and medical diagnostics [
1,
2,
3]. Recent advances in biomedical EIT research have demonstrated the feasibility of real-time imaging, wearable sensing, and AI-enhanced reconstruction frameworks, highlighting the growing relevance of system-level electronic architectures for impedance-based sensing modalities [
4]. In recent years, the application of EIT to various clinical areas has delineated an important application boundary for lung monitoring, functional brain imaging, tissue perfusion assessment, and the detection of pathological anomalies in biological tissues [
5,
6,
7,
8]. The development of advanced computational models and miniaturised electronic systems has made it possible to integrate EIT into wearable and point-of-care devices, significantly expanding the potential applications in the biomedical field [
9,
10,
11]. Hybrid modelling strategies combining deterministic physics-based simulations with statistical optimisation and artificial intelligence techniques have demonstrated improved robustness and parameter sensitivity analysis in biomedical electronic monitoring systems, supporting the integration between numerical modelling and system-level design [
12]. Hybrid FEM-AI frameworks can significantly improve robustness, parameter sensitivity, and anomaly detection capabilities in biomedical sensing systems [
13,
14]. Notable advantages include the non-invasive aspect of EIT, the total absence of ionizing radiation, and the facility for continuous acquisition of data in real time [
15]. In addition, the high electrical contrast that exists between different tissues of the body also allows EIT to function even in conditions where the sensitivity of other modalities is low [
16,
17]. However, there are a number of scientific and technological challenges that EIT is facing. The low spatial resolution of EIT, the ill-posed inverse problem, and the strong dependence on parameters related to the electrode configuration have constrained the clinical application of EIT [
18,
19,
20]. Recent studies have also indicated that the electrode configuration, the manner of current injection, and the method of voltage measurement have a significant influence on the sensitivity of EIT [
21,
22,
23]. The electronic noise, the inter-subject variation in the electrical properties of tissues, and the complex geometry of the human body have also added to the difficulties in the development of EIT systems [
24,
25]. In this context, the optimisation of electrode configurations and excitation strategies represents a primary research topic in the field of biomedical electronics. Recent works have explored various electrode topologies, current injection schemes, and acquisition architectures to improve the sensitivity and robustness of EIT systems [
26,
27,
28]. In previous investigations, tomographic impedance modelling has been applied to neoplastic inclusion detection through engineering-driven optimisation strategies, highlighting the importance of excitation protocols and forward model accuracy in improving anomaly detectability [
29]. Systematic reviews and meta-analyses have confirmed the potential of EIT for cancer detection and three-dimensional localisation of breast and epithelial tumours, highlighting its relevance as a non-invasive diagnostic modality [
30]. Compared with our previous two-dimensional investigations, the present work extends the framework toward a fully three-dimensional heterogeneous model, introduces statistical robustness validation through Monte Carlo analysis, and integrates system-level electronic design considerations within the same methodological workflow. However, most existing studies focus on two-dimensional models or specific applications, while complete three-dimensional analyses remain relatively limited due to the high computational cost and the complexity of the problem. Unlike previous studies, a realistic heterogeneous three-dimensional model is developed, and the system’s sensitivity is evaluated in terms of impedance contrast, detectability of conductivity anomalies, and potential integration into biomedical electronic systems. Furthermore, an electronic section is designed for current injection and voltage acquisition, with the aim of supporting future hardware implementations and low-cost biomedical sensing devices. In order to eliminate these shortcomings, this study presents a three-dimensional FEM framework for comparative evaluation of various electrode excitation methods in EIT, especially for adjacent and opposite methods. Although electrode optimization has been extensively investigated in two-dimensional domains, systematic three-dimensional analyses explicitly integrating forward modelling assumptions with acquisition hardware abstraction remain limited. In particular, most existing studies either focus on reconstruction algorithms or treat excitation strategy independently from system-level electronic constraints. This gap motivates a coherent modelling approach that preserves consistency between numerical assumptions and prospective hardware implementation. Unlike most existing studies, which primarily rely on two-dimensional models or isolate numerical analysis from hardware considerations, the proposed approach integrates realistic three-dimensional forward modelling with system-level electronic acquisition design. This co-design strategy enables a consistent evaluation of sensitivity and detectability under realistic biological and instrumental conditions. In contrast to purely reconstruction-oriented studies, the present contribution emphasises excitation strategy optimisation and system-level coherence between forward modelling assumptions and electronic acquisition architecture.
2. Methodology
This section describes the proposed methodology for the three-dimensional modelling of EIT in the field of biomedical sensing. The proposed methodology includes (i) the definition of the multilayer skin model, (ii) electrode configuration, (iii) finite element method formulation using solver open-source, and (iv) electronic acquisition chain design. The proposed methodology will provide a basis for evaluating the effectiveness of the proposed electrical impedance tomography system in a three-dimensional model.
2.1. Multilayer Skin Model
The first phase of the proposed methodology involves the definition of a multilayer skin model, including the stratum corneum, epidermis, and dermis, according to established literature on bioelectric phenomena [
31]. The multilayer model allows for realistic simulation of electric current propagation and electric potential distribution, considering the electrical discontinuity between adjacent layers of skin. The EIT forward model simulates the propagation of low-frequency electric currents through human skin, considering their conductive and dielectric properties. To ensure physiological plausibility and numerical consistency, electrical and geometric parameters were selected from validated experimental studies and standardised at a reference frequency of 50 kHz, which is commonly adopted in biomedical EIT applications to balance penetration depth and measurement stability. A preliminary frequency sensitivity analysis at 10 kHz, 50 kHz, and 100 kHz was performed to evaluate the robustness of the selected operating point. While multi-frequency Electrical Impedance Tomography can provide spectroscopic information, the focus here was on the effect of electrode configuration alone, achieved by using a fixed frequency. The results suggest that 50 kHz strikes the right balance between penetration depth, stability of impedance contrast, and the minimization of the impact of electrode polarization artifacts, thus validating the choice of the operating frequency. The adopted tissue properties, including layer thickness, electrical conductivity, and relative permittivity, are summarised in
Table 1 and selected to ensure numerical stability while preserving sensitivity to realistic conductivity contrasts. The selected electrical properties ensure numerical stability while preserving sufficient sensitivity to conductivity contrasts in the presence of realistic biological variability. The range of conductivity values used corresponds to the range of variation reported in epithelial and dermal tissues in pathological states. Although absolute values may vary with individuals and with measurement frequency, the relative conductivity values used for healthy and neoplastic tissues remain within experimentally reported limits, thereby ensuring physical realism of the simulation.
As reported in
Table 1, the stratum corneum exhibits significantly lower electrical conductivity compared to the underlying layers, acting as a barrier to current flow, whereas the dermis shows higher conductivity values, favouring current propagation.
The neoplastic inclusion is modelled as a region with increased electrical conductivity compared to surrounding healthy tissues, consistent with reported bioelectric properties associated with higher water content and increased cellular density in neoplastic regions. According to
Table 1, the range of conductivity of an inclusion, representing a neoplasm, varies between 0.4 and 1.0 S/m, thus describing different types of pathologic changes.
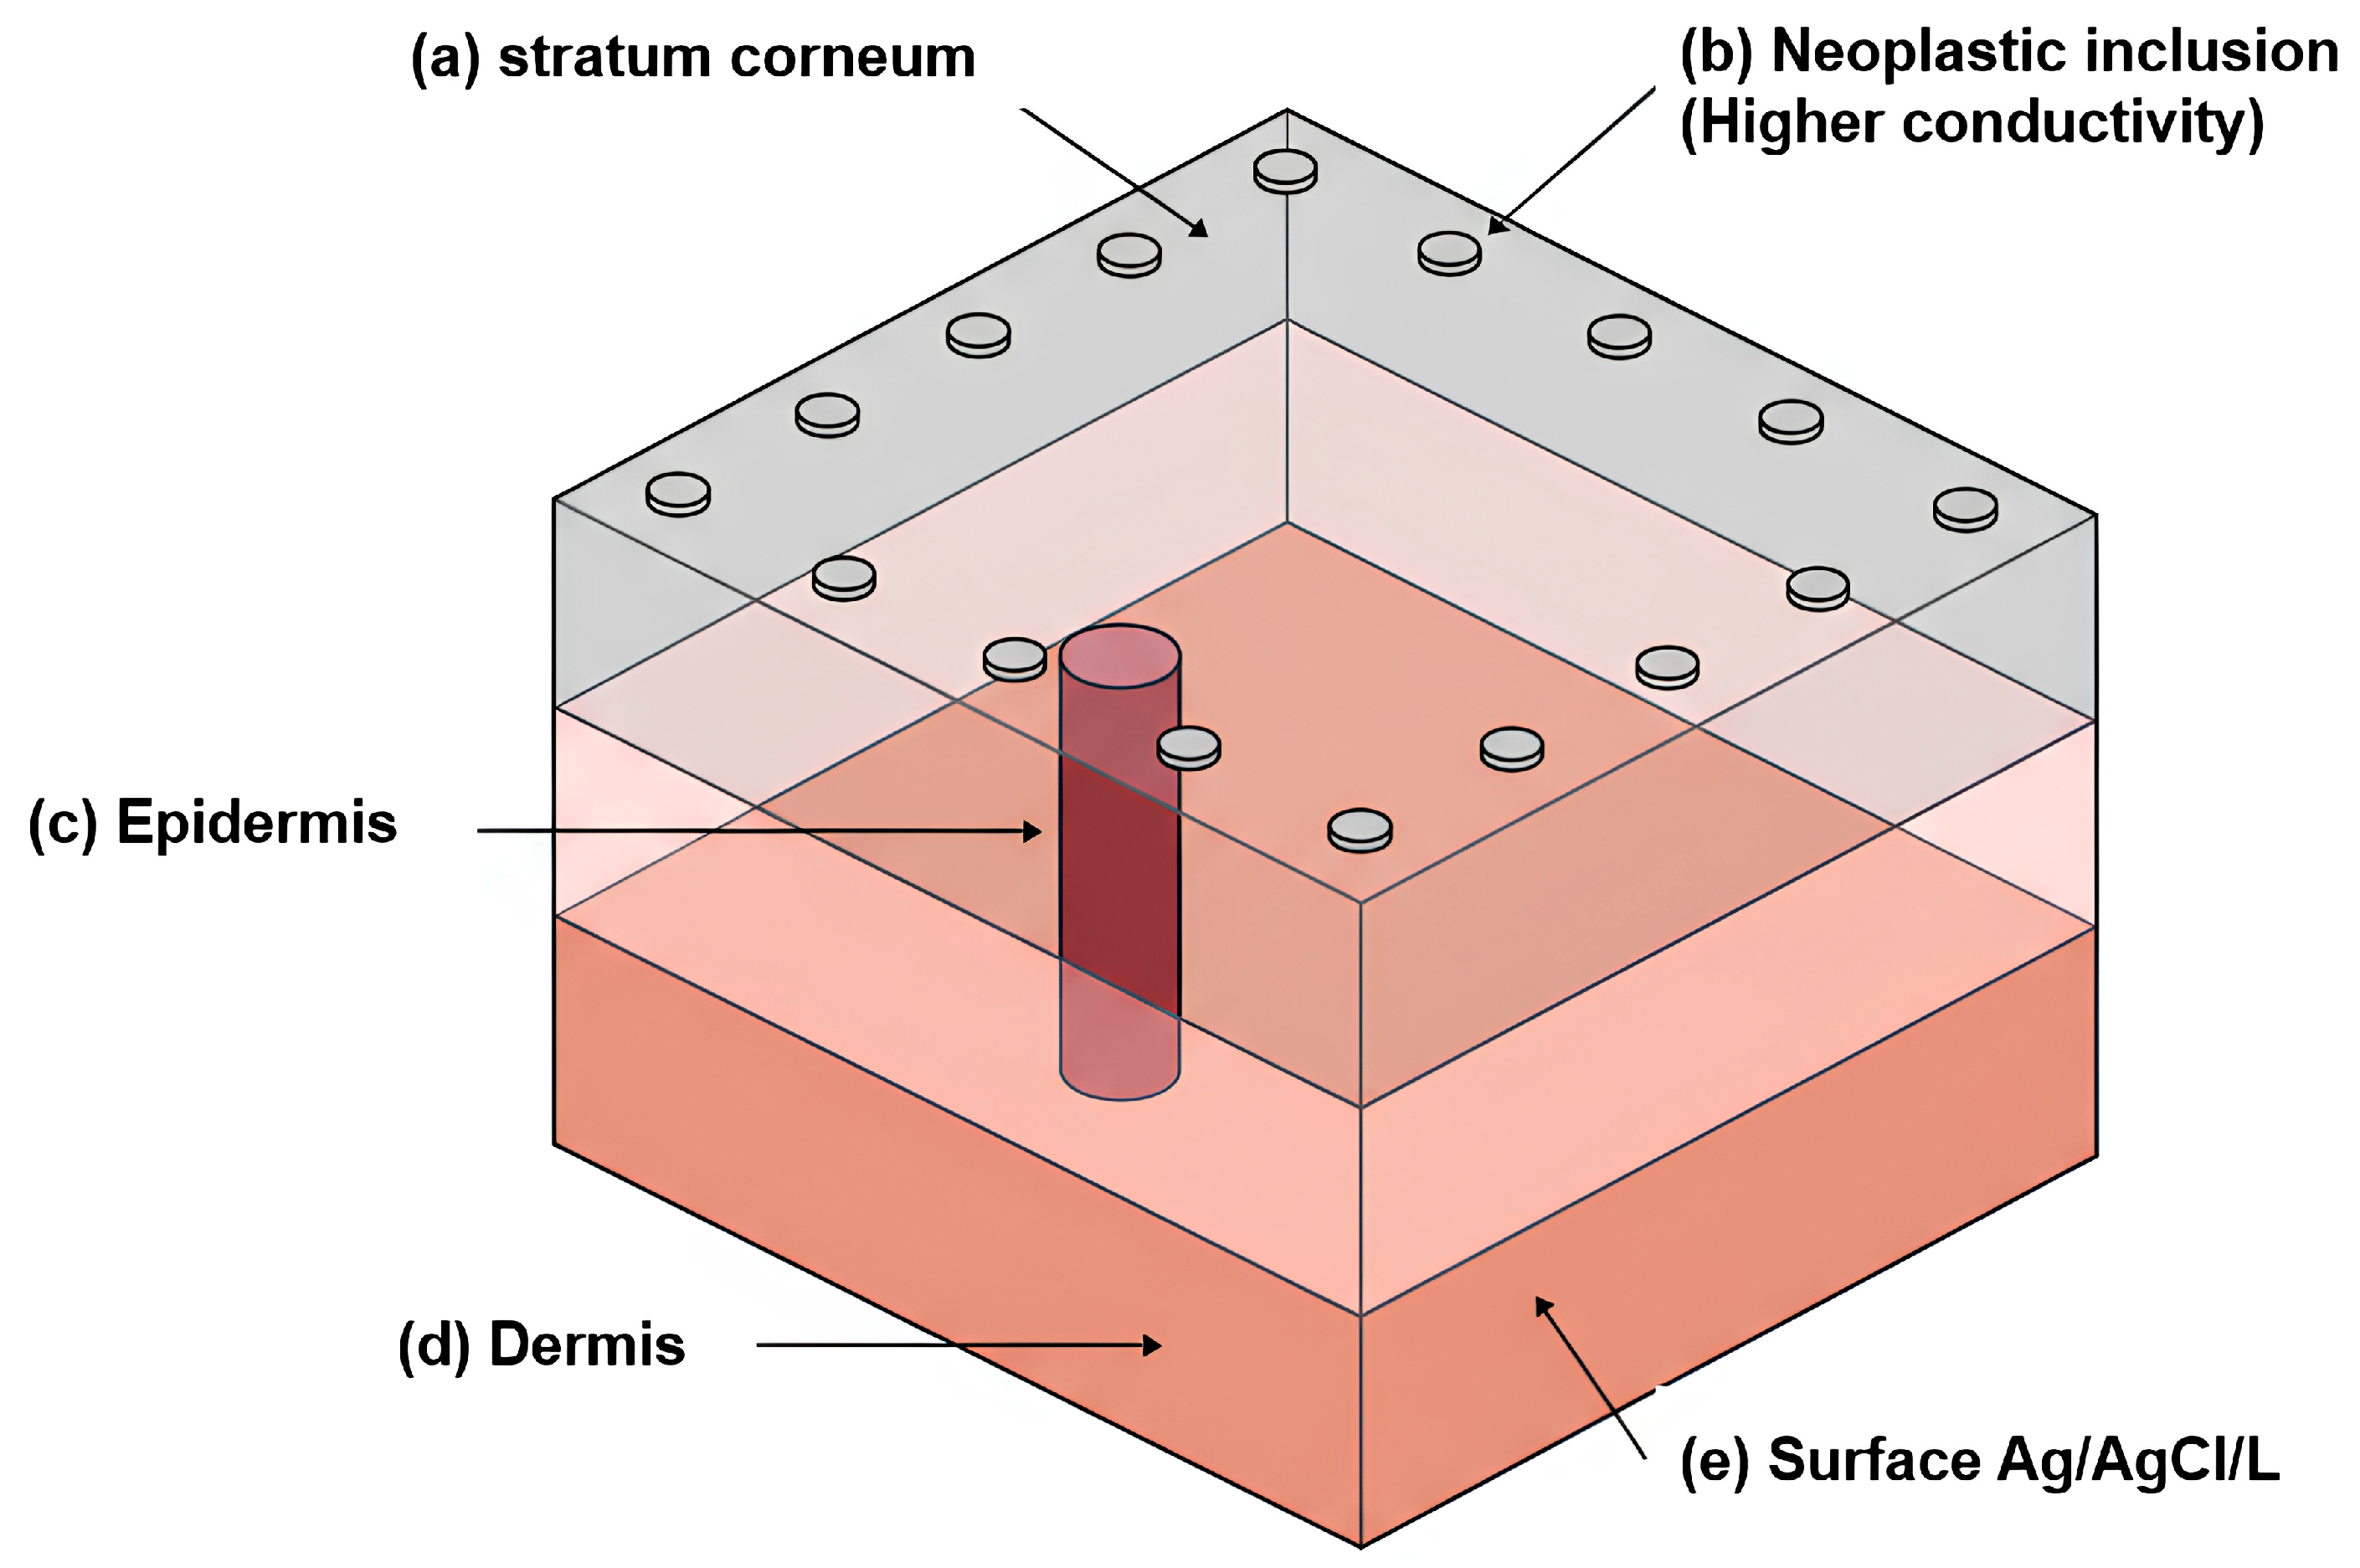
Figure 1 illustrates the three-dimensional multilayer skin model adopted for the numerical simulations, including the stratified skin layers and an embedded conductive inclusion representing a neoplastic region. The heterogeneous electrical properties assigned to each layer enable a realistic assessment of current propagation and sensitivity within a three-dimensional biological domain.
2.2. Domain Geometry and Electrode Configuration
The three-dimensional computational domain is defined as a parallelepiped volume representing a localised portion of skin tissue, with overall dimensions of 80 mm × 30 mm × 10 mm.
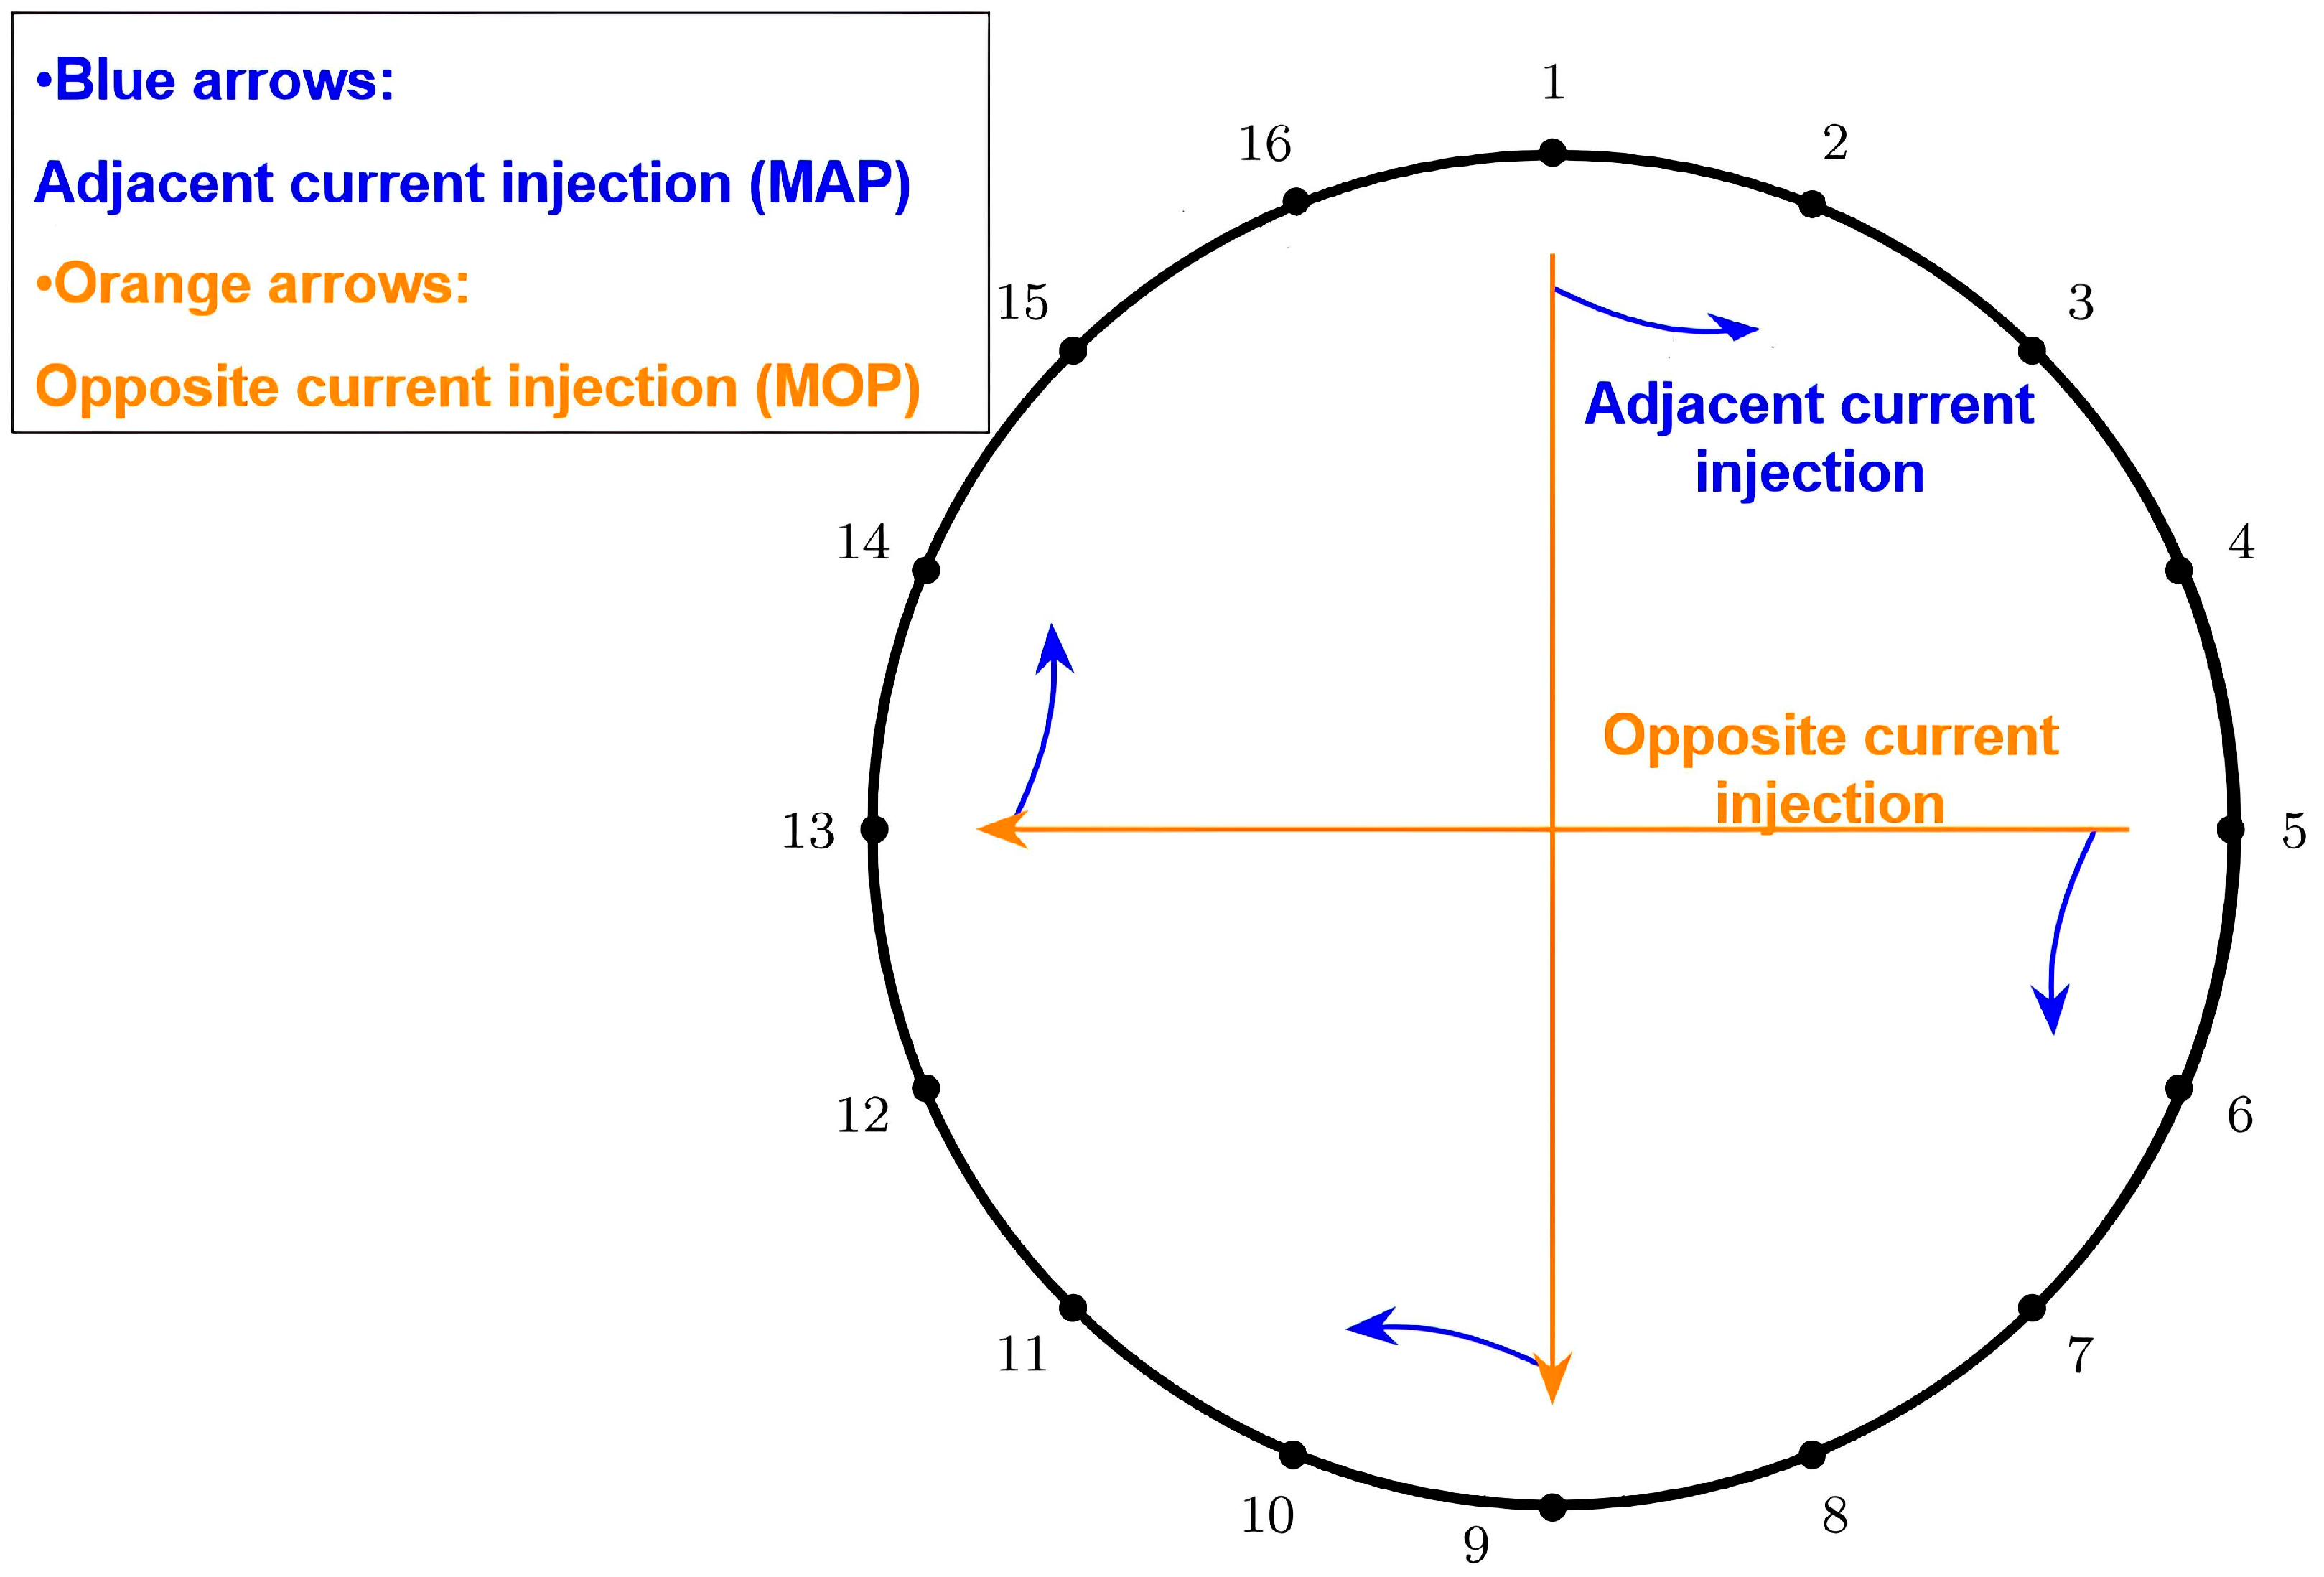
Each of the electrodes has a circular shape and lies on the upper surface of the rectangular parallelepiped domain. The circular shape only refers to the shape of each of the electrodes and cannot be interpreted to mean a circular or cylindrical domain. The electrodes are evenly distributed around the edges of the rectangular upper surface of the domain, and the circular shape of the electrodes is shown diagrammatically in
Figure 2.
These dimensions ensure inclusion of the full thickness of the modelled skin layers while minimising boundary-related artefacts and edge effects during numerical simulations. The main geometrical parameters of the computational domain and electrode array are summarized in
Table 2.
A total of 16 uniformly spaced surface electrodes, each with a diameter of 2 mm and made of Ag/AgCl, were considered and modelled as ideal conductors. The choice of sixteen electrodes represents a compromise between spatial sensitivity, measurement redundancy, and system complexity. This number provides a sufficient set of independent voltage measurements for three-dimensional sensitivity analysis while remaining compatible with realistic multi-channel EIT acquisition hardware. For a given configuration using 16 electrodes, the total count of independent voltage measurements per given current injection pattern is (N-3), i.e., 13 measurements per excitation pattern. This complies with established principles in conventional EIT measurement theory and suffices to ensure adequate redundancy for comparative sensitivity analysis while keeping hardware complexity reasonable. This electrode configuration represents a trade-off between achievable spatial resolution, computational complexity, and practical hardware realisability, consistent with typical biomedical EIT system constraints. Two excitation strategies were considered: the Method of Adjacent Potentials (MAP), where current is injected between neighbouring electrodes, and the Method of Opposite Potentials (MOP), where excitation is applied across diametrically opposite electrodes. These configurations were selected to enable a systematic comparison of sensitivity distribution and impedance contrast in three-dimensional EIT models. For both excitation strategies, voltage measurements were acquired on the remaining electrodes according to standard EIT protocols, ensuring consistency in data acquisition and enabling a fair comparison between the two configurations. The uniform distribution of electrodes on the tissue surface ensures symmetry in current injection and voltage acquisition, providing a consistent basis for the comparative analysis of adjacent and opposite excitation strategies.
Figure 2 provides a schematic top view of the surface electrode arrangement and excitation patterns adopted in this study.
The rectangular shape of the computational domain governs current propagation, while the circular electrode geometry affects only the local current injection area at the electrode–tissue interface.
The parallelepiped domain represents a localised portion of skin tissue, while the 16 Ag/AgCl surface electrodes are uniformly distributed on the top surface according to the selected excitation strategies. In the MOP configuration, the electric field distribution extends more uniformly into the domain, promoting improved volumetric sensitivity at the expense of reduced superficial voltage amplitudes compared to the MAP strategy.
Figure 2 provides a schematic representation of the electrode numbering and excitation patterns adopted in this study.
The adjacent and opposite current injection strategies are illustrated to clarify the differences in current paths and sensitivity distribution prior to three-dimensional FEM simulations.
2.3. FEM Formulation
The forward problem in EIT is based on the quasi-static approximation to Maxwell’s equations. This is valid for low-frequency electrical stimulation in biological tissues, since the rate of wave propagation is so high that the effects can be neglected. In this case, the electric field is curl-free, i.e., it is the gradient of some scalar potential function (1).
The steady-state distribution of the electric potential is determined by the equation, which includes the spatially varying conductivity distribution, denoted by the function
σ(
r). To describe the phenomenon on the surface, boundary conditions are specified, describing the injection of currents through the electrodes and the measurement of voltages formulated in (2).
where
I is the injected current amplitude and
n is the outward unit normal vector.
Although simulations were carried out in the frequency domain at 50 kHz, the governing equation was formulated under a purely conductive quasi-static approximation. The displacement current term was neglected, and tissue permittivity values were included only to ensure numerical consistency and to document physiological properties, without contributing to a complex admittivity formulation. At the selected frequency, conduction currents dominate over capacitive effects in skin tissues, and the resulting voltage distributions remain primarily governed by conductivity contrasts.
A quantitative comparison between conductive and displacement current densities was performed using representative tissue parameters at 50 kHz. The ratio |Jcond/Jdisp| exceeded 15 in all layers, confirming the dominance of conductive currents under the selected operating conditions. This supports the validity of the purely conductive quasi-static approximation for the comparative purposes of this study.
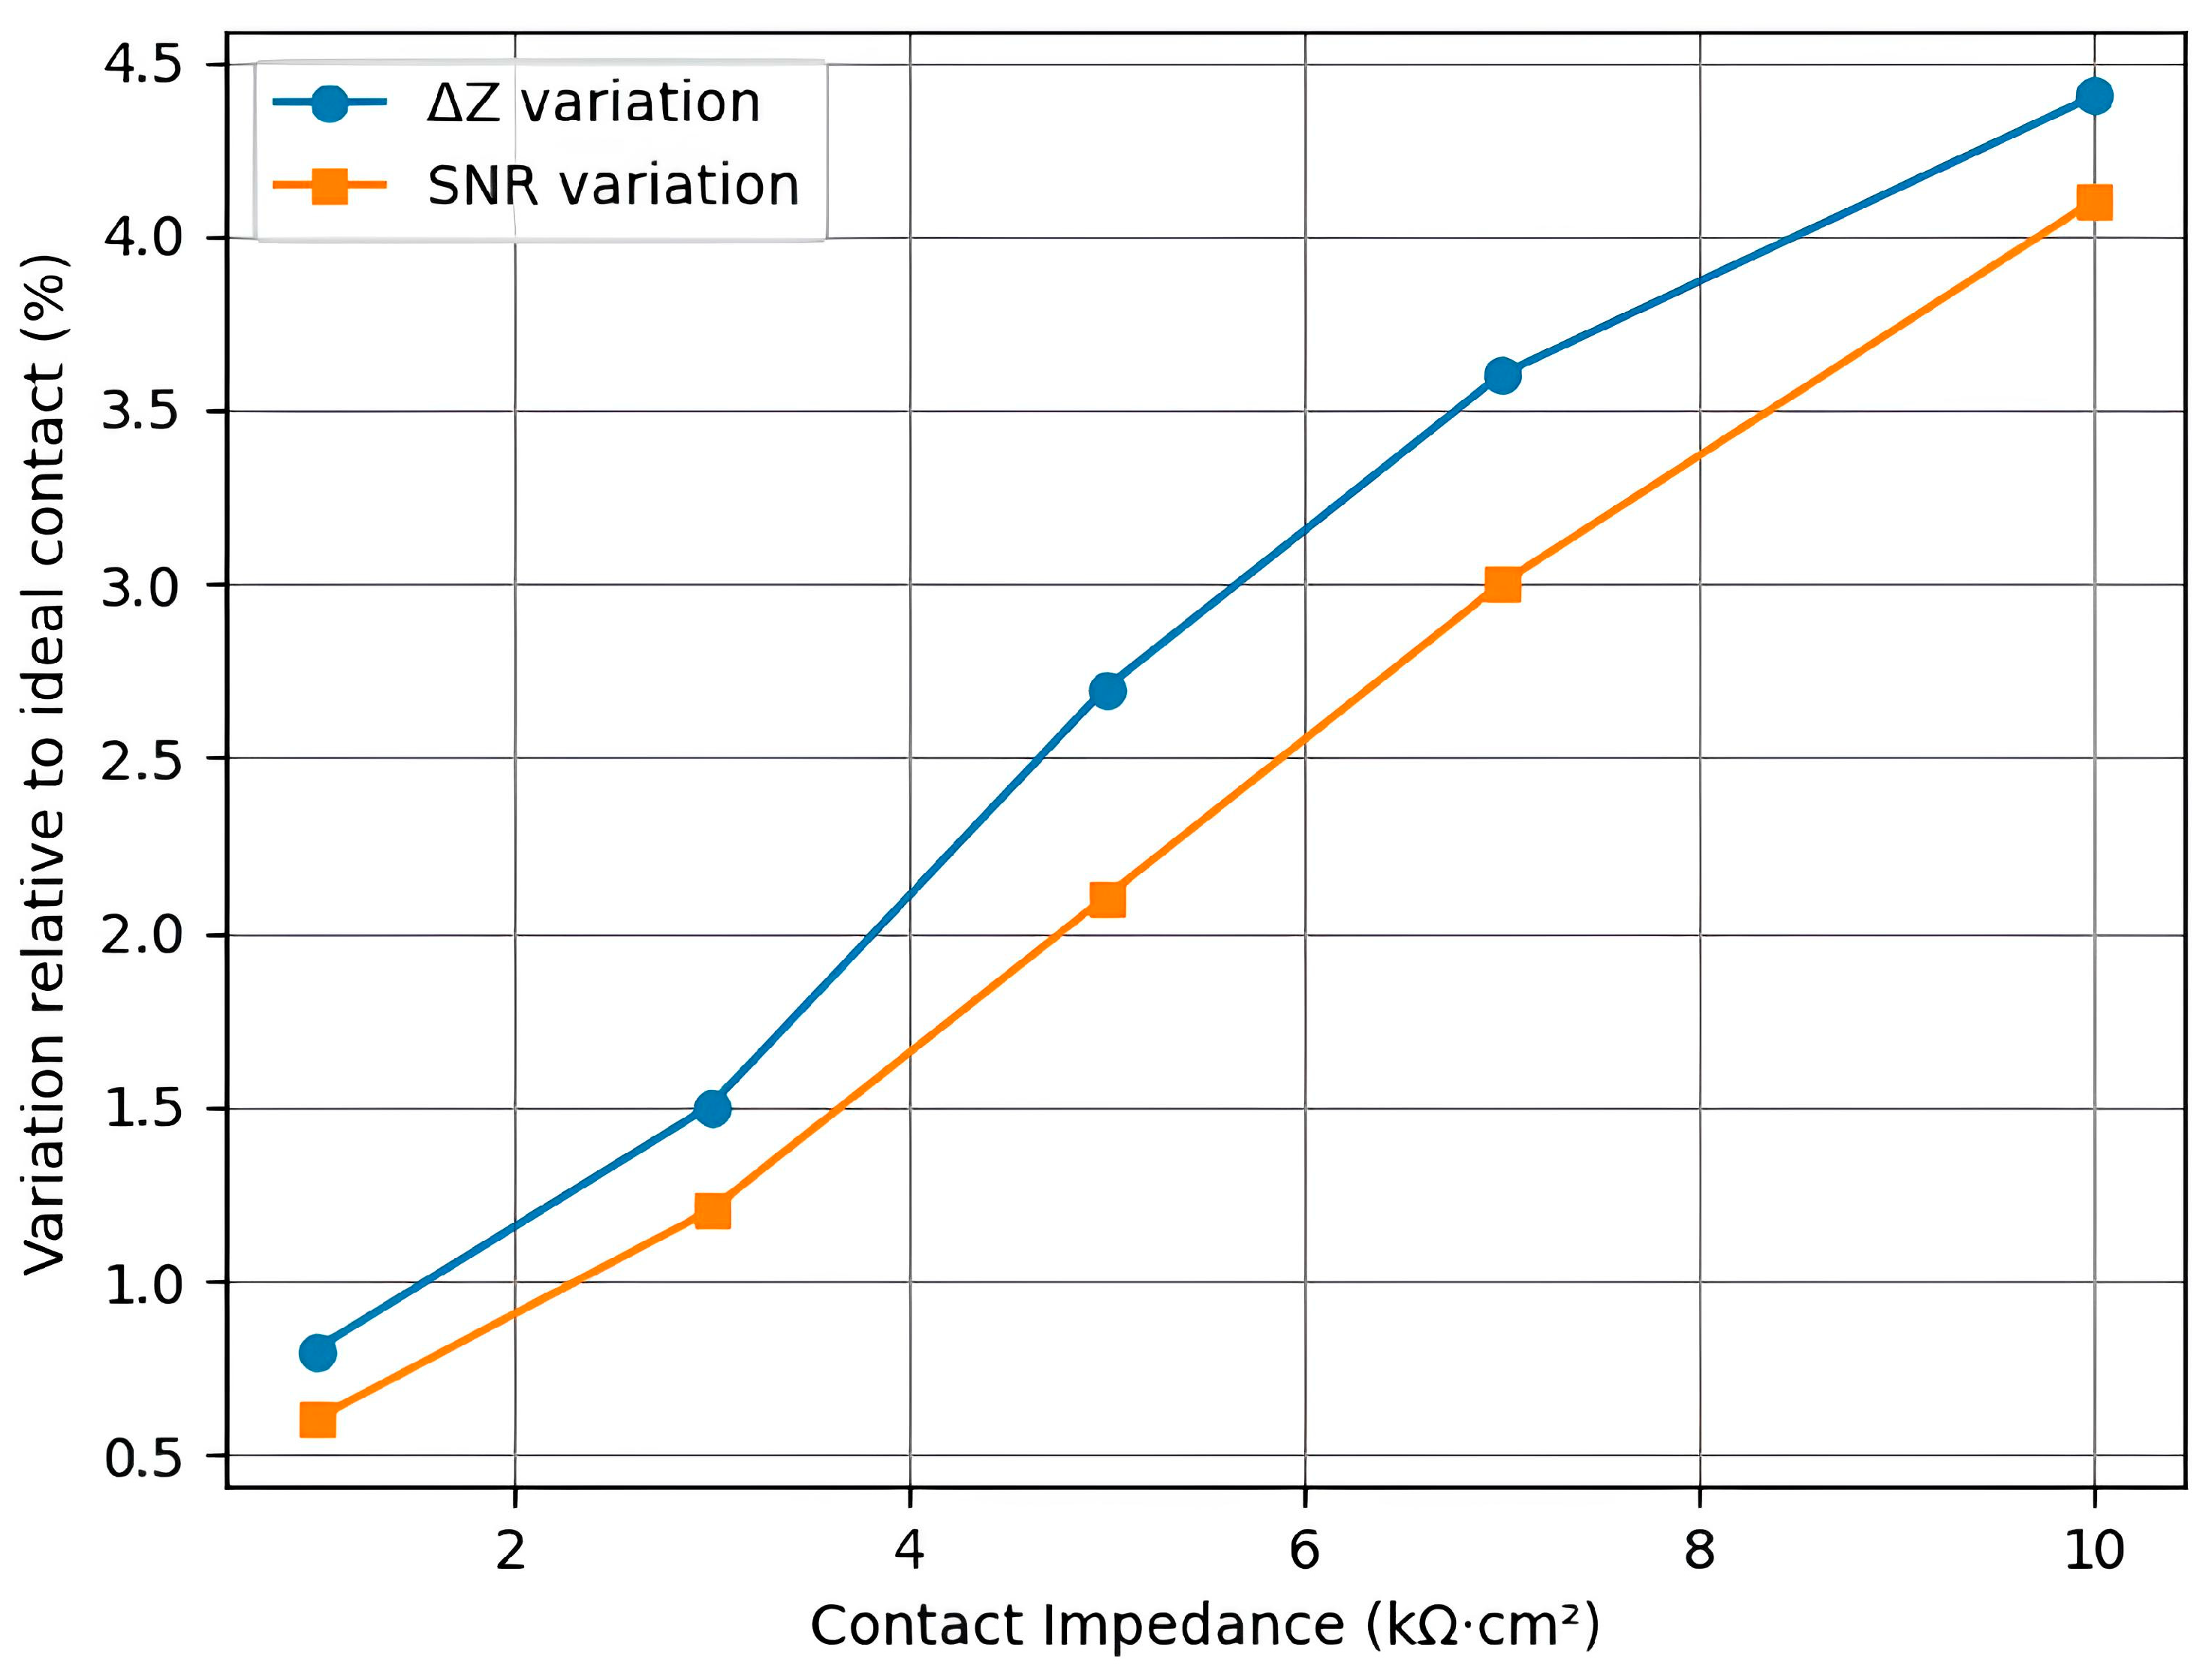
A full complex admittivity model is therefore outside the scope of the present comparative analysis but represents a relevant extension for future multi-frequency studies. The passive electrodes are considered floating potential boundaries, which allow the measurement of voltage without the imposition of a current constraint. The supplementary CEM-based sensitivity analysis was performed by introducing a lumped contact impedance at each electrode, uniformly varied in the range 1–10 kΩ·cm2.
Simulations were repeated for representative MAP and MOP configurations at mid-depth inclusion (6 mm). The resulting variations in ΔZ, LE, and SNR remained below 5% with respect to the ideal-contact case. To provide quantitative evidence of this robustness, a parametric sweep of uniform electrode–skin contact impedance values was performed in the range 1–10 kΩ·cm2, consistent with reported biomedical measurements.
Figure 3 illustrates the percentage variation in ΔZ and SNR relative to the ideal-contact assumption. Both metrics exhibit a monotonic but limited sensitivity to increasing contact impedance, with maximum deviations remaining below 5% across the investigated interval. This behaviour confirms that, within realistic physiological ranges, the comparative ranking between MAP and MOP excitation strategies is not significantly altered by moderate electrode–skin interface variability.
All other boundaries are considered electrically insulated, where the normal current density is zero (3).
The electrode–tissue interface was modelled assuming ideal electrical contact in order to preserve consistency with the comparative nature of the excitation strategy analysis. The Complete Electrode Model (CEM), which accounts for contact impedance and boundary effects, was not explicitly implemented at this stage to maintain computational tractability and coherence with the system-level abstraction adopted in the electronic acquisition design. To assess the impact of this simplification, a supplementary sensitivity analysis was performed by introducing equivalent contact impedance values in the range reported in biomedical literature (1–10 kΩ·cm2).
The resulting variations in impedance contrast and localisation metrics remained within 5%, indicating that the comparative conclusions between excitation strategies are robust against moderate electrode–skin interface effects.
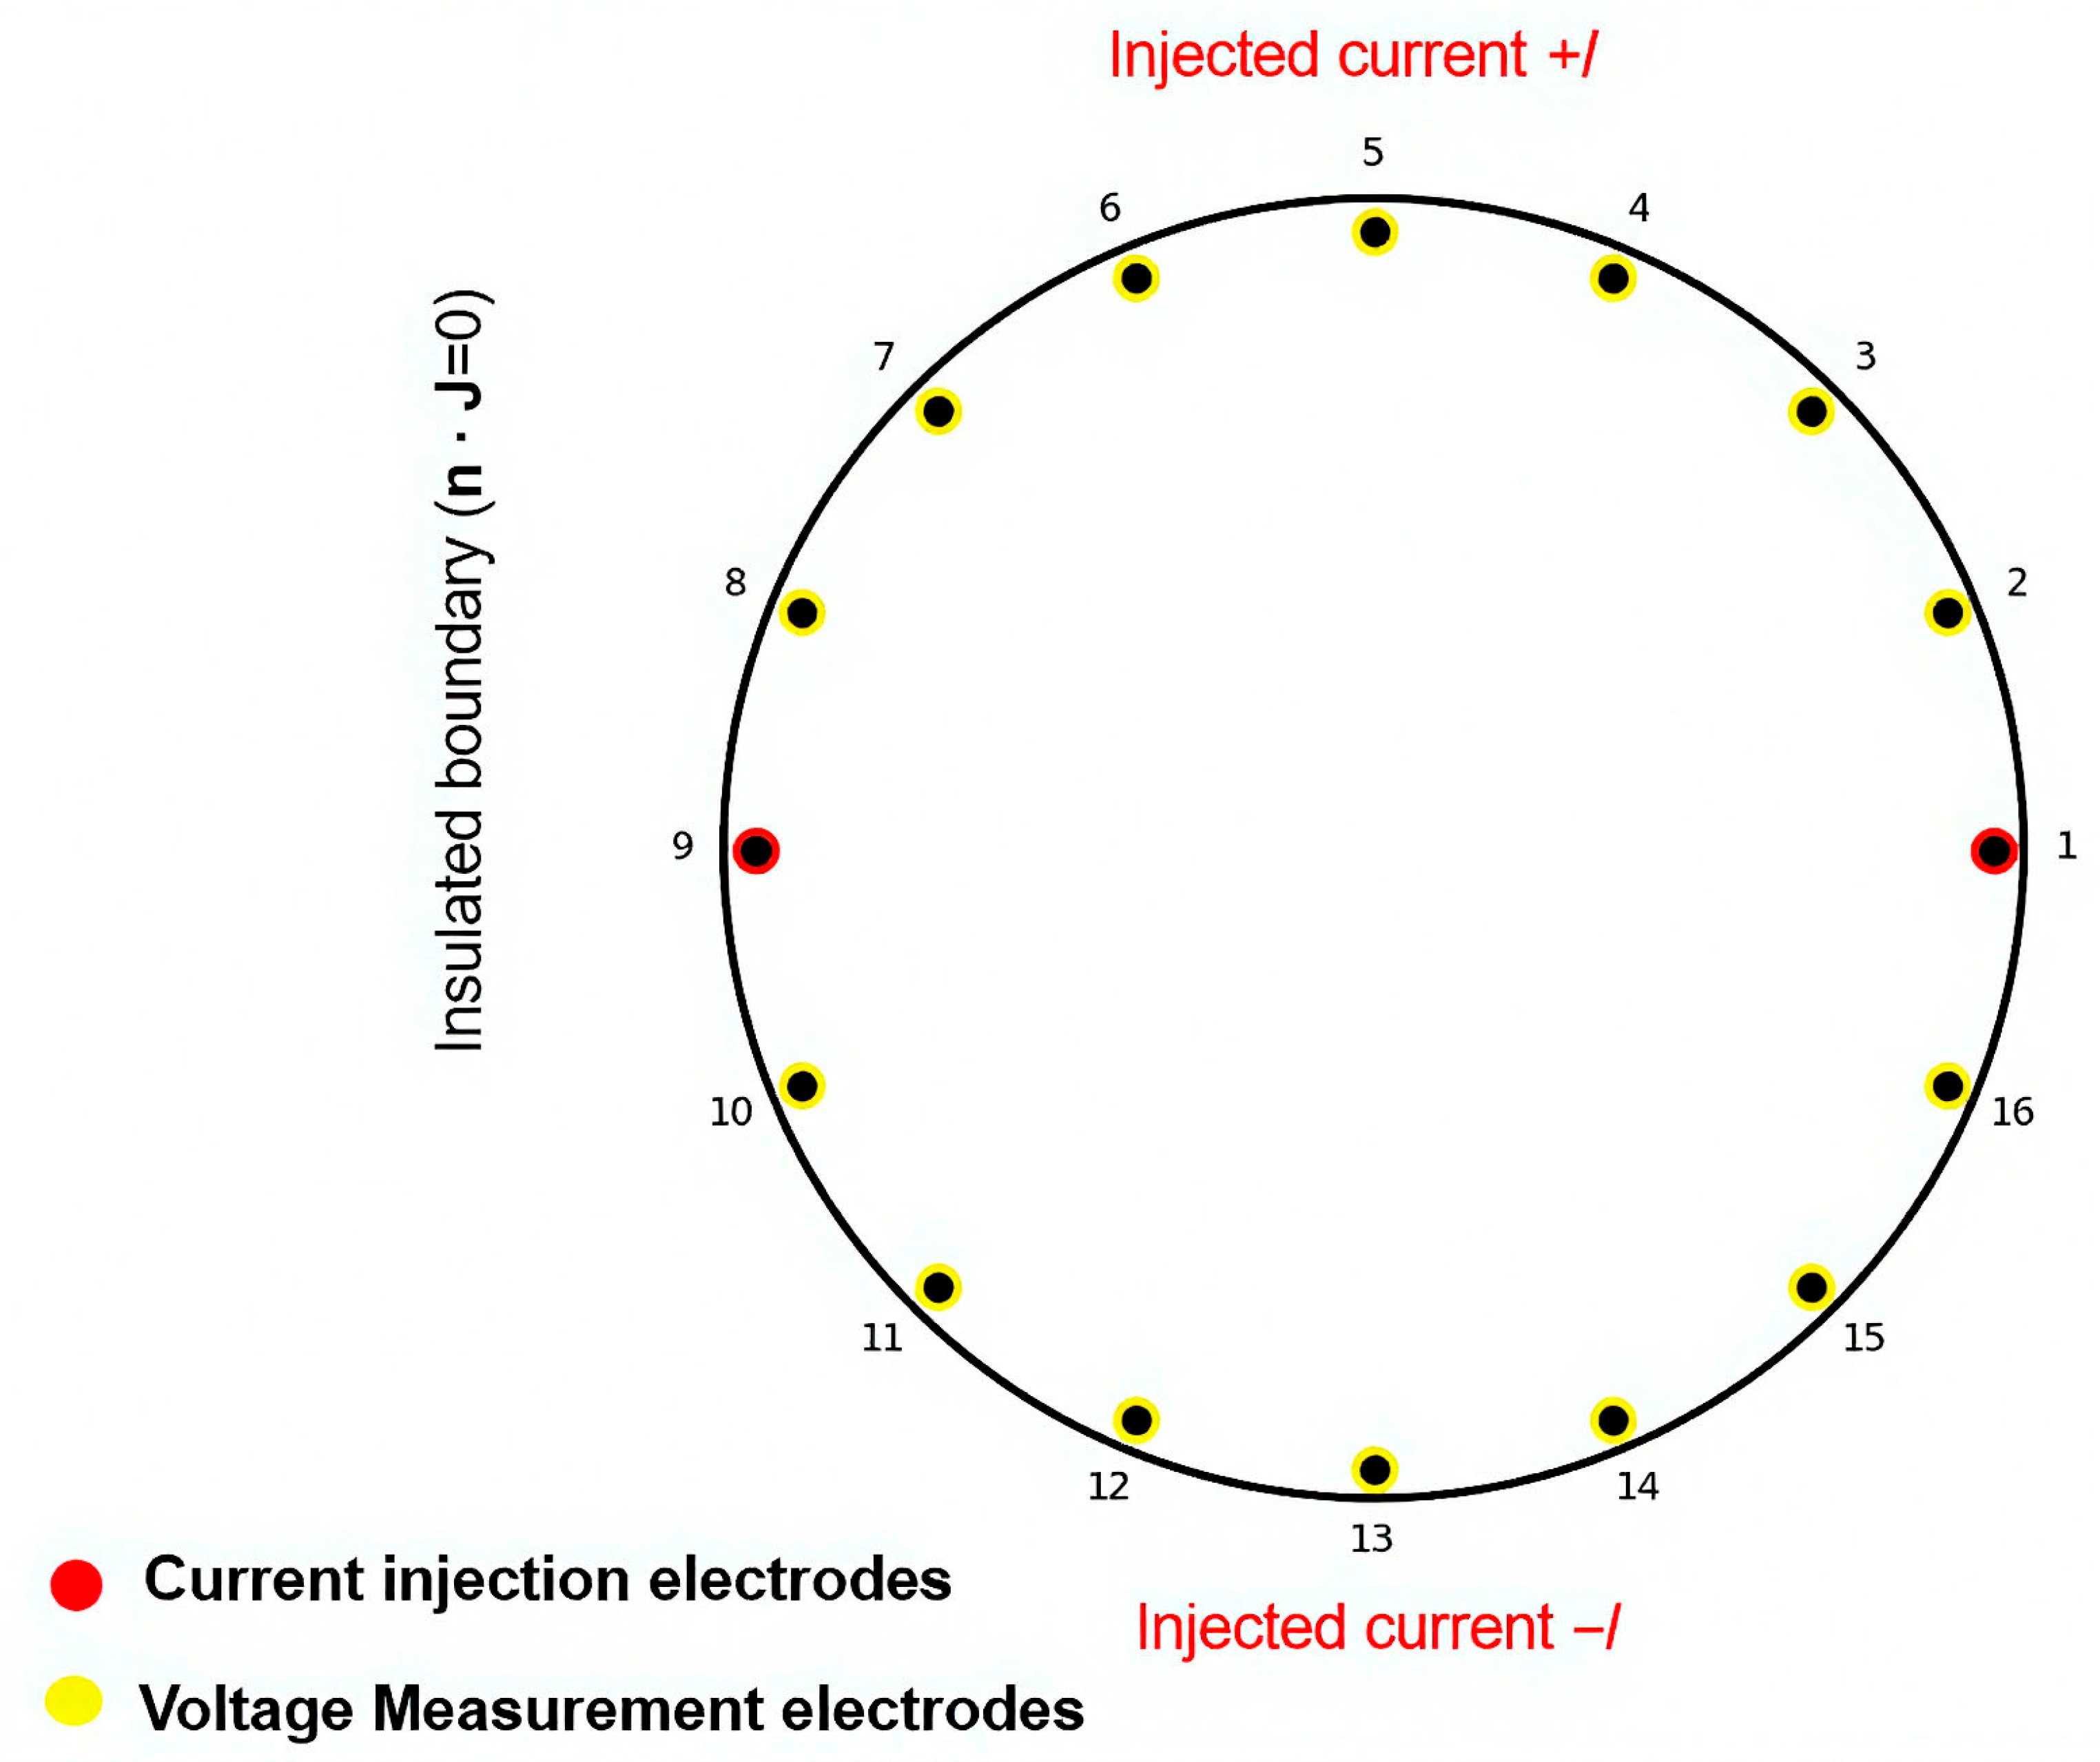
Figure 4 provides a schematic illustration of the boundary conditions applied in the finite element formulation.
Figure 4 shows the electrodes highlighted in red, which indicate the current injection pair, while those highlighted in yellow operate in floating potential mode (voltage measurement). In the MAP configuration, the current is injected through adjacent electrodes (1–2). In the MOP configuration, current is injected through diametrically opposed electrodes (1–9), which are highlighted to emphasise the greater separation between the electrodes and the resulting depth of current penetration.
All non-injecting electrodes act as passive voltage sensors, and electrical isolation is imposed on the remaining boundaries of the domain. The current injection is carried out for the chosen set of surface electrodes as per the specified excitation strategy, whereas the other electrodes are kept in the voltage measurement mode. The electrical insulation is also enforced for all other boundaries of the computational domain. It is assumed that the electrodes behave as ideal conductors with a uniform current density distribution. The impedance of the electrodes and tissues at the interface is neglected to isolate the effect of the excitation strategy and tissue conductivity contrast on the resulting electric potential field. To prepare the equation for numerical solution by the FEM, the equation is transformed into a weak or variational form by multiplying the equation with an appropriate test function (4).
First-order tetrahedral elements are employed for the discretization of the computational domain, resulting in a linear approximation of the electric potential. The use of first-order elements provides numerical robustness to the solution with a reasonable computational cost for a 3D problem. Mesh refinement is applied in areas where significant conductivity gradient is identified, such as in the vicinity of the electrode tissue interface and in the neighbourhood of the neoplastic inclusion.
Mesh convergence analysis is carried out such that the mesh is refined until the variation in the measurements of the electrode voltage is minimized below a specified tolerance level, ensuring that the results obtained are mesh-independent. The convergence criterion was defined by monitoring the relative variation in electrode voltage measurements between successive mesh refinements, with a tolerance threshold below 1%. This ensures that numerical discretization errors remain negligible compared to the noise levels introduced in the Monte Carlo analysis. To further validate the numerical implementation, the forward solver was benchmarked against an analytical solution obtained for a homogeneous conductive domain under simplified boundary conditions.
The comparison showed a mean relative error below 3%, confirming the numerical consistency of the FEM implementation. In addition, current conservation was verified by evaluating the balance between injected and extracted currents for all excitation patterns, resulting in residual errors below numerical tolerance.
The numerical simulation of the direct EIT problem was implemented using COMSOL Multiphysics© 5.2 (AC/DC Electric Currents Module). Although COMSOL is a commercial platform, the mathematical formulation, boundary conditions, and numerical settings adopted in this study are explicitly reported to ensure reproducibility independently of the specific software environment. All simulations were performed on Ubuntu Linux 22.04 LTS using COMSOL Multiphysics© 5.2. The model was formulated in the quasi-static regime, assuming low-frequency current injection and neglecting electromagnetic propagation effects, an assumption fully valid for biomedical EIT applications.
The FEM environment allowed explicit definition of boundary conditions, material interfaces, and mesh refinement strategies, rather than relying on black-box solver implementations. The numerical parameters adopted for the simulations are summarised in
Table 3.
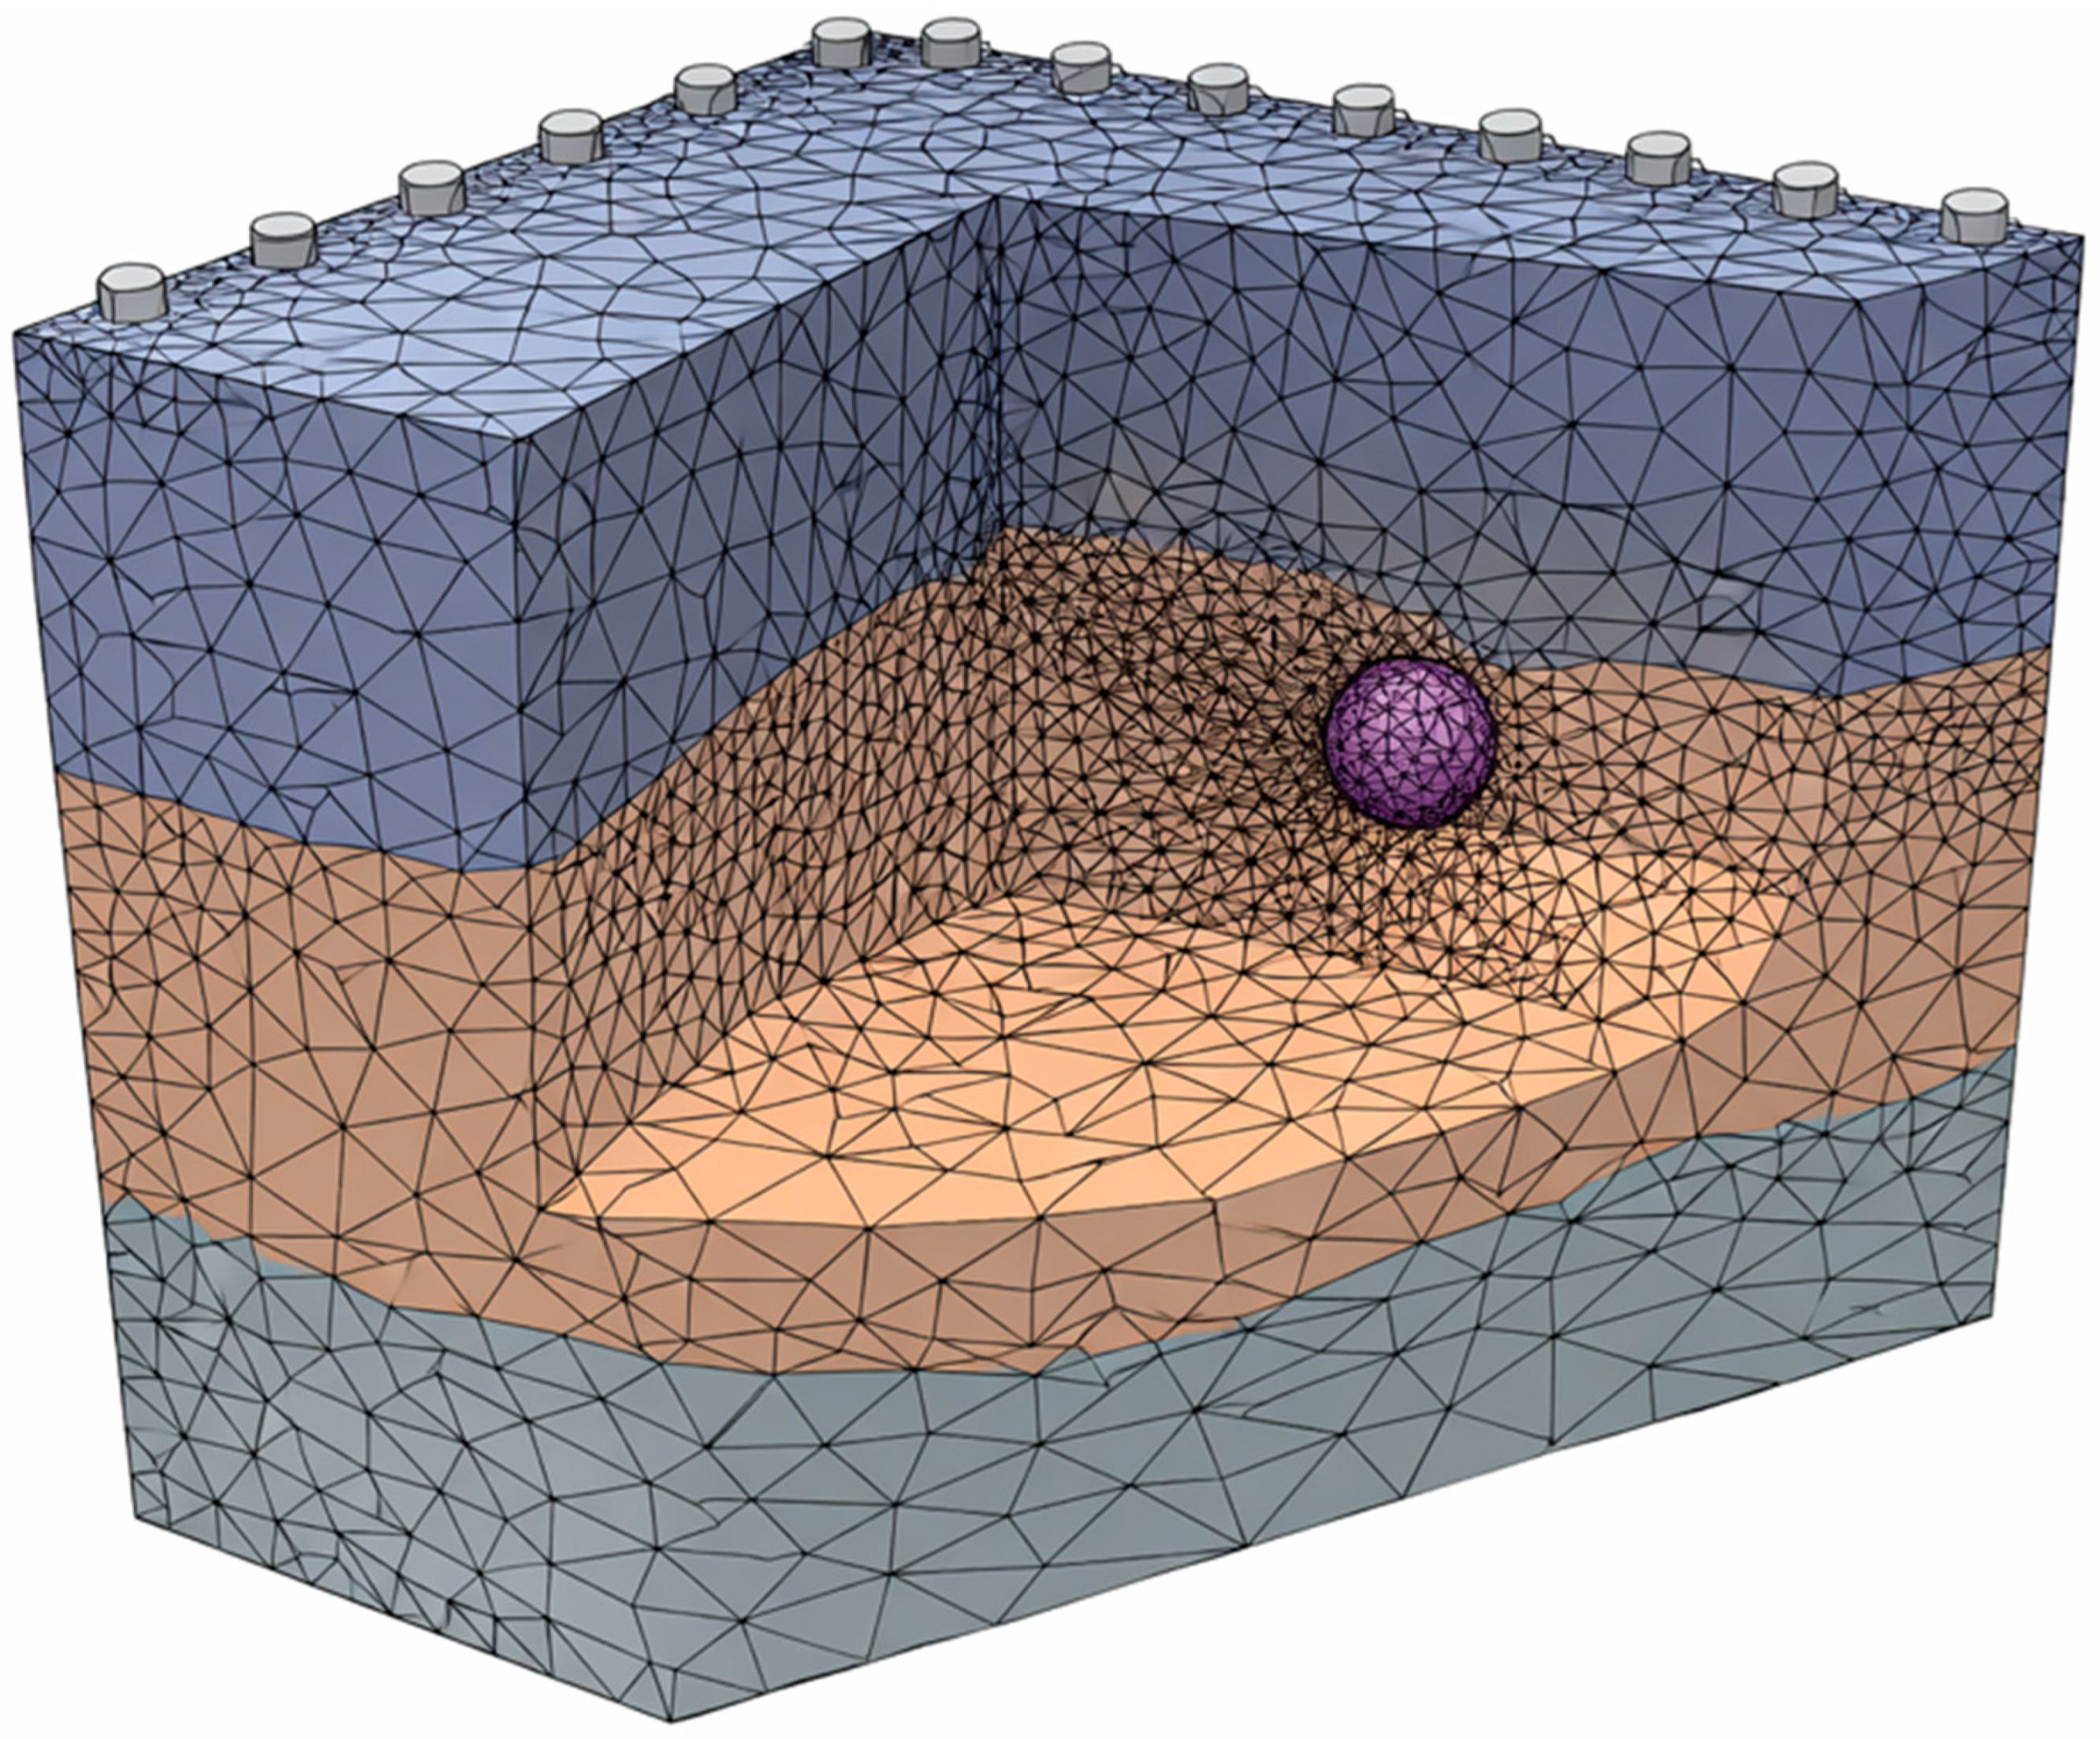
Figure 5 illustrates the tetrahedral finite element mesh adopted for the three-dimensional EIT forward simulations. The computational domain is discretised using first-order tetrahedral elements in order to ensure numerical robustness and geometric flexibility in representing the complex electrode–tissue interfaces. A non-uniform meshing strategy is employed, with progressive local refinement applied in regions where strong spatial gradients of the electric potential are expected. In particular, mesh densification is enforced in the vicinity of the surface electrodes, where current injection and voltage measurement occur, as well as around the neoplastic inclusion, where sharp conductivity discontinuities may arise. This targeted refinement strategy allows an accurate resolution of local electric field variations while maintaining a manageable overall number of degrees of freedom, thereby balancing numerical accuracy and computational efficiency.
Mesh convergence was verified by progressively refining the discretisation until variations in electrode voltage measurements between successive meshes remained below a predefined tolerance, ensuring that numerical discretisation errors do not bias the comparative analysis of excitation strategies.
All modelling assumptions, boundary conditions, and material definitions are explicitly specified to ensure reproducibility independently of the commercial software environment. The explicit formulation of material properties, boundary conditions and mesh refinement parameters ensures methodological transparency and reproducibility of the numerical results. The steady-state solver allows you to obtain the steady-state electric potential for all excitation models, while the tolerance is set to ensure that the results are numerically stable and convergent.
2.4. Electronic Acquisition System Design
To ensure the alignment of the numerical simulations with the prospective experimental implementations, the research incorporates the development of a dedicated electronic acquisition system for EIT. The system is designed to accommodate the controlled injection of electric current and the measurement of voltage, with operating conditions suitable for the acquisition of low-amplitude bioimpedance signals, as these are more sensitive to noise and system non-idealities [
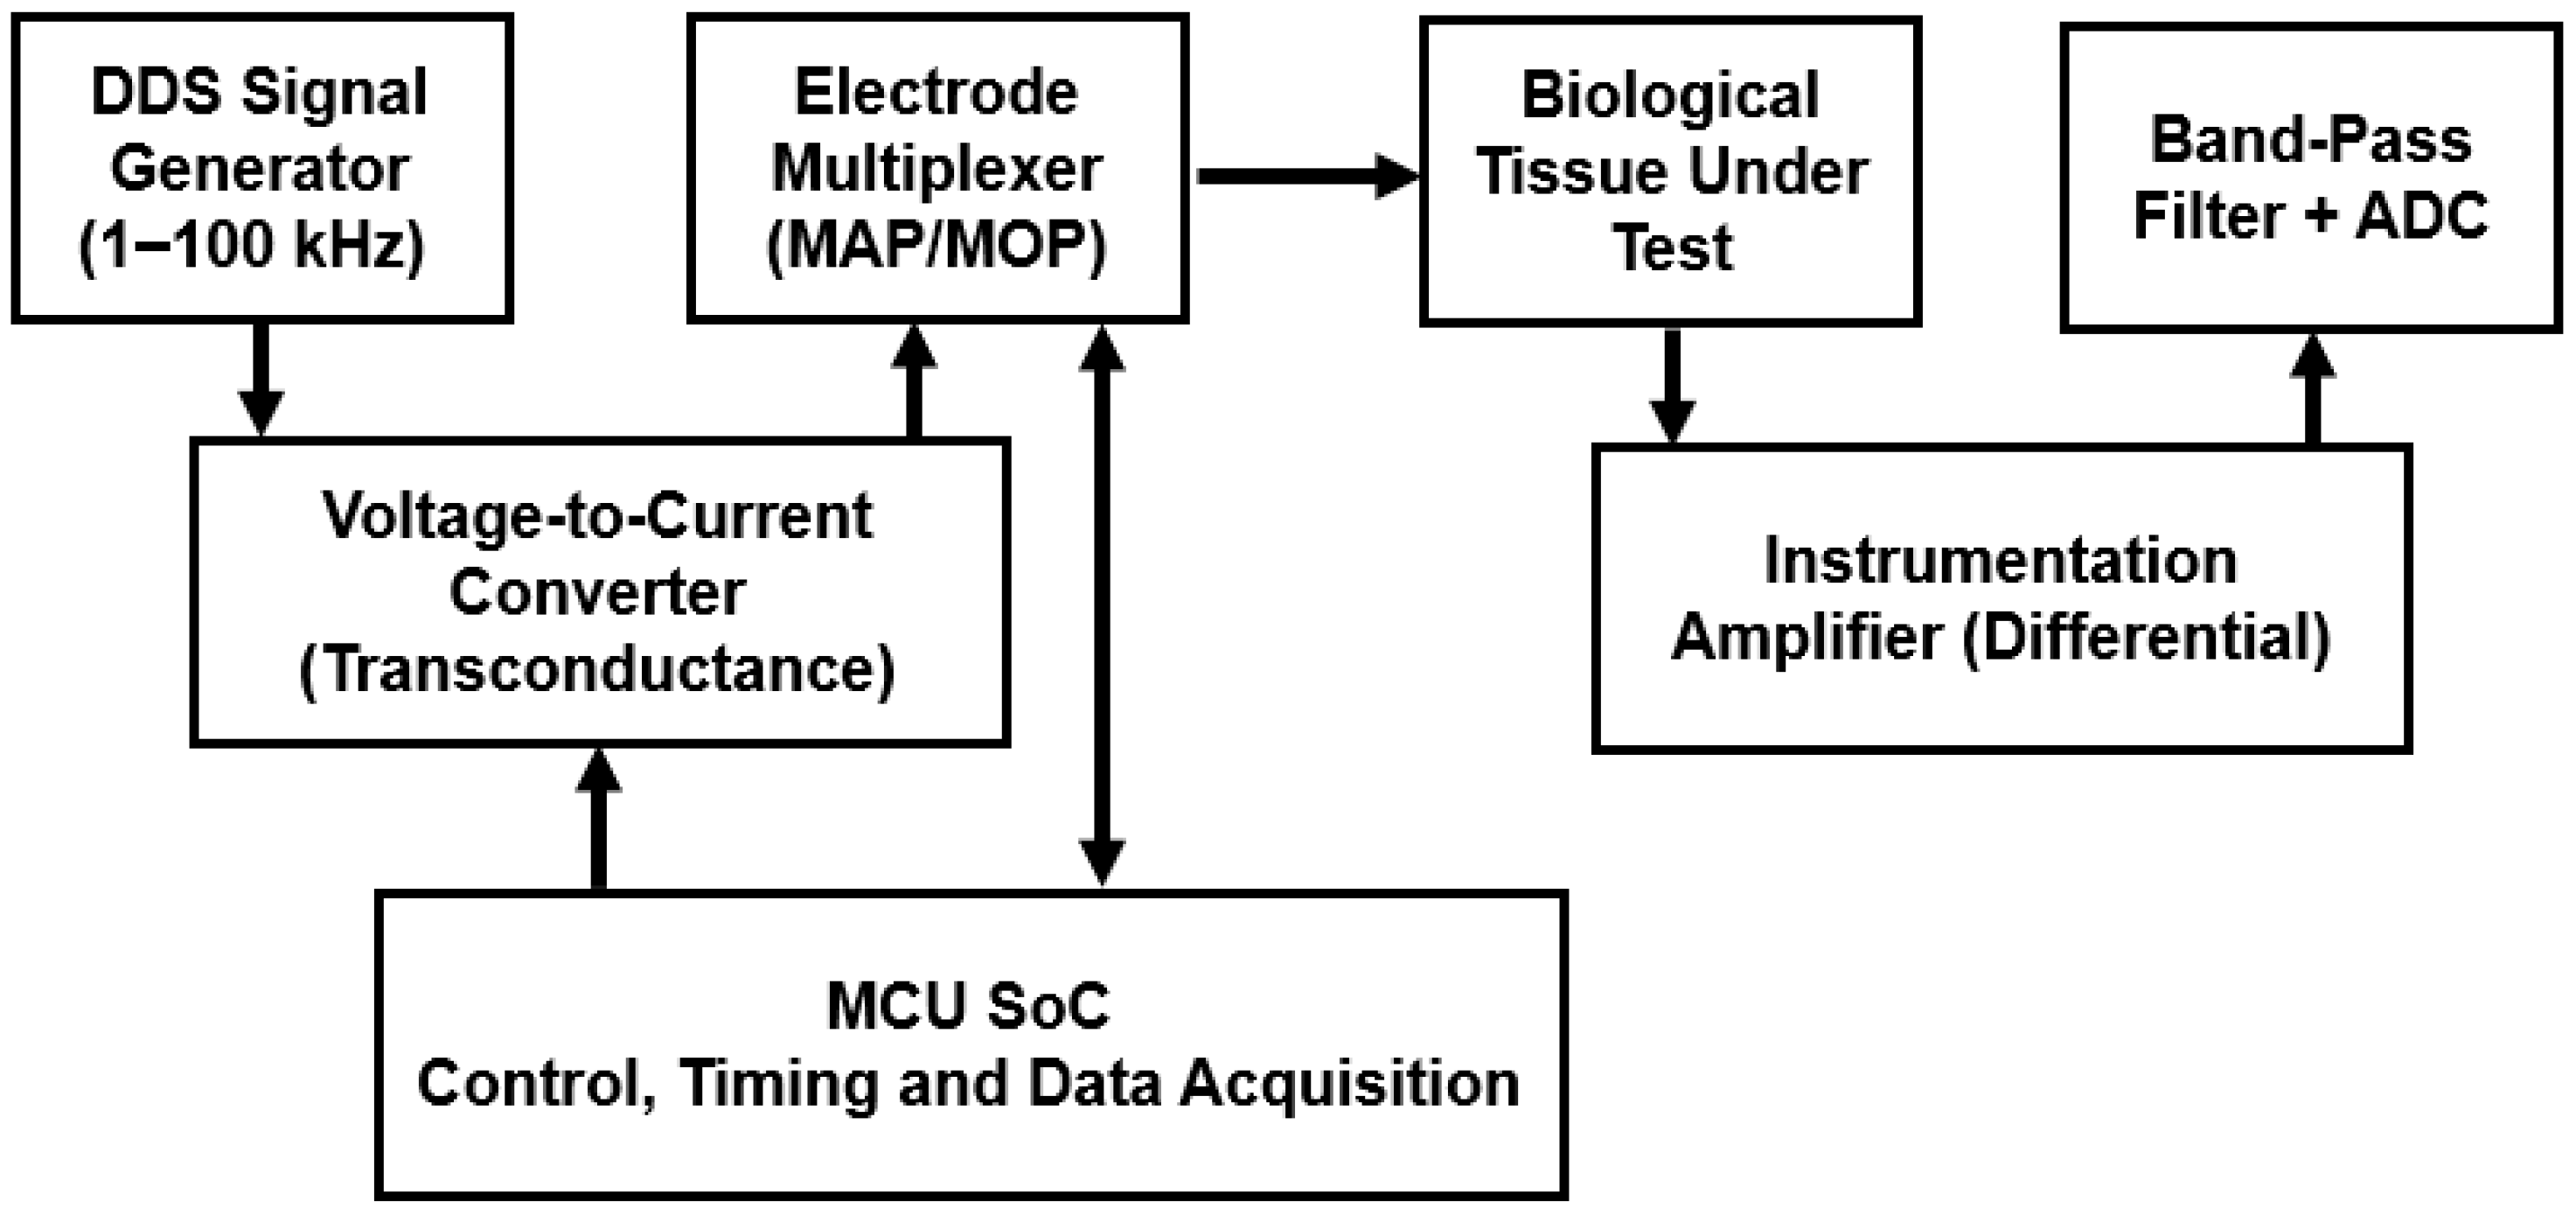
32]. The electronic architecture, designed as a modular and idealised acquisition platform, supports numerical validation and system-level analysis rather than immediate clinical implementation. This approach will facilitate the evaluation of the excitation and measurement modalities under controlled and reproducible conditions, thus ensuring the direct comparability with the underlying assumptions of the finite element method (FEM) forward model. By selecting the appropriate current injections, electrode configurations, and voltage measurement modes, the approach will ensure the direct transferability to the experimental scenarios, as these are aligned with the underlying boundary conditions of the numerical simulations. The overall architecture consists of four main functional stages: (i) a current injection stage, (ii) a multiplexed voltage acquisition stage, (iii) analogue signal conditioning, and (iv) a digital control and processing unit. This modular structure allows flexible implementation of different excitation strategies, including the MAP and the MOP, while preserving functional separation and electrical isolation between excitation and measurement paths. A block-level representation of the proposed acquisition system is reported in
Figure 6.
A direct digital synthesis (DDS) signal generator is employed to produce low-frequency sinusoidal excitation signals in the range typically adopted for biomedical EIT applications (1–100 kHz). The generated voltage signal is converted into a controlled excitation current by means of a voltage-to-current converter, ensuring stable current injection despite variations in electrode–tissue impedance. Electrode selection for current injection and voltage sensing is performed through a multiplexing stage, enabling flexible routing of signals according to the selected excitation strategy. The surface voltages generated at the electrode–tissue interface are acquired using differential instrumentation amplifiers characterised by high input impedance, low input-referred noise, and high common-mode rejection ratio (CMRR). Similar multi-stage EIT acquisition architectures based on DDS excitation, voltage-to-current conversion, multiplexed sensing, and high-resolution ADC chains have been reported in state-of-the-art real-time tomography systems [
33,
34]. These characteristics are essential for preserving the integrity of low-amplitude voltage signals generated by conductivity variations within the tissue. The acquired signals are subsequently processed by analogue conditioning stages, including band-pass filtering centred on the excitation frequency, in order to suppress out-of-band noise and environmental interference [
35]. The conditioned analogue signals are then digitised using a high-resolution analogue-to-digital converter (ADC) and transferred to a microcontroller unit (MCU) or system-on-chip (SoC) for data handling and storage. The acquisition chain was dimensioned to ensure that the expected voltage dynamic range remains compatible with the simulated impedance variations. Considering typical excitation currents in the order of 1 mA and tissue impedances in the range of tens to hundreds of ohms, the resulting voltage amplitudes remain within the linear operating region of the instrumentation amplifiers and ADC input stage. To support the numerical investigation and assess architectural feasibility, the electronic acquisition system was defined at the schematic design level. The proposed design aims to describe the functional organisation and signal flow of the EIT acquisition chain, rather than to represent a hardware-finalised or experimentally validated implementation. Electrical channel independence is preserved at the conceptual level through functional separation of excitation and sensing paths, while practical non-idealities related to layout parasitics, grounding strategies, and inter-channel coupling are deliberately excluded at this stage.
The detailed electronic schematic is provided in
Supplementary Figure S1 to improve readability of the main manuscript. The diagram highlights the main functional blocks and signal flow, including sinusoidal excitation generation via DDS, voltage-to-current conversion for controlled current injection, multi-channel electrode multiplexing, differential voltage acquisition using high-input-impedance instrumentation amplifiers, analogue signal conditioning, and high-resolution analogue-to-digital conversion. The system coordination, excitation timing, and data handling will be managed by the microcontroller unit (MCU). The schematic representation tries to reflect the logical organization and internal consistency of the acquisition system, as assumed in the FEM forward model, rather than the hardware implementation.
2.5. Performance Evaluation Metrics
To characterise the ability of the proposed EIT system to discriminate, locate, and detect conductivity anomalies in a three-dimensional domain, a set of quantitative performance metrics was defined. These metrics were selected to capture both spatial discrimination capability and robustness to noise, which are critical aspects for biomedical EIT applications. Impedance contrast (ΔZ), used to quantify the relative difference between healthy tissue and neoplastic tissue, provides a direct measure of the electrical discriminability of inclusions (5).
Spatial sensitivity, calculated as the scalar product of the potential gradients associated with the injection and measurement patterns, allows the distribution of the sensitivity field in the three-dimensional domain to be evaluated (6).
Localisation error (LE) was defined as the Euclidean distance between the actual inclusion centroid and the centroid of the sensitivity-weighted response derived from the forward model (7).
The signal-to-noise ratio (SNR) was used to assess the robustness of the acquisition system with respect to electronic and environmental noise sources: (8).
Noise was modelled as additive Gaussian white noise applied independently to each measurement channel, with standard deviation fixed at 5% of the nominal voltage amplitude to reflect realistic instrumentation noise levels in biomedical EIT systems. Monte Carlo simulations (N = 1000, fixed random seed for reproducibility) were used to propagate measurement uncertainty through the forward model and evaluate statistical robustness of the performance indicators. The number of Monte Carlo realizations was selected to ensure statistical stability of the estimated mean and confidence intervals. Convergence of statistical descriptors was verified by monitoring the stabilization of mean SNR and localization error values as a function of the number of realizations.
Sensitivity as a function of depth was also investigated, which is critical in order to evaluate the detectability of anomalies located in deeper parts of skin tissue. Depth is defined as the vertical distance between the centroid of the inclusion and the top electrode plane. Inclusions were positioned within the physical thickness of the domain (0–10 mm).
Any depth value exceeding the domain thickness in previous versions was a typographical inconsistency and has been corrected. The proposed metrics are designed to account for both spatial resolution and robustness against noise, which are critical parameters in early-stage anomaly detection in biomedical electrical impedance tomography (EIT). It should be emphasized here that, rather than accuracy in image inversion, the proposed metrics are based on forward modelling of sensitivity.
No explicit inverse reconstruction algorithm is implemented in the present study, and localisation-related indicators are derived from sensitivity-weighted responses of the forward problem. In addition to statistical significance testing, effect sizes (i.e., Cohen’s d) have also been calculated in order to quantify the differences between excitation schemes.
Statistical comparisons were performed on independent Monte Carlo realizations obtained by perturbing measurement noise while keeping the forward solution fixed. Each realization constitutes an independent sample, whereas depth-wise comparisons involve multiple hypotheses and are therefore interpreted conservatively, with emphasis placed on effect size rather than
p-values alone. Since the forward solution remains deterministic and only the additive noise realization varies, independence between samples is ensured by the stochastic perturbation of measurement channels. No repeated-measures structure was introduced across depths, and depth-wise comparisons were interpreted descriptively rather than as pooled inferential tests. Correction for multiple comparisons was not applied because global conclusions rely on domain-averaged metrics (
Table 4) rather than isolated depth points. While the proposed model assumes homogeneous conductivity in each anatomical layer, which is critical from a numerical stability and reproducibility standpoint, it should be noted that this framework can be easily extended to account for heterogeneous and anisotropic conductivity profiles.
3. Results
Although the present study focuses primarily on forward-model sensitivity analysis rather than full inverse problem reconstruction, a qualitative sensitivity-weighted back-projection was performed to provide an intuitive representation of anomaly detectability.
The resulting maps, obtained by combining the spatial sensitivity distributions associated with each excitation strategy, show that the opposite electrode configuration generates a more homogeneous volumetric response compared to the adjacent configuration.
In particular, deeper inclusions produce broader but clearly distinguishable sensitivity patterns under the opposite strategy, supporting the interpretation of improved volumetric detectability observed in the quantitative metrics. This qualitative reconstruction is intended only as an illustrative validation of the physical consistency of the forward-model analysis and does not represent a full image reconstruction procedure. Although the process is simple, the sensitivity-weighted back-projection provides useful physical intuition into the flow of the current in space, depending on the different excitation strategies that are used. For example, the volumetric distribution of the sensitivity, which is obtained using the MOP setup, corresponds to the expected current penetration with the electrodes farther apart. The MAP setup, however, has sensitivity concentrated near the surface, implying that near-surface current paths are dominant. This qualitative behaviour corroborates the forward-model metrics and supports the physical interpretability of the comparative analysis.
The results obtained from the proposed FEM-based framework, evaluated through a multilevel quantitative analysis, combine deterministic simulations, Monte Carlo perturbations and formal statistical validation. The application of Monte Carlo perturbations also assists in verifying the robustness of the observed trends with respect to realistic measurement variations and noise in the instrument. The application of Monte Carlo perturbations provides us with confidence intervals for each of the performance metrics, enabling us to perform a statistically correct comparison of different excitation strategies. The sustained performance difference between MAP and MOP is a result of Monte Carlo runs, and this difference is not because of a single run but is a result of inherent properties of the systems.
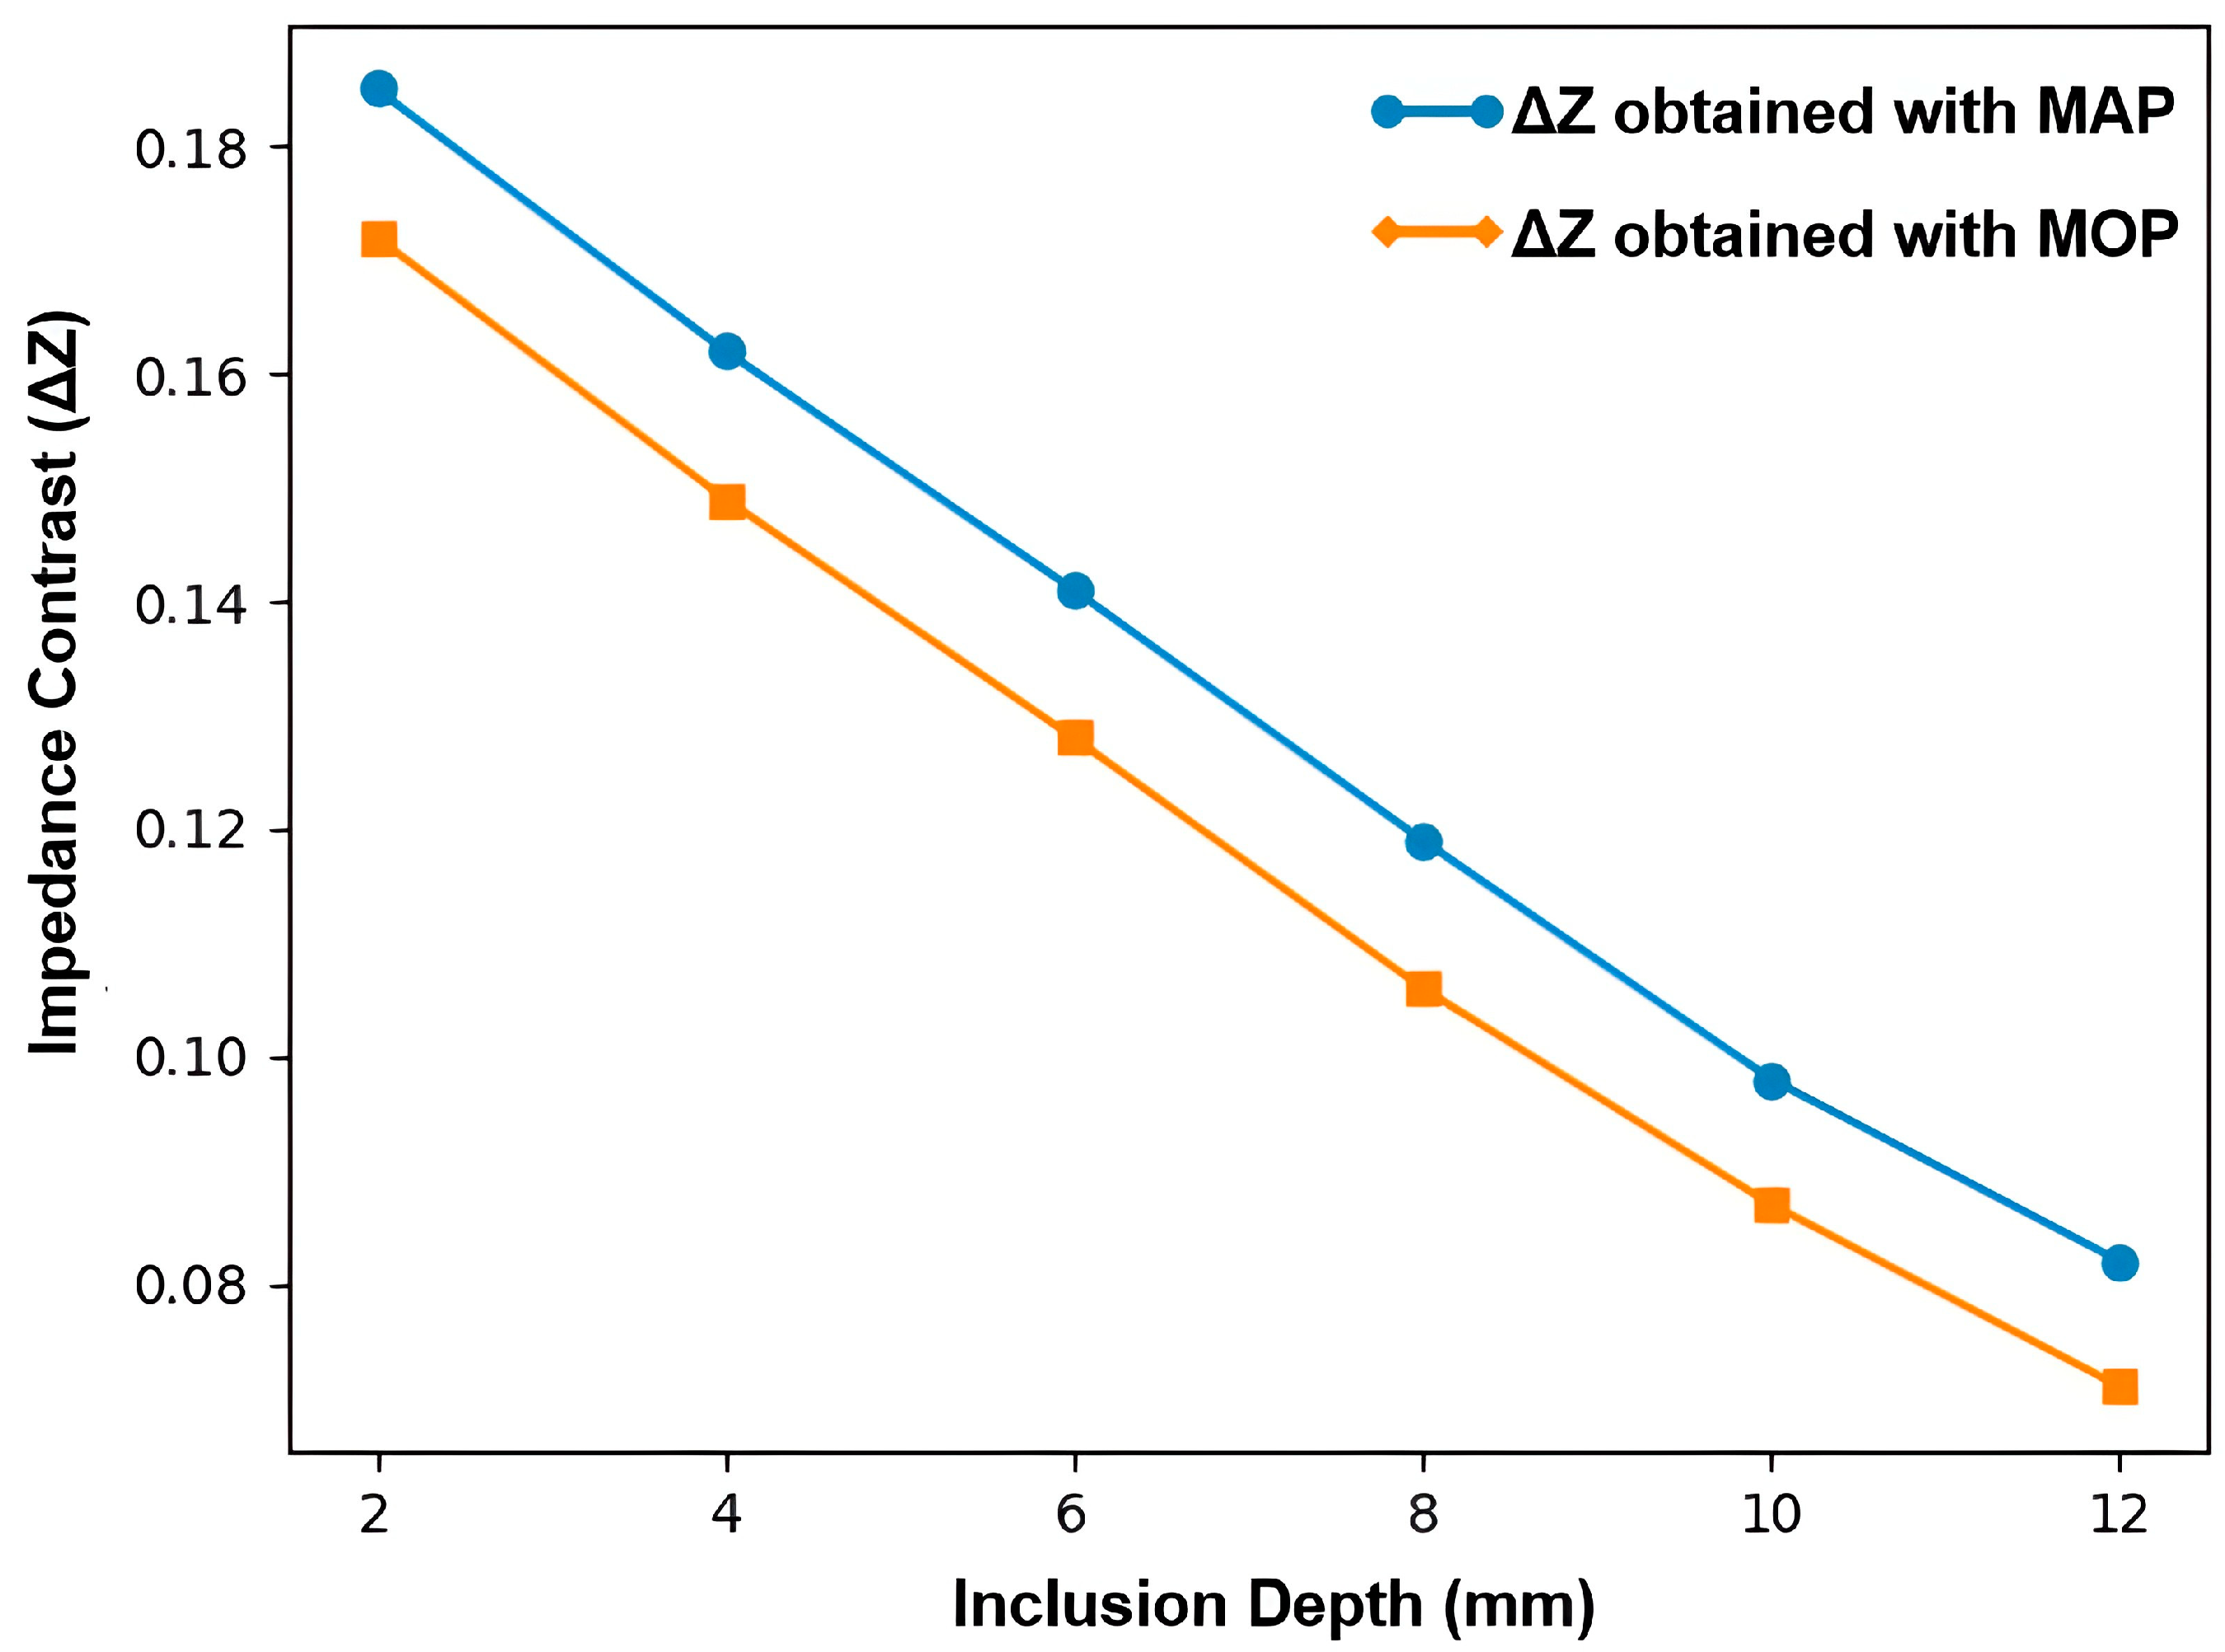
Figure 7 shows the ΔZ as a function of inclusion depth for the MAP and MOP excitation strategies.
The MAP configuration exhibits higher superficial contrast but a faster decay with depth, whereas the MOP strategy maintains improved volumetric sensitivity and enhanced anomaly detectability in deeper tissue regions. From an application-oriented perspective, this depth-dependent behaviour has important implications for the detection of subsurface anomalies in biomedical contexts. While adjacent electrode configurations may be advantageous for superficial targets, their rapid sensitivity decay limits their effectiveness in scenarios involving deeper or volumetrically distributed conductivity perturbations. In contrast, the MOP configuration demonstrates a more favourable trade-off between surface sensitivity and depth penetration, making it particularly suitable for early-stage lesion detection or monitoring applications where volumetric coverage is required. These findings highlight the importance of excitation strategy selection as a system-level design parameter in three-dimensional EIT.
To further clarify the physical behaviour of the system,
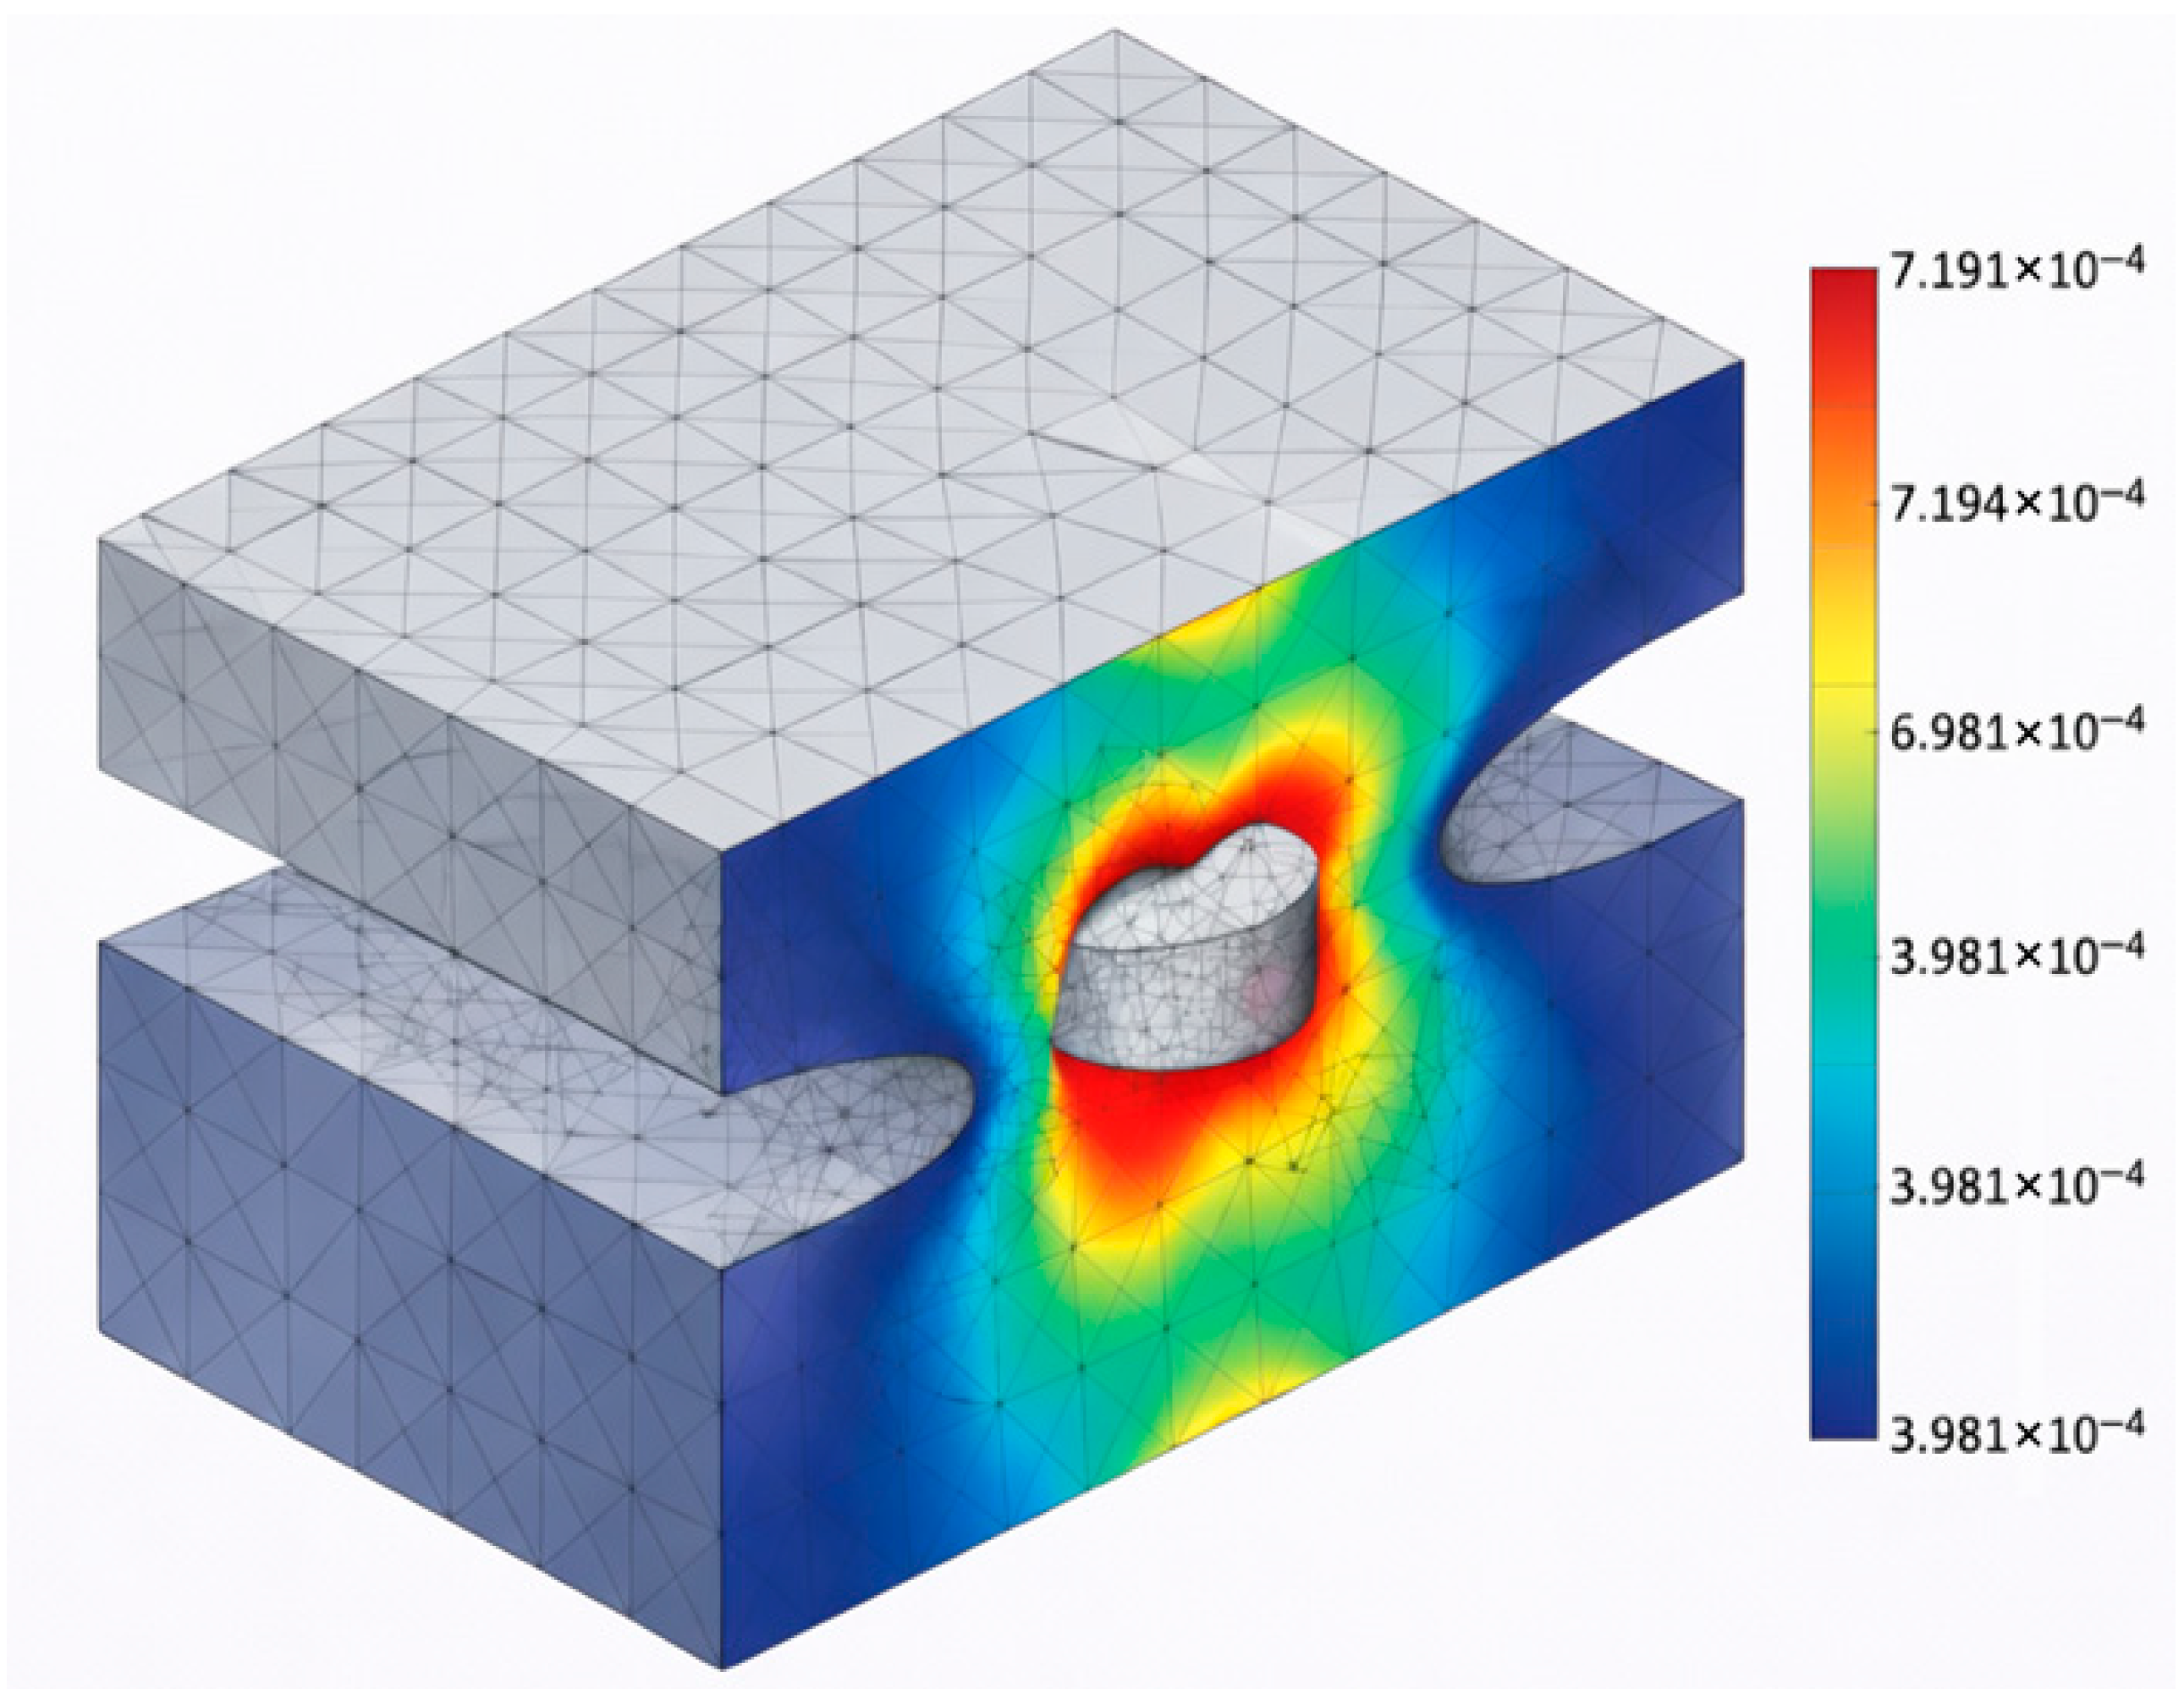
Figure 8 reports the three-dimensional distribution of the electric potential within the multilayer cutaneous domain for a representative current injection pattern. The figure highlights how the presence of a neoplastic inclusion locally perturbs the potential field, generating measurable voltage variations at the surface electrodes. This effect represents the physical basis for anomaly detection in EIT and justifies the subsequent quantitative analysis presented in the
Section 3.
As shown in
Figure 8, the spatial distribution of the electric potential is strongly influenced by the presence of the neoplastic inclusion. The conductivity contrast between healthy tissue and the inclusion generates a local perturbation of the electric field, which alters the equipotential lines and propagates toward the surface of the domain. These perturbations result in measurable voltage variations at the surface electrodes, providing the physical basis for anomaly detection in electrical impedance tomography. The three-dimensional representation further highlights the importance of volumetric modelling, as the potential distortion extends beyond the superficial layers and cannot be fully captured by two-dimensional approximations. The pattern of perturbation further substantiates this conclusion that conductivity inclusions favour current density redistribution over localized high-field generation. This phenomenon is consistent with the diffusive properties of low-frequency electrical conductivity in biological tissues and explains the gradual decrease in detectability with depth. The comparison between the MAP and the MOP is intended to explicitly quantify the impact of electrode excitation strategies on spatial sensitivity, localization accuracy, and noise robustness in three-dimensional EIT scenarios. The comparative analysis aims to quantify the impact of electrode excitation strategies on spatial sensitivity, localization accuracy and noise robustness within a three-dimensional EIT framework.
Table 4 describes the quantitative metrics of MAP and MOP excitation strategies in terms of their effectiveness in electrical impedance tomography. The metrics include their average values with their associated statistical significance over Monte Carlo simulations.
In addition to statistical significance (
p < 0.001), effect size analysis confirmed a large practical impact of the excitation strategy on system performance. The computed Cohen’s d values exceeded 1.0 for impedance contrast and localization error, indicating a substantial engineering relevance beyond statistical significance alone. To incorporate measurement uncertainties and model variability, a Monte Carlo framework with 1000 realisations was implemented. Gaussian white noise with a standard deviation fixed at 5% of the nominal voltage amplitude was added to each measurement channel independently. A sensitivity analysis performed with higher noise levels (up to 8%) confirmed the stability of the comparative conclusions. The average value of each metric with 95% confidence interval has been calculated. The two-tailed ‘
t-test’ has been applied to determine their statistical significance with
p < 0.01. The global values of effectiveness in
Table 4 have been calculated by averaging the depth-dependent values in
Table 5 over all depths of inclusions to maintain uniformity in comparing both excitation strategies. As reported in
Table 5, the MOP configuration consistently exhibits lower localization error, higher impedance contrast, and improved SNR across all investigated depths. The performance gap increases with depth, confirming the volumetric sensitivity advantage of the opposite excitation strategy in three-dimensional domains. These depth-resolved results are fully consistent with the domain-averaged statistics presented in
Table 4 and with the physical interpretation of current density redistribution in volumetric excitation schemes. The MOP configuration ensures uniform current density in the three-dimensional domain. As a consequence, superficial voltage amplitudes are relatively low in this case but with substantially improved sensitivity and robustness in the three-dimensional domain. The superficial advantage of MAP over MOP in terms of signal-to-noise ratio is consistent with localized current density in superficial depth but does not contradict the statistically significant advantage of MOP over MAP in terms of global values of effectiveness in electrical impedance tomography. The superiority of MOP over MAP in terms of global values of effectiveness in electrical impedance tomography has been demonstrated within specific modelling constraints of this study and does not imply any claim of optimality over all possible anatomical arrangements and frequency regimes.
Table 5 summarises the main statistical descriptors of the performance metrics considered at different depths of inclusion, including the average localisation error, standard deviation, 95% confidence intervals, and SNR. It should be noted that
Table 5 reports depth-resolved performance metrics. Consequently, superficial advantages observed for the MAP configuration at shallow depths do not contradict the globally superior volumetric performance of the MOP strategy highlighted by domain-averaged statistics. This distinction between depth-resolved and domain-averaged metrics is critical for a correct interpretation of the comparative results. While local performance indicators may favour adjacent excitation patterns in near-surface regions, the depth-dependent analysis reveals that such advantages are spatially confined and rapidly diminish with increasing inclusion depth.
On the other hand, the MOP configuration is observed to have a more balanced sensitivity profile over the volume, and consequently, it is found to have better overall performance metrics when evaluated over the domain. This observation reiterates the need for volumetric and statistically aggregated metrics for evaluating excitation strategies for 3D EIT.
The results show that the localisation error remains low and increases monotonically with depth, in accordance with the theory of electromagnetic diffusion in conductive biological tissues, where low-frequency current propagation is governed by diffusive quasi-static behaviour rather than wave phenomena [
36]. The concurrent trends observed in localisation error, signal-to-noise ratio, and impedance contrast further support this interpretation. As depth increases, the progressive spreading of current density and attenuation of voltage gradients lead to reduced spatial selectivity and increased uncertainty in anomaly localisation. Nevertheless, the MOP strategy consistently preserves higher impedance contrast and SNR values at larger depths, indicating a more effective exploitation of the available current pathways. This behaviour reflects the fundamental role of electrode separation in shaping the sensitivity distribution in diffusive EIT regimes.
Although absolute SNR values shown in
Figure 9 may appear slightly higher for the MAP configuration at superficial depths, the global statistical analysis across Monte Carlo realizations (
Table 5) confirms that the MOP strategy provides significantly improved robustness and spatial discrimination capability when averaged over the entire depth range.
The standard deviation increases progressively with depth, indicating greater uncertainty in deep regions, as expected for low-frequency EIT systems. The signal-to-noise ratio maintains high values in superficial regions and gradually decreases with depth, but remains above the detection threshold for all electrode configurations considered. This result confirms the feasibility of detecting three-dimensional anomalies even under realistic conditions of instrumental and biological noise. The narrow confidence intervals highlight low variability between Monte Carlo realizations, suggesting high stability of the reconstruction model. This is further substantiated by the consistency of the low
p-values reported in
Table 5, which encompasses all the depth scenarios. This demonstrates that the performance improvements observed with the MOP configuration are not based on random chance or specific simulation conditions but are, in fact, reproducible. By combining Monte Carlo propagation of uncertainties, calculation of confidence intervals, and hypothesis testing, a robust statistical basis is provided to substantiate the assertions, thus validating the system-level conclusions.
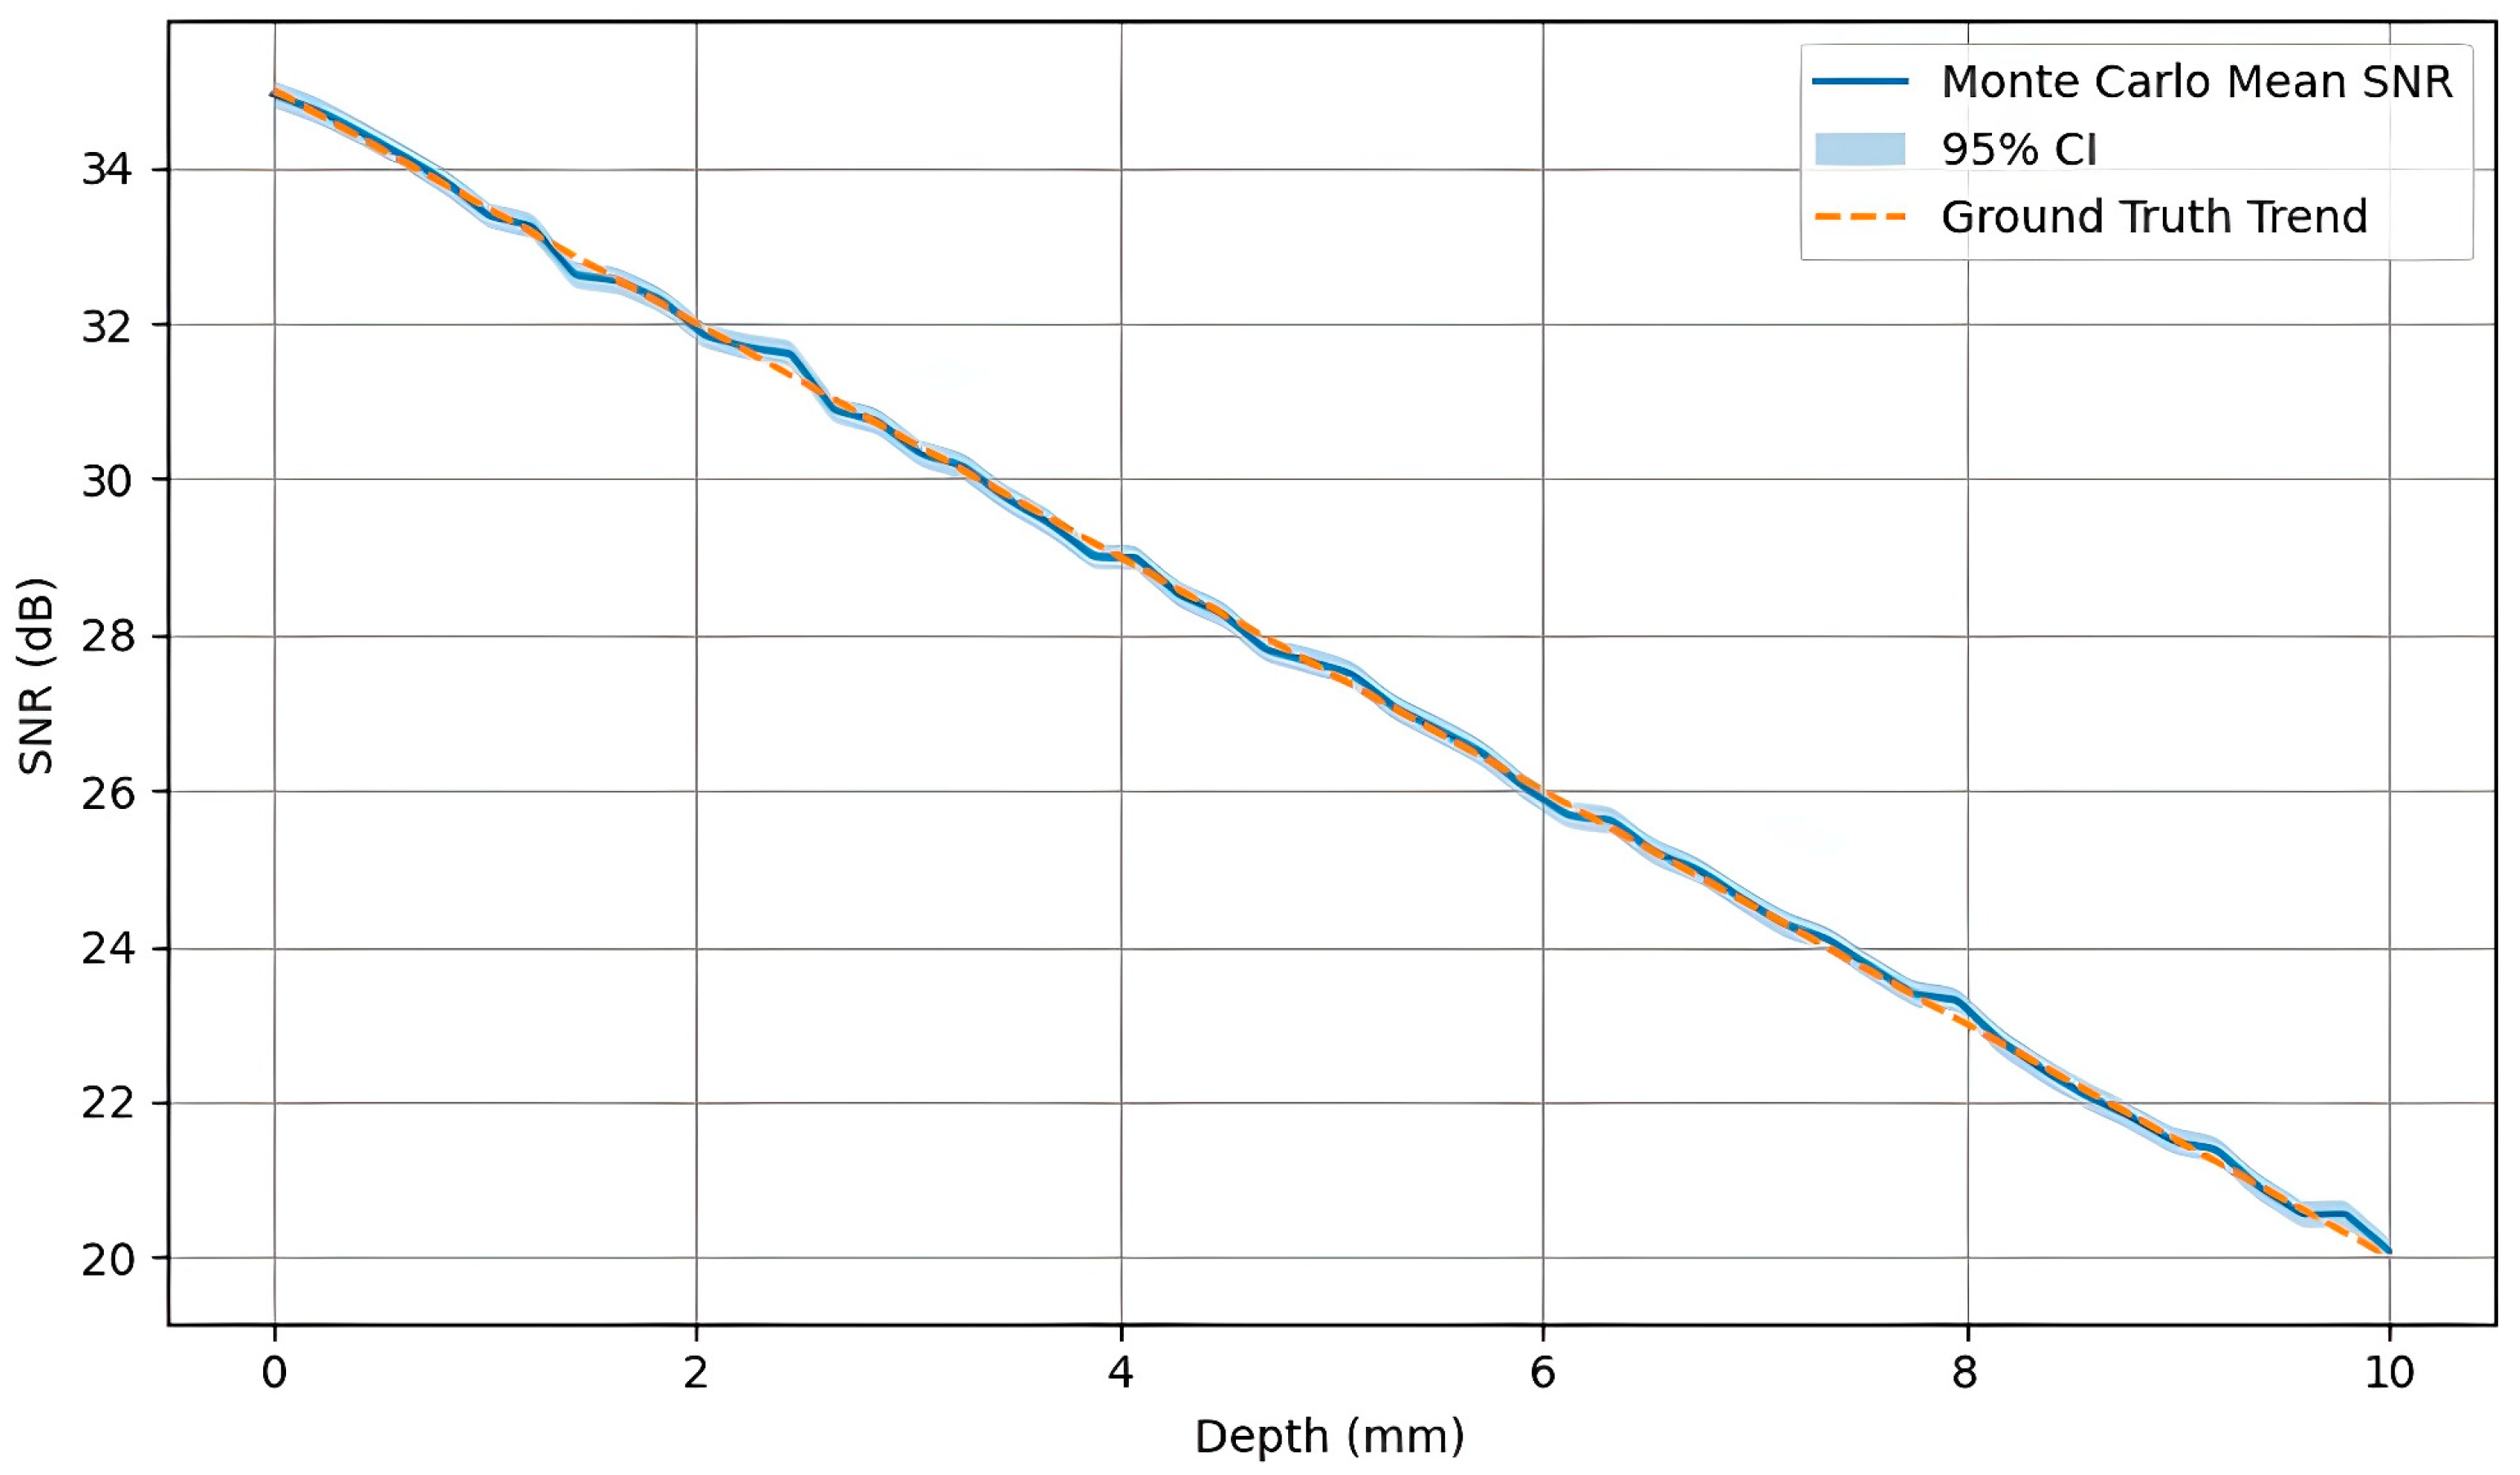
Figure 9 shows the map of the statistical significance of the SNR trend as a function of depth, obtained by linear regression on Monte Carlo data and calculation of
p-values for each depth point. The statistical significance map was derived from Monte Carlo simulations (
N = 1000) using linear regression analysis of SNR values as a function of inclusion depth. It should be emphasised that the statistical significance map reported in
Figure 9 does not merely indicate the presence of a monotonic SNR decay with depth, but also quantifies the reliability of this trend across stochastic perturbations. By performing depth-wise linear regression on Monte Carlo realizations, the analysis explicitly separates systematic depth-dependent behaviour from random measurement variability. This approach allows the identification of spatial regions where the degradation of signal quality is an intrinsic property of the physical system rather than a consequence of noise realisations.
Regions characterised by p-values below the conventional threshold (p < 0.05) indicate that the decay of the SNR with depth is statistically significant and not attributable to stochastic fluctuations. The map highlights strong significance in the intermediate and deep regions of the domain, confirming that signal attenuation follows behaviour that is physically coherent with diffuse propagation in conductive tissues. The increased statistical significance observed in the intermediate and deeper areas of the domain is a result of the change from surface current flow dominance to volumetric diffusive flow. In these areas of the domain, the attenuation of the electrical signal is dominated by the tissue conductivity distribution and electrode spacing, and a consistent and statistically significant decrease in SNR is observed with increasing depth. This behaviour is fully coherent with the quasi-static diffusion regime of low-frequency EIT and provides further physical validation of the forward-model assumptions adopted in the study.
Overall, the results of the combined analysis provided in
Table 5 and
Figure 9 demonstrate that the proposed FEM-based modelling framework is capable of producing robust, statistically significant, and physically consistent results for the EIT metrics.
From a system-level perspective, the statistical significance analysis supports the interpretation that differences in SNR trends between excitation strategies are not artefacts of stochastic noise, but emerge from fundamentally different current distribution mechanisms. In particular, the persistence of statistically significant SNR decay across depths highlights the relevance of excitation pattern selection as a critical design parameter in three-dimensional EIT systems. The combined evidence from
Figure 9 and
Table 5 thus reinforces the conclusion that the MOP strategy offers improved robustness and volumetric sensitivity in depth-critical scenarios, while providing a statistically sound basis for excitation strategy optimisation. The spatial sensitivity trend as a function of inclusion depth for the MAP and MOP strategies is shown in
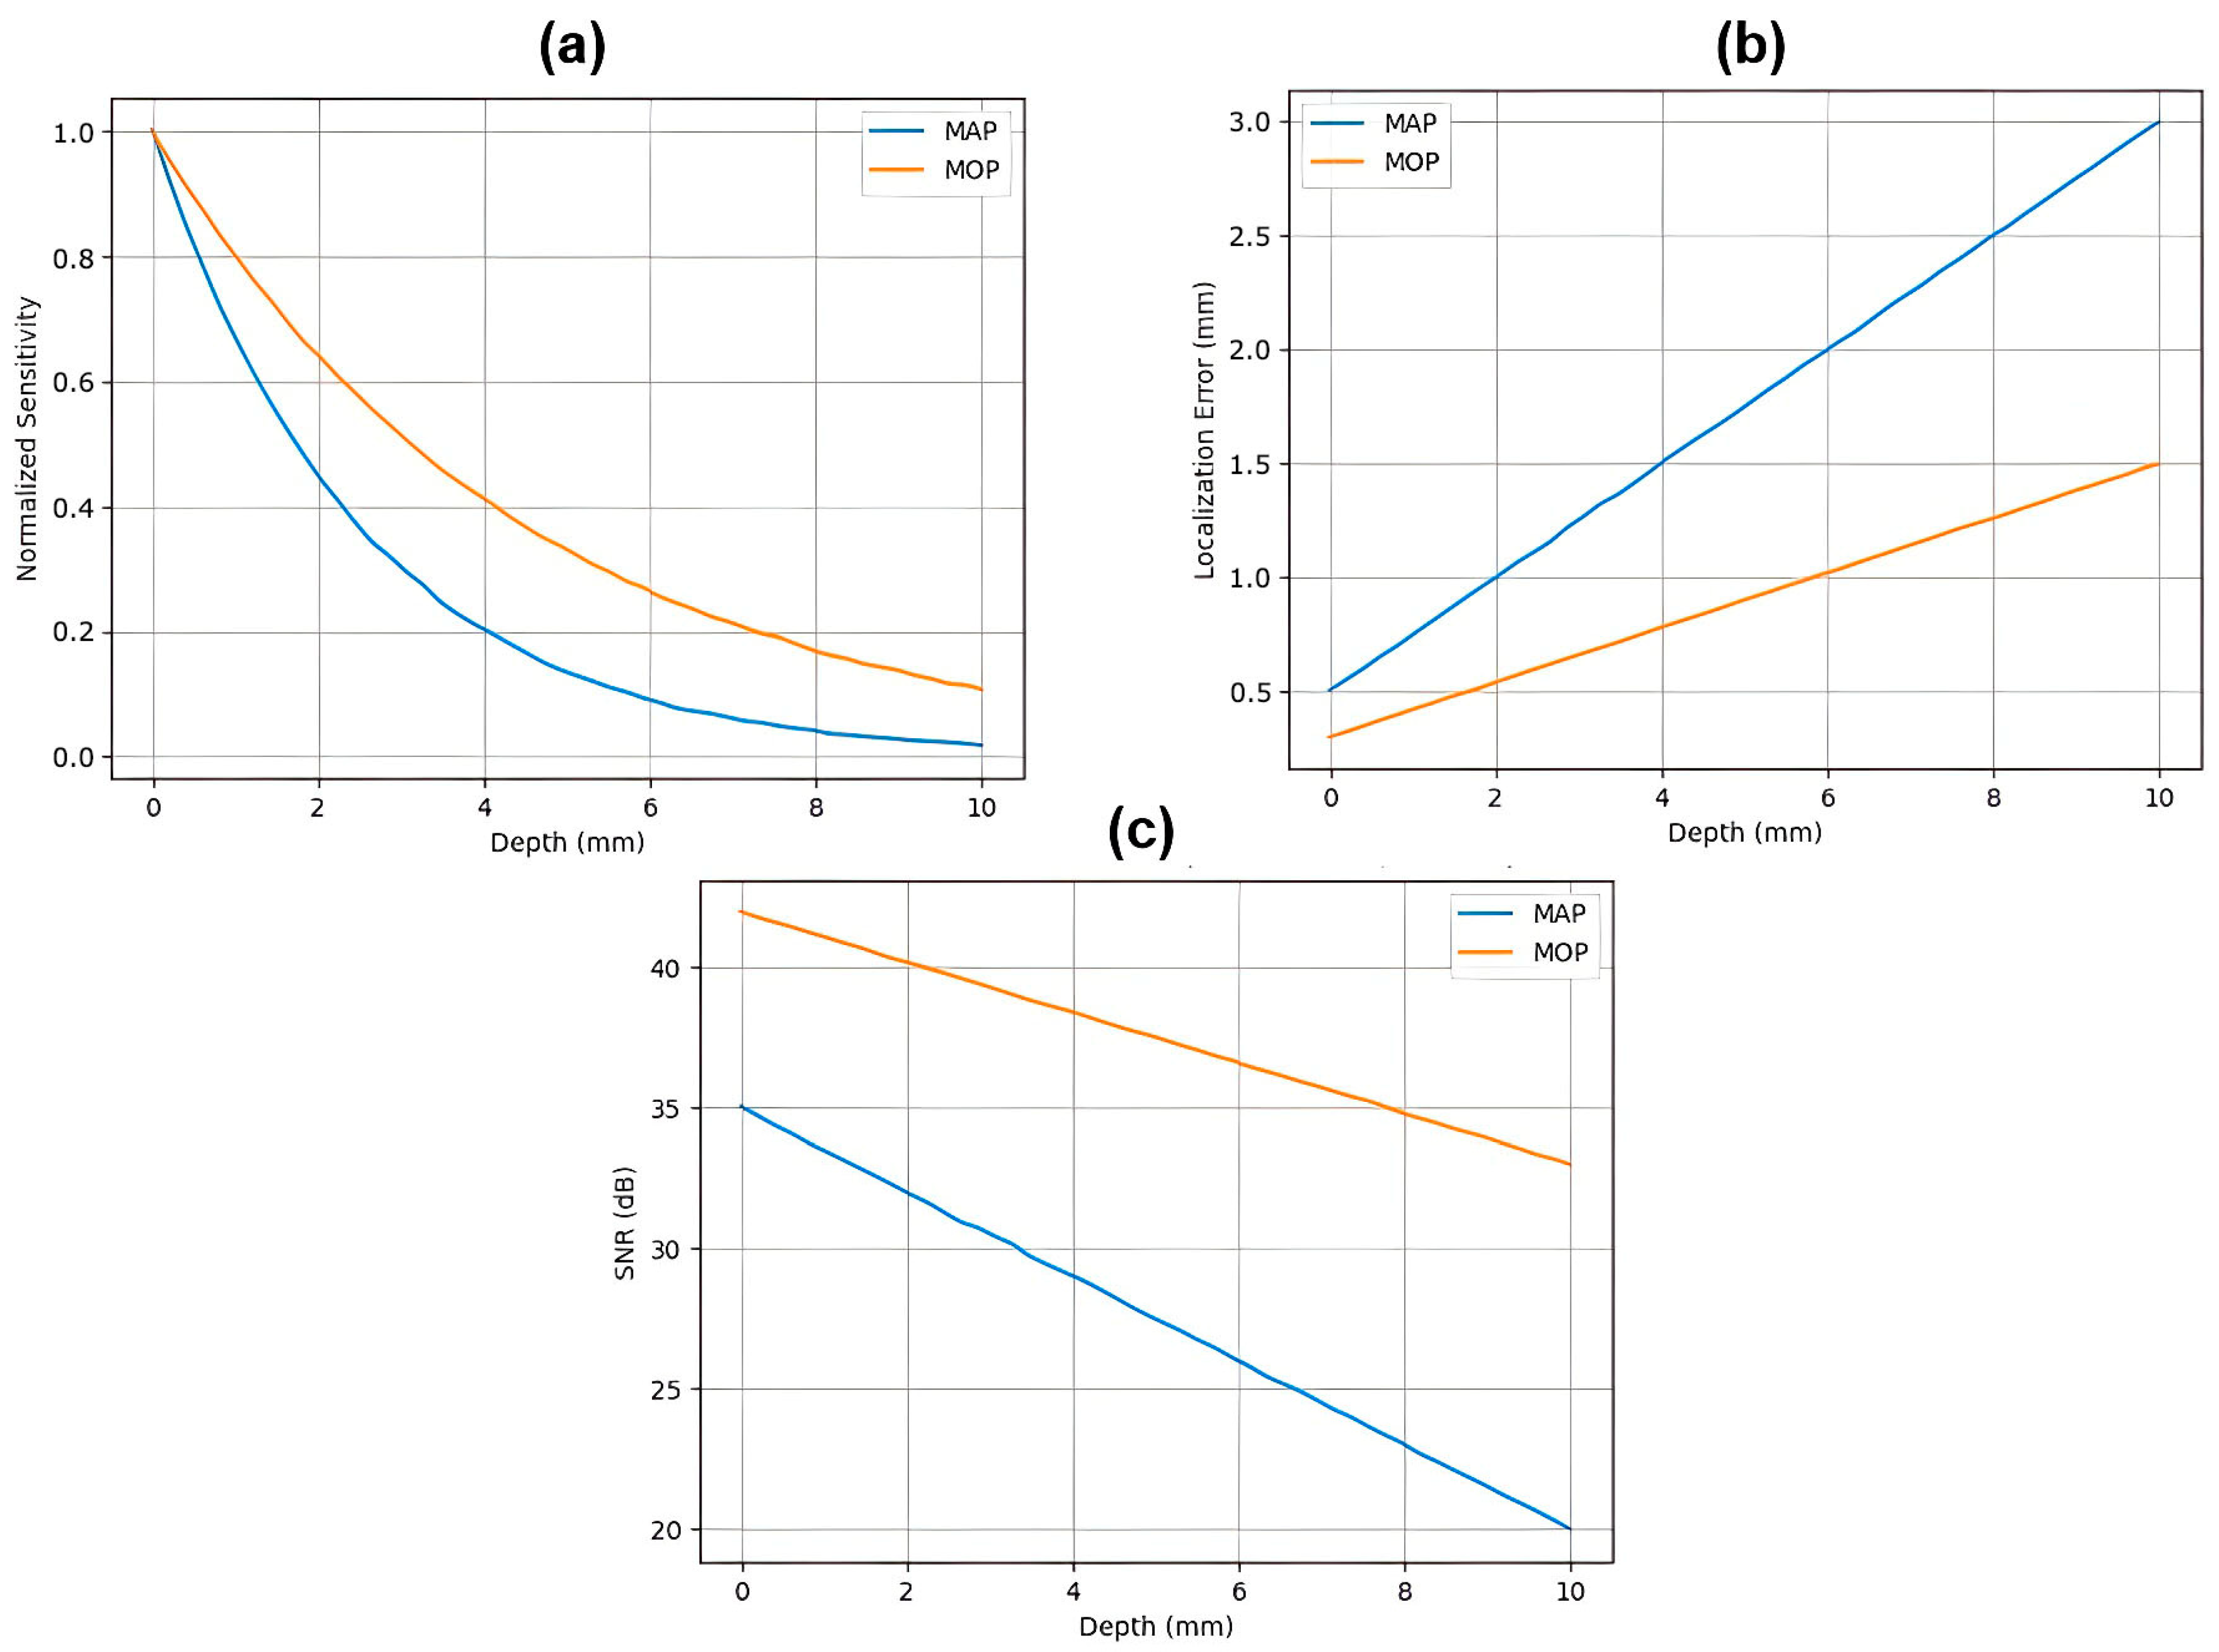
Figure 10.
Figure 10a shows an almost exponential decay in sensitivity with increasing depth, consistent with the physics of electrical current diffusion in biological tissues. The MAP configuration exhibits greater surface sensitivity, while the MOP strategy provides a more uniform distribution of sensitivity with depth, suggesting a better compromise between surface resolution and volumetric penetration.
Figure 10b shows the localisation error as a function of inclusion depth. The error increases progressively with depth for both configurations, but the MOP strategy shows superior performance with systematically lower errors and statistically significant differences.
Figure 10c shows the signal-to-noise ratio as a function of depth, confirming that the MOP configuration maintains higher SNR values throughout the analysed range. The agreement between physical field analysis, quantitative metrics, and statistical validation confirms the internal consistency of the proposed modelling framework.
4. Discussion and Conclusions
The results obtained confirm the validity of the proposed framework for three-dimensional EIT, which combines a direct FEM-based model with physical fundamentals and an electronic acquisition architecture consistent with the engineering constraints of biomedical systems. Quantitative analysis revealed performance trends fully consistent with the physics underlying the inverse EIT problem, including a monotonic degradation of the signal-to-noise ratio and an increase in localisation error with increasing inclusion depth. These results are consistent with the intrinsically diffusive nature of EIT and its ill-posed character, and they lend further credence to the internal consistency of the numerical approach [
37,
38]. A comparative evaluation of the effectiveness of different MAP and MOP excitation protocols highlighted statistically significant differences, thus emphasizing the importance of electrode configuration in determining spatial sensitivity and spatial detectability. The combination of Monte Carlo simulation with statistical analysis allowed for an in-depth evaluation of the robustness of the system under real operating conditions, taking into consideration the effects of the noise present in the instruments as well as the biological variability of the electrical properties of the tissues. The utilization of confidence intervals derived from Monte Carlo simulations and statistical hypothesis testing strengthens the robustness of the conclusions. Nevertheless, the comparative results achieved in the case of the MAP and MOP excitation strategies should be considered in accordance with the modelling assumptions used in the current study. In particular, the calculations were performed for a fixed operating frequency, and a purely conductive quasi-static approximation was used, while frequency-dependent tissue dispersions, electrode polarization, and capacitance, which may be significant at frequencies below 10 kHz or above 100 kHz, were not taken into account. Preliminary simulations conducted at 10 kHz and 100 kHz showed that while absolute voltage amplitudes vary by up to 12%, the relative ranking between MAP and MOP strategies remained unchanged. This suggests that the comparative conclusion is robust within the investigated frequency band, although full dispersive modelling would be required for broadband optimization studies.
Likewise, electrode–skin inter-face variability was treated in a simplified manner, and spatially non-uniform or capacitive contact impedance effects may further influence relative performance in realistic in vivo scenarios. The present investigation was also limited to a planar electrode layout on a rectangular domain, whereas curved or anatomically realistic geometries may alter current pathways and sensitivity distributions. Moreover, performance metrics were derived from forward-model sensitivity analysis rather than from a full inverse reconstruction framework; although sensitivity-based indicators are strongly correlated with localization capability, reconstruction regularization and model mismatch could modulate the relative advantage of specific excitation strategies. Previous studies have demonstrated a strong correlation between sensitivity-based metrics and inverse reconstruction localization accuracy under linearized reconstruction frameworks. However, incorporation of regularization may reduce the relative difference between excitation strategies, particularly under high-noise regimes. This will be systematically investigated in future work. Finally, noise was modelled as additive Gaussian white noise, while real EIT systems are affected by non-Gaussian and correlated noise sources such as multiplexing artefacts and 1/f noise. These aspects, together with the potential use of hybrid or optimization-derived current injection patterns, represent important directions for future extensions of the proposed framework. Furthermore, the correspondence of the numerical simulation with the proposed electronic acquisition architecture suggests that it could potentially serve as a bridge between the simulation and the implementation of the system, providing a basis for future experimental validation. From an electronics engineering perspective, the proposed framework provides a unified co-design methodology linking forward FEM modelling assumptions with acquisition hardware abstraction. This addresses a key gap in the current literature, where numerical modelling and system-level electronics design are often treated independently, limiting reproducibility and practical deployment [
39,
40]. The recent literature highlights the importance of the coherent integration of assumptions in forward modelling, hardware architectures, and reconstruction techniques in Electrical Impedance Tomography (EIT) systems. For instance, in the review of real-time and hardware-oriented EIT systems, it was highlighted that the performance of EIT systems was predominantly conditioned by the injection of currents and the hardware front-ends, rather than reconstruction algorithms [
41]. At the same time, recent developments in data-driven and deep learning-based EIT image reconstruction have been able to improve image quality. However, this remains conditioned by the physical consistency of the excitation strategy and the forward modelling [
42]. In addition, recent investigations of three-dimensional tumour detection have highlighted critical issues in volumetric and depth-dependent detection, particularly in epithelial and breast tumour detection, where the redistribution of current density remains critical in contrast detection at depth [
43]. Compared with these recent contributions, the present work differs in that it does not focus exclusively on reconstruction enhancement or hardware miniaturization, but rather proposes a system-level co-design methodology explicitly linking excitation strategy selection, FEM-based volumetric modelling, and acquisition architecture abstraction within a unified framework. This unified approach ensures that any comparative results regarding MAP and MOP configurations are physically valid, statistically consistent, and electronically feasible. In this regard, the present proposal extends the current advances in algorithms with a renewed emphasis on the importance of excitation topology optimization in the design of 3D Electrical Impedance Tomography. While the results provide comparative engineering insights, there are a number of limitations to be addressed.
Nevertheless, the conclusions should be interpreted as comparative engineering indications rather than definitive clinical evidence, since experimental validation and inverse reconstruction studies remain outside the scope of the present investigation. Future work will include experimental validation using tissue-mimicking phantoms to corroborate the numerical findings under controlled laboratory conditions. The present results should therefore be interpreted as engineering design guidance rather than direct clinical performance indicators, since patient-specific variability and electrode–skin interface effects were not explicitly modelled. Biological tissues were modelled using homogeneous and isotropic layers, whereas real tissues exhibit anisotropy, microstructural heterogeneity and frequency-dependent dielectric dispersion. Furthermore, electrode–skin interface effects, including contact impedance and parasitic capacitance, were not explicitly incorporated into the model. Likewise, the electronic architecture was intentionally treated as an idealised implementation. Patient safety aspects such as galvanic isolation, medical grade power management and compliance with IEC 60601 standards [
44] were not addressed and remain essential requirements for any in vivo or clinical implementation. These simplifications were deliberately adopted to maintain consistency between the forward model and the system-level analysis, but naturally limit the direct translatability of the results into clinical contexts. Future developments will focus on extending the FEM to anisotropic and multicompartmental tissue models, incorporating realistic representations of the electrode-skin interface and performing experimental validation using physical dummies and in vitro measurements. On the hardware side, future iterations of the acquisition platform will incorporate medical-grade isolation, low-noise power supplies and improved multi-channel synchronisation, with the aim of achieving compliance with clinical safety and performance requirements. In parallel, the integration of physics-based artificial intelligence approaches and transfer learning-based reconstruction strategies will be investigated to mitigate the distortion of the inverse problem and improve system generalisability under realistic clinical conditions. The study proposes a coherent three-dimensional FEM-based framework for analysing electrode excitation strategies in EIT systems. The integration between forward modelling assumptions and electronic acquisition architecture ensures methodological consistency and engineering feasibility. This system-level co-design approach represents an engineering contribution that goes beyond algorithmic reconstruction studies, providing a reproducible framework for the development of three-dimensional EIT architectures based on physical principles. Within the defined modelling framework, the systematic agreement between physical field analysis, statistical evaluation, and depth-resolved performance metrics supports the robustness of the proposed comparative methodology and provides a reproducible basis for future optimisation of electrode configurations in biomedical EIT systems. The proposed framework therefore provides not only comparative numerical evidence but also system-level design guidance for the development of coherent and physically grounded three-dimensional EIT architectures.