3.1. Synthetic Dataset for Track Projections
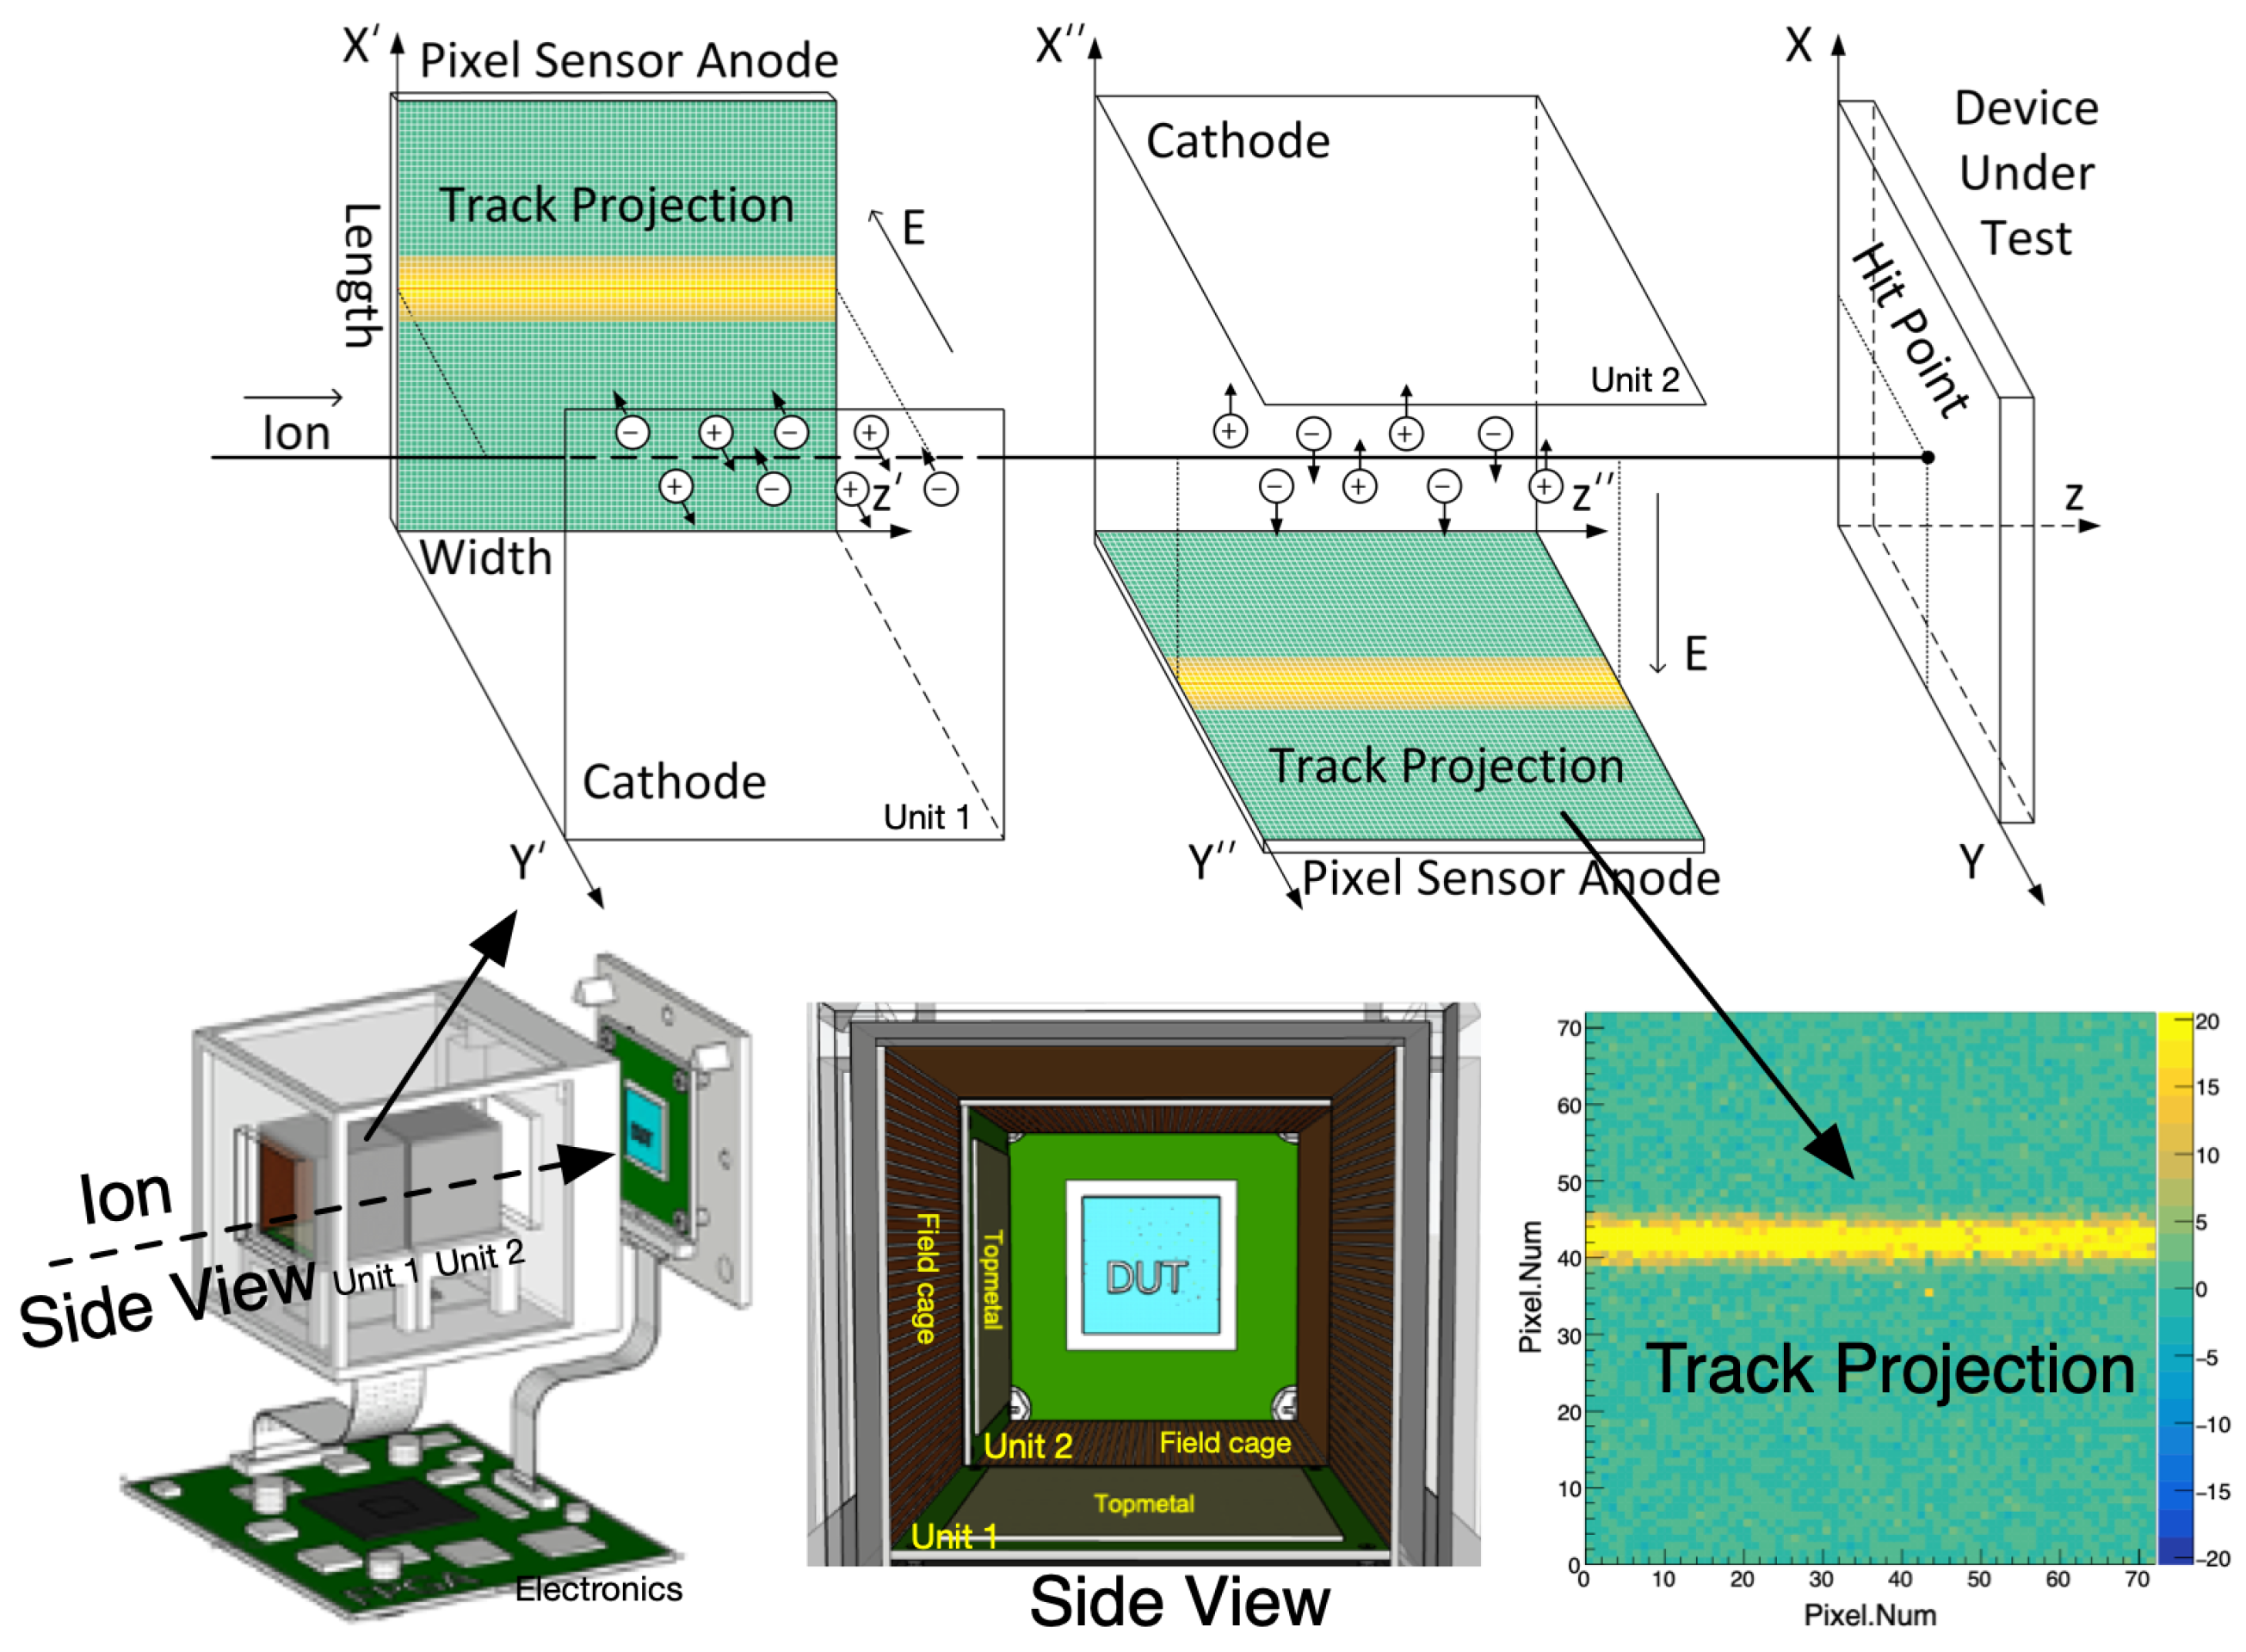
To quantitatively evaluate the proposed detector, a synthetic dataset is constructed that mimics the heavy ion track projections recorded by the Topmetal-based beam tracking system. Each sample corresponds to a single projection frame on one anode plane and is represented as a grayscale image of size pixels. The gray level of each pixel reflects the collected charge on the corresponding pad, resulting in slender bright bands where charged particle tracks traverse the sensitive volume. At the same time, the remaining regions are dominated by stochastic electronic noise and baseline fluctuations.
The intensity model is based on the fundamental physics of charge deposition and diffusion in a gaseous drift cell. A heavy ion traversing the gas volume deposits energy along its track according to the stopping power. The deposited energy is converted into ionization electrons with a mean work function and is further reduced by an effective charge collection efficiency, which accounts for recombination and imperfect transport. The total number of electrons associated with a track is proportional to its physical length, the stopping power, and the collection efficiency. This electron yield is then mapped to the analog to digital converter values through a fixed conversion factor. In the simulator, the electrons are distributed along an ideal straight segment that represents the track projection on the anode plane. Each elemental cloud is broadened transversely by a Gaussian kernel whose width is set by the diffusion coefficient and the drift distance in the uniform electric field. The broadened charge distribution is accumulated on the image grid to form a frame. Independent Gaussian noise with zero mean and unit variance is added to every pixel to emulate residual electronic noise and pedestal fluctuations. Negative values are clipped, and a fixed gain factor is applied, so that the simulated frames exhibit elongated bands with realistic widths and intensity variations superimposed on a noisy background.
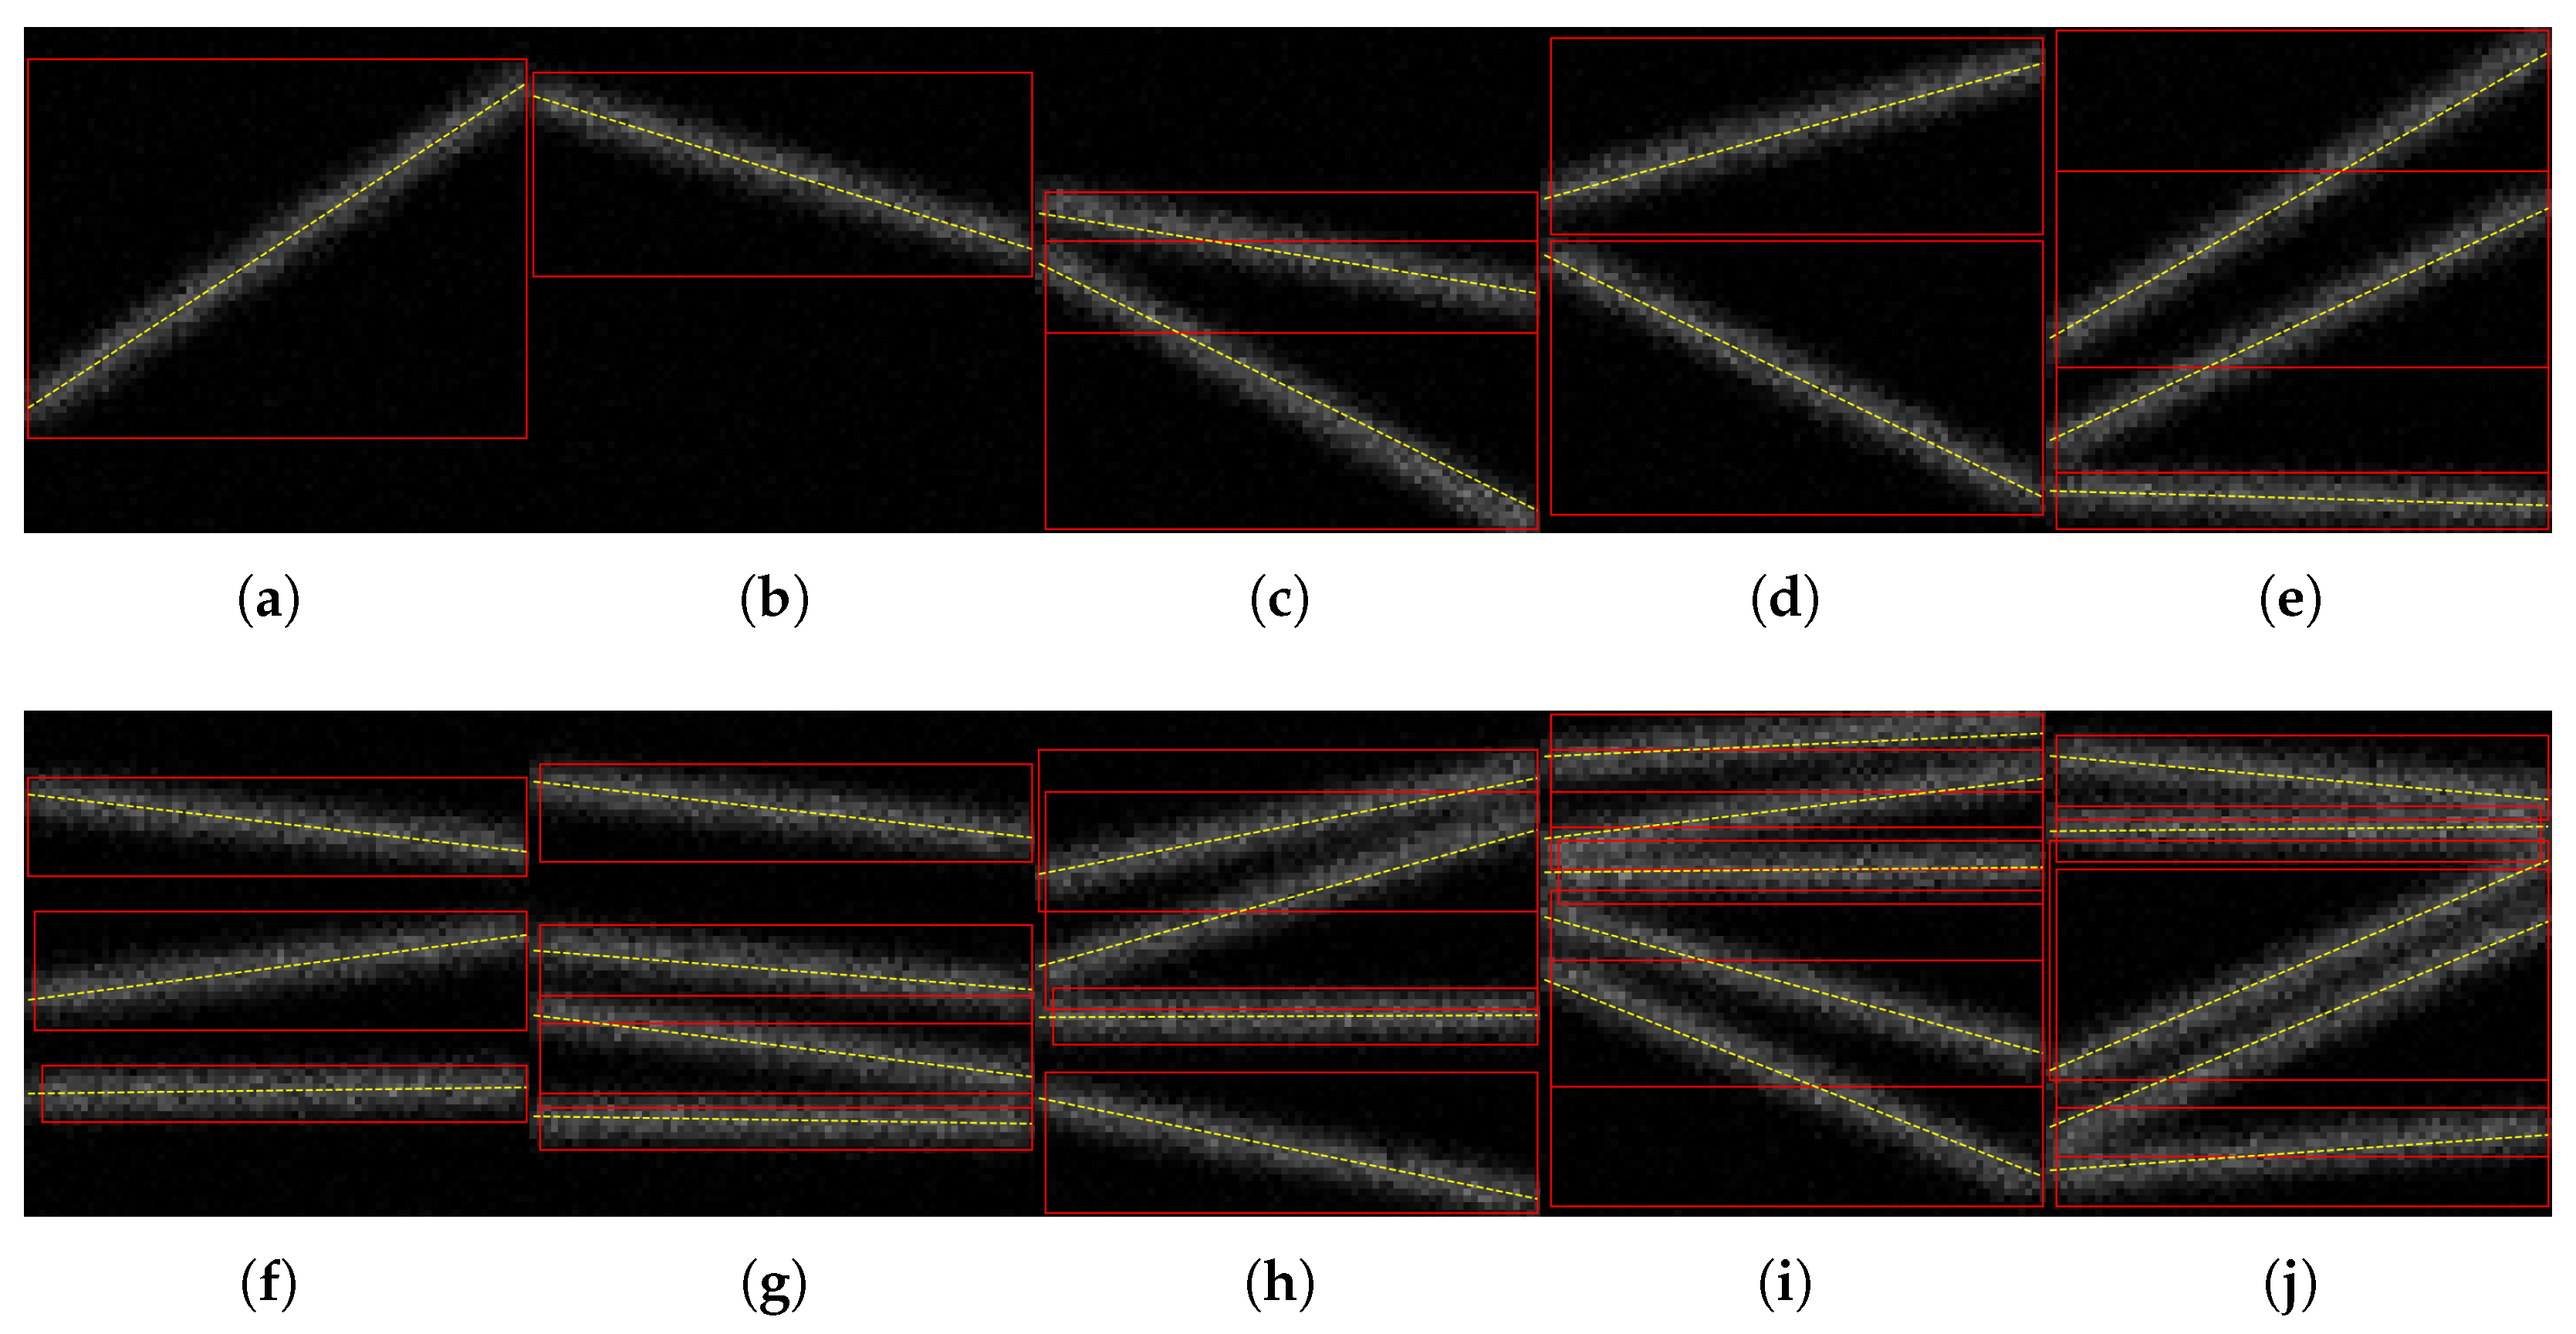
In each synthetic frame, the number of visible tracks is treated as a random variable that reflects the fluctuating multiplicity in real SEE tests. The track count is allowed to range from zero to five, with single-track and two-track configurations being the most frequent, and frames with more tracks occurring with progressively lower probability. Frames without any track serve as hard negatives, regularizing the detector and reducing false alarms. Meanwhile, frames with multiple tracks emulate crowded conditions in which several projections coexist in the same field of view.
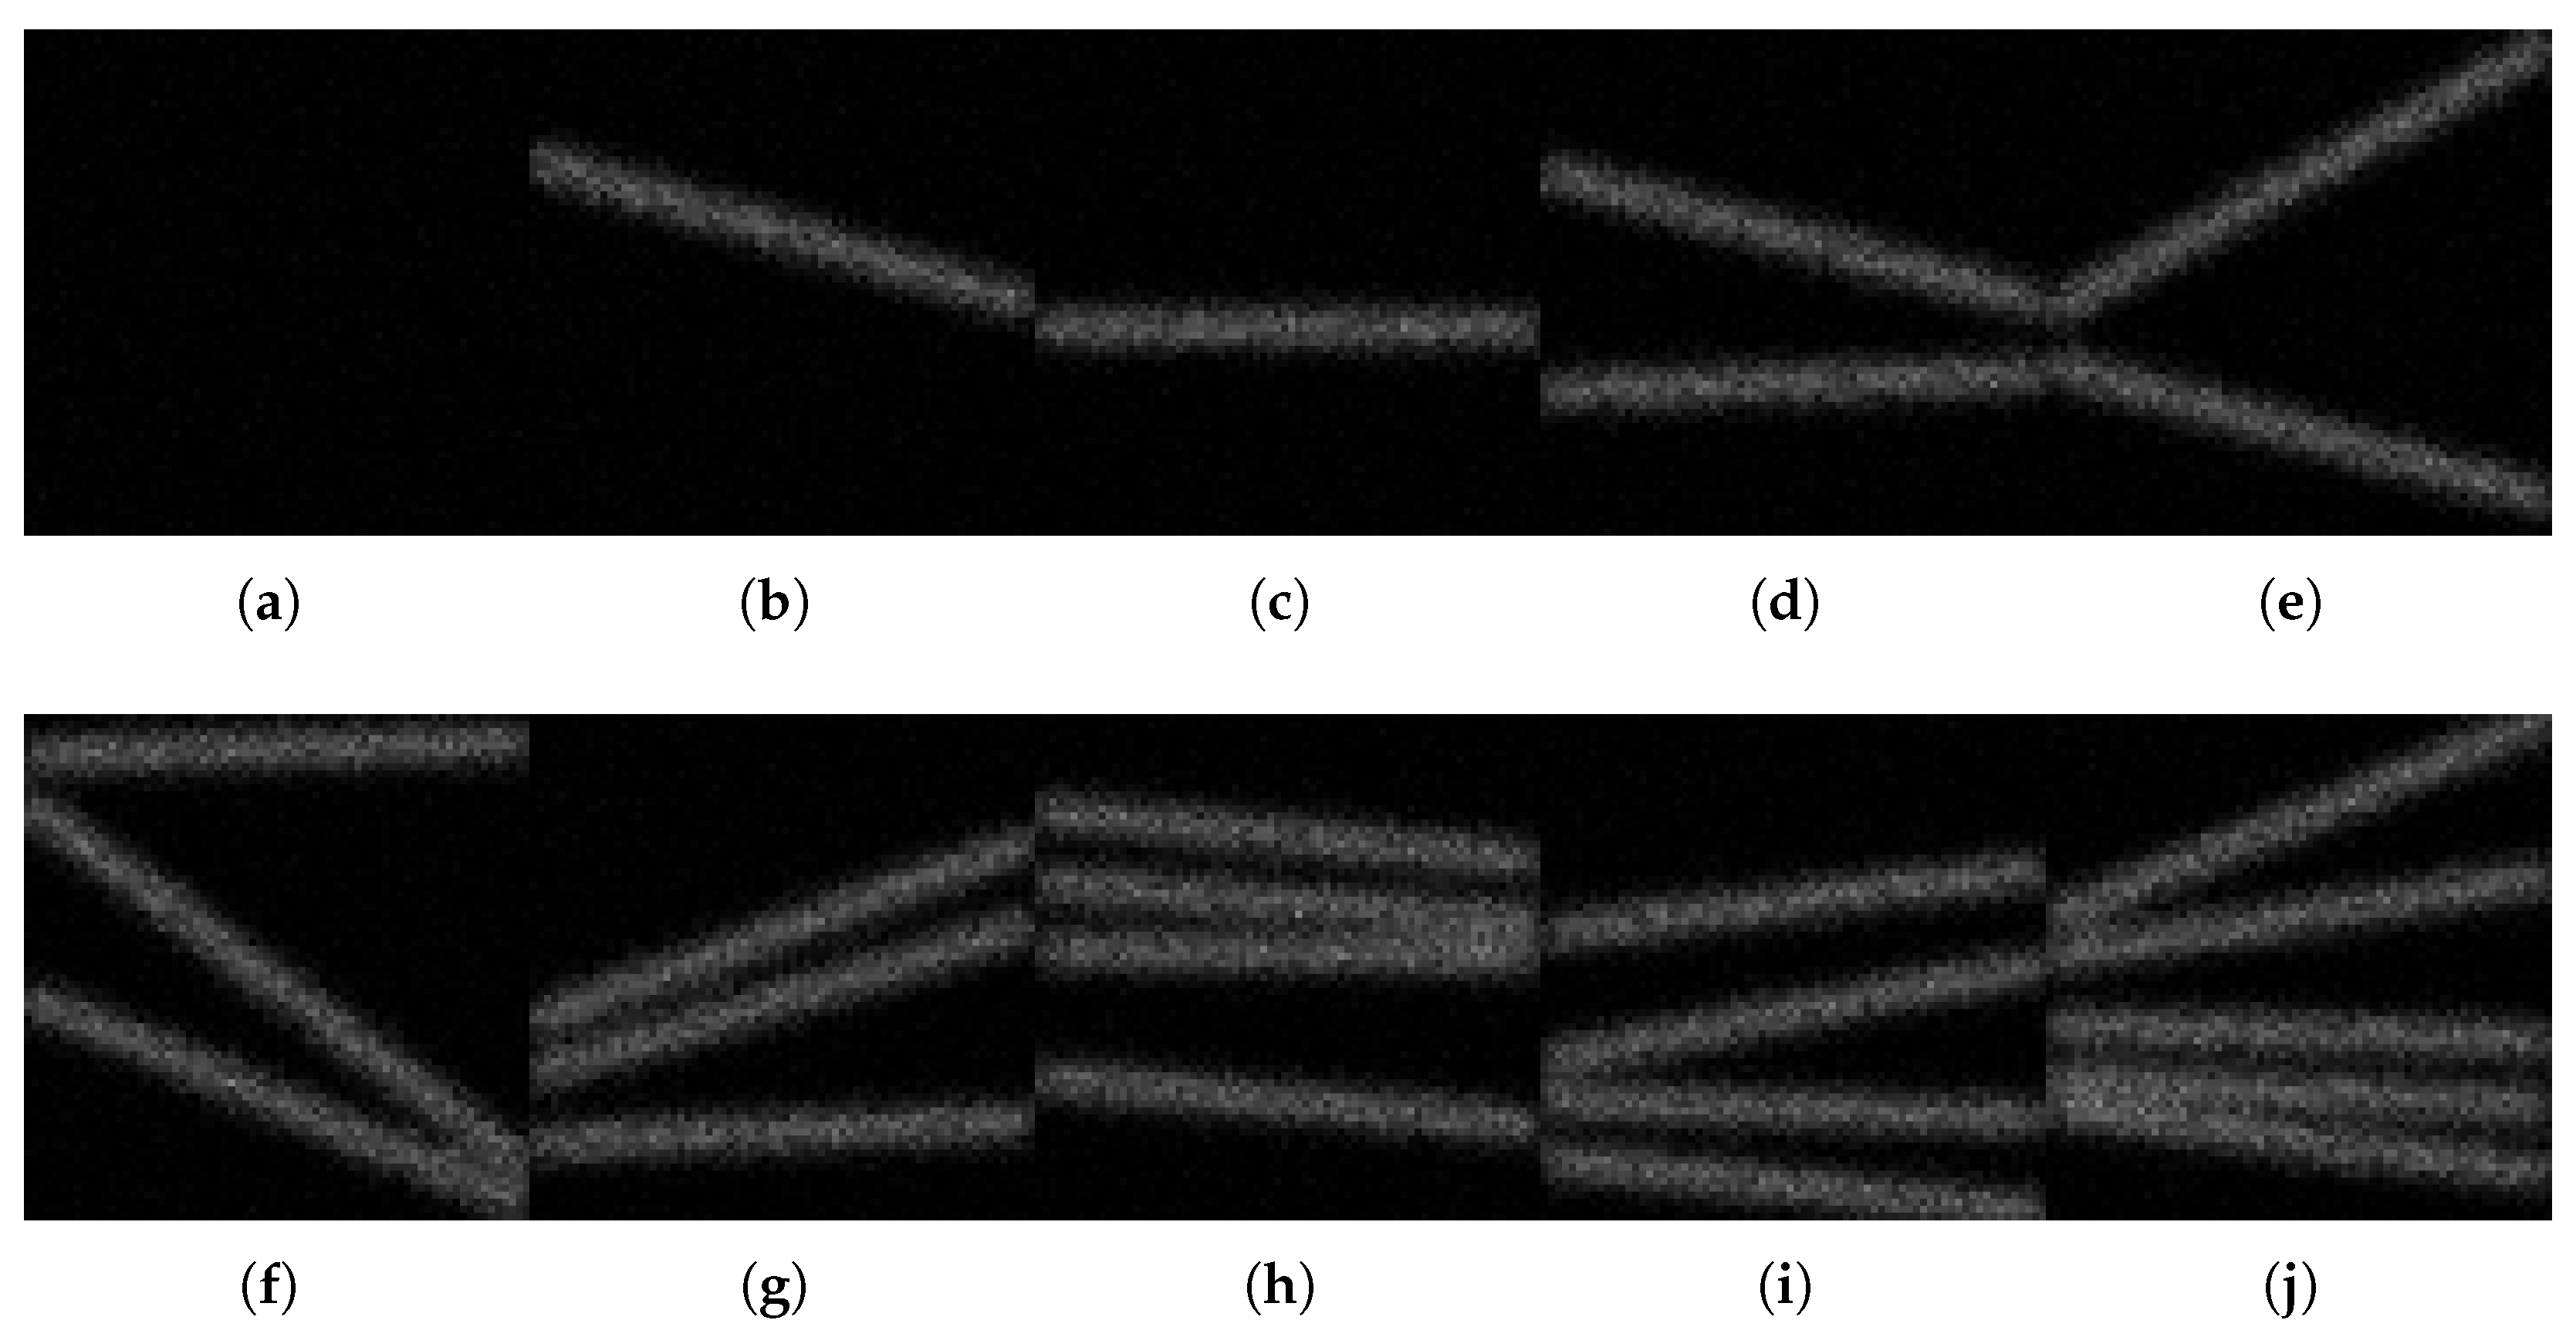
Figure 3 shows representative examples of purely noisy frames, frames containing a single track at different angles, and frames with multiple tracks that span different orientations and positions.
The geometric parameters of each track are specified by the angle
and the intercept
b at the left boundary of the image window. In the generator, the incident angle is drawn from a broad range
so that both shallow and steep projections are represented. At the same time, the intercept
b is sampled across the active vertical extent of the sensor. A small margin is reserved near the top and bottom edges to prevent tracks that only clip the corners, resulting in a negligible visible length. As a result, the synthetic dataset provides a balanced coverage of incident directions and hit positions that reflects the geometric constraints imposed by the detector layout.
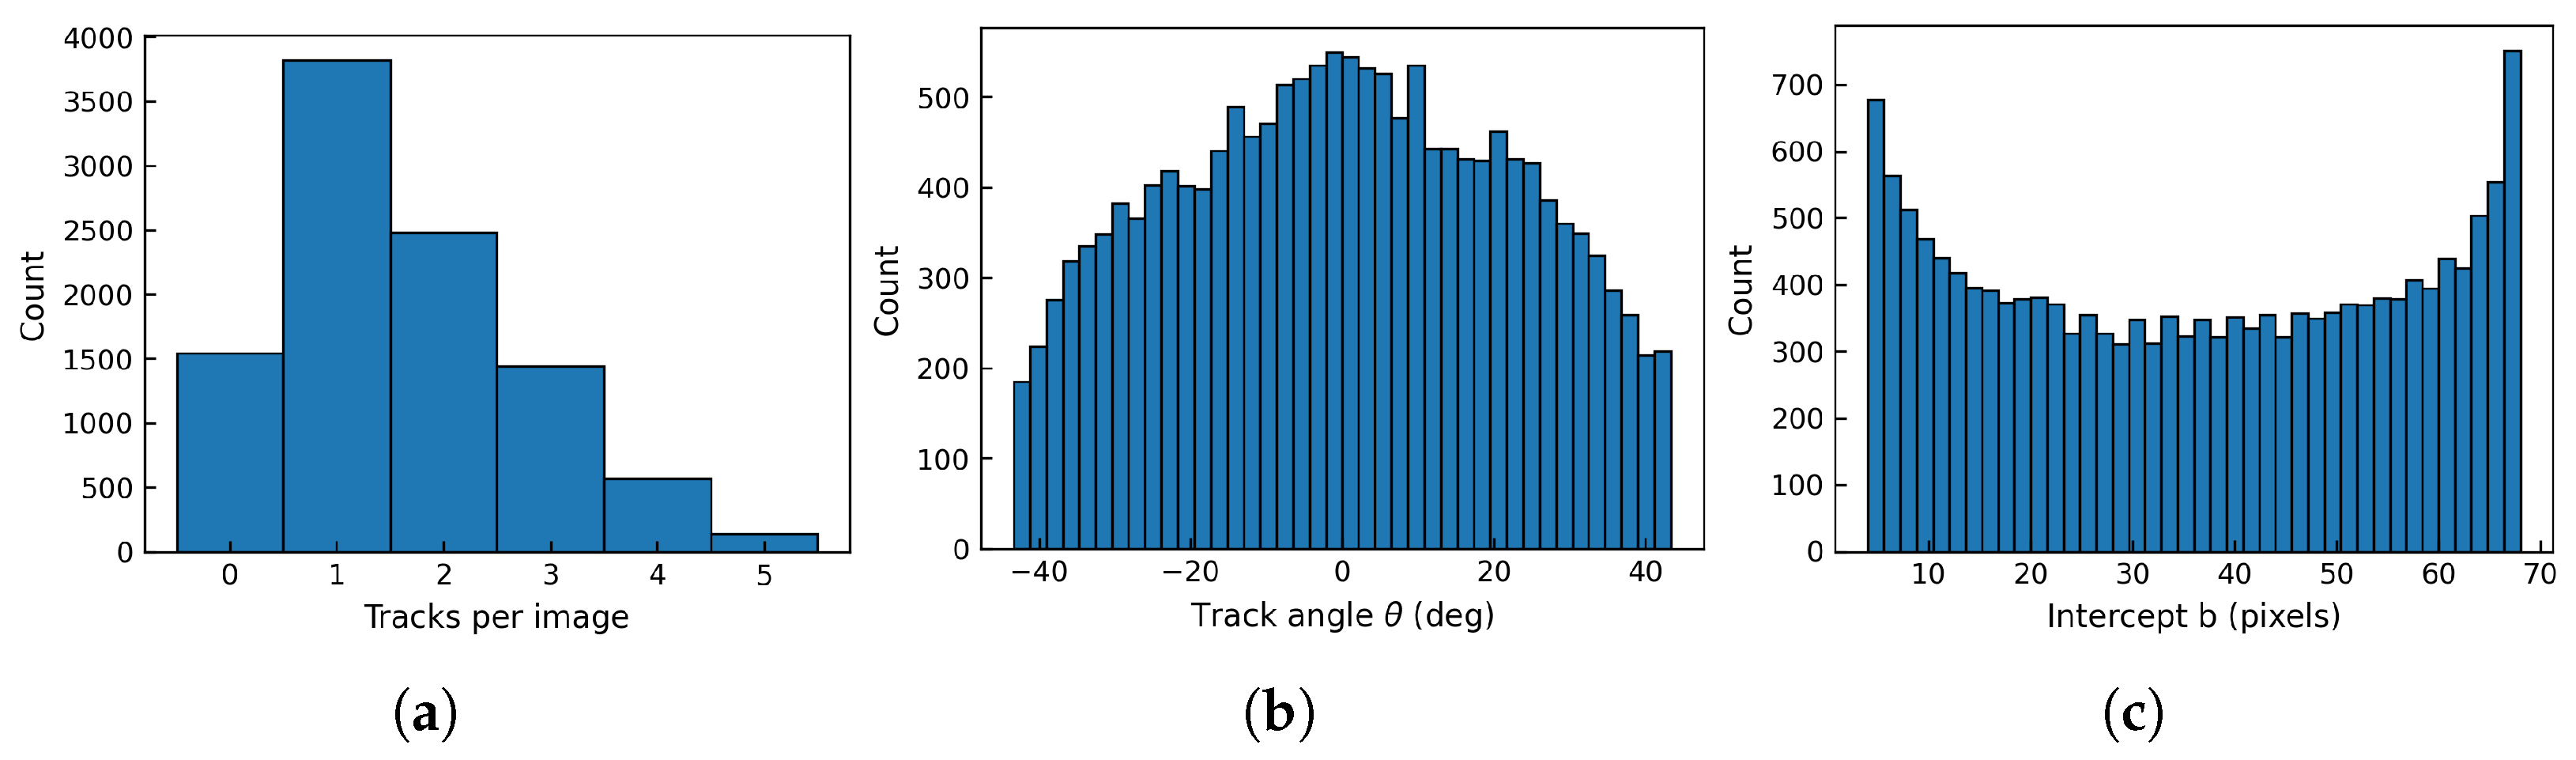
Figure 4 summarizes the resulting distributions of track angles and intercepts over the whole dataset. The angle histogram is close to uniform within the design range, and the intercept histogram is approximately flat in the central region, with a mild decline near the edges due to the active area margin.
For each simulated track, the generator records a bounding box that tightly encloses the broadened segment together with the underlying line parameters
in the image coordinate system. All labels are stored in a unified YOLO-style format with seven entries per track
, where
are the normalized box center coordinates,
are the normalized width and height, and the class index is fixed to zero for particle tracks. The normalized line parameters
are defined as in (
5) and serve as regression targets of the detector. Frames that do not contain any visible track yield empty label files, which act as hard negatives during training.
In total, 10,000 synthetic projection images are generated and randomly split into training, validation and test subsets with an 8:1:1 ratio.
3.2. Training and Evaluation on Synthetic Data
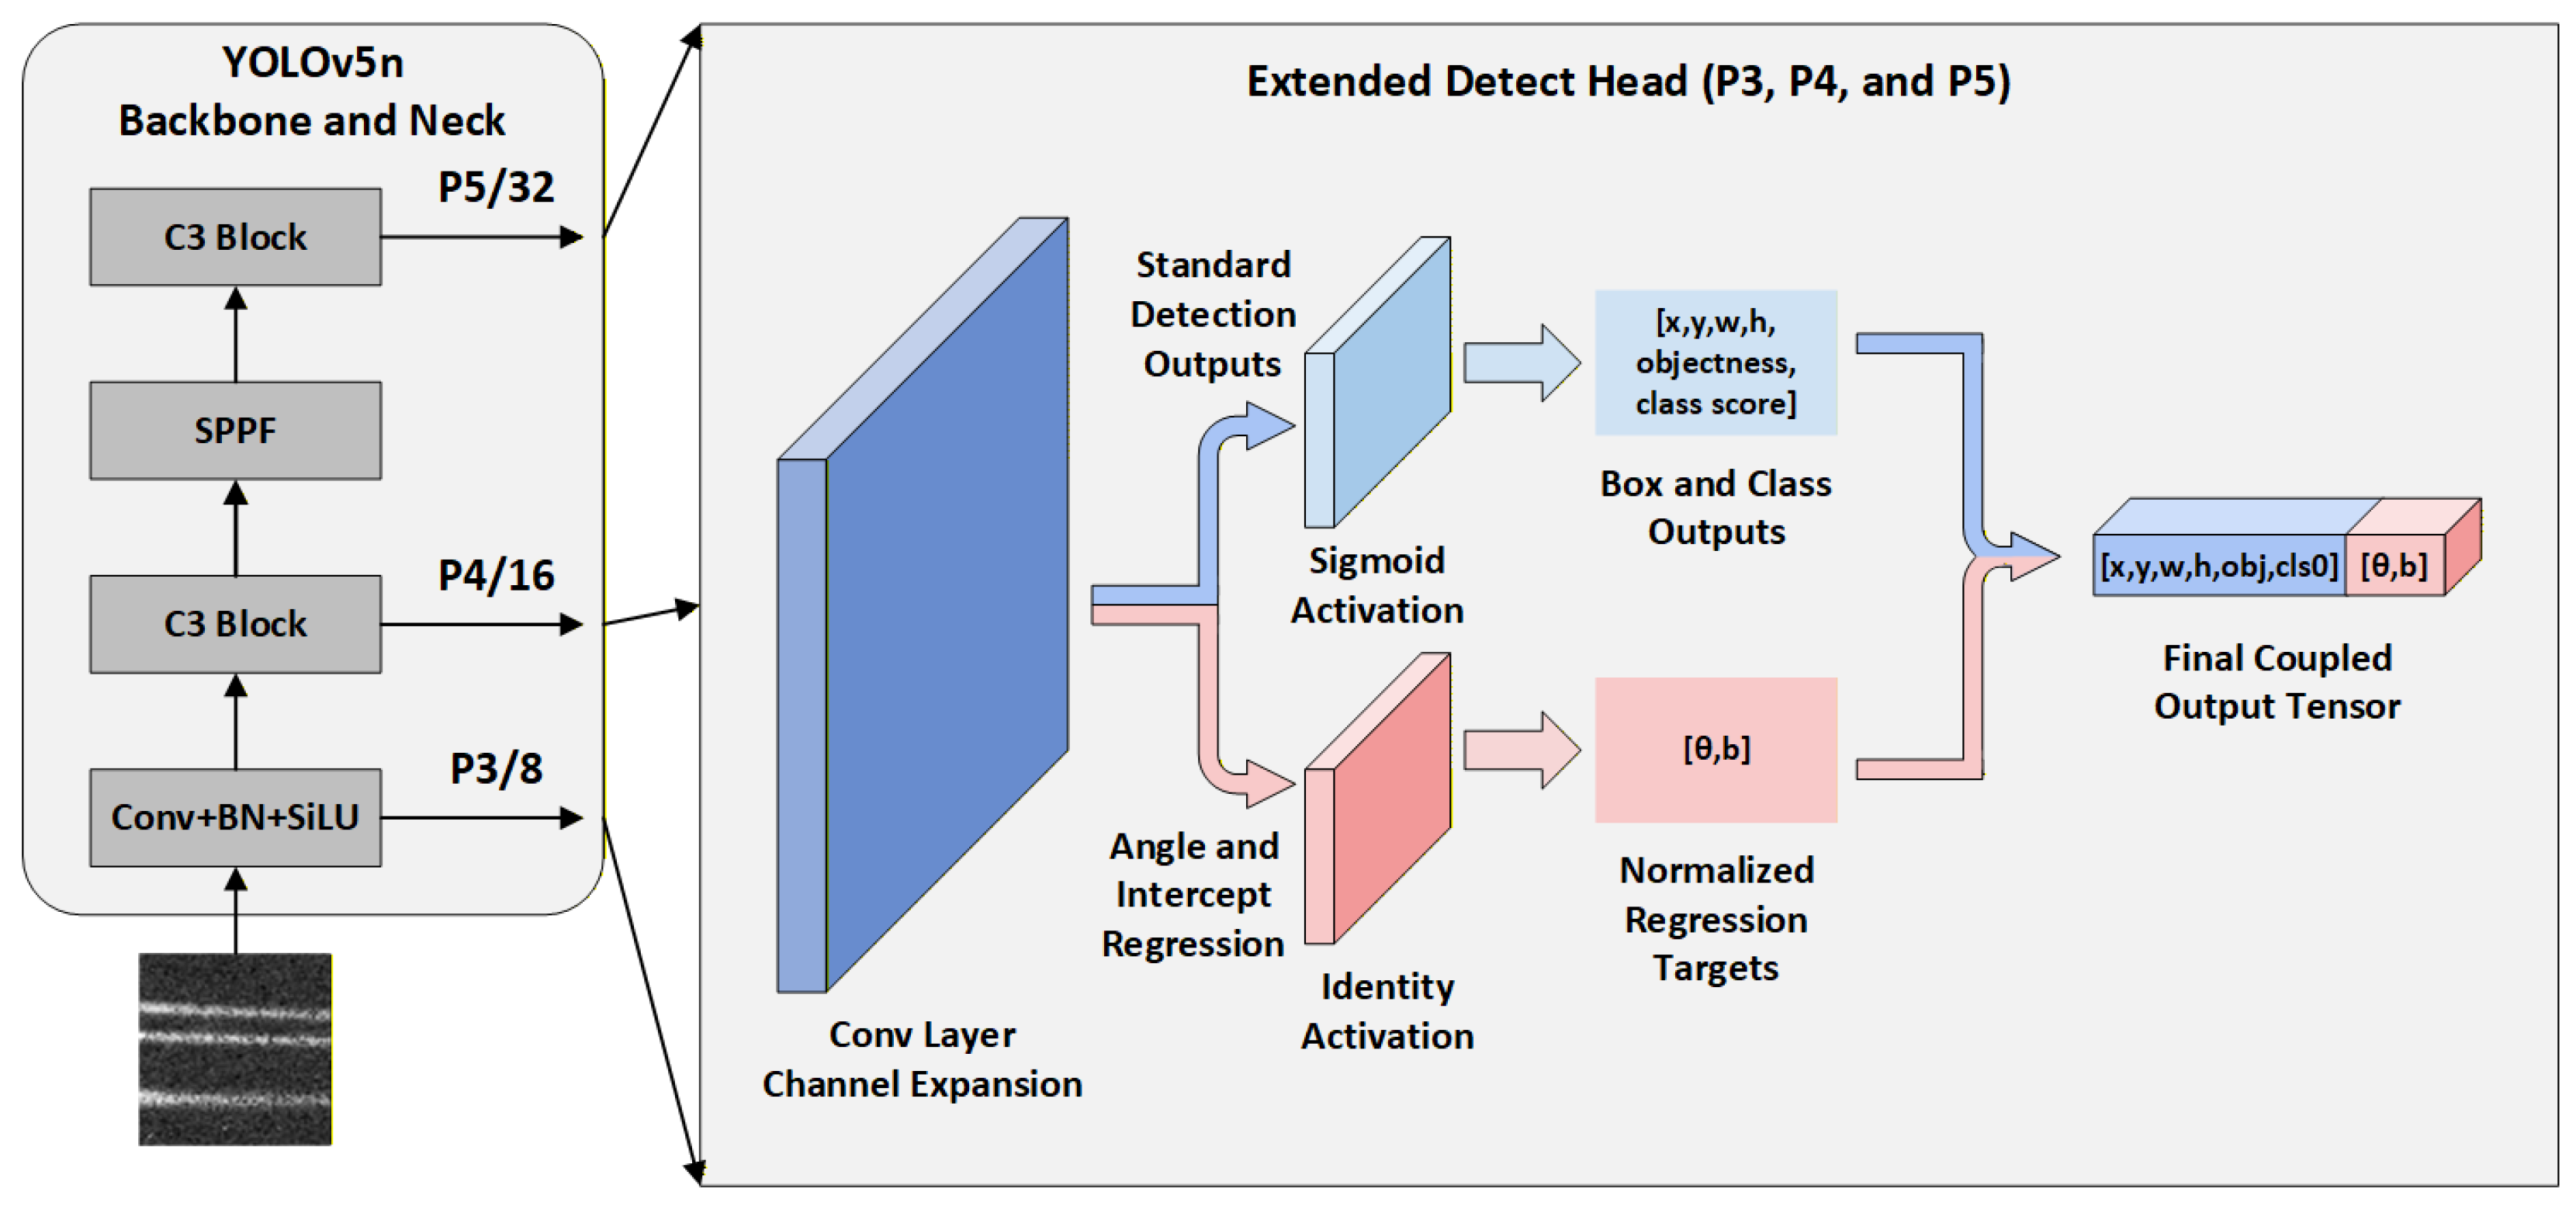
The network is trained by minimizing the multi-task loss
L in (
8), which combines objectness classification, bounding box regression, and direct regression of the line parameters. Optimization is carried out using stochastic gradient descent with momentum and weight decay. A standard YOLOv5 learning-rate schedule is adopted, with
and a final LR factor
, including a 3-epoch warm-up. The model is trained for 300 epochs with a batch size of 128. The initial learning rate is set to
for the detection head and reduced for earlier layers following the standard YOLOv5n training recipe.
Data augmentation is applied with particular care, since the regression targets explicitly encode track geometry. Horizontal flipping is enabled, and the corresponding ground truth parameters are recomputed so that
and
remain consistent in the
coordinate system after transformation. In contrast, spatial augmentations such as random rotation, scale jitter, mosaic, and perspective warping are disabled because they would alter the underlying line geometry and invalidate the parameter labels. Photometric perturbations are retained, as they preserve line structure while improving robustness to intensity variations in real beam projections. The main training and evaluation hyperparameters are summarized in
Table 1.
With the above configuration, training converges stably. The multi-task loss decreases smoothly, and the validation performance follows the same trend, indicating that localization and geometric regression are learned in a balanced manner.
Figure 5 shows representative examples from the synthetic test set. The predicted bounding boxes and the regressed line parameters are overlaid on the input projections. As shown, the proposed model robustly localizes track candidates across different track configurations and reconstructs the corresponding line geometry with good visual consistency.
Quantitative performance on the synthetic test set is evaluated using fixed confidence and NMS IoU thresholds.
Table 2 summarizes the standard detection metrics of the proposed detector, together with the Mean Absolute Errors (MAEs) of the regressed angle and intercept. For a set of
N matched tracks, the angle and intercept MAEs are computed as
where
are the line parameters predicted by the network and
are the corresponding reference values in the synthetic test set.
For comparison, we evaluate two classical fitting-based baselines, a Hough detector and an RANSAC-based line fitter, and a modern lightweight detector, YOLOv8n, on the same synthetic test set. Hough and RANSAC output line hypotheses rather than bounding boxes. Precision and recall are computed at the track level under the same matching protocol. The MAEs of the angle and intercept quantify geometric accuracy. YOLOv8n produces bounding boxes. The line parameters are obtained by applying an RANSAC line fit within each predicted ROI, yielding consistent evaluations of across all methods.
Table 2 summarizes the results. The proposed model achieves a precision of 0.9626 and a recall of 0.9493. Direct parameter regression yields MAEs of 0.3930° for the angle and 0.4842 pixels for the intercept. The Hough baseline achieves a recall of 0.9427 but has a lower precision of 0.9024. The geometric errors increase to 1.0035° and 2.6094 pixels, consistent with over-detection under noisy backgrounds. RANSAC provides strong detection and improved geometry, with a precision of 0.9436, a recall of 0.9584, an angle MAE of 0.4135°, and an intercept MAE of 0.6013 pixels. The proposed model remains more accurate in parameter estimation. YOLOv8n attains a precision of 0.9952 and a recall of 0.9938, while the recovered parameters show larger errors of 2.5371° and 3.1593 pixels. YOLOv8n is optimized for bounding box localization. The subsequent ROI-based RANSAC fitting is sensitive to slight localization bias and background residuals, which degrade the recovered line parameters.
We further evaluate robustness on the synthetic test set by injecting additive white Gaussian noise into the input frames to achieve controlled Signal-to-Noise Ratio (SNR) levels.
Table 3 reports track-level precision, recall, and the MAE of the estimated line parameters on matched true positives.
The results show stable performance above 25 dB. Precision and recall remain above 0.93. The angle MAE remains below 0.67 degrees. The intercept MAE remains below 0.74 pixels. As SNR decreases further, detection performance degrades gradually. Precision and recall drop to about 0.90 at 20 dB and to about 0.88 at 15 dB. At 10 dB, the method still maintains a precision of 0.8186 and a recall of 0.8111. The overall trend indicates a clear operating range, with reliable localization at moderate SNR and a graceful degradation pattern under severe noise.
3.3. Ablation Studies
We conduct ablation experiments to examine key design choices of the proposed detector, including the regression branch, the input channel representation, the backbone capacity, and the regression loss weight.
Table 4 reports the results. Precision and recall are computed using a track-level matching protocol at an IoU of 0.50. The mean Average Precision (mAP)@0.5 metric is obtained from the official YOLOv5 evaluation routine. The quantities MAE
and MAE
b are the MAEs of the regressed line angle and intercept on matched true positives.
The baseline configuration achieves high detection accuracy and stable parameter regression. When the regression branch is removed, we estimate the line parameters by applying a RANSAC-based fitting procedure to the detected candidate boxes. The detection metrics remain comparable, whereas the parameter accuracy degrades substantially. This result suggests that post hoc geometric fitting within candidate boxes is unreliable in our setting, likely because multiple tracks may coexist within a single detected box, leading to ambiguous inlier sets and compromising robust line fitting.
We further evaluate the input channel representation by replacing the replicated three-channel input with a single-channel input. The performance remains comparable across detection metrics and regression errors. For practical implementation, we retain the replicated three-channel input in the final system to maintain compatibility with the standard YOLOv5 input interface and pretrained weights. Since the replicated channels do not add information and the additional computation is limited to the first convolutional layer, this choice has a negligible impact on overall inference latency.
To investigate model capacity, we replaced the YOLOv5n backbone with the larger YOLOv5s, while detection accuracy remains high, regression errors increase significantly. This suggests that simply increasing model size does not benefit line parameter estimation in our sparse feature setting and may lead to optimization difficulties. Finally, we analyzed the regression loss weight. Increasing the weight from 1.0 to the baseline value of 5.0 significantly improves accuracy, whereas further increases to 10.0 yield diminishing returns. This indicates that balancing the regression objective is critical for optimal parameter estimation.
Overall, these ablations show that end-to-end regression and proper loss weighting are the main contributors to accurate track localization. At the same time, input channel replication and backbone scaling have only a limited impact on performance in our setting.
3.4. Evaluation on Real Beam Test Data
To verify that the detector generalizes beyond the synthetic domain, it is further evaluated on projection frames acquired during a dedicated heavy-ion beam test. The experiment for the beam tracking prototype detector was carried out at the Heavy Ion Research Facility in Lanzhou (HIRFL). The detector utilizes a pixel chip named Topmetal, which features a pixel array with a pixel pitch of 83 μm. During the test, a krypton ion beam with an energy of 25 MeV/u and a spot size of 5.29 cm2 was delivered in ambient air at room temperature, and the pixel chip recorded the tracks of the incident ions.
The raw readout frames from the Topmetal chip are processed by the same front end chain as used in the online SEE monitoring system. This chain includes pedestal subtraction, removal of obviously saturated or dead channels, and basic noise suppression. After this preprocessing, the charge distribution on each anode plane is cropped and grayscale. In contrast to the idealized simulations, these real frames contain effects such as gain non-uniformity across the array, occasional hot pixels, and fluctuations in the beam profile, thereby providing a realistic test of the detector’s robustness.
We evaluate the synthetically trained network on real data, using identical detection settings. To establish ground truth, we manually labeled 149 frames. For each track, we annotated the two endpoints of the visible bright segment. These endpoints were used to generate a tightly enclosing bounding box and to compute the line parameters within the coordinate system. Performance is assessed via standard metrics by matching predictions to ground truth. Additionally, spatial consistency is quantified by position resolution, defined as the root mean square of the perpendicular distances between the reference track and the predicted line.
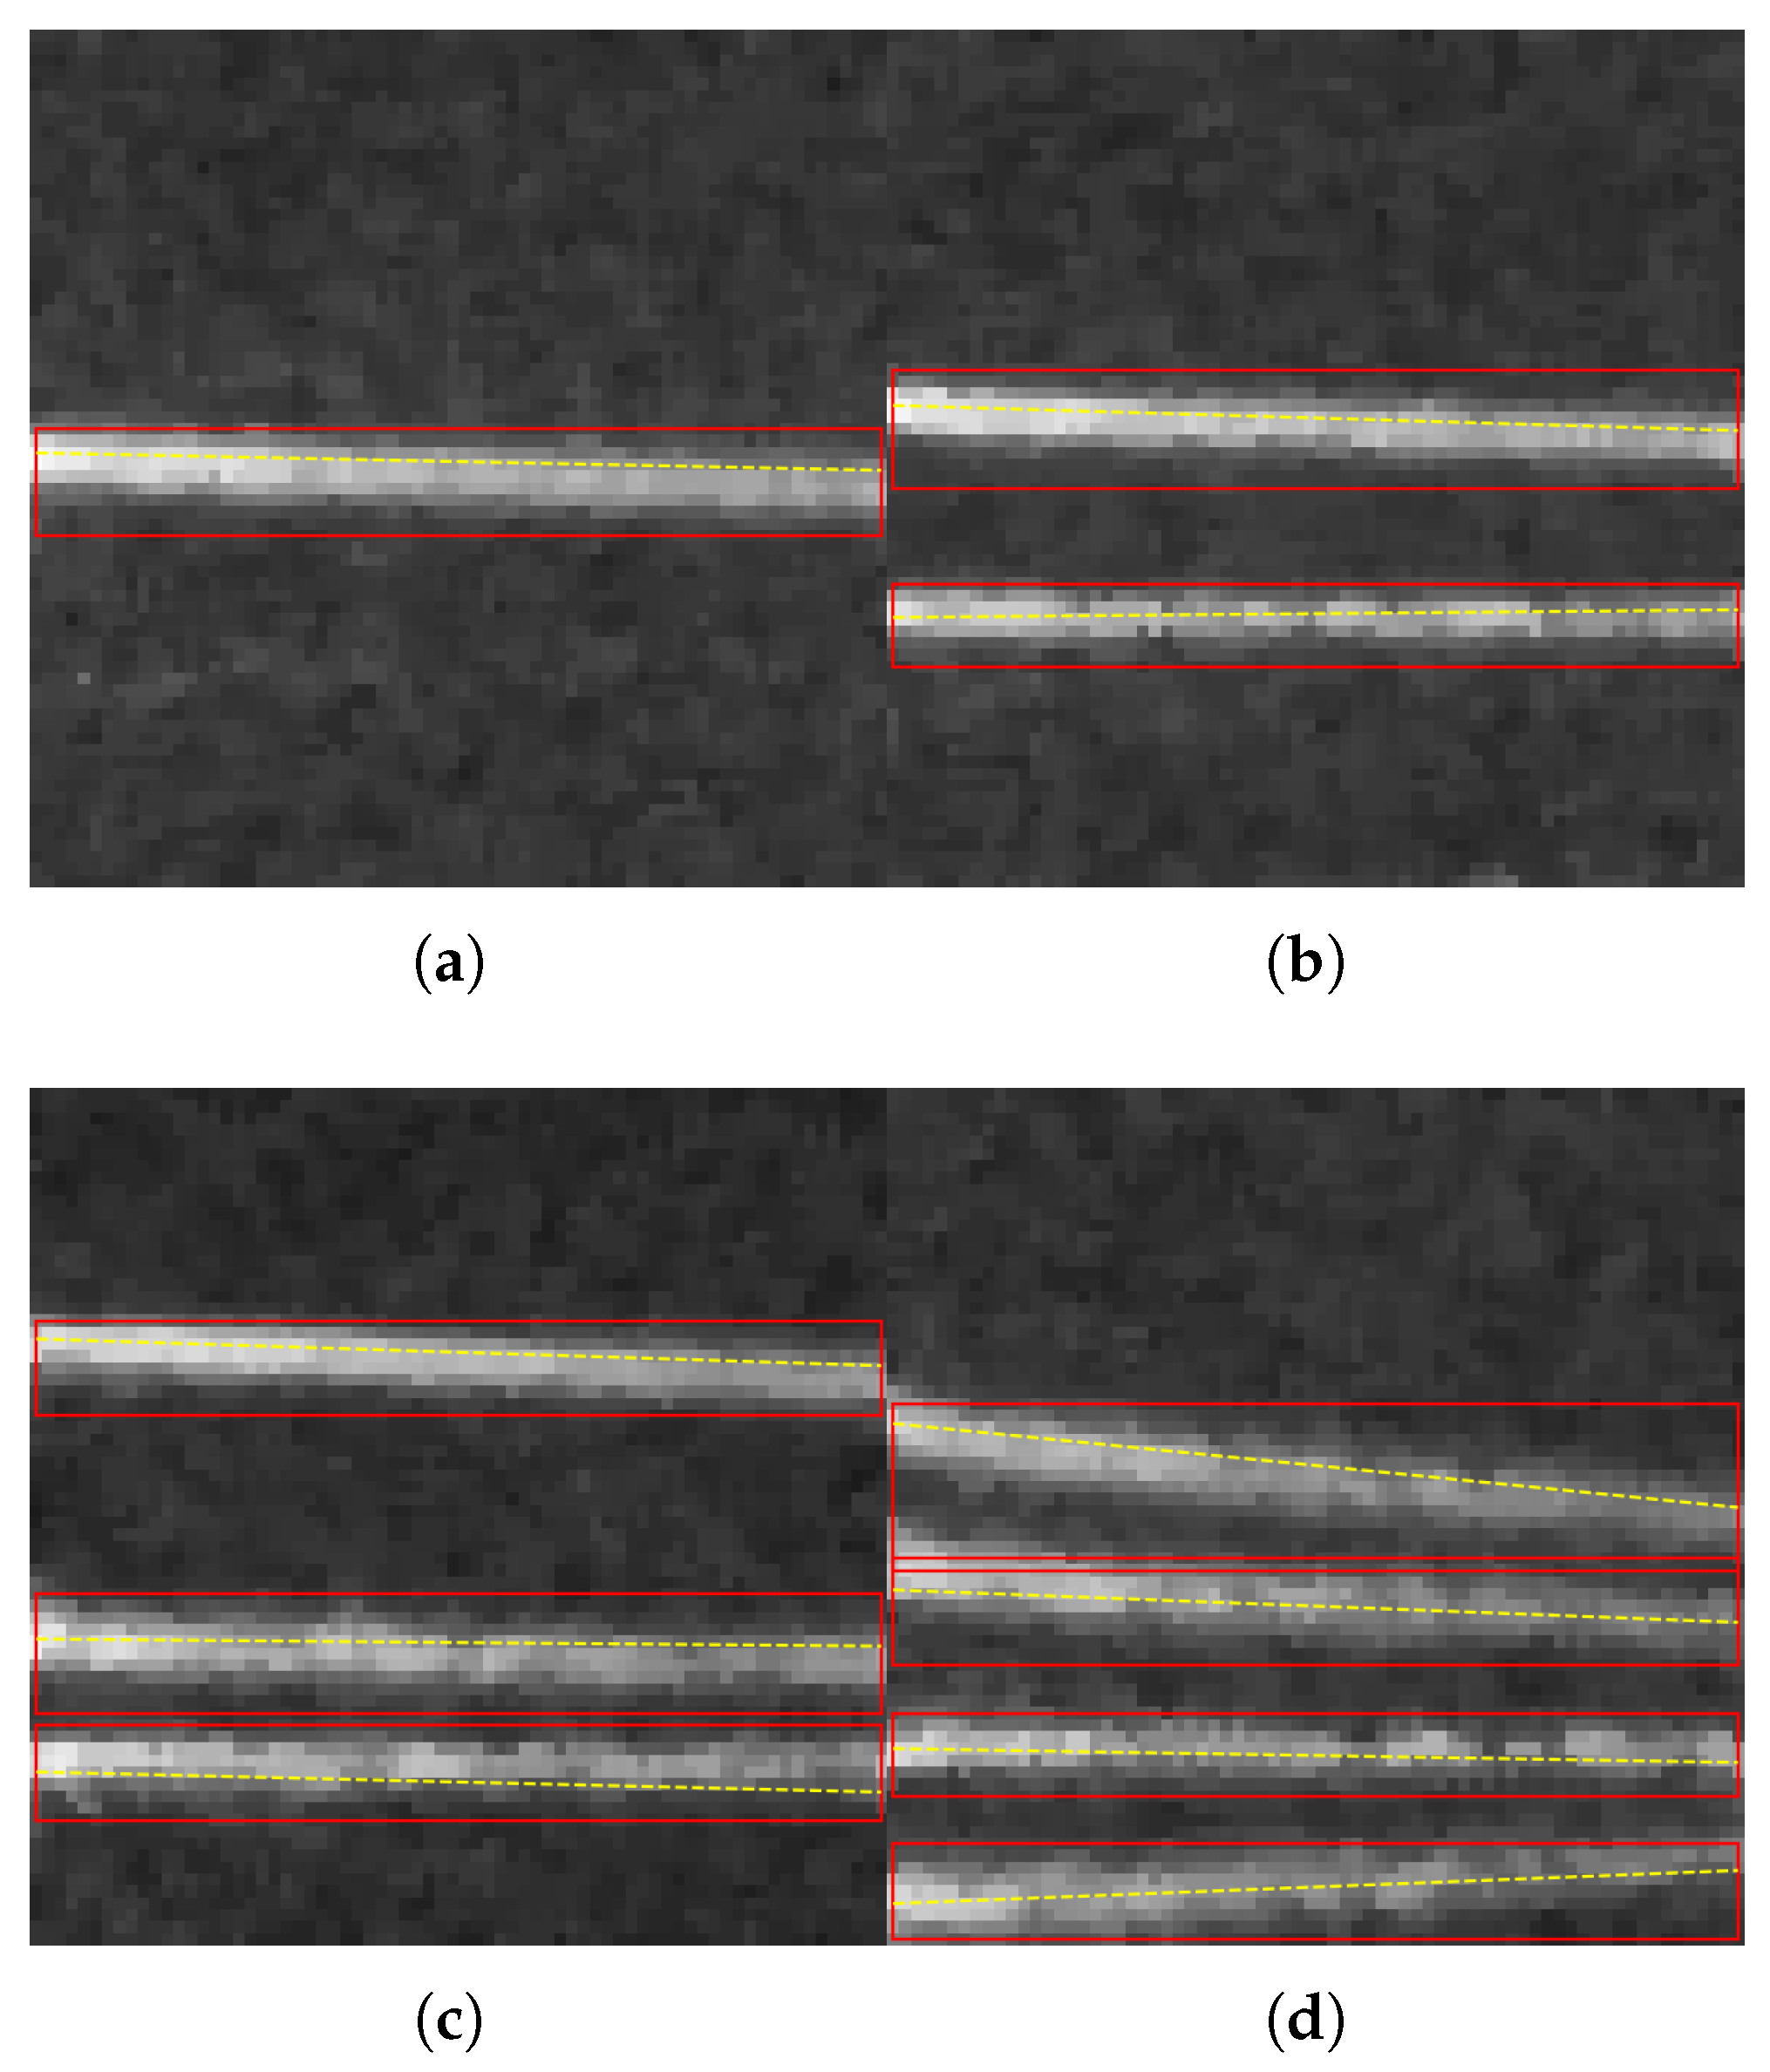
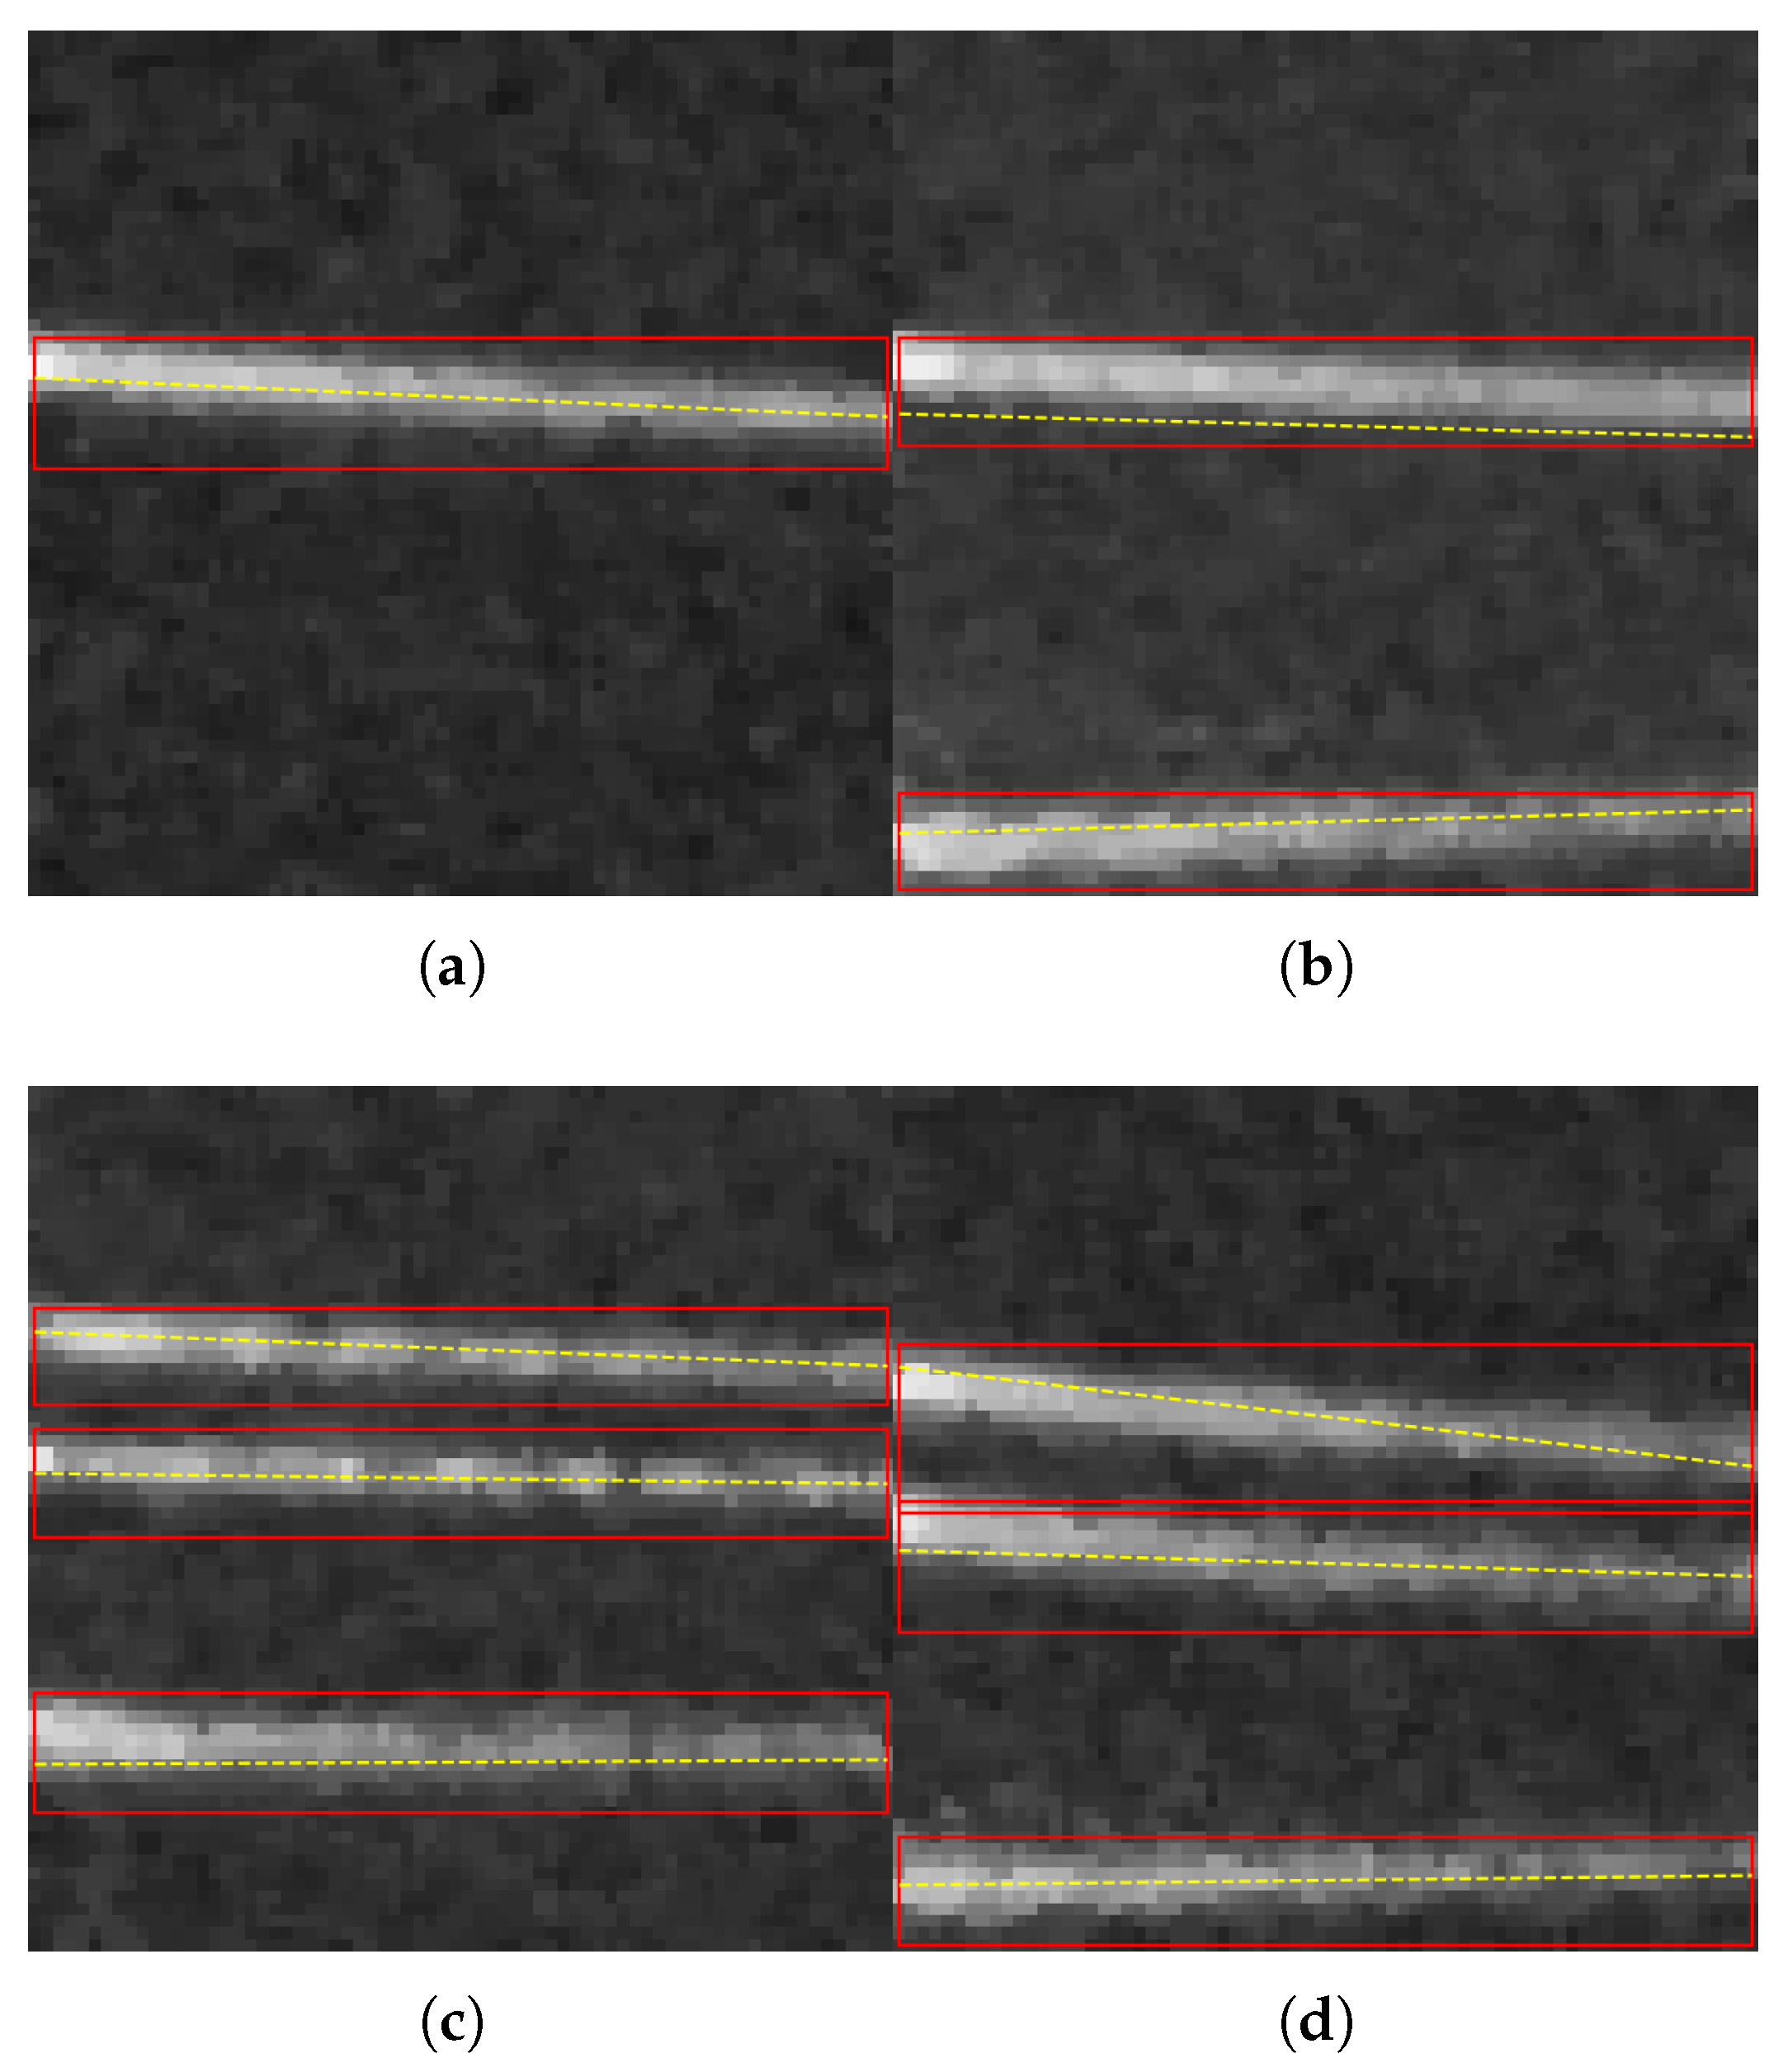
As shown in
Figure 6, these frames contain elongated, continuous, high-intensity ridges that are clearly distinguishable from the slowly varying background. In (a), the single track is nearly horizontal and has a strong contrast along most of its length, so the detector produces one stable bounding box and a consistent center line. In (b), two tracks are well separated in the vertical direction, which reduces overlap during NMS and allows both instances to be retained with reliable line estimates. In (c), three parallel tracks remain distinct and approximately uniform in width, which matches the training prior and leads to consistent geometry estimation across multiple instances. In (d), the upper track has a moderate tilt but remains long and continuous. In contrast, the three lower tracks are nearly parallel and non-overlapping, so the detector can localize each track and recover its orientations.
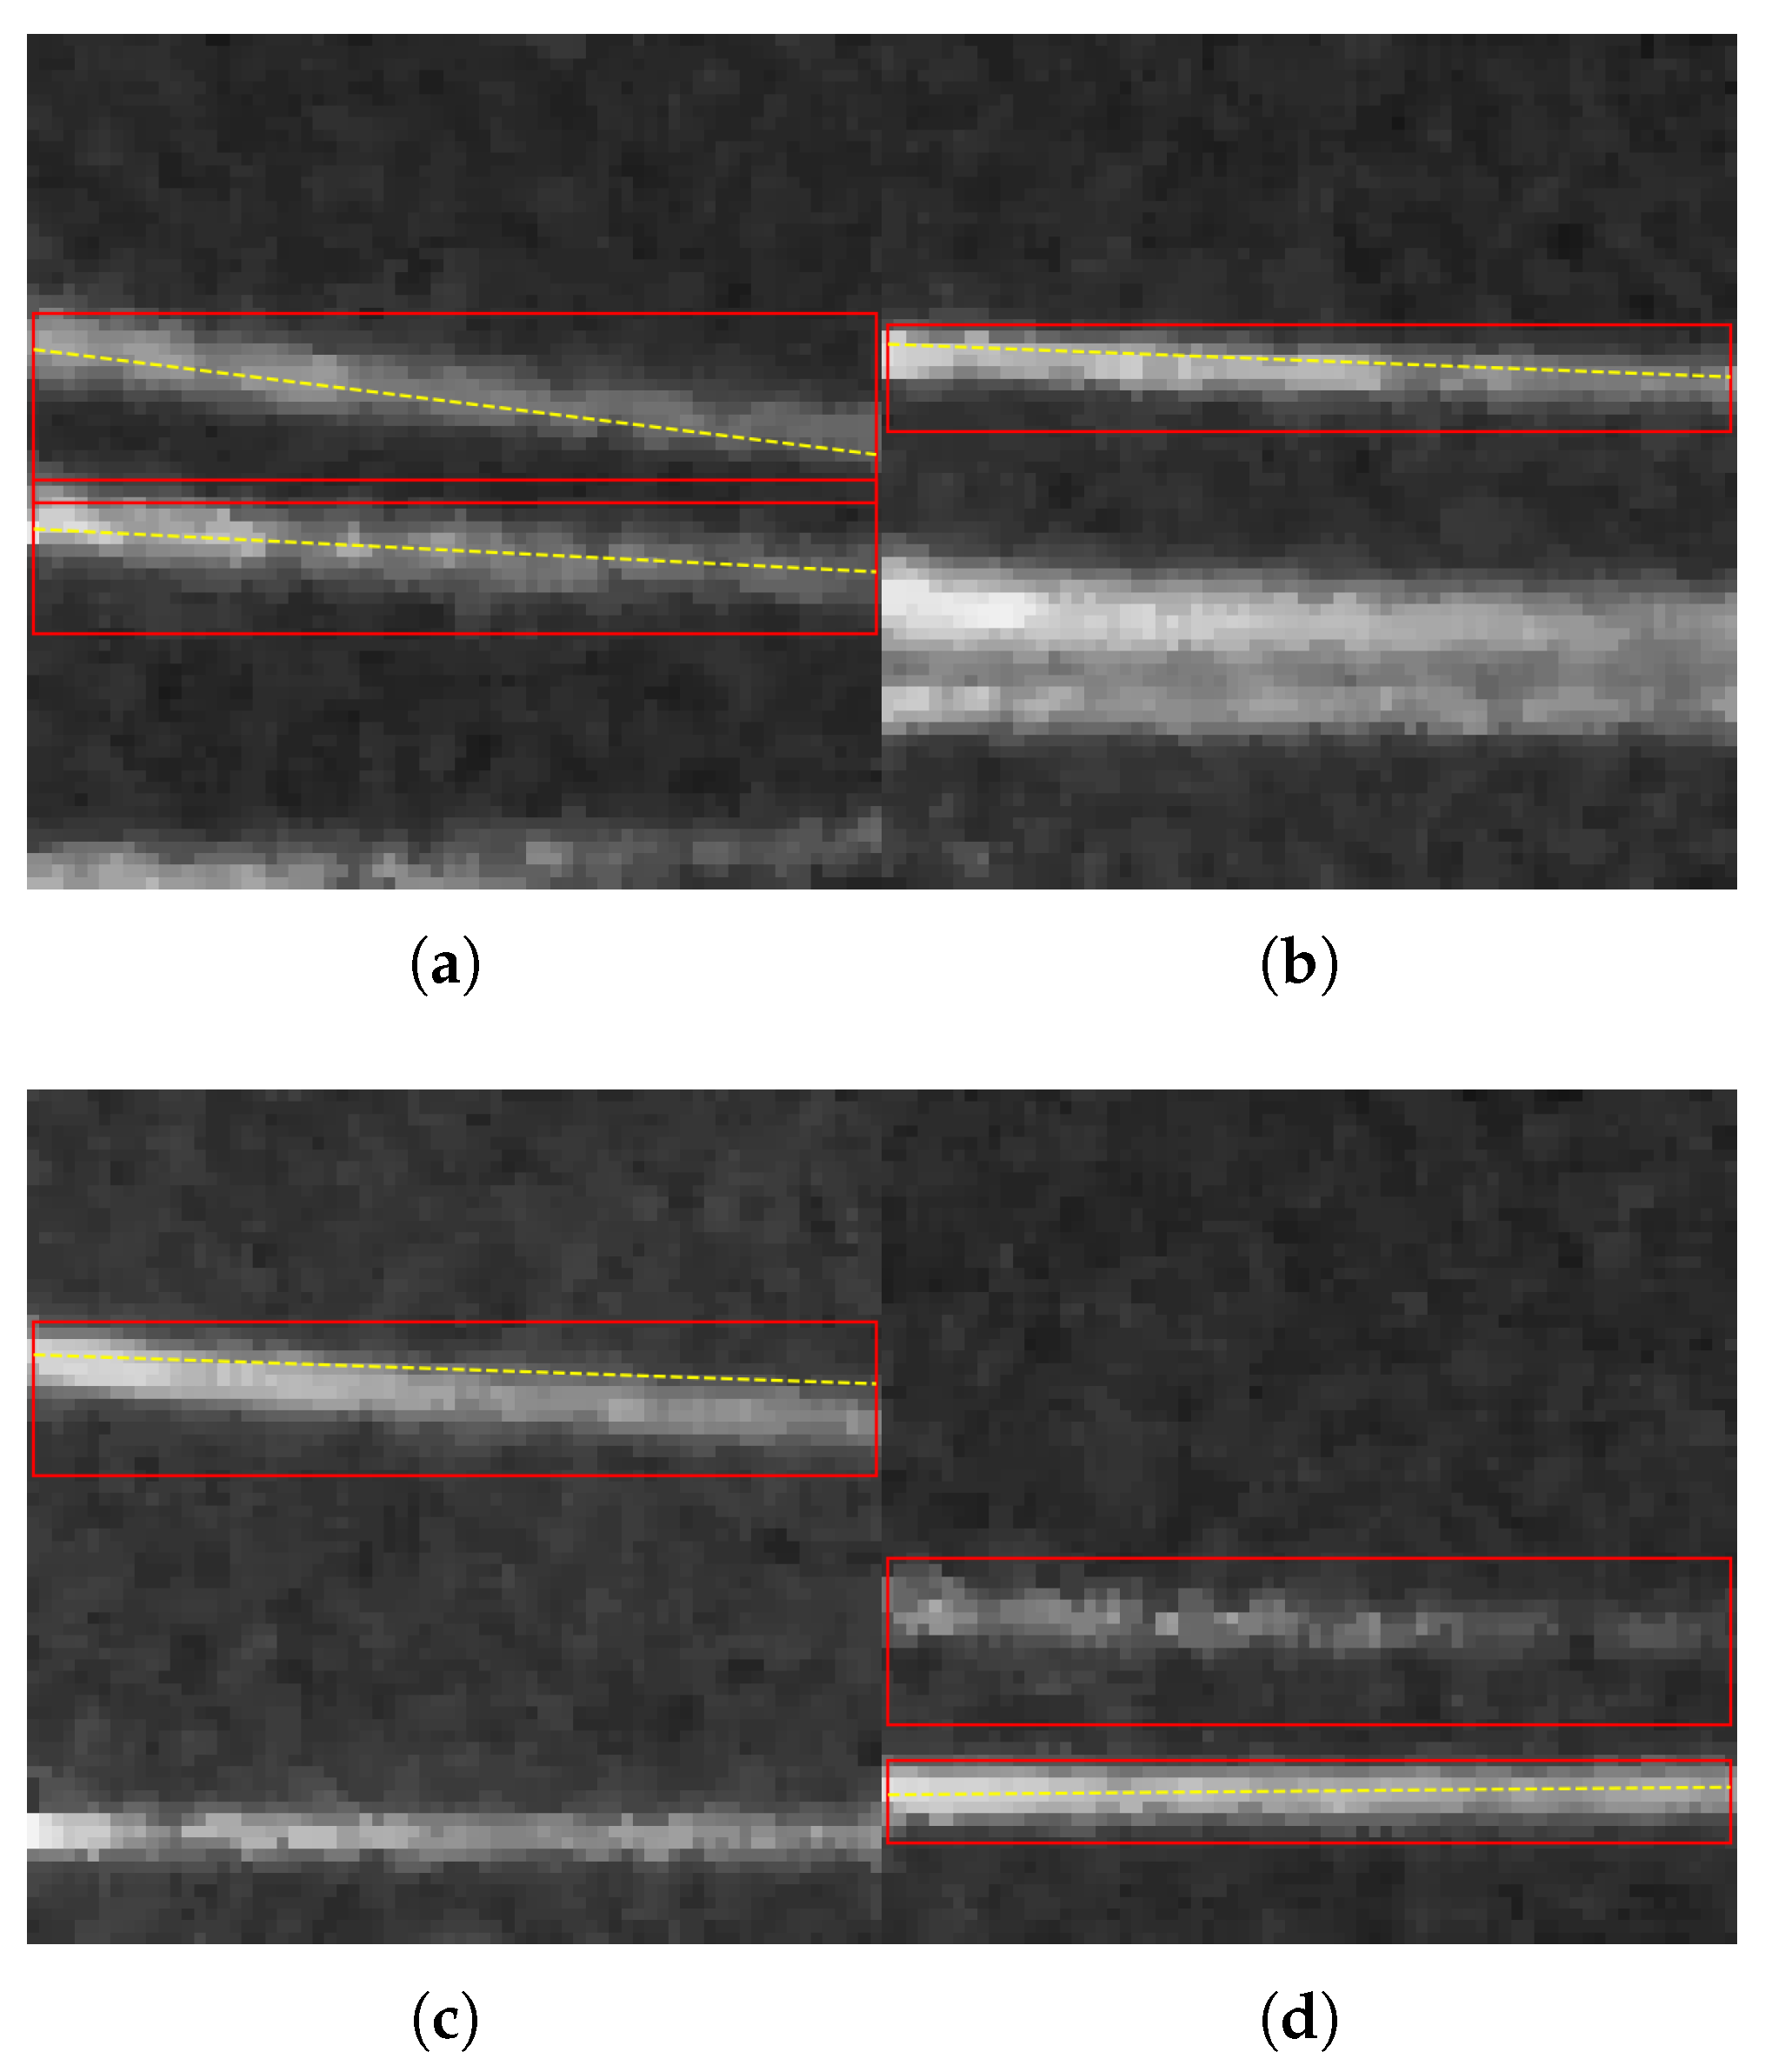
The failure cases in
Figure 7 mainly originate from track appearance deviations that are not well covered by the nominal examples. In (a), the projected track lies close to the image boundary and becomes partially truncated, so the visible segment is incomplete and the detector cannot recover a consistent instance. In (b), two tracks overlap and appear as a single merged bright band whose effective width exceeds the normal range, which tends to confuse the detector and leads to missed or incorrect predictions. In (c), the track is fragile, with weak spatial support, making it difficult to separate from background fluctuations and leading to a missed detection. In (d), the track intensity is intermittent, breaking into short fragments, violating the ridge continuity assumption, and leading to a failed localization.
These results highlight the model’s limitations, indicating that it performs well under conditions with well-defined, uninterrupted tracks but may struggle in scenarios with partial visibility, overlapping tracks, low intensity, or fragmented tracks.
The quantitative results are summarized in
Table 5, which lists the detection metrics together with the position resolution. For the current beam test set, the detector maintains a precision of 0.9156 and a recall of 0.9626, and the position resolution remains at the level of a small fraction of a pixel. This indicates that the model retains most of its synthetic domain performance when applied to real beam data.




 ,
,