1. Introduction
Under the drive of the “carbon neutrality” goal, offshore wind energy in China has steadily progressed in recent years [
1]. Meanwhile, wind-to-hydrogen production has increasingly been recognized as a promising pathway for large-scale renewable energy utilization under the “dual carbon” agenda [
2]. However, its deployment faces significant challenges due to the intermittency and strong seasonality of deep offshore wind resources, which substantially complicate wind energy development and utilization. How to fully utilize deep offshore wind energy to build wind power systems with high absorption capacity is an inevitable trend in current research. The current gap in the hydrogen energy market provides a new direction for the utilization of deep offshore wind power, and the use of offshore wind power for hydrogen production has become a new approach in the planning of offshore wind farms [
3].
In recent years, the planning of deep offshore wind farms has attracted significant attention from the academic community. In response to the many challenges faced by deep offshore wind farms, Reference [
4] proposed a frequency division dispatching planning method for offshore wind power, constructing a grid connection scheme that comprehensively considers economy, resonance stability, and reliability. It introduced the planning model for offshore wind frequency division dispatching systems. Reference [
5] proposed a novel robust planning method for offshore wind power access systems, using robust optimization and master–slave game theory to optimize system investment and operation. Reference [
6] proposed a two-stage robust expansion planning method for offshore wind power access and transmission networks based on Vague soft sets, combining Monte Carlo simulations and second-order cone relaxation to optimize investment costs and wind curtailment load shedding. Reference [
7] proposed a large-scale offshore wind power system planning method based on the N+ design, considering the power-limited operation of wind turbines under the N+ design. Reference [
8] proposed an RL-based dynamic optimal power flow (DOPF) dispatch strategy for interconnected offshore wind farms accessing the onshore grid via multiple PCCs, achieving improved long-timescale economic performance under operational constraints. Reference [
9] developed a typhoon path-informed ramp mitigation framework and a resilience-aware ordered curtailment strategy for large-scale offshore wind power systems, improving operational economy while ensuring system security and stability. Reference [
10] proposed a multi-objective wake redirection control strategy that optimizes wind farm yaw settings to increase offshore wind power output while mitigating turbine fatigue loads, with effectiveness validated against FAST.Farm. Most existing studies focus on single-objective optimization and pay limited attention to the synergistic interactions between offshore wind farms and other energy systems.
In recent years, substantial progress has been made in coordinated multi-energy planning for offshore wind power. Reference [
11] proposed a strategy for offshore wind power-based hydrogen production microgrids, constructing a real-time energy management model that includes offshore wind power, hydrogen production devices, and hydrogen storage tanks. Reference [
12] proposed a planning method for large-scale offshore wind farm power convergence systems based on mixed-integer linear programming, optimizing the siting of offshore substations and the dimensions and layout of wind turbine connections, with special consideration for the unique needs of deep offshore areas. Reference [
13] studied the transmission planning issue of offshore wind farms, proposing a transmission planning method for multi-segment large-scale offshore wind farms that considers wind farm grouping, transmission technology, voltage levels, and main network connection points. Reference [
14] studied the optimization planning of offshore wind farm power convergence systems, proposing a joint optimization method for cable layout and switch configuration to improve the balance between cost-effectiveness and reliability, outperforming traditional two-stage planning methods. Reference [
15] studied the export path planning problem of offshore wind farms and distributed hydrogen production, proposing a mathematical programming-based scheme for optimizing the siting of offshore compression stations and pipeline layout. Reference [
16] compared multiple offshore wind power export and wind-to-hydrogen supply chain options (HVAC transmission, onshore electrolysis, offshore electrolysis with subsea hydrogen pipelines, and LOHC–FPSO shipping) and quantified how project economics vary with offshore distance and hydrogen price. Reference [
17] developed a bottom-up energy system planning model for Hebei, China, revealing substantial offshore wind deployment potential and highlighting offshore wind-to-hydrogen with seasonal production and storage as an effective option to mitigate seasonal fluctuations under coordinated demand-side transition. Reference [
18] studied the planning and development of deep offshore wind energy resources, proposing a GIS-based technical method for evaluating sea areas and determining priority development zones for offshore wind farms. Reference [
19] developed a GIS-based hybrid MCDM framework to identify suitable sites for hybrid offshore solar–wind plants and quantified wind–solar complementarity to support coordinated offshore renewable deployment. Reference [
20] assessed offshore wind–wave energy co-location feasibility using long-term reanalysis and wave modeling, quantifying spatial–temporal variability and highlighting stable zones to support integrated offshore renewable planning and investment decisions.
However, these studies have not fully considered the particularities of deep off-shore areas: the limitations of hydrogen transport by offshore vessels, wind power re-source fluctuations, and energy efficiency losses in long-distance transportation, which place higher demands on system economics and feasibility. Reference [
21] showed that pipeline line-pack can mitigate short-term fluctuations but is insufficient for inter-seasonal balancing, and emphasized that optimal wind-to-hydrogen decisions should jointly consider onshore/offshore hydrogen storage requirements together with electricity transport to the mainland. Reference [
22] designed a zero-emission, wind-powered offshore platform supply system with uncertainty-aware storage and centralized control, demonstrating reduced power downtime and improved energy stability under wind variability.
To address the problems of limitations in hydrogen transport by offshore vessels, wind power resource fluctuations, and energy efficiency losses in long-distance transportation, this paper proposes a deep offshore wind power planning method that considers nearshore relay points and coordinated hydrogen production. The main innovations include the following: (1) constructing a deep offshore wind power planning framework incorporating nearshore relay points, through which energy delivery paths and hydrogen storage configurations are jointly optimized; (2) establishing a deep offshore wind power system planning model with coordinated hydrogen production, optimizing the energy efficiency and economics of the transportation chain using a hierarchical vessel transportation model; (3) considering the impact of vessel downtime under extreme scenarios and the inability to deliver energy on time, establishing a second-order robust model to improve the wind–hydrogen system configuration. The results of the case study validate the feasibility and economic viability of the proposed deep offshore wind–hydrogen system.
To enhance the clarity of the manuscript’s structure and help readers follow the logical flow of the study, a brief overview of the remaining chapters is provided as follows, together with the specific contribution of each chapter.
Section 2 presents the formulation and solution methodology of the proposed planning framework, detailing the nearshore relay point-based architecture, the coordinated wind–hydrogen planning model with hierarchical vessel transportation, and the associated robust modeling strategy.
Section 3 validates the proposed approach through numerical case studies, quantitatively demonstrating its advantages in terms of economic performance, operational feasibility, and robustness under resource variability and marine logistics constraints.
Section 4 provides an in-depth discussion from both scientific and practical perspectives: it interprets how the framework captures the coupled interactions among wind variability, hydrogen storage states, and multi-vessel logistics, and it further translates the findings into actionable insights for offshore wind developers, hydrogen investors, marine logistics operators, and policymakers, while outlining key directions for future extensions.
Section 5 concludes the paper by summarizing the main findings and contributions, and by highlighting how relay-based planning can improve accommodation and utilization, reduce curtailment, and enhance the reliability and resilience of far-offshore wind-to-hydrogen systems.
2. Problem Formulation
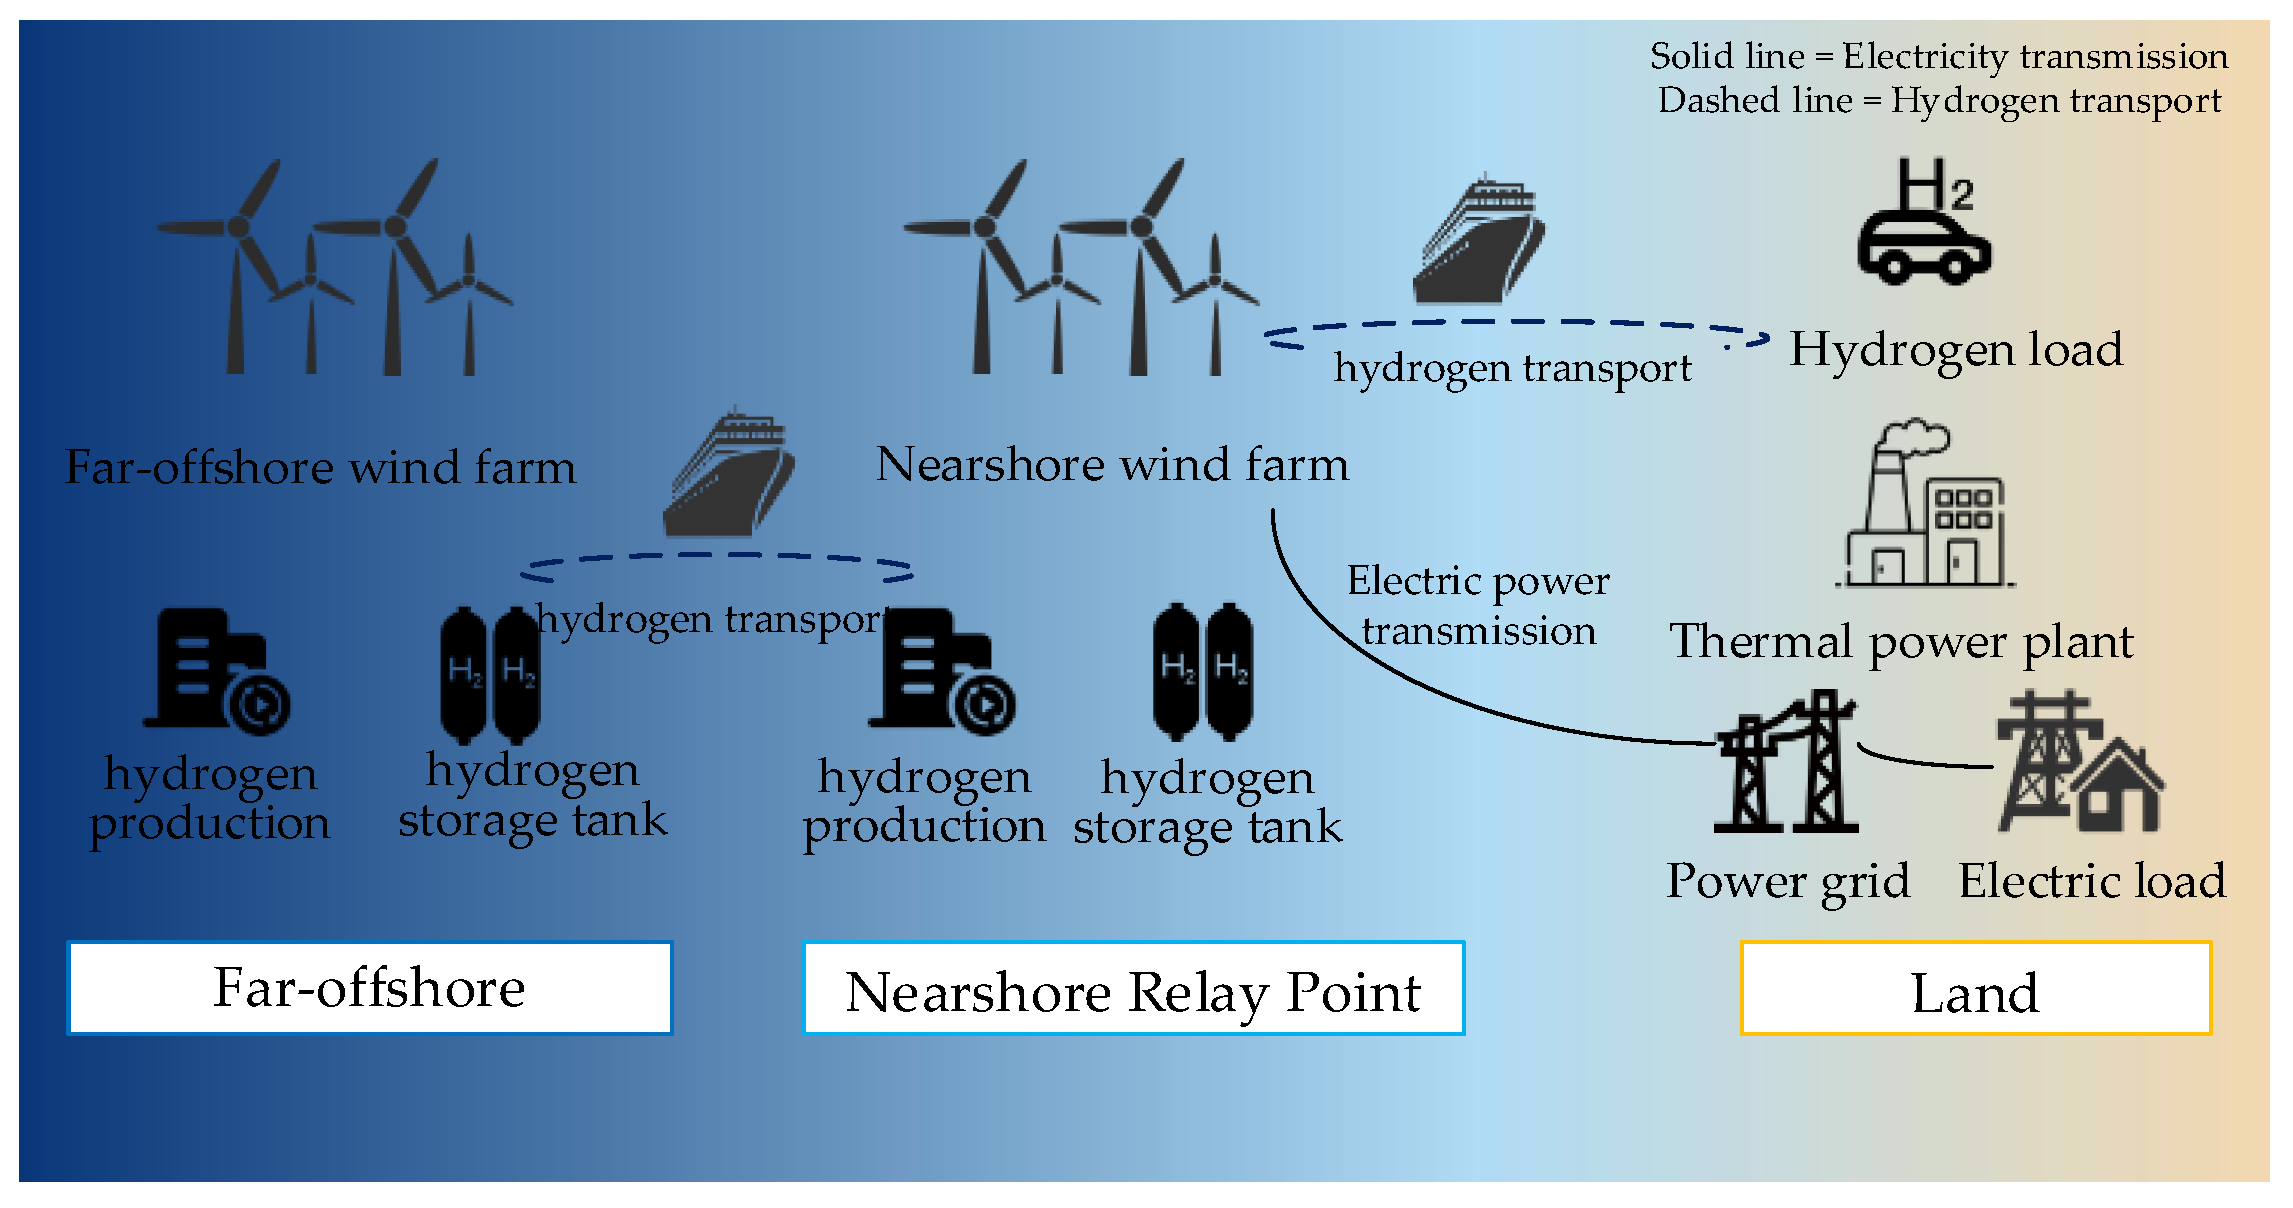
The deep offshore wind farm transmits the electricity it generates through an internal collection system to the associated hydrogen production equipment. The hydrogen produced is stored in offshore hydrogen storage facilities and then transported by dedicated vessels to hydrogen storage relay points established at nearshore wind farms. Given the significant distance between deep offshore wind farms and the mainland, and the limitations of vessel transportation timeliness, relying solely on direct transportation is insufficient to meet the real-time demand for hydrogen energy onshore. Therefore, this paper proposes a coordinated operation scheme with hydrogen storage relay points at nearshore wind farms, enhancing the reliability of hydrogen energy supply through a hierarchical storage and transportation model.
With the growing demand for hydrogen energy and the expansion of offshore wind power development into deep offshore areas, traditional power supply models face two major challenges: first, the widening hydrogen supply gap, and second, the high cost of deep offshore cable transmission. Establishing a wind power–hydrogen production collaborative development model for deep offshore areas can not only meet the increasing demand for hydrogen energy but also significantly reduce the development costs of deep offshore wind power. The proposed model optimizes the configuration of key components—including deep offshore wind turbines, electrolysis units, hydrogen storage facilities, and transport vessels—to achieve improved overall system economic performance. Specifically, in response to the vessel transportation timeliness constraints, it innovatively introduces nearshore relay hydrogen storage facilities, constructing a “deep offshore production—nearshore buffering—onshore consumption” hydrogen supply system, effectively solving the short-term supply–demand matching challenge.
2.1. Overall Modeling Framework of the Offshore–Nearshore Wind–Hydrogen Integrated System
2.1.1. Deep Offshore Wind Power System Model with Coordinated Hydrogen Production
In Equations (1)–(5),
respectively represent offshore wind turbines; offshore electrolysis hydrogen production units; offshore hydrogen storage tank; and offshore hydrogen transport vessels.
,
represent the capacity of a single hydrogen production unit and hydrogen storage tank.
represents the hydrogen transport capacity of a single offshore vessel.
,
represent the minimum and maximum allowable number of units for equipment z.
represents the power of a single wind turbine at time
t in the wind farm.
represents the hydrogen storage amount in the offshore hydrogen storage tank at time
t.
represents the hydrogen transport amount of the
n-th vessel at time
t.
2.1.2. Nearshore Relay Point Hydrogen Production Equipment Model
In Equations (6)–(10),
respectively represent nearshore wind turbines; nearshore electrolysis hydrogen production units; nearshore relay point hydrogen storage tank; and nearshore hydrogen transport vessels.
represents the hydrogen production amount of the offshore wind–hydrogen system at time
t.
represents the hydrogen storage amount in the nearshore relay point hydrogen storage tank at time
t.
represents the hydrogen production amount from the nearshore wind farm.
represents the hydrogen transport amount from the offshore to the nearshore relay point at time
t.
represents the hydrogen output amount from the nearshore relay point to nearshore vessels at time
t.
2.1.3. Offshore Vessel and Nearshore Vessel Transfer Model
In Equations (11)–(18),
represent the numbers of constructed ocean-going and nearshore vessels;
represent the shortest travel time between vessels
I and
j;
represents the state of the
n-th ocean-going vessel on route
i-
j at time
t;
represents the state of the
n-th nearshore vessel on route
i-
j at time
t;
represents that the
n-th vessel is sailing/docking on route
i-
j at time
t;
represents that the
n-th vessel is not sailing/docking between
I and
j at time
t;
g is the set of neighboring stations adjacent to node
I;
represents the state of the
n-th vessel at the initial space–time;
represents the state of the
n-th vessel at the final time.
2.1.4. Hydrogen Transfer Model
In Equations (19)–(23),
represent nearshore and ocean-going vessels’ hydrogen charging and discharging power;
represent nearshore and ocean-going vessels’ maximum hydrogen charging and discharging power;
represent nearshore and ocean-going vessels’ hydrogen consumption power for navigation;
represent nearshore and ocean-going vessels’ rated hydrogen consumption power.
In Equations (24)–(28),
represent real-time hydrogen storage amounts of nearshore and ocean-going vessels;
represents the hydrogen conversion efficiency;
,
,
,
represent maximum and minimum hydrogen storage amounts of nearshore and ocean-going vessels, respectively.
Speed-dependent propulsion consumption:
In Equation (29), represents the rated navigation consumption power; is the cruising speed of vessel n; is the reference speed.
2.1.5. Relay Point Hydrogen Storage Tank Model
In Equations (29)–(33),
represents the hydrogen storage amount of the nearshore relay point at time
t;
represents the hydrogen storage amount at time
t;
represents the hydrogen delivered from the nearshore wind farm to the hydrogen storage tank at time
t;
represent the minimum and maximum allowable hydrogen storage amounts of the hydrogen storage tank;
represents the maximum hydrogen production power of the nearshore wind farm.
Figure 1 illustrates the overall configuration and coordinated operation mechanism of a far-offshore wind power system integrated with hydrogen production, highlighting the key components and energy flow pathways involved.
2.2. Relay Point Vessel Downtime Model
The vessel transportation link in the deep offshore wind–hydrogen system faces severe challenges under harsh weather conditions. During the voyage, vessels may encounter extreme sea conditions such as typhoons and large waves, leading to forced downtime and interruption of hydrogen transport to the nearshore. This paper considers the situation where offshore transport vessels are out of service due to adverse weather conditions. In such cases, all the electricity generated by the deep offshore wind farm is used for hydrogen production and stored in offshore hydrogen storage facilities. After the vessels resume operation, the hydrogen is transported, and the nearshore relay point hydrogen storage tanks adjust their output according to a preset strategy to meet onshore hydrogen demand.
Given the uncertainty in the duration of vessel downtime and the unpredictable timing of when it occurs, the optimization process must account for the uncertainty caused by harsh weather conditions leading to offshore vessel downtime. To enhance the robustness of the planning results, a two-stage robust optimization model is constructed to address the uncertainty of vessel downtime caused by extreme scenarios. Therefore, the key to the vessel downtime state model lies in the construction of the uncertainty set. The vessel downtime state model is established as follows:
In the equation,
represents the operational state of the vessel at time
t.
indicates that the vessel is operating normally and performing hydrogen charging/discharging operations;
indicates that the vessel is out of service due to weather. Considering that the vessel experiences at most one continuous outage during the period T, the vessel outage uncertainty set can be expressed as follows:
In the equation, represents the outage start period; represents the maximum outage duration. During one cycle, the vessel operates in outage only within the period , and runs normally in all other time intervals. Under normal system operation, the ocean-going vessel operates normally, and the hydrogen produced offshore is transported to the relay point by the vessel, while the system runs according to the planned scheme. In the extreme outage scenario, the hydrogen produced offshore is temporarily stored in the offshore hydrogen storage tank, and the relay point mainly relies on hydrogen generated by the nearshore wind farm and reserved hydrogen to supply the onshore load, until the vessel resumes operation.
2.3. The Objective Function
The planning objective for the deep offshore wind power system is to minimize the annual total cost, which includes the annualized investment construction costs, operational costs, and hydrogen sales revenue. The equation is as follows:
In the equation, C is the minimum annual total cost; is the investment cost of the ocean-going wind–hydrogen system; is the operating cost; is the revenue from hydrogen sales.
The investment cost of near-offshore and far-offshore wind–hydrogen systems can be expressed as follows:
In the equation, is the unit capacity investment cost of equipment z; is the discount rate; is the investment lifespan of equipment z.
The operating cost consists of hydrogen production cost, vessel operating cost, wind farm O&M (operation and maintenance) cost, and hydrogen storage cost, and can be expressed as [
23]
In the equation, is the cost of hydrogen production by the wind farm; is the vessel travel cost; is the wind farm generation cost; is the hydrogen storage cost of the storage tank; is the unit hydrogen production cost; is the unit vessel travel cost; is the unit O&M cost of the wind farm; is the unit O&M cost of hydrogen storage; is the hydrogen charging quantity of the transport vessel into the offshore storage tank; is the hydrogen production quantity of the far-sea wind–hydrogen system; is the hydrogen discharge quantity of the transport vessel into the nearshore relay point storage tank.
The revenue from hydrogen sales can be expressed as follows:
In the equation, is the unit revenue from hydrogen sales; is the hydrogen transported from the nearshore relay point storage tank to the onshore hydrogen load at time t.
To provide an explicit investment–performance metric that is consistent with the above annual cost–revenue accounting, the return on investment ROI is defined on an annual basis as follows:
2.4. Constraints
(1) Wind turbine output constraint [
24]:
In the equation, , represent the upper limit of wind turbine output and the lower limit of wind turbine output, respectively.
(2) Far-offshore hydrogen storage tank constraint [
25]:
In the equation, is the quantity of hydrogen produced by the hydrogen production station at the wind farm at time t.
(3) Hydrogen load constraint:
In the equation, is the demand for onshore hydrogen load at time t.
(4) Hydrogen production station constraint:
In the equation, is the unit conversion coefficient for converting electrical energy into equivalent energy of hydrogen gas, ; is the conversion efficiency.
(5) Onshore electric load supply balance constraints:
In the equation, is the onshore electricity load demand at time t; is the electrical energy supplied from the nearshore wind farm to the onshore grid at time t; is the generation output of the onshore thermal power plant at time t.
(6) Nearshore hydrogen production and vessel coordination constraints:
In the equation, is the maximum hydrogen production power ratio of the hydrogen production equipment, ensuring that hydrogen production does not exceed the surplus power capacity of the wind farm.
2.5. Model Solution
For the operation of the far-sea wind–hydrogen system proposed in this chapter, the nonlinear constraints in the model are elaborated in detail regarding how they are handled by linearization methods. In Equation (5),
and
are the product of two decision variables, resulting in a bilinear nonlinear constraint. An auxiliary variable
is introduced, with its upper and lower bounds set as [
26]
Through McCormick relaxation, the nonlinear part is relaxed into the following approximate linear inequalities [
27]:
After linearization, we have
For the vessel navigation status and hydrogen charging/discharging power, the big-M method is applied as follows [
28], where
M is a sufficiently large constant:
By applying a two-stage planning approach that integrates the construction quantities of the wind–hydrogen system equipment in the planning stage with the consideration of vessel outage uncertainty in the operation stage, the optimal number of wind–hydrogen equipment units is obtained. In this approach, Stage 1 is the investment and construction phase, in which the number of devices and the investment cost of the far-offshore wind–hydrogen system are determined based on load demand and construction conditions, with the objective of minimizing total investment cost. Stage 2 is the optimized operation phase, which minimizes the annual operating cost under the worst-case scenario of vessel outages, thereby refining the planning results. Thus, the two-stage robust planning model is made into an equation as [
29]
In the equation,
,
are the coefficient matrices corresponding to vessel investment cost and operating cost, respectively;
is the fault scenario corresponding to vessel voyage outage;
correspond, respectively, to Equation (1), offshore equipment hydrogen production, nearshore relay point planning, vessel space–time transfer constraints, far-sea hydrogen storage tank constraints, and hydrogen production constraints;
are the constant matrices; we define the variables as follows:
In the equation, are the decision variable sets for the number of vessels constructed and the construction stages of the wind farm, respectively. The Column-and-Constraint Generation algorithm (C&CG) is adopted to remake the model into a master problem with a “min” structure and a subproblem with a “max–min” structure for iterative solution, where the master problem addresses the planning of the far-sea wind–hydrogen system, and the subproblem addresses the operation under the worst-case scenario.
The master problem is made into an equation as follows:
In the equation, is the iteration number; is the operational solution added to the master problem at the k-th iteration; is the introduced auxiliary variable.
Subproblem: Worst-case voyage outage scenario:
It is evident that the above subproblem is a bilevel optimization problem, and the inner minimization problem is essentially a convex optimization problem with strong duality. Therefore, it can be dualized into a maximization problem and then combined with the outer maximization problem [
30], yielding the following single-level problem:
In the equation, are the dual variables. The specific algorithmic steps are as follows:
(a) Initialize the iteration counter , lower bound , upper bound , and convergence tolerance .
(b) Solve the master problem to obtain the optimal configuration , and simultaneously update the lower bound .
(c) Based on the solution from (b), solve the subproblem to obtain the worst vessel outage scenario and the corresponding operating cost , then update the upper bound .
(d) Check termination condition: If , output the optimal solution ; otherwise, set and return to step (b).
The proposed max–min model is solved by the C&CG framework, where the master problem and the subproblem are repeatedly solved as MILP instances. To meet the technical reporting requirements for engineering applications,
Table 1 provides a convergence trace of a representative MILP solved within the C&CG procedure, using the incumbent objective and the best bound reported by Gurobi. As shown, the optimality gap decreases rapidly from 33.7% to 0.0011%, and the MILP instance is solved to near-optimality within 0.63 s. This convergence behavior supports the practical computational tractability of the proposed solution procedure.
3. Results
3.1. Simulation Environment
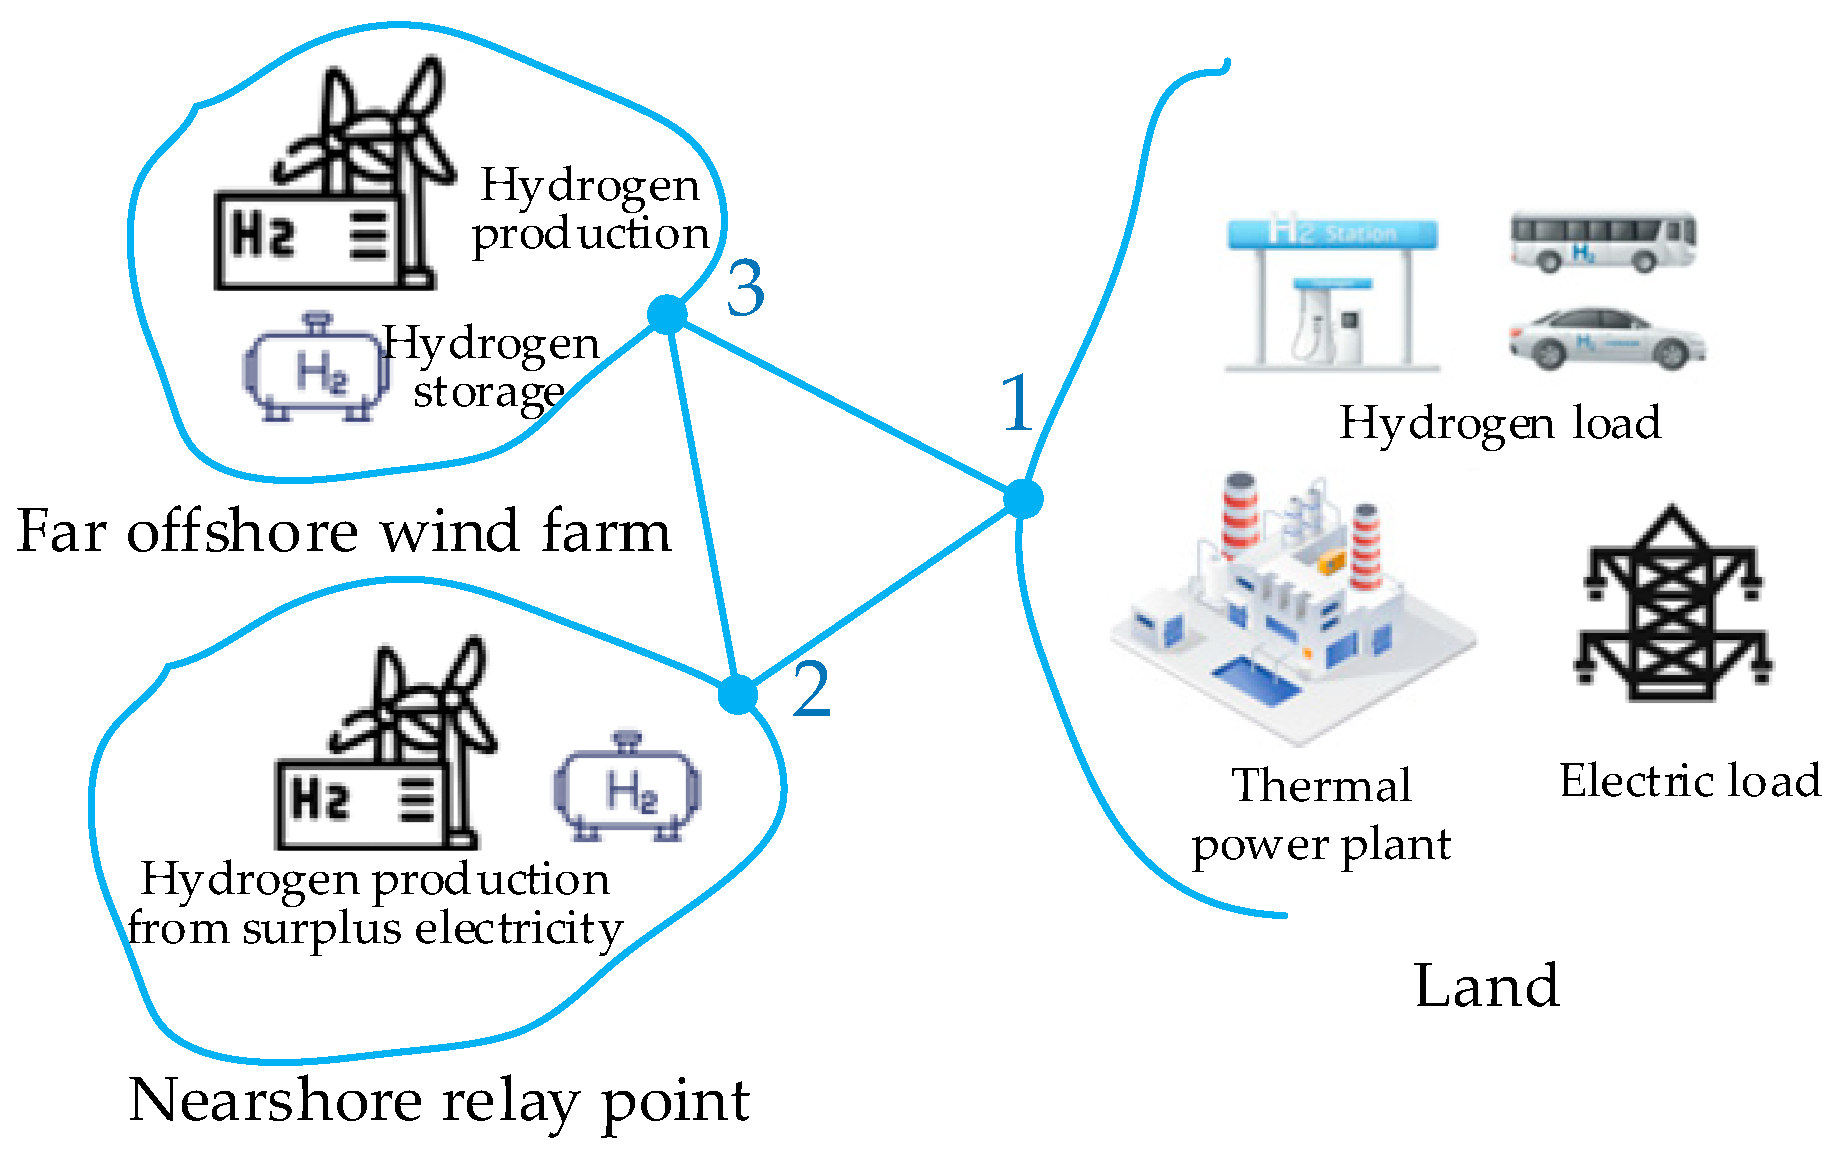
Based on the existing reference literature and research data, the relative positions and numbering of the wind farm and load are set as shown in
Figure 2. Site 1 is the onshore area, Site 2 is the nearshore relay point, and Site 3 is the deep offshore wind farm. The nearshore wind farm is planned to be built with a capacity of 400 MW, and the deep offshore wind farm is planned to be built with a capacity of 600 MW.
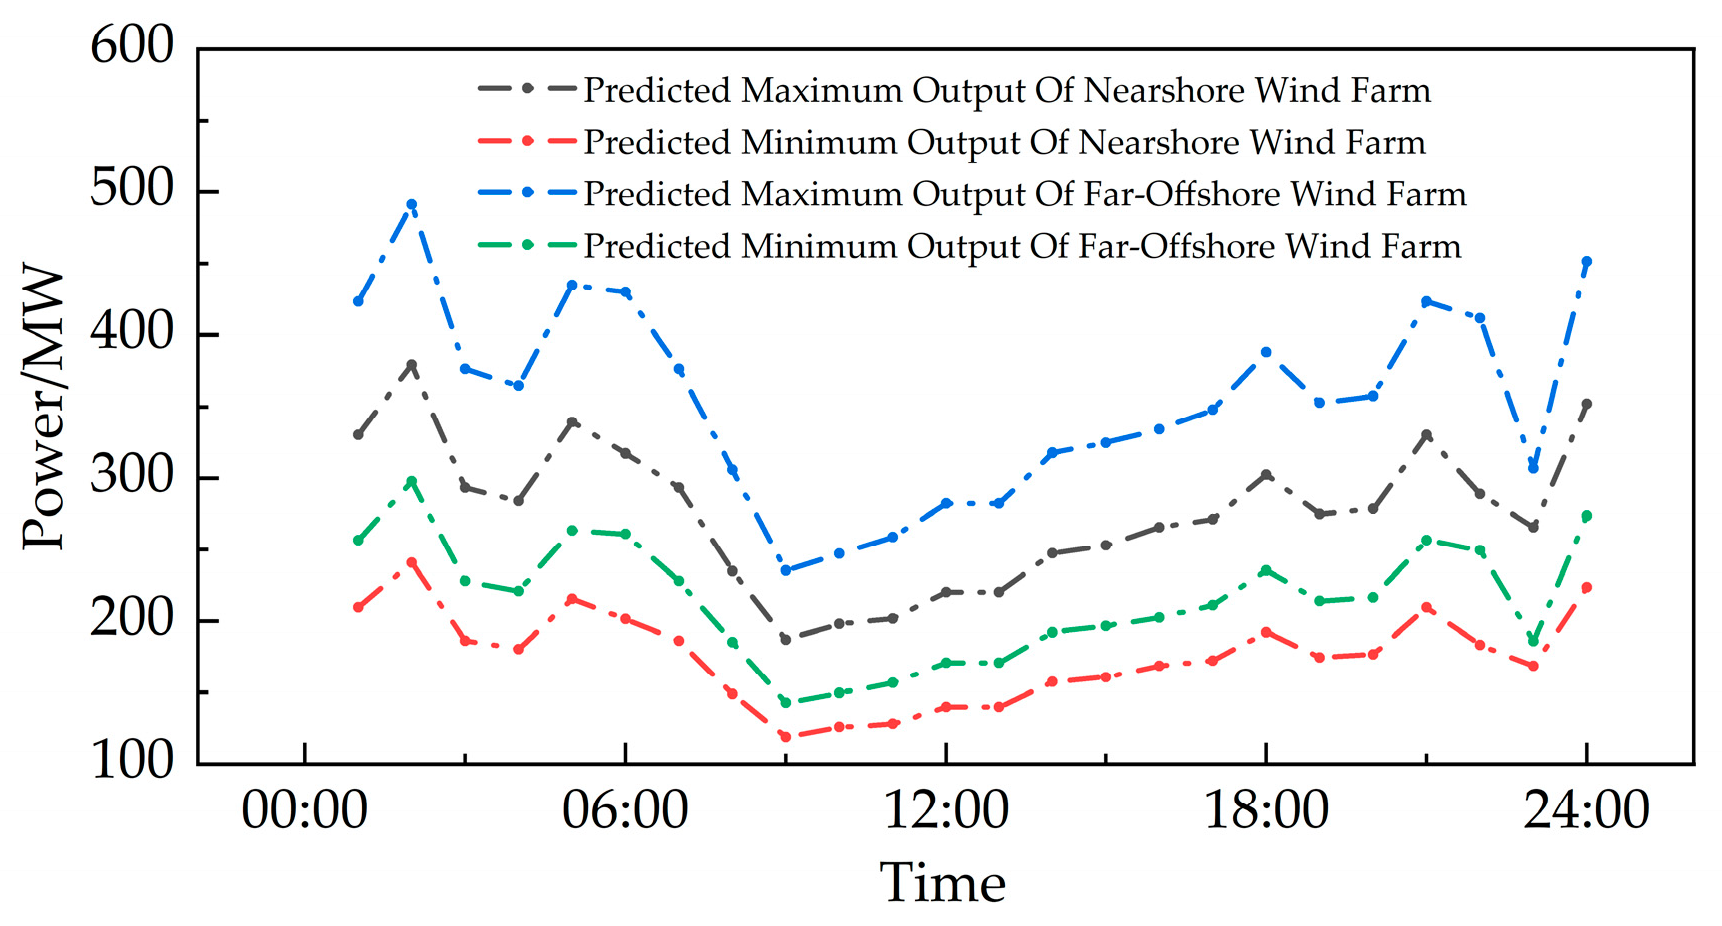
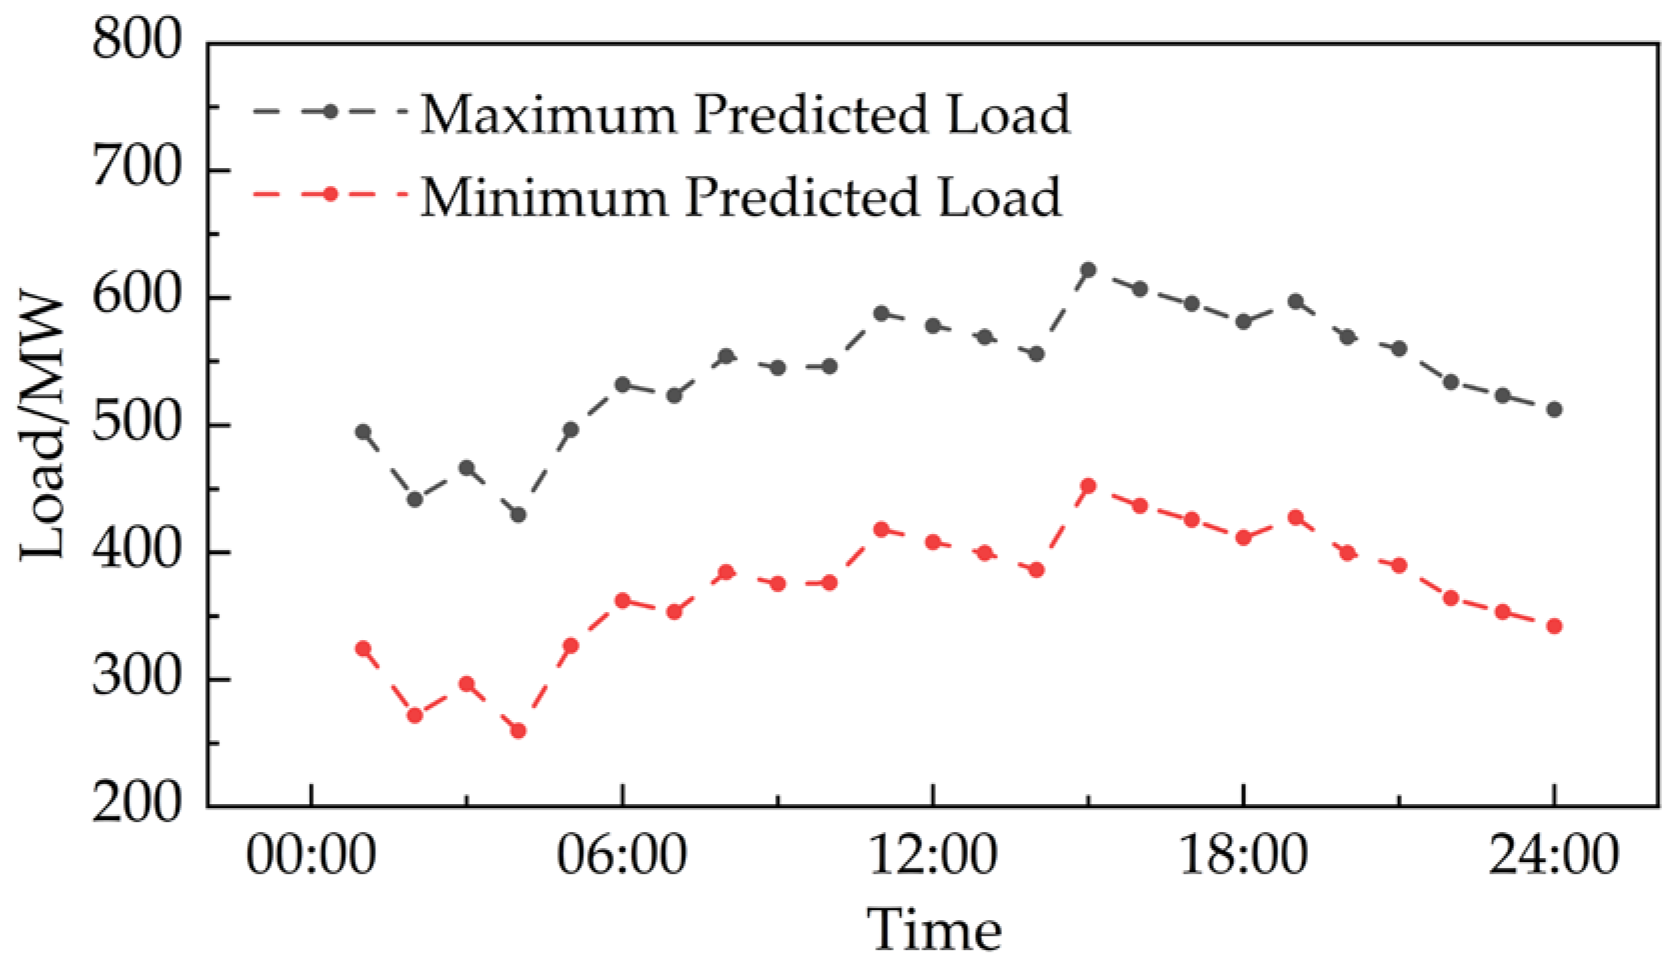
The ships constructed in this study are assumed to have the following speeds under normal weather conditions: the nearshore vessels have a speed of 15 km/h, and the offshore vessels have a speed of 30 km/h. Since fuel consumption increases nonlinearly with cruising speed, these speed settings directly affect the net delivered hydrogen and the overall transport chain efficiency. As a result, the optimization tends to avoid unnecessarily long high-speed sailing and instead leverages relay-based staging to improve net energy efficiency under the same delivery requirements. The predicted maximum and minimum output of the wind turbines at the wind farm for the day are shown in
Figure 3, and the load forecast data are shown in
Figure 4.
To validate the planning method proposed in this paper, the following three scenarios are established, ensuring that the vessel configuration maintains equivalent total transport capacity to verify the feasibility of the proposed planning method:
Scenario 1: All the electricity generated by the deep offshore wind farm is used for hydrogen production. The hydrogen is stored in offshore hydrogen storage facilities, then transported by offshore vessels from the deep offshore wind farm to the onshore hydrogen receiving station. Nearshore light-load vessels transport hydrogen between the relay point and the mainland.
Scenario 2: Offshore vessels perform large-capacity transport from the deep offshore wind farm to the relay point, while nearshore light-load vessels are tasked with high-frequency transport between the relay point and the mainland. This achieves optimized transportation efficiency through capacity stratification.
Scenario 3: Building upon Scenario 2, the extreme scenario of vessel downtime is introduced. The wind–hydrogen system configuration quantities are planned using the method outlined above.
These scenarios also provide a structured robustness check with respect to key modeling assumptions, including transportation architecture (single-stage vs. multi-stage relay-based logistics) and severe weather-induced vessel downtime.
3.2. Planning Scenario Analysis
The deep-sea wind–hydrogen coordinated planning scheme proposed in this paper, which takes into account a nearshore relay point, demonstrates significant advantages over the traditional single-stage ship transport mode in terms of both system operational efficiency and economic performance. Under the premise of comparable total investment costs, establishing a multi-stage transport system and deploying nearshore relay hydrogen storage facilities can effectively enhance the overall system performance. Details of the hydrogen production equipment, wind turbine construction, far-offshore hydrogen storage tanks, nearshore relay point, and vessel capacity are provided below.
As shown in
Table 2 and
Table 3, differences in equipment configurations among the three scenarios can be observed. Scenario 1 represents the baseline case: the far-offshore wind farm is equipped with ten hydrogen storage tanks, six hydrogen production units, and 39 wind turbines, while the relay point has three hydrogen storage tanks, four hydrogen production units, and 14 wind turbines. In this configuration, the relay point plays a relatively minor role, relying mainly on long-distance direct transport by ocean-going vessels.
Scenario 2 builds upon Scenario 1 by introducing an explicit multi-stage transport strategy and strengthening the functions of the relay point. The far-offshore wind farm increases its equipment to 12 hydrogen storage tanks, seven hydrogen production units, and 45 wind turbines. Meanwhile, the relay point is upgraded to six hydrogen storage tanks, 17 wind turbines, and four hydrogen production units.
Scenario 3 further incorporates robustness considerations for vessel suspension under extreme weather conditions, based on the two-stage transport architecture of Scenario 2. The relay point retains six hydrogen storage tanks, four hydrogen production units, and 15 wind turbines, while the far-offshore wind farm reduces its equipment to ten hydrogen storage tanks, five hydrogen production units, and 38 wind turbines—a more compact configuration compared with Scenario 2. This streamlined setup achieves higher hydrogen supply reliability despite reduced hardware deployment.
3.3. Operation Analysis of Electricity–Hydrogen Transmission
3.3.1. Hydrogen Transmission and Sensitivity Analysis Under Vessel Downtime
Based on the analysis of Scenario 1 presented in
Section 3.2, this section focuses on evaluating the optimization effects of multi-stage transport and relay points. A comparative operational analysis is conducted between the transport mode of Scenario 1 and that of Scenario 2, aiming to investigate the synergistic role of the relay point and the impact of vessel staging on system transmission efficiency.
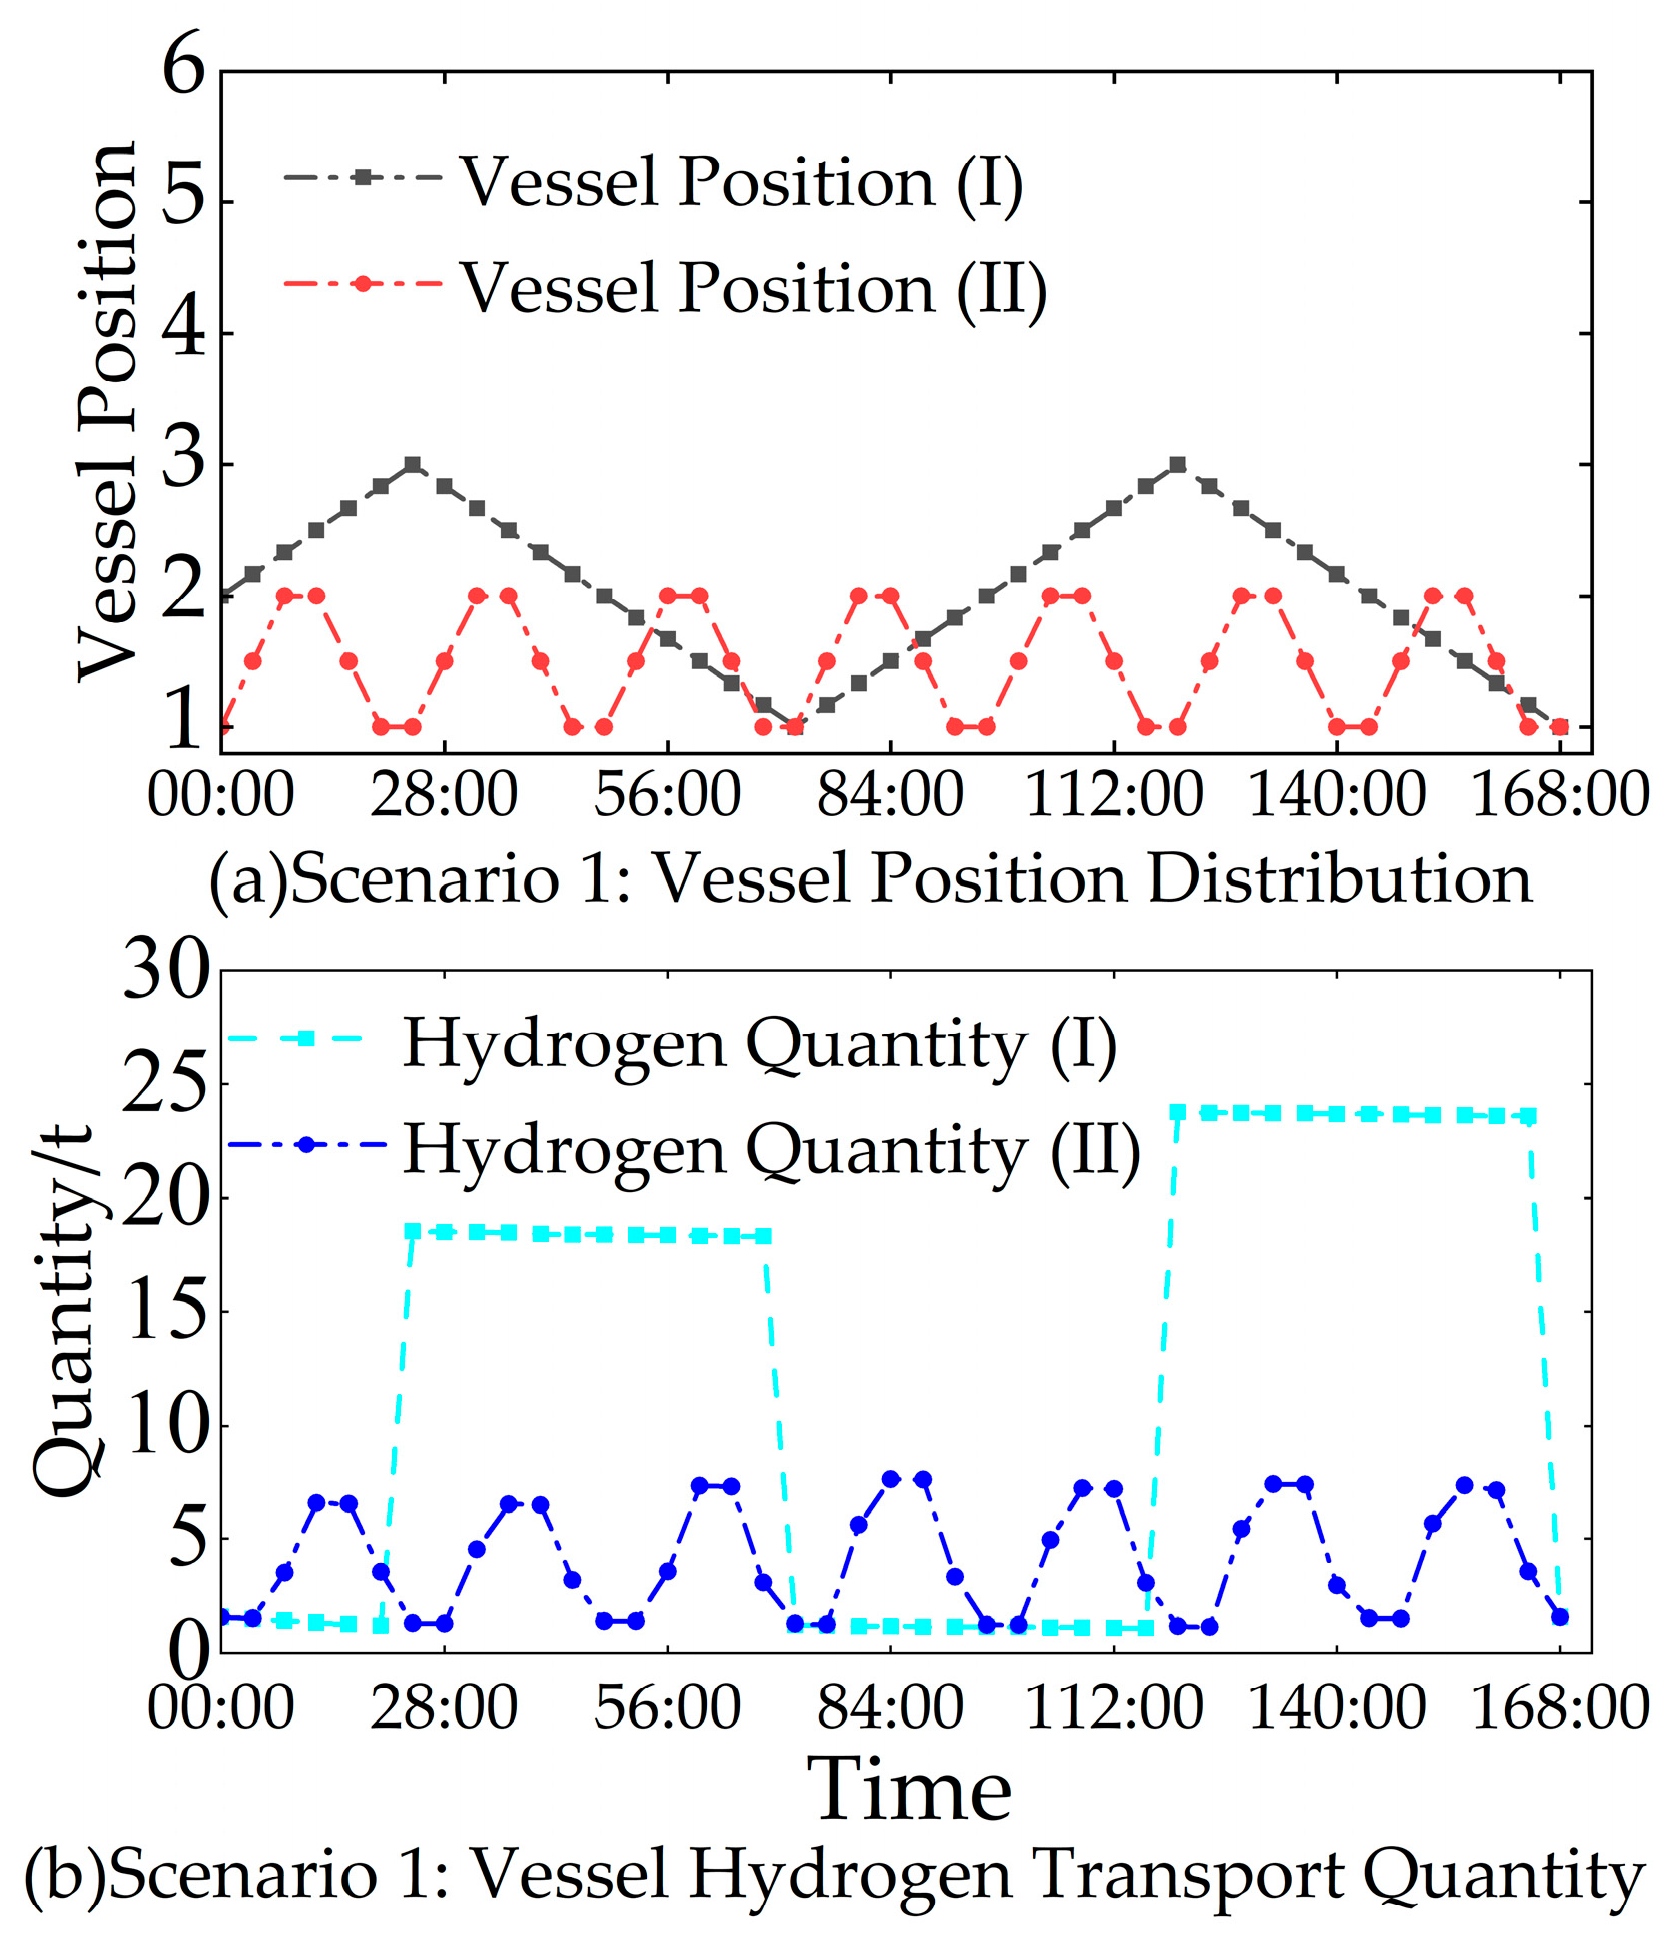
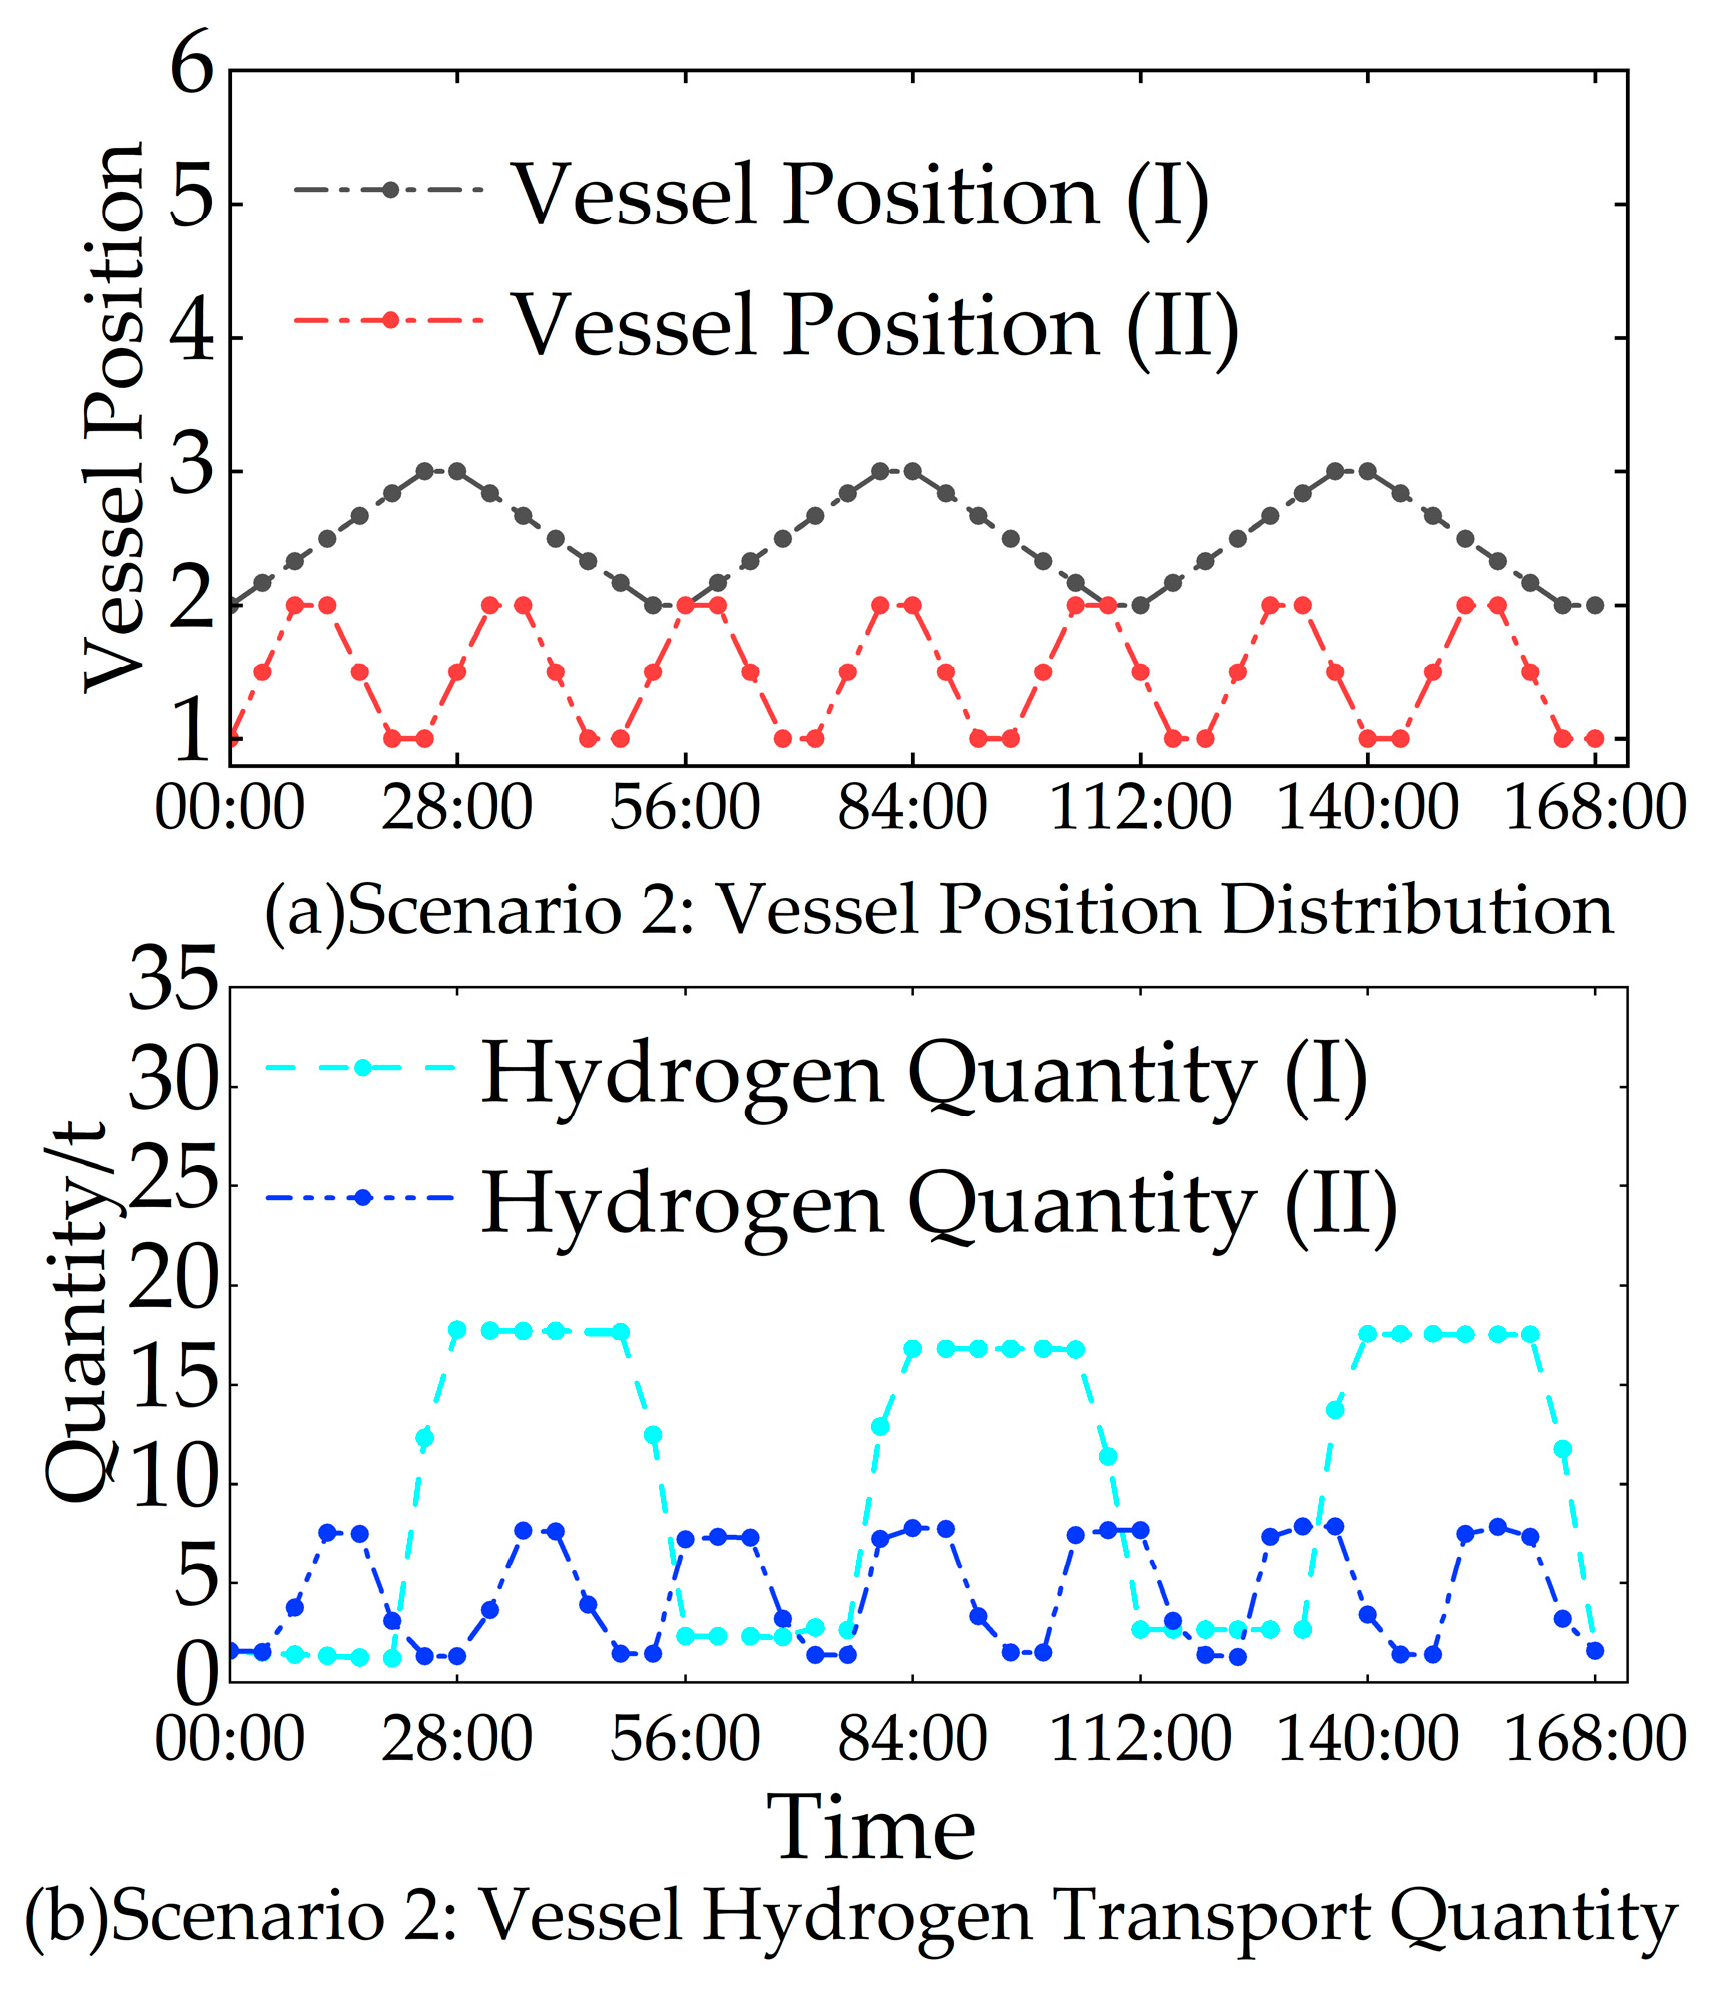
With the objective of achieving global economic optimality for the system,
Figure 5 and
Figure 6 present the weekly vessel spatiotemporal distribution and energy transmission results for the two scenarios. It can be observed that, under the Scenario 1 mode, ocean-going vessels must perform long-distance round trips from the far-offshore area to land. Their spatiotemporal trajectories exhibit prolonged voyage characteristics, with a vessel operating rate exceeding 90%; however, a substantial amount of time is consumed in transit. Consequently, hydrogen delivery shows pronounced fluctuations: when vessels arrive at the onshore receiving terminal, a large volume of hydrogen is unloaded in a short period, creating abrupt impacts on onshore hydrogen supply and demand. Moreover, because sailing-related fuel consumption grows with the square of speed, the long-haul round trips in Scenario 1 incur disproportionately higher navigation losses, reducing the net hydrogen delivered to the shore and further lowering transport energy efficiency under tight logistics constraints.
In Scenario 2, nearshore vessels operate with high frequency and small batch sizes, alleviating the hydrogen storage pressure at both the nearshore and far-offshore wind farms and reducing the burden on long-haul hydrogen transport. This leads to a smoother hydrogen supply profile.
To test the robustness of the proposed relay-enabled transport architecture, this subsection further performs a sensitivity analysis by comparing system operation with and without vessel suspension under extreme scenarios.
Table 4 presents a comparison of monthly hydrogen transport under extreme scenarios. As can be seen from
Table 4, in Scenario 2 under the extreme scenario, vessels made 24 trips for the month, with the relay point storing 389 t of hydrogen. In Scenario 3, Vessel 1 completed 16 trips for the month, and the relay point stored 378 t of hydrogen. Despite the reduction in far-offshore transport capacity, Scenario 3 achieved a comparable level of reserve between the two cases. Therefore, incorporating relay point coordinated hydrogen production with a consideration of vessel suspension under extreme scenarios demonstrates greater economic efficiency and enhanced risk resilience.
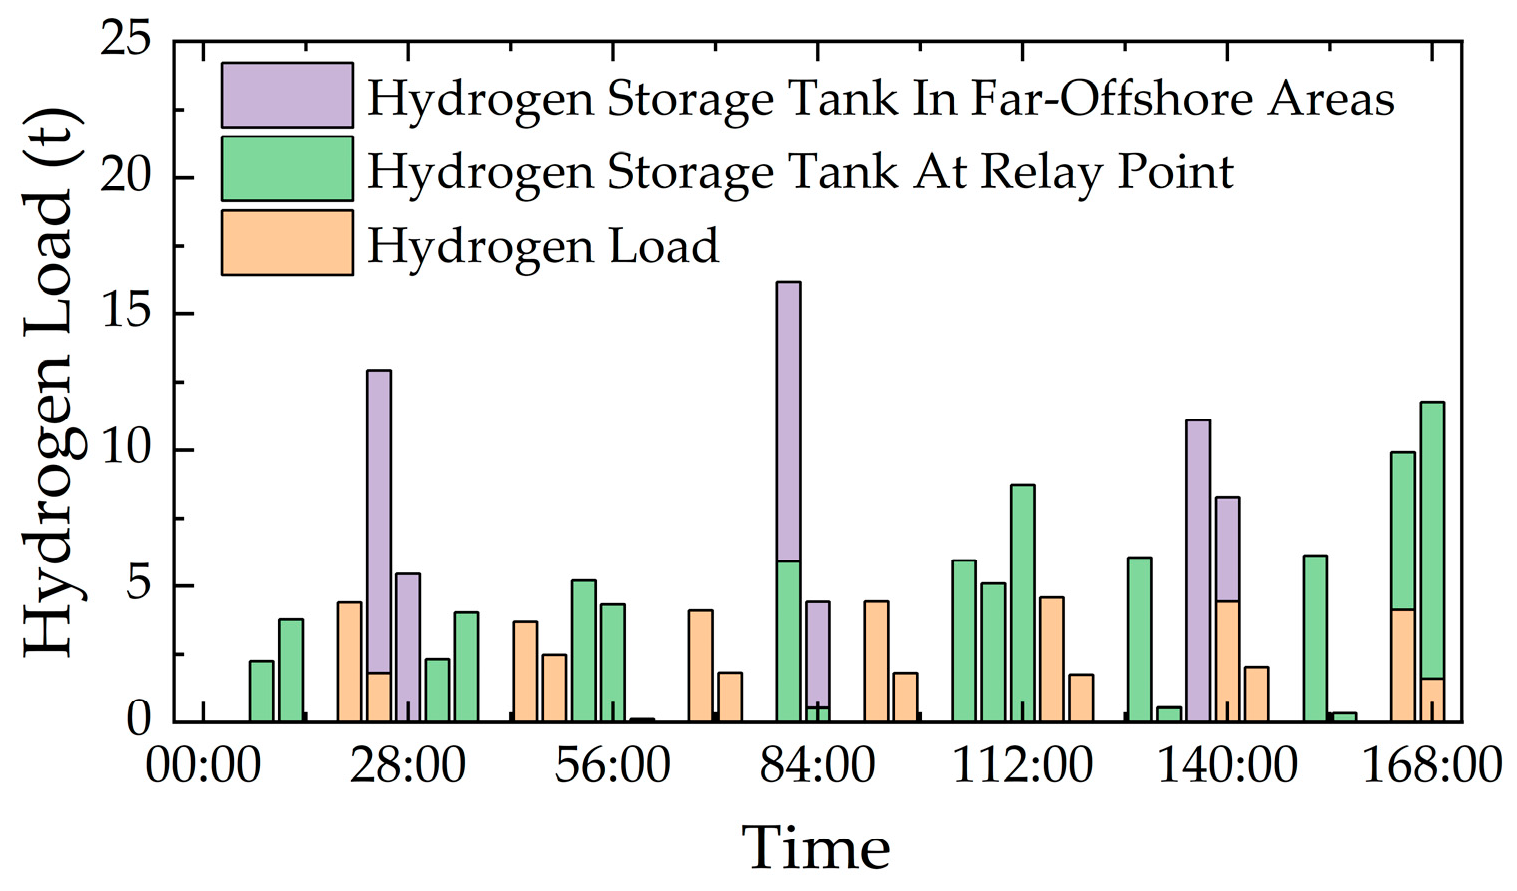
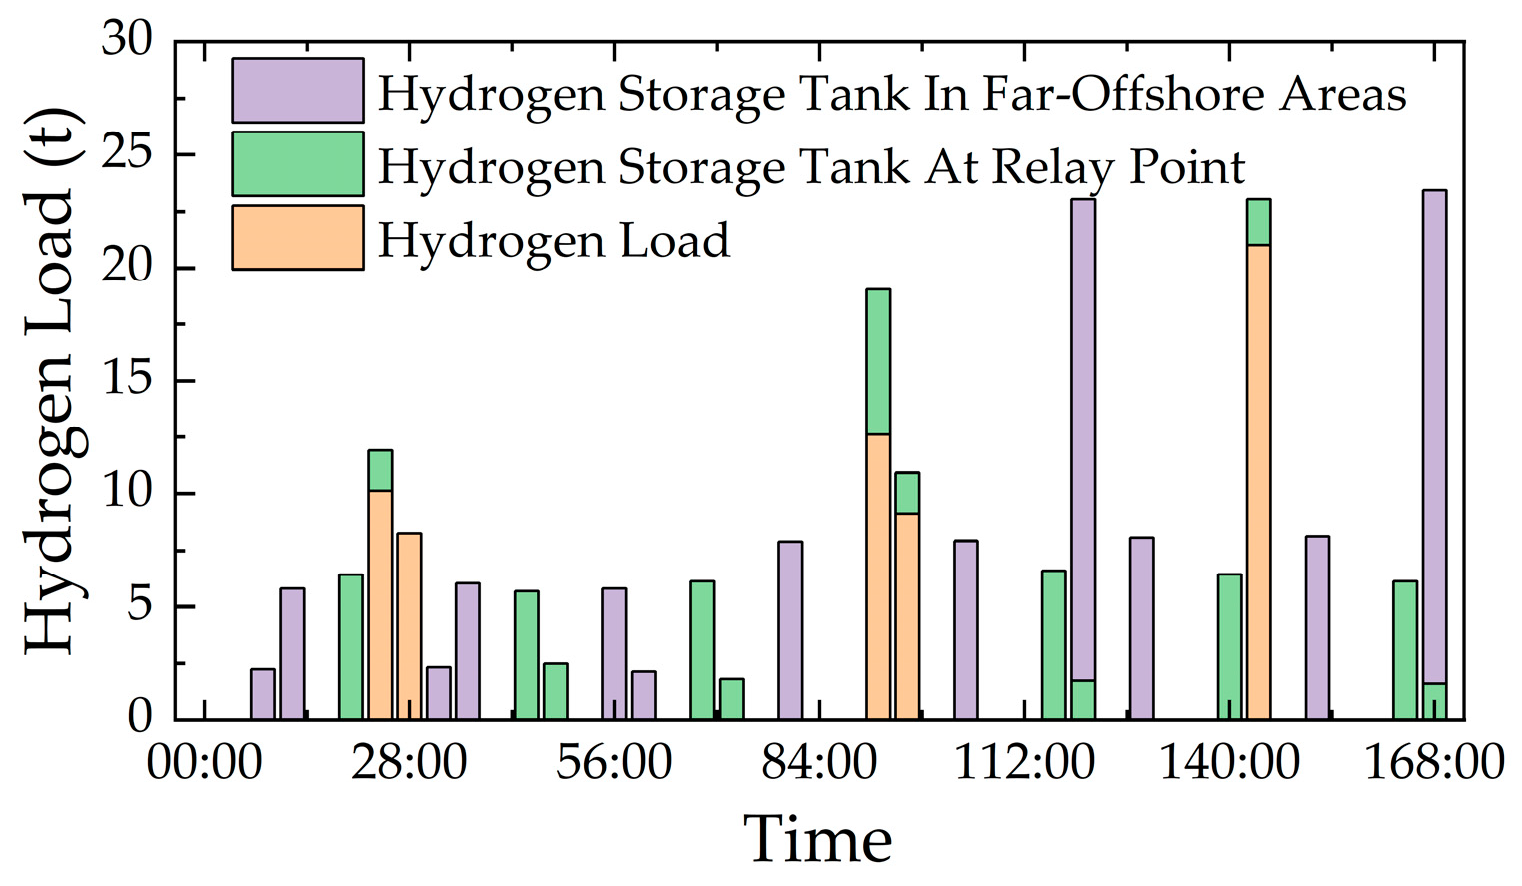
Figure 7 and
Figure 8 show the weekly changes in hydrogen transfer between vessels and storage for Scenarios 2 and 3, respectively. Under the extreme scenario, Vessel 1 experienced one suspension at 52:00, yet the hydrogen interactions between Vessel 1, Vessel 2, and the relay point remained smooth. The relay point maintained its ability to balance supply and meet the onshore hydrogen load without degradation, thereby maximizing the buffer regulation capacity of the hydrogen storage tanks and ensuring continuous and stable hydrogen supply to downstream land facilities.
3.3.2. Electric Power Transmission
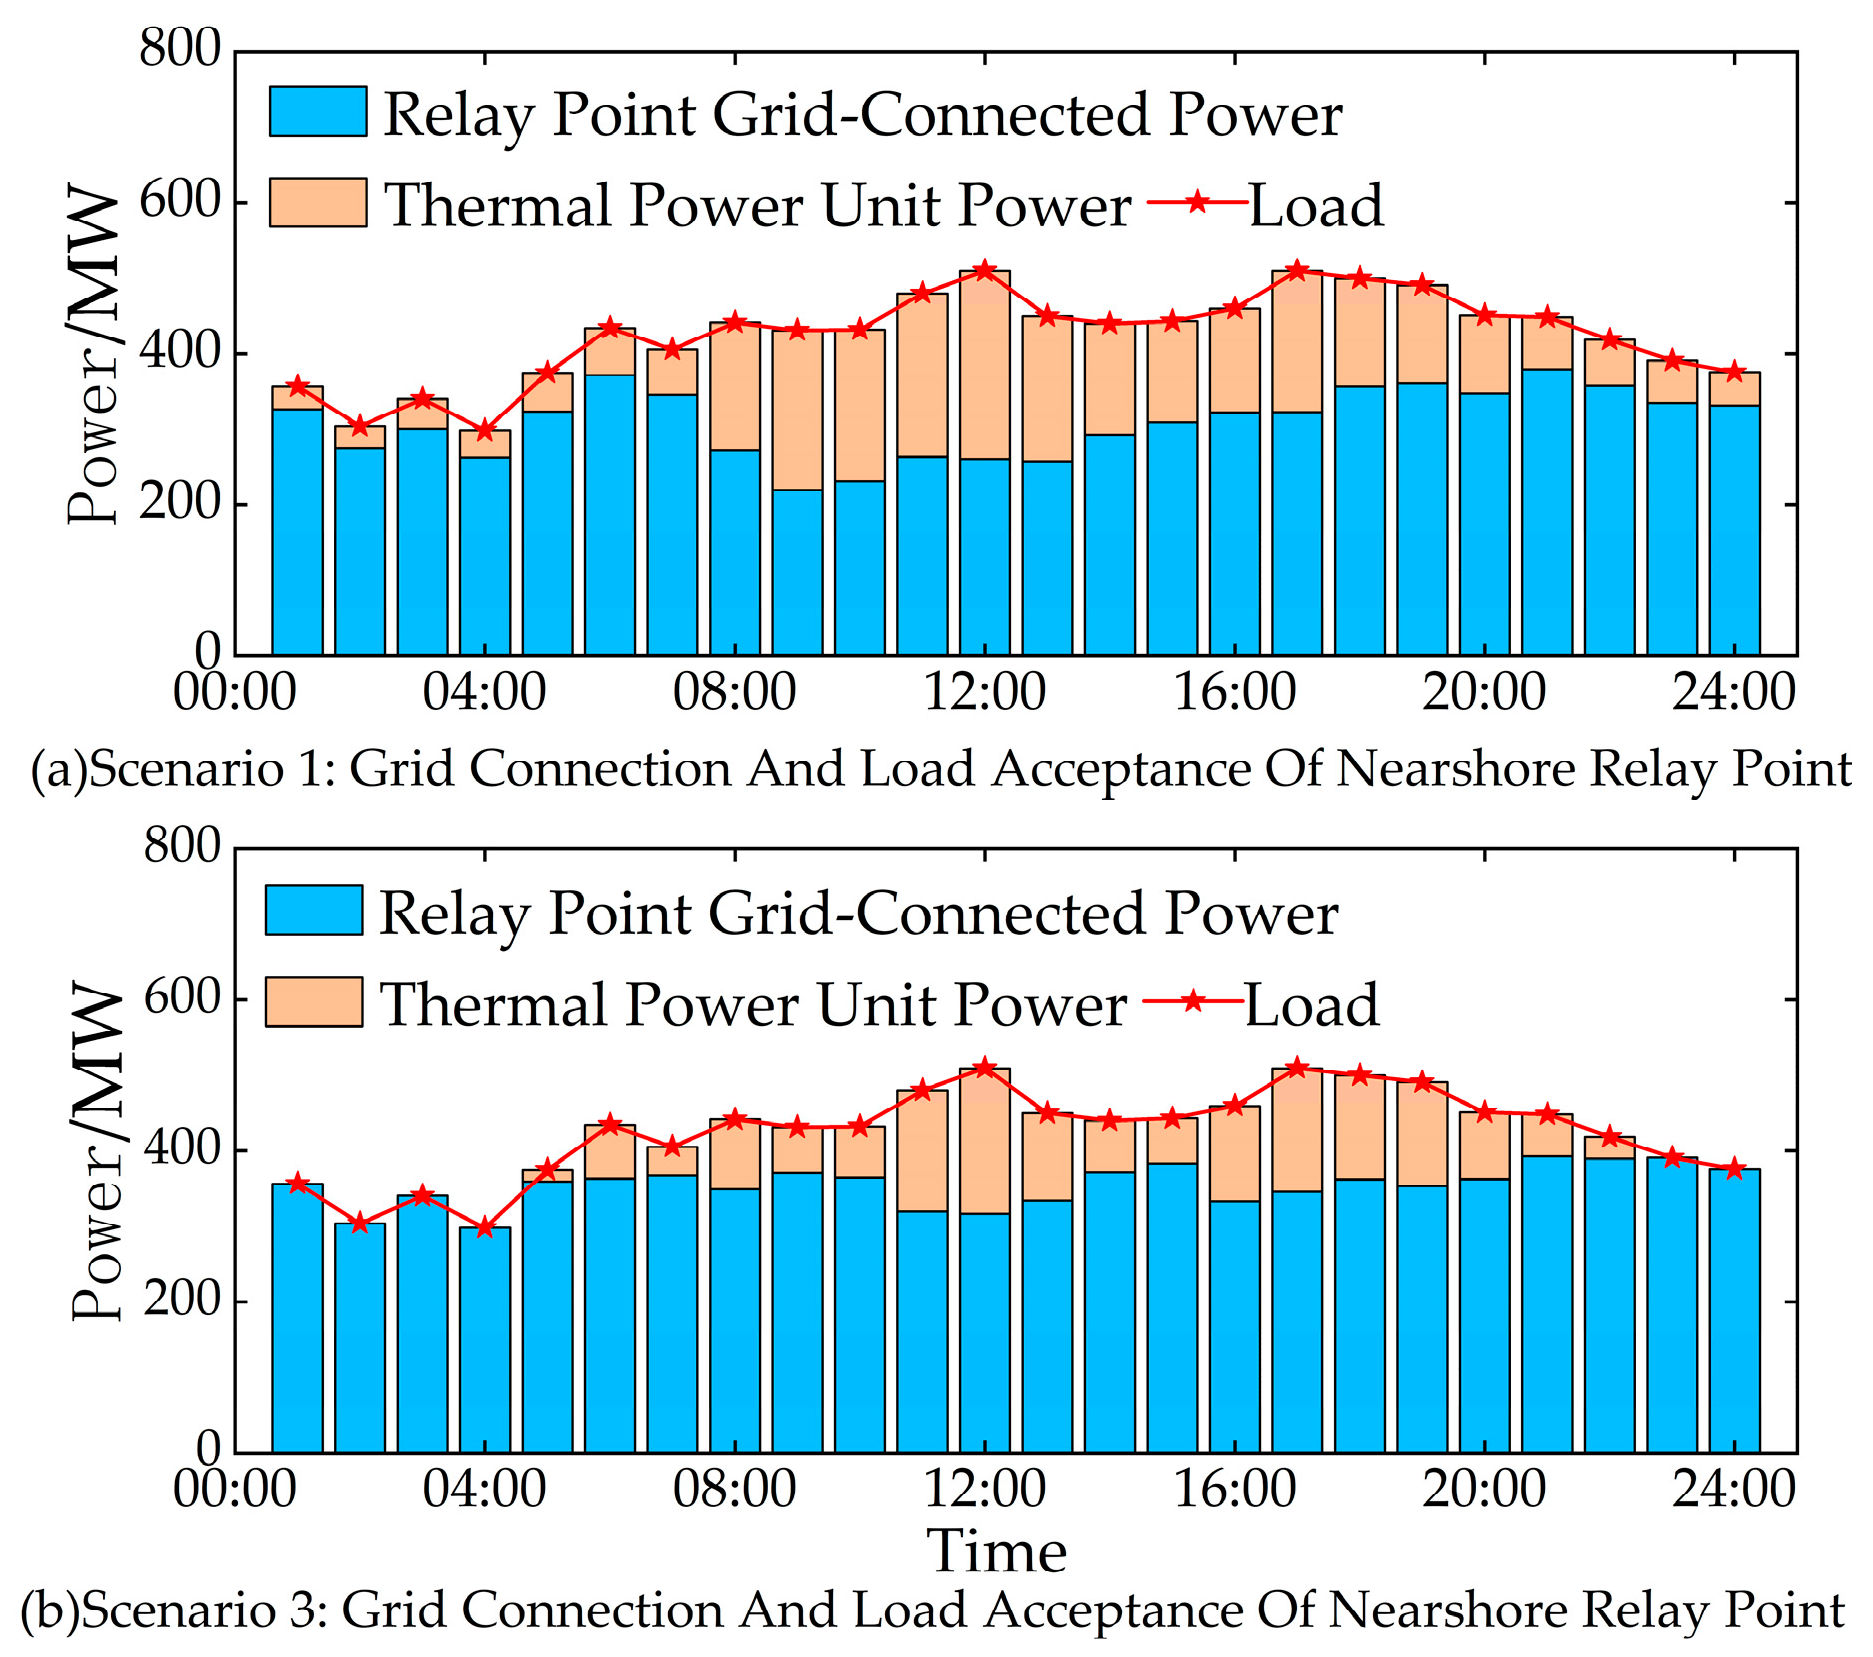
Figure 9 shows the total grid-connected output of the nearshore relay point wind farm and the output of thermal power units for Scenario 1 and Scenario 3. A single-day analysis of thermal and wind power output is presented. From
Figure 9a, the first stage of wind farm output indicates that between 08:00 and 20:00, due to a decrease in offshore wind speed, the output of thermal power units increased. In contrast, as seen in
Figure 9b for Scenario 3, the buffering value of the relay point hydrogen storage tanks is fully exploited: the system can store hydrogen in advance during periods of surplus wind power, so as to meet hydrogen demand and simultaneously reduce the need for additional balancing by thermal power units when wind power output is insufficient.
3.4. Economic Comparison Analysis of Scenarios
3.4.1. Economic Comparison and Ablation Evidence Under Extreme Weather
According to the comparative analysis of the planning results in
Table 5, the total investment cost of Scenario 3 is CNY 13.752 billion, which is CNY 1.191 billion lower than that of Scenario 2, indicating effective cost savings. Meanwhile, the annual operating cost of Scenario 3 is CNY 0.966 billion, representing a reduction of CNY 0.297 billion compared with Scenario 2, reflecting superior economic operational efficiency. In addition, the monthly wind power curtailment rate in Scenario 3 drops to 24.13%, a substantial decrease of 10.45 percentage points from 29.68% in Scenario 2. It is evident that the planning method proposed in this study not only reduces the system’s total investment and operating costs, but also improves the utilization efficiency of wind resources and the transmission effectiveness of hydrogen.
To substantiate the effectiveness of the proposed second-order robust planning against vessel downtime, we conduct an ablation study by comparing the system performance with and without the robust component under identical extreme weather conditions. Specifically, Scenario 2 represents the relay-enabled multi-stage transport architecture without the robust planning component, while Scenario 3 incorporates the proposed two-stage robust optimization to explicitly hedge against vessel suspensions. The results show that the robust configuration in Scenario 3 effectively enhances supply reliability and reduces disruption-induced losses; compared with Scenario 2, Scenario 3 achieves a lower annual operating cost by CNY 0.297 billion and a lower monthly wind curtailment rate by 10.45 percentage points under extreme weather vessel downtime, thereby demonstrating the practical value of the robust component.
3.4.2. Robustness and Sensitivity Analysis
To further enhance the methodological rigor, we additionally examine the sensitivity of the above conclusions to changes in the key inputs. Based on the sensitivity results, we evaluate how the main indicators—total investment cost, annual operating cost, and wind power curtailment rate—respond when storage-related cost/size assumptions, vessel-related capacity/operating assumptions, and extreme-condition downtime intensity are varied within plausible ranges. The sensitivity results indicate that the comparative advantages of the relay-enabled multi-stage architecture and the robust configuration remain consistent across these parameter variations, thereby supporting the robustness of the reported findings without altering the benchmark results in
Table 5.
We further perform a targeted sensitivity analysis on electrolyzer conversion performance, the electricity-to-hydrogen conversion coefficient, and vessel sailing-consumption intensity. The results are summarized in
Table 6.
Notably, the sensitivity-induced variations in operating cost and curtailment are smaller than the ablation gap between Scenario 2 and Scenario 3 reported in
Table 5, indicating that the economic and operational advantages of the robust relay-enabled configuration remain stable under reasonable parameter perturbations.
As indicated in
Table 6, improving
effectively increases the hydrogen yield from the same wind power input, which enhances the curtailment absorption capability and typically improves both economic and operational indicators. In contrast, a larger effective conversion coefficient
weakens the power-to-hydrogen chain and may increase curtailment under the same transport and storage constraints. In addition, since propulsion consumption grows with
, higher sailing-consumption intensity penalizes long-haul operations more strongly, which increases the relative value of relay-enabled staging and buffering.
From an economic perspective,
Table 7 shows the sensitivity of ROI to the hydrogen selling price. ROI increases monotonically across all scenarios, with Scenario 3 exhibiting the greatest economic robustness. Despite the improvement in Scenario 3, the remaining curtailment mainly stems from binding operational limits in the current system configuration, including the instantaneous conversion capability of electrolyzers, hydrogen storage bounds, and marine transport constraints. When surplus wind power exceeds the feasible absorption capacity of the power-to-hydrogen chain at certain time periods, curtailment becomes unavoidable under the present assumptions.
In summary, the far-offshore wind power planning method proposed in this study, which considers nearshore relay points and coordinated hydrogen production, effectively addresses the issues faced by traditional single-stage transport modes—namely low transport efficiency, high wind curtailment rates, and poor economic performance—by establishing a multi-stage coordinated system of “far-offshore hydrogen production—nearshore storage and transport buffering—onshore consumption”.
Scenario comparisons demonstrate that the introduction of multiple transport stages significantly enhances overall system performance: compared with the baseline scenario, Scenario 3 achieves a reduced wind curtailment rate, improved vessel transport efficiency, and verifies the engineering value of multi-stage distribution coordination. The buffering mechanism at the relay point enables dynamic optimization, reducing the fluctuation amplitude of far-offshore hydrogen storage, improving hydrogen supply stability, and consequently driving down the unit cost of hydrogen.
4. Discussion
To address the challenges in planning far-offshore wind–hydrogen systems—especially those related to accommodation and utilization—this study introduces a planning method that incorporates nearshore relay points and coordinated hydrogen production and transportation. From a scientific perspective, the proposed framework provides a unified way to couple long-term capacity planning with short-term operational scheduling in a far-offshore wind–hydrogen supply chain, explicitly capturing the interactions among wind variability, hydrogen storage states, and multi-vessel logistics. This integration advances the field by moving beyond simplified, single-stage transport assumptions and by offering a system-level representation of spatiotemporal hydrogen transfer under operational constraints and extreme conditions.
From an industry and practitioner perspective, the results offer actionable value for offshore wind developers, hydrogen project investors, and marine logistics operators. The model can inform investment decisions on relay point storage sizing and fleet configuration, support strategy selection between direct transport and relay-based transport architectures, and provide quantitative guidance for risk management under severe weather disruptions. For policymakers and regulators, the framework can help evaluate infrastructure priorities, and it can serve as a reference when designing standards or incentives related to offshore hydrogen supply reliability and curtailment reduction. Overall, the study explicitly delineates how relay-based planning can improve the economic and operational performance of far-offshore wind-to-hydrogen systems, thereby strengthening the practical significance of the work for the renewable energy industry.
Future research can further extend the proposed framework in three directions. First, relay point siting should be investigated using integrated techno-economic and marine-constraint analyses to improve feasibility under real-world sea area restrictions and port accessibility. Second, the planning method can be generalized to multiple relay points, enabling networked offshore hydrogen logistics and potentially improving resilience and scalability for large development zones. Third, the role of inter-seasonal hydrogen storage at relay points deserves dedicated attention, as it may help address seasonal supply–demand mismatches and align offshore hydrogen production with downstream demand profiles.