Article

Predicting Hyperkalemia in Patients with Chronic Kidney Disease Using the CatBoost Model and Multiple Interpretability Analyses

1
College of Mathematics and Statistics, Wuhan University of Technology, Wuhan 430070, China
2
Hubei Longzhong Laboratory, Wuhan University of Technology, Xiangyang 441100, China
3
Department of Biostatistics and Data Science, College of Public Health, University of South Florida, Tampa, FL 33612, USA
*
Author to whom correspondence should be addressed.
Electronics 2026, 15(2), 291; https://doi.org/10.3390/electronics15020291
Submission received: 13 October 2025 / Revised: 16 December 2025 / Accepted: 6 January 2026 / Published: 9 January 2026

Abstract

Hyperkalemia is a major complication of chronic kidney disease (CKD). However, owing to the absence of specific symptoms in its early stages, hyperkalemia frequently remains undiagnosed. This study aimed to develop a machine learning model for predicting the risk of early hyperkalemia in patients with CKD. By conducting a comparative analysis of six machine learning methods, CatBoost demonstrated superiority across various evaluation metrics. Further evaluation using confusion matrix and decision curve analysis (DCA) confirmed its high classification accuracy and substantial clinical utility. Meanwhile, through multiple interpretability analyses based on SHAP and Local Interpretable Model-agnostic Explanations (LIME) techniques, we precisely quantify the contributions and positive or negative effects of risk factors for hyperkalemia.

1. Introduction

Chronic Kidney Disease (CKD) has emerged as a major global health threat. Epidemiological studies indicate a worldwide prevalence of CKD ranging from 8% to 16% [1,2]. Clinically, CKD patients are often accompanied by renal anemia (RA), secondary hyperparathyroidism (SHPT), and other complications [3]. Hyperkalemia is a common metabolic complication in patients with CKD, generally defined as a blood potassium level higher than 5.5 mmol/L in international guidelines [4,5]. Hyperkalemia typically presents with nonspecific clinical manifestations. As serum potassium levels rise, patients may develop progressive neurological symptoms, including limb paresthesia, muscle weakness, and mental status deterioration, accompanied by cardiovascular complications such as hypotension and arrhythmias. Left untreated, severe hyperkalemia may lead to life-threatening respiratory depression, cardiovascular collapse, and ultimately cardiac arrest [6,7].
As serum potassium levels increase, hyperkalemia patients may develop progressive neurological symptoms like limb paresthesia, muscle weakness, and mental status deterioration, along with cardiovascular complications including hypotension and arrhythmias [8,9]. However, due to the lack of specific symptoms in its early stages, hyperkalemia frequently remains undiagnosed, with some cases only being identified upon the emergence of severe complications such as malignant arrhythmias or sudden cardiac death [10]. If diagnosed promptly, it enables clinicians to implement timely personalized management for patients, including precise monitoring and intervention, while ensuring the safe use of cardiorenal medications. Consequently, there is an urgent need to develop validated tools for the early prediction of hyperkalemia in patients with CKD.
Although studies have revealed multiple risk factors for the development of hyperkalemia and clinical outcomes, challenges in the timely diagnosis of hyperkalemia persist, as few studies have focused on developing early prediction models for CKD patients. With the progress of science and technology, artificial intelligence and big data technology have been developed rapidly. As a branch of artificial intelligence, machine learning (ML) is a computational discipline that enhances system performance by enabling computers to simulate human learning processes and autonomously acquire knowledge and skills [11]. Currently, machine learning has shown increasing promise and effective performance in disease prediction tasks. Therefore, constructing an early prediction model for hyperkalemia associated with chronic kidney disease using machine learning represents a viable approach. Meanwhile, in the field of machine learning, interpretability analysis is of critical importance. It enhances the reliability of models by revealing feature importance, quantifying the direction and magnitude of influencing factors, and thereby transforming the model’s predictive process into understandable evidence. However, a single interpretability method may be insufficient to deliver all this valuable information simultaneously. As a result, we aim to construct an early prediction model for CKD-associated hyperkalemia using ML methods and employ multiple interpretability analyses to obtain comprehensive and precise feature contributions.
The most important contributions of this work are summarized below:
  • Clinical data from patients with CKD and CKD-associated hyperkalemia were extracted from the MIMIC database, and data preprocessing work was performed on them.
  • The study employed six machine learning models to predict the risk of hyperkalemia in CKD patients. The optimal model was selected based on different evaluation metrics and further assessed by DCA for its clinical utility.
  • Multiple interpretability analyses were conducted on the optimal model: SHAP analysis can precisely quantify the positive or negative impacts of key risk factors, while LIME methods provide a comprehensive ranking of risk factors and clearly visualize the ranges within which different indicators exert their influential effects. By integrating the analyses, we gain a deep understanding of the magnitude and polarity of each medical indicator’s impact on the prediction, accurately grasp the distribution of all samples across different indicators, and pinpoint the value ranges within which each indicator plays a dominant role in determining the outcome. This approach enhances clinicians’ understanding of the machine learning-assisted diagnostic process and fosters greater trust in the diagnostic outcomes.
To present these findings in a clear and logical manner, the remainder of this paper is organized as follows. Section 2 reviews current research on the early prediction of hyperkalemia. Section 3 describes the dataset from MIMIC-IV and details the methodology, including data preprocessing and early prediction. Section 4 evaluates model performance using different metrics and conducts multiple interpretability analyses of the optimal model. Section 5 suggests future research directions. Section 6 summarizes the core contributions and conclusions of this work.

2. Related Work

Prior studies have investigated potential biomarkers and predictive models for hyperkalemia in CKD patients. Sharma et al. [12] developed a prediction model using a large U.S. healthcare payer database to identify CKD patients at risk of developing hyperkalemia within 12 months of initiating renin–angiotensin–aldosterone system inhibitor (RAASi) therapy. By analyzing CKD patients diagnosed in 2016 without hyperkalemia who subsequently developed incident hyperkalemia in 2017, the study found higher comorbidity burdens and increased RAASi utilization in patients who developed hyperkalemia (AUC = 0.843). The top two risk deciles accounted for 75.9% of hyperkalemia cases, demonstrating strong predictive performance. Israni et al. [13] used electronic medical records to study the progression from mild hyperkalemia. The study revealed that among patients with mild hyperkalemia, 16.9% and 8.7% progressed to moderate and severe hyperkalemia, respectively. In addition, the Cox proportional hazards model (Cox PH) identified advanced CKD stage, type 1 diabetes mellitus (T1DM), and baseline hyperkalemia as significant predictors of hyperkalemia progression, and patients with comorbid heart failure, hypertension, or type 2 diabetes mellitus (T2DM) had significantly higher progression rates than those without these conditions. Kim et al. [14] evaluated the association between serum aldosterone-to-potassium (Aldo/K) ratios and hyperkalemia risk in stage 3–4 CKD patients receiving angiotensin-converting enzyme inhibitors (ACEIs) or angiotensin receptor blockers (ARBs). Using Cox PH in a cohort of 186 CKD patients, they demonstrated that lower Aldo/K ratios significantly increased hyperkalemia incidence. These findings suggest that monitoring serum aldosterone and potassium levels during ACEI/ARB therapy may help identify CKD patients at elevated hyperkalemia risk. Katherine et al. [15] conducted a cross-sectional analysis of medical records from pediatric CKD patients to determine hyperkalemia prevalence and associated risk factors. Using LR, they found no significant associations between hyperkalemia and age, gender, or race/ethnicity. Hyperkalemia was more prevalent in children with advanced CKD, glomerular disease, low serum bicarbonate, and ACEI/ARB therapy. Chang et al. [16] developed different machine learning models using electronic health record data from advanced CKD patients and compared their performance against clinician assessments. The results showed that the XGBoost model demonstrated superior predictive capability, achieving an accuracy of 0.933, which significantly exceeded clinician performance. XGBoost and LR models consistently identified four key predictors: hemoglobin level, serum potassium concentration at the previous visit, prior ARB use, and history of calcium polystyrene sulfonate administration. You et al. [17] investigated CKD patients and found that when a patient presented with at least one of the symptoms of hyperkalemia, the point-of-care potassium test (POC-K+) demonstrated high concordance with standard laboratory serum potassium measurements (ICC = 0.913). This indicates that POC-K+ effectively enables rapid hyperkalemia diagnosis in CKD patients, proving particularly valuable in clinical scenarios requiring immediate intervention. Kohsaka et al. [18] conducted a study to examine the association between hyperkalemia and long-term cardiovascular/renal outcomes in patients with CKD. Over a mean follow-up period of 3.5 years, the hyperkalemia group exhibited significantly faster declines in estimated glomerular filtration rate (eGFR) and higher risks of all-cause mortality, cardiac event-related hospitalizations, heart failure, and renal replacement therapy compared to the normokalemia group. Kanda et al. [19] developed a risk prediction model using a retrospective database cohort study. They employed XGBoost, LR, and deep neural networks to predict four outcomes in patients with heart failure or stage 3a-5 CKD: all-cause mortality, hyperkalemia, heart failure hospitalizations, and cardiovascular events. Results demonstrated XGBoost outperformed other models, exhibiting strong predictive accuracy in both internal and external validation sets.
Conducting interpretability analysis upon completion of model predictions is crucial. Interpretability analysis is a technique that seeks to provide human-understandable explanations for the decision logic of machine learning models by externally analyzing their behavior, without altering the model’s internal structure. Given the critical importance of reliable outcomes in fields like healthcare, explaining the model becomes essential—especially for complex “black-box” models such as deep neural networks and ensemble trees. To date, several key interpretability methods have been introduced. Craven et al. [20] proposed a global surrogate model approach, which trains a fully transparent and interpretable model (such as a decision tree) to approximate the input–output mapping of a black-box model globally. By interpreting the surrogate, one can indirectly understand the overall decision logic of the complex model. Lundberg et al. [21] introduced the SHAP framework, which is based on Shapley values from cooperative game theory. SHAP quantifies the contribution of each feature by averaging its marginal impact across all possible feature subsets, offering a unified and model-agnostic explanation that indicates both the magnitude and direction of feature influence. Ribeiro et al. [22] developed LIME, a method built on the idea of “local fidelity.” LIME generates intuitive explanations for individual predictions by constructing a simple, interpretable model that locally approximates the complex model around the instance of interest, using perturbed samples to ensure a faithful local fit. Vaswani et al. [23] embedded an intrinsic interpretability mechanism within the Transformer architecture via attention weights. Visualizing these weights thus offers direct insight into the model’s focus across different input segments, enabling the discovery of feature interactions during decision-making.
In summary, significant progress has been made in understanding hyperkalemia in CKD, particularly regarding risk stratification, contributing factors, and clinical diagnosis. However, few studies have focused on developing early prediction models for hyperkalemia in CKD patients, and even fewer have employed ML models for this task. Additionally, while existing research has identified multiple risk factors, consensus on key determinants remains limited, with conflicting conclusions appearing in some reports. Meanwhile, studies rely on only one interpretability method, limiting the perspective from which the model is examined. Employing multiple interpretability approaches can more fully capture the necessary information—such as the magnitude and direction of feature influence, the intervals over which they exert effects, and their distribution across different sample points—leading to a more comprehensive and reliable understanding of model behavior. Therefore, we applied ML methods for the early prediction of hyperkalemia in CKD patients and used multiple interpretability analyses to identify comprehensive and precise risk factors.

3. Materials and Methods

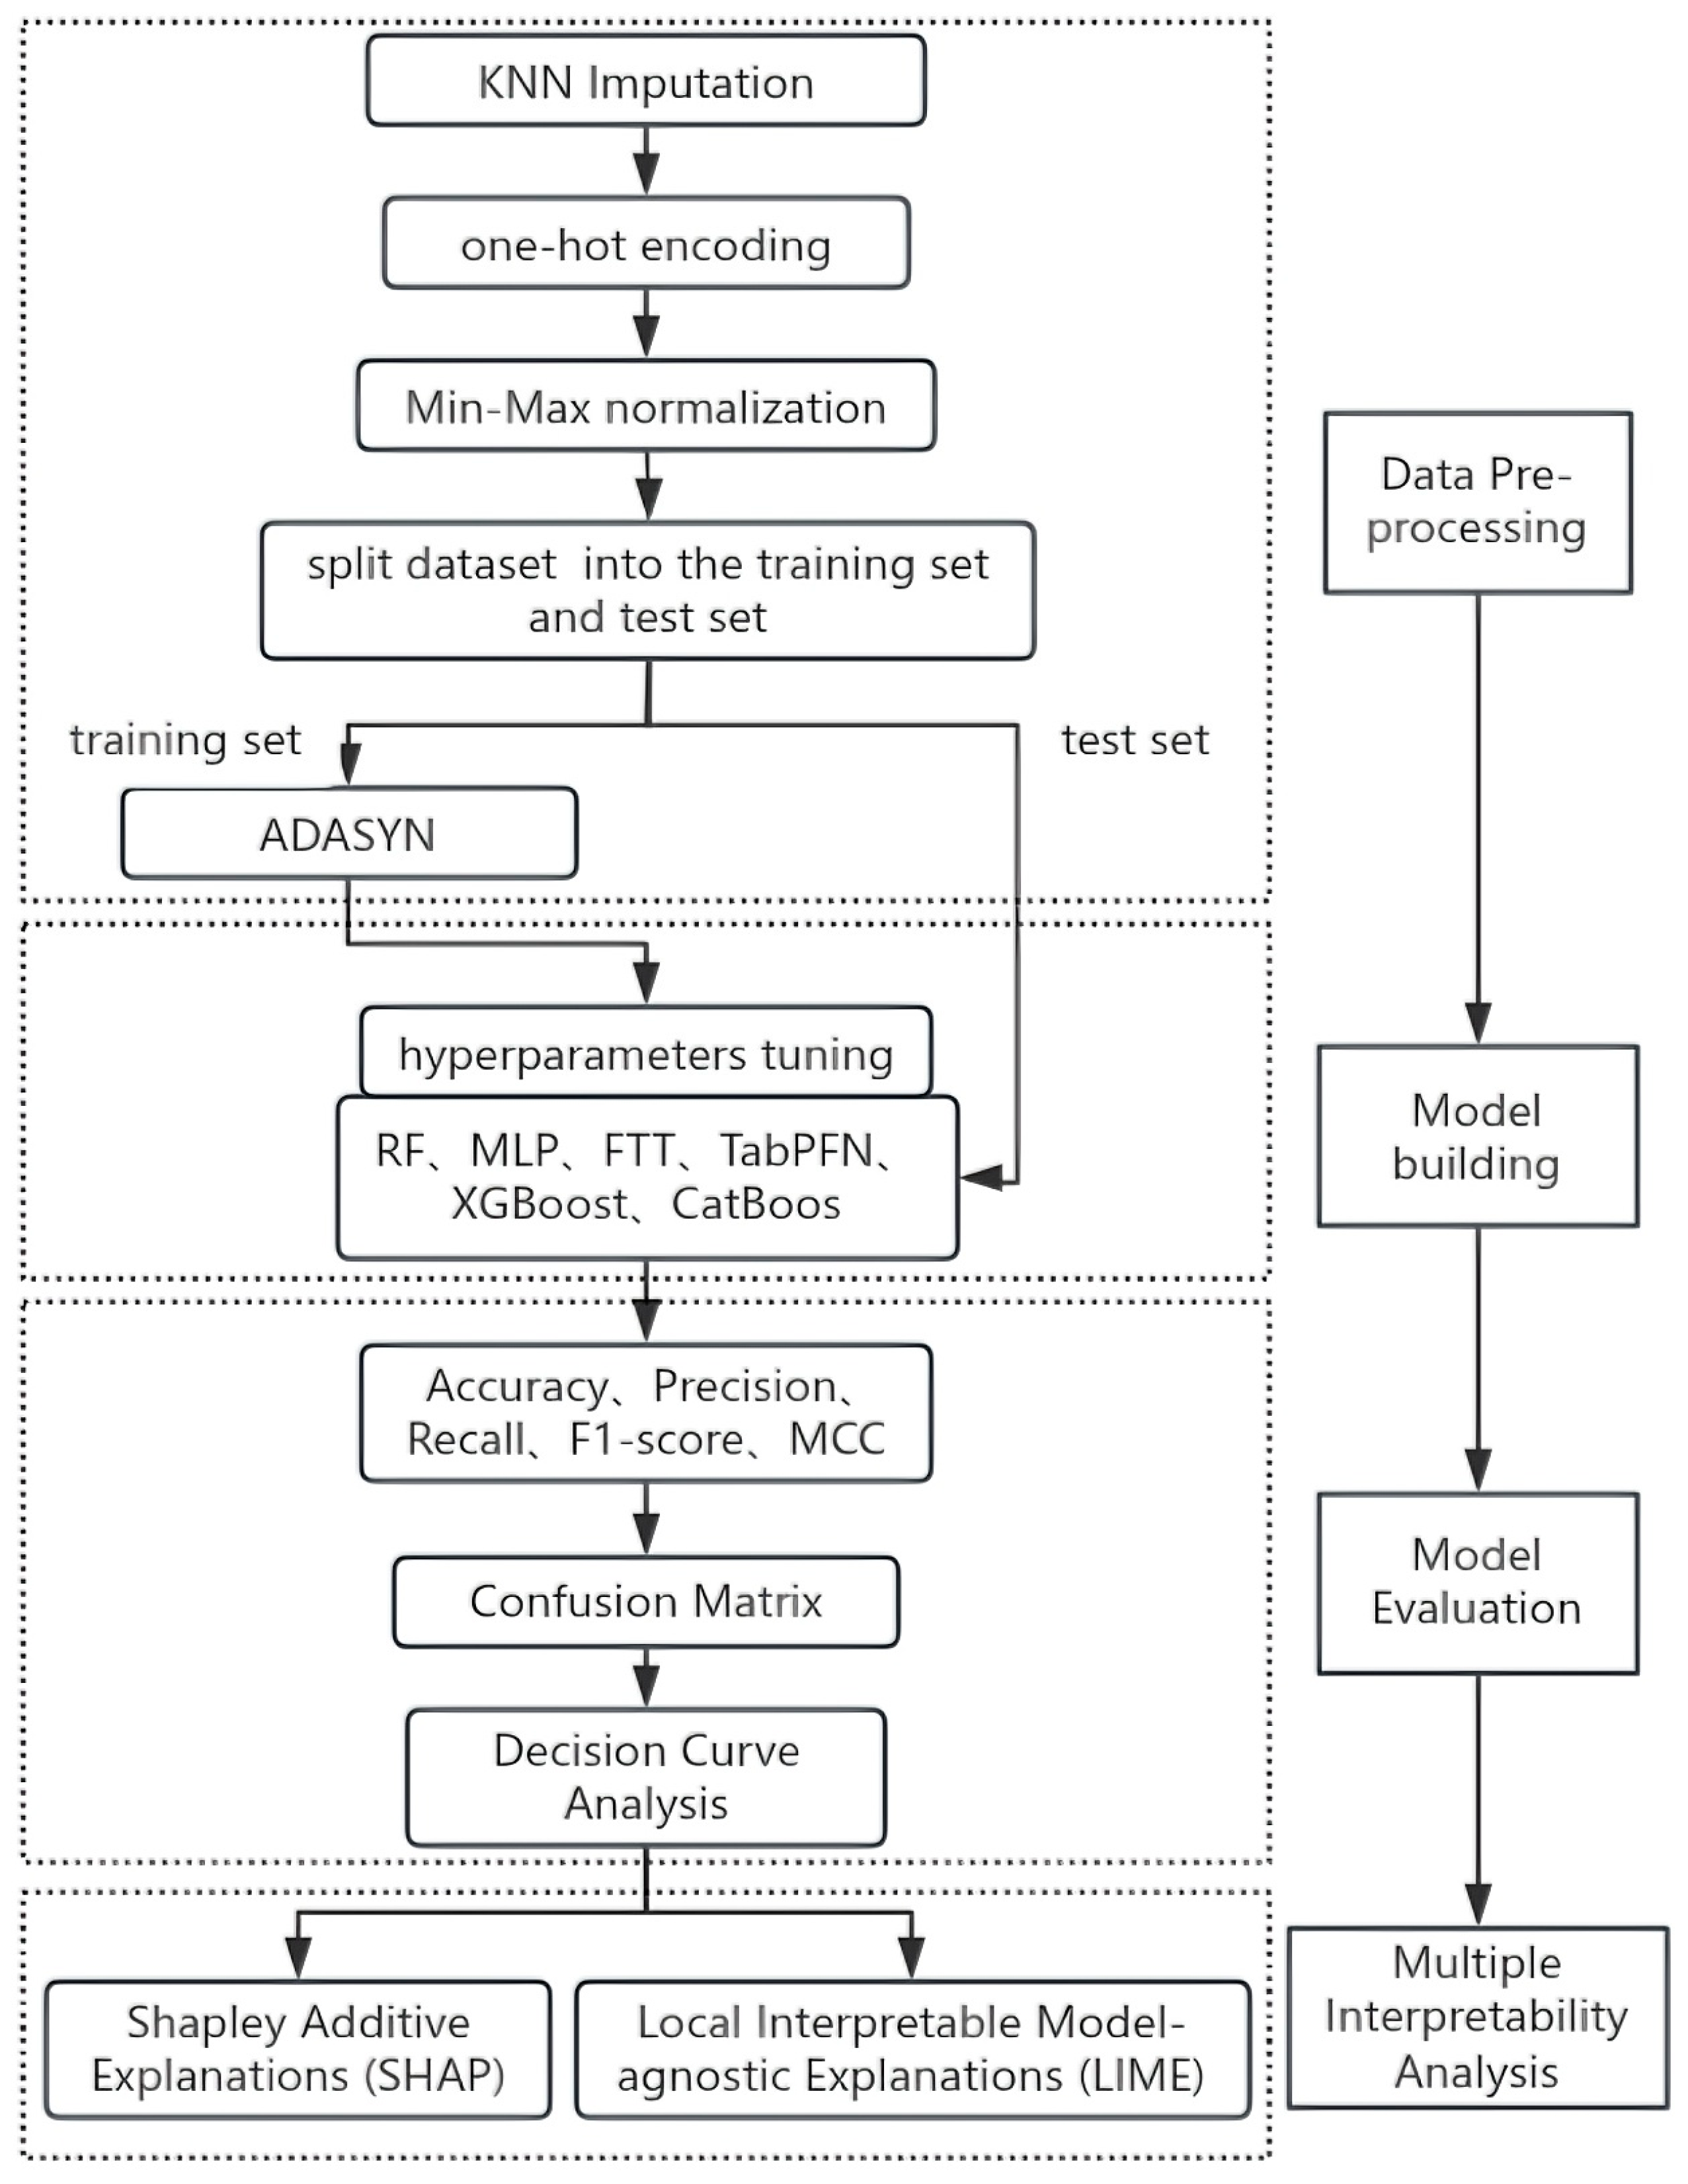
The technical framework of this study is summarized in Figure 1.

3.1. Datasets

The Medical Information Mart for Intensive Care (MIMIC) database is a publicly accessible critical care repository collaboratively developed by the Massachusetts Institute of Technology (MIT) Laboratory for Computational Physiology, Beth Israel Deaconess Medical Center (BIDMC), and Philips Healthcare, with initial funding from the National Institutes of Health (NIH) [24]. First released in 2003 and now updated to the MIMIC-IV version, this resource integrates de-identified multidimensional clinical data from over 60,000 intensive care unit (ICU) admissions. Based on the research in this paper, access to this database has been obtained; therefore, the data used in this paper are not subject to ethical review.
This study focused on CKD-related hyperkalemia. We initially identified CKD patients through ICD-9/10 codes, then screened hyperkalemia cases from this cohort. The exclusion and inclusion criteria were as follows: 1. Hyperkalemia patients were ICU patients with clinically confirmed chronic kidney disease and peak serum potassium ≥5.5 mmol/L [25]. 2. For patients with multiple ICU admissions, only the first admission data were considered. 3. Patients with ICU stays of less than 6 h were excluded. 4. Patients aged <18 years were excluded. 5. Patients with excessive missing data were excluded.
This study selected a 48-dimensional feature set comprising demographic and laboratory variables, including age, height, weight, wbc, and hemoglobin to form the early prediction dataset. Detailed definitions of all features are provided in Appendix A. Using Structured Query Language, we extracted 1748 patient episodes from the database. And after applying exclusion criteria for extensive missing data, 548 records were included in the final dataset.

3.2. Data Pre-Processing

Data preprocessing is a crucial preliminary step in data analysis. It involves operations such as data cleaning and imputation, which transform raw data into a format suitable for analysis, thereby improving model accuracy.
To prevent missing values from affecting model training, we employed the k-nearest neighbors (KNN) imputation method [26] for features with a low proportion of missing values. As a multivariate technique, KNN estimates missing values based on the feature vectors of the k most similar complete cases, thereby effectively preserving the local data structure and distribution characteristics. Compared to more complex model-based imputation methods, KNN is computationally efficient and less prone to overfitting. To ensure the reliability of missing value imputation, this study adopted a stratified 5-fold cross-validation strategy to determine the optimal k = 4 for KNN imputation. Specifically, the dataset was randomly partitioned into five stratified folds. For each candidate value of k, a standard 5-fold cross-validation was conducted: in each fold, one subset was held out as the validation set, and the model was trained on the remaining four. After training and evaluating a decision tree as the base model, the optimal parameter was selected based on the average accuracy of the model on the validation sets. Notably, when the proportion of missing values in a feature is excessively high, imputation becomes unreliable for recovering meaningful information. This process is likely to introduce substantial noise and skew the underlying data distribution, thereby introducing bias into the predictive outcomes [27]. Therefore, features with missing values exceeding 50%, such as total_protein and albumin, were discarded directly. After elimination, 30-dimensional features remain for the early prediction dataset.
For categorical variables such as gender that exist in the original data, this paper coded them one-hot for subsequent modeling and analysis.
Since the magnitudes of the features are different from each other, it is necessary to control the value of the features in a fixed range by processing, so that the features are comparable. The Min-Max normalization processing formula used in this paper is as follows:
x i j = x i j min x j max x j min x j
where max(xj) is the largest value of feature xj and min(xj) is the minimum value of feature xj.
Then, the processed dataset is divided into the training set and test set in the ratio of 8:2.
The early prediction dataset extracted in this paper is unbalanced, while there are significantly fewer patients with hyperkalemia than those without hyperkalemia in the CKD population. To avoid this imbalance and prevent the model from being biased toward the majority class during training, we applied the Adaptive Synthetic Sampling (ADASYN) technique [28] exclusively to the training set. ADASYN’s key advantage lies in its adaptive mechanism, which targets hard-to-learn minority instances for synthetic sample generation, thereby strengthening the decision boundary precisely where misclassification is most likely. This adaptive mechanism offers distinct advantages over other common oversampling techniques. The final training dataset consisted of 462 records, including 339 from CKD patients who did not develop hyperkalemia and 123 from those who eventually progressed to hyperkalemia. To ensure the robustness of the evaluation, ADASYN was strictly applied only within each fold of the cross-validation process, and the final model performance was assessed on an independent test set.

3.3. Model Construction

This study employed six ML algorithms for early prediction of hyperkalemia in patients with CKD: Random Forest (RF), Multilayer Perceptron (MLP), FT-Transformer (FTT), TabPFN, XGBoost, and CatBoost. The rationale for model selection was as follows:
  • RF: A Bagging-based ensemble learning algorithm, it enhances model stability and generalization ability by constructing numerous decision trees and aggregating their predictions [29]. RF was selected as a classic and robust representative of ensemble learning.
  • MLP: A fundamental feedforward neural network capable of capturing complex nonlinear relationships through learned hierarchical feature representations [30]. In the experiments, it serves as a baseline deep model to evaluate the added value of more complex architectures.
  • FTT: A deep learning architecture built on the self-attention mechanism, specifically designed for tabular data [31]. We introduced FTT as an exploration of advanced deep learning architectures, aiming to utilize the potential of attention mechanisms in handling heterogeneous features.
  • TabPFN: A deep learning model specifically designed for tabular data, which employs Prior-Data Fitted Networks (PFNs) to achieve sample-efficient inference [32]. It was chosen for the advantage in small-sample prediction.
  • XGBoost: A gradient-boosted tree framework incorporating L1/L2 regularization to prevent overfitting, with native support for categorical feature encoding [33]. XGBoost was selected because it is widely regarded as a mainstream high-performance benchmark model for structured tabular data.
  • CatBoost: An ensemble tree algorithm featuring ordered target encoding for categorical variables and symmetric oblivious trees to mitigate prediction shift caused by noisy data points [34]. It was selected for its specialized optimization for categorical data, which is well-suited to clinical datasets with numerous categorical features.

3.4. Hyperparameters Tuning

In the experiments, all ML models except TabPFN underwent hyperparameter optimization using the Tree-structured Parzen Estimator (TPE) algorithm, implemented in the Optuna framework, a variant of Bayesian optimization [35]. The test set was then evaluated using the trained models. Notably, TabPFN was excluded from this process because it utilizes a pre-trained, fixed architecture with a rigorously validated default configuration that requires no additional tuning [32]. For tree-based models, including RF, XGBoost, and CatBoost, we optimized the number of estimators to control the ensemble size, the maximum depth to regulate individual tree complexity, and regularization parameters such as min_samples_leaf. For the MLP, our optimization simultaneously targeted the hidden_layer_sizes to define the network architecture, the alpha coefficient to adjust L2 regularization strength, and the learning_rate_init to configure the optimization process. For the FTT, optimization focused on its representational capacity and core regularization. The num_heads parameter was tuned to determine the diversity of the multi-head attention mechanism. The input_embed_dim was adjusted to shape the vector representation capability for categorical features. Additionally, the attn_dropout technique was applied to control the sparsity of the attention matrix, thereby preventing overfitting.
The hyperparameter tuning procedure with Optuna was as follows: First, a search space for each model’s key hyperparameters was defined based on common experiments, as shown in Table 1. The objective function was set to maximize the average accuracy obtained from a stratified 5-fold cross-validation on the training set. Optuna then sampled and evaluated hyperparameter combinations for each model, leveraging the TPE algorithm to balance exploration and exploitation. This iterative process continued for a maximum of 100 trials. Upon completion, the hyperparameter set that yielded the highest cross-validation accuracy was selected for each model.

4. Results

After preprocessing, the prepared dataset was used to train multiple models for evaluation and performance comparison, and the results obtained by the optimal model were analyzed for interpretability. All experiments were conducted using the Windows operating system and an NVIDIA GeForce RTX 4060 GPU in a Python 3.11 environment configuration to meet the model’s operational requirements.

4.1. Model Evaluation

For the early prediction of hyperkalemia risk in CKD patients, the following model evaluation metrics were employed:
  • Accuracy
Accuracy = TP + TN TP + FP + TN + FN
2.
Recall
Recall = TP TP + FN
3.
Precision
Precision = TP TP + FP
4.
F1-score
F 1 = 2 × Precision × Recall Precision + Recall
5.
Receiver Operating Characteristic (ROC) Curve
The ROC curve represents the relationship between the True Positive Rate (TPR) and the False Positive Rate (FPR). Area Under the Curve (AUC) is the area under the ROC curve and is used to quantify the performance of the ROC curve.
6.
Matthews Correlation Coefficient (MCC)
The MCC is a comprehensive metric for evaluating binary classifiers. It is calculated using all four values from the true positives, true negatives, false positives, and false negatives. A value closer to +1 indicates better overall model performance. This metric is particularly robust as it remains reliable even with imbalanced class distributions [36].
MCC = TP × TN   -   FP × FN ( TP + FP ) ( TP + FN ) ( TN + FP ) ( TN + FN )
In the experiments, for decision tree-based models, which are insensitive to feature scale, data standardization was not applied [37]. Similarly, owing to the CatBoost algorithm’s inherent ability to handle categorical variables directly, one-hot encoding was omitted from the preprocessing pipeline [34]. The hyperparameter optimization results and the corresponding experimental results are summarized in Table 2 and Table 3.
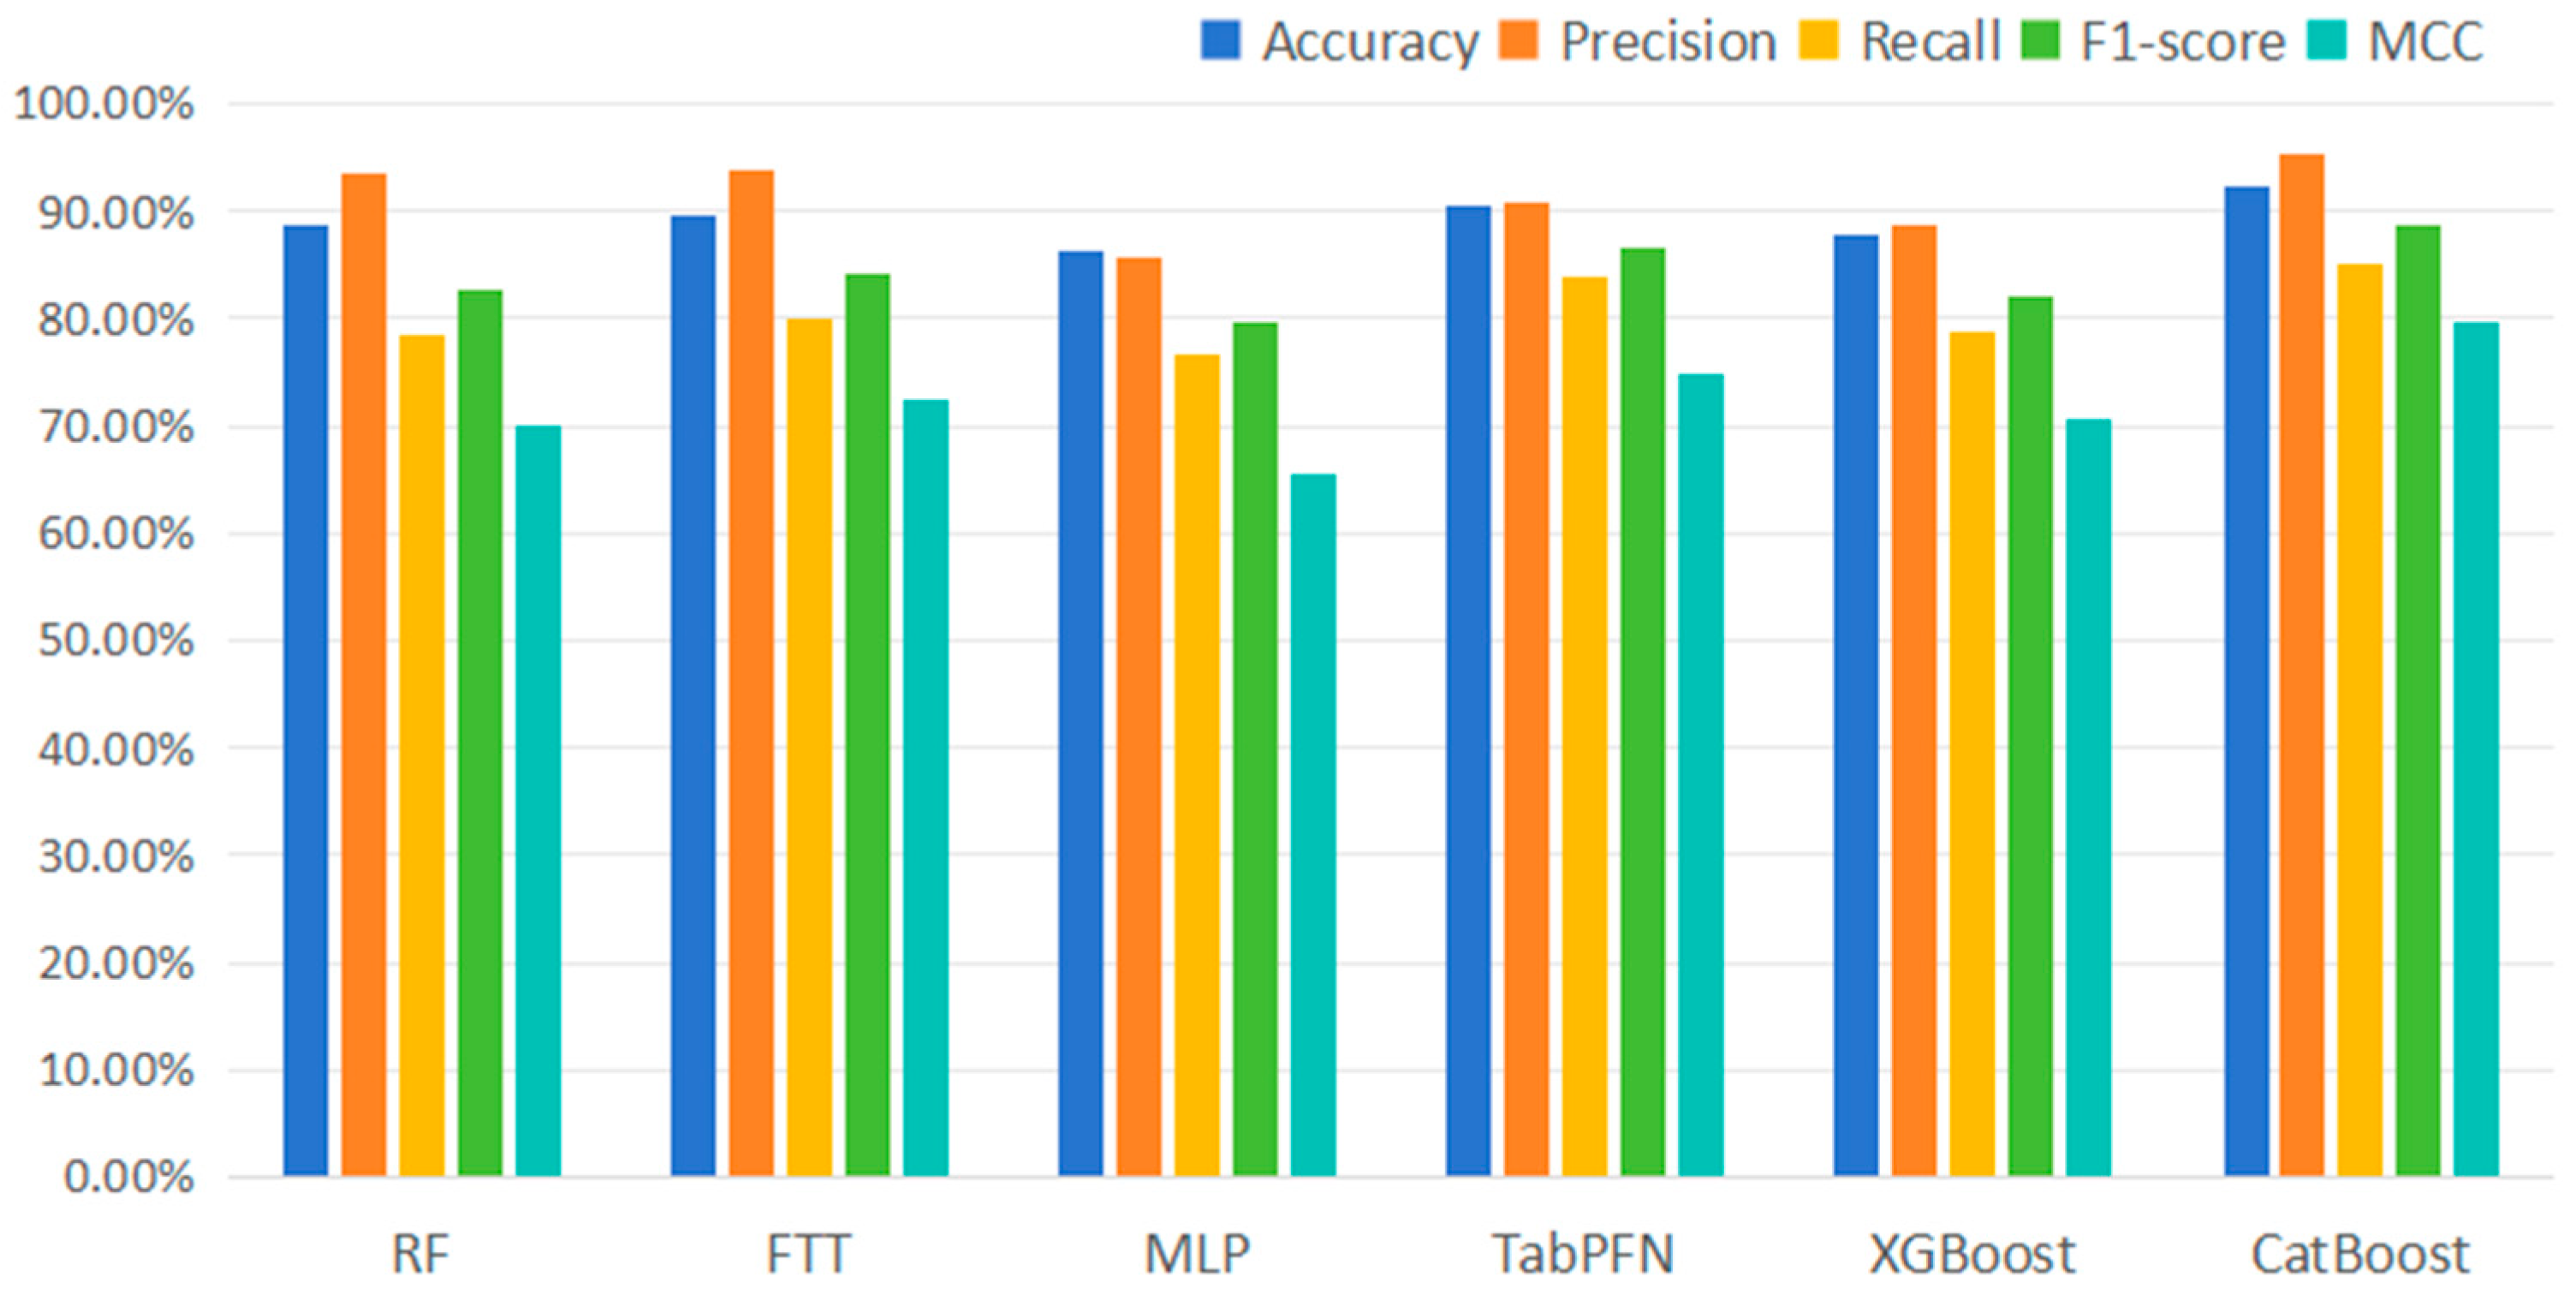
Among the models evaluated, the CatBoost model achieved the highest accuracy of 92.44%, indicating that it correctly classified 92.44% of both hyperkalemia and non-hyperkalemia patients. Meanwhile, the CatBoost model also achieved the highest precision of 95.26% and the highest MCC of 79.62%.
To provide a more intuitive comparison of performance differences among the six ML models, we present the experimental results as bar charts in Figure 2.
The CatBoost and TabPFN models demonstrated optimal performance in the prediction task, with CatBoost achieving the highest composite score across the four metrics. Consequently, CatBoost was selected as the final model for predicting hyperkalemia in CKD patients and was subjected to further evaluation and analysis.
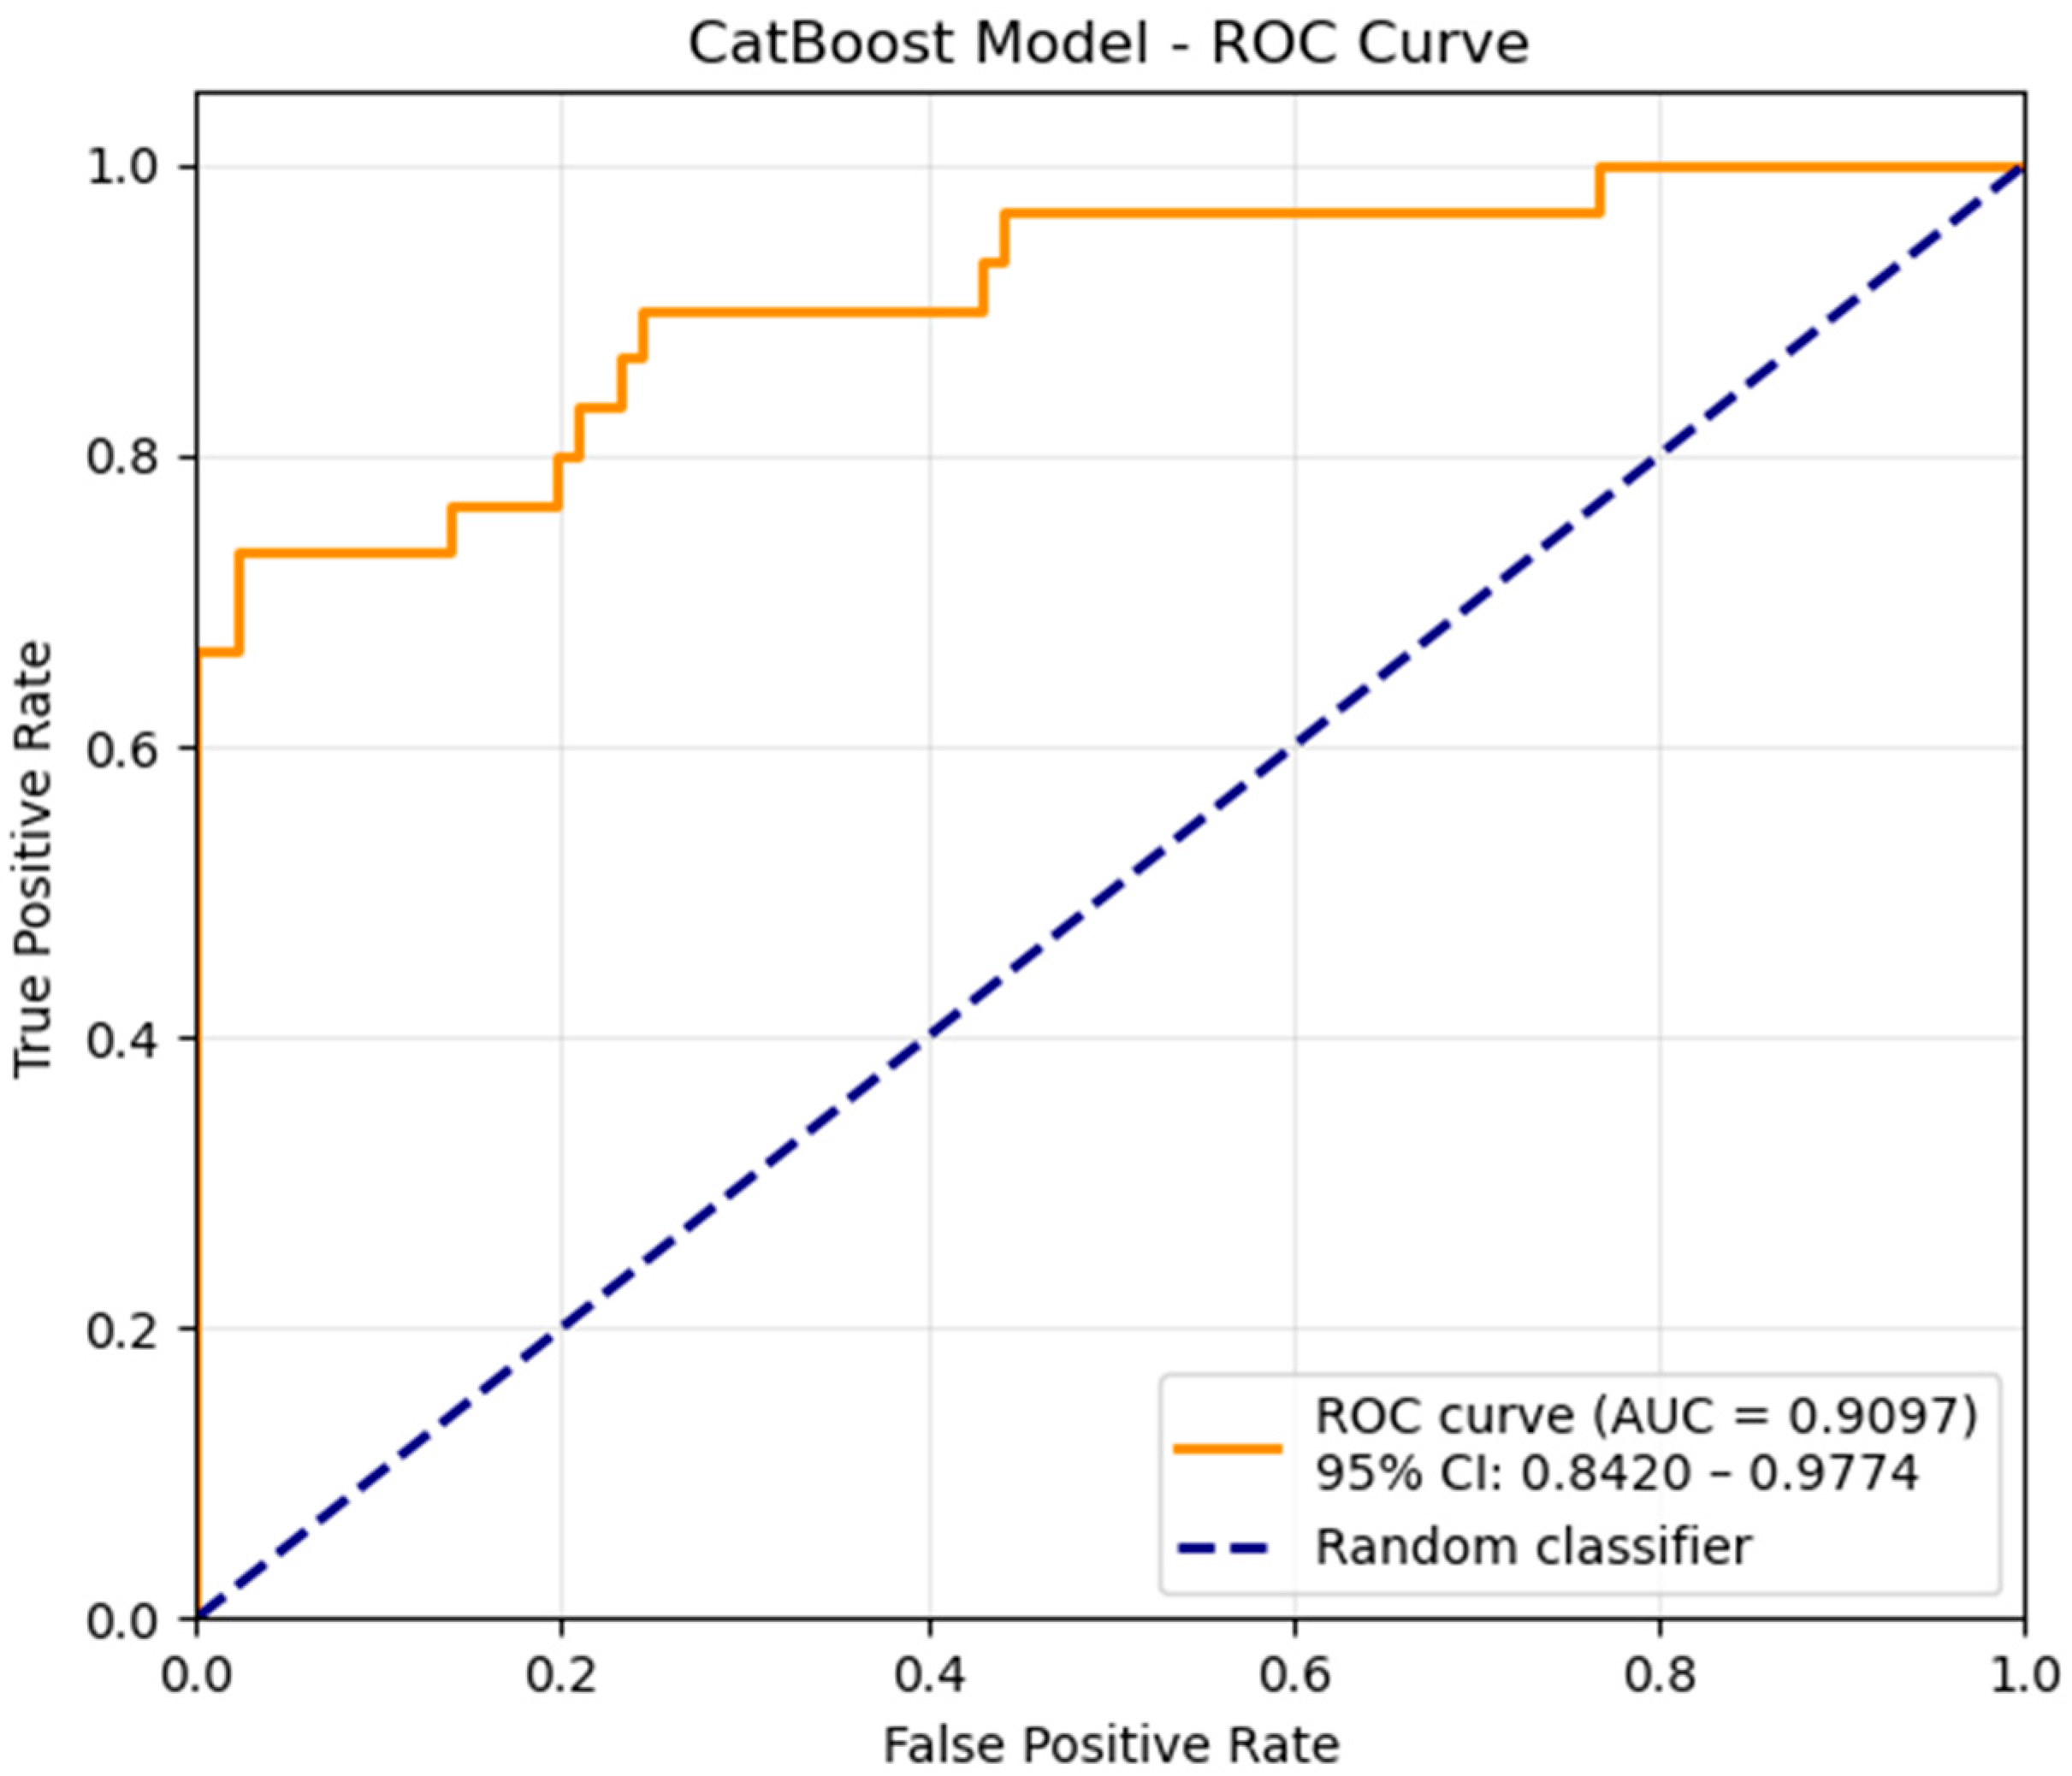
Meanwhile, CatBoost achieved an AUC of 0.9097, as shown in Figure 3. The statistical significance of this performance (p < 0.001) and a precise 95% confidence interval of (0.8420, 0.9774), computed using the DeLong method, confirm the model’s capability to effectively identify CKD patients at risk of hyperkalemia. Furthermore, the ROC curve shows that the model achieves a high true positive rate across a wide range of low false positive rates.
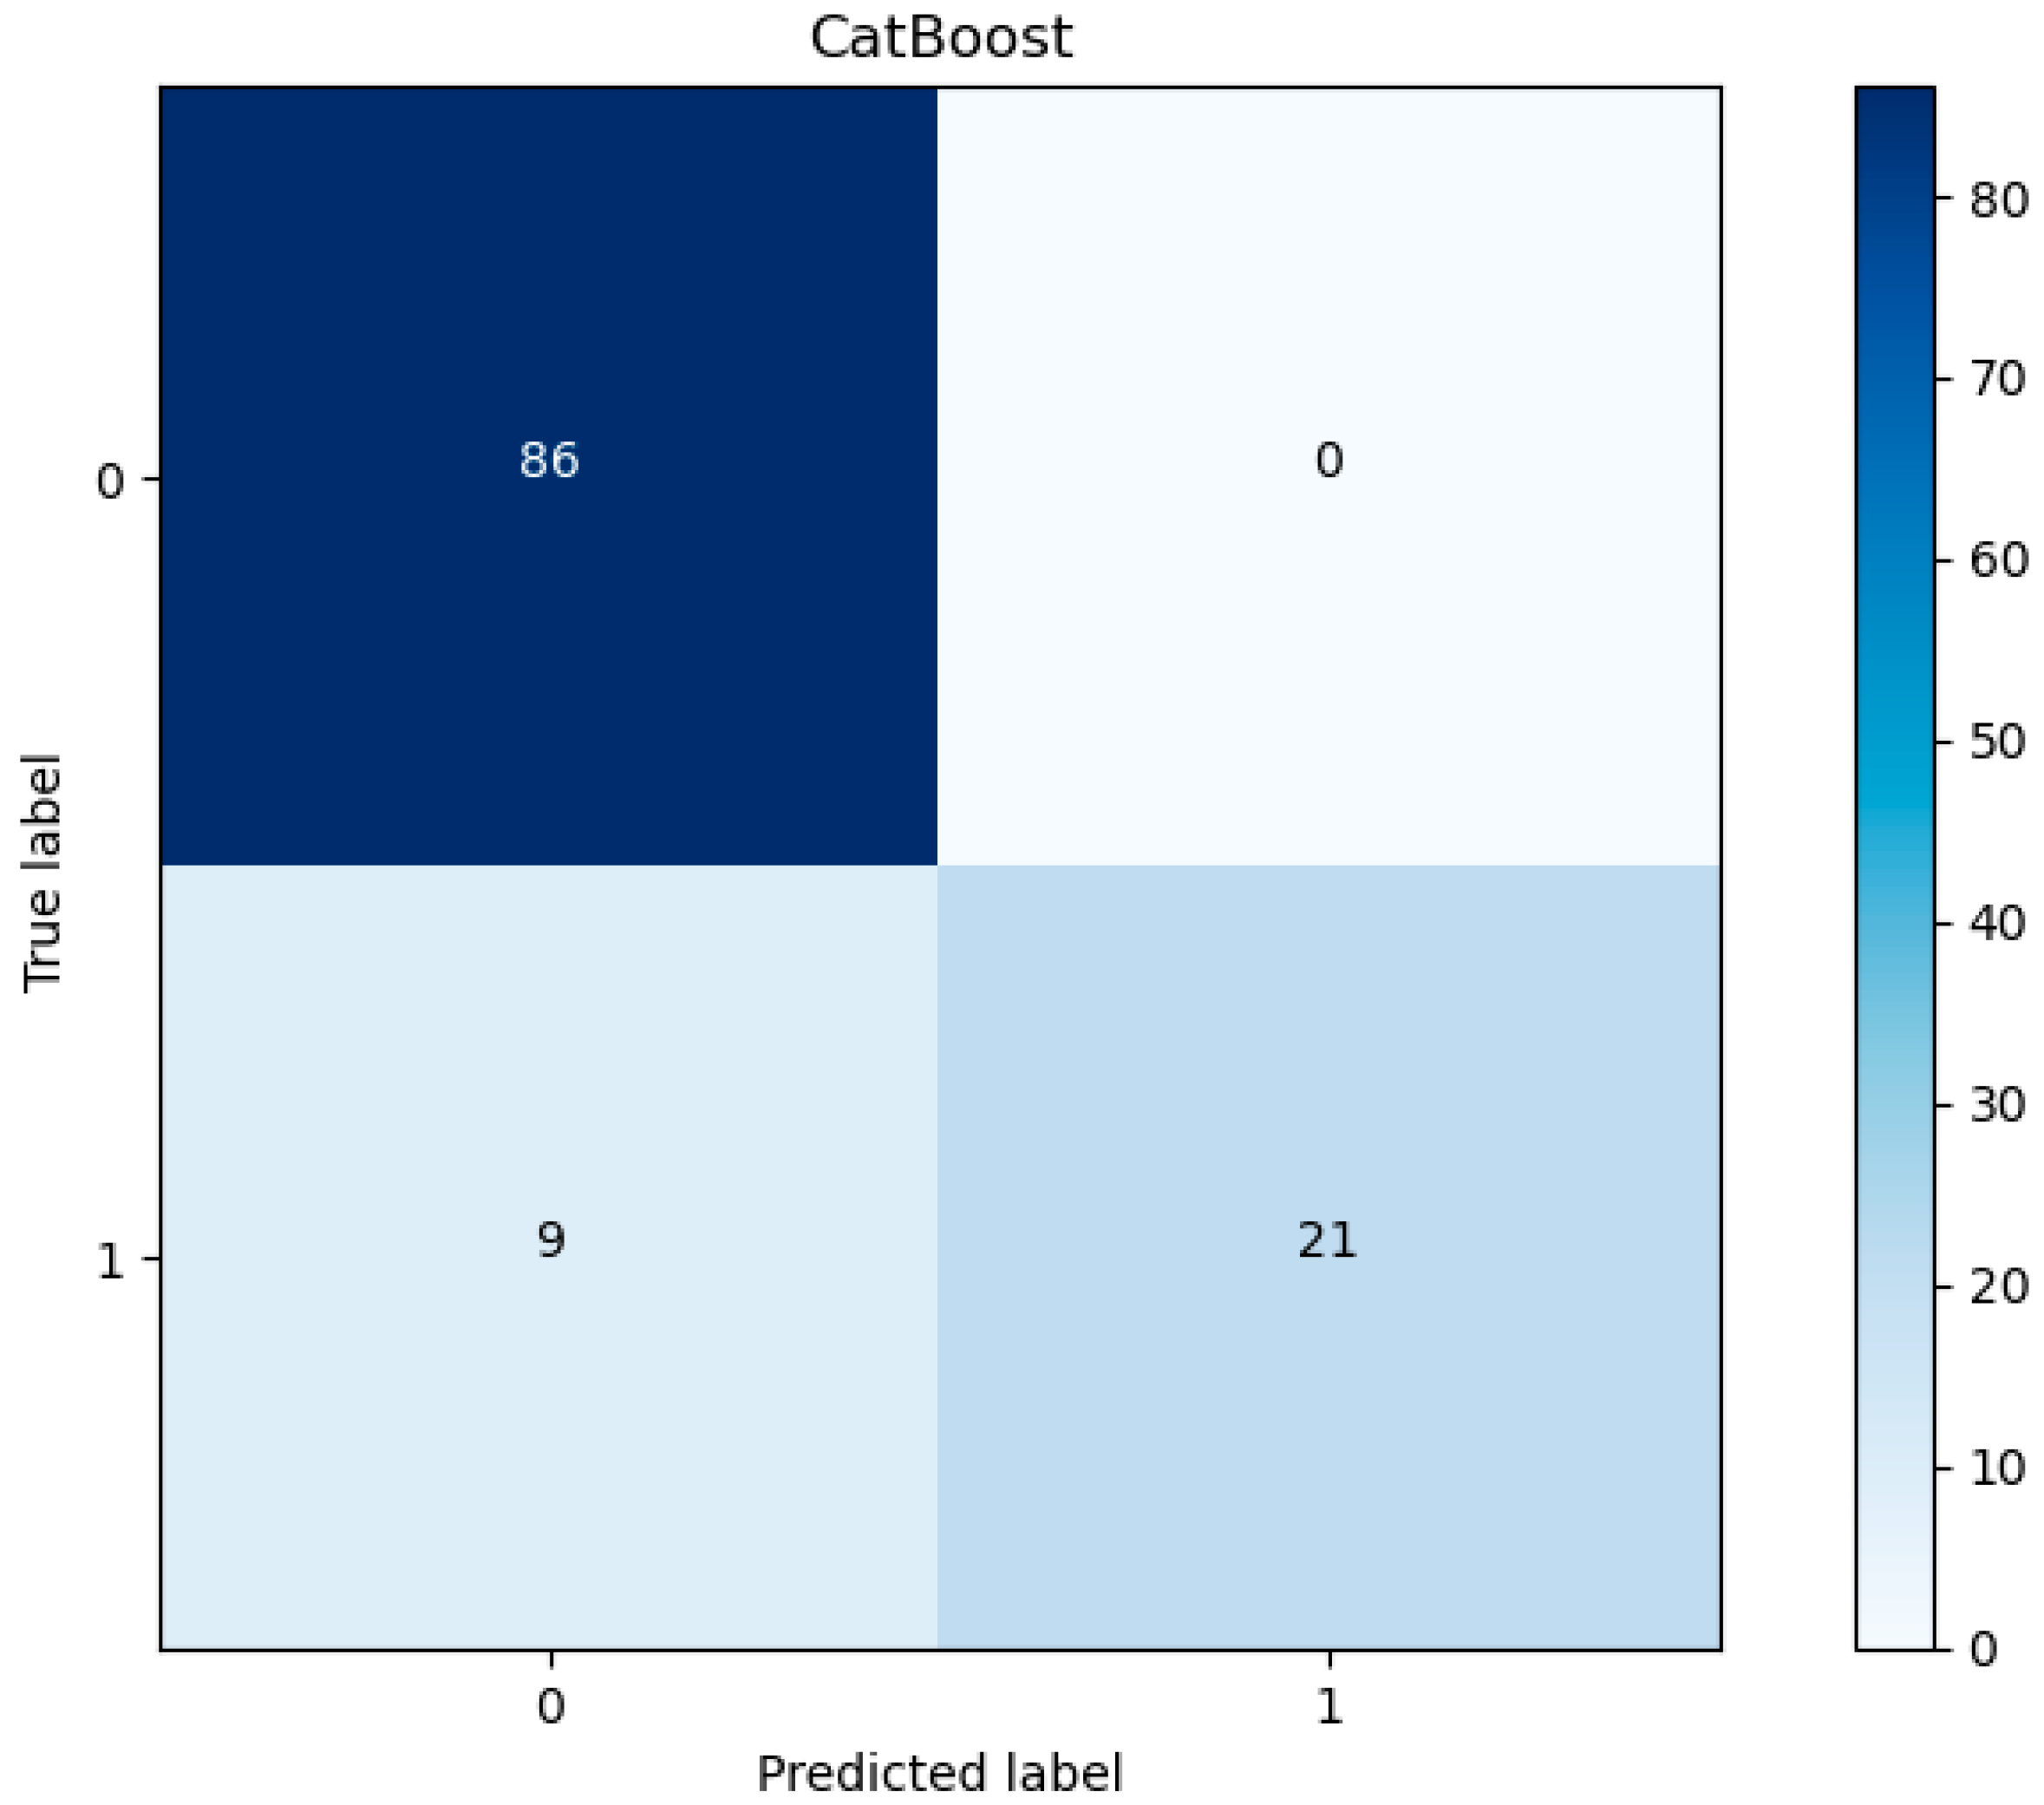
To further evaluate the model’s classification performance, the study employed the confusion matrix [38] as a visualization tool. In the confusion matrix, each column represents the predicted class label, and the number of columns corresponds to the number of classes. Each row represents the true class label, and the number of rows corresponds to the number of actual classes.
The confusion matrix is shown in Figure 4. It can be seen that the value at position (0, 0) is 86, indicating that all 86 positive samples in the validation set were correctly predicted. Furthermore, the CatBoost model correctly identified 21 true negative cases, demonstrating its ability to achieve accurate predictions for most samples.
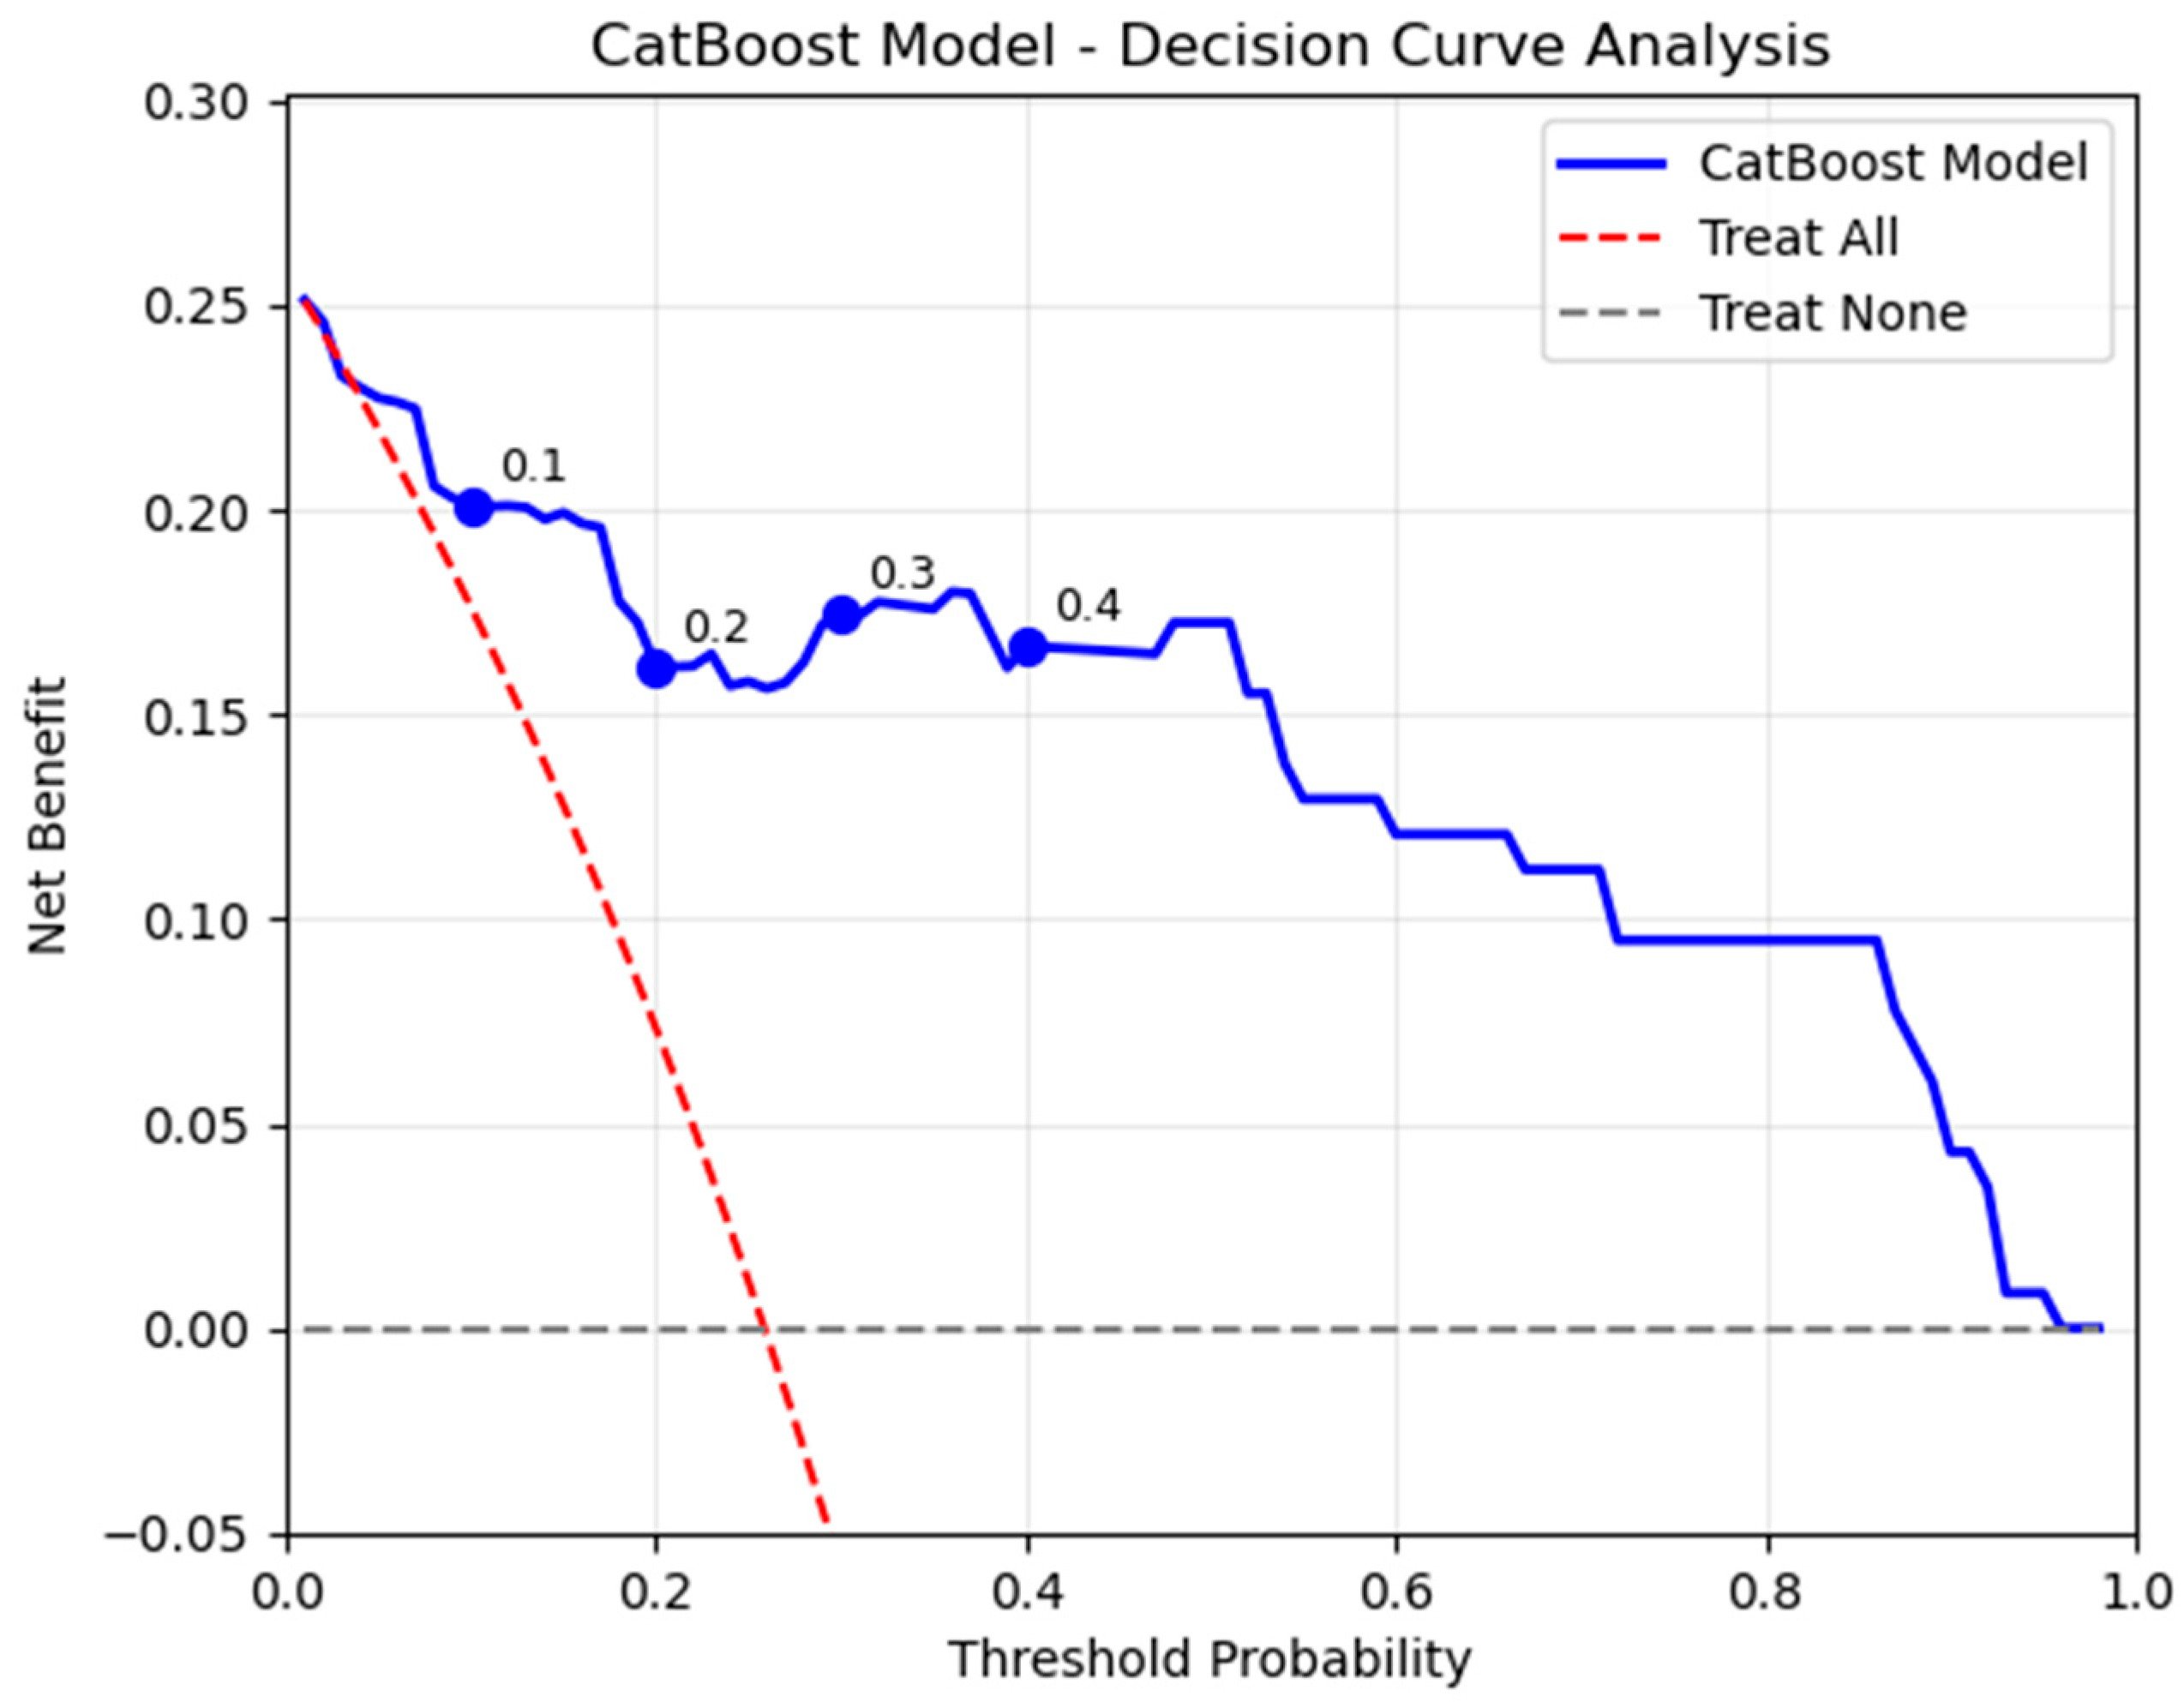
Traditional metrics like AUC and accuracy evaluate predictive performance but do not quantify the clinical benefit a patient might gain from model-guided decisions. Decision Curve Analysis (DCA) [39] quantitatively assesses the “net benefit” achieved by using the model to guide interventions, compared to the default strategies of “treat all” or “treat none”, across a range of probability thresholds. This approach offers explicit insight into the clinical utility of the model at different risk thresholds. Consequently, the DCA plot effectively guides clinical action by helping physicians decide when to trust the mode.
We applied the DCA technique to the optimal CatBoost model to further evaluate its potential utility for clinical adoption, as shown in Figure 5. The x-axis corresponds to the threshold probability, and the y-axis denotes the net benefit. The blue curve illustrates the net benefit achieved by the model at varying threshold probabilities, while the red and gray curves reflect the net benefits associated with strategies of intervening in all patients and no patients, respectively. It can be observed that within the clinically commonly used threshold probability range of 0.1–0.65, the blue curve of the model consistently lies above both the red and gray dashed lines, suggesting that employing this model for individualized intervention can provide additional net clinical benefits. Particularly in the 0.10–0.40 range, the improvement in net benefit is most significant, indicating that the model offers the greatest positive value when clinicians are willing to accept a false positive risk of 10–40%. Furthermore, the model curve shows a notable decline beyond a threshold probability of >0.8. Although it does not intersect with the gray curve, clinicians with a preference for high thresholds may still need to incorporate other clinical indicators or expert judgment. In conclusion, this model can effectively assist in the early prediction of hyperkalemia risk in CKD patients, providing quantifiable decision support for clinical practice.
In summary, among the six machine learning models compared, CatBoost demonstrated superiority across various evaluation metrics. Further assessment using the confusion matrix and DCA techniques corroborated its high classification accuracy and strong clinical utility. Additionally, when applied to datasets of other diseases, CatBoost continued to demonstrate robust predictive capability and strong generalization ability.

4.2. Multiple Interpretability Analyses

In the field of machine learning, the complexity of most models makes their decision-making processes difficult to interpret, posing a persistent challenge for model interpretability [40]. This is particularly critical in high-stakes domains, where decision transparency and reliability are paramount. In disease prediction, this transparency allows clinicians to understand how the model arrives at diagnoses based on patient characteristics. However, a single interpretability analysis may be insufficient to deliver all this valuable information simultaneously. As a result, we employed multiple interpretability methods to obtain a comprehensive and precise assessment of feature contributions. Specifically, SHAP [21] analysis was used to quantify the magnitude and direction of each feature, while Local Interpretable Model- agnostic Explanations (LIME) [22] provided complementary insights by ranking features and visually delineating their influential ranges.

4.2.1. SHAP Analysis

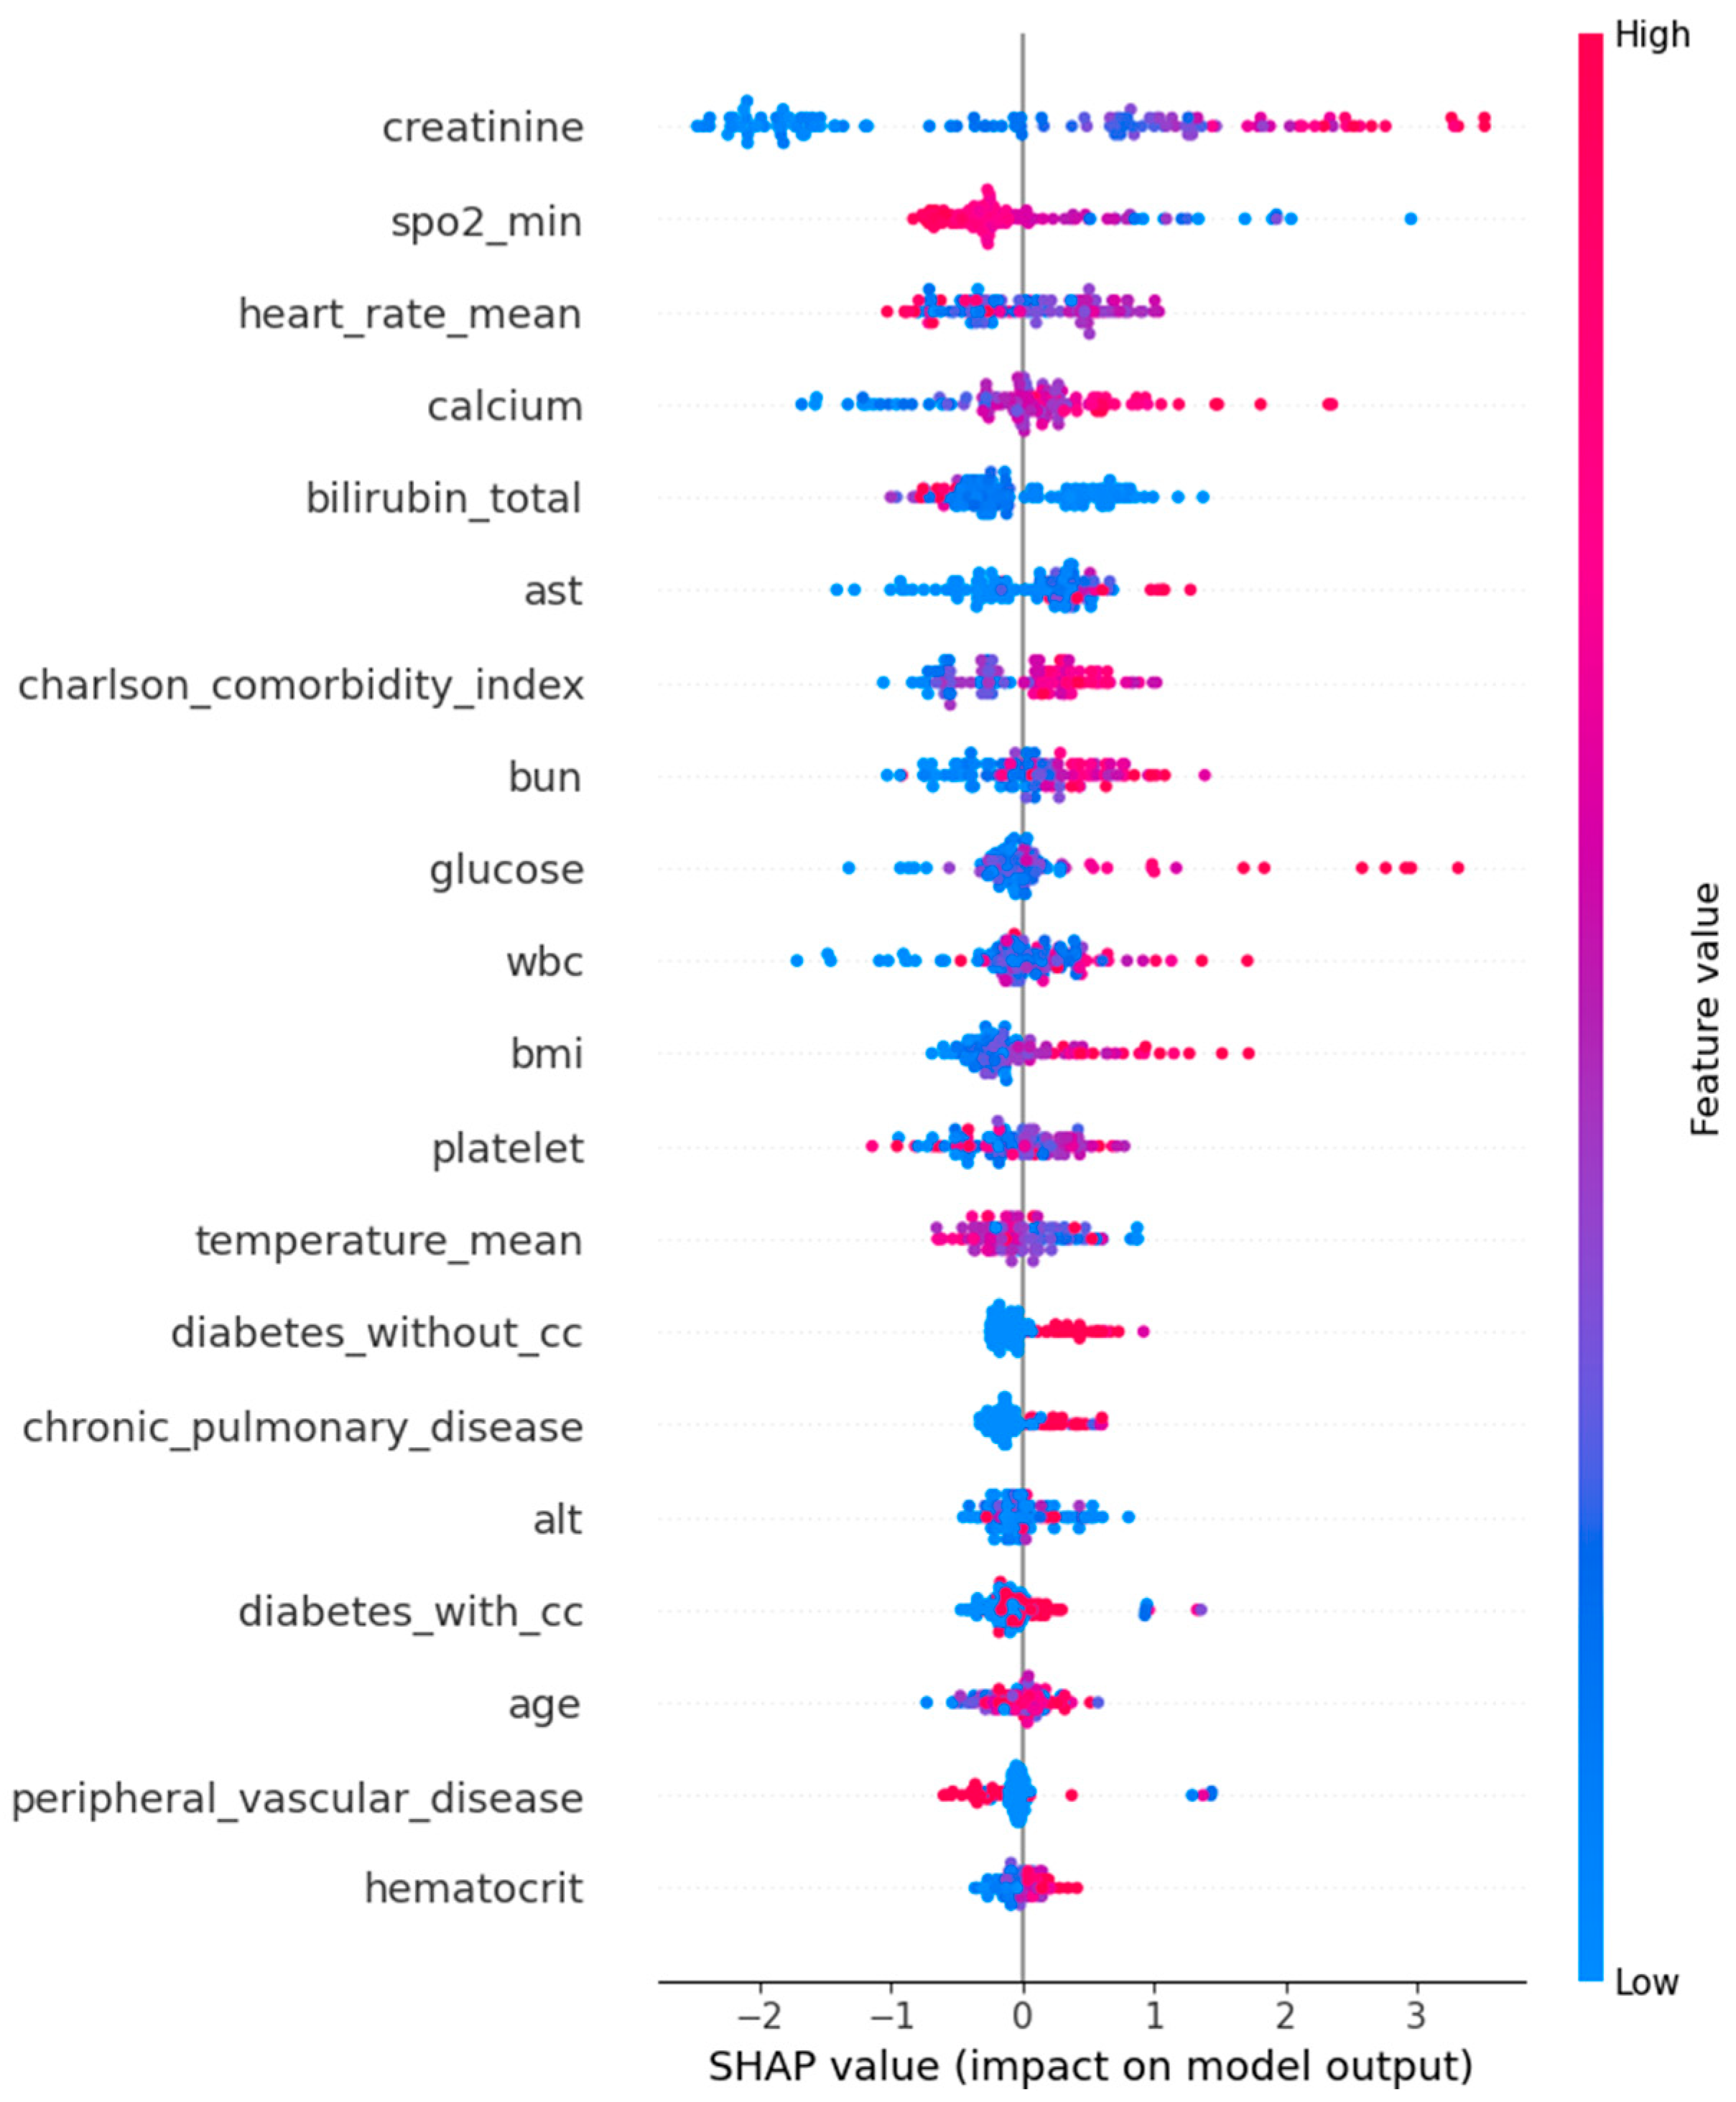
SHAP theory is an effective visualization method, and its core idea is derived from the Shapley value in game theory. The SHAP theory is a method for fairly distributing the gains of a cooperative game that ensures that the contribution of each feature is reasonably quantified to explain the model’s predictions. The SHAP summary plot for the model is shown in Figure 6 and Figure 7.
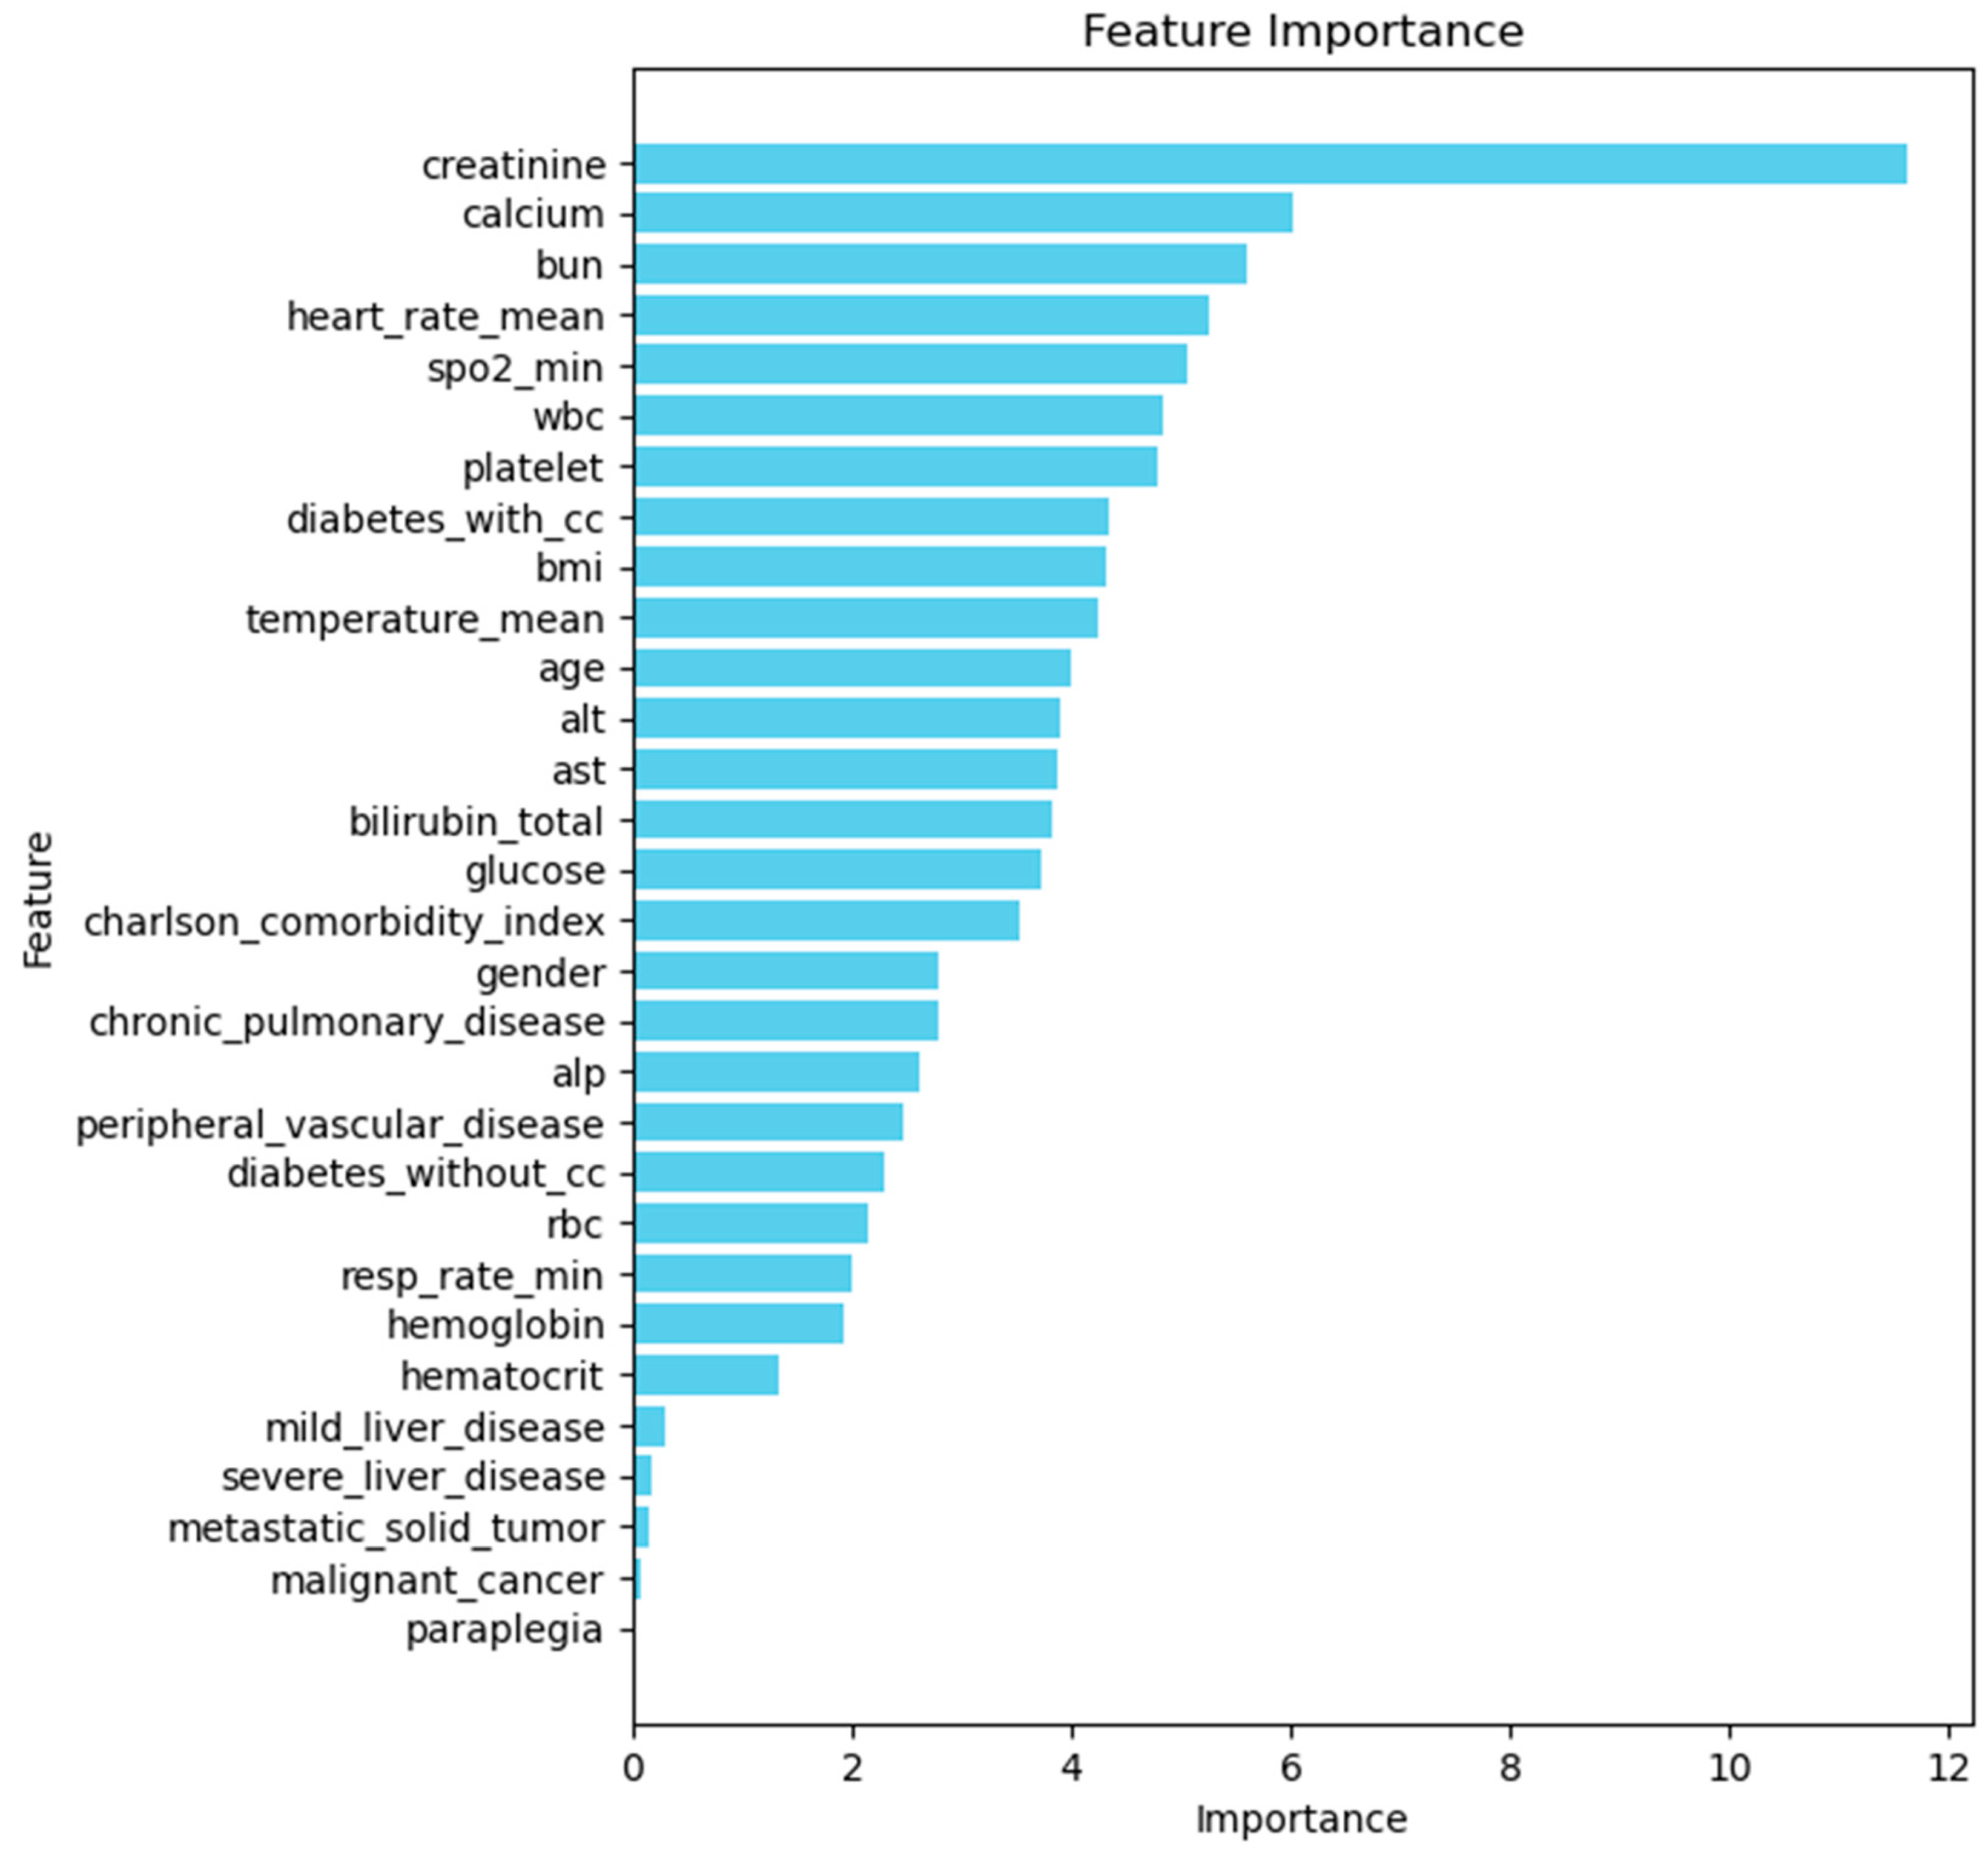
Figure 6 gives an importance ranking for different features. As shown, creatinine was the most influential feature for model predictions. This likely stems from its role as a key indicator of renal function: elevated creatinine levels typically reflect impaired kidney function, reducing the kidneys’ ability to excrete both creatinine and potassium. Consequently, diminished potassium excretion can lead to hyperkalemia [41].
Additionally, calcium, BUN, mean heart rate, minimum SpO2, platelet count, WBC count, diabetes with complications, diabetes without complications, BMI, mean temperature, AST, ALT, age, total bilirubin, and the Charlson Comorbidity Index are all significant factors influencing hyperkalemia development in CKD patients. Elevated BUN directly reflects a reduced glomerular filtration rate and impaired tubular function, leading to a significant decrease in potassium excretion and consequently increasing the risk of hyperkalemia [42]. Diabetes complications not only accelerate renal function deterioration but also directly increase hyperkalemia risk through the renin–angiotensin–aldosterone system (RAAS) inhibition, particularly when combined with diabetic nephropathy [43]. Elevated total bilirubin indicates hepatocellular damage, which may disrupt the synthesis of enzymes involved in potassium metabolism [44]. Abnormal mean heart rate reflects cardiac insufficiency: tachycardia reduces renal blood flow and potassium excretion efficiency, while bradycardia further suppresses excretion due to diminished cardiac output [45]. Age is closely associated with CKD progression, so that elderly patients exhibit significantly reduced potassium metabolism capacity due to renal structural degeneration, natural glomerular filtration rate decline, and multi-organ dysfunction. Polypharmacy and chronic comorbidities further increase the risk of hyperkalemia in this population [46].
Figure 7 facilitates a more in-depth examination of how these features impact the model’s decision-making. The vertical axis lists each feature, and the horizontal axis represents the corresponding SHAP values, which quantify the direction and magnitude of each feature’s effect on the output. Each point represents an individual sample: red dots indicate higher feature values with a positive contribution to the prediction, while blue dots denote lower values with a negative influence. The horizontal spread of the SHAP values reflects the overall importance of each feature.
As shown in Figure 7, creatinine exhibits the highest SHAP values, identifying it as the most influential predictor of hyperkalemia in CKD patients. Higher creatinine levels are associated with a significantly increased probability of hyperkalemia.
It can also be seen that heart_rate_mean, calcium, platelet, wbc, bmi, ast, charlson_comorbidity_index, bun, glucose, alt, age, diabetes_without_cc, diabetes_with_cc, hematocrit, and chronic_pulmonary_disease are all important factors that increase the probability of hyperkalemia in patients with CKD. Elevated levels of platelet count, WBC count, AST, BUN, glucose, ALT, hematocrit, age, and BMI, along with a history of diabetes mellitus or chronic pulmonary disease, are associated with an increased probability of hyperkalemia in CKD patients. Conversely, spo2_min is a protective factor affecting the occurrence of hyperkalemia in CKD patients; the lower the level of spo2_min in CKD patients, the more likely they are to develop hyperkalemia.

4.2.2. LIME Analysis

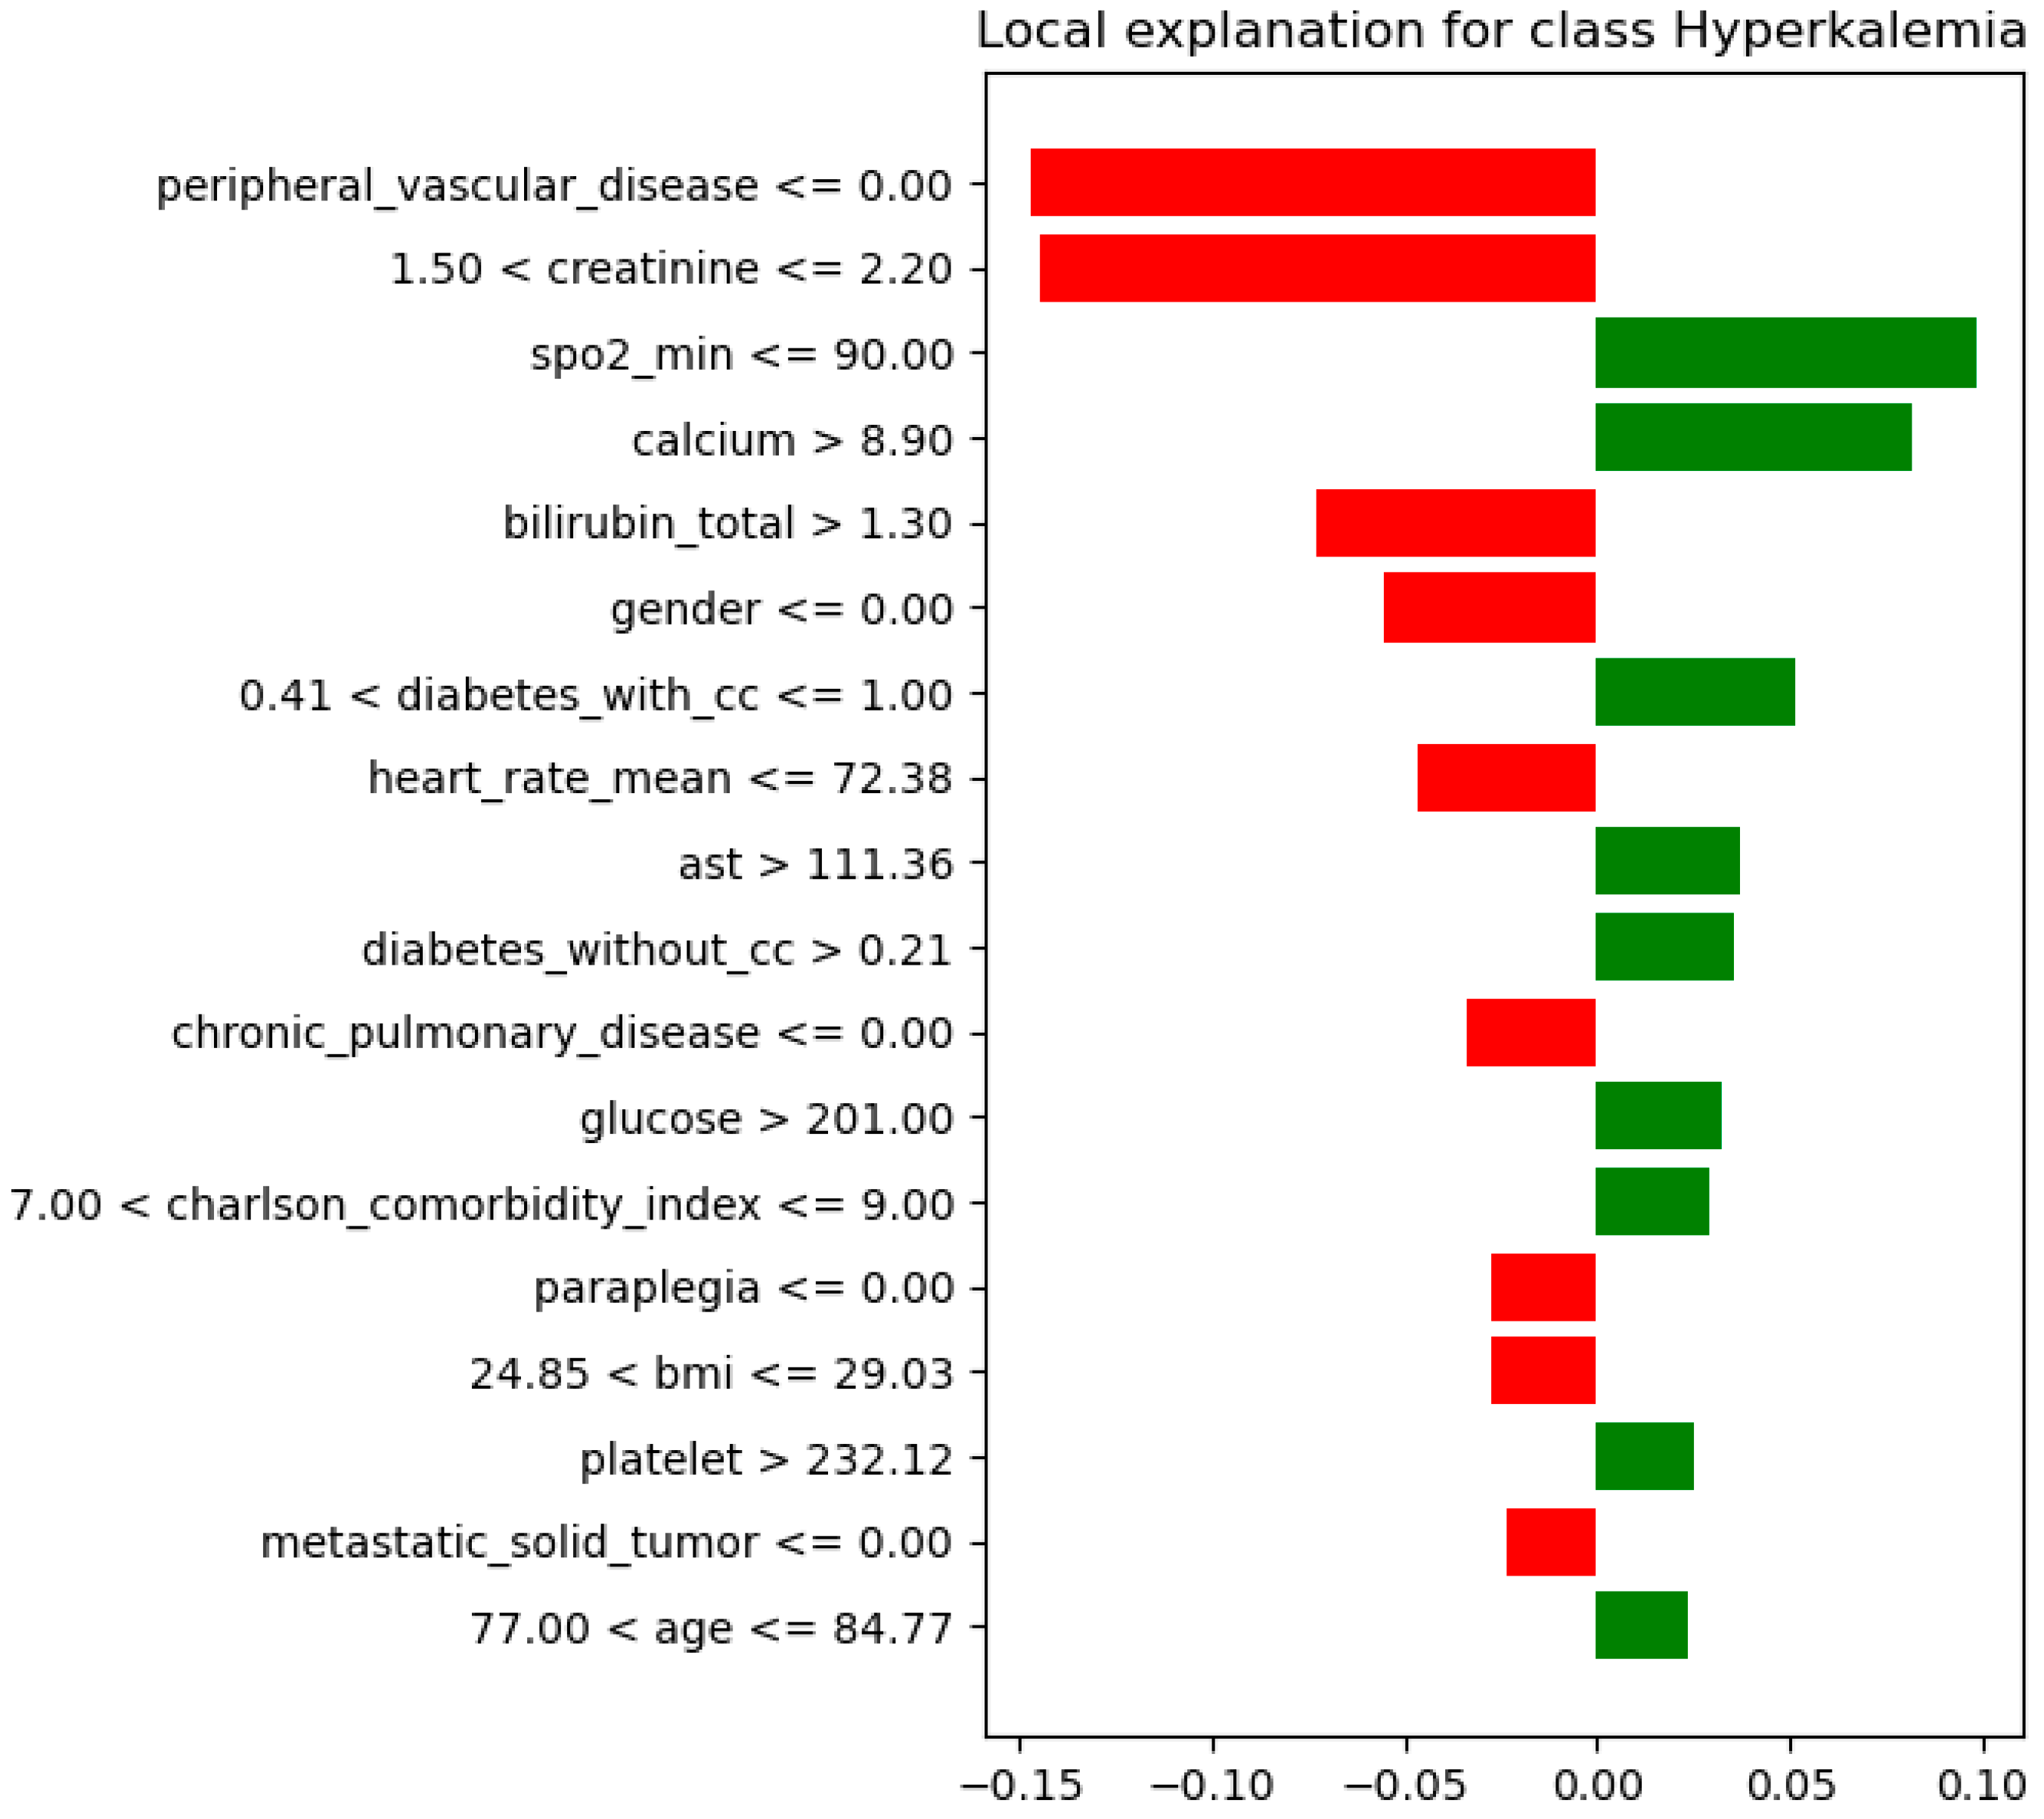
While SHAP quantifies feature importance and influence direction, the requirements of clinical decision-making also demand an understanding of how these features affect the decision outcome. LIME is a technique that explains individual predictions of any ML model by approximating it locally with an interpretable surrogate model. It identifies influential features and their directional impact for a single instance, improving transparency and trust in black-box models. The LIME plot for the CatBoost is shown in Figure 8, where the green portion represents features that push the prediction toward the positive class, and the red portion represents features that push it toward the negative class.
As shown in Figure 8, the model’s judgment of this patient as high risk for hyperkalemia is primarily based on the following key features: First, creatinine levels in the elevated range of 1.50–2.20 mg/dL, directly reflecting impaired renal potassium excretion. Second, the minimum SpO2 ≤ 90% indicates a hypoxic state in the patient, which may promote the shift of intracellular potassium to the extracellular space through acidosis mechanisms. Simultaneously, abnormal values of total bilirubin > 1.30 mg/dL and AST > 111.36 U/L suggest potential liver damage or hemolysis, which can disrupt electrolyte balance. Other features such as age between 77 and 85 years, BMI in the overweight range of 24.85–29.03 kg/m2, blood glucose > 201 mg/dL, and high comorbidity burden (Charlson Comorbidity Index score of 7–9) also characterize a high-risk clinical profile commonly associated with renal complications. It is noteworthy that some features demonstrate risk-mitigating effects: serum calcium level > 8.90 mg/dL becomes the most significant negative predictor; the relatively low mean heart rate ≤ 72.38 beats per minute may indicate that the patient has not yet developed the tachycardia typical of severe hyperkalemia, thus reducing the risk score.
In summary, multiple interpretability analyses revealed the relative importance of the key risk factors for early prediction of hyperkalemia in chronic kidney disease. The most influential factors, listed in descending order of importance, include creatinine, calcium, BUN, mean heart rate, minimum SpO2, platelet count, WBC count, diabetes, BMI, mean temperature, AST, ALT, age, total bilirubin, and the Charlson Comorbidity Index. These analyses also clarified the direction of each factor’s effect on the model’s output. Such interpretability can further inform clinical management strategies. When abnormal key indicators, such as elevated creatinine levels and low SpO2, suggest an increased risk of hyperkalemia, clinicians can prioritize these patients for intensified monitoring and adjust treatment plans through measures such as modifying potassium-affecting medications, correcting modifiable risk factors, and managing comorbidities.

5. Discussion

Using the CatBoost algorithm, we constructed an effective predictive model for hyperkalemia in CKD patients. Interpretability analysis further revealed critical risk factors, providing insights for personalized patient management. However, predictors were limited to structured EHR data, and potentially information from medication histories or continuous waveform data was not included. Future work should explore multimodal data fusion. In addition, future research could be refined by introducing more advanced and novel model architectures, more efficient parameter optimization strategies, or ensemble learning approaches that integrate predictions from multiple models. Such improvements would enhance model stability and accuracy, extending their applicability to broader disease domains and increasingly complex diagnostic scenarios.

6. Conclusions

This study presented distinct machine learning models to perform early hyperkalemia risk prediction in CKD patients. The ADASYN-enhanced CatBoost model achieved optimal performance on the early prediction dataset with 92.44% accuracy, demonstrating optimal predictive capability. Meanwhile, we analyzed CatBoost using DCA, and the results exhibited significant clinical utility, with the model yielding the highest net benefit across a threshold probability range of 10% to 40%. Therefore, we propose using this model in clinical decision support systems to assist clinicians in early identification of high-risk hyperkalemia patients during CKD, enabling targeted interventions to effectively delay disease progression and improve patient outcomes. In addition, through multiple interpretability analysis methods, the study identified key risk factors for hyperkalemia development in CKD patients, including: creatinine, mean heart rate, platelet count, WBC, BMI, AST, Charlson comorbidity index, BUN, glucose levels, ALT, age, diabetes, hematocrit, and chronic pulmonary disease.

Author Contributions

Conceptualization, Y.L. and J.C.; methodology, Y.L. and J.C.; software, Y.L.; validation, Y.L., J.C., and Y.H.; formal analysis, Y.L.; investigation, Y.L.; resources, Y.L.; data curation, Y.L. and Y.H.; writing—original draft preparation, Y.L.; writing—review and editing, Y.L., J.C., and Y.H.; visualization, Y.L.; supervision, J.C. and Y.H.; project administration, J.C. and Y.H.; funding acquisition, Y.L. All authors have read and agreed to the published version of the manuscript.

Funding

This research received financial support from the National Natural Science Foundation (Grant Number 81671633) and was further backed by Project of the Ministry of Education on Humanities and Social Sciences Research Planning Fund (Grant Number 25YJAZH017) and the Open Fund of Hubei Longzhong Laboratory (Grant Number 2024KF-32).

Data Availability Statement

The original data presented in the study are openly available in MIMIC-IV at https://physionet.org/content/mimiciv/ (accessed on 1 March 2025).

Acknowledgments

The authors gratefully acknowledge the editors and two anonymous referees for their insightful comments and constructive suggestions that led to a marked improvement of the article.

Conflicts of Interest

The authors declared no potential conflicts of interest with respect to the research, authorship, and/or publication of this article.

Appendix A

Table A1. Feature Set for Early Prediction.
Features
early predictiongender, age, bmi, rbc, wbc, hemoglobin, hematocrit, platelet, creatinine, glucose, bun, calcium, severe_liver_disease, chronic_pulmonary_disease, mild_liver_disease, diabetes_with_cc, diabetes_without_cc, peripheral_vascular_disease, charlson_comorbidity_index, metastatic_solid_tumor, malignant_cancer, paraplegia, alt, alp, ast, bilirubin_total, heart_rate_mean, temperature_mean, spo2_min, resp_rate_min, diagnosis

References

  1. Jha, V.; Garcia-Garcia, G.; Iseki, K.; Li, Z.; Naicker, S.; Plattner, B.; Saran, R.; Wang, A.Y.M.; Yang, C.W. Chronic kidney disease: Global dimension and perspectivesl. Lancet 2013, 382, 260–272. [Google Scholar] [CrossRef] [PubMed]
  2. Ene-Iordache, B.; Perico, N.; Bikbov, B.; Carminati, S.; Remuzzi, A.; Perna, A.; Islam, N.; Bravo, R.F.; Aleckovic-Halilovic, M.; Zou, H.; et al. Chronic kidney disease and cardiovascular risk in six regions of the world (ISN-KDDC): A cross-sectional study. Lancet Glob. Health 2016, 4, e307–e319. [Google Scholar] [CrossRef]
  3. Pazianas, M.; Miller, P.D. Osteoporosis and chronic kidney disease-mineral and bone disorder (CKD-MBD): Back to basics. Am. J. Kidney Dis. 2021, 78, 582–589. [Google Scholar] [CrossRef]
  4. Sarafidis, P.A.; Georgianos, P.I.; Bakris, G.L. Advances in treatment of hyperkalemia in chronic kidney disease. Expert Opin. Pharmacother. 2015, 16, 2205–2215. [Google Scholar] [CrossRef] [PubMed]
  5. Einhorn, L.M.; Zhan, M.; Walker, L.D.; Moen, M.F.; Seliger, S.L.; Weir, M.R.; Fink, J.C. The frequency of hyperkalemia and its significance in chronic kidney disease. Arch. Intern. Med. 2009, 169, 1156–1162. [Google Scholar] [CrossRef]
  6. Vega, L.B.; Galabia, E.R.; da Silva, J.B.; González, M.B.; Fresnedo, G.F.; Haces, C.P.; Fontanet, R.P.; San Millán, J.C.R.; de Francisco, Á.L.M. Epidemiology of hyperkalemia in chronic kidney disease. Nefrol. (Engl. Ed.) 2019, 39, 277–286. [Google Scholar]
  7. Kashihara, N.; Kohsaka, S.; Kanda, E.; Okami, S.; Yajima, T. Hyperkalemia in real-world patients under continuous medical care in Japan. Kidney Int. Rep. 2019, 4, 1248–1260. [Google Scholar] [CrossRef]
  8. Collins, A.J.; Pitt, B.; Reaven, N.; Funk, S.; McGaughey, K.; Wilson, D.; Bushinsky, D.A. Association of serum potassium with all-cause mortality in patients with and without heart failure, chronic kidney disease, and/or diabetes. Am. J. Nephrol. 2017, 46, 213–221. [Google Scholar] [CrossRef]
  9. Cheng, X.; Changlin, M. Long-term management of hyperkalemia in chronic kidney disease. Chin. J. Nephrol. 2021, 37, 380–384. [Google Scholar]
  10. Kovesdy, C.P. Updates in hyperkalemia: Outcomes and therapeutic strategies. Rev. Endocr. Metab. Disord. 2017, 18, 41–47. [Google Scholar] [CrossRef]
  11. Sarker, I.H. Machine learning: Algorithms, real-world applications and research directions. SN Comput. Sci. 2021, 2, 160. [Google Scholar] [CrossRef]
  12. Sharma, A.; Alvarez, P.J.; Woods, S.D.; Dai, D. A model to predict risk of hyperkalemia in patients with chronic kidney disease using a large administrative claims database. Clin. Outcomes Res. 2020, 12, 657–667. [Google Scholar] [CrossRef]
  13. Israni, R.; Betts, K.A.; Mu, F.; Davis, J.; Wang, J.; Anzalone, D.; Uwaifo, G.I.; Szerlip, H.; Fonseca, V.; Wu, E. Determinants of hyperkalemia progression among patients with mild hyperkalemia. Adv. Ther. 2021, 38, 5596–5608. [Google Scholar] [CrossRef] [PubMed]
  14. Kim, H.; Ko, A. # 619 Serum aldosterone to potassium ratio and hyperkalemia risk in patients with chronic kidney disease. Nephrol. Dial. Transplant. 2024, 39, I2220–I2221. [Google Scholar]
  15. Kurzinski, K.L.; Xu, Y.; Ng, D.K.; Furth, S.L.; Schwartz, G.J.; Warady, B.A.; CKiD Study Investigators. Hyperkalemia in pediatric chronic kidney disease. Pediatr. Nephrol. 2023, 38, 3083–3090. [Google Scholar] [CrossRef]
  16. Chang, H.-H.; Chiang, J.-H.; Tsai, C.-C.; Chiu, P.-F. Predicting hyperkalemia in patients with advanced chronic kidney disease using the XGBoost model. BMC Nephrol. 2023, 24, 169. [Google Scholar] [CrossRef] [PubMed]
  17. You, J.S.; Park, Y.S.; Chung, H.S.; Lee, H.S.; Joo, Y.; Park, J.W.; Chung, S.P.; Lee, S.H.; Lee, H.S. Evaluating the utility of rapid point-of-care potassium testing for the early identification of hyperkalemia in patients with chronic kidney disease in the emergency department. Yonsei Med. J. 2014, 55, 1348–1353. [Google Scholar] [CrossRef]
  18. Kohsaka, S.; Okami, S.; Kanda, E.; Kashihara, N.; Yajima, T. Cardiovascular and renal outcomes associated with hyperkalemia in chronic kidney disease: A hospital-based cohort study. Mayo Clin. Proc. Innov. Qual. Outcomes 2021, 5, 274–285. [Google Scholar] [CrossRef]
  19. Kanda, E.; Okami, S.; Kohsaka, S.; Okada, M.; Ma, X.; Kimura, T.; Shirakawa, K.; Yajima, T. Machine learning models predicting cardiovascular and renal outcomes and mortality in patients with hyperkalemia. Nutrients 2022, 14, 4614. [Google Scholar] [CrossRef]
  20. Craven, M.; Shavlik, J. Extracting tree-structured representations of trained networks. Adv. Neural Inf. Process. Syst. 1995, 8, 24–30. [Google Scholar]
  21. Lundberg, S.M.; Lee, S.I. A unified approach to interpreting model predictions. Adv. Neural Inf. Process. Syst. 2017, 30, 4768. [Google Scholar]
  22. Ribeiro, M.T.; Singh, S.; Guestrin, C. “Why should i trust you?” Explaining the predictions of any classifier. In Proceedings of the 22nd ACM SIGKDD International Conference on Knowledge Discovery and Data Mining, San Francisco, CA, USA, 13–17 August 2016; pp. 1135–1144. [Google Scholar]
  23. Vaswani, A.; Shazeer, N.; Parmar, N.; Uszkoreit, J.; Jones, L.; Gomez, A.N.; Kaiser, Ł.; Polosukhin, I. Attention is all you need. Adv. Neural Inf. Process. Syst. 2017, 30, 5998. [Google Scholar]
  24. Johnson, A.; Bulgarelli, L.; Pollard, T.; Horng, S.; Celi, L.A.; Mark, R. MIMIC-IV, Version 2.0; PhysioNet: Boston, MA, USA, 2022. [Google Scholar]
  25. Bu, Z.J.; Jiang, N.; Li, K.C.; Lu, Z.L.; Zhang, N.; Yan, S.S.; Chen, Z.L.; Hao, Y.H.; Zhang, Y.H.; Xu, R.B.; et al. Development and validation of an interpretable machine learning model for early prognosis prediction in ICU patients with malignant tumors and hyperkalemia. Medicine 2024, 103, e38747. [Google Scholar] [CrossRef] [PubMed]
  26. Aljrees, T. Improving prediction of cervical cancer using KNN imputer and multi-model ensemble learning. PLoS ONE 2024, 19, e0295632. [Google Scholar] [CrossRef]
  27. Bennett, D.A. How can I deal with missing data in my study? Aust. N. Z. J. Public Health 2001, 25, 464–469. [Google Scholar] [CrossRef]
  28. Balaram, A.; Vasundra, S. Prediction of software fault-prone classes using ensemble random forest with adaptive synthetic sampling algorithm. Autom. Softw. Eng. 2022, 29, 6. [Google Scholar] [CrossRef]
  29. Mendapara, K. Development and evaluation of a chronic kidney disease risk prediction model using random forest. Front. Genet. 2024, 15, 1409755. [Google Scholar] [CrossRef]
  30. Joo, Y.; Namgung, E.; Jeong, H.; Kang, I.; Kim, J.; Oh, S.; Lyoo, I.K.; Yoon, S.; Hwang, J. Brain age prediction using combined deep convolutional neural network and multi-layer perceptron algorithms. Sci. Rep. 2023, 13, 22388. [Google Scholar] [CrossRef]
  31. Gorishniy, Y.; Rubachev, I.; Khrulkov, V.; Babenko, A. Revisiting deep learning models for tabular data. Adv. Neural Inf. Process. Syst. 2021, 34, 18932–18943. [Google Scholar]
  32. Hollmann, N.; Müller, S.; Eggensperger, K.; Hutter, F. Tabpfn: A transformer that solves small tabular classification problems in a second. arXiv 2022, arXiv:2207.01848. [Google Scholar]
  33. Liu, L.; Cui, S.; Hou, J.; May, N.S.; Luo, J.J. Risk Prediction for Alzheimer’s Disease Mortality: Using XGBoost Survival Analysis. Ann. Epidemiol. 2024, 97, 93. [Google Scholar] [CrossRef]
  34. Wei, X.; Rao, C.; Xiao, X.; Chen, L.; Goh, M. Risk assessment of cadiovascular disease based on SOLSSA-CatBoost model. Expert Syst. Appl. 2023, 219, 119648. [Google Scholar] [CrossRef]
  35. Akiba, T.; Sano, S.; Yanase, T.; Ohta, T.; Koyama, M. Optuna: A next-generation hyperparameter optimization framework. In Proceedings of the 25th ACM SIGKDD International Conference on Knowledge Discovery & Data Mining, Anchorage, AK, USA, 4–8 August 2019; pp. 2623–2631. [Google Scholar]
  36. Chicco, D.; Jurman, G. The advantages of the Matthews correlation coefficient (MCC) over F1 score and accuracy in binary classification evaluation. BMC Genom. 2020, 21, 6. [Google Scholar] [CrossRef] [PubMed]
  37. Hastie, T. The Elements of Statistical Learning: Data Mining, Inference, and Prediction; Springer: New York, NY, USA, 2009. [Google Scholar]
  38. Vanacore, A.; Pellegrino, M.S.; Ciardiello, A. Fair evaluation of classifier predictive performance based on binary confusion matrix. Comput. Stat. 2024, 39, 363–383. [Google Scholar] [CrossRef]
  39. Fernández Alba, J.J.; Carral, F.; Ayala Ortega, C.; Santotoribio, J.D.; Lara, M.C.; González Macías, C. External Validation of a Predictive Model for Thyroid Cancer Risk with Decision Curve Analysis. Diagnostics 2025, 15, 686. [Google Scholar] [CrossRef] [PubMed]
  40. Rudin, C.; Chen, C.; Chen, Z.; Huang, H.; Semenova, L.; Zhong, C. Interpretable machine learning: Fundamental principles and 10 grand challenges. Stat. Surv. 2022, 16, 1–85. [Google Scholar] [CrossRef]
  41. Qi, J.; Yang, R.; Wang, P. Application of explainable machine learning based on Catboost in credit scoring. In Journal of Physics: Conference Series; IOP Publishing: Bristol, UK, 2021; Volume 1955, pp. 1–7. [Google Scholar]
  42. Stevens, P.E.; Ahmed, S.B.; Carrero, J.J.; Foster, B.; Francis, A.; Hall, R.K.; Herrington, W.G.; Hill, G.; Inker, L.A.; Kazancıoğlu, R.; et al. Kidney Disease: Improving Global Outcomes (KDIGO) CKD Work Group. KDIGO 2012 clinical practice guideline for the evaluation and management of chronic kidney disease. Kidney Int. Suppl. 2013, 3, S117–S314. [Google Scholar]
  43. Kim, H.W.; Park, J.T.; Yoo, T.H.; Lee, J.; Chung, W.; Lee, K.B.; Chae, D.W.; Ahn, C.; Kang, S.W.; Choi, K.H.; et al. Urinary potassium excretion and progression of CKD. Clin. J. Am. Soc. Nephrol. 2019, 14, 330–340. [Google Scholar] [CrossRef]
  44. Chawla, T.; Sharma, D.; Singh, A. Role of the renin angiotensin system in diabetic nephropathy. World J. Diabetes 2010, 1, 141. [Google Scholar] [CrossRef]
  45. Hu, H.; Liang, W.; Ding, G. Ion homeostasis in diabetic kidney disease. Trends Endocrinol. Metab. 2024, 35, 142–150. [Google Scholar] [CrossRef]
  46. Pal, N.; Sivaswamy, N.; Mahmod, M.; Yavari, A.; Rudd, A.; Singh, S.; Dawson, D.K.; Francis, J.M.; Dwight, J.S.; Watkins, H.; et al. Effect of selective heart rate slowing in heart failure with preserved ejection fraction. Circulation 2015, 132, 1719–1725. [Google Scholar] [CrossRef] [PubMed]
Figure 1. The technology roadmap for this paper.
Electronics 15 00291 g001
Figure 2. Overall performance of the six machine learning models.
Electronics 15 00291 g002
Figure 3. ROC curve of the CatBoost.
Electronics 15 00291 g003
Figure 4. Confusion matrix of CatBoost.
Electronics 15 00291 g004
Figure 5. DCA of CatBoost.
Electronics 15 00291 g005
Figure 6. Feature importance scores of CatBoost.
Electronics 15 00291 g006
Figure 7. SHAP summary plot of the CatBoost model.
Electronics 15 00291 g007
Figure 8. LIME plot of the CatBoost model.
Electronics 15 00291 g008
Table 1. Parameters selected to be optimized and their value ranges.
ModelValue Range
RFn_estimators: (100, 500),
max_depth: (3, 20),
min_samples_split: (2, 20),
min_samples_leaf: (1, 10),
FTTinput_embed_dim: (1, 100),
attn_dropout: (0.01, 1),
num_heads: (1, 100)
MLPhidden_layer_sizes: ([(50,), (100,), (50, 50), (100, 50), (100, 100), (200, 100)]),
alpha: (1 × 10⁻⁵, 0.1),
learning_rate_init: (0.001, 0.1)
XGBoostlearning_rate: (0.01, 0.3),
n_estimators: (100, 1000),
max_depth: (3, 20)
CatBoostiterations: (100, 1000),
depth: (3, 16),
learning_rate: (0.001, 0.1)
Table 2. Hyperparameter optimization results.
ModelValue
RFn_estimators: 235
max_depth: 30
min_samples_split: 7
min_samples_leaf: 3
FTTinput_embed_dim: 72
attn_dropout: 0.19
num_heads: 6
MLPhidden_layer_sizes: (100, 100)
alpha: 4.883 × 10⁻⁵
learning_rate_init: 0.021
XGBoostlearning_rate: 0.063
n_estimators: 672
max_depth: 7
CatBoostiterations: 345
depth: 8
learning_rate: 0.096
Table 3. Comparative experimental results of six machine learning models.
ModelAccuracyPrecisionRecallF1-ScoreMCC
RF88.79%93.43%78.33%82.66%70.16%
FTT89.66%93.88%80.00%84.24%72.56%
MLP86.21%85.73%76.69%79.60%65.64%
TabPFN90.52%90.81%83.84%86.55%74.83%
XGBoost87.93%88.75%78.84%82.15%70.67%
CatBoost92.44%95.26%85.00%88.69%79.62%
Disclaimer/Publisher’s Note: The statements, opinions and data contained in all publications are solely those of the individual author(s) and contributor(s) and not of MDPI and/or the editor(s). MDPI and/or the editor(s) disclaim responsibility for any injury to people or property resulting from any ideas, methods, instructions or products referred to in the content.