Article

Analysis of PMSM Torque Waveform Discrepancies in a Hardware-in-the-Loop Environment

by
Wojciech Pietrowski
1,*,
Magdalena Puskarczyk
2 and
Jan Szymenderski
1
1
Faculty of Automatic, Robotics and Electrical Engineering, Institute of Electrical Engineering and Electronics, Poznan University of Technology, Piotrowo 3a, 61-138 Poznan, Poland
2
Nexteer Automotive Poland sp. z o. o., Towarowa 6, 43-100 Tychy, Poland
*
Author to whom correspondence should be addressed.
Electronics 2026, 15(17), 3946; https://doi.org/10.3390/electronics15173946
Submission received: 30 June 2026 / Revised: 27 August 2026 / Accepted: 27 August 2026 / Published: 2 September 2026

Abstract

This paper compares Permanent-Magnet Synchronous Motor (PMSM) torque waveforms measured on a dynamometer test bench and generated by a real-time Hardware-in-the-Loop (HiL) simulation. A nonlinear PMSM model, parameterised using measurements from the physical motor and incorporating magnetic saturation through Look-Up Tables, was implemented on a dSpace HiL platform. Torque signals were evaluated at steady-state operating points of 20, 100, and 200 rpm using time-domain errors, Pearson and Spearman correlations, and FFT-based spectral analysis. An affine gain–offset transformation was applied to separate calibration-related discrepancies from differences caused by dynamic behaviour and unmodelled physical effects. The maximum observed initial discrepancy between dynamometer-measured and HiL-estimated torque was 0.638 Nm. Affine calibration reduced the maximum error by up to 85%, demonstrating that gain and offset mismatches were major contributors to the original error. However, correlation values remained low, and spectral analysis identified substantial differences in harmonic content. The dynamometer signals contained speed-dependent components, including a component near the 24th mechanical harmonic, whereas the HiL signals were dominated by the first mechanical harmonic. The proposed workflow supports mean-torque-oriented HiL validation and identifies priorities for improving model representation, channel scaling, and dynamic testing procedures.

1. Introduction

The objective of this work is to develop an effective method for the early detection of faults in Electric Power Steering (EPS) systems. From the perspective of an average vehicle user, the primary objective of this research is to increase vehicle reliability—particularly the reliability of the EPS system—thereby enhancing driving safety and improving steering precision. The main advantage of early fault-identification solutions is their ability to detect potentially hazardous faults, thereby enabling the timely activation of safety procedures and reducing the risk of critical system failures during vehicle operation.
Hardware-in-the-Loop (HiL) simulation and dynamometer testing are widely used to validate automotive control systems. HiL enables real-time verification of embedded control systems by connecting physical hardware with simulated plant models, providing a cost-effective, flexible, and repeatable alternative to full-scale system or vehicle testing, whereas dynamometer measurements are commonly treated as a reference for validating simulation results.
A comprehensive review of EPS fault-detection methods presented in [1] highlights the role of HiL platforms in validating diagnostic algorithms under controlled and repeatable conditions. The review presents the structure and dynamics of EPS systems; outlines typical faults in sensors, electric motors, and mechanical components; and examines algorithms such as observer-based estimators, parameter-estimation schemes, and AI-supported classifiers (e.g., neuro-fuzzy methods). It also identifies limitations related to simplified models, nonlinear steering dynamics, thermal effects, and computational constraints.
Recent reviews [2,3] show that PMSM models for HiL applications range from simplified synchronous-frame models to high-fidelity FEA-based implementations capable of representing saturation, saliency, cogging torque, cross-coupling, and spatial harmonics [4,5]. Their main limitations include memory requirements, computational latency, interpolation errors, numerical stability issues, and limited robustness to parameter variations. Furthermore, validation procedures remain inconsistent, and thermal or loss models are often omitted.
In PMSM applications, validation is typically performed in stages: Software-in-the-Loop (SiL), HiL (or Control Hardware-in-the-Loop, CHiL), and then Power Hardware-in-the-Loop (PHiL), followed by comparison with a physical drive or dynamometer [6]. In such applications, the control algorithm is generally retained throughout the workflow to isolate the effects of model fidelity and hardware interfaces [7]. The agreement between simulation and measurement is commonly assessed using torque error, dynamic-response error, harmonic-spectrum agreement, latency, and simulation step size. Typical test cases include torque–speed sweeps, transient load changes, and parameter-uncertainty scenarios, with torque referenced to a dynamometer-mounted torque sensor [6,7,8].
Waveform comparison methods reported in the literature include RMSE, Pearson correlation, Euclidean and Mahalanobis distances, energy residuals, settling time, mean values, RMS values, peak values, THD, harmonic spectra, and transient-duration metrics [9,10,11]. Close agreement has been reported between the HiL, CHiL, and PHiL results and the dynamometer measurements for torque–speed sweeps and transient test scenarios, with torque errors below ±2% and transient-response deviations below 0.05 s [6]. For comparison, HiL studies on induction motor drives reported torque-estimation errors below 5 Nm in the operating range—for example, at an output torque of 55 Nm, using powertrain test-bench measurements as the reference [12]. In these studies, HiL was applied primarily to validate control, fault-diagnosis, and fault-handling functions.
Detailed electromagnetic models, such as the finite-element model presented in [13], enable an in-depth analysis of motor operation and electromagnetic characteristics. Advanced PMSM models that combine finite-element-data-driven nonlinear modelling with integrated loss modelling have achieved current errors below 2% and agreement exceeding 90% between simulated and experimentally measured efficiency maps [14].
The study [15] represents uncertain HiL test-bench parameters by means of probability distributions and propagates them through a Modelica model using Monte Carlo simulation. The results indicate that the test-bench parameters considered have little effect on the measured efficiency. Uncharacterised uncertainties are intended to be identified through comparisons with experimental data and inverse uncertainty propagation.
Observed discrepancies between simulated and measured signals are typically related to sensor noise, communication delays, model simplifications, actuator dynamics, such as machine inertia and losses [16], and the limited representation of nonlinear and multiphysics effects. Recent studies using integrated test environments and hybrid evaluation approaches report improved agreement between simulation results and experimental data [9]. Another study [17] reports that discrepancies between HiL and ideal-system responses arise primarily from non-negligible actuator dynamics, communication delays, measurement noise, model mismatch, and uncertainty in the parameters of the device under test. In the presented example, the HiL response exhibits a time delay caused by a motor-induced phase shift and an additional communication delay of 2 ms.
The IEEE standard [18] defines metrics for assessing both the accuracy and sensitivity of HiL simulations. Accuracy refers to how closely the HiL system reproduces the behaviour of the real system, while sensitivity quantifies the impact of disturbances, delays, noise, and interface imperfections. Unlike the broader framework considered in the standard, this study focuses specifically on comparing motor-torque signals measured on a dynamometer with those generated by a real-time HiL platform.
The present study is part of a broader research project; therefore, the manuscript includes future research directions and clearly identifies the limitations that will be addressed in the next phases of the project. At the current stage, the focus is on developing and validating a methodology for comparing HiL-generated signals with dynamometer measurements and assessing the accuracy of the HiL signals. Since both the dynamometer-based motor test bench and the HiL setup are still under development, the experimental investigation was intentionally limited to selected steady-state operating points. Rotational speeds of 20, 100, and 200 rpm were selected because the available measurement equipment introduces significant noise at higher rotational speeds, which could adversely affect the reliability of the comparison. Nevertheless, these operating conditions were considered sufficient to demonstrate the feasibility and applicability of the proposed methodology.
Close agreement between real-world and HiL-generated waveforms is desirable, as it supports controller validation, safety assessment, and faster development. Therefore, the objective is to determine the fidelity of the HiL setup and to continuously improve its agreement with dynamometer measurements. However, the primary focus of the present work is the development of the proposed signal-analysis-based algorithm rather than the development of a highly accurate HiL motor model. Since experimental validation on a physical prototype is available and serves as the final reference, shortcomings of the HiL model can be addressed through dynamometer testing, which inherently captures unmodelled phenomena and hardware effects. Consequently, the HiL platform is used as an intermediate validation tool for the preliminary development and functional verification of algorithms based primarily on mean torque, slowly varying variables, signal acquisition, communication, and low-bandwidth controller behaviour. The present HiL fidelity is not considered sufficient for developing or calibrating waveform-sensitive diagnostic algorithms that rely on torque-ripple amplitude, correlation structure, or harmonic-order signatures; for these, the dynamometer remains the reference environment throughout this work.
Recent research has explored advanced nonlinear control strategies for PMSM drives. For example, the super-twisting-like fractional (STLF) controller proposed in [19] reduces current ripple while maintaining good disturbance-rejection and tracking performance. Similarly, Ref. [20] introduced a composite adaptive super-twisting sliding-mode (ASTSM) controller with online gain adaptation, improving robustness and disturbance rejection. However, the objective of the present work is not the development of a new motor control strategy. Instead, the focus is on evaluating the accuracy of the HiL signal by comparing it with dynamometer measurements. Future work will address the development of early fault-detection algorithms for motors and inverters while retaining existing control algorithms.
In summary, this publication addresses the following research questions:
  • How closely do the motor torque signals generated by the real-time HiL simulation match the signals measured on the dynamometer?
  • What metrics are suitable for a quantitative assessment of the agreement between the simulated and measured signals?
  • What are the main sources of discrepancies between the waveforms obtained from the two sources?
  • What actions can be taken to improve the level of agreement between simulation and measurement?
The remainder of this article is organised as follows: Section 2 provides a general overview of the test setup and the motor model, including a description of the tested motor. In Section 3, the measured torque time-domain signals are presented. Section 3.2 describes the post-processing performed on the measured data and introduces the quantitative metrics used to assess similarities and differences between the time-domain signals. Measurement errors observed in the experimental data are discussed in Section 3.3. Section 4 summarises recommendations for the test setup and the modelling approach. Finally, Section 5 concludes the article.

2. Materials and Methods

2.1. Research Gaps

Despite the widespread use of Hardware-in-the-Loop (HiL) environments in drives with Permanent-Magnet Synchronous Motors (PMSMs), the published validation methods and procedures remain inconsistent and only partially meet the needs of torque-sensitive applications, such as Electric Power Steering (EPS).
A recent review of the literature on real-time modelling of electrical machines for HiL testing summarises model architectures, computational limitations, and platform architectures [2,3], but these reviews do not propose a standardised, multi-domain protocol for comparing torque waveforms measured on a dynamometer with those estimated in HiL tests.
Real-time PMSM models, taking into account phenomena such as magnetic circuit nonlinearity, spatial harmonics in the magnetic field distribution, and iron losses, have been demonstrated on FPGA platforms and commercial HiL platforms and verified primarily using finite-element analysis and measured currents, as well as through deviations in average torque following model refinement [4,5,14,21].
Motor emulators in Power Hardware-in-the-Loop systems also emphasise the accuracy of electrical variables, including phase currents, dq currents, and rotational speed, and typically exhibit relative tracking errors of a few percent without comparing the torque waveform based on dynamometer measurements [22,23,24].
System-level studies comparing Control HiL, Power HiL, and dynamometer test results indicate close agreement in average torque values (e.g., within ±2%) and transient response times, which confirms the value of multi-stage validation processes for electric powertrains [6,25].
PHiL analyses make it possible to quantify the amplifier’s sensitivity to disturbances, delays, and dynamics [16,17,18,26], whereas research into test-bench control focuses on tracking the shaft torque and rotational speed of the mechanical interface, rather than on estimating the torque of the device under test [27].
Metrics used to compare waveforms, as described in the wider literature on HiL simulation—RMSE, Pearson’s correlation coefficient, energy residuals, THD, and spectral metrics—are rarely used in combination for the same torque waveforms under different operating conditions [9,10,11], whereas affine calibration (gain–offset), which is standard in sensor metrology [28,29], is rarely used to distinguish between channel scaling and deviations arising from dynamic mismatches or those related to the accuracy of torque mapping in the HiL model.
Furthermore, although the harmonic torque content resulting from the presence of cogging in the air gap of PMSM drives has been well characterised from an electromagnetic perspective [30], no systematic reports have been published to date on the experimentally observed discrepancy between the dominant mechanical harmonic on a dynamometer and the harmonic occurring in a simplified real-time HiL system.
Finally, the operating points of the EPS system at low speeds and in steady-state conditions—where ripple harmonics and interaction effects dominate the diagnostic signature used by fault-detection algorithms—remain insufficiently addressed compared with driving-cycle tests aimed at investigating the behaviour of the driving system [1].
Consequently, the HiL setup may appear suitable on the basis of its average-torque or current-tracking performance, but it remains insufficient for validating diagnostic methods at the signal waveform level across all operating conditions.

2.2. Novelty

This article addresses the gaps discussed above by proposing and experimentally demonstrating a compact, multi-method discrepancy-analysis procedure for PMSM torque signals. Signals obtained from a dynamometer test bench and a real-time dSpace HiL platform were analysed. The motor under test is a PMSM with four pole pairs and twelve slots, configured for measurement purposes and representative of Electric Power Steering (EPS) applications. The tests were carried out at selected steady-state operating points at rotational speeds of 20, 100, and 200 rpm, and at a torque reference of 3.92 Nm. A review of the literature shows that research has primarily focused on verifying the operation of the controller or the emulation of electrical ports. This study, however, presents a signal-level analysis aimed at determining where and why the estimated torque in HiL tests deviates from actual measurements.
The scientific contribution of this article comprises three elements: The first is an affine gain–offset calibration applied to the HiL torque channel. Second, despite closely matched mean torques, raw Pearson and Spearman coefficients remain weak and negative, becoming only weakly positive after affine correction, demonstrating that mean-value agreement does not imply waveform fidelity. Third, the spectral analysis reveals a systematic mismatch in dominant mechanical harmonics: a component near the 24th mechanical order on the dynamometer, consistent with the 4-pole-pair/12-slot topology [30], versus dominance of the first mechanical harmonic in the HiL estimate. This finding links residual discrepancy to unmodelled machine and mechanical effects rather than to a residual gain error.
Beyond HiL bench qualification itself, this quantified discrepancy-decomposition workflow is intended as an enabling step for two downstream application areas that motivate the present study:
Firstly, torque-sensitive fault-diagnosis algorithms designed for PMSM drives in EPS systems are usually developed and preliminarily verified on HiL test benches before being implemented on physical hardware. These include schemes for detecting inter-turn short circuits and mechanical faults based on ripple amplitude, correlation, or harmonic signatures [1,12,31]. If the torque waveform in the HiL environment deviates from the actual behaviour of the machine in terms of correlation structure and harmonic content, as shown here, there is a risk that a diagnostic threshold or classifier tuned on a HiL bench will be incorrectly calibrated when transferred to the actual system, which may result in false alarms or failures to detect early-stage faults.
Secondly, the same concerns regarding the accuracy of waveform reproduction in the time domain apply to data-driven forecasting of remaining service life and maintenance planning based on the technical condition of electrical machinery and EPS actuators. In such cases, degradation indicators are typically derived from long-term trends in torque ripple, harmonic content, or residual-error statistics. If these indicators are determined or calibrated using an insufficiently validated HiL surrogate, the resulting lifetime estimates or condition indicators inherit the same biases and waveform distortions that have been quantified in this study. By explicitly separating the calibration error from other dynamic and spectral discrepancies, the proposed methodology provides a simple and quantitative basis for assessing which torque characteristics are sufficiently reliable to be used in diagnostic models and service-life prediction models built on industrial HiL test benches, without the need to recreate the full finite-element model.

2.3. Test Environment Description

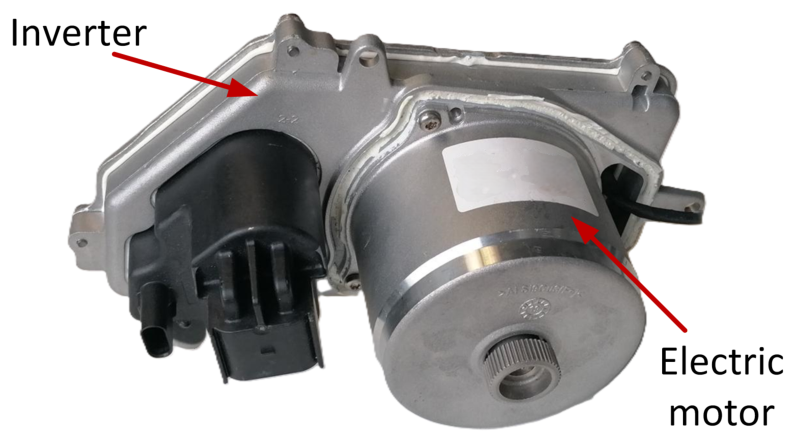
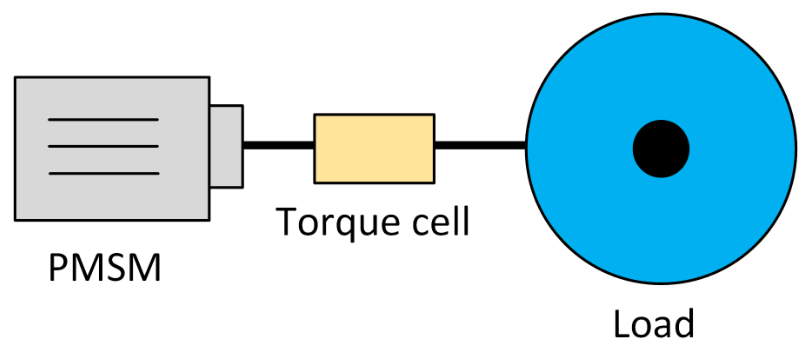
To record the signals generated during the operation of the real drive system consisting of a PMSM and an inverter (see Figure 1), an experimental setup equipped with a motor dynamometer was used.
The dynamometer was controlled to maintain a constant rotational speed, while the tested motor was driven to produce a predefined torque. The load machine used in the dynamometer setup was a motor with rated power and maximum speed substantially higher than those of the device under test, thus ensuring stable operation and accurate measurement results. Figure 2 illustrates the block diagram of the motor dynamometer setup.
Based on the measurement results, a mathematical model of the PMSM was developed for implementation on the dSpace HiL platform, as shown in Equation (1):
L d d i d d t + i d d L d d t = v d R s i d + L q ω e i q L q d i q d t + i q d L q d t = v q R s i q L d ω e i d ψ p ω e T = 3 2 p ψ p i q + ( L d L q ) i d i q
where L d and L q are the inductances on the direct and quadrature axes, respectively; i d and i q are the direct- and quadrature-axis currents; R s is the stator-winding resistance; ω e is the motor angular velocity; p is the number of pole pairs; ψ p is the permanent-magnet flux linkage; and T is the motor torque [32].
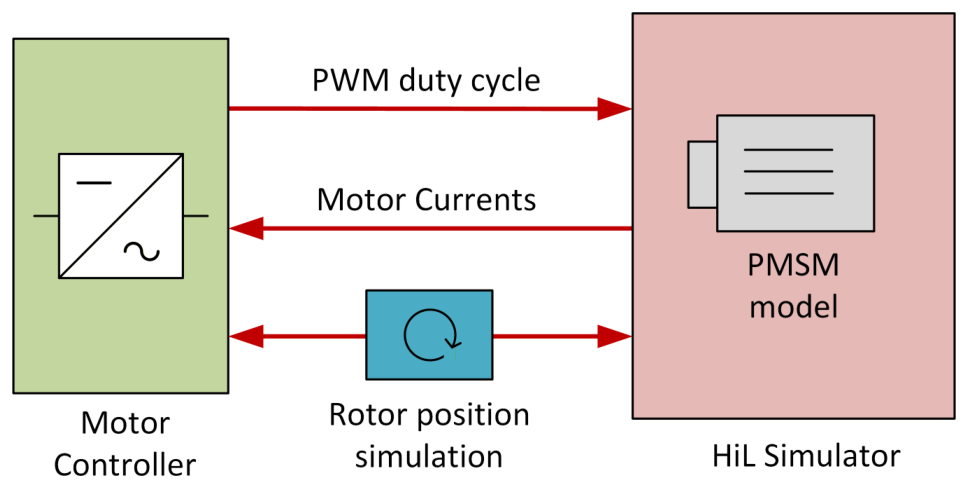
The HiL system interfaced with the real motor controller instead of a physical PMSM by capturing the switching commands issued by the controller and providing the corresponding motor currents as feedback (more specifically, voltages corresponding to the motor phase currents). Inverter dead-time and voltage drops were not included in the HiL model and were therefore neglected in the analysis. In addition, the same simulated rotor-position signal was provided to both the HiL motor model and the controller, as shown in Figure 3.
The motor model was formulated in the rotating reference frame and employed Clarke–Park transformations. Its parameters were set to the measured values for the tested PMSM.
In addition to basic motor parameters such as the voltage constant k e , resistance R, and inductances L d and L q , the model incorporated measured magnetic flux linkage saturation characteristics and inductance variation as a function of the quadrature-axis current, i q . This approach enabled the creation of a nonlinear PMSM model based on a Look-Up Table (LUT) structure, thus capturing magnetic-saturation effects and the resulting dependence of motor parameters on current [32]. The LUT model was used exclusively to account for magnetic-saturation effects, while cogging torque, temperature effects, parasitic effects, friction, and other real-world phenomena were not modelled. Such a simplified model is considered sufficient for the intended application. The planned tests are relatively short; therefore, the temperature rise is not expected to significantly affect the motor parameters. Furthermore, incorporating additional effects such as asymmetries or cogging torque would require considerable modelling effort while providing only limited benefits for the objectives of this study. An important advantage of the adopted simplified model is the reduction in model-development and implementation time. This approach is justified because the final validation will be performed on a dynamometer, where these effects are inherently present and measured directly. Table 1 presents the parameters used in the model.
The HiL model equations are solved once per PWM pulse. As a result, the controller cooperating with the HiL experiences a one-PWM-cycle delay: the motor current determined at a given time instant is based on the PWM signal measured in the previous cycle. For example, with a PWM frequency of 15 kHz, the delay is 66.7 × 10 6 s.
Test data were collected for the following motor rotational speeds: 20, 100, and 200 rpm. A torque reference of 3.92 Nm was applied. The experiment was carried out on the dynamometer test bench with a real motor and using the real-time HiL platform.

3. Research Results

3.1. Identifying Differences Between Simulated and Measured Signals

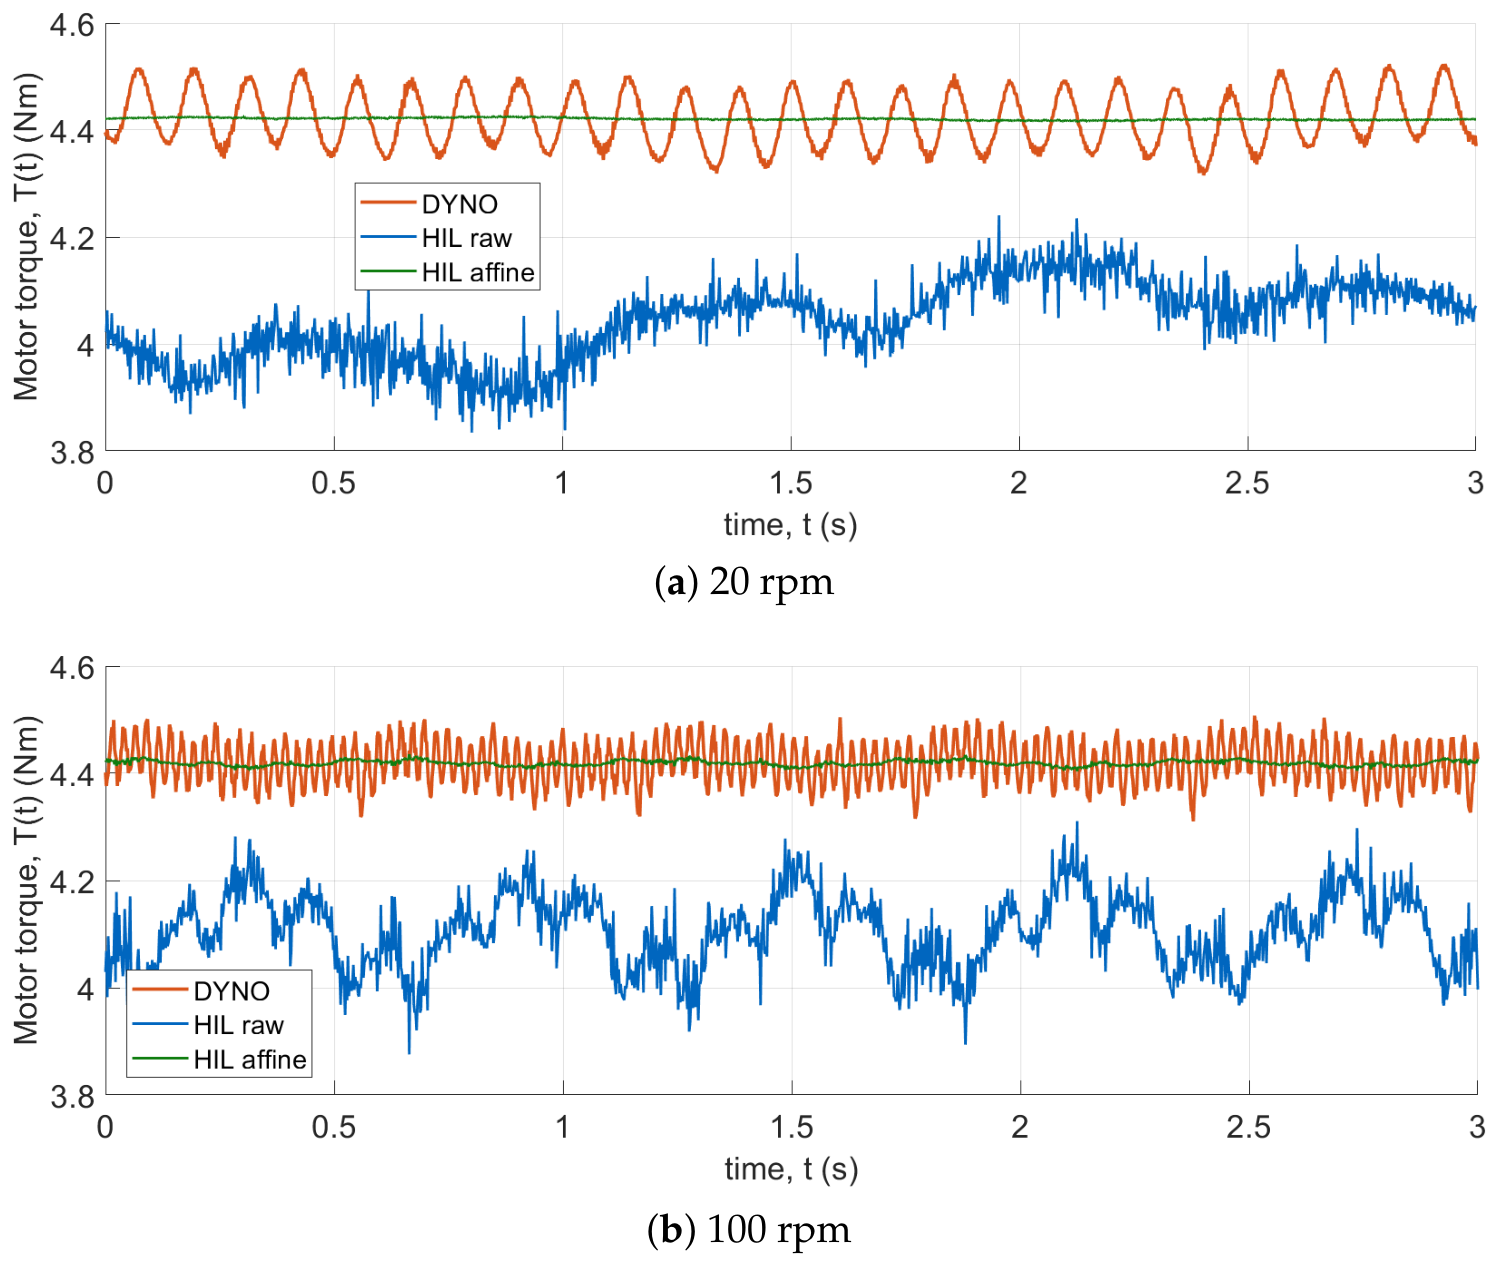
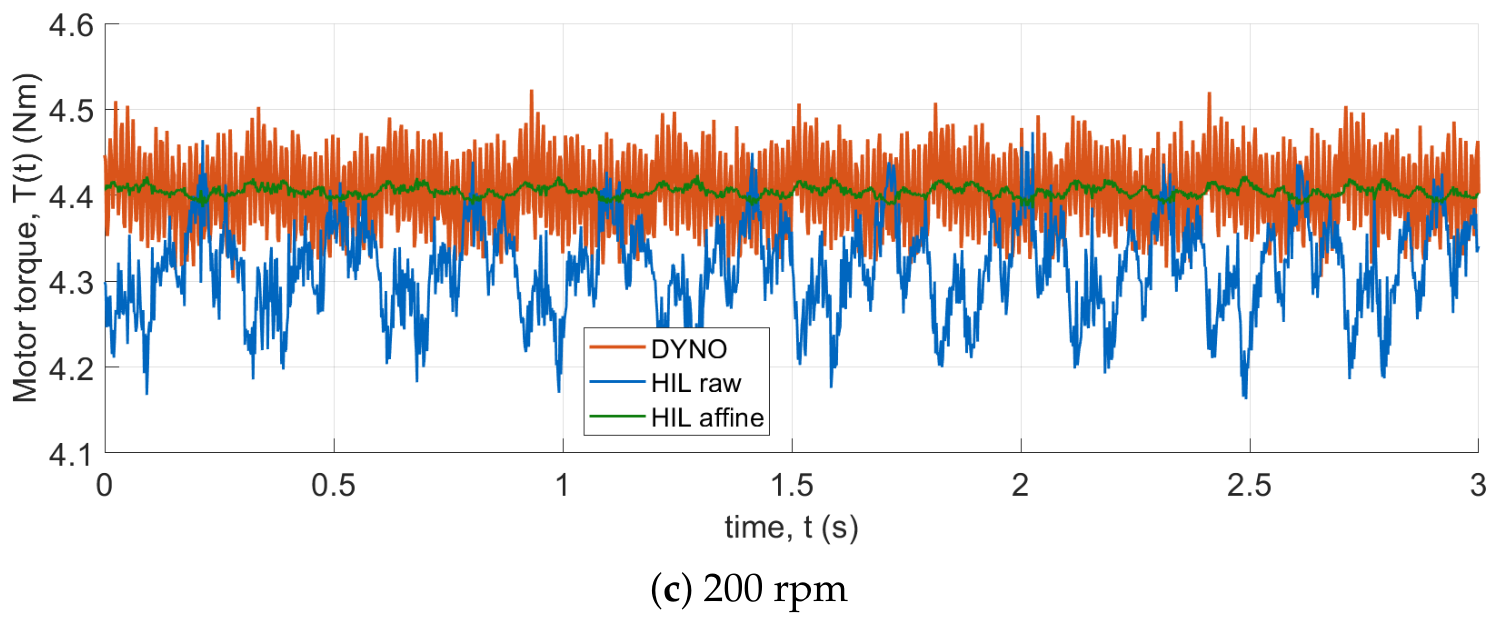
The analysed dataset consists of torque measurements obtained from two sources: a dynamometer test bench and a real-time dSpace HiL simulation. Figure 4 shows the recorded motor torque T ( t ) for all three operating points (20, 100, and 200 rpm), for the two test environments: HiL, T h ( t ) and the dynamometer, T d ( t ) . The low rotational speeds considered in the analysis allow a large number of samples to be collected per period during the measurement, enabling a detailed and accurate analysis.
At 20 rpm (Figure 4a), both waveforms exhibit limited similarity in short-time fluctuations, suggesting residual dynamic mismatch. A dominant amplitude offset can also be observed. At 100 rpm (Figure 4b), the divergence in local oscillatory patterns becomes more apparent, indicating increasing disagreement in the speed-dependent dynamic content. At 200 rpm (Figure 4c), the waveforms indicate the greatest discrepancy in waveform detail, consistent with a further increase in speed-dependent dynamics that is not reproduced in the HiL results.
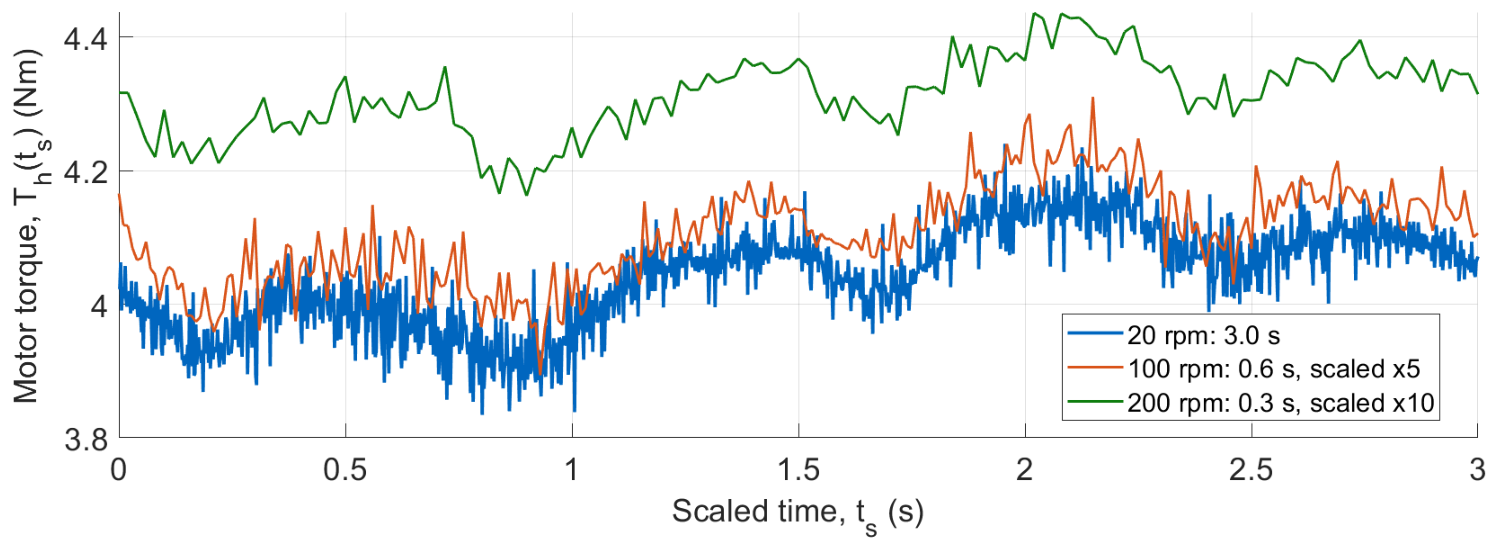
Figure 5 shows the raw motor torque estimated by the HiL model, T h r a w , over a complete mechanical revolution. The time axes for 100 and 200 rpm were rescaled to allow a direct comparison of the waveforms obtained at different rotational speeds. The waveforms exhibit similar shapes but differ in their mean levels, indicating the presence of speed-dependent offsets.
Table 2 summarises the mean signal values ( T a v g , d and T a v g , h denote the mean values of the dynamometer and HiL signals, respectively).

3.2. Data Analysis Method

The goal of the analysis is to evaluate how closely the motor torque estimated by the HiL platform agrees with that measured for the physical motor across multiple operating points. The analysis compares the measured motor torque and the torque signal provided by the HiL platform at three operating points (20, 100, and 200 rpm). For each operating point, time-domain errors, correlations, and frequency-domain characteristics were evaluated.

3.2.1. Affine Transformation for Test Data

The initial time-domain inspection revealed noticeable differences between the waveforms obtained from both test environments, indicating the presence of calibration-related offsets and deeper dynamic mismatches. To separate these effects, an affine mapping fitted by least squares was applied to the HiL torque signal, T h r a w (2):
T h affine ( t ) = a · T h raw ( t ) + b
yielding a (gain) and b (offset).
Affine representations offer a computationally efficient means of linking measured data with physical quantities while reducing calibration complexity [28]. In addition, many sensor calibration methods rely on affine models, where measurement discrepancies are expressed through gain and offset parameters that can be estimated to equalise the outputs of different systems [29].
The applied approach distinguishes between mean-torque fidelity and waveform-level fidelity by separating simple gain and offset discrepancies, typically introduced by calibration or measurement-chain differences, from genuine dynamic deviations such as delays, nonlinearities, and unmodelled effects. The affine correction improves signal calibration by compensating for scaling and offset mismatches; however, it does not improve the fidelity of the underlying HiL model or its ability to reproduce missing dynamic or harmonic content of the physical system.
The affine transformation coefficients determined for the analysed signals are summarised in Table 3.
For transparent interpretation, further results are reported in two parallel variants: (i) raw data, which reflect direct agreement between the two approaches (real motor measurement versus simulation); and (ii) affine-transformed data, which demonstrate the expected results for an alternative calibration of the HiL torque channel. Reporting both variants clarifies whether discrepancies are dominated by a linear gain/offset mismatch or by differences in dynamic content.

3.2.2. Time-Domain Error

For each operating speed (20, 100, and 200 rpm), the study reports differences between the measured and simulated signals. The time-domain difference (error) is given by the following equation:
e raw ( t ) = T d ( t ) T h raw ( t )
where T d ( t ) denotes the torque signal measured on the dynamometer test bench, and T h r a w ( t ) denotes the torque estimated by the HiL platform.
The affine-transformed error is defined as
e aff ( t ) = T d ( t ) T h aff ( t )
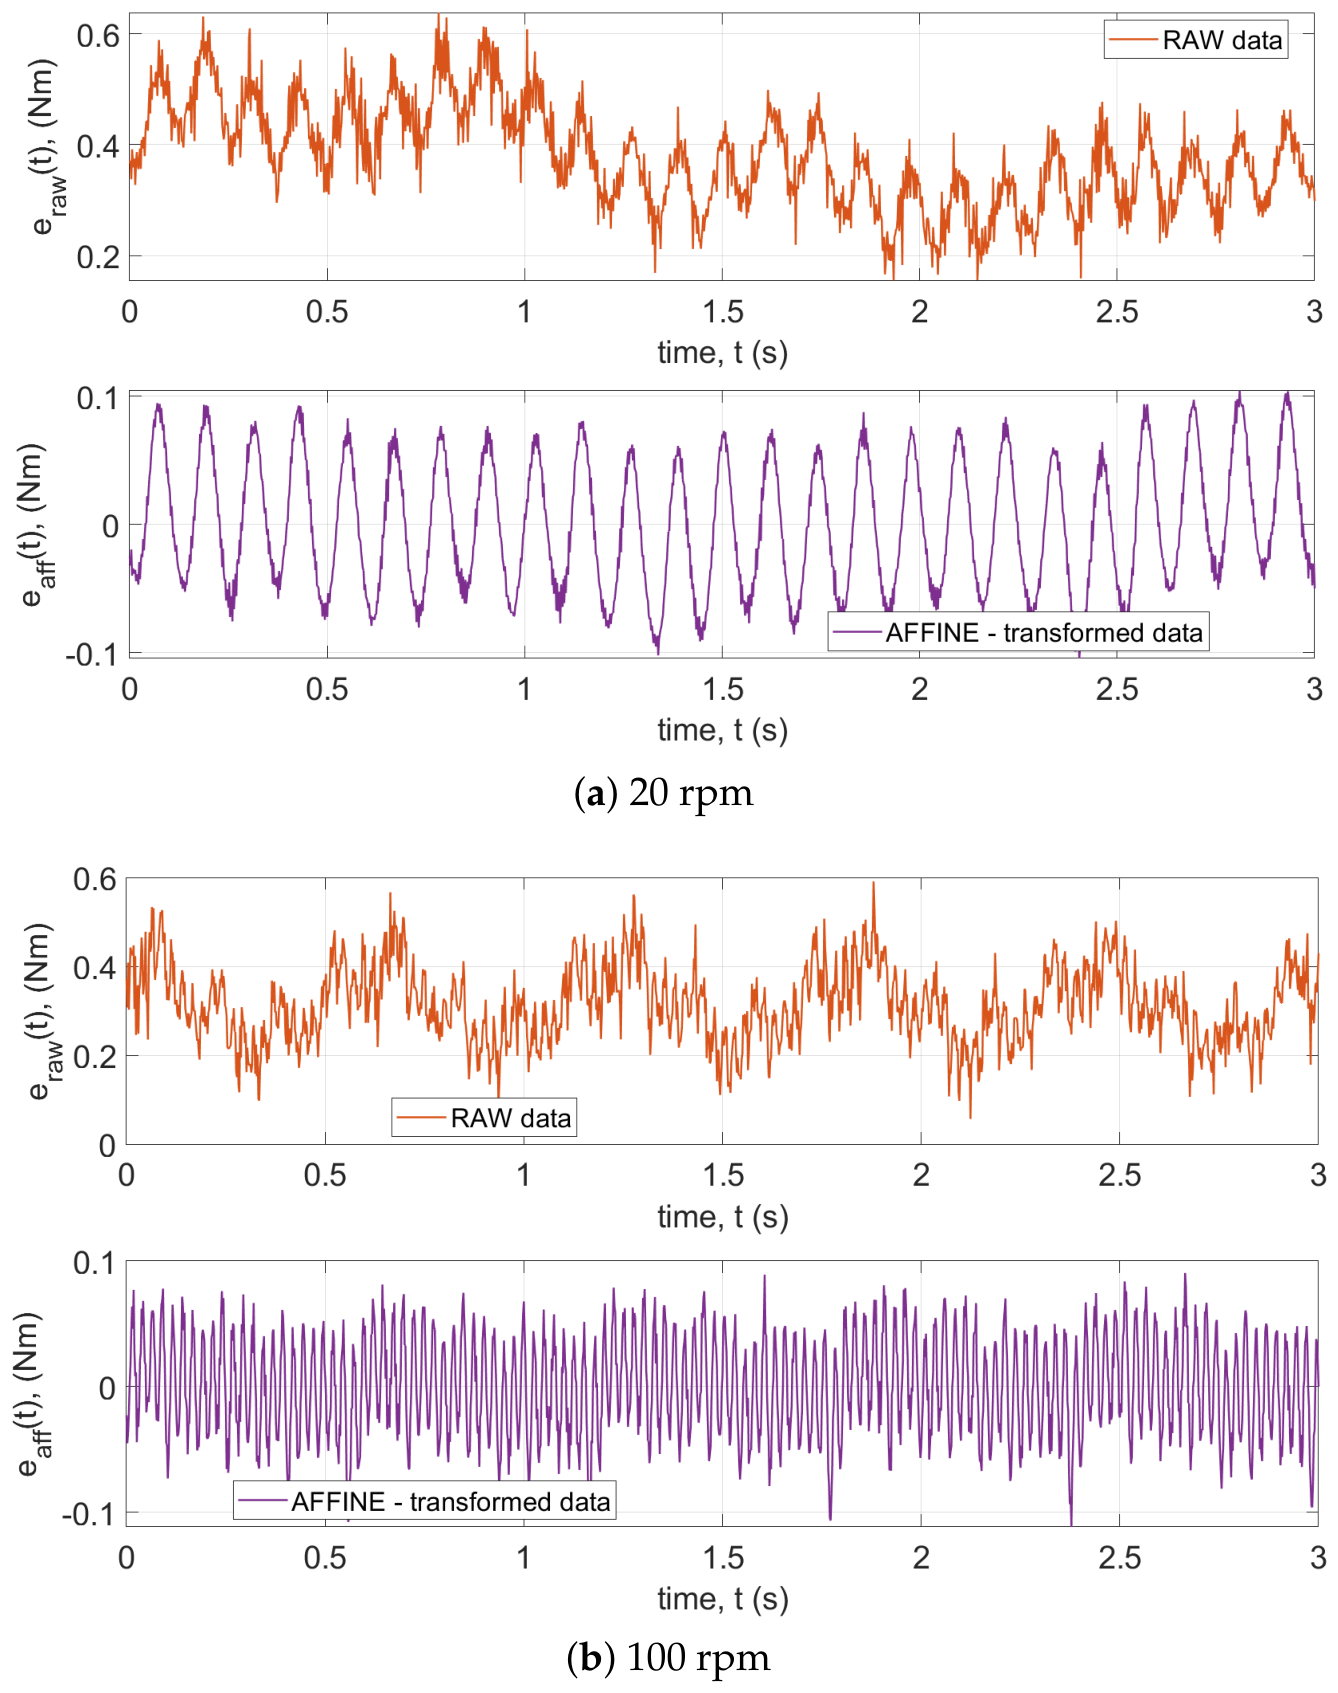
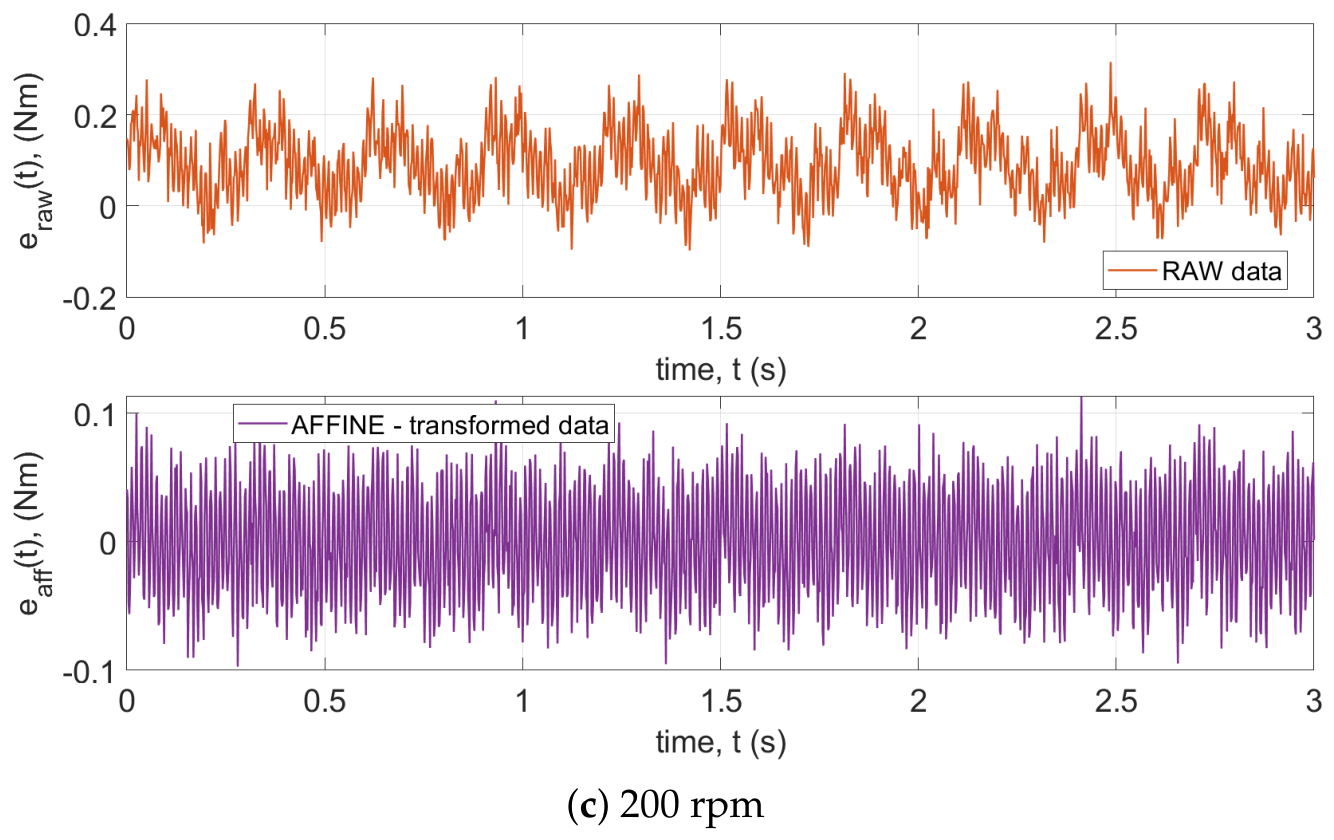
Figure 6 summarises the steady-state time-domain differences. Each plot contains two waveforms: (i) raw-data difference (as defined by Equation (3)) and (ii) affine-transformed waveform difference (Equation (4)).
Table 4 summarises the maximum time-domain torque errors for both the HiL raw data and the affine-transformed data.
Applying only the affine transformation reduces the time-domain torque error by as much as 85% (from 0.591 Nm to 0.09 Nm at 100 rpm). This result indicates that recalibration of the channels may lead to significant improvements in the accuracy of the output signal. The remaining dynamic discrepancies are small compared with the dominant gain/offset error. A full characterisation of the machine would require repeating the analysis for all four operating quadrants, i.e., with positive and negative speed and torque. Nevertheless, the results demonstrate the potential value of this simple analysis.

3.2.3. Correlation-Based Similarity Assessment

Pearson and Spearman correlation coefficients were used to assess the similarity between torque signals measured on the dynamometer and generated by the HiL platform. Both correlation measures help to determine the degree to which the HiL signal follows the measured torque trend, regardless of scaling differences. As the analysis was performed at different rotational speeds, the correlations help to assess the ability of the HiL system to capture high-frequency motor dynamics.
Pearson correlation quantifies linear agreement,
r = cov ( T d , T h ) σ T d · σ T h ,
while Spearman correlation evaluates monotonic agreement and is defined as the Pearson correlation of rank-transformed data,
ρ = r rank ( T d ) , rank ( T h ) .
Consequently, both metrics provide complementary information on how closely the HiL signal follows the measured torque trend, regardless of scaling differences. The correlation coefficients for the raw and affine-transformed data are summarised in Table 5.
Pearson correlation quantifies linear co-variation; values near zero indicate weak linear agreement in the steady-state waveform, while values close to 1 indicate a strong positive linear relationship between the two signals. This means that increases and decreases in one signal are closely matched by proportional changes in the other, reflecting a high degree of similarity in their dynamic behaviour. Spearman correlation quantifies monotonic association; deviations from Pearson may indicate nonlinear or rank-preserving relationships.
At 20 rpm, the correlations are low, indicating only limited agreement in the local steady-state trajectory. At 100 rpm, correlations and residual structure suggest a weaker raw association and a potential sign/scale effect captured by the affine fit. At 200 rpm, the residual exhibits the most pronounced short-time structure, but the correlations remain low. Owing to the higher rotational speed, fewer samples per revolution are acquired than during operation at 20 rpm.
The negative correlation values obtained for the raw signals indicate opposite dynamic trends between the HiL and dynamometer waveforms within the analysed time intervals. This observation is consistent with the results of the affine transformation, where the gain coefficient a is negative for all datasets (Table 3). This behaviour should be interpreted as a consequence of differences in the dynamic response of the two systems. Possible contributing factors include temperature-related torque drift during dynamometer testing, measurement noise, signal delays, and the accumulation of numerical errors in HiL calculations.
Although the mean torque values T a v g , d and T a v g , h are closely matched, both Pearson and Spearman coefficients remain low at all speeds investigated, indicating limited similarity in the local waveform variations. This suggests that the disturbances present in the steady-state signals differ between the physical system and the HiL environment. At higher rotational speeds, the absolute values of the correlation coefficients increase slightly, which may additionally be influenced by the smaller number of samples acquired per mechanical revolution. The results therefore indicate that the dominant sources of signal fluctuations are not identical in the two systems, even though their mean values are closely aligned.
Correlation-based metrics are particularly valuable in the assessment of dynamic operating conditions. However, the present study is limited to steady-state signal analysis. Future work will therefore extend the proposed methodology to transient operating scenarios, including step-response tests, where correlation measures are expected to provide deeper insight into the dynamic agreement between the HiL model and the physical system.

3.2.4. Frequency-Domain Spectrum

The frequency-domain analysis uses FFT magnitude spectra to highlight how harmonic components differ between the analysed test benches. In fault or non-ideal operating conditions, such methods may enable mitigation of harmonics caused by machine faults, as shown in [31], emphasising the critical importance of capturing electromagnetic nonlinearities and fault-induced disturbances.
The results of the spectral analysis demonstrate how the dominant frequencies of the dynamometer and the HiL signals change with motor speed. This, in turn, indicates how the applied real-time modelling approach influences the final HiL output and what the dynamic limitations of the system are.
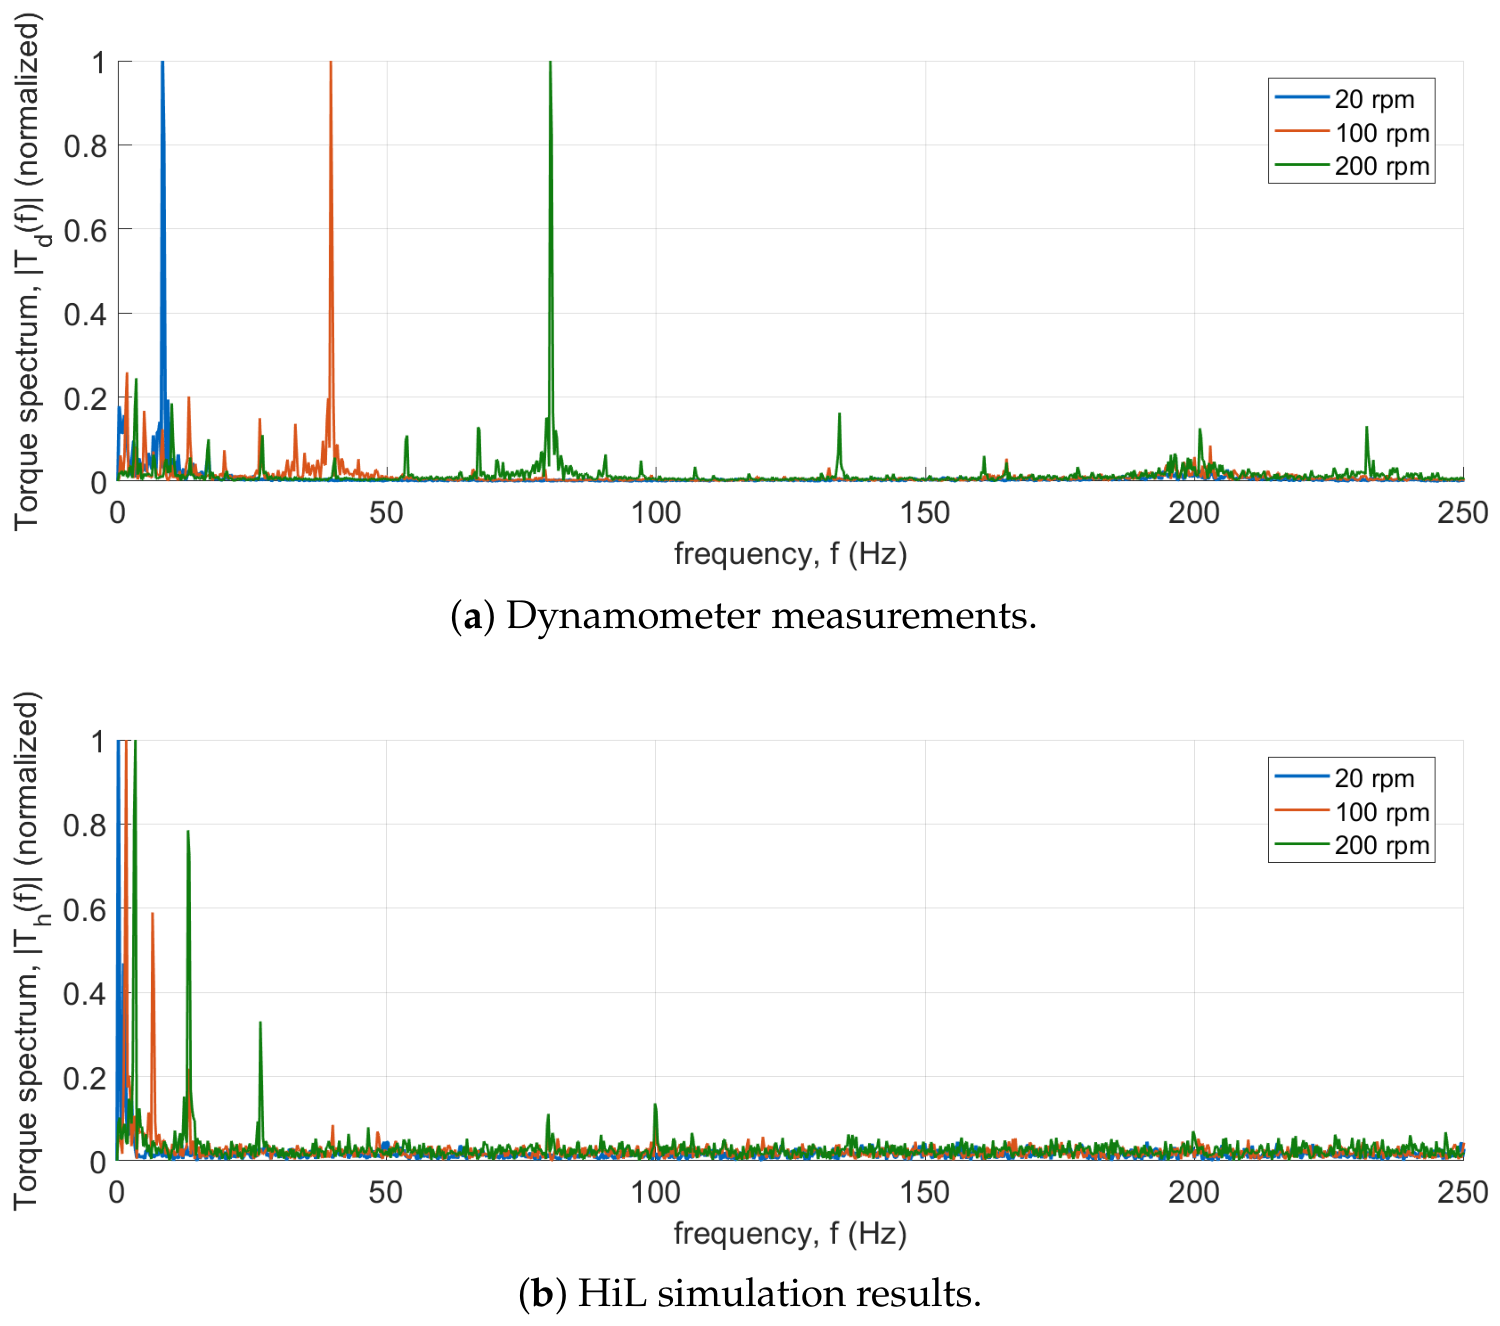
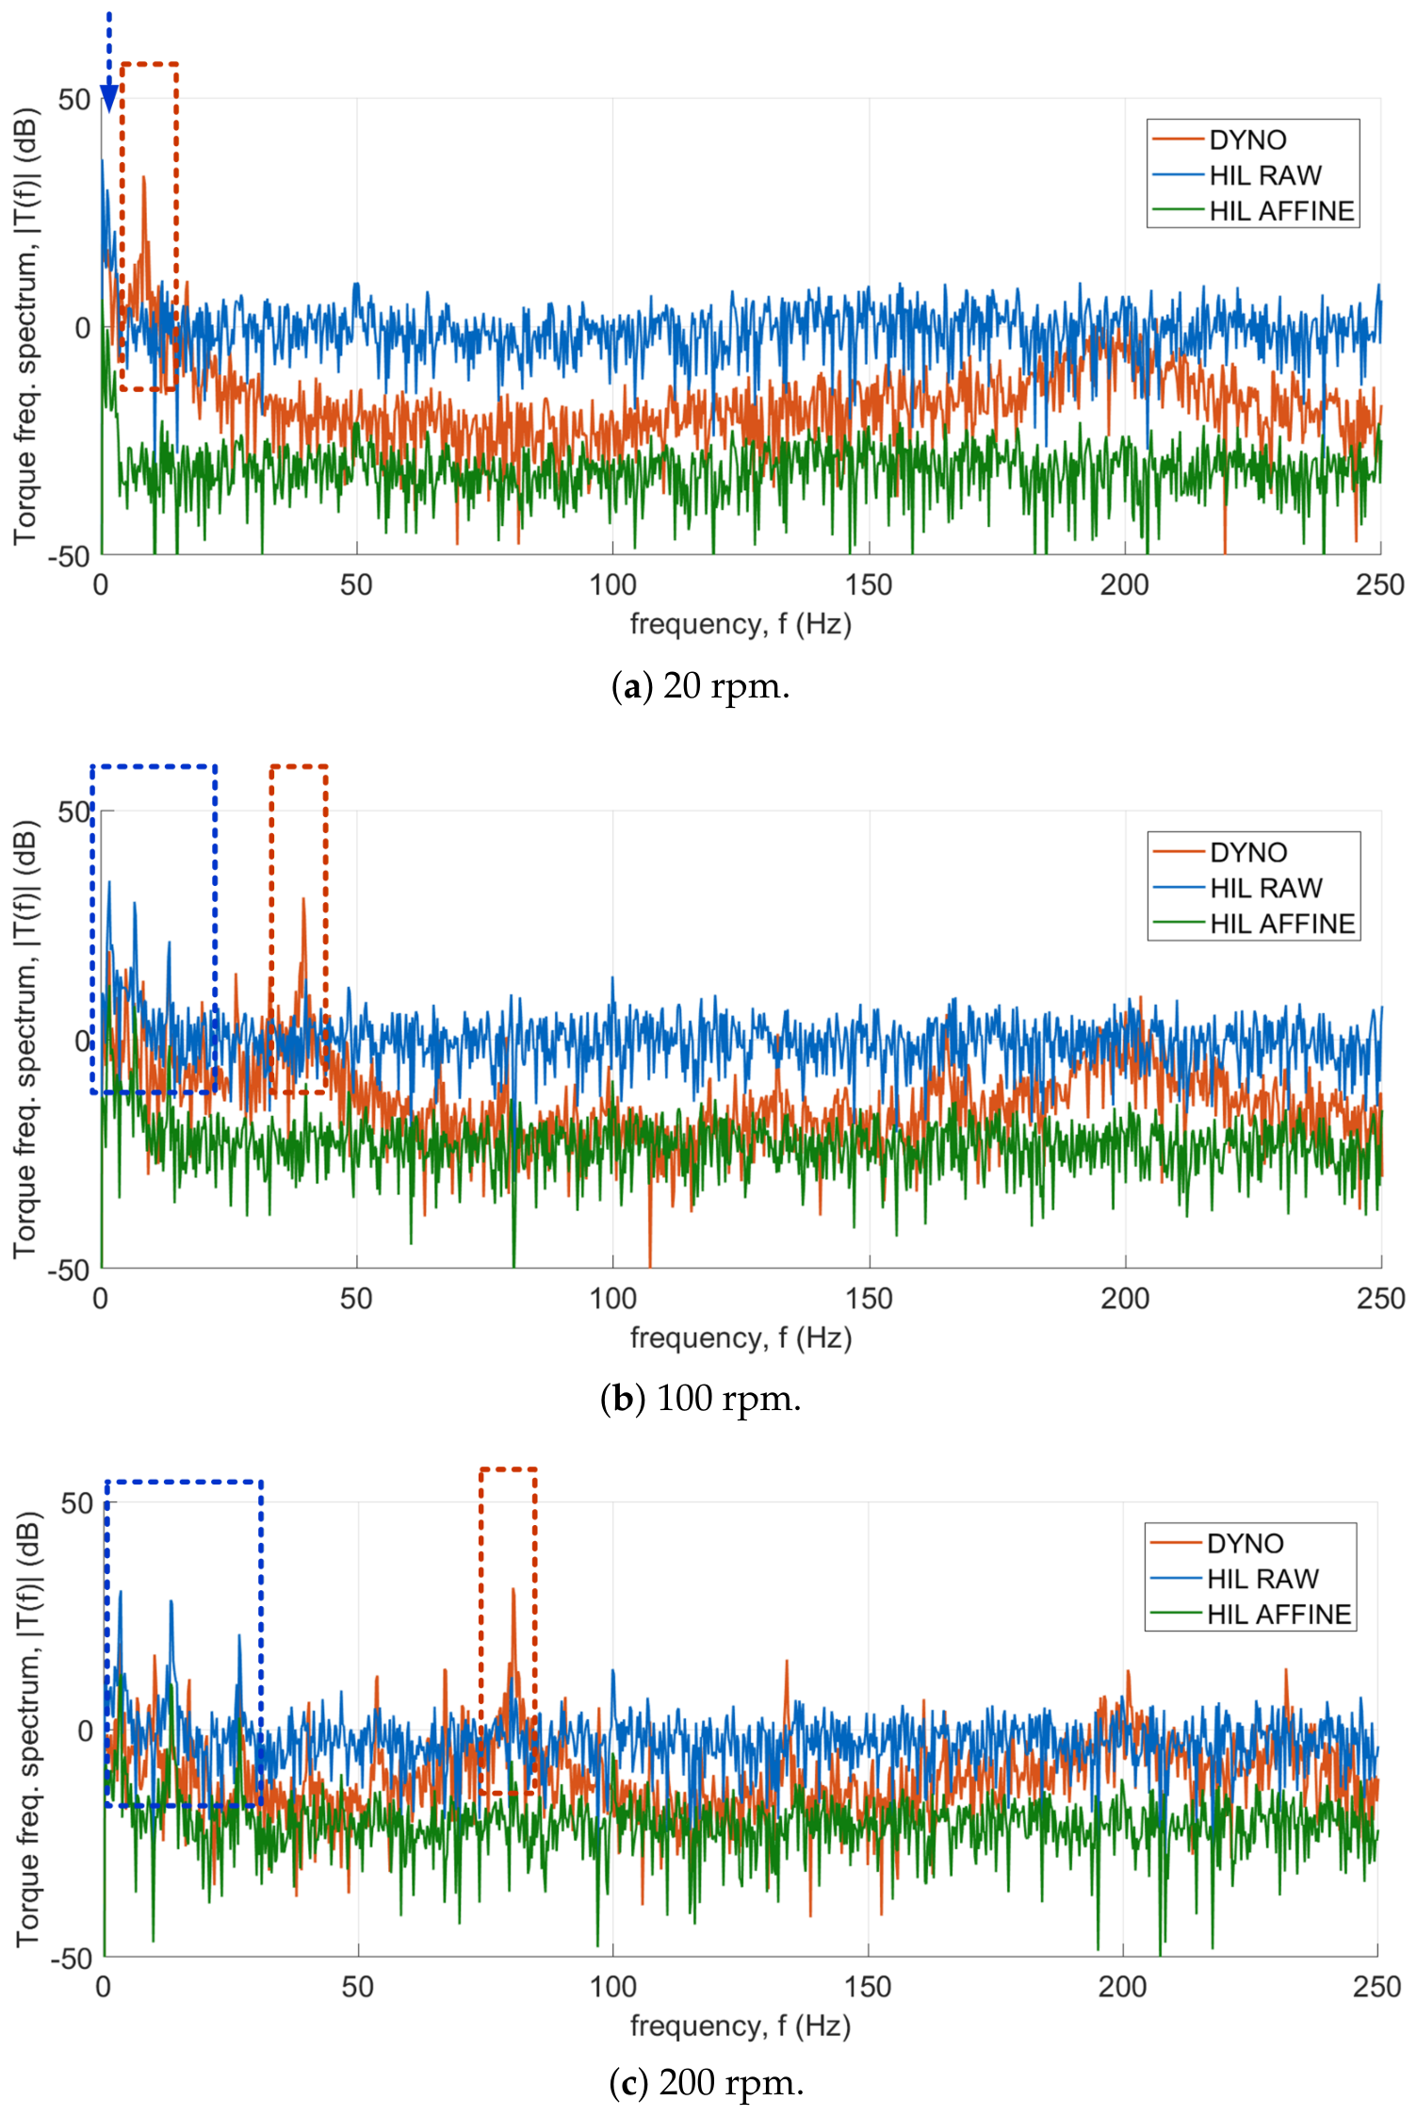
Figure 7 shows the frequency spectrum of the motor torque at each analysed rotational speed (HiL and dynamometer waveforms, | T h ( f ) | and | T d ( f ) | , respectively). The resolution of the calculated frequency spectrum is 0.2441 Hz (sampling rate: 500 Hz). The dominant harmonics for each test environment are highlighted with dashed frames (red for the dynamometer signal and blue for the HiL signal) to illustrate how their frequencies change with increasing rotational speed.
At 20 rpm (Figure 7a), the dominant components are concentrated at lower frequencies, and the spectral mismatch is moderate. At 100 rpm (Figure 7b), the dominant dynamometer spectral peak shifts upward and the spectral difference becomes larger, indicating that the frequency content diverges more strongly as the speed increases. At 200 rpm (Figure 7c), the dynamometer spectrum shows the highest-frequency dominant component among the three cases, and the mismatch within the plotted band is the strongest, consistent with a growing discrepancy in high-speed dynamics.
Figure 8 presents frequency spectra for all analysed rotational speeds, normalised to 1. Figure 8a shows the frequency spectrum of the measured motor torque at various motor speeds (dynamometer). Figure 8b presents the frequency spectrum of the motor torque estimated by the HiL model.
Figure 7 and Figure 8 show how the dominant frequencies in the dynamometer and HiL signals shift as speed increases. This, in turn, indicates how the applied real-time modelling approach influences the final HiL output and what the dynamic limitations of the system are.
Table 6 presents the peak frequency for each signal ( f p , d and f p , h denote the dominant frequencies for the dynamometer and HiL signals, respectively). Although the signals are analysed under steady-state operating conditions, periodic torque-ripple components may remain present because steady-state operation does not imply constant instantaneous torque.
The peak frequency f p summarises how dominant oscillatory components differ and usually increases with operating speed in the presented dataset. As the operating point increases from 20 to 200 rpm, the dominant frequency in the dynamometer signal shifts towards higher frequencies, and the separation between the dominant dynamometer and the HiL components, f p , d and f p , h , tends to increase. This shows that the source of harmonic content in the dynamometer signal and in the HiL signal is fundamentally different. In the dynamometer measurements, the dominant harmonics arise from motor-speed-dependent phenomena, and these components are absent in the HiL-generated signal.
In the analysed data, a component close to the 24th mechanical harmonic is observed in the dynamometer signal, whereas the first mechanical harmonic is observed in the HiL signal. The 6th-order torque ripple results from the 5th- and 7th-order induced voltage harmonics, while the 12th-order ripple is associated with the 11th and 13th harmonics, as explained in [30]. For a motor with four pole pairs and twelve slots, the 24th harmonic corresponds to the least common multiple of these numbers.

3.2.5. Frequency-Domain Error

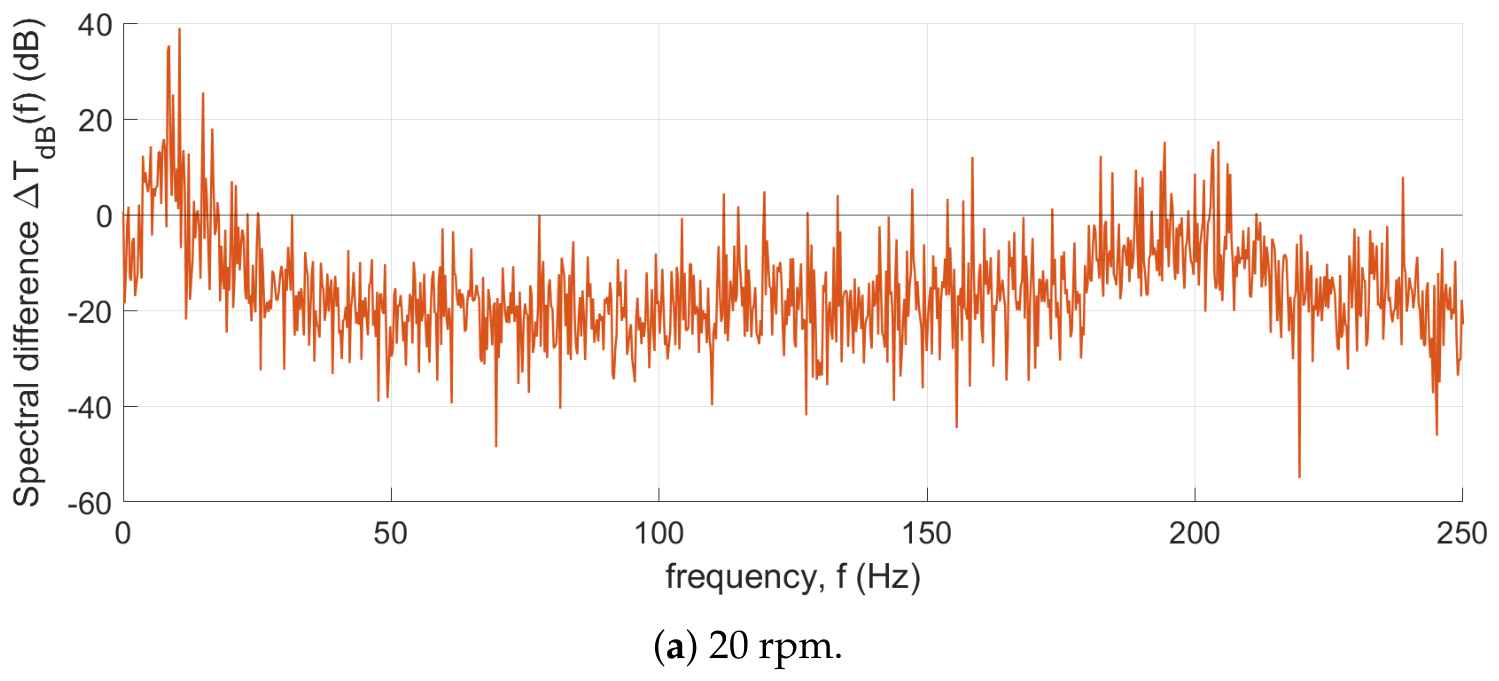
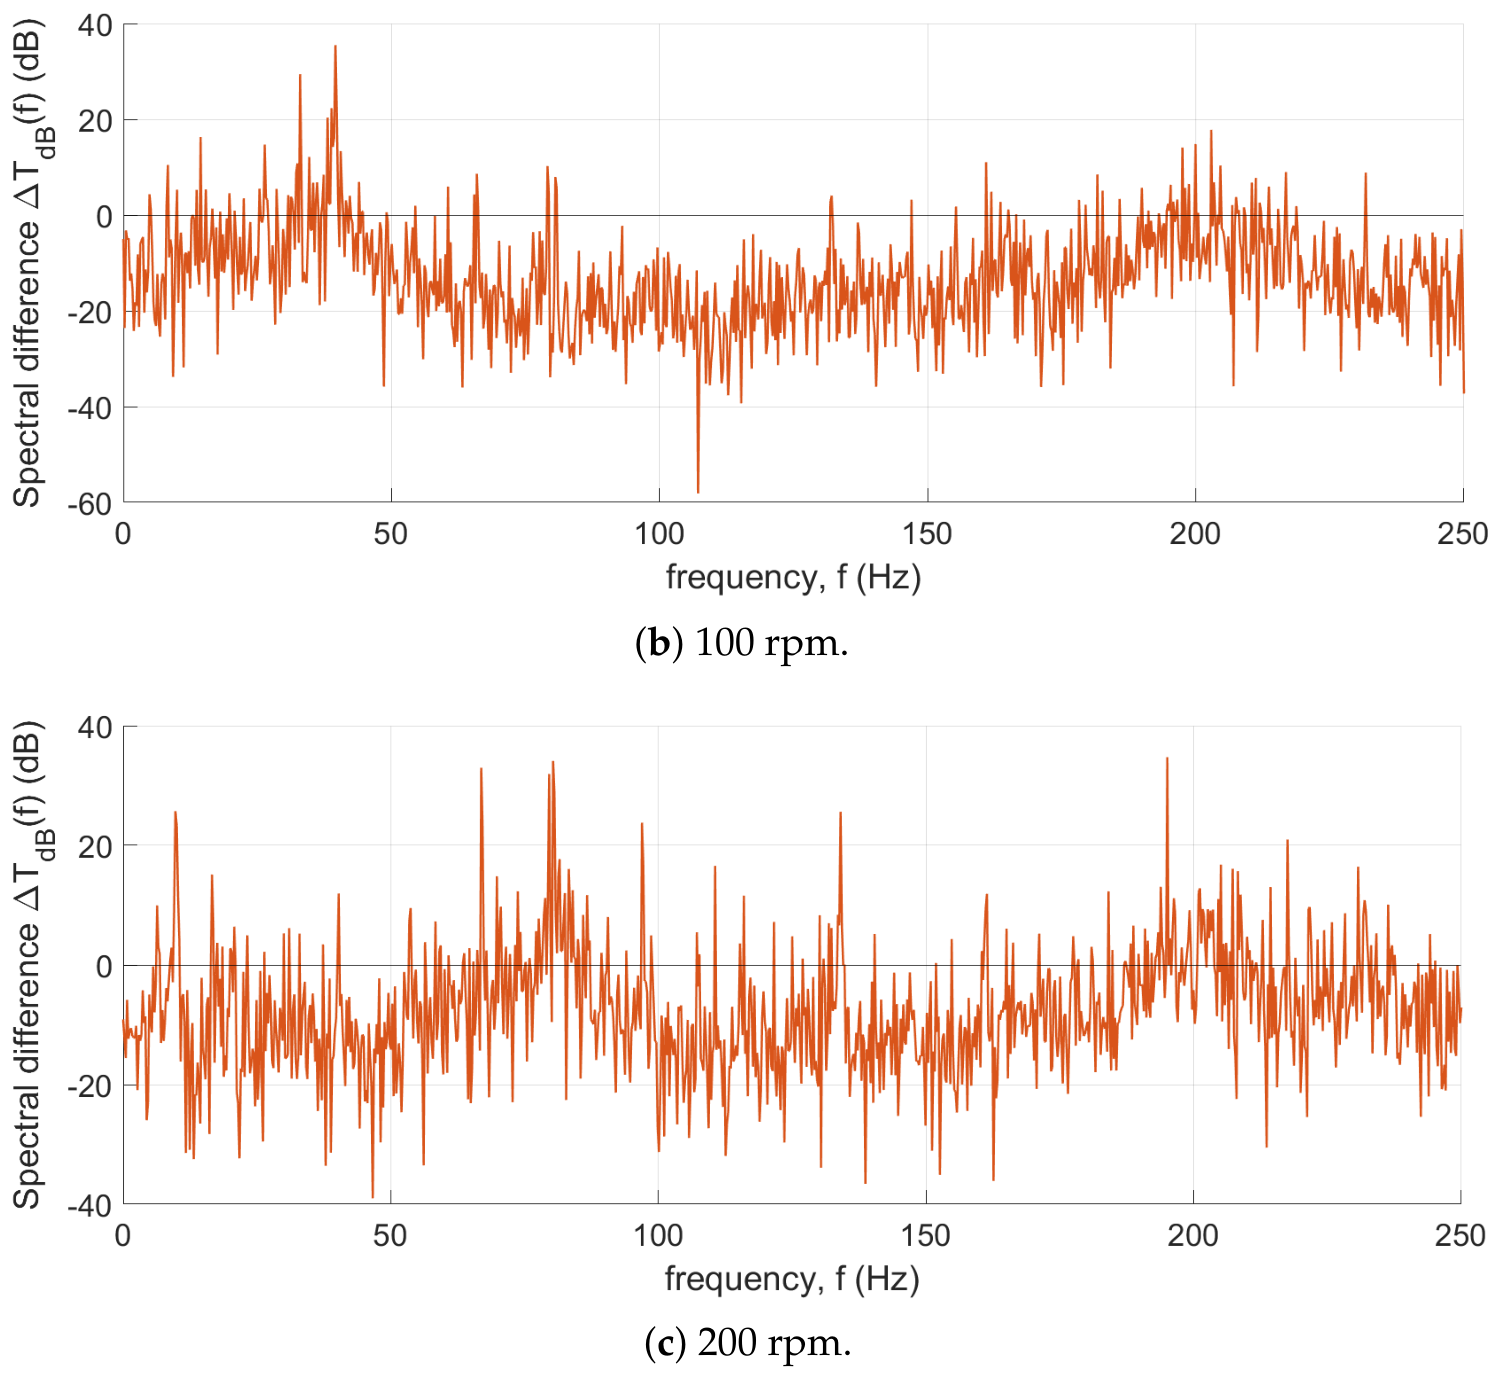
Let | T d ( f ) | and | T h ( f ) | denote the magnitude spectra of the motor torque recorded on the dynamometer and generated by the HiL platform, respectively. The spectral difference is calculated as follows:
Δ T dB ( f ) = 20 log 10 ( T d ( f ) + ε ) 20 log 10 ( T h ( f ) + ε ) ,
where ε is a small constant that prevents log ( 0 ) . The spectral difference emphasises frequency bands in which one signal systematically has a larger spectral magnitude than the other. Figure 9 compares steady-state spectra using one-sided FFT magnitudes, as defined by Equation (7).

3.3. Measurement-Error Metrics

The accuracy and variability of the measured motor torque were evaluated using three standard statistical metrics computed on N samples y ( t i ) with respect to a torque reference value y ref . The Mean Absolute Error (MAE) is defined as
MAE = 1 N i = 1 N | y ( t i ) y ref | .
The Mean Relative Error (MRE), expressed in percent when y ref 0 , is given by
MRE [ % ] = 100 N i = 1 N | y ( t i ) y ref | | y ref | .
The Standard Deviation (STD) of the error is
STD = 1 N 1 i = 1 N ( y ( t i ) y ref ) e ¯ 2 e ¯ = 1 N i = 1 N y ( t i ) y ref
representing the dispersion of the torque error around its mean. The reference value used in this study was 3.92 Nm for all speed points (20, 100, and 200 rpm).
The calculated error metrics are presented in Table 7.
For all rotational speeds, the dynamometer errors remained relatively consistent across speed, with MAE and MRE showing only slight reductions from 20 to 200 rpm. In contrast, the raw HiL data demonstrated an increase in MAE with speed, suggesting a growing static bias, while its STD gradually decreased. It should be noted that the metrics in Table 7 were computed with respect to the commanded reference torque and, therefore, quantify the deviation of each test bench from that reference, rather than the mutual agreement between the two signals. The effect of the affine transformation on the HiL–dynamometer discrepancy is quantified separately in Table 4, where the maximum time-domain error is reduced by up to 85%. Overall, the results show that the dynamometer measurement performance is stable across the tested speed range, whereas the raw HiL signal exhibits a speed-dependent bias with respect to the reference torque.

4. Discussion and Key Findings

4.1. Observed Characteristics of the HiL Torque Signal

The mean values of the torque waveforms in the time domain are comparable for the two systems, namely, the HiL setup and the dynamometer. However, noticeable differences are observed in the distortion of the torque waveforms obtained from the two systems. The time-domain torque waveform estimated by the HiL differs from the measured torque in terms of gain and offset. Furthermore, the 1st mechanical harmonic is present in the torque estimated by the HiL, whereas the 24th mechanical harmonic is absent.

4.2. Analysis of HiL–Dynamometer Discrepancies

The observed discrepancies between the HiL setup and the dynamometer may result from the absence of physical non-idealities and machine imperfections in the HiL model. Effects such as thermal variation, magnetic hysteresis, asymmetric windings, bearing friction, and structural resonances are not represented. Cogging torque and mechanical asymmetries are also absent in the considered HiL setup, as revealed by the motor torque frequency spectrum. Although each of these effects is individually well documented in the literature as a source of torque ripple and waveform distortion, the present experimental design, which uses a single affine decomposition of the aggregate torque-channel error, does not allow their individual quantitative contributions to be isolated from one another or from interface-related effects. Doing so would require dedicated single-variable experiments (e.g., controlled thermal soak tests, bearing-friction characterisation, or modal analysis of the mechanical drivetrain) that are beyond the scope of the present steady-state comparison and are identified here as a specific target for follow-up work.
Interface-related non-idealities are another potential source of discrepancies. Signal scaling and calibration errors were identified, while ADC/DAC noise and electrical interference can contaminate the feedback signals received by the inverter controller. Additional differences may result from PWM signal acquisition and inaccurate reconstruction caused by timing jitter, synchronisation errors between the inverter and the HiL platform, and inaccuracies in edge detection.
Errors may also originate from current calculation and shunt-voltage signal generation, including model-based current-estimation errors and inaccuracies in motor parameters. Furthermore, the generated rotor-position signal does not include real-world effects such as mechanical backlash, encoder eccentricity, quantisation, or noise. Delays introduced during the calculation and output of the position signal can also degrade the performance of the motor control algorithm.
Real-time execution constraints may constitute an additional source of discrepancies. Different update rates for PWM capture, motor-model execution, and signal output may produce aliasing or control artefacts.

4.3. Interpretation of Correlation Results and Implications for Controller and Diagnostic-Algorithm Validation

The low and, in several cases, negative raw correlation coefficients reported in Table 5 merit explicit interpretation, since agreement on mean torque alone does not guarantee that a HiL platform is suitable for waveform-sensitive validation tasks. The low magnitude of the raw Pearson and Spearman coefficients indicates that the local, sample-to-sample fluctuations in the HiL and dynamometer torque signals are largely uncorrelated within the analysed steady-state windows: the two signals have similar mean values and amplitude ranges but do not share a common instantaneous trajectory. The negative sign observed at all three speeds is consistent with the negative gain identified by the affine fit (Table 3) and is interpreted as an apparent phase or sign inversion between the recorded ripple components, rather than as a fundamental sign error in the torque measurement itself; after the affine correction, the coefficients become weakly positive but remain far from unity, showing that a linear recalibration alone cannot restore waveform-level agreement. Whether this level of agreement is acceptable depends on the intended use of the HiL platform. For mean-torque-oriented or low-bandwidth controller-validation tasks, such as verifying average torque tracking or overall closed-loop stability, the observed discrepancy in local waveform shape is unlikely to be critical, since such applications are relatively insensitive to ripple-level detail. However, for the torque-waveform-sensitive diagnostic use case that motivates this study—namely, detecting incipient faults such as inter-turn short circuits or mechanical asymmetries from ripple amplitude, correlation, or harmonic-order signatures—the present HiL configuration cannot yet be considered sufficiently accurate. A fault-detection algorithm trained or thresholded on HiL-generated torque-ripple data would be exposed to a systematically different noise and harmonic structure than the one encountered in the physical system. This distinction between mean-value fidelity and waveform-level fidelity is the central motivation of the present work, which is why the correlation results are reported and discussed explicitly rather than omitted.
It should also be emphasised that the affine gain–offset correction applied in this study is a calibration-level procedure: it compensates for systematic scaling and bias errors in the HiL torque channel but cannot compensate for nonlinear dynamics, phase delays, bandwidth limitations, or missing harmonic content in the underlying motor model. The substantial reduction in time-domain error achieved by the affine transformation (up to 85%) should therefore not be interpreted as evidence of improved model fidelity; rather, it isolates and removes a linear measurement-chain artefact so that the remaining, comparatively small, residual error can be attributed to genuine dynamic and spectral mismatches between the HiL model and the physical machine. Accordingly, the present HiL configuration is regarded as an adequate development environment for mean-torque-oriented and low-bandwidth control functions, and as a functional—but not metrological—environment for diagnostic code, in the sense that it can verify execution, convergence, and real-time behaviour, but not the ripple-level thresholds on which fault detection ultimately depends.

4.4. Recommendations for Improving HiL Fidelity

Based on the observed time-domain and spectral differences, polarity, scaling constants, and offsets should be verified to ensure consistency across the measurement chains. The model parameters, including resistances, inductances, and magnetic-flux saturation tables, should match those of the real device as closely as possible. In addition, the fidelity analysis of the computed signals should be extended to dynamic operating conditions and reverse-torque operation.
When testing electrical machines under fault conditions, the characteristics of the measurement systems must also be considered. Dynamometer measurements inherently capture real-world effects such as misalignment, cogging torque, motor asymmetries, and other non-ideal characteristics of the electric machine. These phenomena are not included in the HiL results for the setup considered in this study.
By contrast, HiL measurement results are primarily affected by interface-related factors, including measurement noise, interface delays, and processing within the HiL loop, rather than by physical machine non-idealities. Accurate prediction of PMSM electromagnetic characteristics requires detailed modelling approaches, which is not the primary objective of the present work. The ultimate goal is to develop and validate early fault-detection algorithms that operate alongside the existing motor control algorithm. Combining experimental validation with appropriate modelling techniques is essential for reproducing PMSM behaviour under both steady-state and dynamic operating conditions.

5. Conclusions

This study presents a detailed comparison between motor torque waveforms measured on a dynamometer test bench and those generated by a real-time Hardware-in-the-Loop simulation for a PMSM used in Electric Power Steering applications. By employing time-domain error analysis, correlation metrics, and frequency-domain spectral evaluation, this work demonstrates that the HiL model accurately reproduces mean torque values but shows increasing discrepancies in waveform shape and harmonic content as motor speed increases. The application of a simple affine calibration revealed that gain and offset mismatches are the dominant contributors to time-domain errors, and that proper channel calibration alone can reduce these errors by up to 85%. The remaining differences were mainly related to unmodelled physical phenomena. The proposed analysis workflow provides a practical and systematic framework for validating HiL environments against experimental measurements and offers clear guidance to improve model fidelity, calibration procedures, and test setup configuration. Within the investigated steady-state operating range, these findings support the use of the HiL configuration for mean-torque-oriented or low-bandwidth controller-validation tasks. However, the observed waveform and spectral discrepancies prevent the present configuration from being considered sufficiently accurate for torque-ripple-based diagnostic validation. The results form a solid basis for future work that will focus on higher speeds, dynamic operating conditions, and fault-injection scenarios relevant to early EPS fault detection.
Limitations of the Proposed Validation Methodology: The present workflow decomposes torque discrepancy into a linear calibration component (affine gain/offset) and a residual dynamic/spectral component, but it does not further decompose the residual into individual physical contributors (e.g., thermal effects, bearing friction, mechanical resonances) or interface-related contributors (e.g., ADC/DAC noise, timing jitter), and it has been demonstrated only for three steady-state, single-quadrant operating points at a single commanded torque of 3.92 Nm. Dynamic operating conditions (torque steps, acceleration/deceleration, transient current response), higher rotational speeds, alternative torque levels, and all four operating quadrants, together with complementary harmonic-distortion metrics (e.g., THD, harmonic energy distribution, spectral error indices) and a direct quantitative comparison with other published HiL validation studies, would be required to establish the general applicability of the proposed method beyond the tested conditions. These extensions are identified as concrete directions for the next phase of the underlying research project. Accordingly, the conclusions of the present study are restricted to the three investigated steady-state, single-quadrant operating points at a torque reference of 3.92 Nm and should not be generalised to higher speeds, alternative torque levels, transient operation, or regenerative conditions without further experimental validation.


Author Contributions

Conceptualisation, M.P., W.P. and J.S.; methodology, M.P.; software, M.P.; validation, M.P., W.P. and J.S.; formal analysis, M.P.; investigation, M.P.; resources, W.P. and J.S.; data curation, M.P.; writing–original draft preparation, M.P.; writing–review and editing, W.P. and J.S.; visualisation, M.P.; supervision, W.P. and J.S.; project administration, W.P.; funding acquisition, W.P. All authors have read and agreed to the published version of the manuscript.

Funding

This research was funded under the Polish Ministry of Science and Higher Education programme “Implementation Doctorate”, implemented from 2025 to 2029 (Agreement No. DWD/9/0194/2025 of 2 December 2025).

Institutional Review Board Statement

Not applicable.

Informed Consent Statement

Not applicable.

Data Availability Statement

Data are available from the corresponding author upon reasonable request.

Conflicts of Interest

Author M.P. was employed by the company Nexteer Automotive (Poland), Tychy, Poland. The remaining authors declare that the research was conducted in the absence of any commercial or financial relationships that could be construed as a potential conflict of interest. The authors declare no conflicts of interest.

Abbreviations

EPSElectric Power Steering
FFTFast Fourier Transform
HiLHardware-in-the-Loop
LUTLook-Up Table
MAEMean Absolute Error
MREMean Relative Error
PMSMPermanent-Magnet Synchronous Motor
STDStandard Deviation

References

  1. Pietrowski, W.; Puskarczyk, M.; Szymenderski, J. Fault Detection Methods for Electric Power Steering System Using Hardware in the Loop Simulation. Energies 2024, 17, 3486. [Google Scholar] [CrossRef] [Scilit]
  2. Lee, J.S.; Choi, G. Modeling and Hardware-in-the-Loop System Realization of Electric Machine Drives—A Review. CES Trans. Electr. Mach. Syst. 2021, 5, 194–201. [Google Scholar] [CrossRef] [Scilit]
  3. Haridas, A.K.; Bilgin, B. Real-Time Modeling of Electric Machines for Hardware-in-the-Loop Environment: A State-of-the-Art Review. IEEE Access 2025, 13, 213630–213652. [Google Scholar] [CrossRef] [Scilit]
  4. Alvarez-Gonzalez, F.; Griffo, A. High-Fidelity Modelling of Permanent Magnet Synchronous Motors for Real-Time Hardware-in-the-Loop Simulation. In Proceedings of the 8th IET International Conference on Power Electronics, Machines and Drives (PEMD 2016), Glasgow, UK, 19–21 April 2016; pp. 1–6. [Google Scholar] [CrossRef] [Scilit]
  5. Griffo, A.; Salt, D.; Wrobel, R.; Drury, D. Computationally efficient modelling of permanent magnet synchronous motor drives for real-time Hardware-in-the-Loop simulation. In Proceedings of the IECON 2013-39th Annual Conference of the IEEE Industrial Electronics Society; IEEE: New York, NY, USA, 2013; pp. 5368–5373. [Google Scholar] [CrossRef] [Scilit]
  6. Arafat, A.; Trapp, D.; Ober, M.; Aidibi, R. Comparative Analysis of CHIL, PHIL, and Dyno Testing for ePowertrain and System Validation. In Proceedings of the 2025 IEEE Energy Conversion Conference Congress and Exposition, ECCE 2025; Institute of Electrical and Electronics Engineers Inc.: New York, NY, USA, 2025. [Google Scholar] [CrossRef] [Scilit]
  7. Fatemimoghadam, A.; Iyer, L.V.; Kar, N.C. Real-Time Validation of Enhanced Permanent Magnet Synchronous Motor Drive Using Dense-Neural-Network-Based Control. IEEE Access 2024, 12, 73323–73339. [Google Scholar] [CrossRef] [Scilit]
  8. Moldovan, T.; Inte, R.; Nemes, R.O.; Ruba, M.; Martis, C. Typhoon HIL Real-Time Validation of Permanent Magnet Synchronous Motor’s Control. In Proceedings of the 2021 9th International Conference on Modern Power Systems, MPS 2021; Institute of Electrical and Electronics Engineers Inc.: New York, NY, USA, 2021. [Google Scholar] [CrossRef] [Scilit]
  9. Glumac, S.; Varga, N.; Raos, F.; Kovačić, Z. Co-simulation perspective on evaluating the simulation with the engine test bench in the loop. Automatika 2022, 63, 275–287. [Google Scholar] [CrossRef] [Scilit]
  10. Jassmann, U.; Frehn, A.; Röttgers, H.; Santjer, F.; Mehler, C.; Beißel, T.; Kaven, L.; von den Hoff, D.; Frühmann, R.; Azarian, S.; et al. CertBench: Conclusions from the comparison of certification results derived on system test benches and in the field. Eng. Res. 2021, 85, 353–371. [Google Scholar] [CrossRef] [Scilit]
  11. Badar, J.; Ali, S.; Munir, H.M.; Bhan, V.; Bukhari, S.S.H.; Ro, J.S. Reconfigurable power quality analyzer applied to hardware-in-loop test bench. Energies 2021, 14, 5134. [Google Scholar] [CrossRef] [Scilit]
  12. Peng, Z.; Si, H.; Wang, H.; Zhou, C.; Chen, G.; Deng, T.; Shu, Y.; Wang, Y.; Liu, Z.; Yin, L.Z. High-accuracy torque estimation and safety control for induction motor used in electric vehicles. Adv. Mech. Eng. 2023, 15, 16878132231199345. [Google Scholar] [CrossRef] [Scilit]
  13. Lei, Y.; Gao, C.; Ren, Y.; Zhang, G.; Huang, Y.; Li, S.; Liu, Z.; Jiang, S.; Xu, X. Analysis and optimization of permanent magnet linear synchronous motor characteristic with composite magnetic slot wedge. Arch. Electr. Eng. 2026, 75, 347–361. [Google Scholar] [CrossRef] [Scilit]
  14. Zhang, G.; Liu, C.; Zhu, N.; Zhang, R. High-Precision EV IPMSM and Loss Modeling for Real-Time Hardware-in-the-Loop Simulation Based on the Finite Element Method. IEEE Access 2026, 14, 57553–57565. [Google Scholar] [CrossRef] [Scilit]
  15. Balasundaram, P.; Ploix, S.; Delinchant, B.; Muresan, C. Uncertainty analysis of hardware in loop setup for testing building technologies: A case study. In Proceedings of the Building Simulation 2021: 17th Conference of IBPSA, Bruges, Belgium, 1–3 September 2021; pp. 2141–2146. [Google Scholar] [CrossRef] [Scilit]
  16. Poudel, B.; Panwar, M.; Guruwacharya, N.; Sindler, P.; Wallen, R.; Hovsapian, R. Enhancing Hydro-Emulation Platform Performance: Addressing Inertial and Machine Losses through Power-Hardware-in-the-Loop Experiments. In Proceedings of the IECON Proceedings (Industrial Electronics Conference); IEEE Computer Society: Washington, DC, USA, 2024. [Google Scholar] [CrossRef] [Scilit]
  17. Fischer, B.; Jassmann, U. A general framework for a control-based design of power and mechanical hardware-in-the-loop systems. Proc. IFAC-Pap. 2017, 50, 10957–10963. [Google Scholar] [CrossRef] [Scilit]
  18. IEEE Power Electronics Society & Industrial Electronics Society. 2004–2025-IEEE Recommended Practice for Hardware-in-the-Loop Simulation-Based Testing of Electric Power Apparatus and Controls; Technical Report; IEEE Power Electronics Society & Industrial Electronics Society: New York, NY, USA, 2025. [Google Scholar]
  19. Hou, Q.; Ding, S.; Yu, X.; Mei, K. A Super-Twisting-Like Fractional Controller for SPMSM Drive System. IEEE Trans. Ind. Electron. 2022, 69, 9376–9384. [Google Scholar] [CrossRef] [Scilit]
  20. Hou, Q.; Wang, H.; Lee, C.H.; Ding, S. Composite Adaptive Super-Twisting Sliding Mode Control Using Barrier Function for PM Motor Drives Toward Electric Aircraft Applications. IEEE Trans. Power Electron. 2025, 40, 16255–16264. [Google Scholar] [CrossRef] [Scilit]
  21. Scheer, R.; Bergheim, Y.; Heintges, D.; Rahner, N.; Gries, R.; Andert, J. An FPGA-based Real-time Spatial Harmonics Model of a PMSM Considering Iron Losses and the Thermal Impact. IEEE Trans. Transp. Electrif. 2022, 8, 1289–1301. [Google Scholar] [CrossRef] [Scilit]
  22. Amitkumar, K.S.; Kaarthik, R.S.; Pillay, P. A Versatile Power-Hardware-in-the-Loop-Based Emulator for Rapid Testing of Transportation Electric Drives. IEEE Trans. Transp. Electrif. 2018, 4, 901–911. [Google Scholar] [CrossRef] [Scilit]
  23. Guo, Y.; Huang, L.; Zhang, M.; He, M.; Zhong, B.; Fan, D. A versatilely high fidelity electric machines emulator for rapid testing of motor controller. PLoS ONE 2024, 19, e0299371. [Google Scholar] [CrossRef] [Scilit] [PubMed]
  24. Alvarez-Gonzalez, F.; Griffo, A.; Sen, B.; Wang, J. Real-Time Hardware-in-the-Loop Simulation of Permanent Magnet Synchronous Motor Drives under Stator Faults. IEEE Trans. Ind. Electron. 2017, 64, 6960–6969. [Google Scholar] [CrossRef] [Scilit]
  25. Poletto, P.; Angiolini, A.; Boccardo, G.; Graziano, E.; Vaschetto, S.; Demelas, R. Real Time Modelling of Automotive Electric Drives for Hardware-in-the-Loop Applications; Technical Report 2023-24-0028; SAE International: Warrendale, PA, USA, 2023. [Google Scholar] [CrossRef] [Scilit]
  26. Lauss, G.; Feng, Z.; Syed, M.; Kontou, A.; Paola, A.; Paspatis, A.; Kotsampopoulos, P. A Framework for Sensitivity Analysis of Real-Time Power Hardware-in-the-Loop (PHIL) Systems. IEEE Access 2022, 10, 101305–101318. [Google Scholar] [CrossRef] [Scilit]
  27. Erdogan, D.; Du, Z.P.; Jakubek, S.; Holzinger, F.; Mayr, C.; Hametner, C. Experimental Validation of Innovative Control Concepts for Powertrain Test Beds in Power Hardware-in-the-Loop Configuration. IEEE Open J. Ind. Appl. 2024, 5, 128–142. [Google Scholar] [CrossRef] [Scilit]
  28. MacHhamer, R.; Fazlic, L.B.; Guven, E.; Junk, D.; Kurt, G.K.; Naumann, S.; Didas, S.; Gollmer, K.U.; Bergmann, R.; Timm, I.J.; et al. Likelihood-Based Sensor Calibration Using Affine Transformation. IEEE Sens. J. 2024, 24, 3672–3680. [Google Scholar] [CrossRef] [Scilit]
  29. Stanković, S.S.; Stanković, M.S.; Veinović, M.; Jokić, I.; Frantlović, M. Distributed Sensor Network Calibration Under Sensor Nonlinearities with Applications in Aerodynamic Pressure Sensing. Sensors 2025, 25, 2505. [Google Scholar] [CrossRef] [Scilit] [PubMed]
  30. Chowdhury, M.; Gebregergis, A.; Islam, M.; Sebastian, T. Analysis of Harmonic Contents in Induced Voltage and Electromagnetic Torque in Interior Permanent Magnet Synchronous Machines under Loaded Condition. In Proceedings of the 2013 International Electric Machines & Drives Conference, Chicago, IL, USA, 12–15 May 2013; pp. 260–267. [Google Scholar] [CrossRef] [Scilit]
  31. Yang, C.; Zhao, X.; Qiu, H.; Wang, Y. Research on torque ripple suppression method of high-speed permanent magnet synchronous generator based on single-phase correction winding. Arch. Electr. Eng. 2026, 75, 387–406. [Google Scholar] [CrossRef] [Scilit]
  32. dSPACE GmbH. ASM Electric Components Reference: For ASM Electric Components Blockset 3.5; Release 2017-B ed.; dSPACE GmbH: Paderborn, Germany, 2017. [Google Scholar]
Figure 1. Permanent Magnet Synchronous Motor (PMSM) and inverter used as the device under test in the dynamometer and HiL validation study.
Electronics 15 03946 g001
Figure 2. Dynamometer test bench architecture showing the tested PMSM, load machine, and torque sensor used to acquire reference torque waveforms.
Electronics 15 03946 g002
Figure 3. Hardware-in-the-Loop setup where the real-time PMSM model interacts with a physical controller, capturing its PWM switching commands and sending back the simulated motor currents.
Electronics 15 03946 g003
Figure 4. Comparison of steady-state torque waveforms measured on the dynamometer and generated by the HiL model at 20, 100, and 200 rpm. Mean torque values are similar, while waveform distortions differ between the two test setups.
Electronics 15 03946 g004aElectronics 15 03946 g004b
Figure 5. Raw motor torque estimated by the HiL model, T h r a w , over one mechanical revolution at different rotational speeds. The time vectors for 100 and 200 rpm were rescaled to enable direct waveform comparison.
Electronics 15 03946 g005
Figure 6. Time-domain torque error between dynamometer and HiL signals at 20, 100, and 200 rpm. Raw denotes the original HiL signal, while affine represents the signal after gain-offset calibration.
Electronics 15 03946 g006aElectronics 15 03946 g006b
Figure 7. FFT- magnitude spectra of dynamometer | T d ( f ) | and HiL | T h ( f ) | torque signals at 20, 100, and 200 rpm. Dashed frames highlight dominant spectral components, illustrating increasing divergence of harmonic content with speed.
Electronics 15 03946 g007
Figure 8. Normalised torque spectra for all investigated operating speeds. The figure illustrates the shift of dominant frequency components with increasing speed.
Electronics 15 03946 g008
Figure 9. Spectral- magnitude difference Δ T dB ( f ) between dynamometer and HiL torque signals at 20, 100, and 200 rpm, highlighting frequency bands where the two systems exhibit different harmonic amplitudes.
Electronics 15 03946 g009aElectronics 15 03946 g009b
Table 1. Parameters of the PMSM model implemented in the HiL platform, identified from measurements of the tested motor.
ParameterValue
Number of pole pairs4
Number of slots12
Stator resistance R [ Ω ]0.0115
Inductances L d , L q [ μ H ]37.8
Flux linkage ψ [Wb]0.005515
Table 2. Comparison of mean steady-state torque values measured on the dynamometer ( T a v g , d ) and estimated by the HiL model ( T a v g , h ), including raw and affine-transformed HiL data.
Speed [rpm] T avg , d [Nm] T avg , h raw [Nm] T avg , h affine [Nm]
204.42074.04194.4207
1004.41894.10494.4189
2004.40424.31304.4042
Table 3. Gain (a) and offset (b) coefficients of the affine transformation used to align HiL torque signals with dynamometer measurements.
Speed [rpm]ab
20−0.02964.5404
100−0.07304.7185
200−0.12094.9258
Table 4. Maximum time-domain torque error between dynamometer and HiL signals for raw and affine-transformed data.
Speed [rpm] e raw [Nm] e aff [Nm]
200.6380.104
1000.5910.090
2000.3150.113
Table 5. Pearson (r) and Spearman ( ρ ) correlation coefficients between dynamometer and HiL torque signals for raw and affine-transformed data.
Speed [rpm]r (Raw) ρ (Raw)r (Aff) ρ (Aff)
20−0.043−0.0390.0430.039
100−0.128−0.1200.1280.120
200−0.150−0.1490.1500.149
Table 6. Dominant frequencies identified in dynamometer f p , d and HiL f p , h torque spectra.
Speed [rpm] f p , d [Hz] f p , h [Hz]
208.300.24
10039.551.71
20080.323.42
Table 7. Measurement error metrics (MAE, MRE, and STD) calculated with respect to the reference torque value for dynamometer and HiL data.
Speed [rpm]Test BenchMAE [Nm]MRE [%]STD [Nm]
20Dynamometer0.501712.8030.0509
20HiL raw0.12573.2070.0740
100Dynamometer0.499912.7550.0400
100HiL raw0.18604.7450.0698
200Dynamometer0.485212.3800.0440
200HiL raw0.394010.0540.0544
Disclaimer/Publisher’s Note: The statements, opinions and data contained in all publications are solely those of the individual author(s) and contributor(s) and not of MDPI and/or the editor(s). MDPI and/or the editor(s) disclaim responsibility for any injury to people or property resulting from any ideas, methods, instructions or products referred to in the content.